Dynamic Metabolic Analysis of Cupriavidus necator DSM545 Producing Poly(3-hydroxybutyric acid) from Glycerol


1
Future Biomanufacturing Research Hub, Manchester Institute of Biotechnology, Department of Chemistry, University of Manchester, Manchester M13 9PL, UK
2
Department of Chemical Engineering and Analytical Science, The University of Manchester, Manchester M13 9PL, UK
3
Future Biomanufacturing Research Hub, Department of Chemical Engineering and Analytical Science, University of Manchester, Manchester M13 9PL, UK
*
Author to whom correspondence should be addressed.
Processes 2020, 8(6), 657; https://doi.org/10.3390/pr8060657
Submission received: 1 April 2020
/
Revised: 21 May 2020
/
Accepted: 25 May 2020
/
Published: 1 June 2020
(This article belongs to the Special Issue Application of Systems Engineering Principles to Bioprocessing
)
Abstract
:Cupriavidus necator DSM 545 can utilise glycerol to synthesise poly(3-hydroxybutyric acid) under unbalanced growth conditions, i.e., nitrogen limitation. To improve poly(3-hydroxybutyric acid) (PHB) batch production by C. necator through model-guided bioprocessing or genetic engineering, insights into the dynamic effect of the fermentation conditions on cell metabolism are crucial. In this work, we have used dynamic flux balance analysis (DFBA), a constrained-based stoichiometric modelling approach, to study the metabolic change associated with PHB synthesis during batch cultivation. The model employs the ‘minimisation of all fluxes’ as cellular objectives and measured extracellular fluxes as additional constraints. The mass balance constraints are further adjusted based on thermodynamic considerations. The resultant flux distribution profiles characterise the evolution of metabolic states due to adaptation to dynamic extracellular conditions and provide further insights towards improvements that can be implemented to enhance PHB productivity.
1. Introduction
In recent decades, biopolymers produced naturally have gained much attention due to rising concerns about environmental issues caused by fossil fuel-based plastics along with a growing strategic interest in bioeconomy. Poly(3-hydroxybutyric acid) (PHB) is the most commonly produced type of natural polyhydroxyalkanoates (PHAs), which features biodegradability and biocompatibility [1]. PHB can be synthesised as an intracellular carbon and energy storage compound in the form of cytoplasmic inclusion when bacteria grow under unbalanced nutrient conditions, typically when essential growth nutrients, such as N and P, are limiting [2,3,4]. Due to having physical properties comparable to those of conventional plastics, PHB and its copolymers find potential applications in moulding [5], food and agriculture industry [3,6,7,8] and in biomedical industry [9,10]. Nevertheless, the choice of carbon sources remains a major limiting factor in the development of economically viable, large-scale and technologically feasible biopolymer processes. The use of low-cost substrates derived from sustainable sources is desirable and thus has been intensively investigated [11,12,13,14].
Meanwhile, in biodiesel production, vegetable oil is converted into methylated fatty acid via transesterification reaction. In this process, a notable amount of crude glycerol is generated as the main byproduct, which accounts for 10% weight of oil consumed [15]. The ever-expanding biodiesel industry happens to provide a stable supply of a large amount of crude glycerol as an inexpensive and renewable carbon source for microbial growth [15]. With appropriate bacterial strains and culture conditions, PHB derived from glycerol can have molecular weights comparable to those derived from glucose [16]. Thus, the bioconversion of crude glycerol to PHB shows potential to be a win-win strategy as it addresses both the environmental performance and the economic viability aspect of both the biodiesel and biopolymer processes.
C. necator is a Gram-negative soil bacterium capable of accumulating PHB up to 80% of its total weight [17], and maintaining decent yield and productivity in the presence of impurities in crude glycerol [18,19]. In particular, C. necator DSM 545, a glycerol positive strain, has attracted research interest in the area of PHB biosynthesis [12,20,21,22,23]. Thanks to the advancement in high-throughput DNA sequencing technology, a growing number of complete metabolic maps or main metabolic routes have been determined for most industrially important strains, including C. necator. This facilitates the construction of metabolic models, which not only offer microscopic insights into intracellular reactions related to biosynthesis but also provide a rational basis for genetically engineering a strain to achieve desirable phenotypes.
In principle, there are two types of metabolic models: stoichiometric metabolic models and kinetic models [24]. Building kinetic models requires knowledge of enzymatic kinetics of intracellular reactions and input of necessary fluxomics/metabolomic data sets. However, this information is still not available or well understood for most microorganisms other than typical model organisms (e.g., E. coli) [25,26], which means such models can be difficult to validate and are limited in terms of scope. In comparison, stoichiometric models require primarily information on reaction stoichiometry of the metabolic network. Hence, stoichiometric modelling is deemed as a more plausible approach to explore the knowledge of cell metabolism of C. necator [27].
Several stoichiometric modelling approaches have been developed so far, with each of them exploiting a different area of knowledge in microbial metabolism at steady state [27]: metabolic flux analysis (MFA) is used to estimate intracellular flux distributions that satisfy measured extracellular fluxes [28]; flux balance analysis (FBA) can predict flux distributions that optimise specific cellular objectives (e.g., cell growth) [29]; elementary modes and extreme pathways are network-based pathway analysis methods, which generate sets of flux vectors compatible with the biochemical networks using convex analysis [30,31]. In addition, sampling methodologies have been developed to address uncertainties in metabolic networks and discriminate between flux combinations reaching the same optimal flux values [32].
In recent years, several studies of the metabolism of C. necator DSM545 using stoichiometric methods have been carried out. For example, Lopar et al. have used elementary flux modes and yield space analysis to study PHB production from glycerol [33], in which multiple sets of elementary modes were obtained to test different assumed metabolic situations.
Metabolic modelling techniques can also be extended to visualise the evolution of intracellular fluxes in dynamic systems such as batch and fed-batch cultures [34,35]. Dynamic metabolic flux analysis (DMFA) has been used to investigate the transient response of metabolism in E. coli [36] and human cell line AGE1.HN culture [37] under various environmental conditions; when combined with macroscopic kinetics or process parameters, dynamic flux balance analysis (DFBA) could simulate shifts of cellular phenotypes [38,39], and identify bottleneck pathways in biochemical networks [40].
In this work, we focused on analysing the dynamics of metabolism of C. necator DSM 545 under different batch conditions using DFBA. Constrained by time-series of extracellular fluxes, the analysis can estimate intracellular dynamics without using kinetic parameters. Estimated flux distribution profiles were compared in order to gain understanding of the growth behaviours under different conditions, as well as metabolic shifts caused by environmental changes. The analysis can be useful for improving PHB productivity by revealing beneficial genetic and process modifications. As an extension of the study, we investigated the potential of DFBA to perform macroscopic predictions with appropriate objective functions and flux constraints.
2. Materials and Methods
2.1. Experimental and Analytical Methods
Cupriavidus necator DSM 545 obtained from DSMZ (German Collection of Microorganisms and Cell Cultures) is used throughout this study. Fermentations at flask and bioreactor scale were conducted under the conditions specified in Table 1. Bioreactor experiments were conducted in duplicates and flask experiments were conducted in triplicates. The medium recipes for both flasks and bioreactor experiments can be found in our previous publication, Pérez Rivero et al. [41]. In order to benchmark the performance of the bacterial culture, we used defined media supplemented with refined glycerol rather than crude glycerol. Analytical methods are summarised in the supplementary file ‘File S1.docx’. Data processing methods, including data smoothing and carbon balance, are summarised in the supplementary file ‘File S1.docx’ [33,36,42,43,44,45,46,47,48,49,50,51].
2.2. Modelling Approaches
The fundamental ideal of FBA is to represent cell metabolism as a constraint-based optimisation problem [26]. By solving the optimisation problem, FBA computes intracellular flux distributions that represent the cellular phenotype expressed under specific conditions, such as optimal growth, varying environmental parameters and genetic modification.
FBA is based on the pseudo-steady state assumption (PSSA). It assumes that cells carry out biochemical reactions at steady state even in an environment which is externally dynamic (e.g., Batch culture) since intracellular states are able to rapidly adapt to new conditions [52]. Thus, we can use extracellular fluxes obtained throughout the entire fermentation duration as FBA inputs to determine time-series flux distributions. Depending on the source of extracellular fluxes, such dynamic metabolic modelling can be further divided into two categories: the first one is a kinetic-driven approach in which flux inputs are generated by macroscopic kinetic models; the second one, which is used in the current work, is a data-driven approach, which uses fluxes derived from time-resolved concentration profiles [35].
2.2.1. Flux Estimation
Deriving valid and reliable time-resolved fluxes from extracellular metabolite measurements is pivotal for a data-driven modelling approach. It is useful to smoothen the experimental data to reduce the noise, which would otherwise compromise the precision of estimated fluxes. Various offline fitting and filtering procedures have been proposed, such as spline fitting [50], polynomial fitting [36], moving average [51] and Kalman filter [42]. Subsequently, metabolic fluxes can be calculated as the derivatives of fitting expressions or concentration gradients between small time intervals.
In this work, concentration profiles obtained from batch experiments were fitted by polynomial fittings, followed by data smoothing (moving average methods) in Matlab. Smoothened concentration curves were then divided into multiple 0.5-h intervals such that fluxes could be calculated with central difference approximation methods:
Here, vi,t is the extracellular flux of metabolite i at time t, and Ci,t represents the corresponding metabolite concentration (unit: g/L). Δt is the length of the time interval equal to 0.5 h. Fluxes were normalised by dividing each calculated gradient by the mass of non-PHB active biomass, CDCW,t (unit: gDCW/L). Hence, the unit of metabolic flux is millimole per hour per gramme of active biomass (mmol/(h·gDCW)).
2.2.2. Metabolic Network
A metabolic network of biochemical reactions of C. necator DSM 545 is primarily reconstructed using existing information from KEGG and BRENDA databases and involves the identification of reactions associated with cell growth and PHB synthesis and determination of their stoichiometry. Information of network stoichiometry was largely taken from established networks of C. necator JMP 134 (which can also grow on glycerol) and C. necator H16 (the ancestral strain of DSM 545). Metabolic networks of C. necator included in the work of Yamane [53], Tanadchangsaeng et al. [54] and Lopar et al. [33] were used as references.
All intracellular reactions were uniformly assumed to be reversible at this stage (i.e., the values of their metabolic fluxes can be either positive or negative). This is also the case for any reversible reactions catalysed by two separate enzymes each of which acts on forward and backward reactions, such as phosphorylation of F6P to FBP catalysed by PFK-1 (E.C. 3.7.1.1) and FBPase (E.C. 3.1.3.11). The PHB degradation pathway is considered inactive as long as there are still external carbon sources available in the medium.
In addition, some reactions, according to the KEGG database, can be catalysed by more than one type of enzymes or use more than one type of cofactors. Though such ‘redundancy’ may be necessary to ensure the robustness of the cellular metabolism, it can introduce additional complexity into our current metabolic model which is not desired from a practical point of view. To reduce possible redundancy in the model, each of these reactions is assumed to be catalysed only by one particular enzyme and/or use only one type of cofactor. We chose the ones that are most commonly used in previous metabolic studies [33,54]. Hence, the following assumptions are made:
- (1)
- GL3P dehydrogenase (E.C. 1.1.1.94) that can utilise both NADPH and NADH was set to use NADH only.
- (2)
- ICIT dehydrogenase (E.C. 1.1.1.42) that can utilise both NADPH and NADH was set to use NADPH.
- (3)
- PEP carboxylation that can be carried out by three types of carboxylases (E.C. 4.1.1.32, E.C. 4.1.1.31 and E.C. 4.1.1.49) was assumed to be catalysed by the ATP-specific carboxylase only (i.e., E.C. 4.1.1.49).
The equation for biomass production was taken from [33], assuming the composition of active biomass remains constant throughout the fermentation. Changes were made to the stoichiometric coefficients of glutamine and glutamate in order to match with measured nitrogen content in biomass (see ‘File S1.docx’ in the supplementary material for further details).
The main metabolic network shown in Figure 1, is encompassing glycerolipid metabolism, glycolysis, pentose phosphate pathways (PPP), tricarboxylic acid (TCA) cycle, nitrogen assimilation and PHB synthesis pathway. The full list of reactions (including labels) and the stoichiometric network were summarised in the supplementary file ‘File S2.xlsx’. A thermodynamics-based analysis was used to check the reversibility and feasibility of the reactions in the metabolic network prior to flux balance analysis.
2.2.3. Problem Formulation
All computations were performed in the MATLAB (The MathWorks, Natick, MA) version 2016a environment. FBA and thermodynamic analysis were performed based on the methods described in the work of Llaneras [27] and Angelez-Martinez et al. [55], respectively. The detailed description of the optimisation problems, objective functions, nomenclatures and matrices dimension can be found in the supplementary file ‘File S3.docx’.
- i.
- FBA/DFBA
Under PSSA, there is no net accumulation or depletion of intracellular metabolites:
Here, S is the stoichiometric matrix of size 49 × 52 (49 and 52 are the number of metabolites and reactions, respectively) and v is the flux vector of size 49 × 1. Consequently, FBA/DFBA can be formulated into a linearly constrained optimisation problem to estimate flux distribution:
| Maximise: | Objective Function | Constraint No. |
| Subject to: | 1 | |
| 2 | ||
| 3 |
Intracellular fluxes were constrained by their respective upper bounds and lower bounds . ext is the mean of reconciliated extracellular fluxes that were measured experimentally. Both the upper and lower bounds of the extracellular flux vext were relaxed with propagated standard error σ to account for experimental errors. It is important to note that DFBA was first performed to generate appropriate flux distributions needed by the thermodynamic analysis as initial guesses. Based on the results of the thermodynamic analysis, the flux constraints were further modified, so that DFBA could be performed again to evaluate different objective functions and generate time-series flux distributions.
- ii.
- Prediction of concentration profiles
Through the DFBA framework, the effect of the modification of specific pathways on the overall fermentation performance can be predicted. For example, if we were to formulate the optimisation problem in the case of gene knockout, we could assign zero values to both the upper and lower bounds of the target pathways. We only used the glycerol and nitrogen uptake rates (average time-series data) as extracellular constraints, while the bounds for the remaining fluxes were replaced by those generated by flux variability analysis (FVA). The resultant extracellular fluxes for products (i.e., PHB, malic acid and acetic acid) can be integrated over time to generate the profiles of metabolite concentration (unit: g/L):
- iii.
- Thermodynamic-based flux estimation (TBFE)
Although stoichiometric modelling methods are versatile tools to explore knowledge of the metabolism as they require information primarily on the structure of metabolic networks, they are often highly underdetermined so that a family of solutions produces feasible answers. In this regard, thermodynamic considerations can be imposed as additional constraints to shrink the solution space further, by the elimination of thermodynamically infeasible flux distributions and the determination of reaction reversibility and directionality [56,57,58,59,60,61,62]. In addition, polling-based FBA has been developed to discriminate among equivalent feasible solutions [32]. The thermodynamic analysis here was formulated as a non-linear optimisation problem. Each optimisation was performed using the non-linear programming solver ‘fmincon’ in Matlab. Sequential quadratic programming is used for the optimisation as it is a relatively robust algorithm and offers a higher chance to converge to a feasible solution than other algorithms. The list of constraints used in TBFE is given in Table 2.
The problem formulation including the relevant nomenclature and the full description of the constraints in Table 2, is given in the supplementary file ‘File S3.docx’. If only the mass balance constraints are used (i.e., constraint 1, 2 and 3), the system is reduced to a linearly constrained optimisation problem. The calculation of the theoretical limits of intracellular fluxes using a linear programming (LP) framework is called flux variability analysis (FVA) [63]. Compared to FVA, TBFE is more stringently constrained and thus leads to narrower solution spaces. When coupled with measured time-series fluxes, TBFE can, in theory, generate better insights into the dynamic metabolism of cells. To check this, FVA was also conducted for the proposed network and compared with TBFE.
- iv.
- Objective functions
Choosing an appropriate and rational objective function for FBA is crucial for obtaining reliable predictions of flux distributions. Steady-state cellular metabolism is often assumed aiming to optimise the fitness and survivability of the cells, such that the intracellular fluxes are driven to maximising biomass growth [39,64] or ATP production per unit flux [65,66]. However, such assumed optimality criteria are not always valid over the whole range of environmental conditions and growth states. For instance, C. necator shifts from cell growth to PHB synthesis as nitrogen depletion is approached, a physiological phenomenon that is almost certainly beyond what ‘optimising cell growth’ can describe. In this case, optimisation with said objective functions would lead to biased prediction.
Hence, objective functions that can interpret the metabolism governed by dynamic environments and predict consistent and reliable fluxes would have important implications for studying biosynthesis in C. necator. Novel insights into bacterial growth have led to a number of justifiable objective functions that can better represent our current system:
The five objective functions listed above were evaluated on their ability to describe the operation of the metabolic network of C. necator first. The system was constrained by substrate uptake rates to predict metabolite secretion rates, and subsequently their concentration profiles. The objective function that can describe the system relatively well should allow the model to generate concentration profiles that better fit the experimental data. This objective function can then be used to perform further DFBA.
The mean Euclidean distance, which measures the absolute deviation between a pair of concentration points, was used to quantify the agreement between the predicted and the experimental data series.
where is the mean Euclidean distance, n is the number of data points on each concentration profile, and Ci and Ci,e are the predicted and experimental concentration at the ith data point, respectively.
3. Results and Discussion
Inputs of extracellular fluxes for thermodynamic analysis and DFBA were obtained from four different batch cultures. Two were conducted in flasks with 20 and 30 g/L glycerol, respectively (denoted as 20F and 30F). The other two were conducted in bioreactors with 30 and 60 g/L glycerol, respectively (marked as 30B and 60B). The concentration profiles are shown in Figure 2.
For flask cultures, increasing the glycerol concentration from 20 to 30 g/L had a negligible effect on cell growth, as both 20B and 30B had achieved a maximum growth rate of 0.14 gDCW/(l·h). However, for 30F, glycerol was consumed and, consequently, PHB was produced at faster rates than for 20F after the cell growth phase ended. By the end of the fermentation 30F, a total of 21.6 g/L of glycerol was consumed and 5.68 g/L of PHB was produced; 15% and 17% higher, respectively, than 20F. In terms of PHB yield (calculated as the ratio between the carbon in PHB and the carbon in glycerol), there was no significant difference between the two experiments (0.351 for 20F, and 0.358 for 30F). Compared to 30F, the 20F culture produced more organic acids in the first 60 h. Consequently, the re-assimilation of the excreted acids was observed in 20F and not in the other experiments. This was due to the depletion of glycerol in the medium, which forced cells to seek other suboptimal carbon sources.
In the bioreactor, the negative impact of glycerol concentration on cell growth was more pronounced. The maximum cell growth rate reached 0.056 gDCW/(L·h) in 30B, but this value dropped to 0.05 gDCW/(L·h) in 60B. The total amount of glycerol consumed in the first 60 h was also higher when less glycerol was used. Despite these advantages, 30B did not accumulate more PHB than 60B in the first 60 h. And after this point, metabolite production in 30B was gradually surpassed by that in 60B. Eventually, 60B produced 5.1 g/L of PHB and 1.11 g/L of acids, 30% and 22% higher than 30B, while consuming approximately the same amount of glycerol. As a result, 60B had a higher PHB yield (0.450) than 30B (0.328).
The bioreactor experiments differ from the flask ones mainly in terms of their aeration configurations and aeration rates: in flask experiments, aeration was supplied by the shaking of the culture flasks on an orbital shaker at 220 rpm; whereas, in the bioreactor experiments, cell cultures were aerated at a rate of 1 v.v.m, with an agitation speed of 220 rpm. Although we have not been able to measure the kLa in our shake flasks due to equipment limitations, the kLa in a flask with a similar experimental set-up (250 mL flask, 2.5 air-to-liquid ratio, 250 rpm) has been reported to be around 0.5 min−1 [72], which is much higher than that achieved in the bioreactor (0.11 min−1, as described in the supplementary file ‘File S1.docx’. This, combined with the fact that bioreactor culture (30B) showed poorer performance than the flask one (30F) in terms of cell growth, glycerol uptake and PHB productivity, means the aeration condition employed in flasks is likely to be more favourable for metabolism, while in bioreactors the aeration condition seems to be suboptimal, demanding further improvement. This hypothesis is verified in further bioreactor experiments employing different combinations of aeration rates and agitation speeds.
With an overall duration of 90 h, each experiment can be divided into four different physiological phases to facilitate illustration of results:
- Phase I (0–t1): Growth phase. The phase ends when carbon split ratios of PHB and biomass are equal.
- Phase II (t1–t2): Co-production of biomass and PHB phase. The phase ends when the carbon split ratio of PHB is 10 times that of biomass.
- Phase III (t2–t3): PHB production phase. The phase ends when cells accumulate more than 80% of the total amount of PHB at 90 h.
- Phase IV (t3–90 h): Post PHB production phase with attenuated metabolic activity
3.1. TFBE
TFBE is computationally expensive due to the presence of non-linear thermodynamic constraints and thus is not suitable for estimating dynamic flux distributions. As a trade-off between computational cost and model predictive capabilities, the thermodynamic constraints were decoupled from the linear constraints of DFBA (i.e., time-series extracellular fluxes). Instead, TBFE was performed with sampled extracellular fluxes from 20F and 30F. Three sets of extracellular fluxes were sampled from t1, t2, and t3 h to cover the behaviour of cells over the fermentation. The objectives of performing TBFE are to identify infeasible reactions/pathways present in the proposed network and determine which of the reactions are reversible. The results should allow us to impose more appropriate bounds to the intracellular fluxes in the following DFBA runs.
The maximum and minimum allowable intracellular fluxes calculated by TBFE are indicative of the directionality of biochemical reactions. A reaction is considered reversible if its flux has a positive maximum and a negative minimum; otherwise, it is irreversible. Moreover, if the absolute value of flux is close to zero (i.e., <0.001), the corresponding reaction is assumed to be in equilibrium.
Thermodynamically Feasible Flux Range over Time
Compared to FVA, which is purely based on mass balance constraints, TBFE allows for a more precise flux estimation by further limiting cellular behaviour with thermodynamic rules. This can be seen from the narrower solutions space predicted by TBFE using data from both 20F and 30F (Figure 3). The improvement on the precision of prediction is particularly obvious for central metabolic pathways, including glycolysis, Entner–Doudoroff (ED) pathway, TCA cycle and PHB synthesis.
Moreover, thermodynamic constraints impact the reversibility of the system. FVA predicted 10 reactions (r2, r3, r19, r20, r24, r25, r32, r33, r35, r36) to be strictly irreversible over the target duration of the fermentation, while TBFE predicted 11 additional irreversible reactions (r9, r21–r23, r37–r40). These irreversible reactions are those tasked with uptaking nutrients, generating energy and synthesising PHB. As for the remaining central metabolic pathways (ED) and anaplerotic pathways, their importance lies in distributing the precursor metabolites to both catabolic and anabolic pathways and maintaining a fine balance between the two. So they remained reversible throughout the fermentation to allow flexible allocation of resources.
According to TBFE results, the lower bounds of irreversible reactions were adjusted to zero, while the bounds of reversible ones remained unchanged. An exception, however, was made for the bounds of PPP. Reactions in PPP were predicted to be irreversible by FVA, but somewhat reversible by TBFE. This could be due to the nature of non-linear programming models, which are subject to the issue of convergence to local rather than global extrema. As such, tightening existing constraints or implementing additional constraints would sometimes direct the solver’s search to other optimisation solutions, leading to wider solution space. Considering the fluxes through these pathways, which generally have very small mean values, their lower and upper bounds were adjusted to −1 and 1 mmol/(h·gDCW), respectively.
3.2. Evaluation of Objective Functions
The mean Euclidean distance between the predicted and the experimental data series depicted a comprehensive picture of the goodness of fit of different objective functions (Figure 4). The predicted concentration profiles are presented in ‘File S2.xlsx’ in the supplementary materials.
The metabolic network of C. necator behaves differently in response to different objectives. For PHB synthesis, the ‘maximisation of ATP yield per flux unit’ is the best predictor, followed by the ‘minimisation of all fluxes’. PHB concentration profiles predicted by these objectives deviate from the experimental data by less than 1 g/L (i.e., 33%), except for fermentation 30B. Meanwhile, the rest of the objective functions provide a less accurate description for PHB synthesis: the ‘maximisation of PHB’ overpredicted PHB production profiles by 0.6–1.6 g/L (i.e., 28% to 81%), while ‘MOMA’ and the ‘maximisation of ATP yield’ severely underestimated the synthesis of PHB in call cases.
For by-product formation, the optimisation studies are less successful in finding a satisfactory metabolic regime. Both the ‘maximisation of ATP yield per flux unit’ and the ‘minimisation of all fluxes’ leads to the overestimation of the production of malate by 0.6–0.8 g/L. This could indicate that the synthesis of malate is likely backed by other cellular objectives, such as MOMA, which generates better prediction of malate concentration profile. In addition, the synthesis of acetate is ignored by most of the objectives tested, especially the ‘maximisation of PHB synthesis’ and the ‘minimisation of all fluxes’. The ‘maximisation of ATP yield per flux unit’ is the only objective that captures the trend of continuous production of acetate during fermentation, but leads to 1.5–2-fold overestimation of the final concentration of acetate.
In general, some objective functions can generate a quantitative prediction for particular extracellular metabolite profiles using carbon and nitrogen extracellular fluxes as inputs, which, to some extent, reflects the metabolic operation shaped and optimised by evolution [65]. Due to the inherent complexity of the regulation of dynamic metabolism in response to external stimuli, however, these objectives have not been able to closely predict the production of all the three metabolites simultaneously. There are always metabolic states that one objective function cannot account for, leading to errors in the predicted fluxes and, subsequently, the concentration profiles. That said, considering the fact that PHB synthesis is the primary carbon-consuming metabolic activity, an objective that can better approximate its production dynamics is likely a more realistic description of metabolic behaviour. Therefore, the ‘maximisation of ATP yield per flux unit’ is chosen for the following DFBA study as it can predict PHB profiles with reasonable accuracy, while reflecting the synthesis of both acids to some extent. In biological terms, this objective function demands a metabolic network to minimise its enzyme usage under growth-limited conditions while maintaining the energy need for maintenance, so that the generation of ATP via a shorter pathway is favoured [71].
In the present study, DFBA was performed by assuming that a single objective function is in play. Nevertheless, microorganisms are known for their ability to survive in ever-changing environments, so it is likely that evolution has driven the cells to optimise metabolic operations towards not only a particular objective but many. Therefore, it would be helpful in the future to construct a model employing an objective function comprising of multiple objectives, with their relative contribution to the overall phenotype indicated by weight factors (i.e., coefficients of importance). These factors, serving the purpose of representing regulatory events, can be adjusted according to environmental factors, such as PHB content and nitrogen availability. Additional constraints such as maintenance cost, P/O ratio or oxygen uptake rates may also be incorporated to improve predictions [65]. However, the limitation is also obvious. The predictive ability of such an objective function would depend, in large part, on the expressions used to adjust the weight factors. Namely, the objective function could not predict phenotypic changes caused by the perturbation of certain environmental factors if they are not involved in the calculation of the weight factors in the first place. In future studies, additional experimental data should be obtained to allow more regulatory factors to be considered in the hybrid objective function so that the model can yield better prediction and insights.
3.3. DFBA
DFBA was performed twice, using the upper limits (vext + δvext) and the lower limits of the measured fluxes (vext − δvext) as extracellular constraints, respectively. This resulted in a filled interval plot (metabolic flux (mmol/(h·gDCW) vs. time (h)) with an upper and a lower bound for every flux (as shown in Figure 5 and Figure 6). Although the estimated upper and lower bounds may not represent the ‘best’ and the ‘worse’ scenario in flux distribution, the inherent uncertainties in the fluxes due to errors of experimental measurements can be reasonably accounted for by the shaded area. The four phases of every flux profile are divided by vertical lines. The uncertainty of estimated fluxes was larger in the early time points because the values of DCW were smaller, so the profiles start from the 10th hour onwards.
3.3.1. Biomass Synthesis and PHB Production
As can be seen from Figure 5, cell growth slowed down as the nitrogen source was consumed. However, before cell growth totally ceased, PHB synthesis had already started. In all cases, we observed a clear growth transition in Phase II, where the decrease in biomass production flux was accompanied by the increase in PHB synthesis flux, suggesting that the production of PHB in C. necator is actually partially growth associated. Yet, the initiation of growth-associated PHB synthesis was not entirely correlated with nitrogen availability. Figure 7 shows the change of the flux split ratio ‘vbiomass/(vbiomass + vPHB)’ on a per carbon basis versus the quantity of nitrogen source left in the media. In 60B, PHB synthesis was initiated more promptly than in the other cultures and the flux split ratio reached a max of below 0.5 when there was still over 100 mg/L of nitrogen in the medium; meanwhile, in flask cultures, the flux split ratio was well above 0.8. In other words, cells in 60B enter the transition phase much earlier than cells in flasks cultures for the same nitrogen availability.
If we couple this with the fact that the cell growth in 60B is the most inhibited amongst the four experiments, we can hypothesise that PHB synthesis is triggered when cells encounter unfavourable growth conditions, which is contributed not only by nitrogen limitation but also by the growth-inhibitory effect of a high glycerol concentration.
The slower the culture grows, the longer growth-PHB transition phase it experiences. On top of this, cells accumulate a greater proportion of PHB as growth associated due to the initiation of PHB synthesis at higher nitrogen availability. For instance, as shown in Table 3, the transition in 60B took 21 h, while contributing to the production of nearly 40% of total PHB. In contrast, the 7-h Phase II in 30F only contributed to the production of less than 20% of total PHB.
The growth-associated PHB productivity (Phase II) is typically 2–3 times lower than the non-growth-associated PHB productivity (Phase III), hence it is undesirable to have a prolonged growth-PHB transition phase, which will only lead to reduced overall productivity. Therefore, in the batch fermentation, it is a favourable strategy to optimise the cell growth conditions to restrict the duration of the overall growth phase (Phase I + II), so that cells can enter efficient PHB production in Phase III sooner.
3.3.2. Acid Production
Given that cells have limited carbon availability and physical volume (i.e., PHB accumulation capacity), PHB fluxes started to decline gradually since the beginning of Phase III. Almost at the same time, acid secretion fluxes started to increase (Figure 5) and peaked near the end of Phase III. The production of organic acid during the non-growth phases (i.e., Phase III and IV) coincided with the cellular requirement to reserve energy. Like PHB, the excreted acids can be seen as extracellular energy reserves, which can be re-assimilated when extracellular glycerol level is low, as observed in 20F during Phase IV.
Despite showing poorer fermentation performance, bioreactor cultures appear to be more ‘resource-efficient’, as higher proportions of glycerol consumed were converted to PHB and acids during Phase III and IV. For instance, in 60B, 52.8% and 12.5% of the glycerol consumed was converted to PHB and acids, respectively, which are the highest amongst the four experiments. High glycerol levels also seemed to promote the conversion ratios of PHB and organic acids, as can be seen by comparing the data for 30B and 60B. Nevertheless, fermentation strategies to optimise PHB synthesis by minimising the production of the organic acids remain elusive, due to the connection between the two metabolic activities.
3.3.3. Glycolysis and TCA Cycle
Glycerol is oxidised by ATP-driven glycerol kinase glpK to form sn-glycerol-3P (GL3P), which is subsequently converted to dihydroxyacetone phosphate (T3P2) by dehydrogenase glpD. Stoichiometrically, T3P2 can be metabolised to pyruvate via both glycolysis and ED pathway. Flux profiles suggest the use of the former pathway by the metabolic network throughout the fermentation, since it allows for the conversion of T3P2 to generate ATP with less enzyme usage, which is favoured by the modelling objective function used (Figure 6).
The TCA cycle serves as the energy-yielding process for metabolism, meanwhile providing necessary precursors for cell building blocks. Thus, the flow of metabolites through the TCA cycle was comparatively high in Phase I and II, and positively correlated with biomass flux, as can be seen from all the plots in Figure 6. As PHB synthesis became increasingly predominant, TCA activity dropped to a minimum as these two pathways diverge from the lower part of glycolysis and are competing for a mutual substrate, acetyl-CoA. The decline in TCA activity is often attributed to the accumulation of the reducing equivalents, which, in turn, inhibits the dehydrogenation steps in the TCA cycle by allosterically affecting the relevant enzymes [73].
Minimal TCA flux signifies a phase of efficient production of PHB, which begins right at the end of Phase II and lasts from 5 to 30 h depending on the experimental conditions. Compared to flask cultures, bioreactor cultures kept TCA activity at a lower level for the entirety of Phase III. The fact that 60B achieved higher PHB productivity than 30B can be linked to the longer ‘Minimal TCA phase’ 60B experienced. This phase was apparently shorter in flask cultures, where TCA flux started increasing shortly after reaching the minimum. Given that cells possess the potential to divert most carbon flux towards PHB metabolism, it is reasonable to envisage optimisation approaches, in which the duration of the ‘minimal TCA phase’ could be extended by imposing suitable fermentation conditions.
TCA fluxes started increasing again during late phase III and early phase IV, along with the increased production of acids. This seemingly wasteful use of carbon source may be an attempt to dispose of upstream glycerol overflow when PHB accumulation capacity has been reached.
3.3.4. NADPH and NADH
The oxidative form of NADH is mainly involved in catabolic reactions, while NADPH is the primary electron donor for the synthesis of cellular substances such as proteins, nucleic acids and PHB [74]. NADH can be regenerated from NAD+ by glycolysis reactions and the TCA cycle, while NADPH is supplied mainly through isocitrate dehydrogenation (E.C. 1.1.1.42). In addition, the production of the two cofactor species can be mediated by two enzymes operating in parallel: a membrane-bound, proton-translocating transhydrogenase (E.C. 7.1.1.1) and a soluble, energy-independent transhydrogenase (E.C. 1.6.1.2) [75]. Since the constraint-based flux analysis is unable to resolve fluxes of parallel routes when they are not coupled to any measurable variables, the two transhydrogenation reactions were merged and treated as a single pathway for the current model. According to TBFE, the transhydrogenation reaction is reversible, so that its flux was loosely constrained between −30 and 30 mmol/(gDCW·h) to allow free interchange between NADPH and NADH. Thus, NADPH-NADPH transhydrogenation flux can be seen as an indicator of catabolism-anabolism balance. As can be seen from Figure 6, the transhydrogenation flux is on a decreasing trend in the early phase of cell growth (Phase I) as anabolic processes become dominant. The flux stays mostly negative throughout Phase II and Phase III, meaning isocitrate dehydrogenase alone can no longer generate enough NADPH to fuel the conversion of acetoacetyl-CoA to 3-hydroxybutyrate, so that an extra source of NADPH must be supplied by transhydrogenation.
Previous studies [75,76] have suggested a straightforward approach of overexpressing the structural genes associated with NADPH replenishment to increase its availability, thereby enhancing PHB production. However, this may not be as effective as expected, since the redox potential does not simply depend on the level of a single reducing equivalent, but on the relative quantity of oxidised and reduced form of both species (i.e., NADPH/NADP+ and NADH/NAD+) maintained at an appropriate level [74]. Moreover, cofactor engineering not only exposes the PHB synthesis machinery but also the entire enzymatic system to an altered redox condition, leading to a more complex scenario. In order to achieve desired cellular improvements using cofactor engineering, further knowledge on the control of reducing power generation through enzyme regulation is required.
3.3.5. ATP Hydrolysis and Energy Status
Cells are known to switch between metabolic end-products to adjust the rate of ATP hydrolysis in order to meet the specific energy demand in different states [77]. From an energy conservation point of view, synthesising PHB is favoured as it only generates 3.196 mol of ATP for each mole of glycerol consumed, while the complete oxidation of one mole of glycerol would generate up to 33.633 mol of ATP. Moreover, when the stoichiometric model is constrained to produce non-PHB biomass as the only product, 0.12 mol of ATP is formed per mole of glycerol consumed. The overall ATP yield of C. necator culture generally varied between 4 to 15 mol ATP/mol glycerol (GLY), depending on the fermentation phases (Figure 6). In phase I, the ATP yield can reach up to 14 mol ATP/mol GLY, which is far greater than the ATP yield associated with biomass formation. In other words, during the growth phase, cells produce far more energy from glycerol than is actually needed for fuelling biomass synthesis.
Initially, the excess energy released during Phase I was thought to be used for purely cell maintenance. However, we then noticed that ATP hydrolysis flux is somewhat positively correlated with biomass synthesis flux (Figure 8). This is not in line with the maintenance energy model proposed by Pirt [78], which postulates that, at a higher specific growth rate, the cellular metabolism should be operating at greater efficiency so that the maintenance energy (mmol ATP/(h·gDCW)) should be lower. Namely, if cells truly expend the energy released from ATP hydrolysis in maintenance, we should expect a downward trend for the ATP yield profiles, which is clearly not the case.
Hence, there is likely energy expenditure due to other means such as respiration uncoupling (i.e., cells fail to meet the theoretical energy yield), and energy spillage via futile cycles [77,79]. Although the energy spillage sacrifices some carbon utilisation efficiency, it guarantees growth potential against being inhibited by energy deficiency, according to Neijssel and Tempest (1976). Furthermore, it has been reported that an energy-dependent futile cycle (i.e., cyclic NH3/NH4+ retention) can occur concomitantly with NH3 assimilation by glutamine synthesis in order to maintain the intracellular NH4+ pool [80]. Nevertheless, a quantitative description of the relative contribution of these components to the overall energy expenditure remains elusive.
When cell growth came to an end due to nitrogen depletion by the end of Phase II, ATP yields reached a plateau with values between 4 and 6 mol ATP/mol GLY (Figure 6). This benchmarks the minimal energy requirement for the cell to carry out efficient PHB synthesis in the presence of excessive carbon source, regardless of fermentation conditions. After this point, the energy demand started to increase once again, conforming with the observation in TCA fluxes. Yet, in bioreactor cultures, the ATP yield remained mostly constant during Phase III. As a result, the ATP yield in the flask was noticeably higher, reflecting better respiration and aeration. Interestingly, the comparison between 30B and 60B revealed that the energetic efficiency of microbial activity was significantly reduced in cells growing in lower glycerol concentration, and the ATP yield was also higher. Increased glycerol transport cost at lower extracellular glycerol concentration is not a plausible explanation because glycerol enters cell membrane via facilitated diffusion that requires no metabolic energy [33]. On the other hand, low glycerol concentration may lead to a low concentration gradient across the cell membrane, thus limiting the rate of facilitated diffusion of glycerol [81]. Under such a carbon-limited environment, it is speculated that cells boost this seemingly wasteful energy expenditure to stimulate the consumption of glycerol, thereby conferring growth advantage upon themselves.
3.3.6. Flux Split Ratio
Flux split ratio, calculated as ‘moles of metabolite produced/total moles of glycerol consumed’, indicates the efficiency of substrate utilisation for the production of desired metabolites. One important motivation of metabolic engineering is to overexpress or knockout particular pathways using plasmids and heterologous enzymes in the hope of redirecting metabolic fluxes towards desired pathways. To enhance the carbon split ratio to PHB, one straightforward approach is naturally overexpressing the PHB synthesis pathway by increasing the copy number of the operon phaCAB. While the modification of other pathways may also serve this purpose, knowledge into the relative distribution of carbon flux in central carbon metabolism is needed. To this end, we plotted the split ratio profiles of four major carbon-consuming metabolic activities during Phase III and IV (Figure 9) only as these two phases contributed most to PHB synthesis (i.e., 60%–80% of PHB accumulation). The split ratios were calculated on a per carbon basis.
During the two phases, PHB synthesis competes for carbon flux with three other activities, which are the TCA cycle, acids (malic and acetic acid) production and pyruvate dehydrogenation. Manipulating pyruvate dehydrogenase can be ruled out first because the action of the enzyme to syphon one carbon atom off for each molecule of glycerol metabolised is unavoidable. From a reductionist point of view, the suppression/knockout of the reactions related to the formation of acetate and malate, as well as the TCA cycle can reduce the wasted carbon flux to the metabolic by-products, thus leading to an improved flux split ratio of PHB synthesis.
For the TCA cycle, the activity of the pathway could be subject to fine-tuning by devising suitable promoter systems. Such systems can be applied to the genetic engineering of one or more pathways to allow for induction of environment-dependent effects on gene expressions [82]. Apart from genetic engineering means, the regulation of the pathway can be conducted at the process level. The maintenance of high glycerol level during PHB growth phase (i.e., Phase III and IV) is a probable strategy, based on the comparison between the flux split profiles of 30B and 60B, which shows a substantial down-regulation of the fluxes through the TCA cycle by relatively high glycerol concentration. The addition of chemical reagents such as malonic acid (succinate dehydrogenase inhibitor) or tartaric acid (fumarase inhibitor) may as well serve the purpose but would be less economically viable for fermentation on a larger scale. In addition, TCA cycle activity can be effectively limited by lowering the oxygen supply, since the cycle forms the core of aerobic respiration. Ideally, if the carbon flux through TCA cycle during Phase III and IV were fully redirected towards PHB synthesis, we would observe a 49% increase in PHB productivity in 30B, 47% increase in 20F and 50% increase in 30F.
Like the TCA cycle, acid production cannot be readily avoided by deleting genes in acid formation pathways either. An attempt can be made to block acetate excretion by modifying the acetyl-CoA hydrolase catalysing the formation of acetate. Whereas malate is an intermediate in the TCA cycle, blocking its formation would naturally mean blocking the individual steps in the TCA cycle, which is also infeasible.
Overall, there are potential strategies to improve the flux split ratio of PHB synthesis by lowering the flux split ratio of the synthesis of byproducts. It cannot be predicted a priori, however, to which extent these modifications would cause the flux of PHB synthesis to rise. This is because the magnitude of the PHB synthesis flux depends not only on the PHB flux split ratio but also on the upstream glycerol supply, which may also be affected by the pathway modification. For instance, with TCA activity suppressed, cellular metabolism would operate with less energy supply, meanwhile producing less carbon dioxide. This was intended to improve the glycerol carbon conversion efficiency in PHB production. On the other hand, if the rising TCA activity during Phase III and IV (as observed in 20F, 30F and 30B) is due to inelastic cellular energy demand (e.g., the energy required to maintain transmembrane glycerol concentration to facilitate glycerol uptake), failing to meet such demand due to repressed TCA activity would instead compromise the rate of glycerol supply, leading to an overall reduction in PHB flux.
3.3.7. Further Experimental Tests
Based on the experimental and DFBA results obtained, aeration should be maintained at a high level during Phase I and II to boost cell growth, and properly moderated during Phase III and IV to repress the TCA activity in order to channel more carbon flux towards PHB. Accordingly, we performed further bioreactor experimental tests to evaluate the effectiveness of this hybrid strategy to PHB synthesis. Two 90-h batch experiments (30B2 and 30B3) were conducted under the same culture conditions as 30B but with different aeration strategies, as shown in Table 4. The raw data and methods for the estimation of oxygen mass transfer coefficients (kLa) are detailed in File S1.docx in the supplementary material.
Both 30B2 and 30B3 passed the cell growth phase in 24 h, with almost identical time profiles of active biomass concentration (Figure 10). After this point, the aeration rate in 30B2 was reduced from 0.6 to 0.4 vvm. This adjustment only slightly affected the acid production and glycerol consumption, but significantly improved the PHB production. In total, 26.25 g/L of glycerol was consumed and 7.60 g/L of PHB was produced in 30B2. The final PHB yield on a per carbon basis in 30B2 was 0.413, around 20% higher than in 30B3 (0.345), which conforms to our expectations.
Through comparing 30B2/30B3 and 30B, the positive impact of aeration on cell growth is confirmed, as the duration of the growth phase in 30B was almost twice as long as in 30B2/30B3. On the other hand, the PHB productivity in 30B (0.092g/(h·L)) at Phase III was significantly lower than 30B2 (0.156g/(h·L)) and 30B3 (0.142g/(h·L)), which contradicted our expectation. To investigate the cause of such contradiction, DFBA was performed with the experimental data of 30B2 and 30B3.
As discussed, the original intention of lowering the degree of aeration during PHB production phases was to increase the flux split ratio of the PHB pathway, in the hope that this can also improve the overall PHB productivity. This strategy has been partially validated, in that the glycerol split ratios in the three experiments were indeed in the order of ‘30B > 30B2 > 30B3′, which was the same as the order of the values of kLa, and opposite to the orders of TCA flux split ratios and ATP yields (Figure 10). The difference between the flux split ratios directly resulted in 30B3 achieving less PHB accumulation than 30B2.
However, comparing the performance of 30B and 30B2 produces a different scenario. It is true that the lowest degree of aeration has granted 30B the highest energy efficiency amongst the three experiments. Yet, it also severely hampered the glycerol uptake rate insomuch that the advantages of the flux split ratio was totally offset, leading to inferior results.
Through comparing the results of three experiments in terms of the ATP yield and PHB accumulation, conclusions are not clear-cut. This implies the existence of a respiration/energy-dependent regulating mechanism of glycerol uptake, which has not yet been verified and taken into account by the current stoichiometric model. The actual bottleneck of cellular performance in 30B appeared to be the rigid energy demand rather than the TCA flux split ratio. Hence, in this case, optimisation should be in the direction of promoting energy generation via respiration, rather than limiting it. The inclusion of associated regulatory and signalling information in the model would grant us more accurate insights into cellular behaviour and into the impact of genetic and environmental perturbations.
4. Conclusions
In this work, we have applied a dynamic flux balance analysis (DFBA) framework to examine the shift of metabolic states during bacterial fermentation. By upgrading the information contained in the experimental measurements, DFBA enables a graphical and intuitive presentation of the evolution of intracellular flux distribution resulting from cellular adaptation to dynamic extracellular environments. To facilitate illustration, the cell metabolism was divided into different phases, which feature microbial growth (Phase I), the co-production of biomass and PHB (Phase II), PHB synthesis (Phase III) and post-PHB synthesis (Phase IV).
Prior to the analysis, a thermodynamic-based flux estimation method was first used to check the directionality of biochemical reactions in the proposed network, and the mass balance constraints were adjusted accordingly. Then, five FBA objective functions were evaluated based on their capability to predict the three product concentration profiles (PHB, acetic acid and malic acid), when the model was only constrained by time-series substrate uptake fluxes. Although none of the objectives was able to generate an accurate prediction for all the three metabolites simultaneously, ‘minimisation of all fluxes’ was chosen as it allowed the model to generate the closest match for PHB production. Then, DFBA was performed with experimental results from batch fermentations with different initial glycerol concentration and aeration conditions.
Despite that fact that biomass synthesis per se is a highly anabolic process with minimal net energy yield, the overall metabolic state during growth phases, especially Phase I, was biased towards catabolism, possibly due to unknown, growth-associated energy expenditure. Moreover, metabolism appears less energetically efficient at faster growth rate, as cells require more maintenance energy (indicated by ATP hydrolysis flux).
The initiation of PHB synthesis is linked with growth stress, which can be elicited by nitrogen limitation as well as other factors, such as aeration limitation and substrate inhibition. Suboptimal conditions not only lead to slower cell growth but also cause cells to initiate PHB synthesis when more nitrogen source is available. To avoid inefficient growth-associated PHB synthesis in Phase II, culture conditions that can maximise cell growth rate should be employed.
As soon as growth ceased due to nitrogen depletion, cells entered Phase III and PHB production flux reached the maximum. Organic acids were also produced concomitantly. During this phase, cells exhibited the potential to achieve a state of efficient PHB production featuring minimum TCA flux split ratio and low ATP yield. It was thus postulated that the minimisation of TCA cycle activity after cell growth phase through modifying environmental factors, such as the degree of aeration, could be a strategy to improve PHB production.
FBA can reveal the distribution of material flow within the metabolic network such that we can identify the major metabolic activities competing for carbon source with PHB metabolism. Nonetheless, as a reductionist approach, FBA has its limitation in demonstrating how PHB metabolism is kept in balance with these activities. It remains elusive whether the TCA cycle, the main competitor for PHB production, is always the rate-limiting factor of PHB productivity. This uncertainty was further explained with additional experiments, where reduced TCA activity showed a positive effect on PHB productivity (Phase III and IV) under highly aerated conditions, whereas the opposite effect was observed when the cell culture received less aeration. The misprediction by FBA partially arises from the missing regulatory link between the level of oxygen and the kinetics of the whole glycerol uptake system. This can be compensated by the use of a holistic model framework, such as metabolic control analysis, which can describe the control structure of the system and quantify the relative strength of the control based on FBA.
Supplementary Materials
The following are available online at https://www.mdpi.com/2227-9717/8/6/657/s1. File S1.docx: Lists of abbreviations and acronyms; summary of material and methods (experimental and computational); appendices with additional raw data and deviation procedures of equations. File S2.xlsx: General data file containing: (1) metabolic network stoichiometry and list of reactions, (2) TBFE modelling parameters, (3) Experimental data as DFBA and TBFE inputs, (4) TBFE results, (5) objective function evaluation results and plots, File S3.docx: Optimisation problem formulation for TBFE and DFBA
Author Contributions
Conceptualization, C.S. and C.T.; Methodology, C.S.; Software, C.S. and C.T.; Validation, C.S. and C.P.-R.; Formal Analysis, C.S. and C.P.-R.; Investigation, C.S. and C.P.-R.; Resources, C.T. and C.W.; Data Curation, C.S.; Writing–Original Draft Preparation, C.S.; Writing–Review and Editing, C.T.; Visualization, C.T.; Supervision, C.T. and C.W.; Project Administration, C.T.; Funding Acquisition, C.T. and C.W. All authors have read and agreed to the published version of the manuscript.
Funding
This research received no external funding.
Acknowledgments
The authors wish to thank the University of Manchester for the provision of a President’s Doctoral Scholarship Award to Cristina Pérez Rivero.
Conflicts of Interest
The authors declare no conflict of interest.
References
- Ashby, R.D.; Solaiman, D.K.Y.; Foglia, T. A Synthesis of short-/medium-chain-length poly(hydroxyalkanoate) blends by mixed culture fermentation of glycerol. Biomacromolecules 2005, 6, 2106–2112. [Google Scholar] [CrossRef]
- Kim, B.S.; Lee, S.C.; Lee, S.Y.; Chang, H.N.; Chang, Y.K.; Woo, S.I. Production of poly(3-hydroxybutyric acid) by fed-batch culture ofAlcaligenes eutrophus with glucose concentration control. Biotechnol. Bioeng. 1994, 43, 892–898. [Google Scholar] [CrossRef] [PubMed]
- Anderson, A.J.; Dawes, E.A. Occurrence, metabolism, metabolic role, and industrial uses of bacterial polyhydroxyalkanoates. Microbiol. Rev. 1990, 54, 450–472. [Google Scholar] [CrossRef] [PubMed] [Green Version]
- Zinn, M.; Witholt, B.; Egli, T. Occurrence, synthesis and medical application of bacterial polyhydroxyalkanoate. Adv. Drug Deliv. Rev. 2001, 53, 5–21. [Google Scholar] [CrossRef]
- Kessler, B.; Witholt, B. Poly(3-Hydroxyalkanoates). In Encyclopedia Of Bioprocess Technology: Fermentation, Biocatalysis, and Bioseparation; Flickinger, M.C., Drew, S.W., Wiley, J., Eds.; John Wiley & Sons: Hoboken, NJ, USA, 1999; pp. 2024–2040. ISBN 0471138223. [Google Scholar]
- Brandl, H.; Gross, R.A.; Lenz, R.W.; Fuller, R.C. Plastics from bacteria and for bacteria: Poly(beta-hydroxyalkanoates) as natural, biocompatible, and biodegradable polyesters. Adv. Biochem. Eng. 1990, 41, 77–93. [Google Scholar]
- Lee, S.Y. Bacterial polyhydroxyalkanoates. Biotechnol. Bioeng. 1996, 49, 1–14. [Google Scholar] [CrossRef]
- Patel, M.K.; Marscheider-Weidemann, F.; Schleich, J.; Hüsing, B.; Angerer, G. Techno-economic Feasibility of Large-scale Production of Bio-based Polymers in Europe; European Commission: Brussels, Belgium, 2005; Technical Report EUR, 22103 EN. [Google Scholar]
- Xiong, Y.-C.; Yao, Y.-C.; Zhan, X.-Y.; Chen, G.-Q. Application of Polyhydroxyalkanoates Nanoparticles as Intracellular Sustained Drug-Release Vectors. J. Biomater. Sci. Polym. Ed. 2010, 21, 127–140. [Google Scholar] [CrossRef]
- Michalak, M.; Marek, A.; Zawadiak, J.; Kawalec, M.; Kurcok, P. Synthesis of PHB-based carrier for drug delivery systems with pH-controlled release. Eur. Polym. J. 2013, 49, 4149–4156. [Google Scholar] [CrossRef]
- Haas, R.; Jin, B.; Zepf, F.T. Production of Poly(3-hydroxybutyrate) from Waste Potato Starch. Biosci. Biotechnol. Biochem. 2008, 72, 253–256. [Google Scholar] [CrossRef]
- García, I.L.; López, J.A.; Dorado, M.P.; Kopsahelis, N.; Alexandri, M.; Papanikolaou, S.; Villar, M.A.; Koutinas, A.A. Evaluation of by-products from the biodiesel industry as fermentation feedstock for poly(3-hydroxybutyrate-co-3-hydroxyvalerate) production by Cupriavidus necator. Bioresour. Technol. 2013, 130, 16–22. [Google Scholar] [CrossRef]
- Xu, Y.; Wang, R.-H.; Koutinas, A.; Webb, C. Microbial biodegradable plastic production from a wheat-based biorefining strategy. Process. Biochem. 2010, 45, 153–163. [Google Scholar] [CrossRef]
- Baei, M.S.; Najafpour, G.D.; Younesi, H.; Tabandeh, F.; Eisazadeh, H. Poly (3-hydroxybutyrate) Synthesis by Cupriavidus necator DSMZ 545 Utilizing Various Carbon Sources Faculty of Chemical Engineering; Noshirvani University of Technology: Babol, Iran, 2009; Volume 7, pp. 157–161. [Google Scholar]
- Yazdani, S.S.; Gonzalez, R. Anaerobic fermentation of glycerol: A path to economic viability for the biofuels industry. Curr. Opin. Biotechnol. 2007, 18, 213–219. [Google Scholar] [CrossRef] [PubMed]
- De Almeida, A.; Giordano, A.M.; Nikel, P.I.; Pettinari, M.J. Effects of Aeration on the Synthesis of Poly(3-Hydroxybutyrate) from Glycerol and Glucose in Recombinant Escherichia coli. Appl. Environ. Microbiol. 2010, 76, 2036–2040. [Google Scholar] [CrossRef] [PubMed] [Green Version]
- Bormann, E.J.; Leisner, M.; Roth, M.; Beer, B.; Metzner, K. Production of polyhydroxybutyrate by Ralstonia eutropha from protein hydrolysates. Appl. Microbiol. Biotechnol. 1998, 50, 604–607. [Google Scholar] [CrossRef]
- Sangkharak, K. Utilization of biodiesel waste as a feedstock for the production of polyhydroxybutyrate by Cupriavidus necator. Afr. J. Biotechnol. 2011, 10, 17812–17824. [Google Scholar] [CrossRef]
- Salakkam, A.; Webb, C. Production of poly(3-hydroxybutyrate) from a complete feedstock derived from biodiesel by-products (crude glycerol and rapeseed meal). Biochem. Eng. J. 2018, 137, 358–364. [Google Scholar] [CrossRef]
- Špoljarić, I.V.; Lopar, M.; Koller, M.; Muhr, A.; Salerno, A.; Reiterer, A.; Malli, K.; Angerer, H.; Strohmeier, K.; Schober, S.; et al. Mathematical modeling of poly[(R)-3-hydroxyalkanoate] synthesis by Cupriavidus necator DSM 545 on substrates stemming from biodiesel production. Bioresour. Technol. 2013, 133, 482–494. [Google Scholar] [CrossRef]
- Passanha, P.; Esteves, S.; Kedia, G.; Dinsdale, R.; Guwy, A.J. Increasing polyhydroxyalkanoate (PHA) yields from Cupriavidus necator by using filtered digestate liquors. Bioresour. Technol. 2013, 147, 345–352. [Google Scholar] [CrossRef]
- Cavalheiro, J.M.B.T.; de Almeida, M.C.M.D.; da Fonseca, M.M.R.; Carvalho, C.C.C.R. De Adaptation of Cupriavidus necator to conditions favoring polyhydroxyalkanoate production. J. Biotechnol. 2012, 164, 309–317. [Google Scholar] [CrossRef]
- Cavalheiro, J.M.; De Almeida, C.D.; Grandfils, C.; Da Fonseca, M.; Da Fonseca, M.M. Poly(3-hydroxybutyrate) production by Cupriavidus necator using waste glycerol. Process. Biochem. 2009, 44, 509–515. [Google Scholar] [CrossRef]
- Theodoropoulos, C.; Sun, C. Bioreactor Models and Modeling Approaches, 3rd ed.; Elsevier: Amsterdam, The Netherlands, 2019; Volume 2, pp. 663–680. ISBN 9780444640468. [Google Scholar]
- Van Gulik, W.M. Metabolic Models for Growth and Product Formation. In The Metabolic Pathway Engineering Handbook; Informa UK Limited: Colchester, UK, 2009; pp. 1–18. [Google Scholar]
- Price, N.D.; Papin, J.A.; Schilling, C.H.; Palsson, B.Ø. Genome-scale microbial in silico models: The constraints-based approach. Trends Biotechnol. 2003, 21, 162–169. [Google Scholar] [CrossRef]
- Llaneras, F.; Picó, J. Stoichiometric modelling of cell metabolism. J. Biosci. Bioeng. 2008, 105, 1–11. [Google Scholar] [CrossRef] [PubMed]
- Klapa, M.I. Metabolic FLux Analysis. In The Metabolic Pathway Engineering Handbook; Smolke, C.D., Ed.; CRC Press: New York, NY, USA, 2010; pp. 1–17. [Google Scholar]
- Orth, J.D.; Thiele, I.; Palsson, B.Ø. What is flux balance analysis? Nat. Biotechnol. 2010, 28, 245–248. [Google Scholar] [CrossRef] [PubMed]
- Papin, J.A.; Stelling, J.; Price, N.D.; Klamt, S.; Schuster, S.; Palsson, B. Comparison of network-based pathway analysis methods. Trends Biotechnol. 2004, 22, 400–405. [Google Scholar] [CrossRef]
- Pey, J.; Rubio, A.; Theodoropoulos, C.; Cascante, M.; Planes, F.J. Integrating tracer-based metabolomics data and metabolic fluxes in a linear fashion via Elementary Carbon Modes. Metab. Eng. 2012, 14, 344–353. [Google Scholar] [CrossRef] [Green Version]
- Binns, M.; De Atauri, P.; Vlysidis, A.; Cascante, M.; Theodoropoulos, C. Sampling with poling-based flux balance analysis: Optimal versus sub-optimal flux space analysis of Actinobacillus succinogenes. BMC Bioinform. 2015, 16, 93. [Google Scholar] [CrossRef] [PubMed] [Green Version]
- Lopar, M.; Špoljarić, I.V.; Cepanec, N.; Koller, M.; Braunegg, G.; Horvat, P. Study of metabolic network of Cupriavidus necator DSM 545 growing on glycerol by applying elementary flux modes and yield space analysis. J. Ind. Microbiol. Biotechnol. 2014, 41, 913–930. [Google Scholar] [CrossRef] [PubMed]
- Leighty, R.W.; Antoniewicz, M.R. Dynamic metabolic flux analysis (DMFA): A framework for determining fluxes at metabolic non-steady state. Metab. Eng. 2011, 13, 745–755. [Google Scholar] [CrossRef]
- Antoniewicz, M.R. Dynamic metabolic flux analysis—Tools for probing transient states of metabolic networks. Curr. Opin. Biotechnol. 2013, 24, 973–978. [Google Scholar] [CrossRef]
- Lequeux, G.; Beauprez, J.; Maertens, J.; Van Horen, E.; Soetaert, W.; Vandamme, E.; Vanrolleghem, P.A. Dynamic metabolic flux analysis demonstrated on cultures where the limiting substrate is changed from carbon to nitrogen and vice versa. J. Biomed. Biotechnol. 2010, 2010, 309–313. [Google Scholar] [CrossRef] [PubMed]
- Kresnowati, M.T.A.P.; Suarez-Mendez, C.; Van Winden, W.; Van Gulik, W.M.; Heijnen, J.J. Quantitative physiological study of the fast dynamics in the intracellular pH of Saccharomyces cerevisiae in response to glucose and ethanol pulses. Metab. Eng. 2008, 10, 39–54. [Google Scholar] [CrossRef]
- Mahadevan, R.; Edwards, J.S.; Doyle, F.J. Dynamic Flux Balance Analysis of Diauxic Growth in Escherichia coli. Biophys. J. 2002, 83, 1331–1340. [Google Scholar] [CrossRef] [Green Version]
- Varma, A.H.; Palsson, B.O. Stoichiometric flux balance models quantitatively predict growth and metabolic by-product secretion in wild-type Escherichia coli W3110. Appl. Environ. Microbiol. 1994, 60, 3724–3731. [Google Scholar] [CrossRef] [PubMed] [Green Version]
- Hohenschuh, W.; Hector, R.; Murthy, G.S. A dynamic flux balance model and bottleneck identification of glucose, xylose, xylulose co-fermentation in Saccharomyces cerevisiae. Bioresour. Technol. 2015, 188, 153–160. [Google Scholar] [CrossRef] [PubMed]
- Rivero, C.P.; Sun, C.; Theodoropoulos, C.; Webb, C. Building a predictive model for PHB production from glycerol. Biochem. Eng. J. 2016, 116, 113–121. [Google Scholar] [CrossRef] [Green Version]
- Henry, O.; Kamen, A.; Perrier, M. Monitoring the physiological state of mammalian cell perfusion processes by on-line estimation of intracellular fluxes. J. Process. Control. 2007, 17, 241–251. [Google Scholar] [CrossRef]
- Prichard, L.; Barwick, V. Preparation of Calibration Curves: A Guide to Best Practice; LGC: Teddington, UK, 2003; pp. 1–27. [Google Scholar]
- Riis, V.; Mai, W. Gas chromatographic determination microbial biomass after hydrochloric of poly-beta-hydroxybutyric acid propanolysis. J. Chromatogr. 1988, 445, 285–289. [Google Scholar] [CrossRef]
- UC Santa Barbara Dissociation Constants of Organic Acids and Bases. Available online: https://labs.chem.ucsb.edu/zhang/liming/pdf/pKas_of_Organic_Acids_and_Bases.pdf (accessed on 25 February 2015).
- Tribe, L.A.; Briens, C.L.; Margaritis, A. Determination of the volumetric mass transfer coefficient (kLa) using the dynamic ?gas out-gas in? method: Analysis of errors caused by dissolved oxygen probes. Biotechnol. Bioeng. 1995, 46, 388–392. [Google Scholar] [CrossRef]
- García-Ochoa, F.; Gomez, E. Bioreactor scale-up and oxygen transfer rate in microbial processes: An overview. Biotechnol. Adv. 2009, 27, 153–176. [Google Scholar] [CrossRef]
- Roberts, R.; Kastner, J.; Ahmad, M.; Tedder, W. The Effect of Agitation on Oxygen Mass Transfer in a Fermentor. Chem. Eng. Educ. 1992, 26, 142–145. [Google Scholar]
- Doble, M.; Kruthiventi, A.K.; Gaikar, V.G. Stirred Bioreactor. In Biotransformations and Bioprocesses; CRC Press: Boka Raton, FL, USA, 2004; pp. 227–255. [Google Scholar]
- Niklas, J.; Schräder, E.; Sandig, V.; Noll, T.; Heinzle, E. Quantitative characterization of metabolism and metabolic shifts during growth of the new human cell line AGE1.HN using time resolved metabolic flux analysis. Bioprocess Biosyst. Eng. 2010, 34, 533–545. [Google Scholar] [CrossRef] [PubMed] [Green Version]
- Llaneras, F.; Picó, J. A procedure for the estimation over time of metabolic fluxes in scenarios where measurements are uncertain and/or insufficient. BMC Bioinform. 2007, 8, 421. [Google Scholar] [CrossRef] [PubMed]
- Stephanopoulos, G.N.; Aristidou, A.A.; Nielsen, J. The Essence of Metabolic Engineering. In Metabolic Engineering; Elsevier BV: Amsterdam, The Netherlands, 1998; pp. 1–20. [Google Scholar]
- Yamane, T. Yield of poly-D(-)-3-hydroxybutyrate from various carbon sources: A theoretical study. Biotechnol. Bioeng. 1993, 41, 165–170. [Google Scholar] [CrossRef] [PubMed]
- Tanadchangsaeng, N.; Yu, J. Microbial synthesis of polyhydroxybutyrate from glycerol: Gluconeogenesis, molecular weight and material properties of biopolyester. Biotechnol. Bioeng. 2012, 109, 2808–2818. [Google Scholar] [CrossRef]
- Angeles-Martinez, L.; Theodoropoulos, C. The Influence of Crowding Conditions on the Thermodynamic Feasibility of Metabolic Pathways. Biophys. J. 2015, 109, 2394–2405. [Google Scholar] [CrossRef]
- Henry, C.S.; Jankowski, M.D.; Broadbelt, L.J.; Hatzimanikatis, V. Genome-Scale Thermodynamic Analysis of Escherichia coli Metabolism. Biophys. J. 2006, 90, 1453–1461. [Google Scholar] [CrossRef] [Green Version]
- Henry, C.S.; Broadbelt, L.J.; Hatzimanikatis, V. Thermodynamics-Based Metabolic Flux Analysis. Biophys. J. 2007, 92, 1792–1805. [Google Scholar] [CrossRef] [Green Version]
- Hoppe, A.; Hoffmann, S.; Holzhütter, H.-G. Including metabolite concentrations into flux balance analysis: Thermodynamic realizability as a constraint on flux distributions in metabolic networks. BMC Syst. Biol. 2007, 1, 23. [Google Scholar] [CrossRef] [Green Version]
- Kümmel, A.; Panke, S.; Heinemann, M. Systematic assignment of thermodynamic constraints in metabolic network models. BMC Bioinform. 2006, 7, 512. [Google Scholar] [CrossRef] [Green Version]
- Beard, D.A.; Babson, E.; Curtis, E.; Qian, H. Thermodynamic constraints for biochemical networks. J. Theor. Biol. 2004, 228, 327–333. [Google Scholar] [CrossRef]
- Angeles-Martinez, L.; Theodoropoulos, C. Estimation of flux distribution in metabolic networks accounting for thermodynamic constraints: The effect of equilibrium vs. blocked reactions. Biochem. Eng. J. 2016, 105, 347–357. [Google Scholar] [CrossRef]
- Soh, K.C.; Hatzimanikatis, V. Network thermodynamics in the post-genomic era. Curr. Opin. Microbiol. 2010, 13, 350–357. [Google Scholar] [CrossRef] [PubMed]
- Bushell, M.E.; Sequeira, S.I.; Khannapho, C.; Zhao, H.; Chater, K.F.; Butler, M.J.; Kierzek, A.; Avignone-Rossa, C.A. The use of genome scale metabolic flux variability analysis for process feed formulation based on an investigation of the effects of the zwf mutation on antibiotic production in Streptomyces coelicolor. Enzym. Microb. Technol. 2006, 39, 1347–1353. [Google Scholar] [CrossRef]
- Feist, A.M.; Palsson, B.O. The biomass objective function. Curr. Opin. Microbiol. 2010, 13, 344–349. [Google Scholar] [CrossRef] [PubMed] [Green Version]
- Schuetz, R.; Kuepfer, L.; Sauer, U. Systematic evaluation of objective functions for predicting intracellular fluxes inEscherichia coli. Mol. Syst. Biol. 2007, 3, 119. [Google Scholar] [CrossRef]
- Knorr, A.L.; Jain, R.; Srivastava, R. Bayesian-based selection of metabolic objective functions. Bioinform. 2006, 23, 351–357. [Google Scholar] [CrossRef] [Green Version]
- Tajparast, M.; Frigon, D. Genome-scale metabolic model of Rhodococcus jostii RHA1 (iMT1174) to study the accumulation of storage compounds during nitrogen-limited condition. BMC Syst. Biol. 2015, 9, 43. [Google Scholar] [CrossRef]
- Van Gulik, W.M.; Heijnen, J.J. A metabolic network stoichiometry analysis of microbial growth and product formation. Biotechnol. Bioeng. 1995, 48, 681–698. [Google Scholar] [CrossRef]
- Bordbar, A.; Monk, J.M.; King, Z.; Palsson, B. Constraint-based models predict metabolic and associated cellular functions. Nat. Rev. Genet. 2014, 15, 107–120. [Google Scholar] [CrossRef]
- Holzhütter, H.-G. The principle of flux minimization and its application to estimate stationary fluxes in metabolic networks. JBIC J. Biol. Inorg. Chem. 2004, 271, 2905–2922. [Google Scholar] [CrossRef]
- Dauner, M.; Sauer, U. Stoichiometric growth model for riboflavin-producing Bacillus subtilis. Biotechnol. Bioeng. 2001, 76, 132–143. [Google Scholar] [CrossRef] [PubMed]
- Gupta, A.; Rao, G. A study of oxygen transfer in shake flasks using a non-invasive oxygen sensor. Biotechnol. Bioeng. 2003, 84, 351–358. [Google Scholar] [CrossRef]
- White, D. Central metabolic pathway. In The Physiology and Biochemistry of Prokaryotes; Oxford University Press: New York, NY, USA, 2000; pp. 180–211. [Google Scholar]
- Ying, W. NAD+/NADH and NADP+/NADPH in Cellular Functions and Cell Death: Regulation and Biological Consequences. Antioxid. Redox Signal. 2008, 10, 179–206. [Google Scholar] [CrossRef] [PubMed] [Green Version]
- Centeno-Leija, S.; Huerta-Beristain, G.; Giles-Gómez, M.; Bolivar, F.; Gosset, G.; Martinez, A. Improving poly-3-hydroxybutyrate production in Escherichia coli by combining the increase in the NADPH pool and acetyl-CoA availability. Antonie van Leeuwenhoek 2014, 105, 687–696. [Google Scholar] [CrossRef] [PubMed]
- Park, S.J.; Hong, S.H.; Lee, S.Y. Polymerisation of Building Blocks to Macromolecules: Polyhydroxyalkanoates as an example. In The Metabolic Pathway Engineering Handbook; Smolke, C.D., Ed.; CRC Press: Boca Raton, FL, USA, 2010; pp. 1–19. ISBN 978-1-4398-0296-0. [Google Scholar]
- Russell, J.B.; Cook, G.M. Energetics of bacterial growth: Balance of anabolic and catabolic reactions. Microbiol. Rev. 1995, 59, 48–62. [Google Scholar] [CrossRef] [Green Version]
- Pirt, S.J. Maintenance energy: A general model for energy-limited and energy-sufficient growth. Arch. Microbiol. 1982, 133, 300–302. [Google Scholar] [CrossRef] [PubMed]
- Russell, J.B. The Energy Spilling Reactions of Bacteria and Other Organisms. J. Mol. Microbiol. Biotechnol. 2007, 13, 1–11. [Google Scholar] [CrossRef] [PubMed]
- Kleiner, D. Bacterial Ammonium Transport. FEMS Microbiol. Lett. 1985, 32, 87–100. [Google Scholar] [CrossRef]
- Lin, E.C.C. Glycerol Utilization by Facilitated Diffusion Coupled to Phosphorylation in Bacteria. In The Cell Membrane; Springer Science and Business Media LLC: Berlin, Germany, 1984; pp. 109–130. [Google Scholar]
- Hwang, H.J.; Lee, S.Y.; Lee, P.C. Engineering and application of synthetic nar promoter for fine-tuning the expression of metabolic pathway genes in Escherichia coli. Biotechnol. Biofuels 2018, 11, 103. [Google Scholar] [CrossRef] [Green Version]
Figure 1.
Metabolic map of C. necator DSM 545. Only pathways associated with central carbon metabolism are shown, while the remaining ones (such as most transport pathways) were omitted from the figure for clarity of the layout.
Figure 1.
Metabolic map of C. necator DSM 545. Only pathways associated with central carbon metabolism are shown, while the remaining ones (such as most transport pathways) were omitted from the figure for clarity of the layout.

Figure 2.
Measured experimental data (*) and smooth concentration profiles (line) of glycerol, poly(3-hydroxybutyric acid) (PHB), non-PHB biomass, acetic acid and malic acid for experiment 20F, 30F, 30B and 60B.
Figure 2.
Measured experimental data (*) and smooth concentration profiles (line) of glycerol, poly(3-hydroxybutyric acid) (PHB), non-PHB biomass, acetic acid and malic acid for experiment 20F, 30F, 30B and 60B.

Figure 3.
Ranges of 39 intracellular fluxes predicted by TBFE (dotted line) and flux variability analysis (FVA) (grey line) using sampled extracellular fluxes from t1, t2 and t3 (20F and 30F).
Figure 3.
Ranges of 39 intracellular fluxes predicted by TBFE (dotted line) and flux variability analysis (FVA) (grey line) using sampled extracellular fluxes from t1, t2 and t3 (20F and 30F).

Figure 4.
Mean Euclidean distance between the predicted concentration profiles and experimental values.
Figure 4.
Mean Euclidean distance between the predicted concentration profiles and experimental values.

Figure 5.
Flux profiles for glycerol (GLY) uptake, biomass synthesis and products (PHB, acetic acid (AC) and malic acid (MAL)) synthesis. Time range: 10–90 h.
Figure 5.
Flux profiles for glycerol (GLY) uptake, biomass synthesis and products (PHB, acetic acid (AC) and malic acid (MAL)) synthesis. Time range: 10–90 h.

Figure 6.
Flux profiles for glycolysis (r5), the ED pathway (r39), TCA cycle (r20), NAD(P)+ transhydrogenation (r41) and ATP yield (molATP/molGLY) profiles. Time range: 10–90 h.
Figure 6.
Flux profiles for glycolysis (r5), the ED pathway (r39), TCA cycle (r20), NAD(P)+ transhydrogenation (r41) and ATP yield (molATP/molGLY) profiles. Time range: 10–90 h.

Figure 7.
Plot of the flux split ratio ‘vbiomass/(vbiomass+vPHB)’ on a per carbon basis against the remaining concentration of nitrogen in the medium.
Figure 7.
Plot of the flux split ratio ‘vbiomass/(vbiomass+vPHB)’ on a per carbon basis against the remaining concentration of nitrogen in the medium.

Figure 8.
Flux profiles of ATP hydrolysis vs. the rate of non-PHB biomass synthesis.

Figure 9.
Profiles of flux split ratios (on a per carbon basis) of four major carbon-consuming activities/pathways: (1) pyruvate dehydrogenation (dashed line); (2) acid production (solid line); (3) PHB synthesis (dotted line); (4) TCA cycle (dash-dot line).
Figure 9.
Profiles of flux split ratios (on a per carbon basis) of four major carbon-consuming activities/pathways: (1) pyruvate dehydrogenation (dashed line); (2) acid production (solid line); (3) PHB synthesis (dotted line); (4) TCA cycle (dash-dot line).

Figure 10.
Results summary of the three bioreactor batch experiments with 30 g/L of glycerol. Profiles of metabolite concentrations (PHB, glycerol and non-PHB biomass), ATP yield and carbon split ratio were shown.
Figure 10.
Results summary of the three bioreactor batch experiments with 30 g/L of glycerol. Profiles of metabolite concentrations (PHB, glycerol and non-PHB biomass), ATP yield and carbon split ratio were shown.


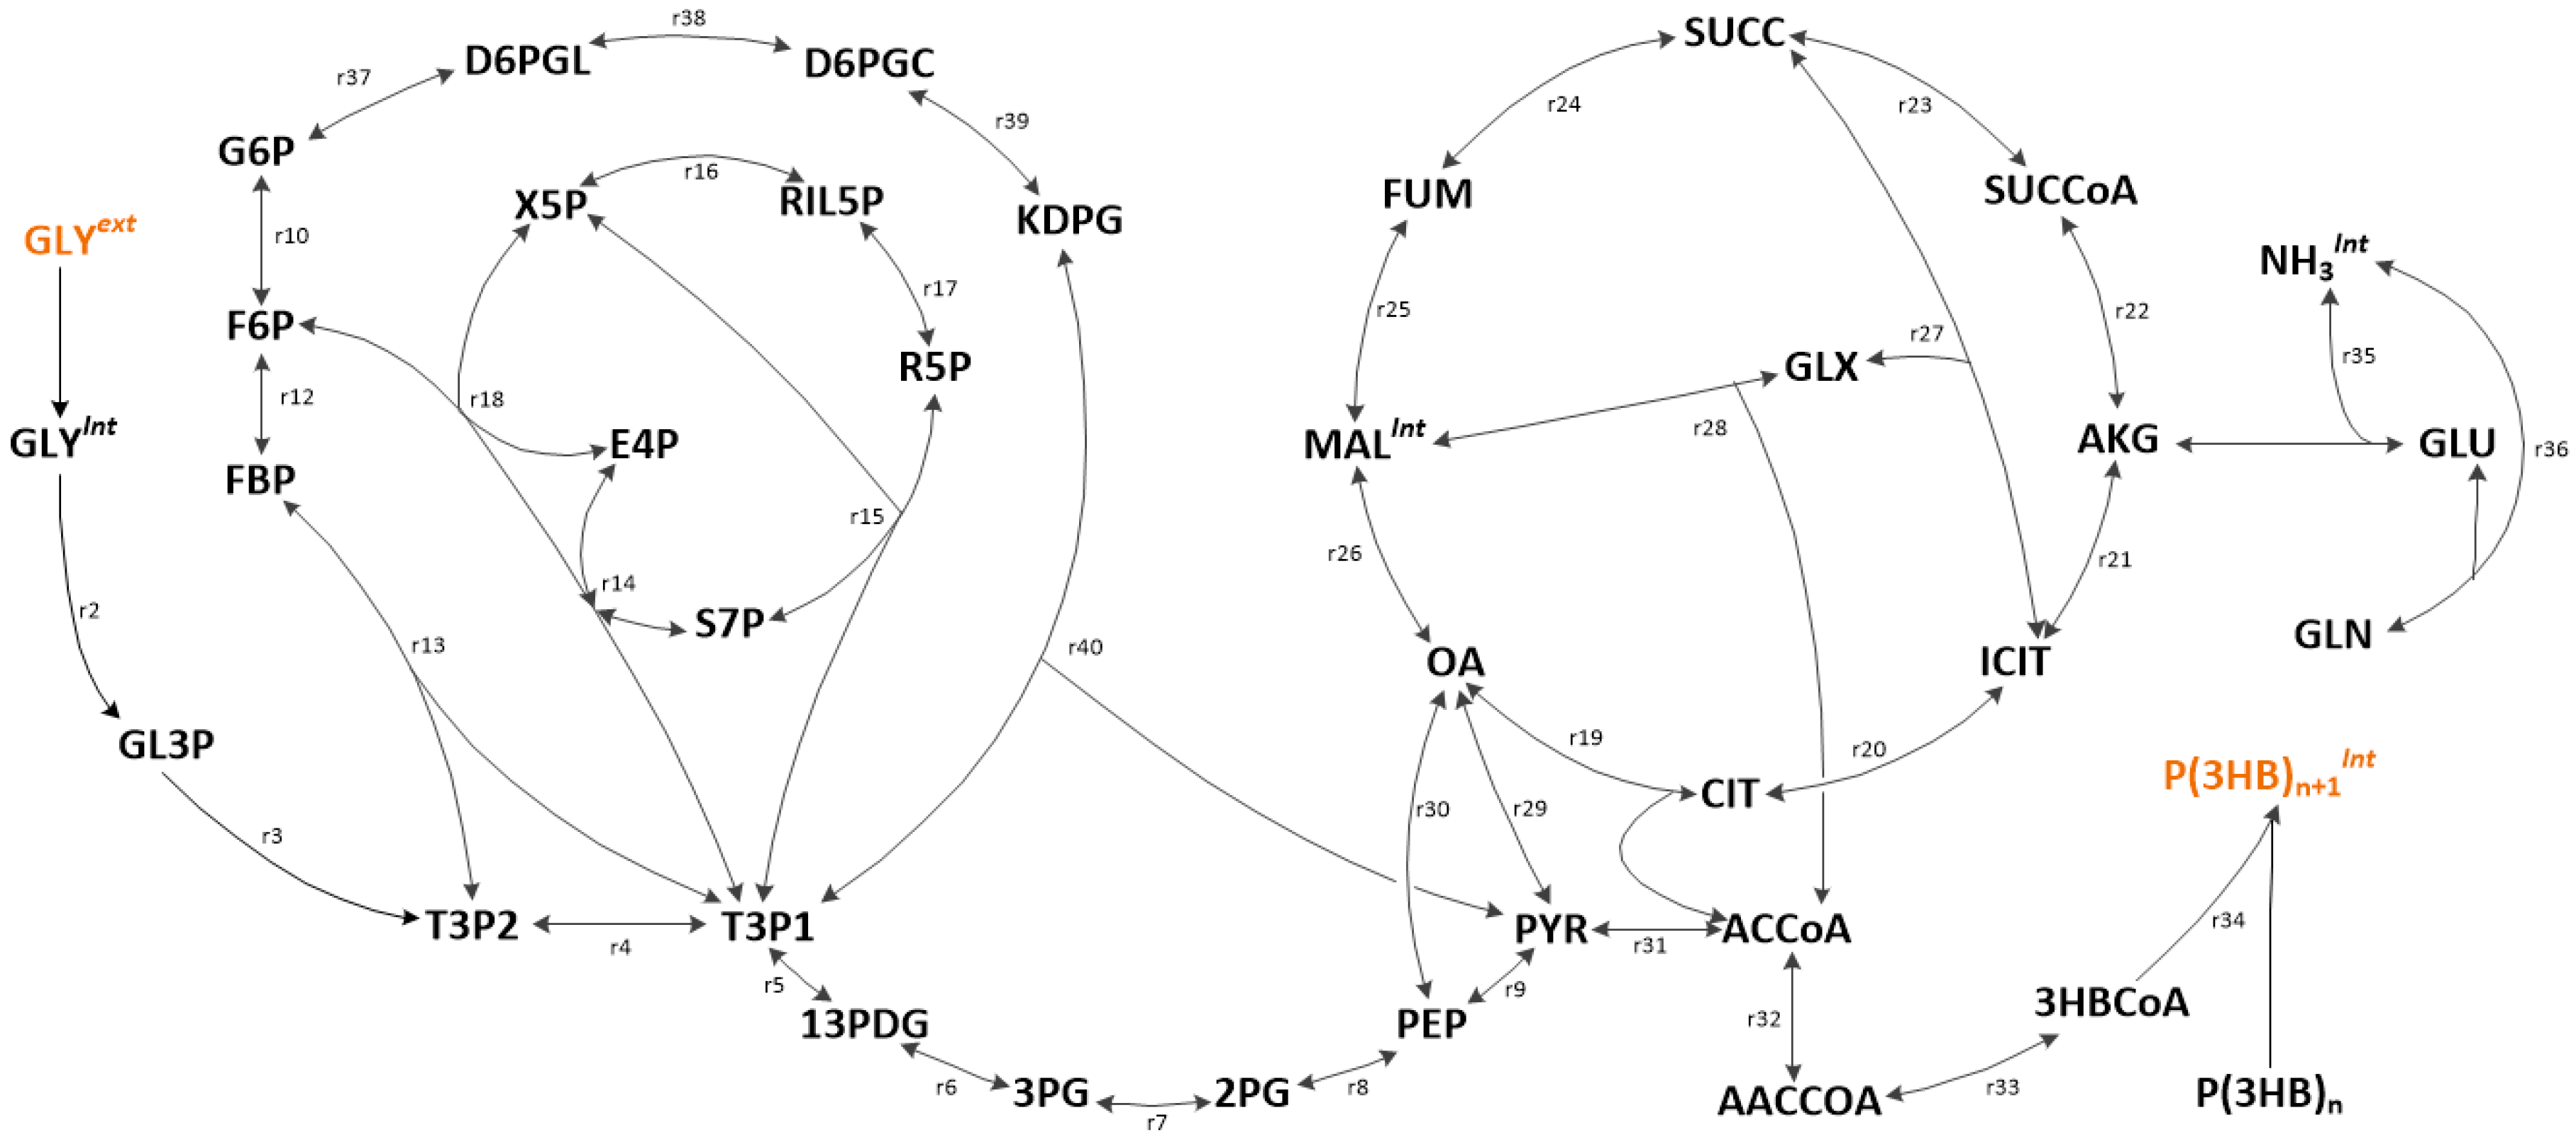
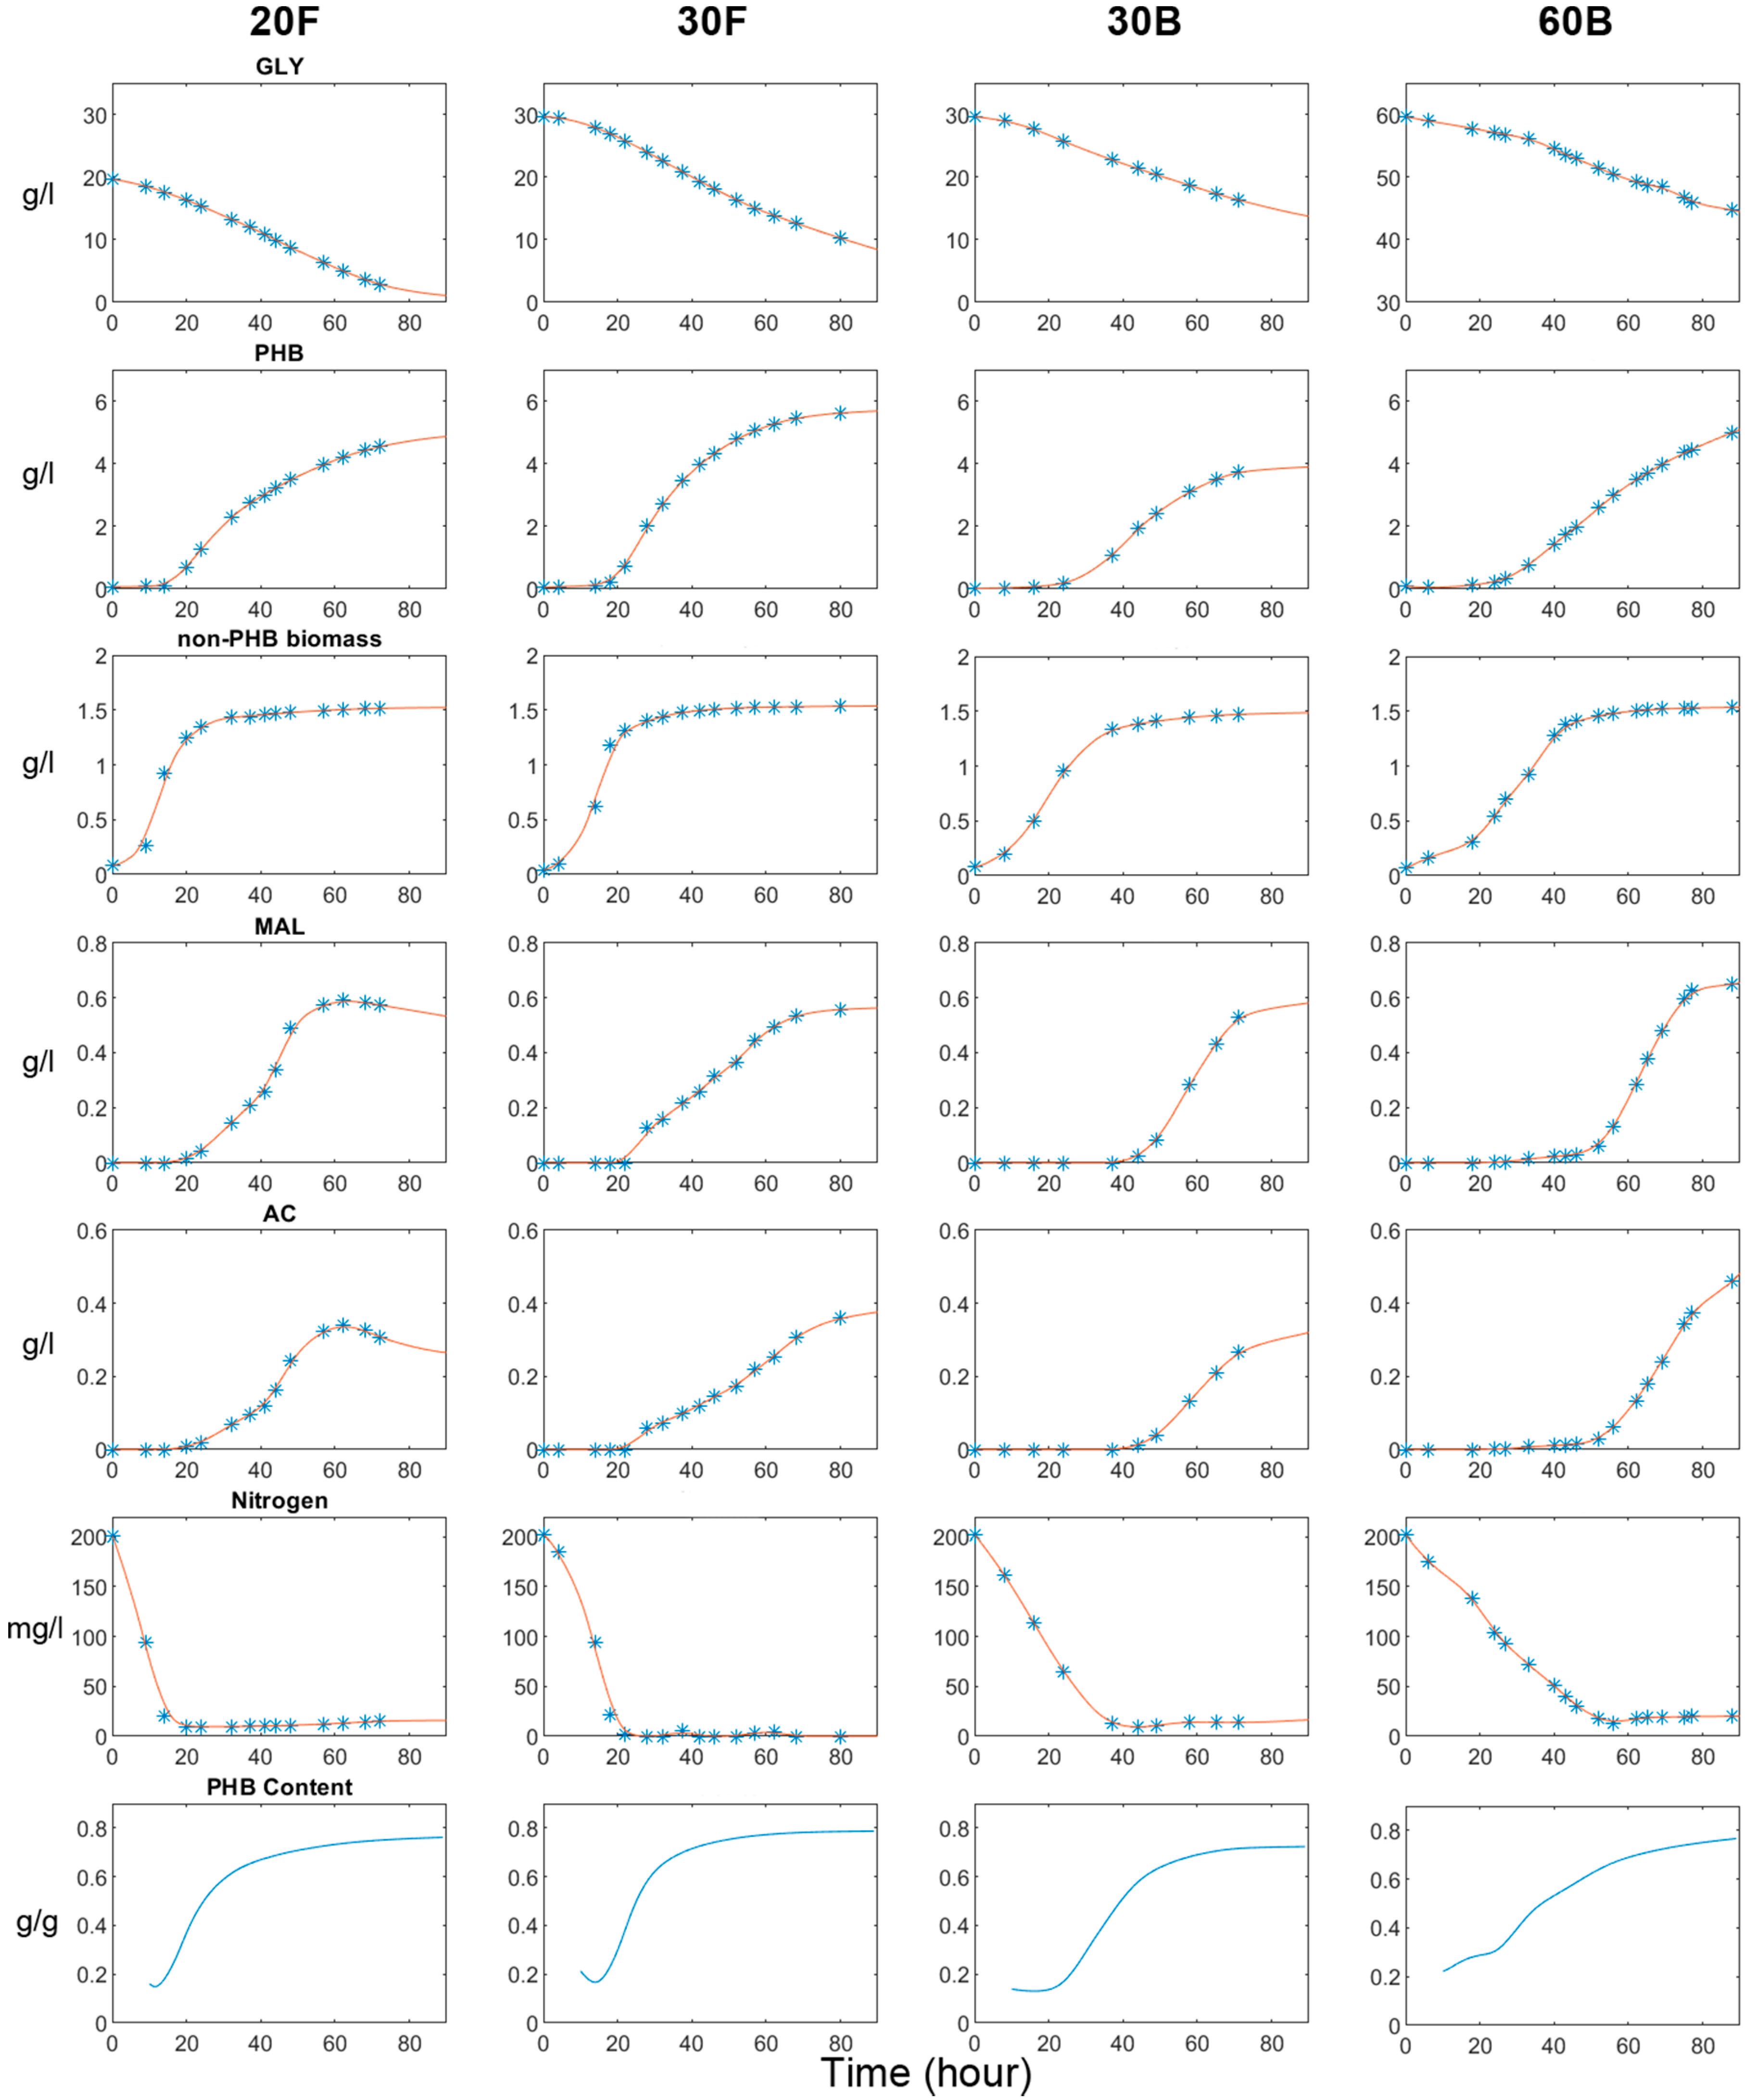
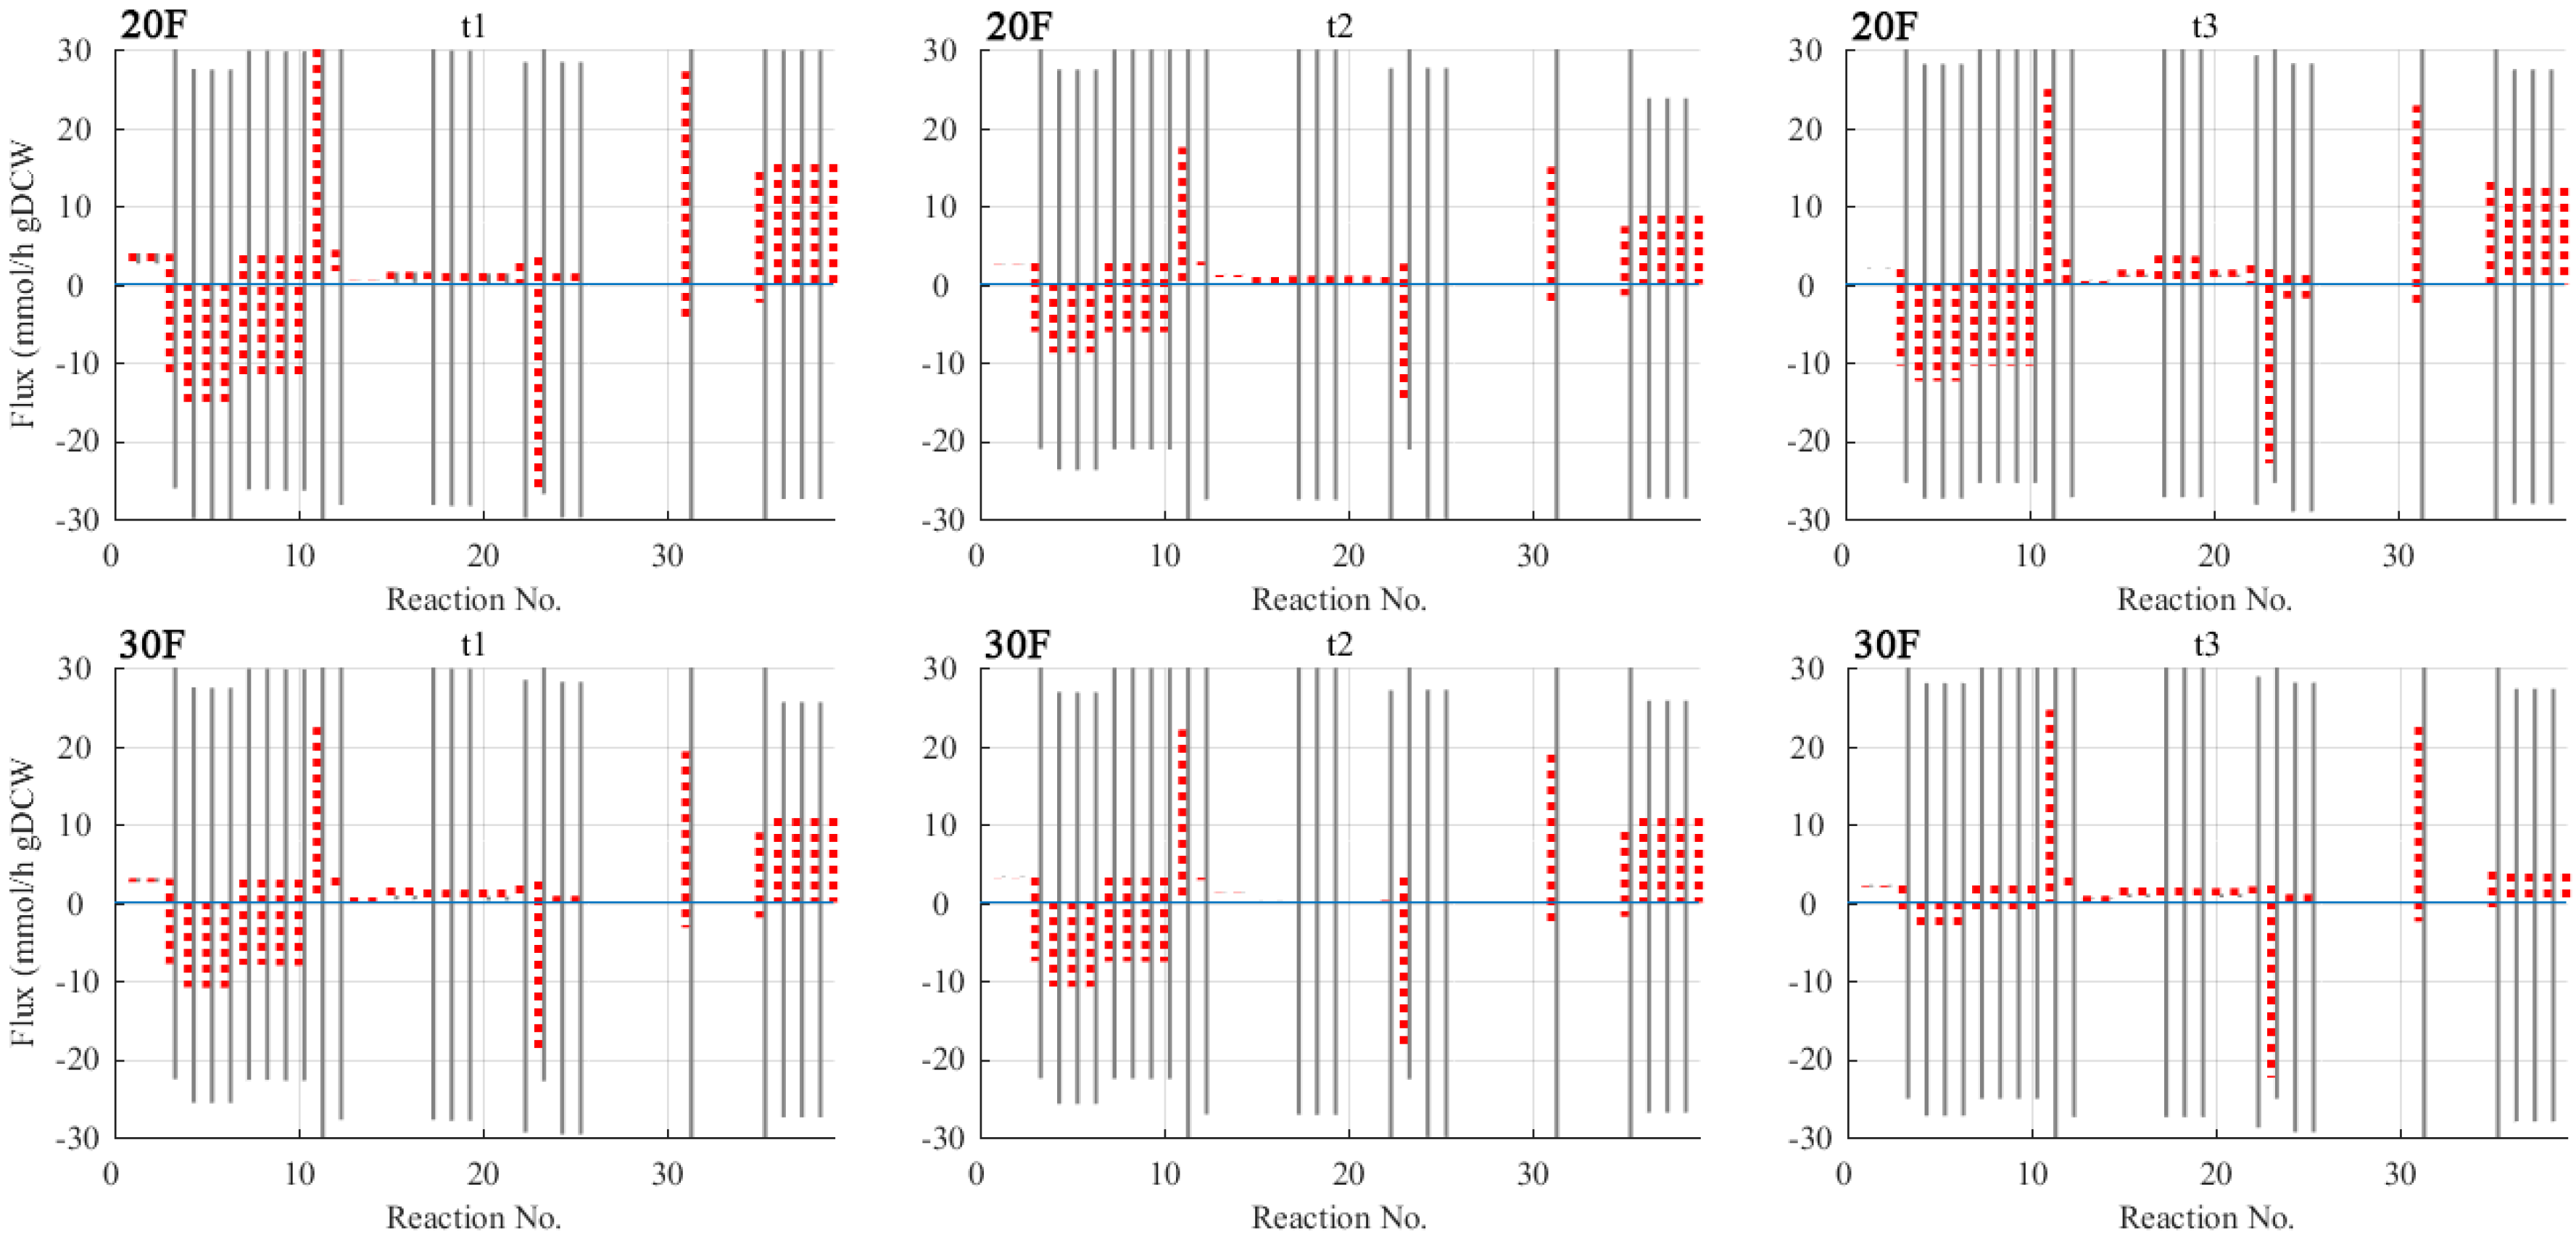
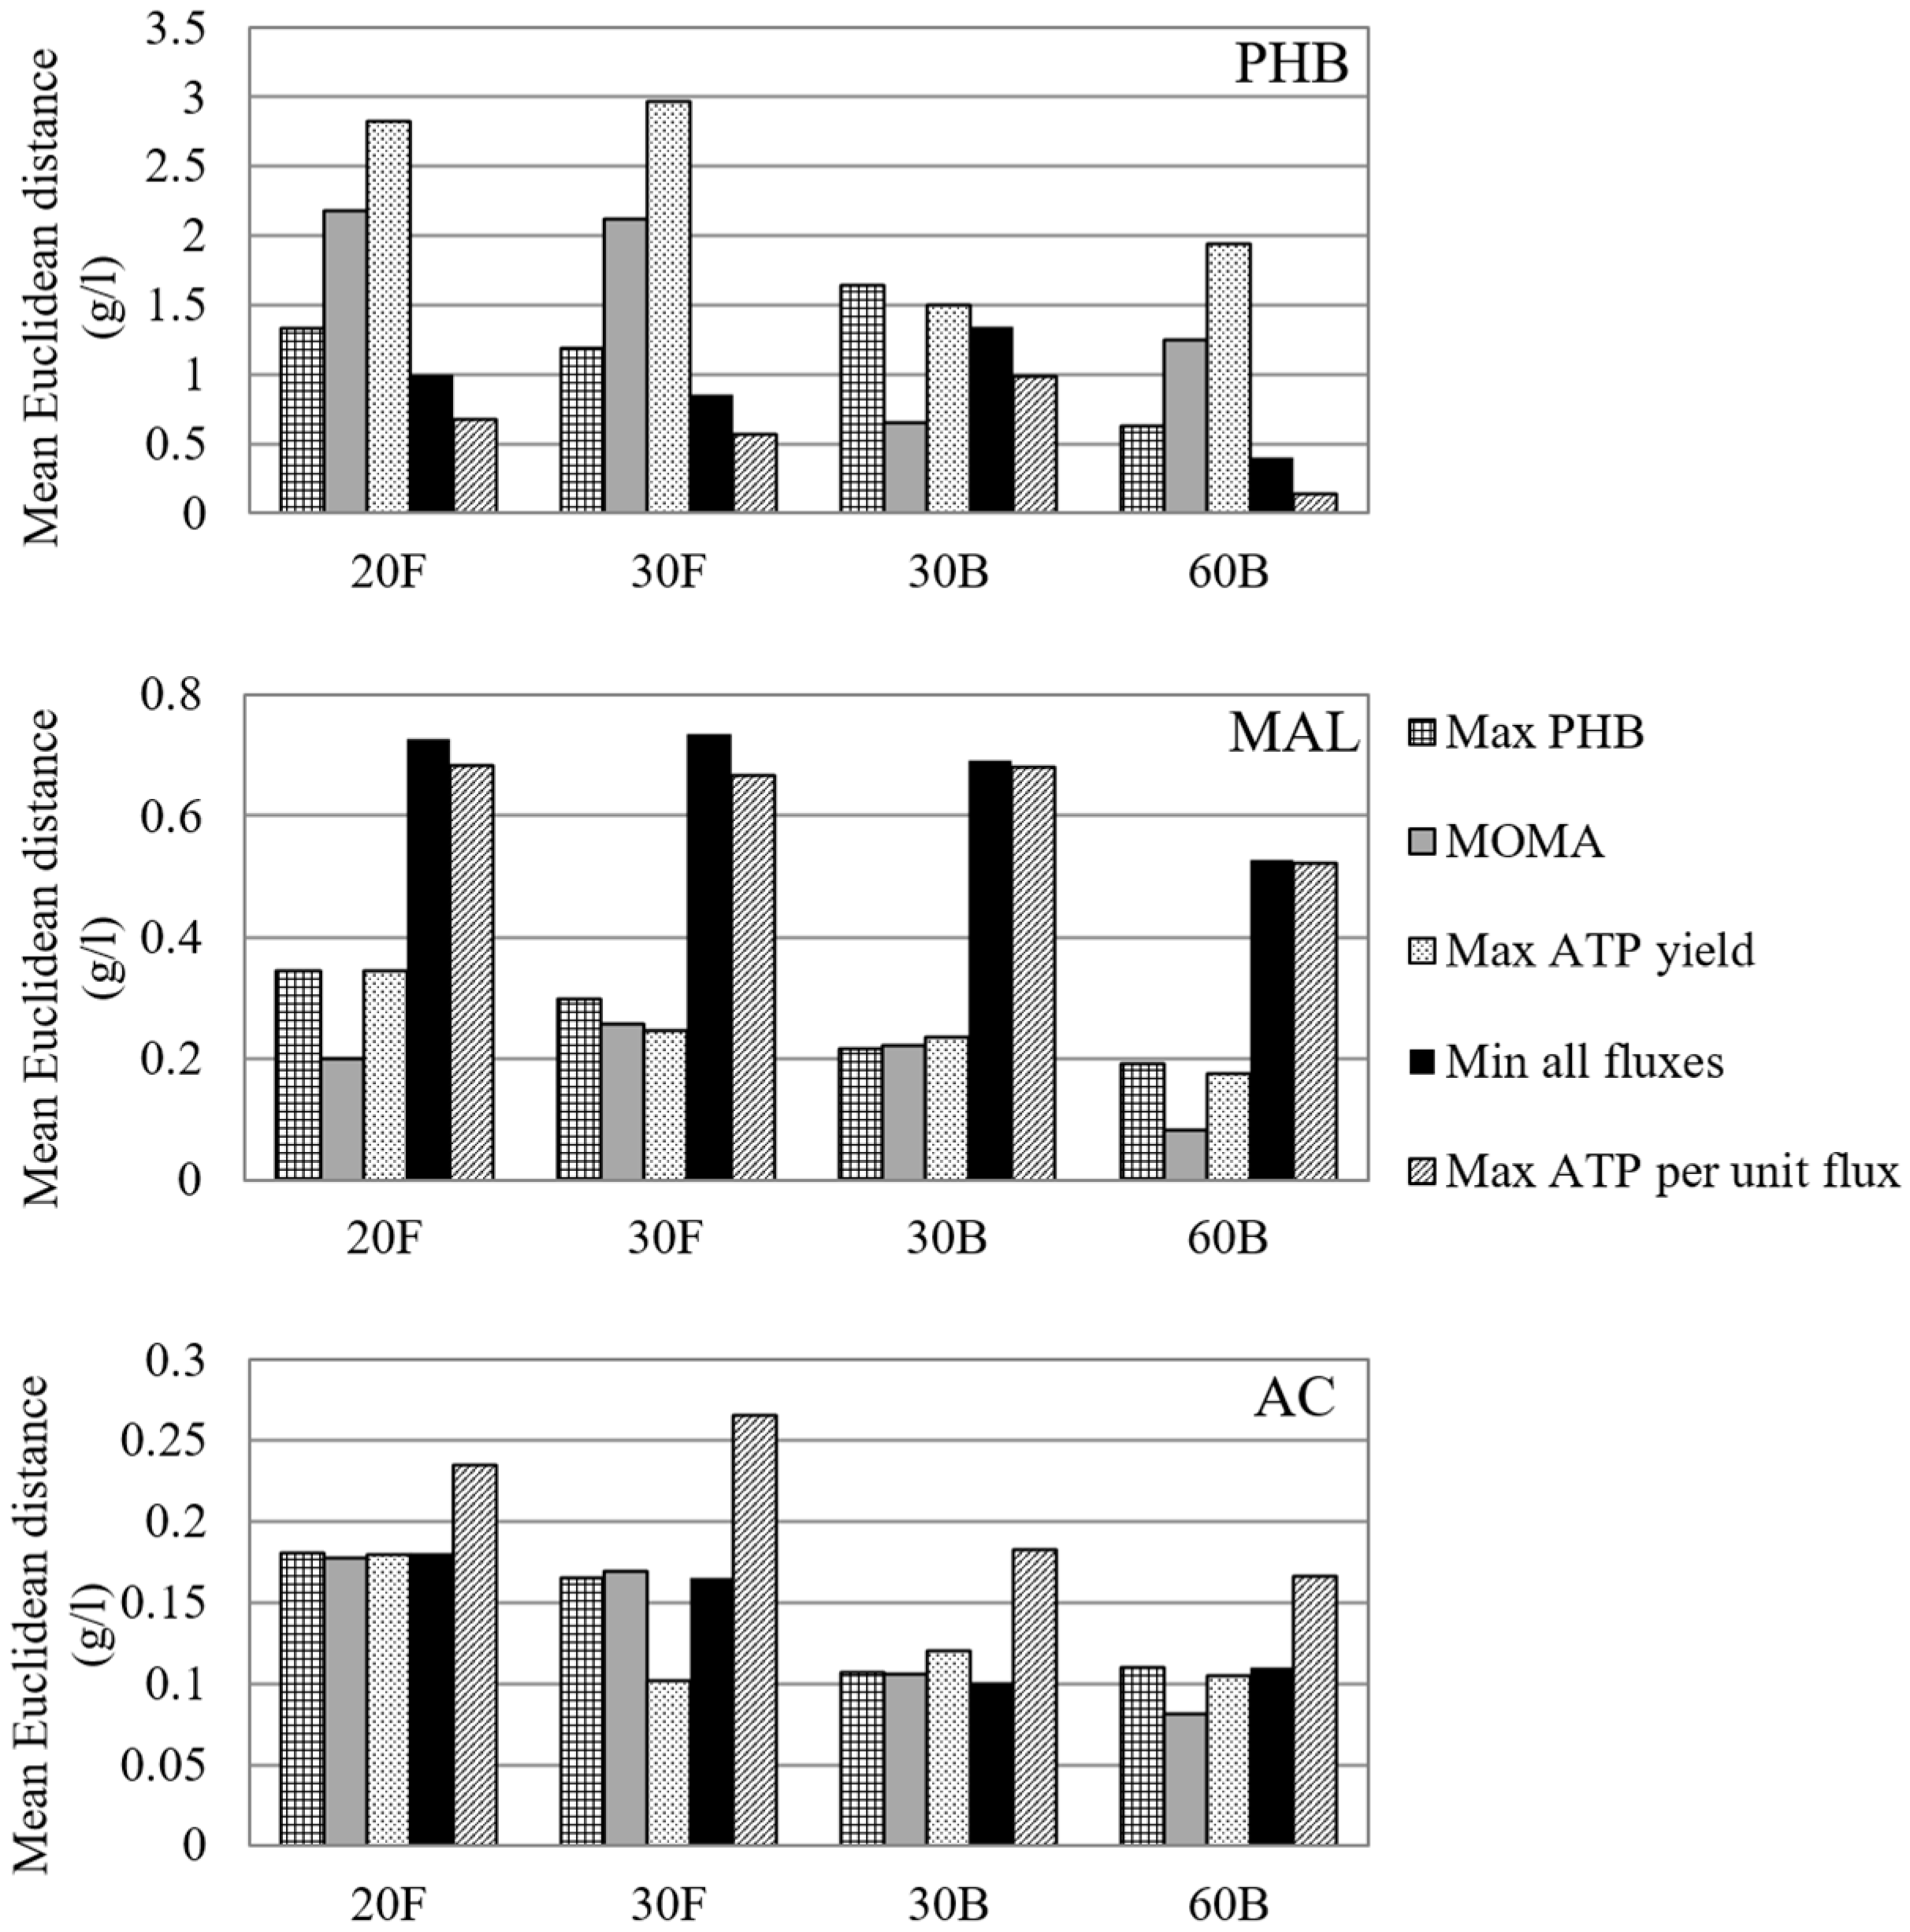
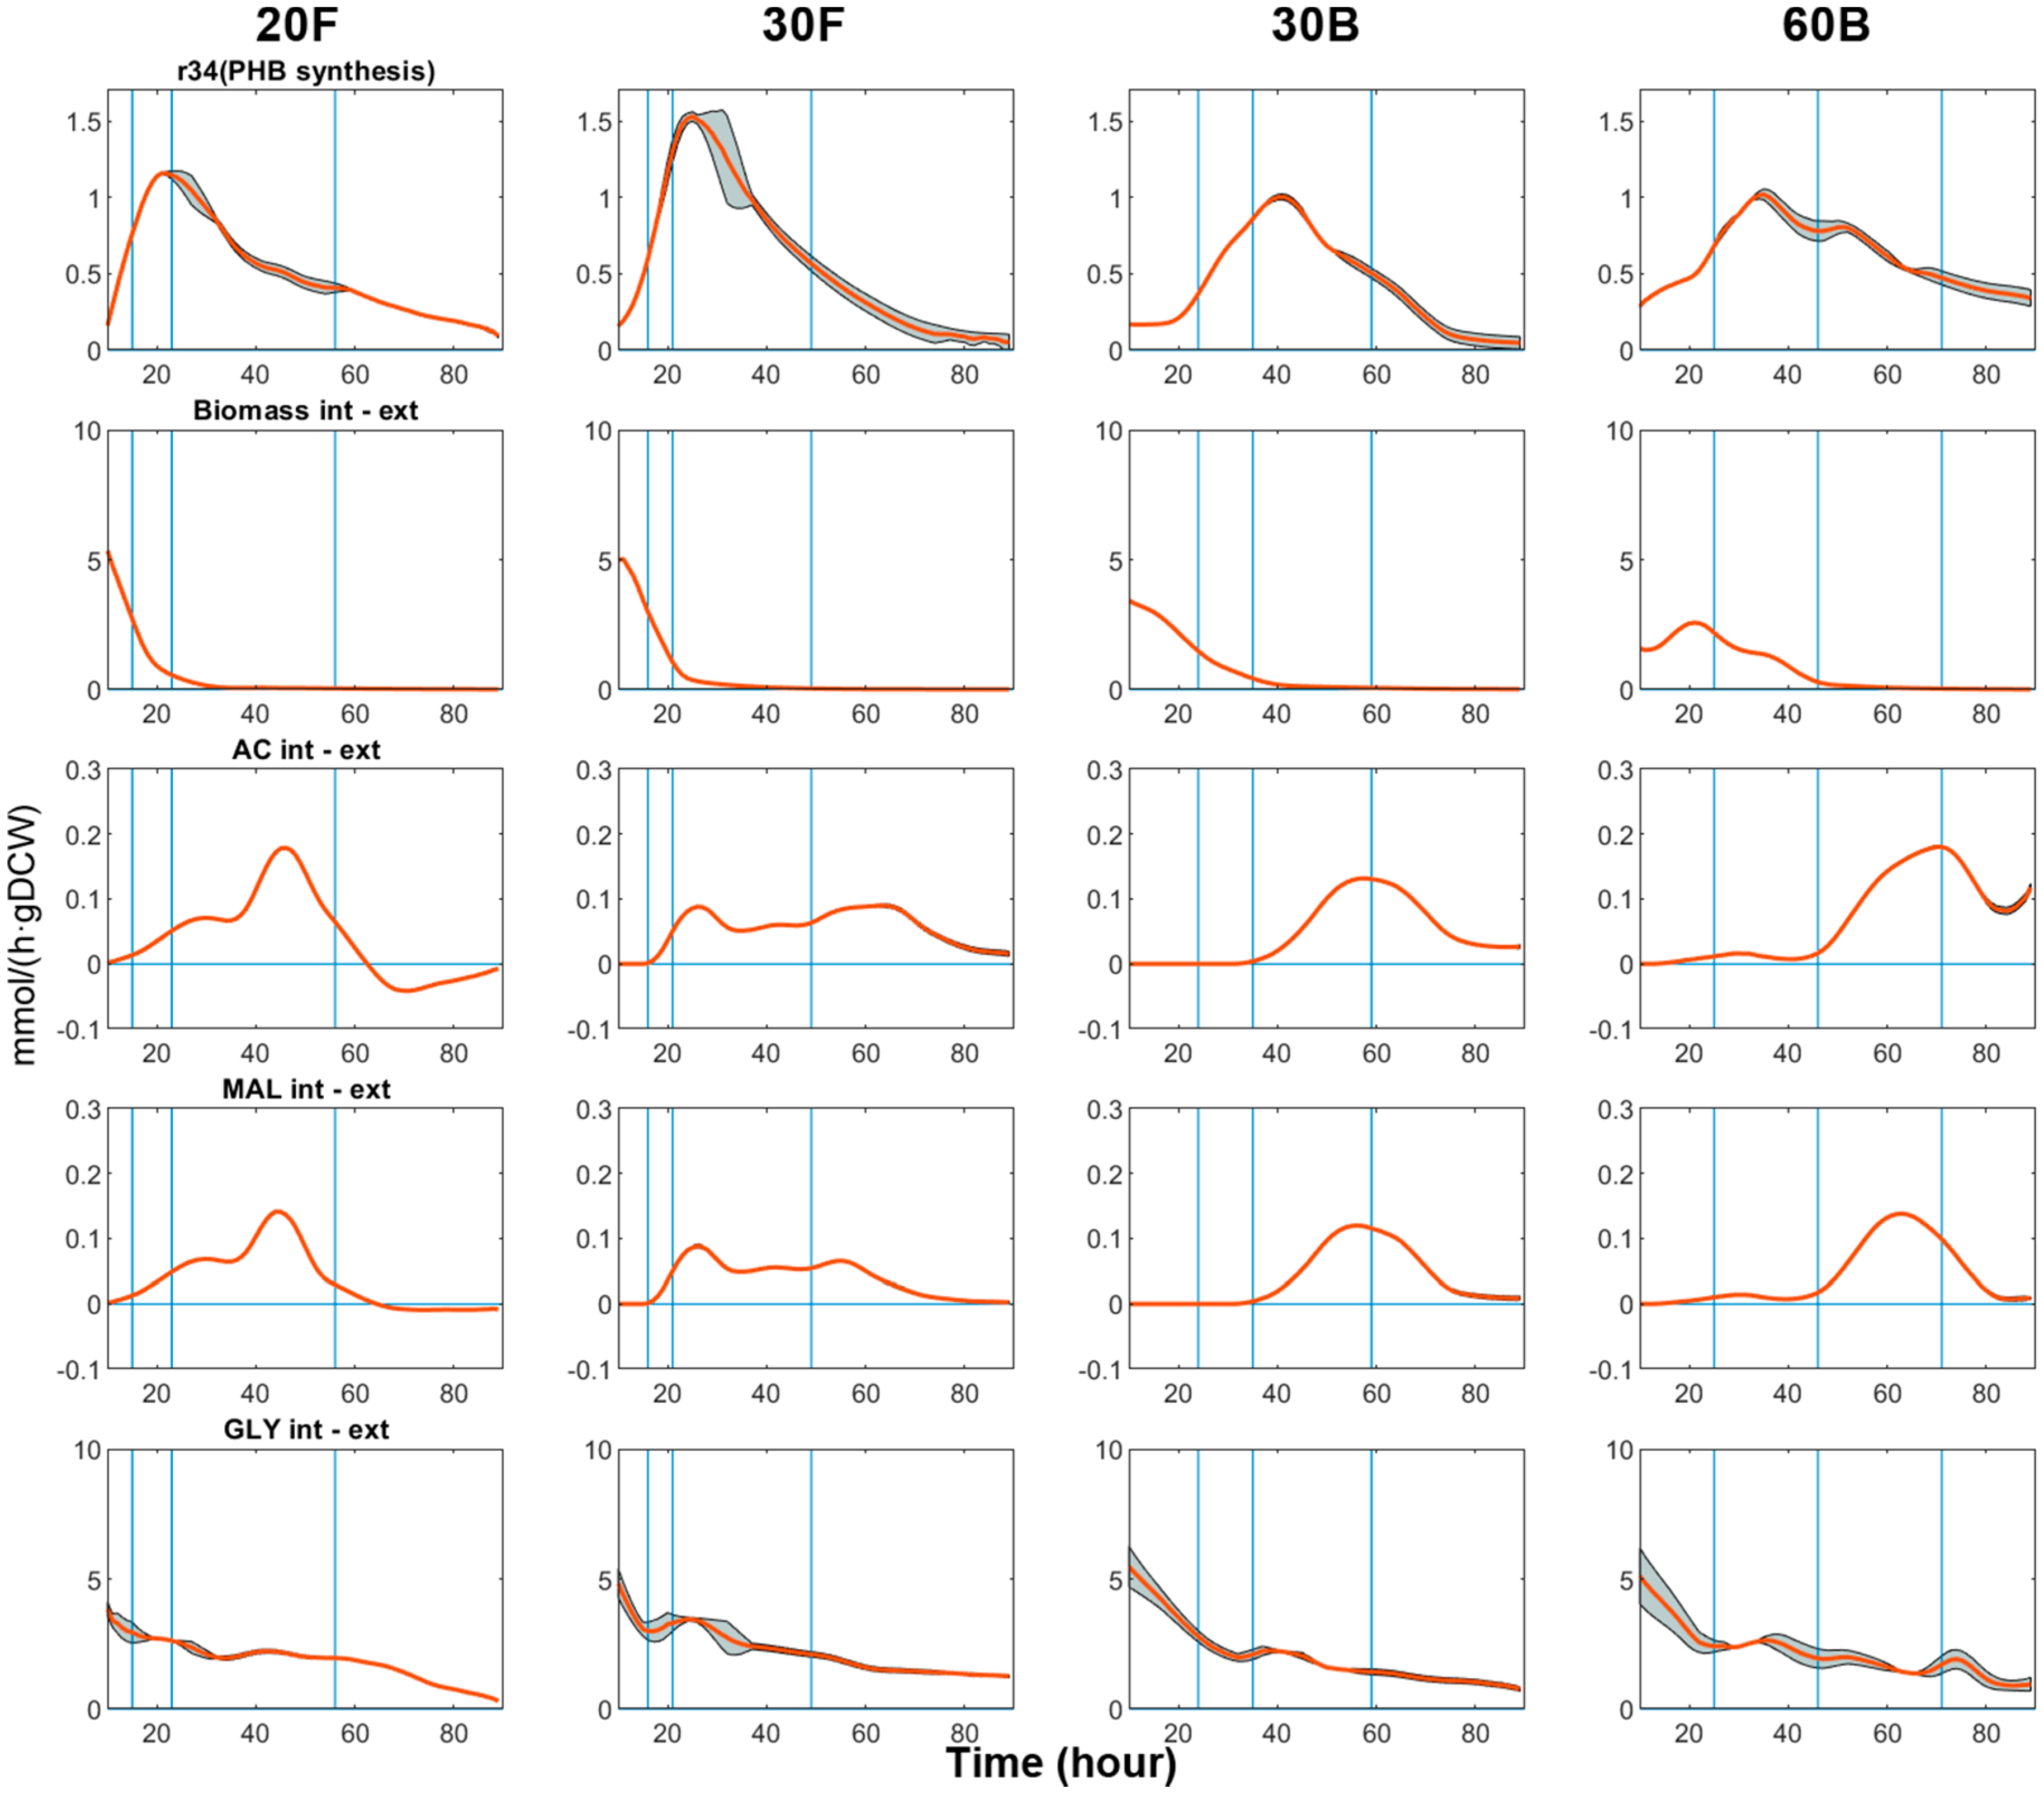
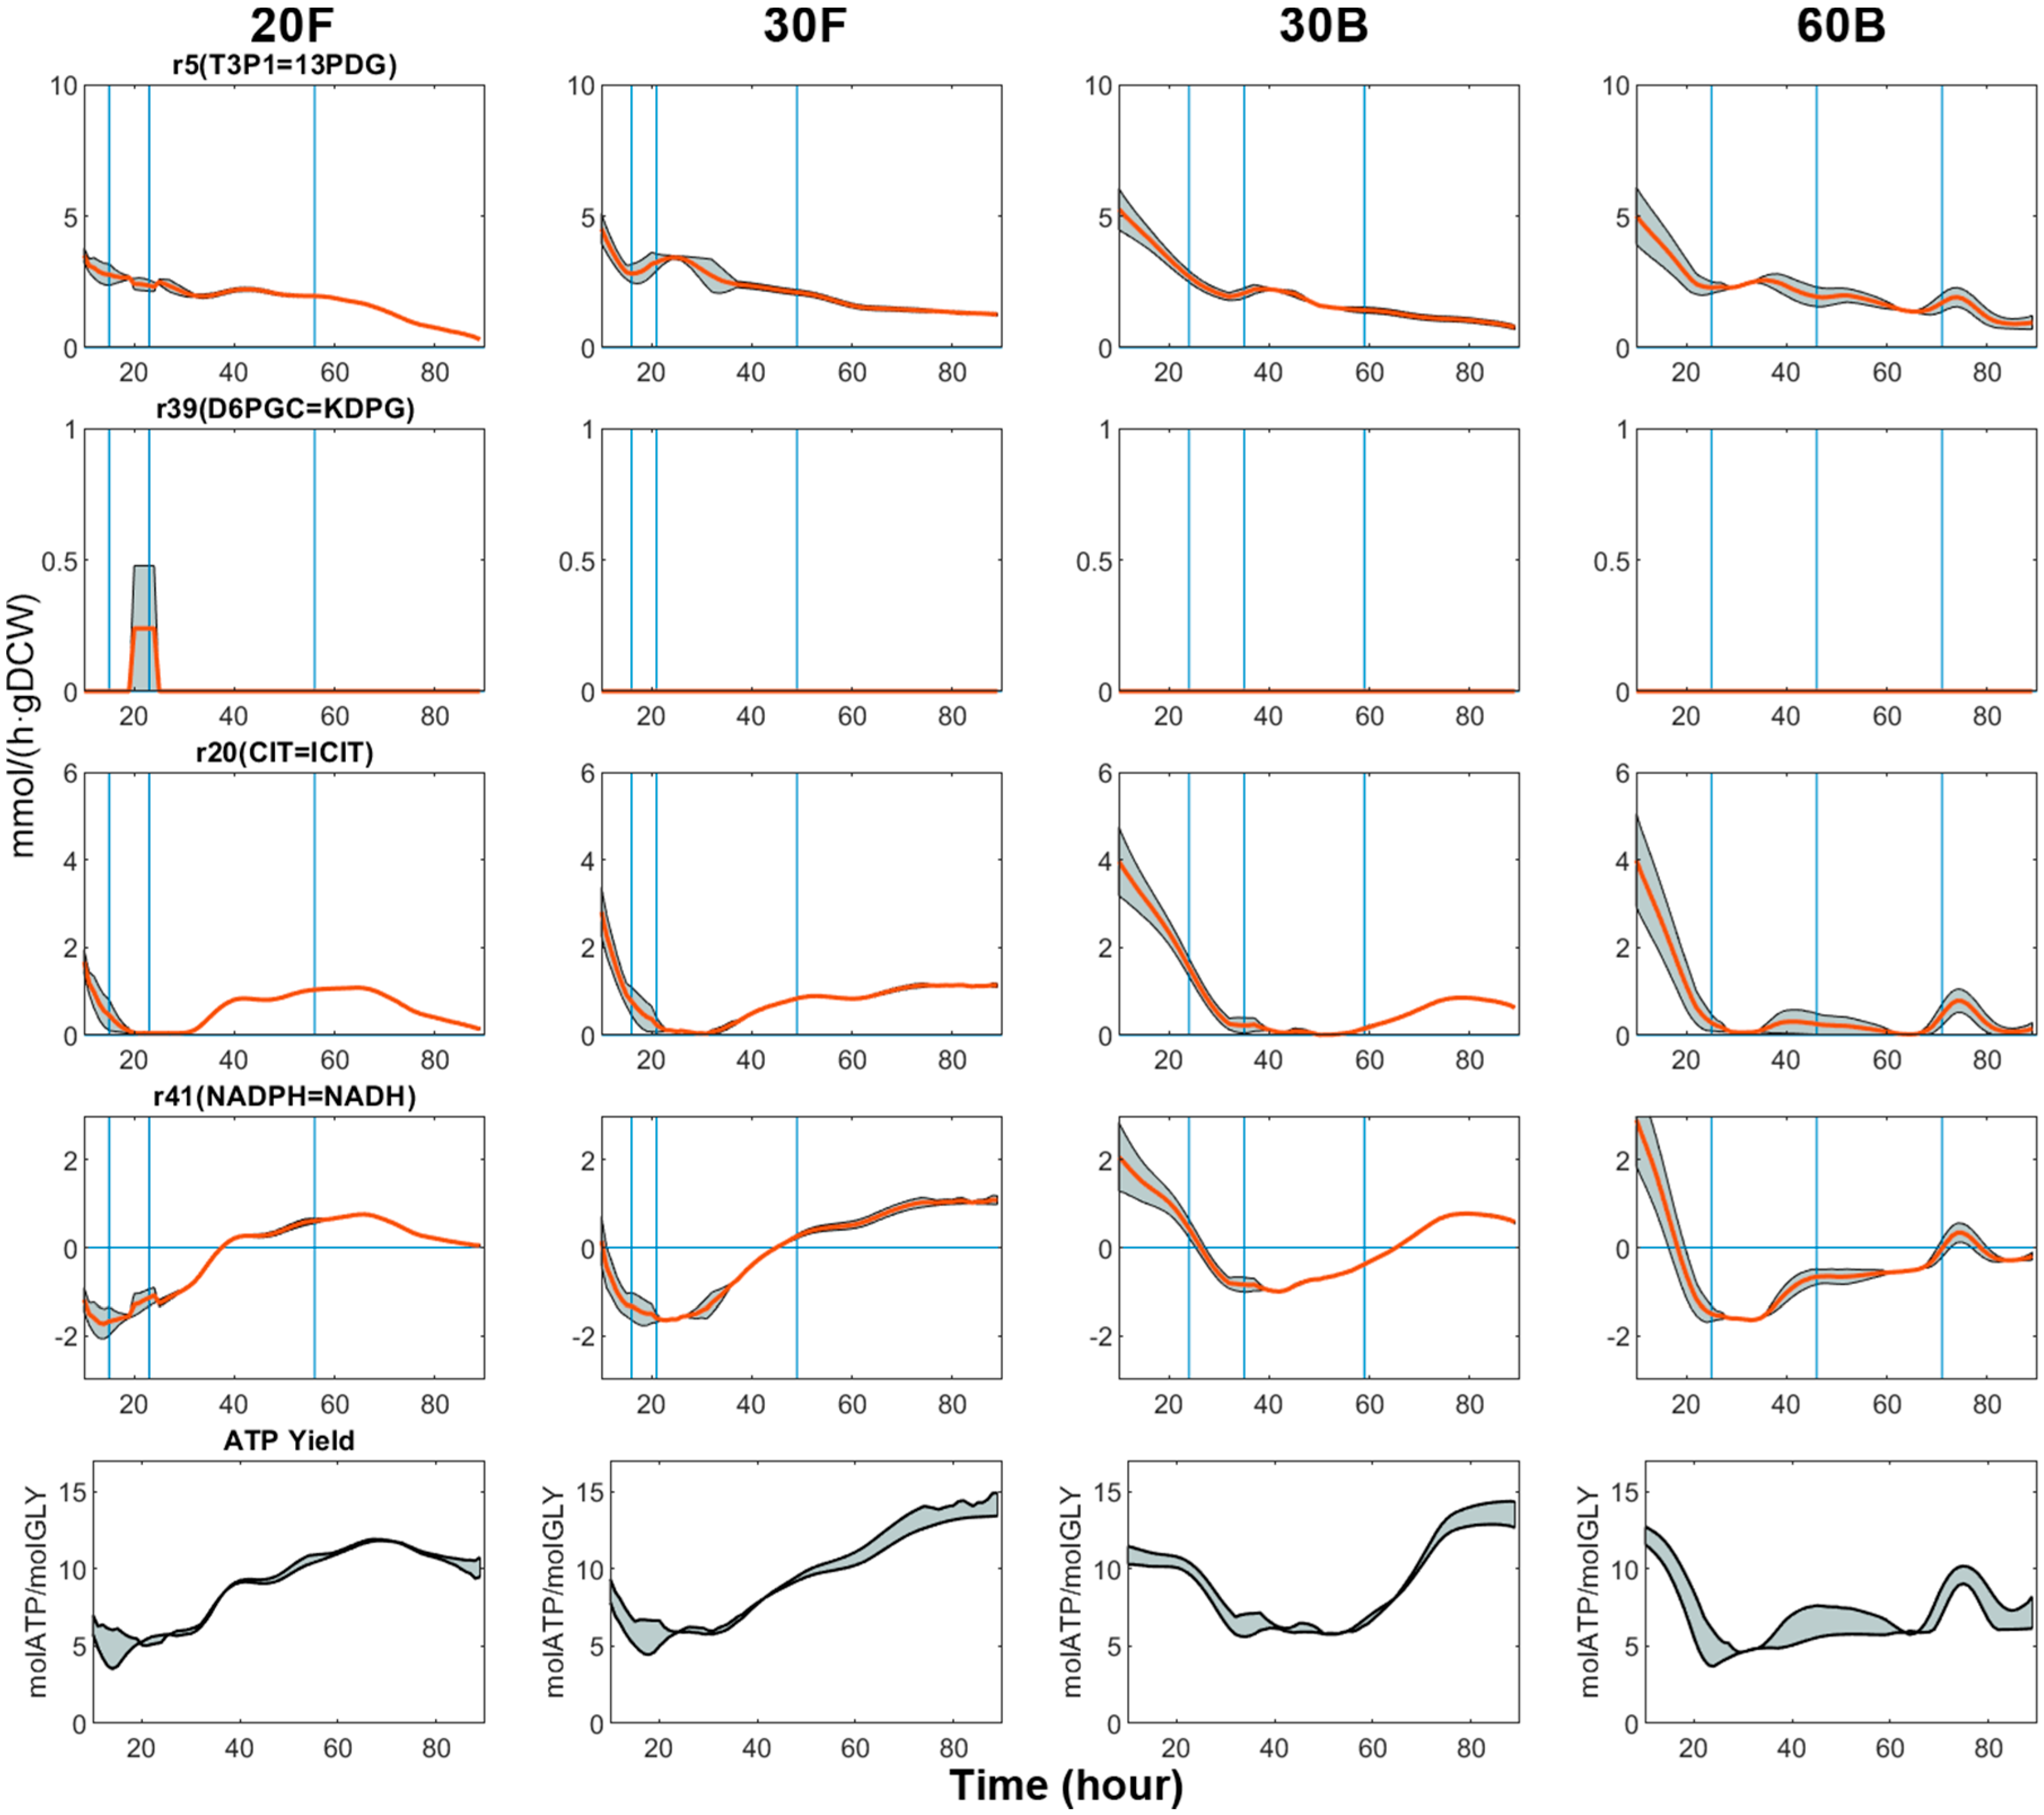
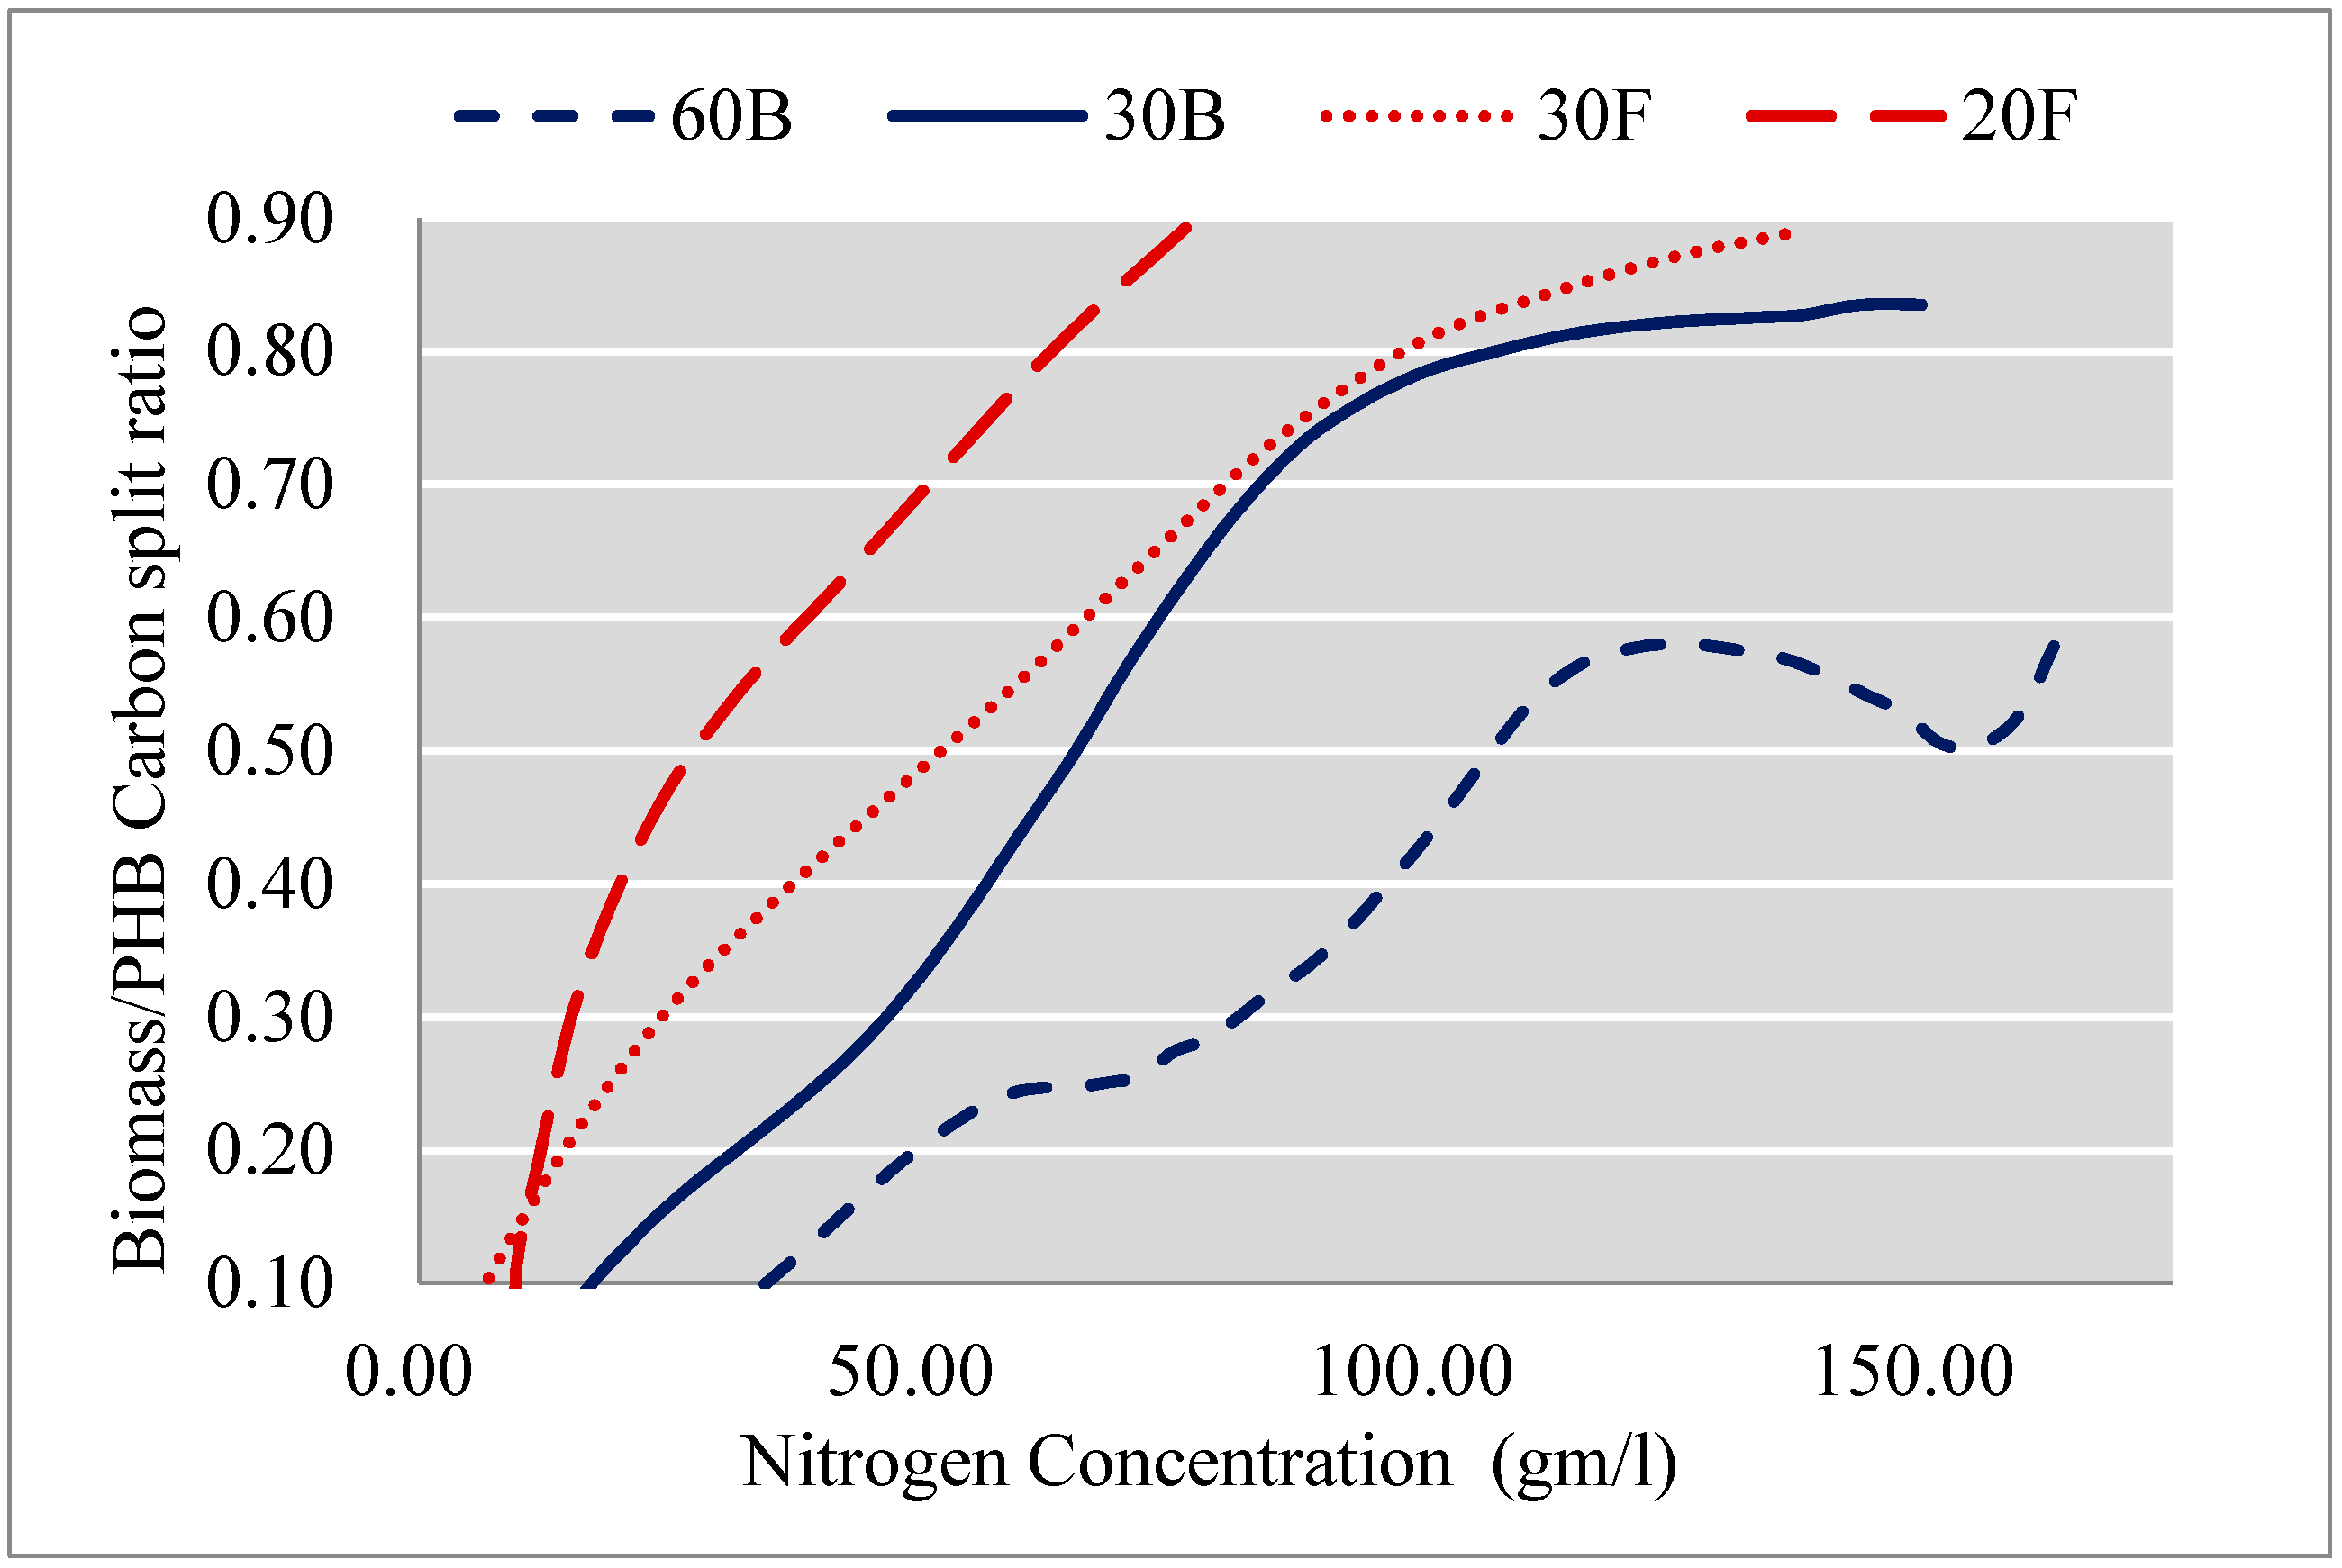
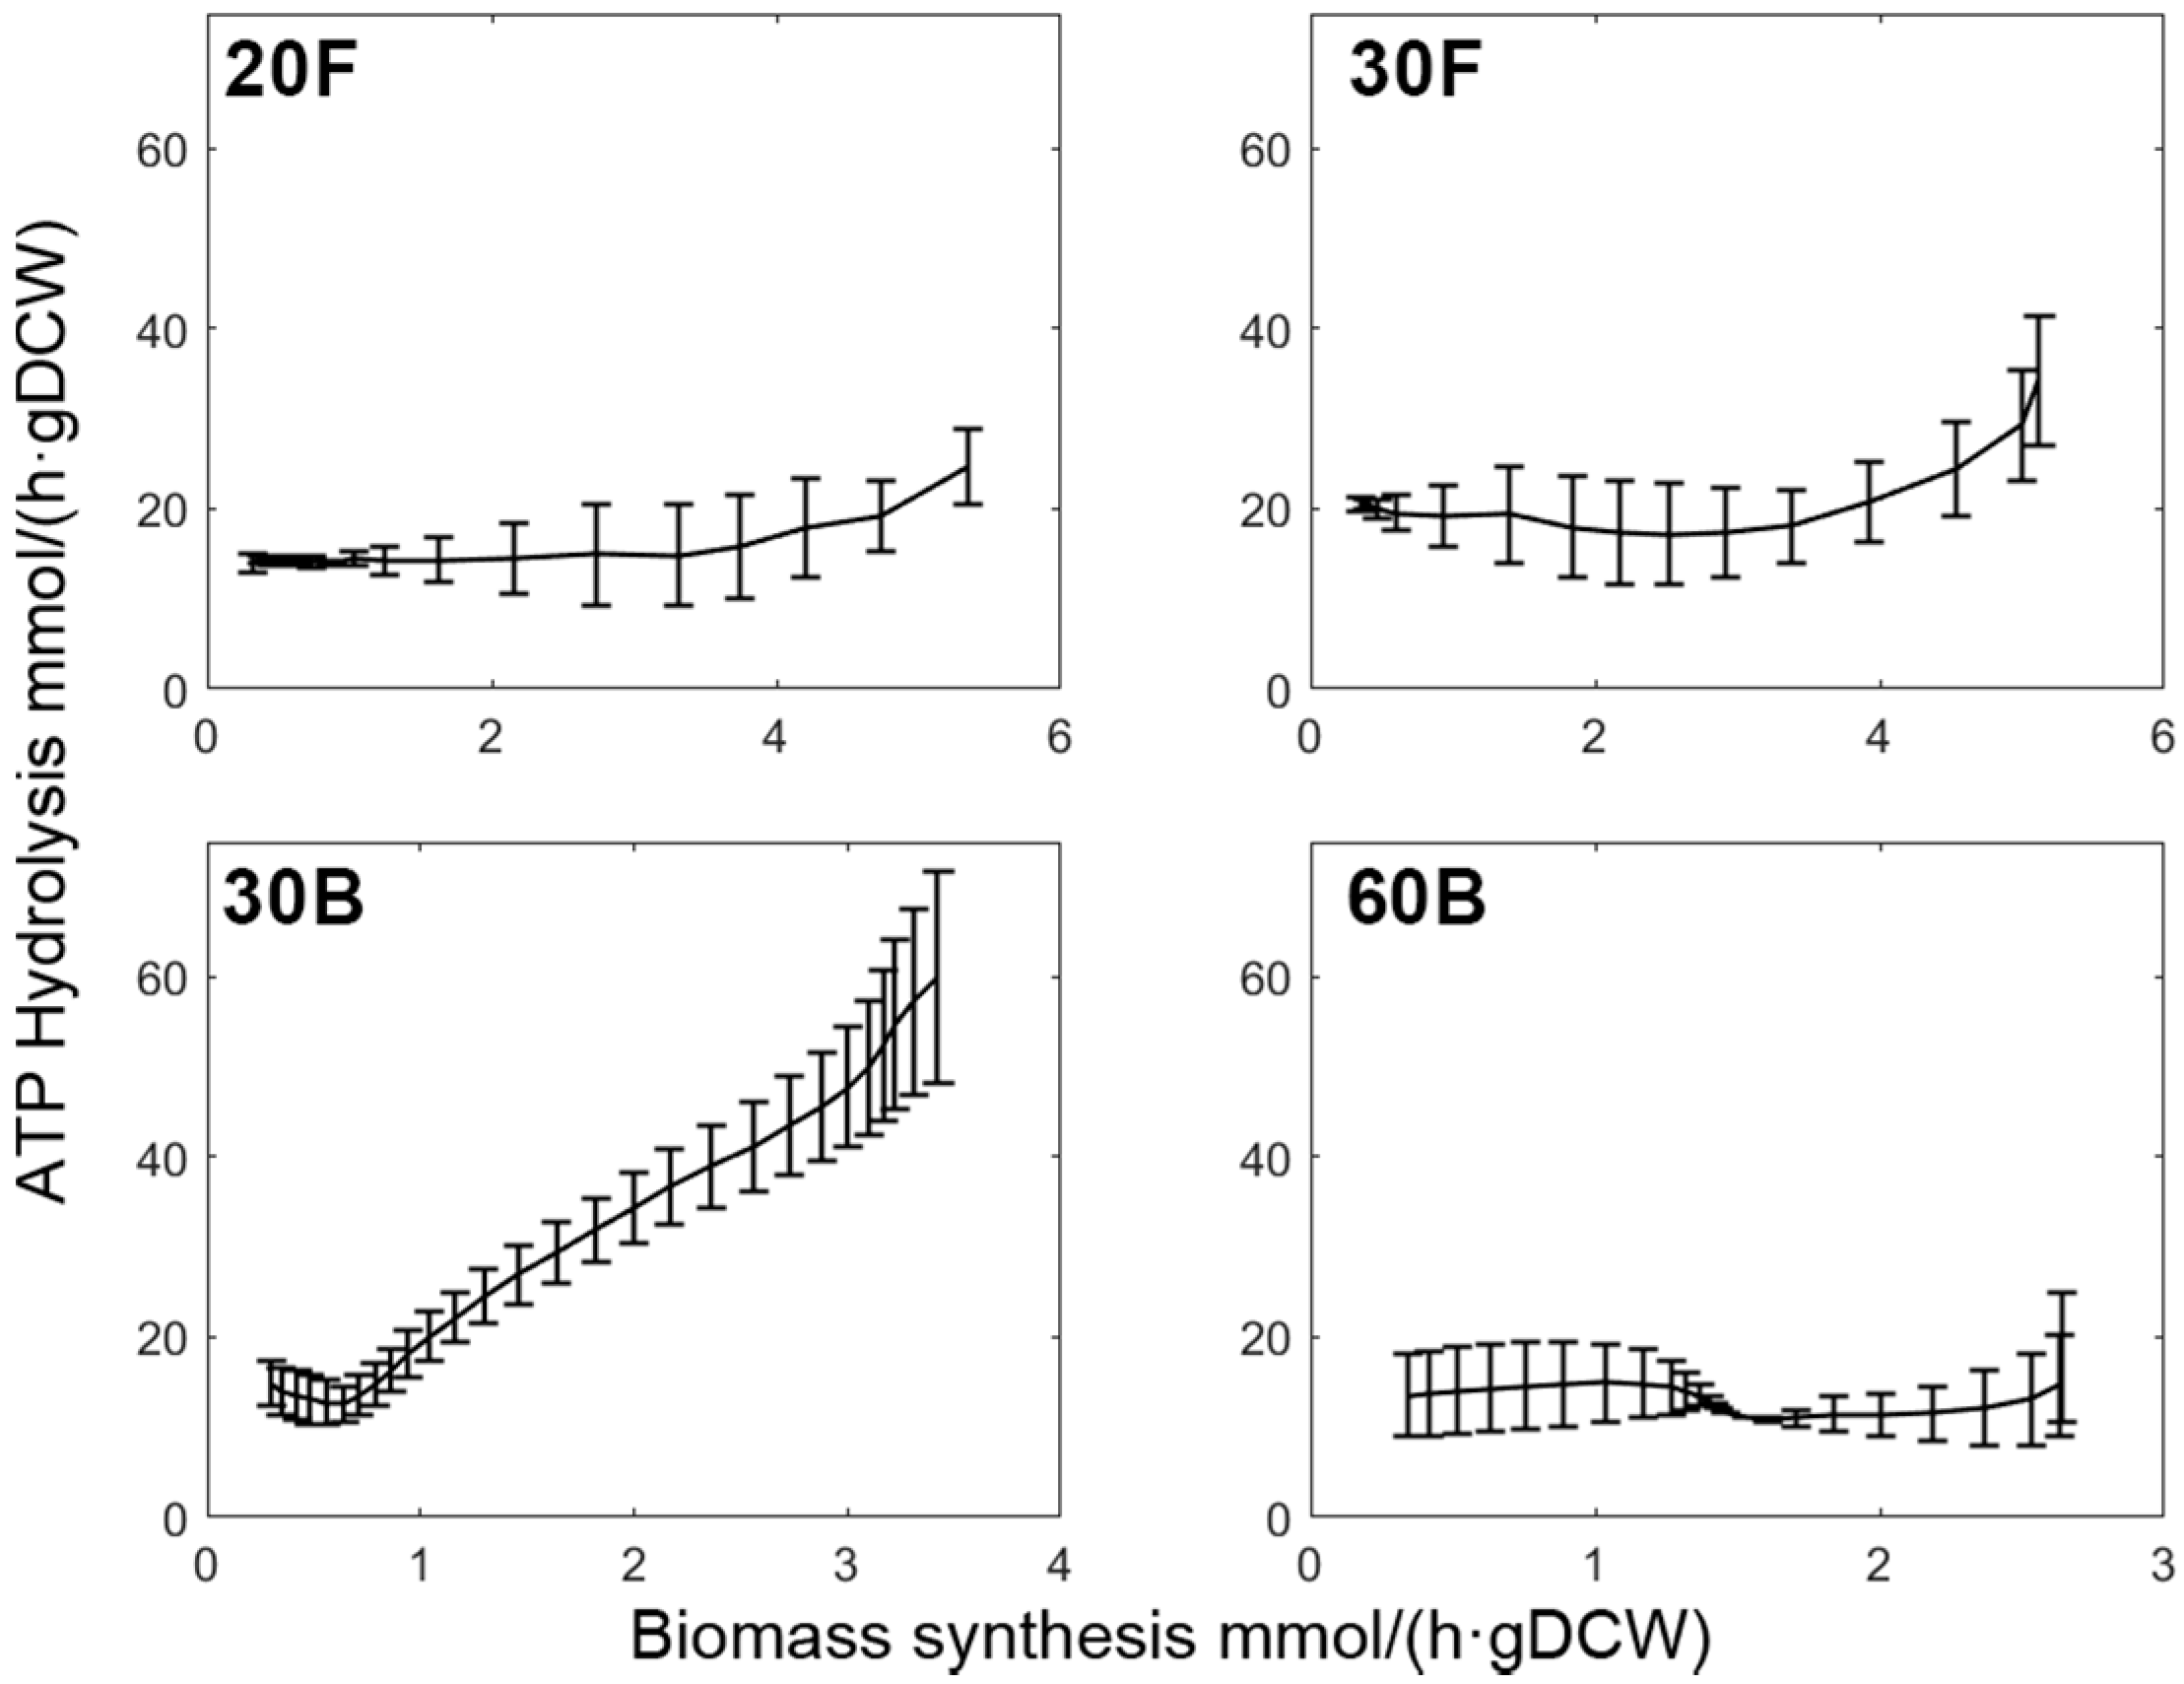
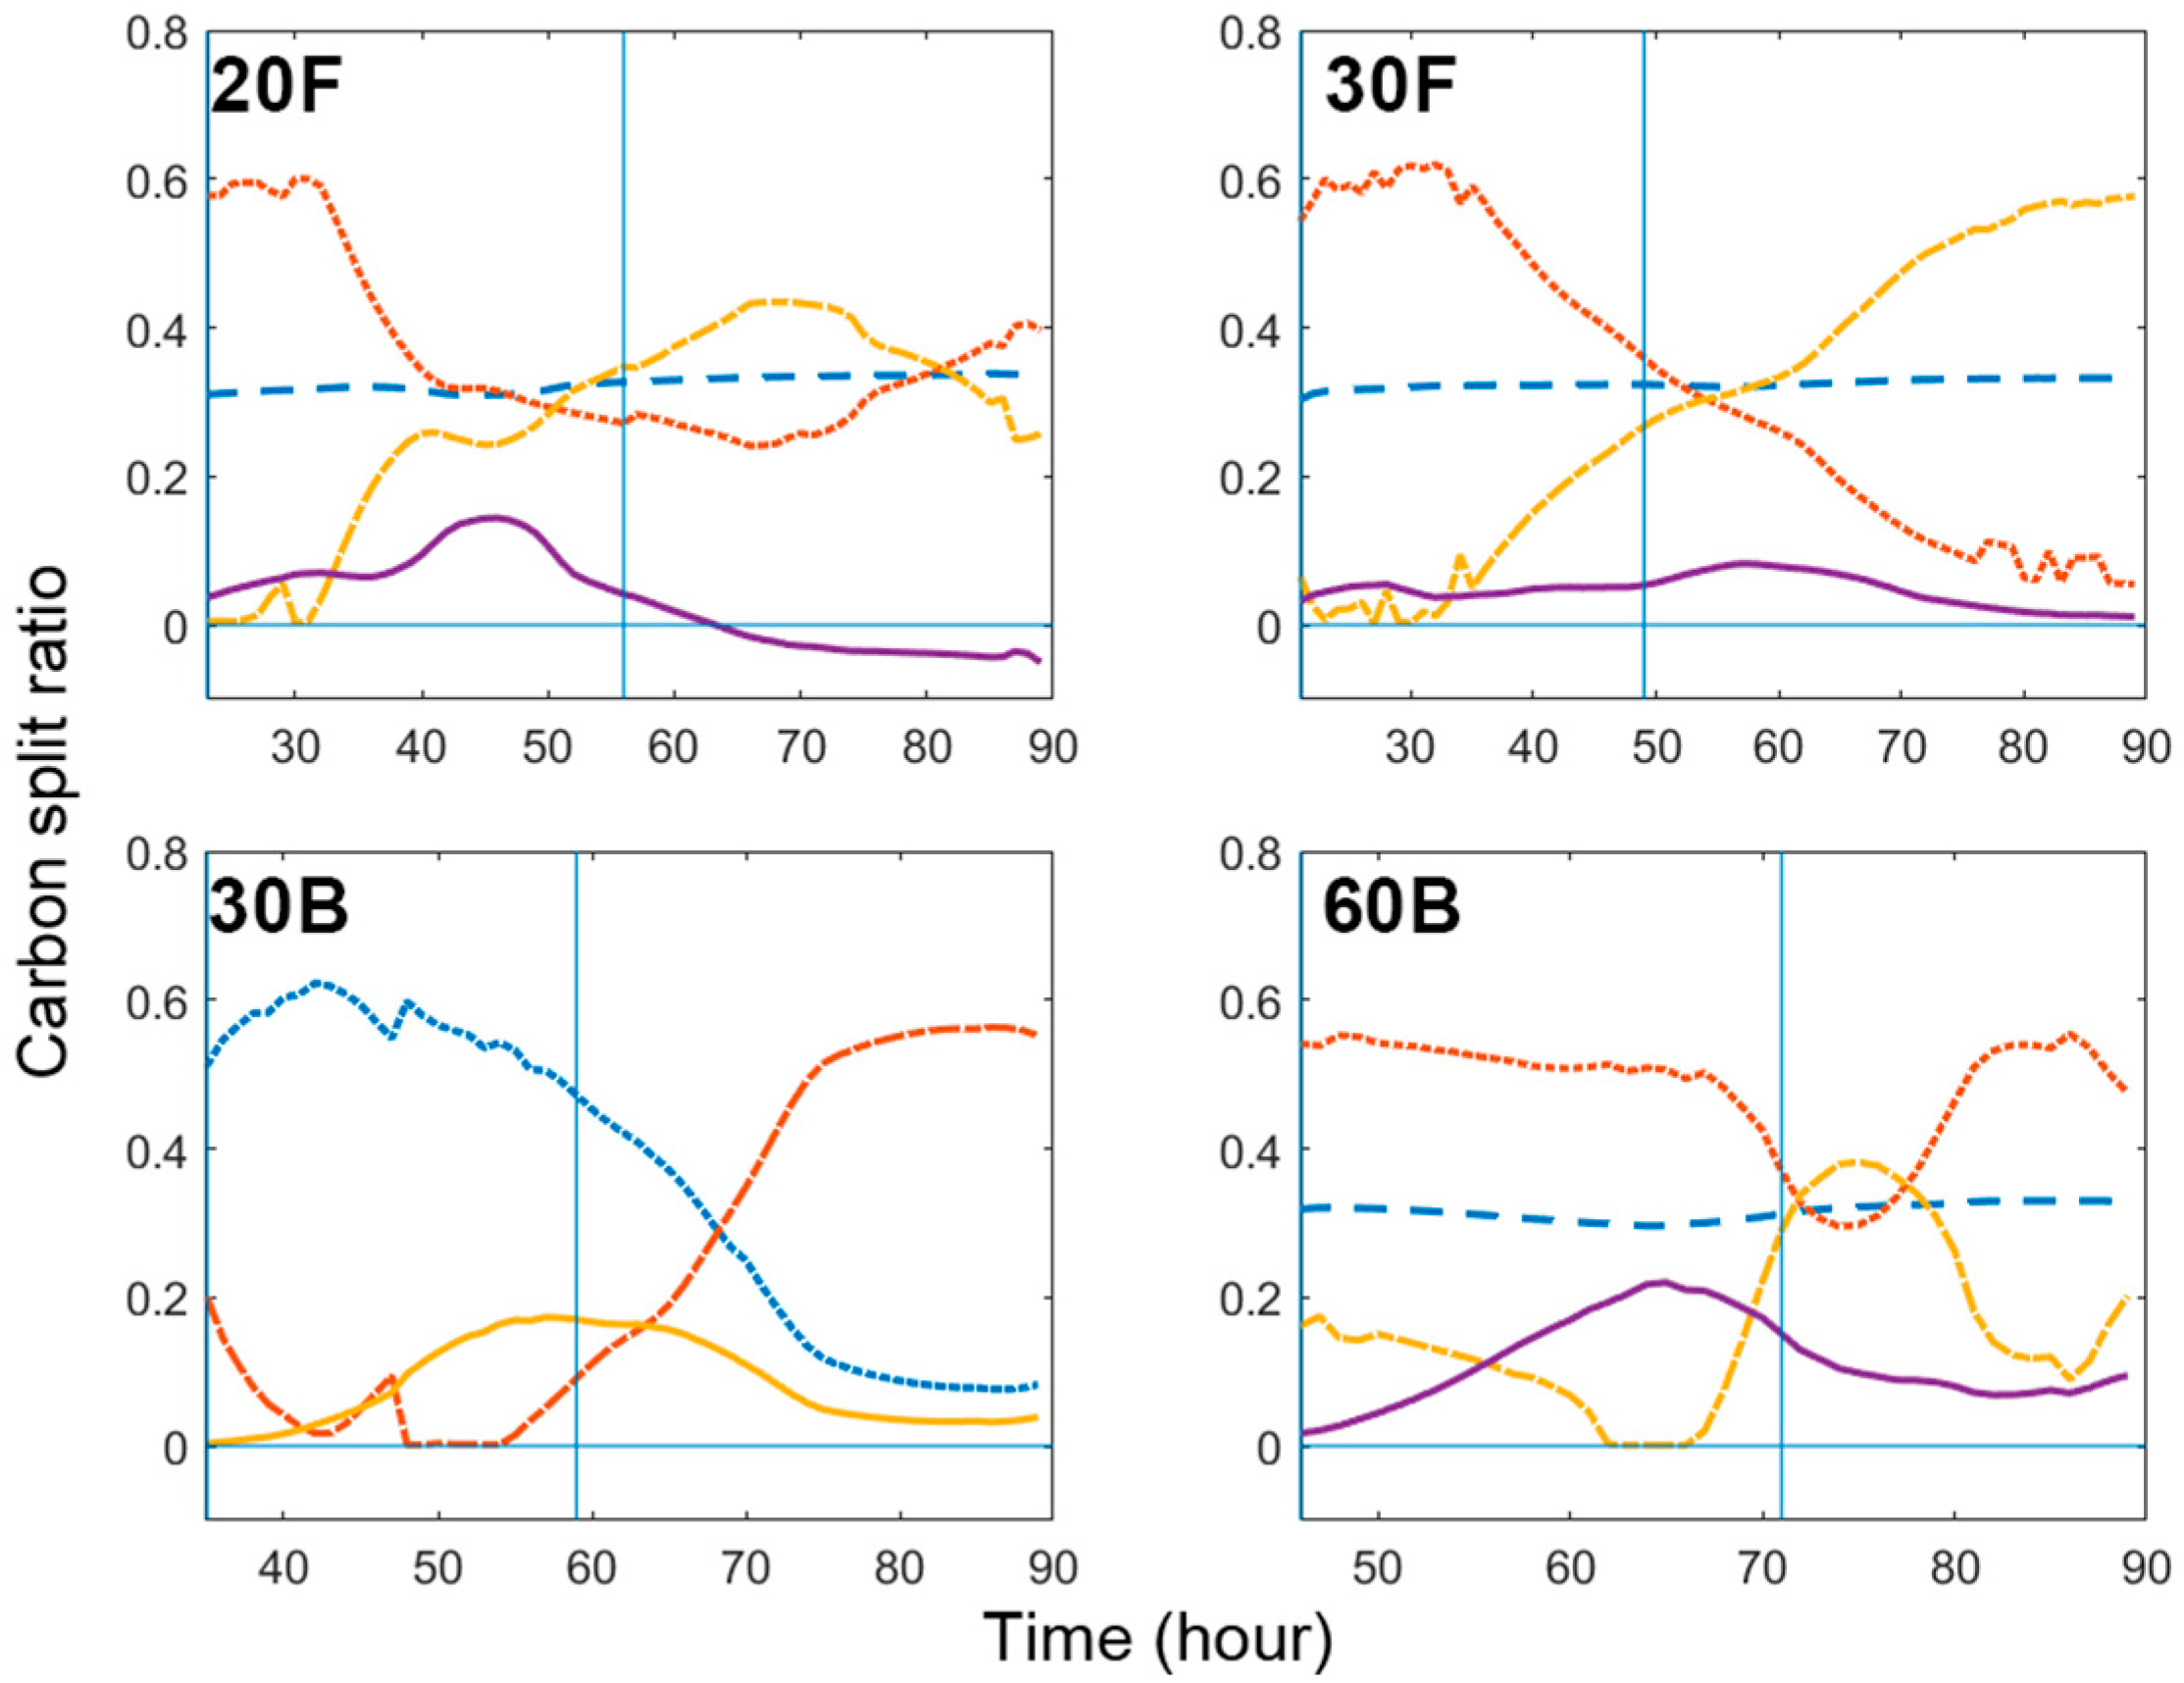
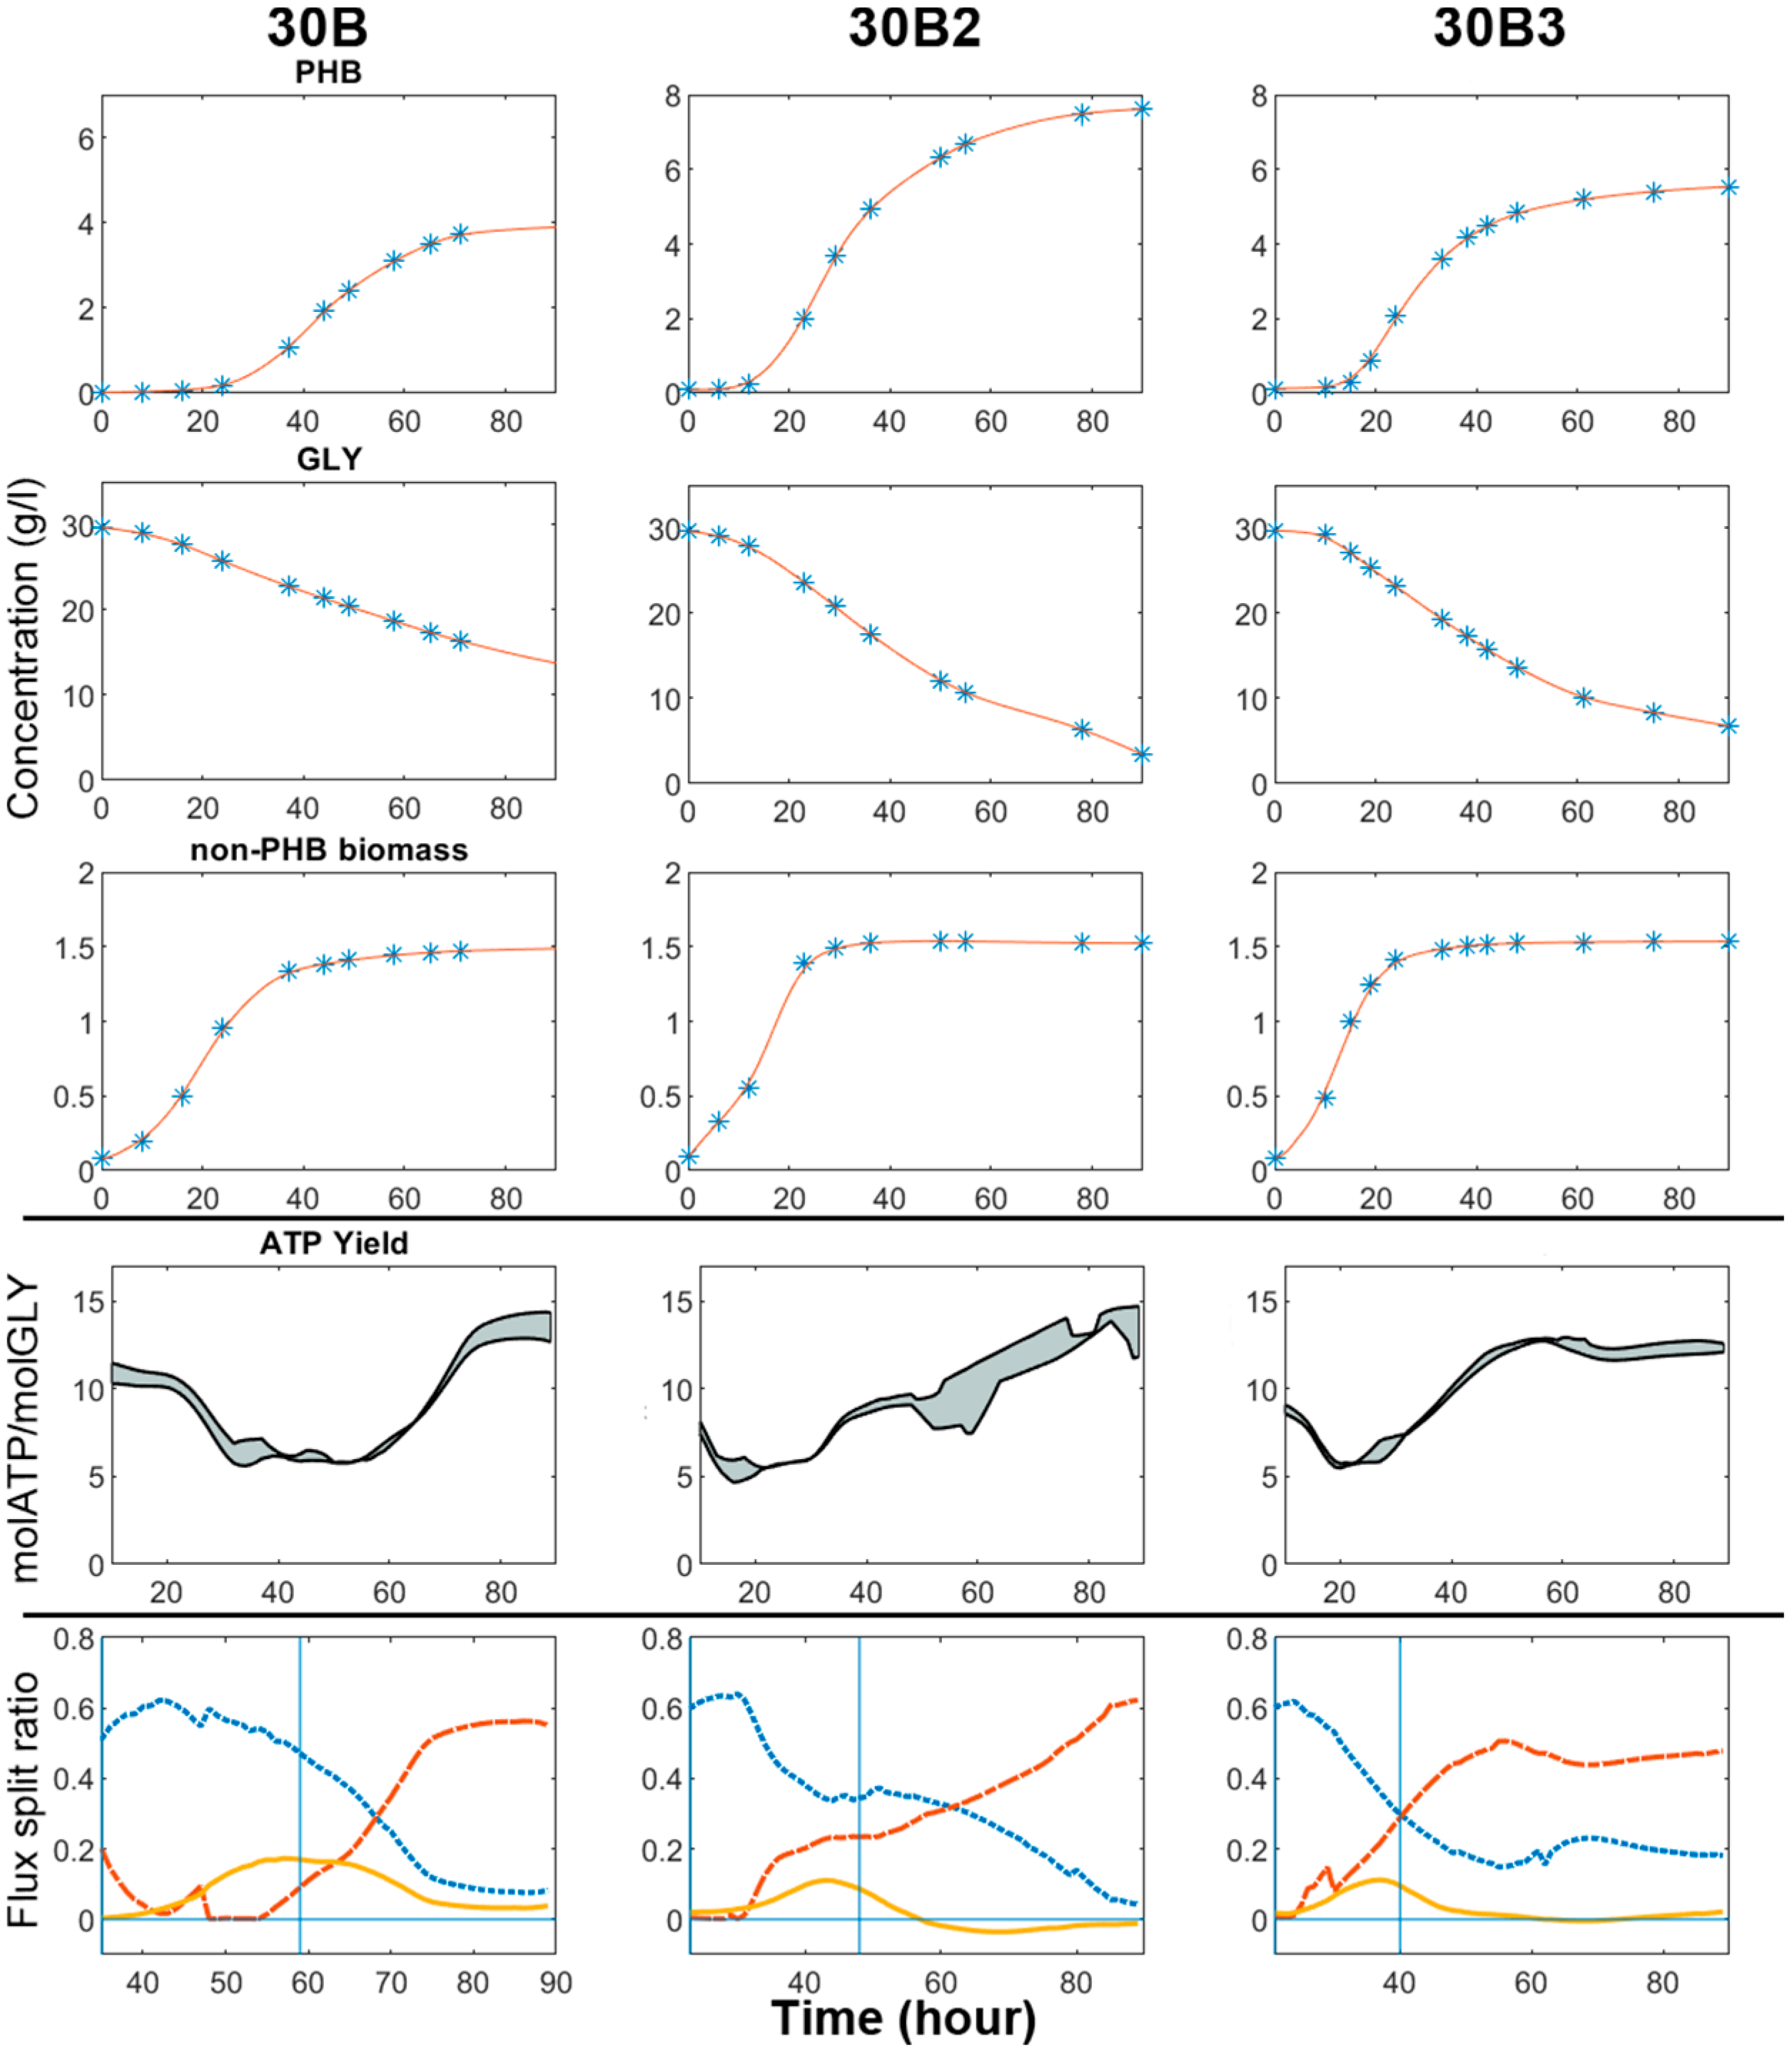
Table 1.
Fermentation conditions for all flask- and bioreactor-scale experiments.
| Conditions | Shake-Flask | Electrolab Bioreactor |
|---|---|---|
| Temperature (°C) | 30 °C | |
| Vessel Volume (mL) | 600 | 1500 |
| Working Volume (mL) | 100 | 1000 |
| Shaking/Stirring Speed (rpm) | 220 | 220 |
| G Force (g) | 0.68 | 1.1 (impeller tip) |
| Oxygen supply | Surface aeration | 1 vvm |
| Inoculation size | 5 mL (5% v/v) | 50 mL (5% v/v) |
Table 2.
List of constraints used in (TBFE) to probe the upper and lower flux limits of all thermodynamically feasible reactions.
Table 2.
List of constraints used in (TBFE) to probe the upper and lower flux limits of all thermodynamically feasible reactions.
| Maximise: | or | |
| Constraint No. | ||
| Subject to: | 1 | |
| 2 | ||
| 3 | ||
| 4 | ||
| 5 | ||
| 6 | ||
| 7 | ||
| 8 | ||
| 9 |
Table 3.
Duration of Phase II and growth phase, percentage of total PHB produced in Phase II, PHB productivity in Phase II and Phase III.
Table 3.
Duration of Phase II and growth phase, percentage of total PHB produced in Phase II, PHB productivity in Phase II and Phase III.
| Duration of Phase II (Hour) | Duration of Growth Phase (Phase I + II) (Hour) | Percentage (wt.%) of PHB Produced in Phase II | PHB Productivity in Phase II (g/L/h) | PHB Productivity in Phase III (g/L/h) | |
|---|---|---|---|---|---|
| 20F | 9 | 22 | 20.4 | 0.045 | 0.085 |
| 30F | 7 | 23 | 17.1 | 0.042 | 0.137 |
| 30B | 12 | 37 | 27.9 | 0.029 | 0.092 |
| 60B | 21 | 46 | 39.2 | 0.043 | 0.083 |
Table 4.
Aeration conditions and corresponding oxygen mass transfer coefficients used in 30B, 30B2 and 30B3.
Table 4.
Aeration conditions and corresponding oxygen mass transfer coefficients used in 30B, 30B2 and 30B3.
| Name | 30B | 30B2 | 30B3 |
|---|---|---|---|
| Aeration (0–24 h) | 220 rpm + 1 vvm aeration (kLa: 0.110 min−1) | 300 rpm + 0.6 vvm aeration (kLa: 0.823 min−1) | 300 rpm + 0.6 vvm aeration (kLa: 0.823 min−1) |
| Aeration (24–90 h) | 220 rpm + 1 vvm aeration (kLa: 0.110 min−1) | 300 rpm + 0.4 vvm aeration (kLa: 0.350 min−1) | 300 rpm + 0.6 vvm aeration (kLa: 0.823 min−1) |
© 2020 by the authors. Licensee MDPI, Basel, Switzerland. This article is an open access article distributed under the terms and conditions of the Creative Commons Attribution (CC BY) license (http://creativecommons.org/licenses/by/4.0/).
Share and Cite
MDPI and ACS Style
Sun, C.; Pérez-Rivero, C.; Webb, C.; Theodoropoulos, C. Dynamic Metabolic Analysis of Cupriavidus necator DSM545 Producing Poly(3-hydroxybutyric acid) from Glycerol. Processes 2020, 8, 657. https://doi.org/10.3390/pr8060657
AMA Style
Sun C, Pérez-Rivero C, Webb C, Theodoropoulos C. Dynamic Metabolic Analysis of Cupriavidus necator DSM545 Producing Poly(3-hydroxybutyric acid) from Glycerol. Processes. 2020; 8(6):657. https://doi.org/10.3390/pr8060657
Chicago/Turabian StyleSun, Chenhao, Cristina Pérez-Rivero, Colin Webb, and Constantinos Theodoropoulos. 2020. "Dynamic Metabolic Analysis of Cupriavidus necator DSM545 Producing Poly(3-hydroxybutyric acid) from Glycerol" Processes 8, no. 6: 657. https://doi.org/10.3390/pr8060657
Note that from the first issue of 2016, this journal uses article numbers instead of page numbers. See further details here.