1. Introduction
Environmental care is currently not only a trend, but it is also an important issue for society and governments. Moreover, for obvious reasons, there is a clear trend in which it is necessary to ensure care for the environment. In point of fact, no impact is very difficult or impossible. But nevertheless, aspects such as sustainability and the maximum possible reduction in environmental impact are very important [
1]. In this sense, in terms of energy needs, renewable energies play a key role in contributing to a reduction in environment impact and emissions [
2]. However, the impact of the power plant implementation itself, based on renewable sources, has to be taken into account; there is not usually zero impact [
3].
Due to it not being possible to achieve the null impact, even with the alternatives and use of renewable energies, there is a legal obligation to optimize and plan installations with maximum efficiency [
4]. Furthermore, the efficiency of the facilities must be measured in accordance with the right ratios and criteria with the aim of ensuring the desired minimum impact [
5].
Both the greatest environmental impact and the economic investment take place during the construction of the power generation facility. When the plant is in operation, although depending on the technology, it usually needs far less expense. Even in some cases, it is better that the installation be in operation than stopped. When this happens, energy storage becomes a highly recommended solution [
6].
Some of the reasons why the electric sector system is very convoluted are as follows [
7]. Among all of them, nowadays, the most complex issue is the matching of consumption with demand. If it is added to the different electric energy technologies of generation, the system could be ungovernable and unpredictable. According to some sources, the destabilization could be increased by the renewable energy plants [
8].
Due to the above reasons, the energy management systems are an imperative necessity. These possible methods and tools could handle the energy consumption and generation points. It is for these reasons therefore, that the concept of SmartGrids arises [
9], in which, among others, the generation and consumption are measured and monitored. With the aim to take decisions, more important than doing the above is to predict the behavior for matching the demand and the generation. Energy storage is a very helpful tool to achieve this goal [
10].
There are geographical areas in which buildings have electricity energy needs, and they are not connected to the electric grid [
11]. This kind of case does not usually have an easy solution because to connect a building to the electricity network implies a high cost, which is never going to be amortized. A possible alternative, and maybe a more feasible one, is to implement energy storage systems [
12].
As shown, in all cases, the energy storage could be a a feasible solution for the mentioned problems [
13]. Many are the technologies for this purpose, some of them relatively old and wasteful, like pumping water for its storage [
14]. During recent times, due to the energy store need, there are a lot of proposals to solve this necessity [
15]. One of the last reasons is the electric car development and trend [
16]. Among all existing technologies, the batteries and fuel cells are the most popular ones in this change process [
17].
One of the major difficult tasks of storage systems is the efficiency advancement under a global point of view. Nevertheless, under a practical outlook, commonly this efficiency is quantified in economical aspects. Of course, ahead of achieving this moneymaking objective requires hard progress. Lately, there are many proposals with the aim to achieve energy storage methods, systems, processes, and so on, in varied forms. Some examples of this are the following: In [
18], an optimal nonlinear controller based on Model Predictive Control (MPC) for a flywheel energy storage system is proposed, in which the constraints on the system states and actuators are taken into account. Ref. [
19] describes a system for storing energy deep underwater in concrete spheres, which also can act as moorings for floating wind turbines. A proposal is made in [
20] for a deterministic and an interval unit commitment formulation for the co-optimization of controllable generation and PHES (Pumped Hydro Energy Storage), including a representation of the hydraulic constraints of the PHES. The present work is focused on the fuel cells case and, specifically, on the hydrogen-based ones. These are the most common ones due to two basic reasons: hydrogen is a very abundant gas, and it is easy to achieve through a very simple process based on hydrolysis [
21].
Given that, as mentioned before, it is very important to obtain the right prediction of both the generation and the consumption, with the aim to achieve the correct decisions [
22]. When it will be necessary for energy selling or purchasing, the accurate forecasting must be decisive to be efficient under an economical point of view [
23]. Taking into account this affirmation, it is very important to have an effective prediction when a fuel cell system based on hydrogen is used.
For the behavior prediction, accomplishing the process modeling is mandatory. Some of the possible ways for this purpose come from Multiple Regression Analysis (MRA)-based models [
24], which have very common limitations in several instances [
25]. This problem is due to the possible nonlinearities in most of the cases [
26]. A possible alternative that solves this problem is the modeling based on intelligent techniques, with which it is possible to achieve satisfactory results commonly [
27]. However, despite the intelligent systems use, bad performance could be possible, if the nonlinearities are several. If it is the case, then, a hybrid system based on clustering techniques, previous to the regression step, frequently gives satisfactory results [
28].
A fuel cell performance modeling is accomplishing on the present research work, taking into account some measured parameters at the real storage system plant. Specifically, with the aim to achieve a very useful application, the model must predict the necessary increasing or decreasing of hydrogen flow for a gradual change of provided output power. Remark that the system behavior has a very nonlinear component, whereby clustering techniques are applied. Then, regression based on intelligent techniques are performed.
The rest of the paper is structured as follows. After the present section, the case study is described. Then, it is given the description of the proposed model approach for solving the problem. After that, the results are detailed and the last section exposes the conclusions and the future works.
2. Case Study
The “University of A Coruña” (UDC) has an experimental system to study renewable sources combined with energy storage system and their possibilities to increase the efficiency of the Power Network.
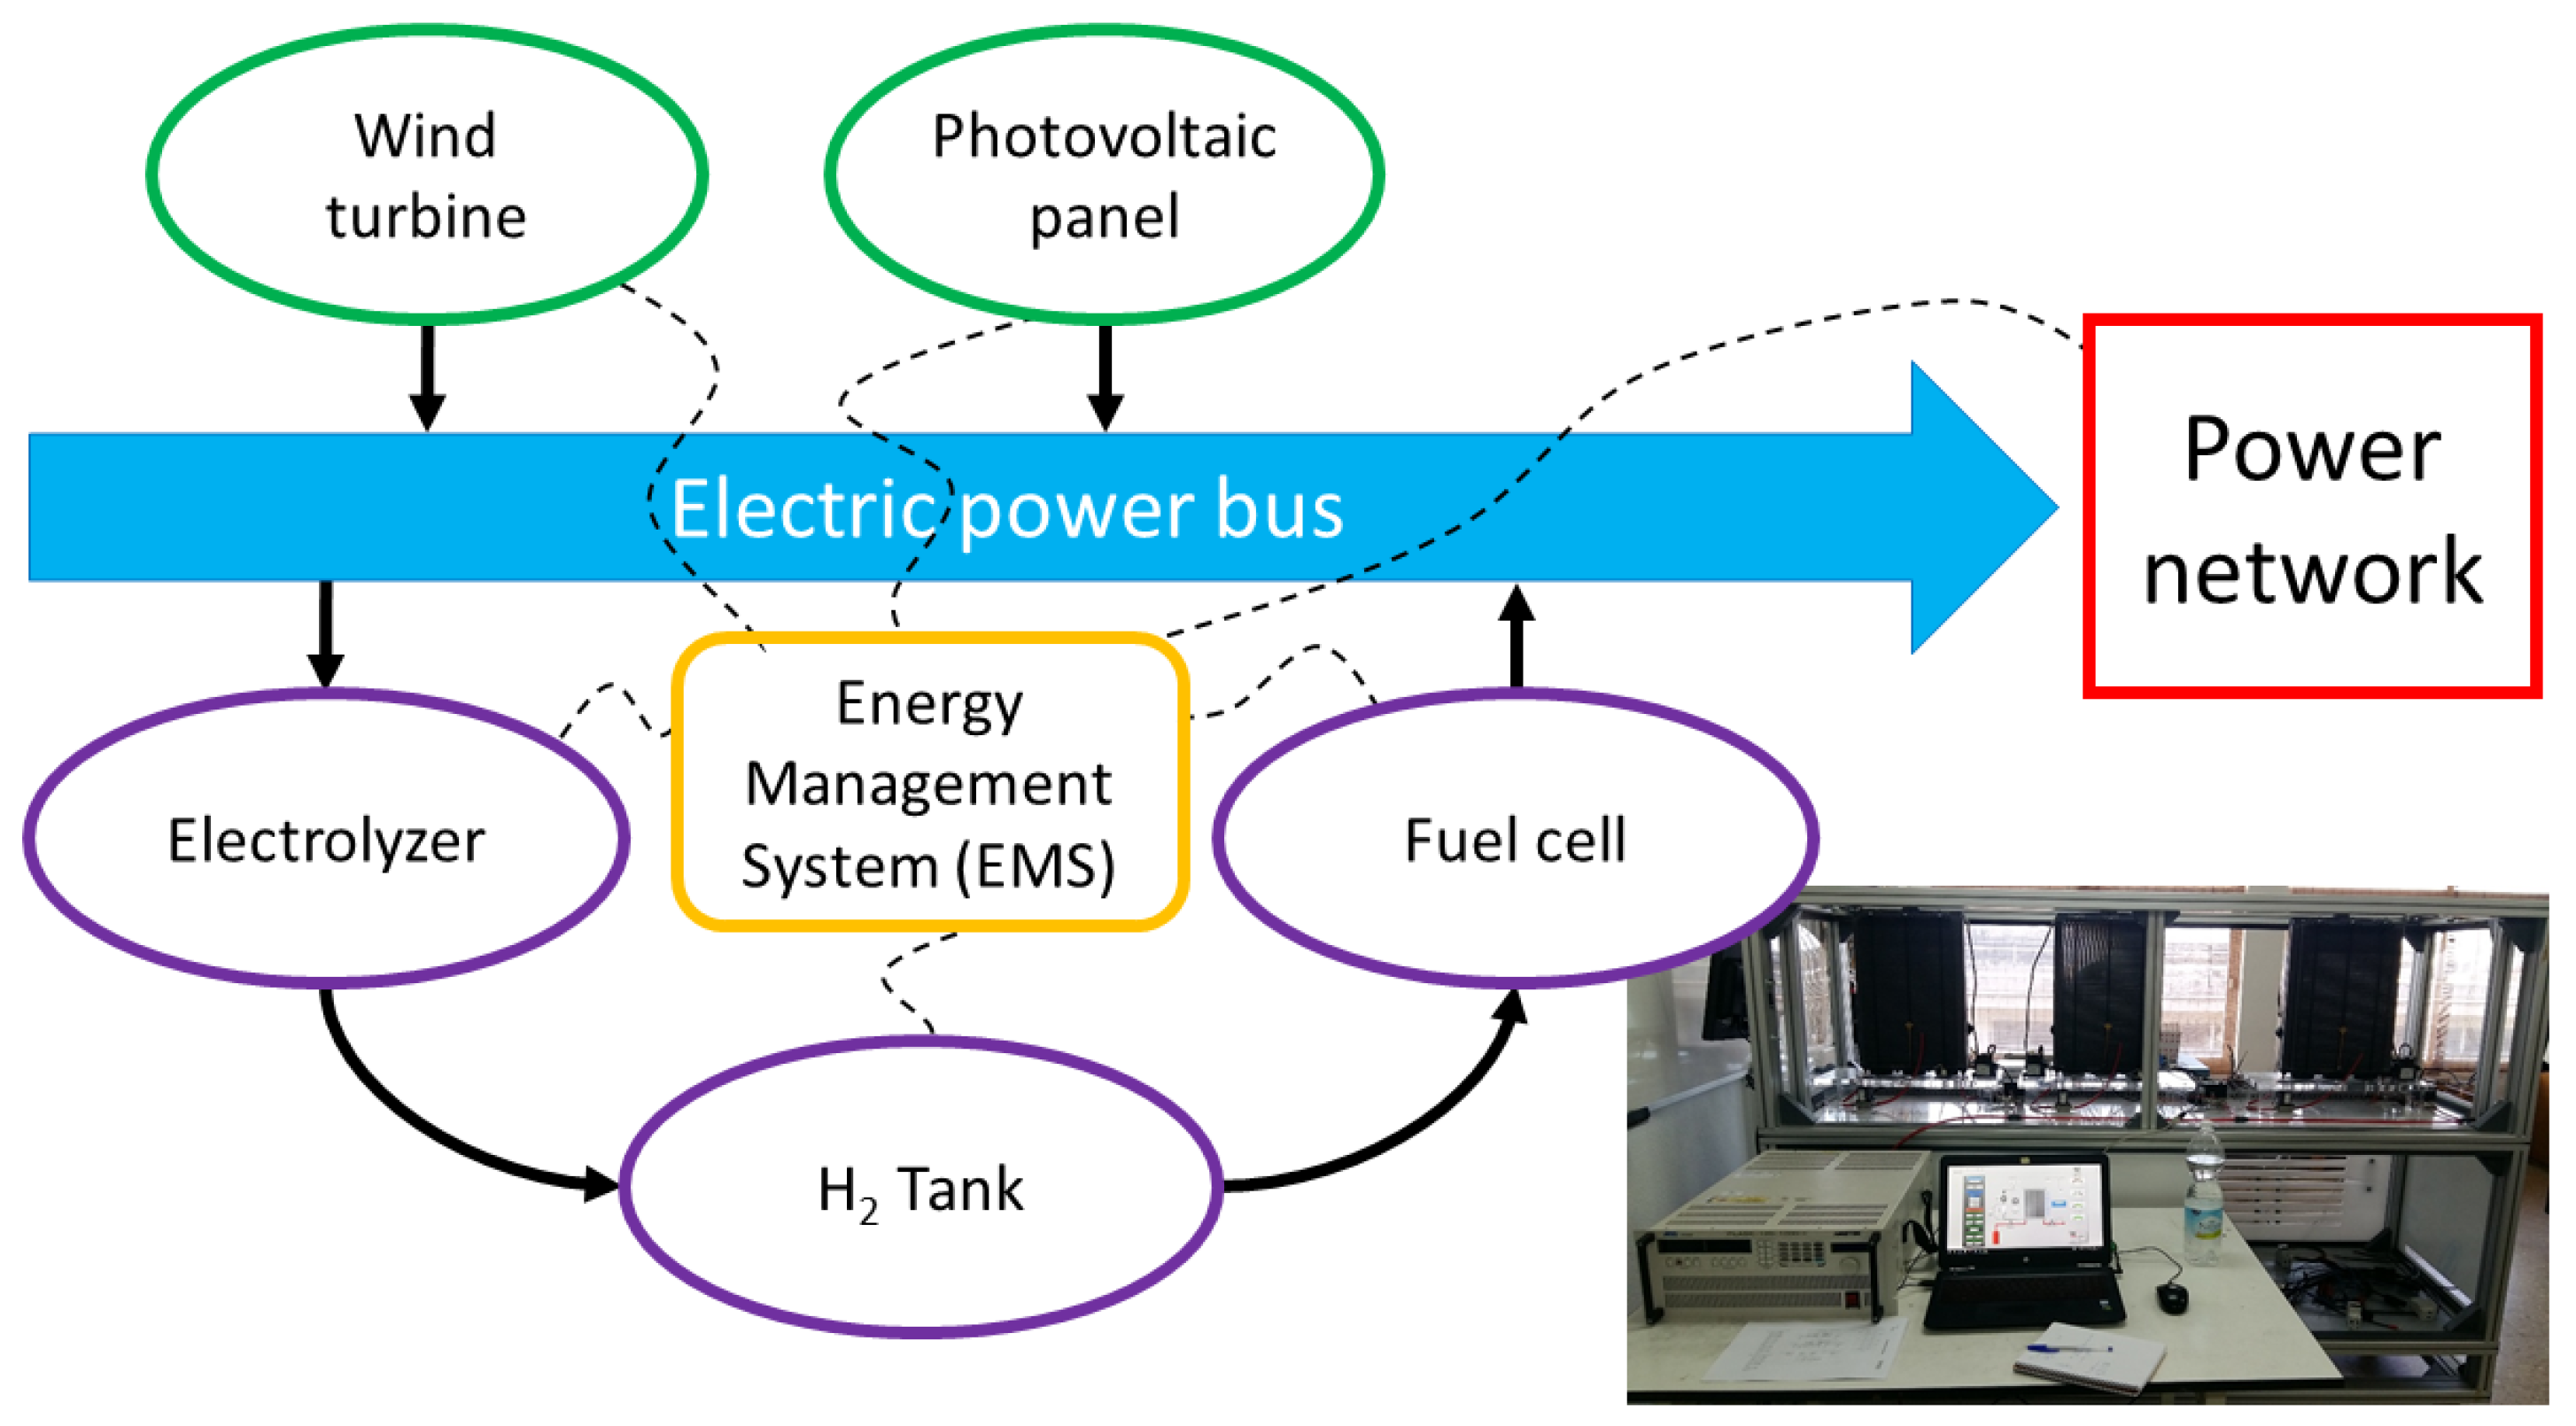
Figure 1 shows the basic scheme of this experimental installation. Our research is focused on the energy storage part [
29] that uses a fuel cell as a power transformation system to produce electrical energy from the chemical energy stored as hydrogen. The used storage system is a laboratory-size equipment, a system with research purpose.
In
Figure 1, the internal diagram of the electric power system is shown. Solar and wind generation and fuel cell are represented as inputs to the power bus; the main output is the Power Network, and also the electrolyzer that demands energy when it produces hydrogen. The Energy Storage System is divided into three different elements: the input Power Transform System (PTS), the electrolyzer; the Central Storage, the
tank; and the output PTS, the fuel cell. The system is controlled and supervised by an Energy Management System (EMS), with the aim of increasing its global efficiency. The Energy Storage System stores energy when the Power Network demand is less than the generation system produces; and the fuel cell produces energy when the Power Network demand is more than the renewable systems could generate.
This research is focused on the output PTS, the fuel cell, and this specific equipment, which are described in detail bellow.
2.1. Fuel Cell
Figure 2 shows the internal scheme of a single fuel cell. The inputs are the
inlet, the fuel input, and the air inlet, the
is picked from the air. The cell has two different outputs: the water outlet, which is the product of the internal reaction; and the
outlet, if the fuel input flow is greater than that of the electrical application needs [
30].
The internal reactions can be divided into three different types, depending on the part of the cell: the anode, the cathode, and the global result. Equation (
1) shows these three chemical reactions [
31,
32]. The fuel cell type used in this research is a Proton Exchange Membrane Fuel Cell (PEMFC), one of the most efficient technologies. It has high energy density and low volume and weight against other fuel cells.
Single fuel cells are joined together to create a stack. The stack used is a PEMFC FCgen-1020AVS from Ballard [
33], and it is formed by 80 BAM4G polymeric single cells [
29]. It has a porous carbon cloth anode and cathode, with a catalyst based on platinum. The whole stack has graphite plates between cells, and aluminum end plates, all of them joined by compression.
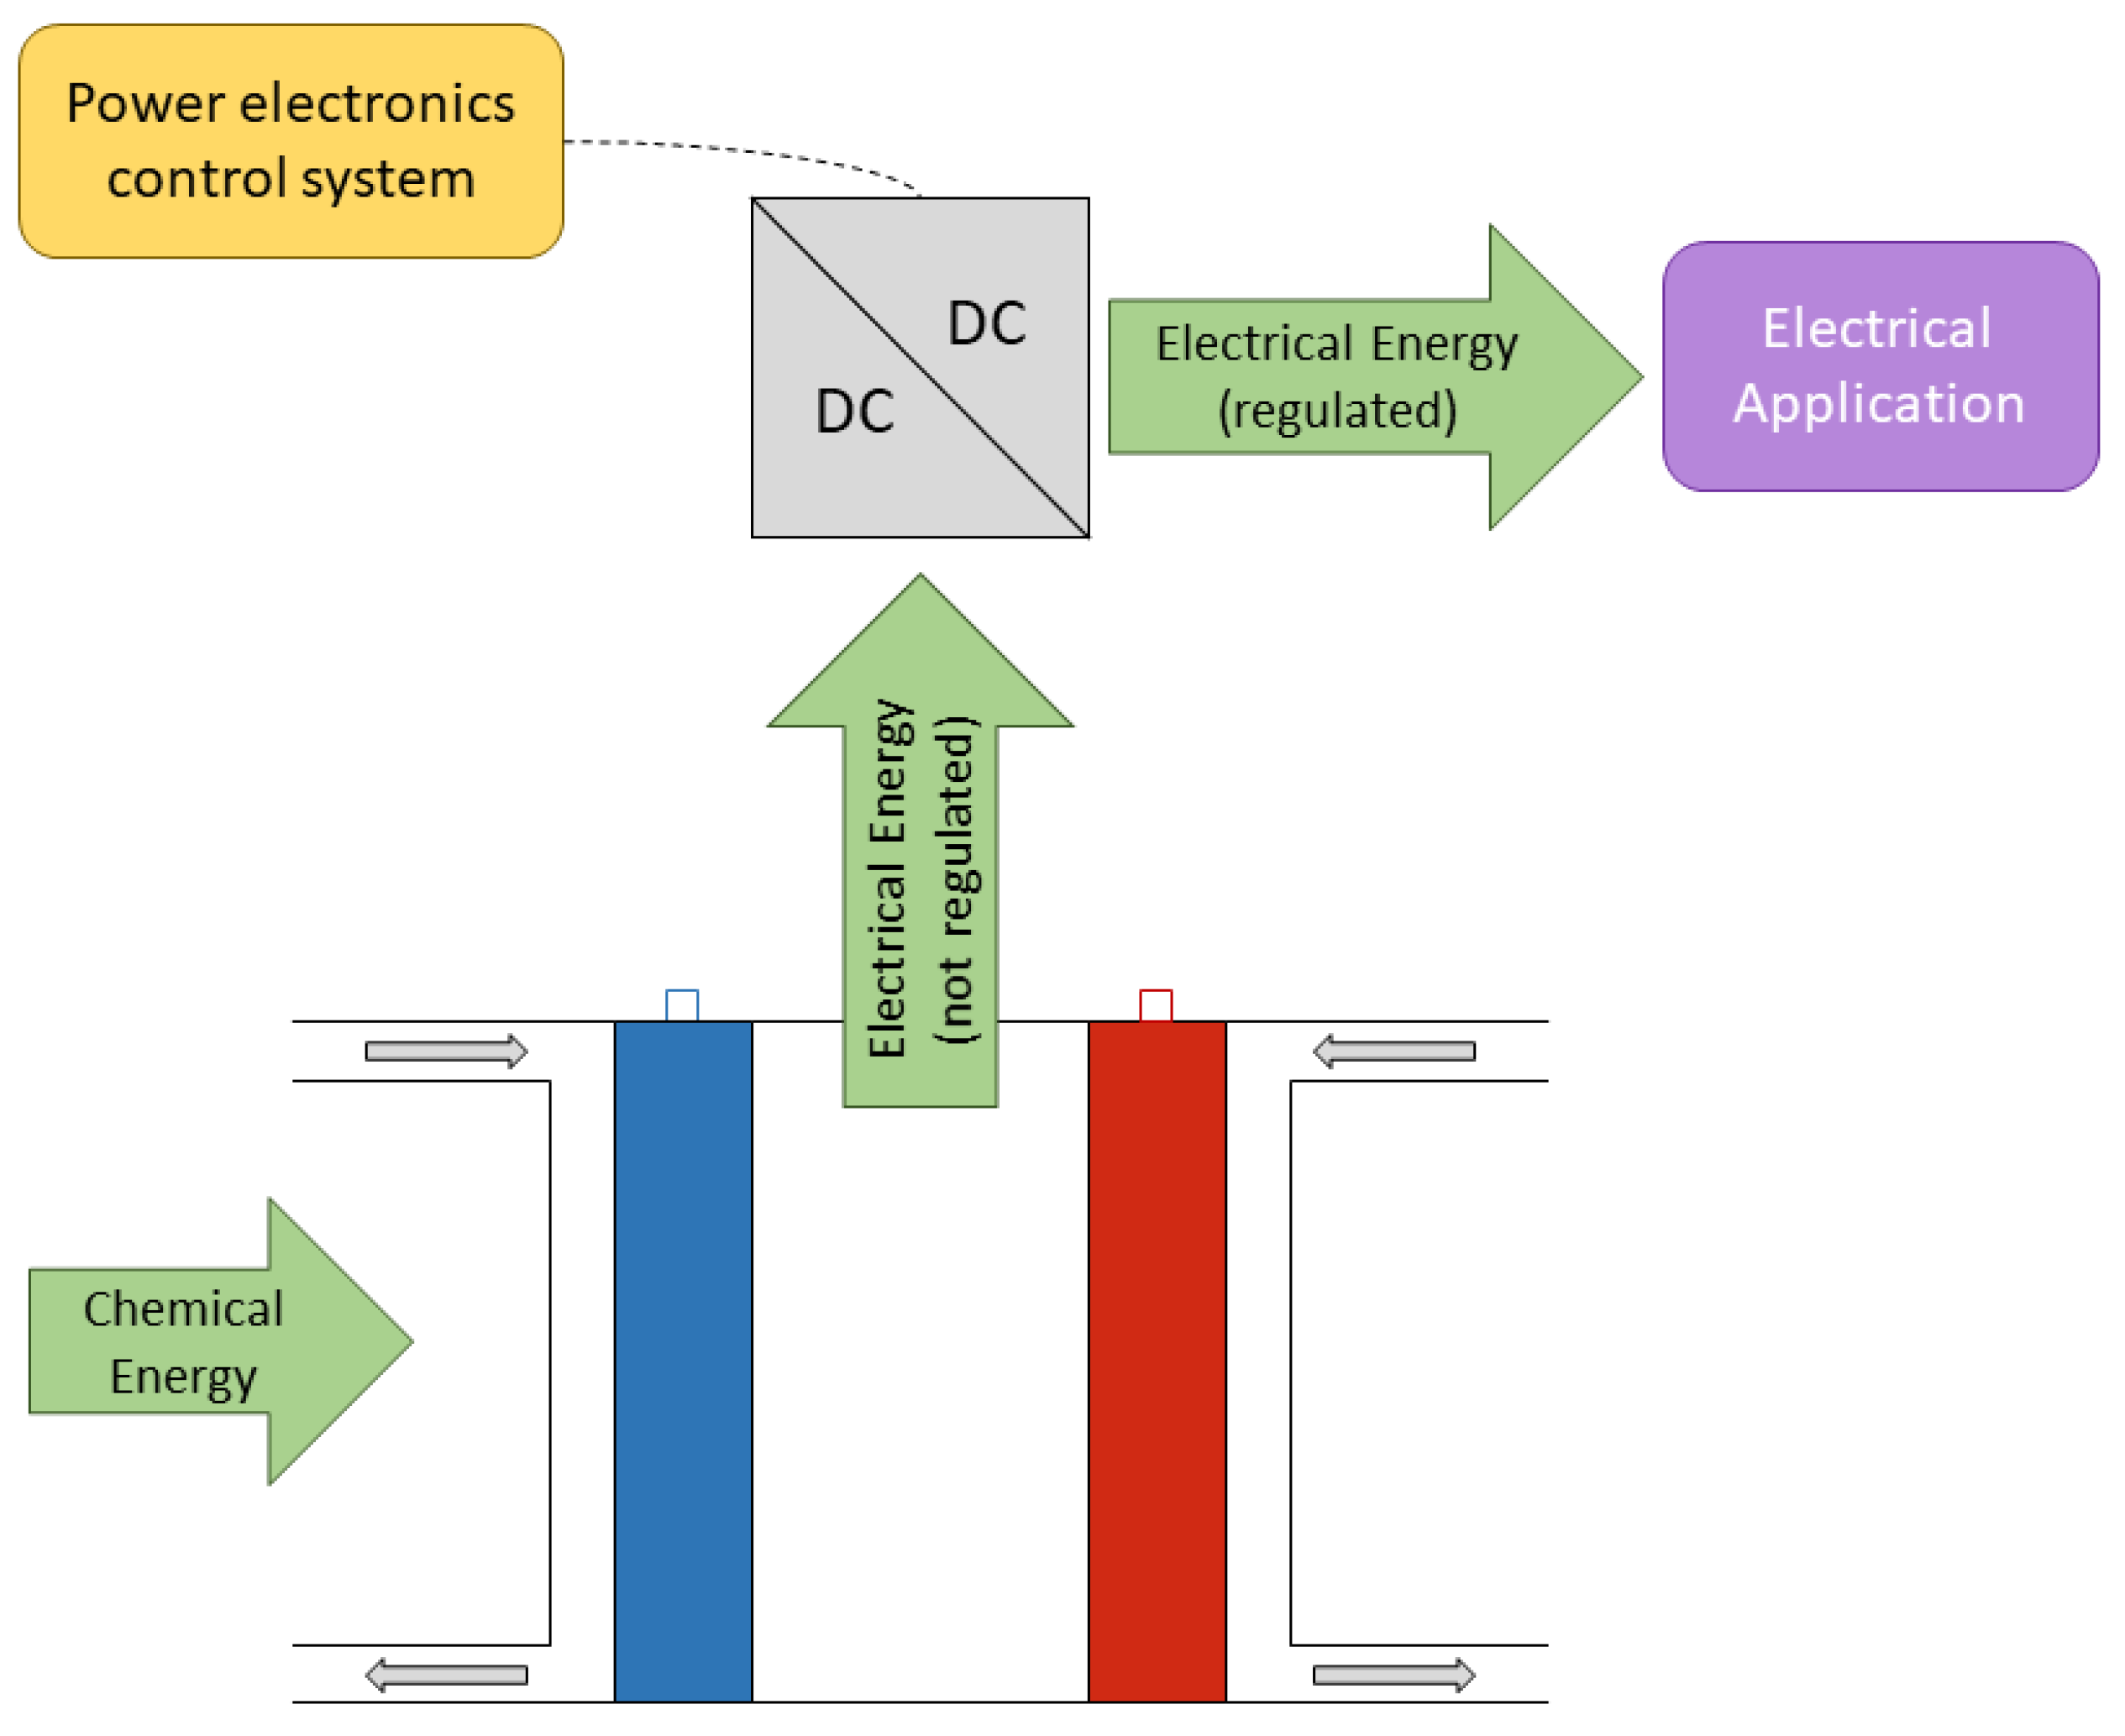
2.2. Power System
The electrical output of the fuel cell is not regulated, the voltage depends on the electrical load and the
inlet flow. However, the electrical applications need a stable input voltage to improve its operation.
Figure 3 shows the general power system diagram, where a power converter connects the output of the fuel cell and the electrical application.
It is necessary to emphasize that this kind of power converter controls the output voltage, and the electrical power becomes the most important variable to be controlled. This power depends on the inlet flow.
3. Model Approach
Figure 4 shows the basic model of the proposal. Instead of using the hydrogen flow as the model output, the variation in the current flow is predicted. Moreover, as the model is focused in the electrical power produced by the fuel cell, the inputs are the current power, the desired power in the future, and the current
inlet flow. The solution provided in this research lies on the modeling of the necessary fuel flow (hydrogen) for a desired power, to minimized the
outlet of the fuel cell.
Figure 5 shows the specific signals and their temporal instants. With the current values of power and hydrogen flow, the model predicts the flow variation two states later to achieve the desired power. As the fuel cell system reacts before the load demands the future power, this model increases the efficiency of the fuel cell.
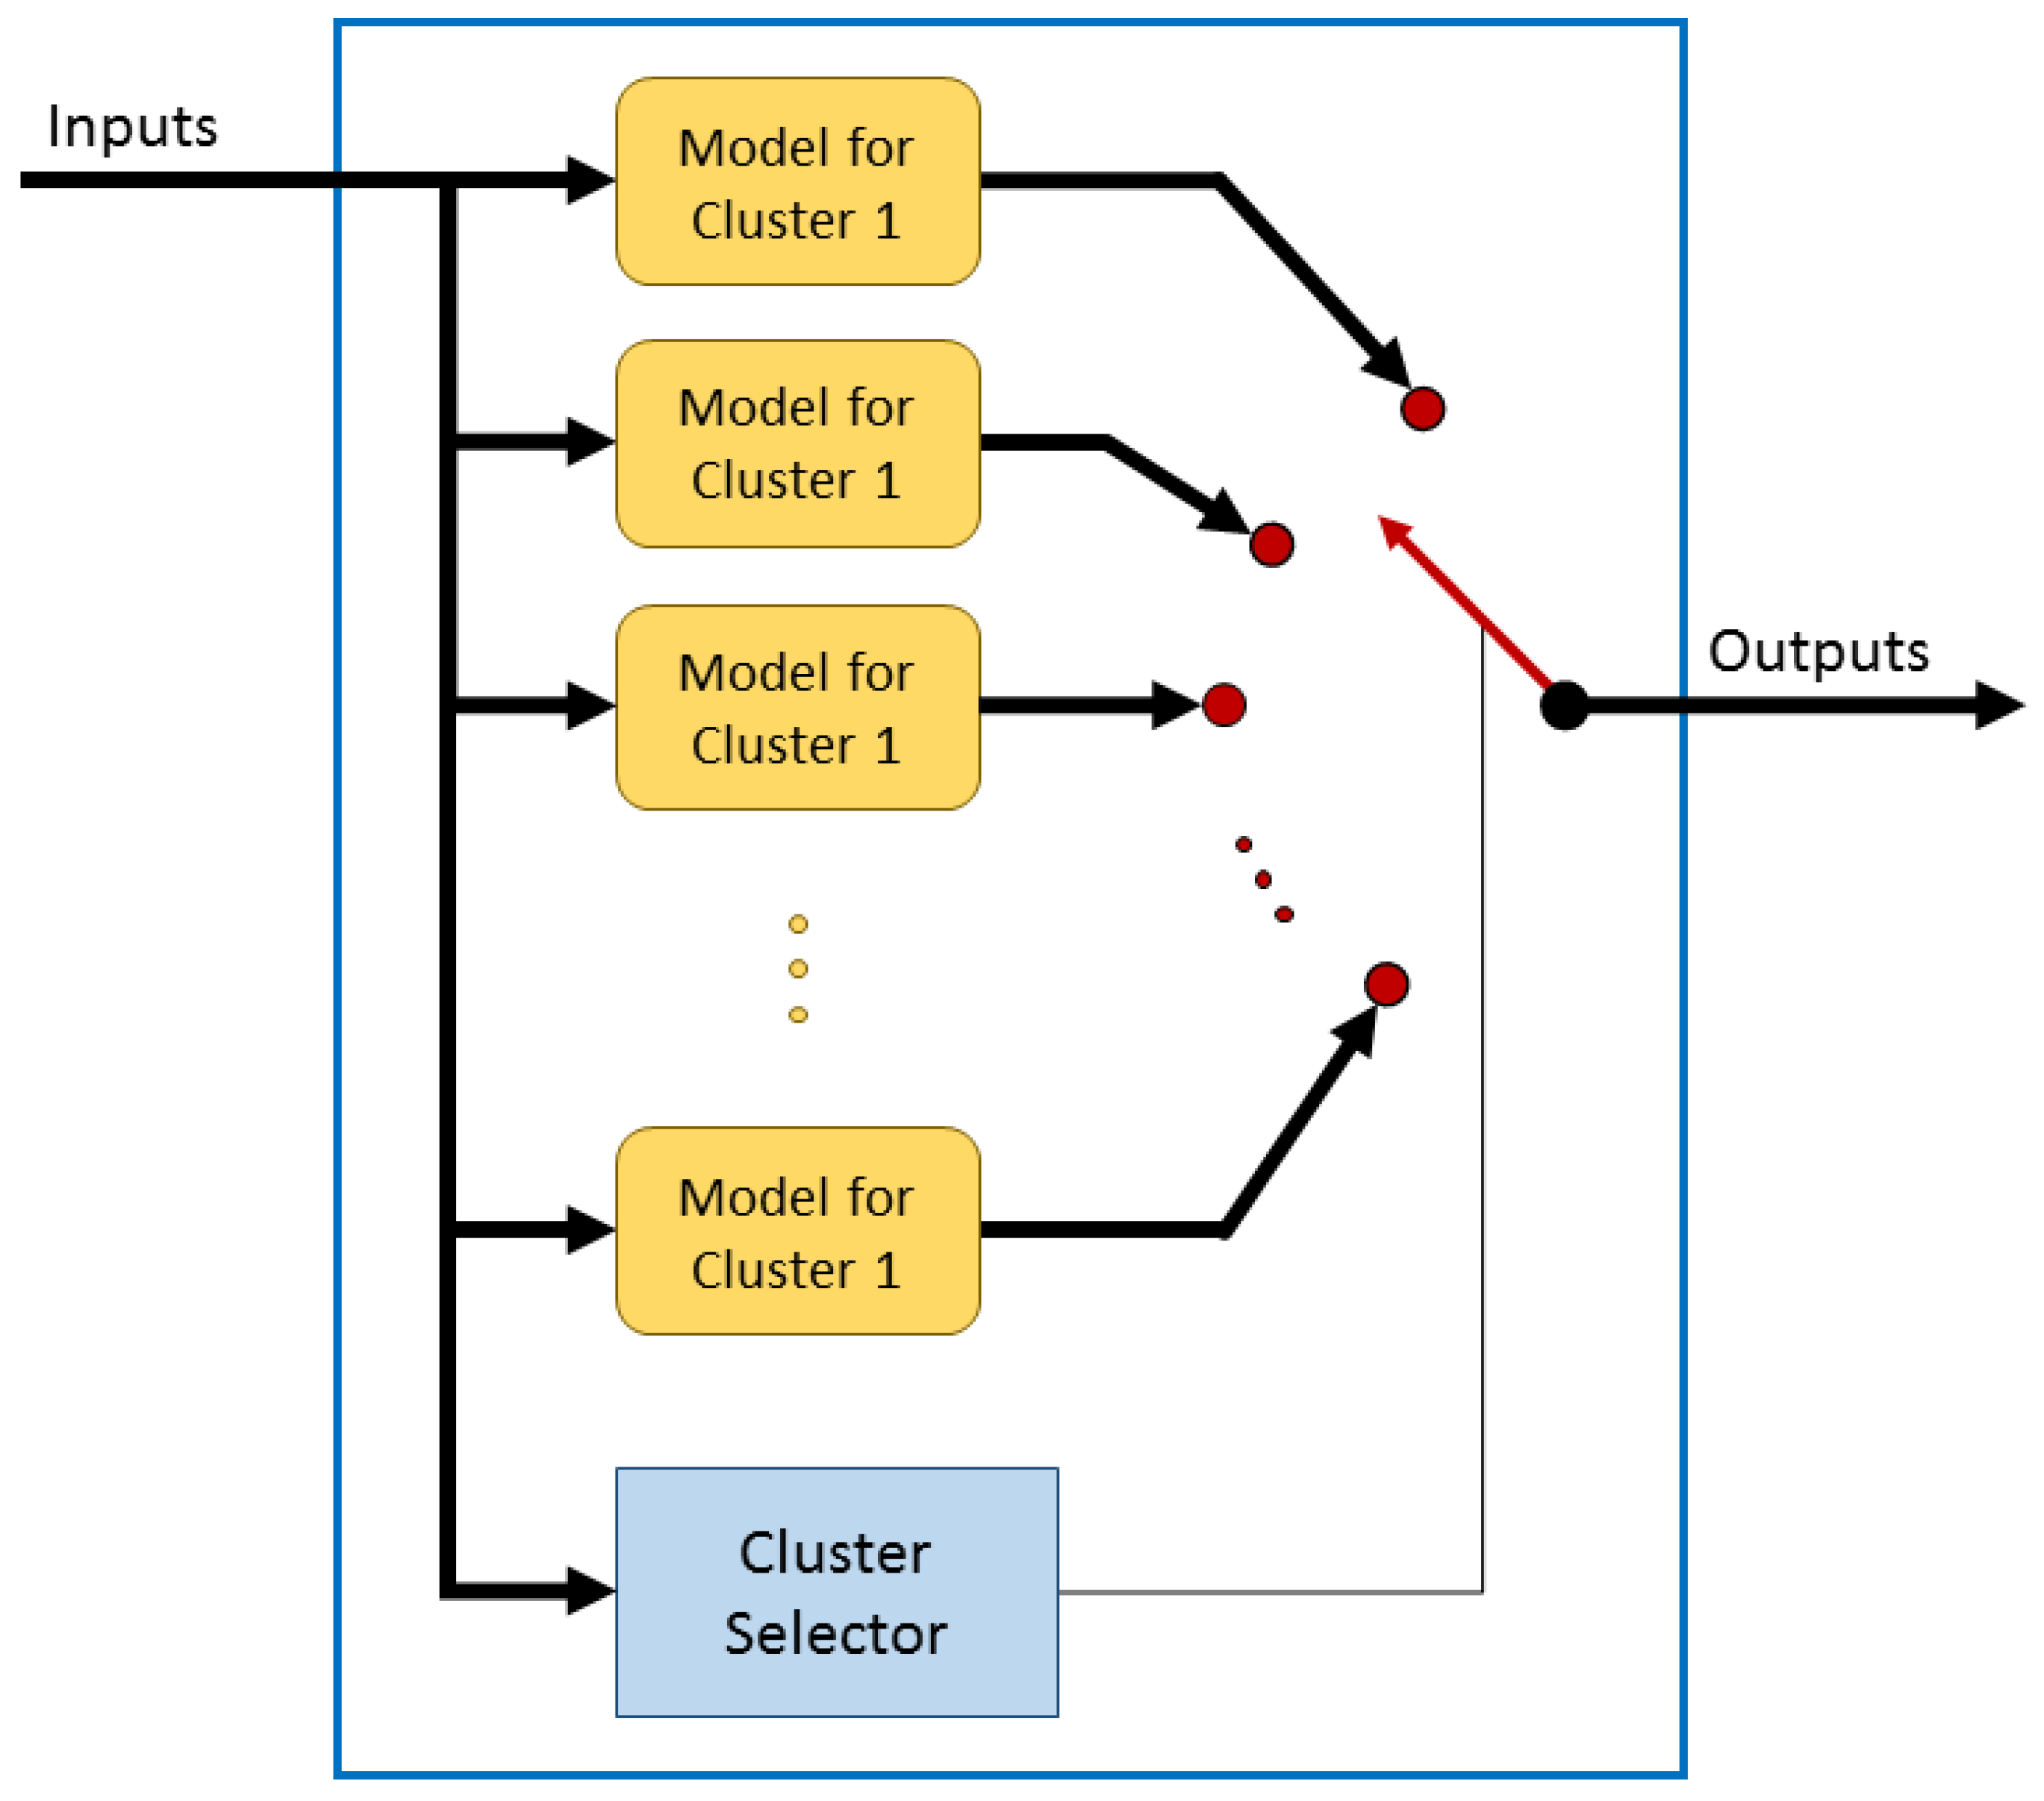
In order to obtain this prediction, a hybrid model has been created using clustering techniques to divide the data into various data subsets. After that, several regression algorithms were trained for each cluster.
Figure 6 shows an internal representation of the hybrid model, it can be seen that each group has its own regression model. Each input sample is assigned to a specific cluster, and the output of the whole model will be the output of the specific local model.
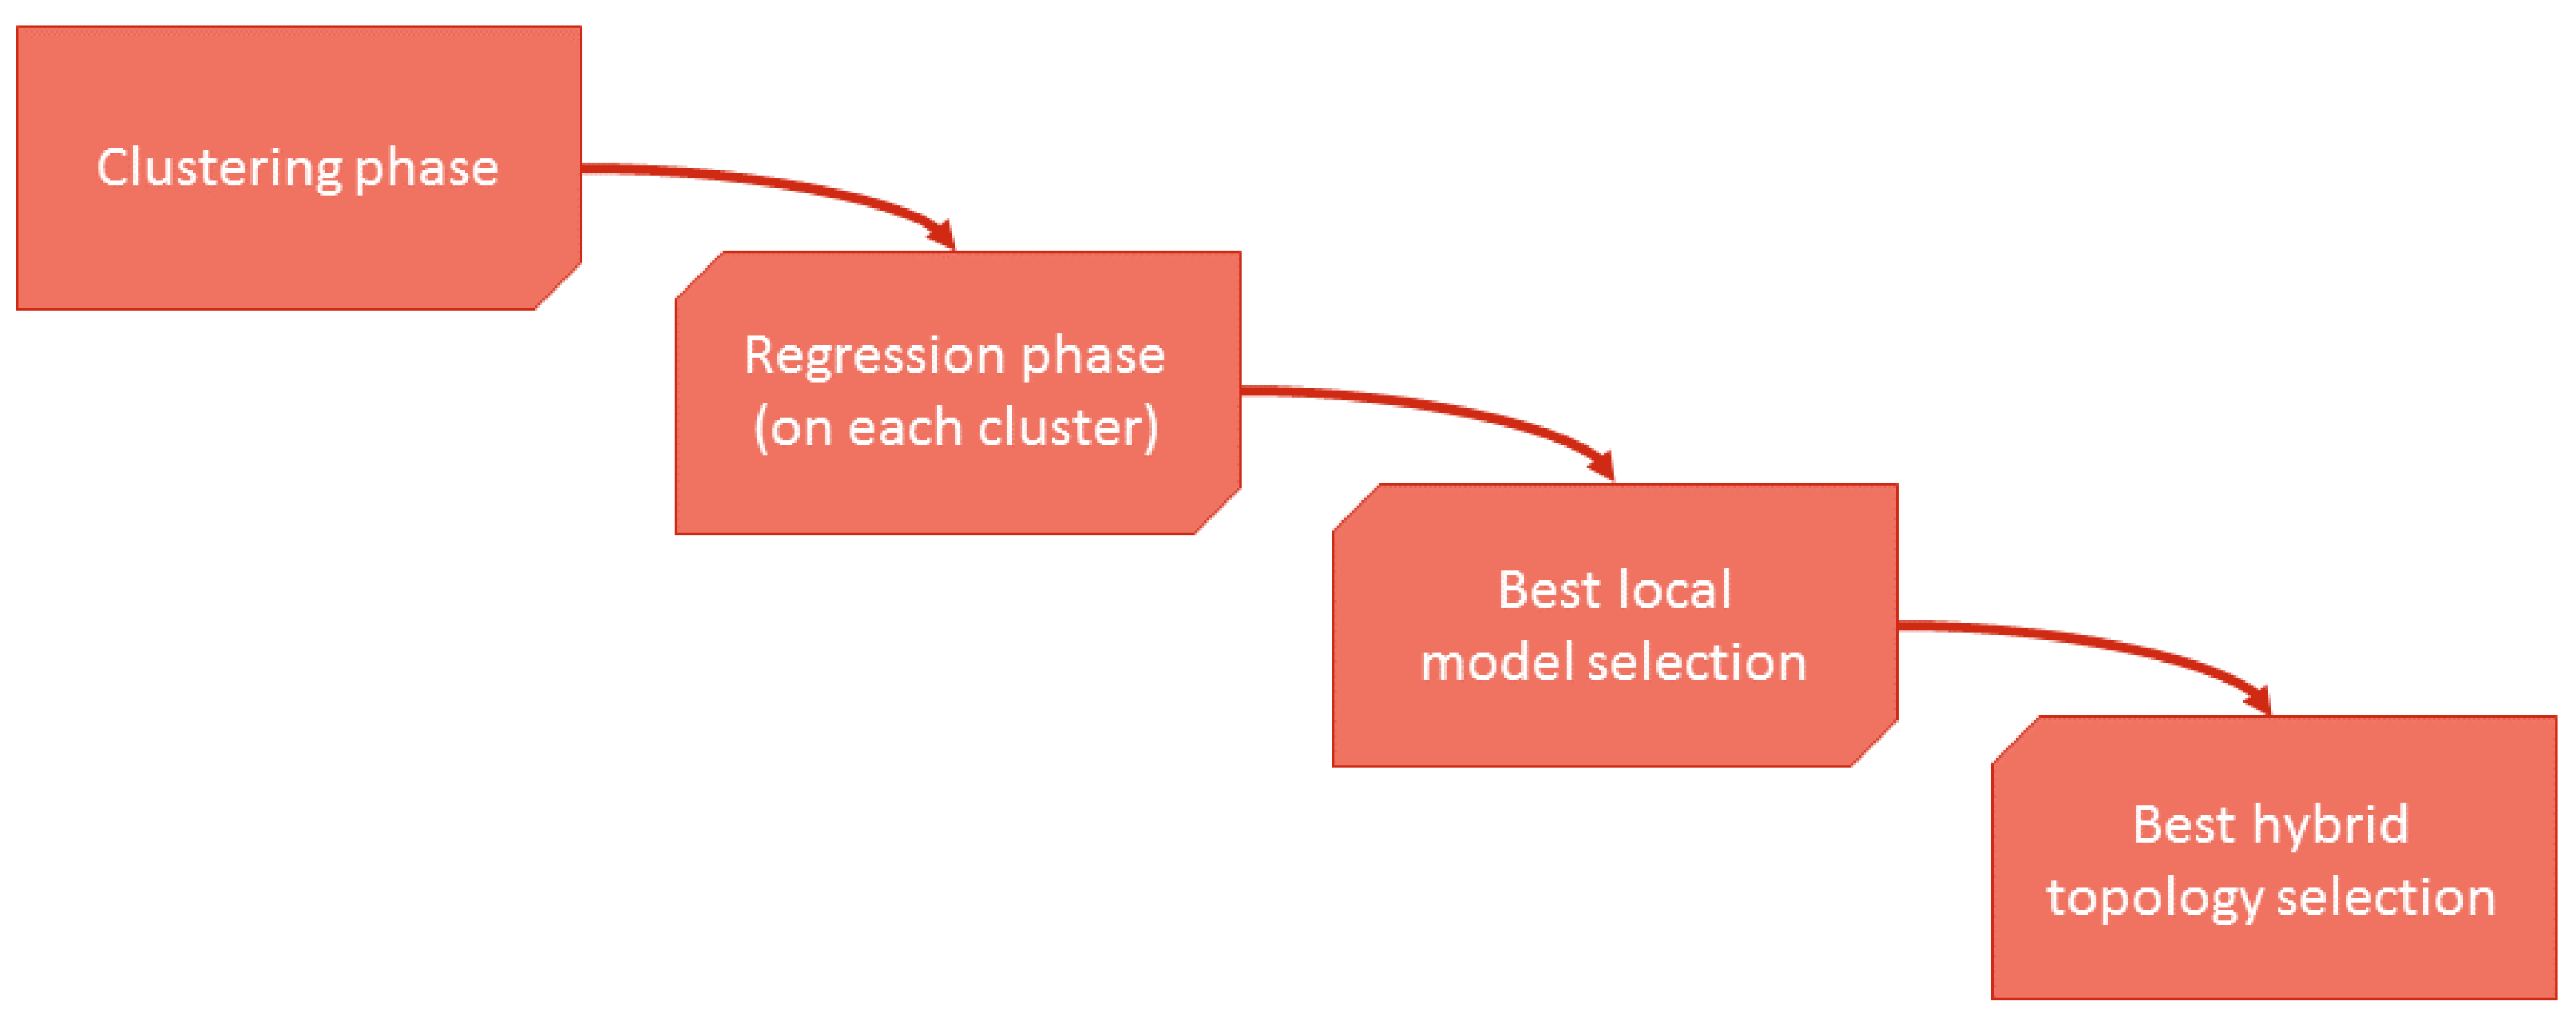
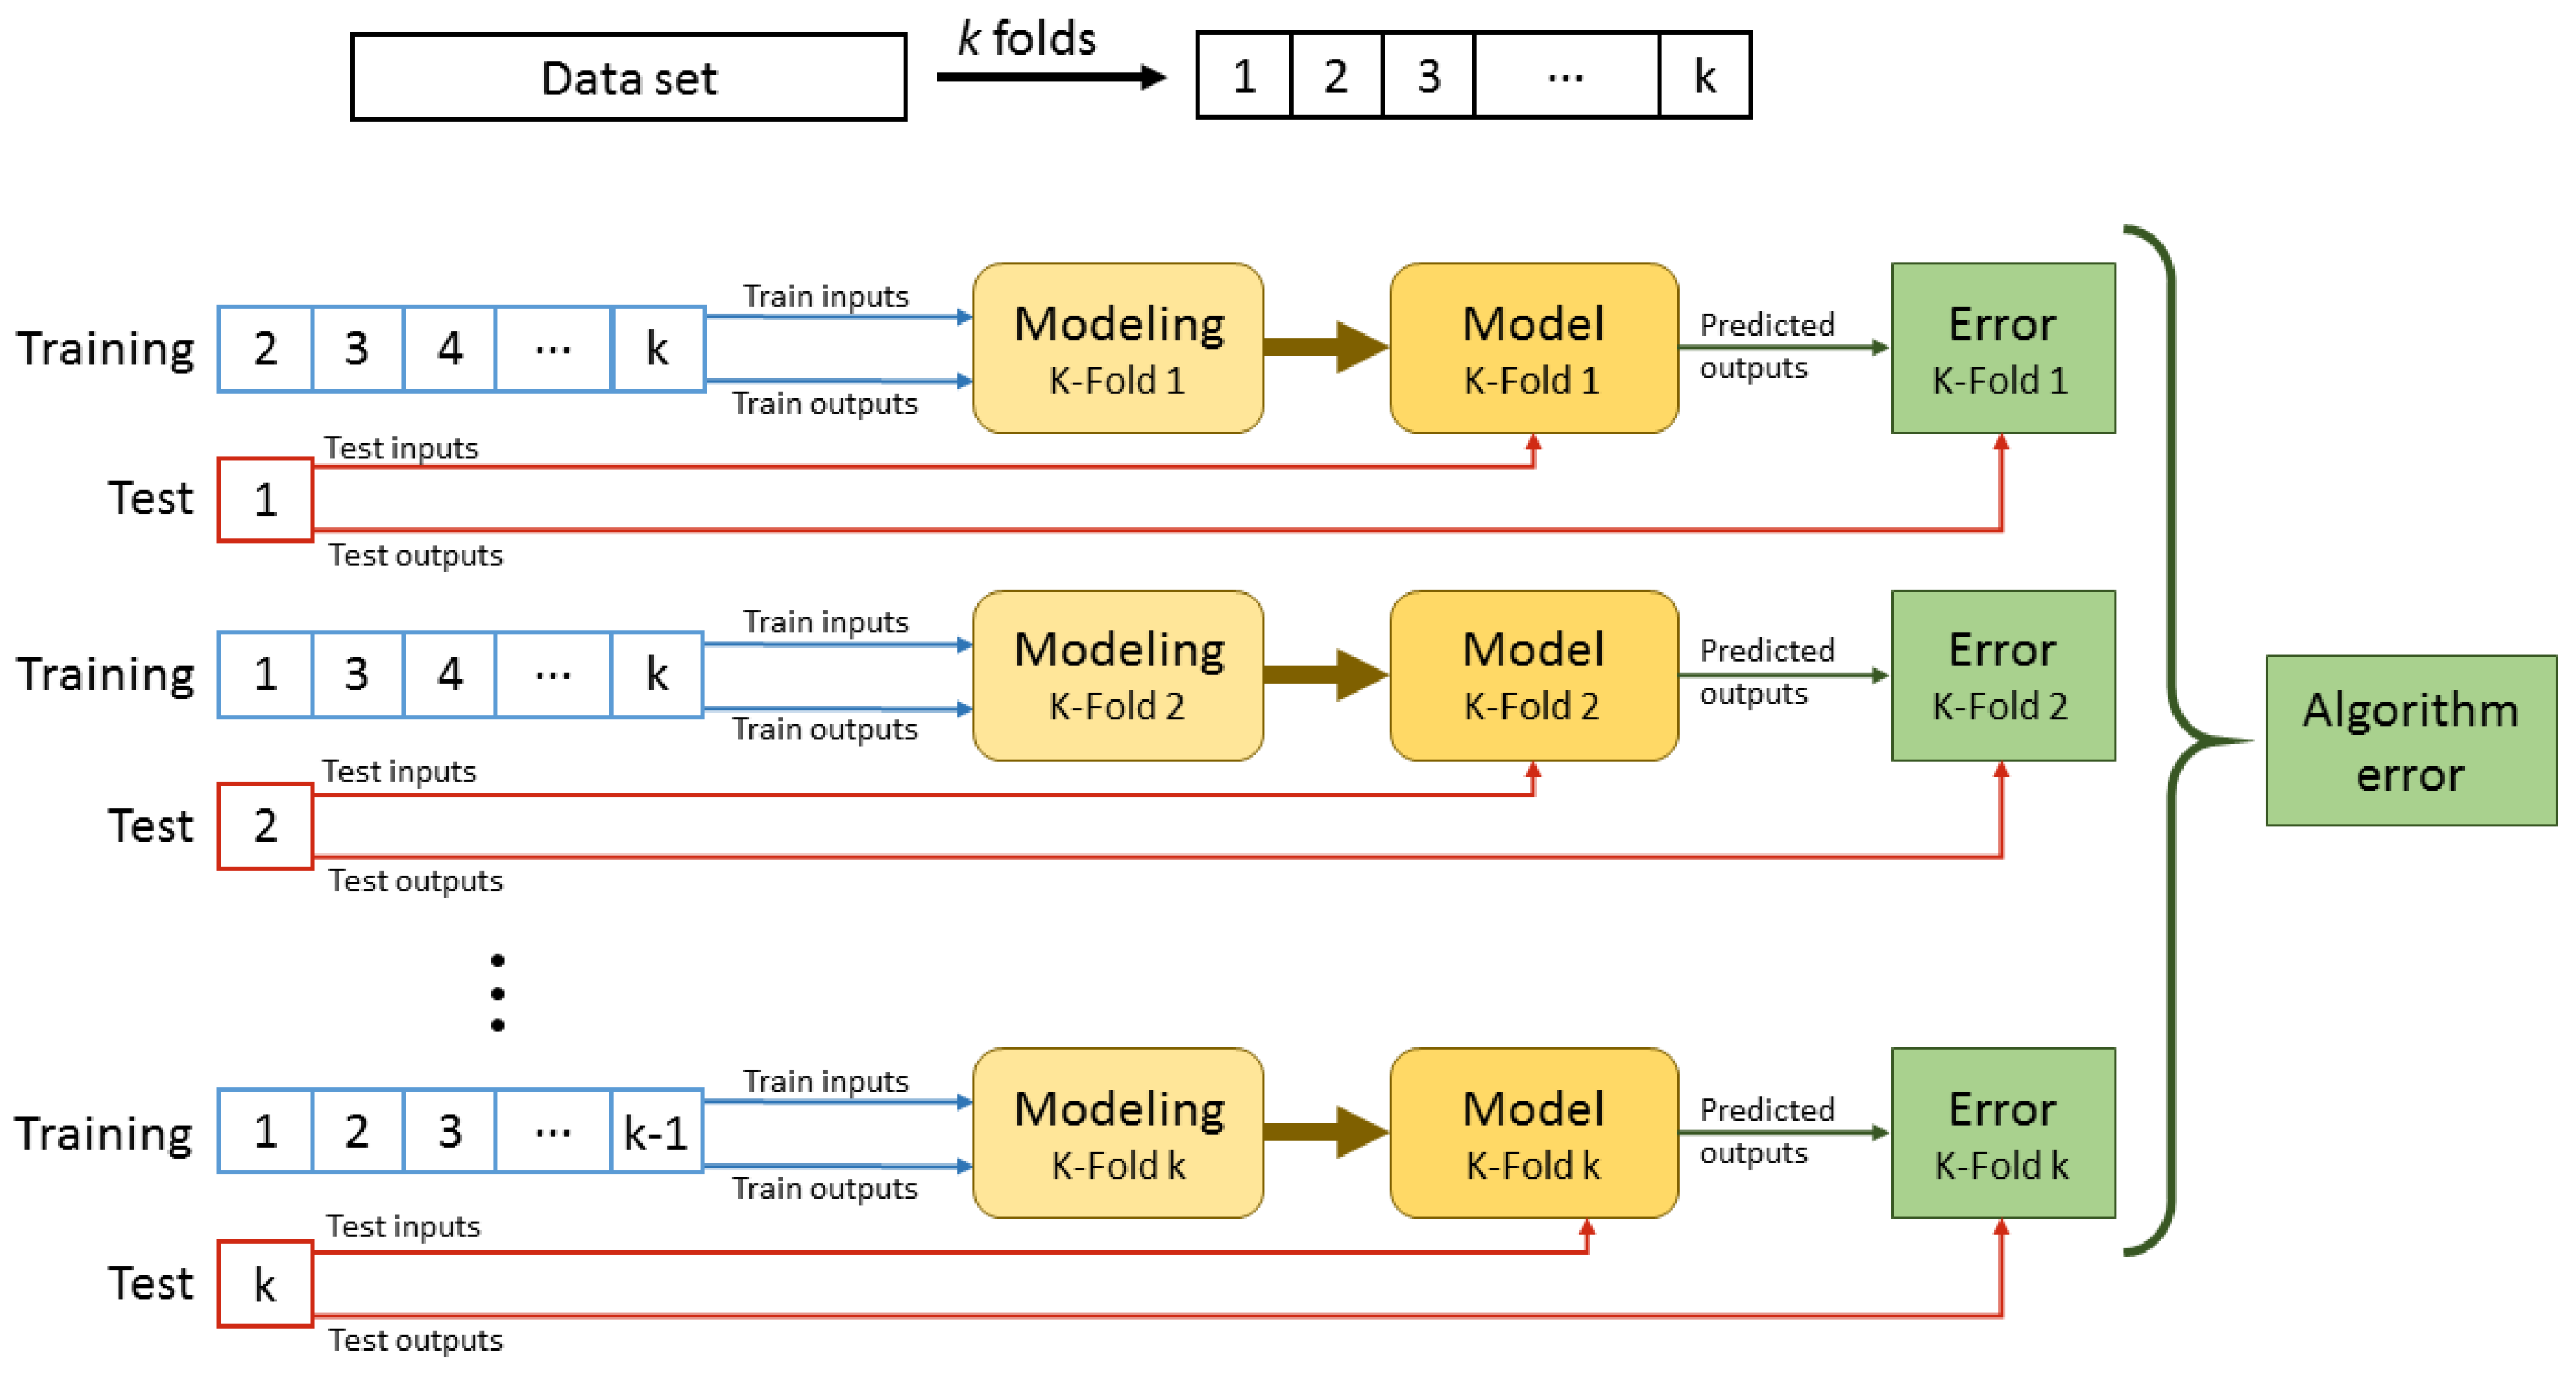
Figure 7 shows the flow diagram followed to create the hybrid model. To perform the third step, the best local model selection, K-Fold cross validation is used to divide the data subsets (cluster data) for training and testing.
Figure 8 shows this validation procedure. Once K-Fold is selected,
one k-th of the cluster data is used for testing and the rest for training. With this training data, a regression model is created with the algorithm selected, and the testing data is used to calculate the modeled output. The real testing data output and the predicted one is save in an
Error log. The training–testing procedure is repeated
k times until all the data is used as testing data. At this time, the
Error log has all the cluster data to calculate the error for each regression algorithm.
3.1. Data Processing
To prepare the dataset for the regression phase, a preprocessing of the data is carried out. This process is divided into two different steps. Firstly, the wrong samples are removed—the samples with out of range values. The second step is the normalization, which tries to minimize the training time in the next regression phase. This normalization is based on Max-Min Scaler [
34], presented in Equation (
2), which obtains new sample values (
) in a range from 0 to 1.
3.2. K-Means Algorithm
The technique chosen for clustering purposes is the K-Means algorithm, in order to define the groups present in a dataset. This algorithm is based on the location of each centroid on its corresponding hyperspace. Thus, the data with a similar nature is situated in the proximity of each centroid, comprising a cluster [
35]. The K-Means algorithm tries to define “K” number of centroids. Then, every data point is located in the nearest cluster, always trying to keep the shorter distance (usually the Euclidean) between centroids and each sample.
At the beginning, K-Means implements a training process in order to get the clusters and distribute the data samples. The velocity of this step depends of the numbers of clusters and the size of the dataset. However, the second phase, when each sample data is assigned to its clusters, is done quite fast compared with the initial phase [
36].
The procedure to train the K-Means algorithm is explained with this sequence:
A random set of data samples are chosen as the first set of centroids due to, at the beginning, the center of each group is not known;
A set of data samples will create a cluster if this set of points are the nearest to this cluster centroid;
Once the clusters are defined, it is necessary to calculate their associated centroid. These new centroids are chosen as the center of each cluster.
The last two steps are repeated until the centroids are the same two consecutive times. It means that the algorithm is converged and the K-Means algorithm will stop, the new samples can be assigned to its clusters by comparing the distance between the different centroids.
3.3. Artificial Neural Networks
An Artificial Neural Network (ANN) is an artificial intelligence technique based on the biological neurons model; the information is managed by unitary component called a neuron. Like in the biological approach, the artificial neuron is linked with other neurons. Thus, an ANN is able to calculate complex functions thanks to external data input and input from others neurons. The input for each neuron has a weight associated and each neuron has inside an activation function that defines the output.
ANN learning model is based on the fact that this kind of architecture is able to learn from experience thanks to the generalization of cases. Complex functions can be obtained through the training process. The ANN develops a characterization of a problem in order to create an answer in accordance with the input of the problem, without having knowledge about the previous situation. Therefore, the ANN can generalize new solutions from previous ones [
37].
The excitation level, also named the output of a neuron, is defined by the activation function [
38]. This output can change from 0 to −1 or from −1 to 1. A key feature of an ANN is its topology. It defines how the set of neurons is organized. Thus, the topology includes the ’placement’ of the neurons and how they are linked. The architecture of the ANN is defined by four features:
The Multi Layer Perceptron (MLP) is the basic topology of the ANN. The architecture is organizes as follows: input, a set of hidden layers, output. When the information arrives from the same source to a set of neurons, they belong to the same layer. The information can go from the inputs of ANN or from a previous layer to the next ones. In the MLP, the information from neurons in a layer goes to the same destination—the next layer or the output of the MLP.
Usually, the activation function of the output layer is a specific activation function that depends on the application of the ANN, one of the most common activation functions is the ‘linear’ one.
3.4. Polynomial Regression
A model defined as summation of several linear functions is known as a polynomial regression model. The amount of basis functions used in the polynomial regression is associated to the number of inputs and is in concordance with the polynomial degree used.
When the first degree is defined, the polynomial can be defined as Equation (
3). If the degree increases, the model becomes more complex. A second degree polynomial is shown in Equation (
4).
3.5. Support Vector Machines for Regression
The supervised machine learning algorithm known as the Support Vector Machine (SVM) is commonly used for classification. The original SVM algorithm needs only few changes to allow use for regression problems, and this new technique is called Support Vector Regression (SVR). The SVR performs a nonlinear transformation of the original data into a high-dimensional space, and it uses linear regression on this mapping data to calculate the desired output.
In this research, the Least Square SVR (LS-SVR) is used [
39], it is a modified algorithm based on SVR that uses the Least Square to minimize the objective function [
39]. This modification provides a comparable generalization performance to the SVR [
40].
The LS-SVR regression algorithm replaces the insensitive by a classical squared loss function. Equation (
5) is used to solve the linear LarushKuhn–Tucker.
where:
LS-SVR only needs to adjust two parameters: the weight vector
and the kernel width
[
39].
5. Conclusions and Future Works
The model created in this research predicts the variation in the hydrogen flow consumption by a fuel cell in an early future. The model uses the desired generated power at the output of the fuel cell, the current generated power, and current hydrogen inlet flow as inputs, and it predicts the variation in the inlet flow as output.
A power converter is used to stabilize the electrical voltage in the output of the fuel cell. It produces the desired voltage for the specific application connected to the fuel cell. As the voltage of the fuel cell varies with the different working points, this power converter allows to control only the electrical power produced by the fuel cell; the output voltage of the converter will be constant all the time.
The bioinspired hybrid model created combines different regression algorithms with clustering to increase the prediction performance of the model. The final model includes three local models with an LS-SVR in each one, and the error values with a validation dataset show that it achieved good results. The NMSE was , and the MAE was .
As future works, it is possible to mention the integration of this model as a part of the control system. This configuration would allow to create a kind of predictive control that could increase the efficiency of the fuel cell system, as it would predict the reaction of the system.

 ,
, 


