
Temporal Evolution of Cooling by Natural Convection in an Enclosed Magma Chamber


1
Department of Mechanical Engineering, Faculty of Engineering, University of Talca, Curicó 3460000, Chile
2
Geoscience Research Institute, University of Montemorelos, Montemorelos 67510, Mexico
3
Department of Earth and Biological Sciences, Geoscience Research Institute, Loma Linda University, Loma Linda, CA 92350, USA
*
Author to whom correspondence should be addressed.
Processes 2022, 10(1), 108; https://doi.org/10.3390/pr10010108
Submission received: 6 December 2021
/
Revised: 23 December 2021
/
Accepted: 29 December 2021
/
Published: 5 January 2022
(This article belongs to the Section Process Control and Monitoring)
Abstract
:This research numerically studies the transient cooling of partially liquid magma by natural convection in an enclosed magma chamber. The mathematical model is based on the conservation laws for momentum, energy and mass for a non-Newtonian and incompressible fluid that may be modeled by the power law and the Oberbeck–Boussinesq equations (for basaltic magma) and solved with the finite volume method (FVM). The results of the programmed algorithm are compared with those in the literature for a non-Newtonian fluid with high apparent viscosity (10–200 Pa s) and Prandtl (Pr = 4 × 10⁴) and Rayleigh (Ra = 1 × 10⁶) numbers yielding a low relative error of 0.11. The times for cooling the center of the chamber from 1498 to 1448 K are 40 ky (kilo years), 37 and 28 ky for rectangular, hybrid and quasi-elliptical shapes, respectively. Results show that for the cases studied, natural convection moved the magma but had no influence on the isotherms; therefore the main mechanism of cooling is conduction. When a basaltic magma intrudes a chamber with rhyolitic magma in our model, natural convection is not sufficient to effectively mix the two magmas to produce an intermediate SiO2 composition.
1. Introduction
To understand the processes that occur in magma chambers it is necessary to use multidisciplinary knowledge from geology, fluid dynamics and engineering [1]. Rheology governs processes such as the rise of magma, the mixing of various batches, the settling of crystals and the transport of xenoliths [2]. Magmas have a range of temperatures and chemical compositions that affect fluid convection and elemental diffusion [3]. Basaltic magma is usually treated as a quasi-Newtonian fluid, but several laboratory experiments have shown that, even for low viscosity, quasi-Newtonian behavior cannot be applied [4]. Instead, basaltic magma behaves like a Bingham fluid [5,6] or a power law fluid [4]. A Bingham fluid behaves like a rigid body when subjected to low stresses but flows like a viscous fluid under higher stresses. In this paper, we include a non-Newtonian model for the magma.
Modeling convective cooling in a magma chamber must take into account an estimate of its size and shape, as well as other geometric, thermodynamic, thermophysical and compositional factors that influence the history of pluton cooling [7,8]. Rectangular shapes approximate a sill-like intrusion or a laccolith. The oblate ellipsoid is a common form for many large chambers [9]. In this paper we study both simple rectangular and elliptical shapes.
Convection in a magma chamber [10,11] due to heating from below and cooling from above is a special case of natural convection called Rayleigh–Bernard (RB) convection [12]. For Rayleigh values higher than 1703, the conditions are thermally unstable and advection occurs. For Rayleigh numbers above 5 × 10⁴, fluid motion evolves through many different patterns before becoming turbulent [13]. Correctly calculating a Rayleigh number based on the temperature (RaT) due to thermal coupling between the magma and host is complicated. A more realistic method uses the flux-based “magmatic Rayleigh number” (RaF) [14] for natural magma convection in a chamber. In this work the RaF is used.
A typical Rayleigh number for real chambers may be in the range of 1 × 10⁹–1 × 10¹⁷, or 1 × 10⁶–1 × 10⁹ [15] for smaller chambers. Magmas have high Prandtl numbers of 1 × 10³–1 × 10⁸ [16], implying that the momentum diffusion is much greater than thermal diffusion. Magmas have an even higher Lewis number of 1 × 10⁴–1 × 10¹³ [17], which means that heat flow is much greater than chemical molecular diffusion. In this work, these observations about the dimensionless numbers will be very important in analyzing the simulation results.
This work studies the cooling of basaltic magma by RB natural convection inside a closed chamber located in the Peruvian Coastal Batholith (PCB). The novelty of this study has two main aspects: (1) the development of a mathematical model of RB convection that includes experimental data for rheology of basaltic magma as it just begins to crystallize and (2) computational simulations of magma chambers that take into account geological aspects of the Humay unit of the PCB. The study describes the magma flow pattern and temperature distribution inside the chamber when the crystal volume in the magma is low. In this work we use a power law non-Newtonian model. The constants for our mathematical model of non-Newtonian viscosity are obtained from experimental data for magma cooling over the range 1498–1448 K [4]. Calculations at ambient pressure indicate that the liquidus and solidus temperature of basaltic magma are approximately 1503 and 1223 K respectively [18]; therefore, if the magma is in equilibrium, it has already begun to solidify at 1498 K. The temperature range of 1498–1448 K is in a higher range where the magma is mostly liquid and has just begun to crystalize. The mathematical model includes the interaction of the magma with the host rock where only conduction is considered. The simulations were run until the temperature at a central point located within the chamber dropped to 1448 K.
The geological aspects of the simulation are considered in detail in Section 2.1. In Section 3.2.1 and Section 3.2.2, the cooling time of magma as a function of the shape of the chamber is studied. In Section 3.2.3, a hypothetical case where a basaltic magma intruded into a rhyolitic magma is also simulated.
Our mathematical model is focused on solving the movement of the magma and does not include the phase change enthalpy in the energy equation. The phase change enthalpy normally is included in mathematical models as an additional term in the energy equation, which is a function of phase change [15,19,20]. Cooling times that do not include the phase change enthalpy are always shorter so the cases solved in this work yield the minimum cooling time for liquid in a magma chamber. These considerations mean that there are two assumptions made on which our analysis are based: (1) the streamlines and the velocities with which the magma moves are always the highest that can be found for each chamber studied and therefore, (2) since the phase change function and the enthalpy of solidification are not considered, the cooling times for each chamber studied are the shortest. This study does not consider water or vapor advection in the host rock which could decrease the cooling times of the magma.
2. Materials and Methods
2.1. The Physical and Geological Situation
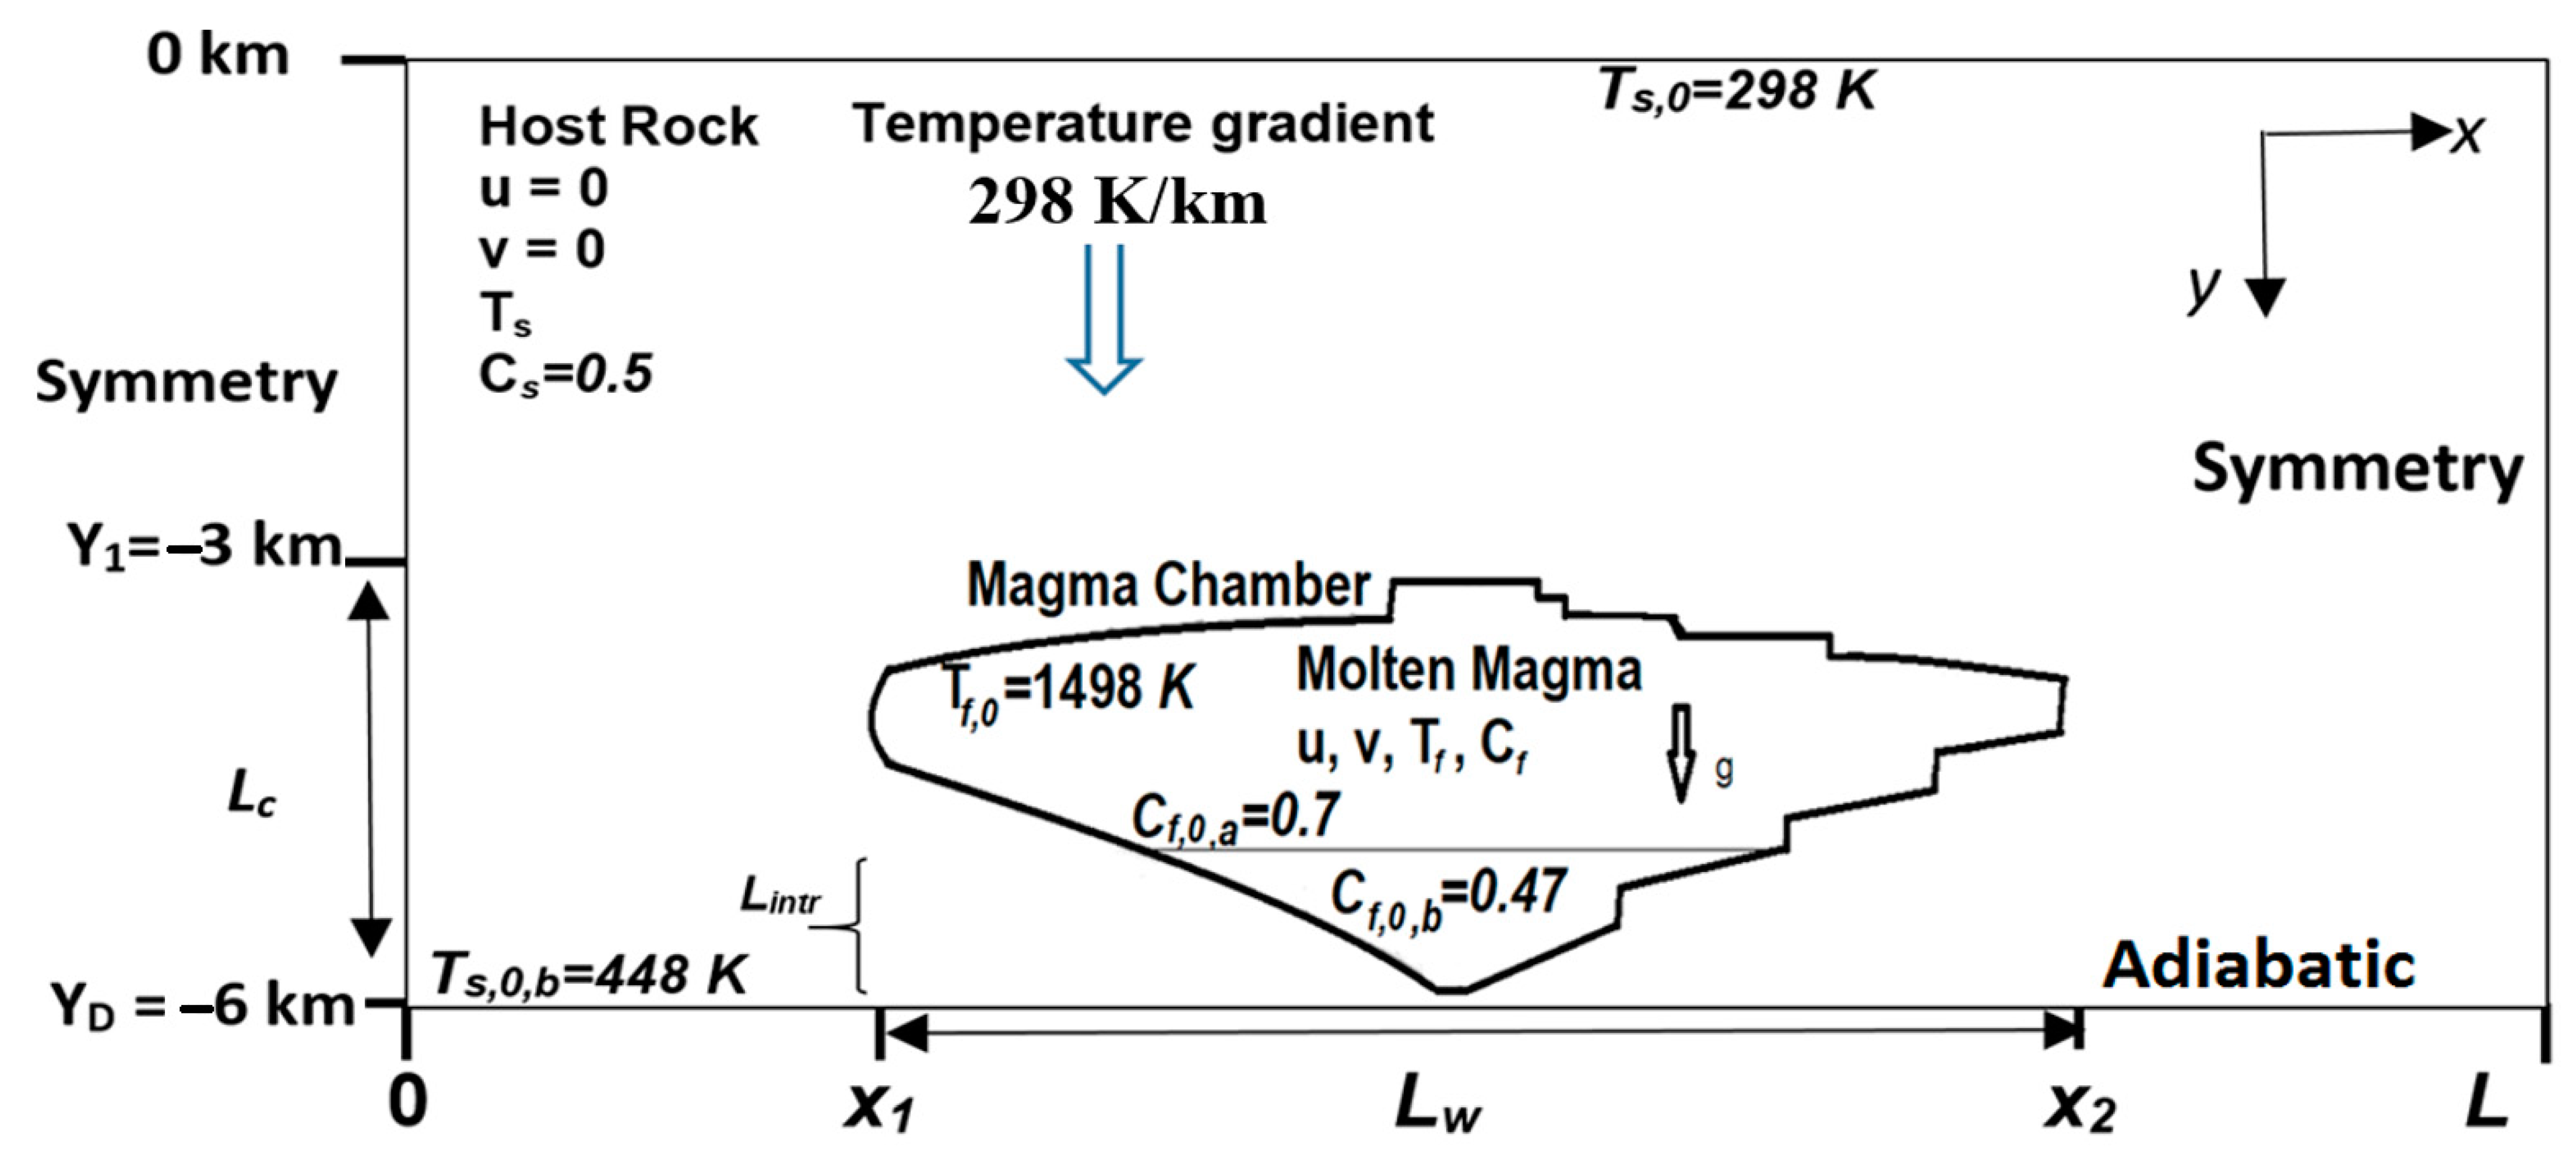
Three chamber shapes are simulated: rectangular (case 1), hybrid (case 2) and quasi-elliptical (case 3) [21]. In all cases, the chamber has the same volume of 18 km3, but varying widths. Figure 1 displays the magma chamber for the most complex case as suggested by previous work in the PCB (Humay unit) [22,23]. Geological data indicate that PCB plutons are commonly 5 km thick or less [24,25]. Analysis of saline inclusions in the PCB Linga complex suggests magma crystallization pressures between 800 and 900 bar, indicating that the depth to the top of the magma chamber was between 2.9 and 3.2 km from the Earth’s surface when crystallizing [22]. In this work we locate the top of the chamber at 3 km from the surface and use a maximum thickness for the chamber of 3 km (Lc = 3000 m).
The basaltic magma inside the chamber is initially stationary with initial temperature of .
This paper uses an initial temperature gradient in the host rock of 25 K/km [26] which corresponds to Ts,0 = 298 K at the upper boundary (surface) and Ts,0,b = 448 K at the lower boundary. The lower edge of the computational domain (chamber and host rock) is considered adiabatic. This could occur if the cooling below the bottom boundary of the model together with the cooling of the modeled magma chamber would lead to a small temperature gradient near the bottom boundary.
The host rock for the PCB is primarily basaltic andesite with SiO2 silica concentration of 50–55 wt%; thus, Cs = 0.5 is used in all simulations. It is common for basaltic magma to have an SiO2 concentration of 45–50 wt% and rhyolitic magma of 65–75 wt% SiO2 [18]. Section 3.2.3 presents the simulation results of a chamber with two magma compositions. Initially SiO2 in the lower zone of the chamber is and in the upper zone , corresponding to basaltic magma intruding rhyolitic magma. This means that at the beginning of the intrusion simulation the chamber contains mostly rhyolitic magma, but with basaltic magma at Lintr = 1000 m at the bottom, with all at the same temperature.
2.2. Mathematical Model
A mathematical model for transient two-dimensional natural convection for non-Newtonian fluid flow is now presented. The relation between density and pressure is simplified by the so-called Oberbeck–Boussinesq approximation [27] which means that density can only change with temperature and hence flow is incompressible, assuming no volatiles are present. The mathematical model assumes that the crystals in the magma follow the flow path of the fluid and there is no settling. The magma stops moving when there is no more convection, which occurs when it reaches around 40% crystals (mush state). The system of equations presented corresponds to the one used generally for laminar flow and is suggested for RB convection for Ra < 1 × 10¹⁴ by several authors [15,27]. The partial differential equations (PDEs) for mass conservation and momentum for a melt are:
where is the density of the reference magma, is gravity and is the volumetric expansion coefficient. The is the reference temperature variation which is related to the average magma temperature in the y direction. This difference is calculated numerically with the equation, , where ny is the total node number for the magma in the y direction. In these Equations (1)–(3) and the following equations, the subscript f is used for the fluid. The energy equation is given by:
The equation for mass concentration of SiO2 in magma is:
In simulations, these equations are solved by coupling them together. This means that in each time step the fluid velocity is used to calculate the temperature, which in turn is used to calculate the non-Newtonian viscosity and the velocity in the next iteration until the convergence criterion imposed for the time step is fulfilled. Section 2.3 gives more details of the procedure to solve the governing equations for the magma.
The thermal diffusion equation is used to calculate the conduction in the host rock:
The subscript s is used for the solid and indicates properties of the host rock. The silica content SiO2 of the host rock is considered to be constant at Cs = 0.5.
According to the power law model, the equations for the shear stress and shear rate for a non-Newtonian liquid are [28]:
Apparent viscosity was defined by the Oswald de Waele power law in terms of the power law index n [29]:
where K is a constant called the consistency index and is the activation energy defined by a temperature function calculated as follows:
The constants E0 and a were calculated from experimental data for basaltic magma at four temperatures: 1498, 1473, 1458 and 1448 K [4]. The resulting values used in the non-Newtonian model of Equations (9) and (10) for cooling of basaltic magma are: E0 = 1.5 × 10⁶ J/mol, a = −994.4827 J/mol K, K = 15 Pa s and n = 0.58. These parameters used in the range 1498–1448 K are constants for the non-Newtonian power law model and do not depend on either time or temperature. This means that the effects of crystals in the movement of the basaltic magma are included.
The velocity scale in the fluid, which coincides with the maximum velocity of the magma, is defined as:
where is the maximum temperature variation which is related to thermal boundary layer Lcl (see Equation (22)), g is gravity and (1/K) is the volumetric expansion coefficient. Independent and dependent dimensionless variables are defined as:
The dimensionless Prandtl, Lewis and Rayleigh numbers (magmatic) are calculated as follows:
The dimensionless PDE system for the conservation of mass, momentum, energy and SiO2 are:
The dimensionless transient heat diffusion equation for the container (host rock) is:
In order to find the thickness of the thermal boundary layer Lcl and the magmatic Rayleigh number Ra, the method proposed by [14] for cooling lava lakes was used. This method assumes that the host regime determines the total flux of the host rock/chamber system. The flux-based Rayleigh number RaF is related to the temperature-based version RaT by the Nusselt number Nu, as follows:
The calculated heat flux F is related to the total flux by conduction between the upper and lower surfaces of the magma chamber. The Nusselt number Nu can be used to relate the total heat flux by conduction and convection in the host rock/chamber system. This dimensionless number is the ratio of the total heat flux F across a convective system characterized by a particular temperature difference () to the heat flux that would be realized by conduction assuming the same temperature difference. The Nusselt number and the flux-based Rayleigh number RaF can be related by an empirical correlation for the RB case () [14]. The earlier equations allow one to obtain the total thermal boundary layer thickness Lcl, their temperature difference and the magmatic Rayleigh number Ra.
The properties and parameters used in the simulations are listed in Table 1. It is interesting to note the close match between the values for maximum velocity calculated in this work ( = 1.4 × 10⁻³ m/s) and those calculated by the correlation proposed by [17] for magma chambers heated from below ( = 0.9 × 10⁻³ m/s).
2.3. Numerical Procedure
The coupled PDEs system is solved numerically with the classical finite volume method proposed originally by [32] and used widely [33,34,35]. The algorithm programmed in FORTRAN 77 computer code solved each governing equation which was treated in the generalized form (23). This equation contains non-steady state, convection, diffusion and linearized source terms:
The integration over time is performed with an explicit Euler scheme.
At each time step , the system of discretized nodal equations for each main variable (φ = U, V, , C*) is solved iteratively (internal iterations) with a combination of the alternating tridiagonal matrix algorithm (TDMA) and the Gauss–Seidel method. The coupling of these main variables (external iterations) uses the SIMPLE (Semi-Implicit Linked Equations) method. In order to improve the convergence, this procedure uses under-relaxation coefficients that convert the implicit in a semi-implicit method. For the cases studied in this paper, relaxation coefficients of 0.25 are adopted for the velocity components U and V, while 0.8 is adopted for pressure. For temperature and concentration, it is not necessary to relax variables. For more details about the finite volume method and the SIMPLE algorithm, consult [36].
Convergence criterion for the residuals of the mass conservation equation of 1 × 10⁻⁴ was used in all simulations. The convergence criteria for the φ variables for the internal iteration k, in the control volume (i,j), in eachdimensionless time step ( = 10), are:
The calculations in the first (external) iteration were carried out using Newtonian behavior in order to find a velocity field that would allow the calculation of the apparent viscosity, find its average value and consequently adjust the pressure gradient, as proposed by [32].
The programmed algorithm required that when the control volume had the thermal properties of a solid, the viscosity was infinite (1 × 1030 Pa s) and the velocities were zero (m/s). No convection is assumed in the volume occupied by the host rock nor in the solidified portion of melt below the solidus temperature (1223 K), and diffusion becomes the only transport mechanism.
In all three cases studied, the simulation ends when the control volume in position x = 12,000 m and y = −4500 m (Pm) meets the condition, . In order to compare reference and simulations results the following equation for the relative error (RE) was used [37]:
In Equation (27), xp and yp are the abscissa and ordinate of the graphs used to obtain the RE.
The calculation of the relative error is carried out by numerical integration (Equation (27)) on the functions obtained by numerical interpolation with the discrete values from the finite volumes algorithm. This is a more precise and rigorous method for calculating the REs between results when compared to the one that is generally used and that will consider only a discrete number of comparison points. In this work, REs were up to 30% higher when the results of Equation (27) were compared with those of the classic RE equation that uses discrete points without integration.
2.4. Mesh Study
In order to optimize the calculation times with a mesh that had no effect on the results, a mesh study with four meshes was carried out. The meshes used and the results are shown in Table 2.
All meshes are uniform except mesh 3, which was refined in the chamber area. The physical situation corresponds to case 1 with a rectangular chamber. Some boundary conditions to reach the steady state were simplified by using a constant dimensionless temperature of in the host rock, an initial temperature of in the magma chamber and a constant time step of = 1 × 10⁻². The mathematical model assumed and . Since the driving force for natural convection is gravity acting on the Y coordinate, it is assumed that the velocity gradients would be greater in the V component of the velocity and hence the mesh convergence is studied analyzing the V profile once all variables () have converged. This is verified after . To calculate the RE, the dimensionless profiles in position V (2.8–5.2; 0.5) obtained with each mesh were compared with those of the denser mesh (mesh 1). The results shown in Table 2 indicate clear convergence when the mesh is denser. Mesh 5 with 6500 nodes distributed over the entire computational domain has a RE of 2.0933. By increasing the nodes to 9360 (mesh 4) the RE decreases to 1.1756, which is approximately 10 times smaller than results found for mesh 5. The greatest gradients occur in the chamber where there is natural convection of the magma, while in the host rock the diffusion produces smaller gradients. This leads us to formulate a mesh with a higher number of nodes in the chamber zone and a lower number of nodes in the host rock. Mesh 3 keeps the same quantity of nodes from mesh 2 in the chamber area, but decreases its number in the host rock zone. The RE is only 0.1283 even when it has about one third of the total nodes of mesh 1. The same happens with the computational time which decreases from 13,180 to 4393 s. Hence, a non-uniform mesh (mesh 3) of 196 × 58 was used in the simulations.
3. Results
3.1. Validation
In order to validate our computer code, we here reproduced the results obtained from [38]. Transient natural convection cooling (RaT = 1 × 10⁶) of a highly non-Newtonian fluid with a high Prandtl number (4 × 10⁴) inside a square cavity surrounded by a solid was studied numerically. The calculated domain was 0.2 m in x and y directions that included a Plexiglas contour of 0.01 m thickness. Initially the fluid was static (U = V = 0) and both fluid temperatures and Plexiglas were constant at T0 = 45 °C (). In order to compare published results with those obtained using our algorithm, two cases were used. In the first case a constant temperature of Tw = 25 °C () outside the container was used. In the second case the same temperature Tw = 25 °C () on three boundaries was imposed, but an adiabatic condition at the bottom boundary was used. The dimensionless mathematical model introduced in Section 2.2 was used to simulate the mathematical model (using and ) and FVM proposed in this work. In both cases, the calculated domain was discretized with five uniform meshes of 40 × 40, 180 × 180, 120 × 120, 60 × 60 and 40 × 40 nodes and three-time steps , of 1 × 10⁻⁴, 1 × 10⁻³ and 1 × 10⁻² (in dimensionless time). Simulations were carried out until reaching 1785s ( = 1165). To calculate the apparent viscosity, the following equation was used: 10−4
where the temperature must be entered in °C. The apparent viscosity varied from approximately 10 to 200 Pa s for a cooling range of 45–25 °C. These viscosity values are close to those of basaltic magma at temperatures between 1498 and 1473 K [4] and a Prandtl number of 4 × 10⁴ is close to the basaltic magma value [39]. It is important that the Prandtl number is close to that of basaltic magma since the theory of similarity between dimensionless numbers allows prediction of the same behavior of both fluids in terms of the amount of movement and heat transfer. This is very important for the validation of magmatic flows since the high temperatures at which they occur make their study very difficult in the laboratory. The two previous characteristics of the reference problem (viscosity and Pr number) allow us to confirm that the dimensionless solution for speeds and temperatures is comparable to those that occur in basaltic magmas. In Figure 2 velocity vectors and isotherms from [38] are compared to those obtained in the present work after 1785 s using a mesh with 180 × 180 nodes.
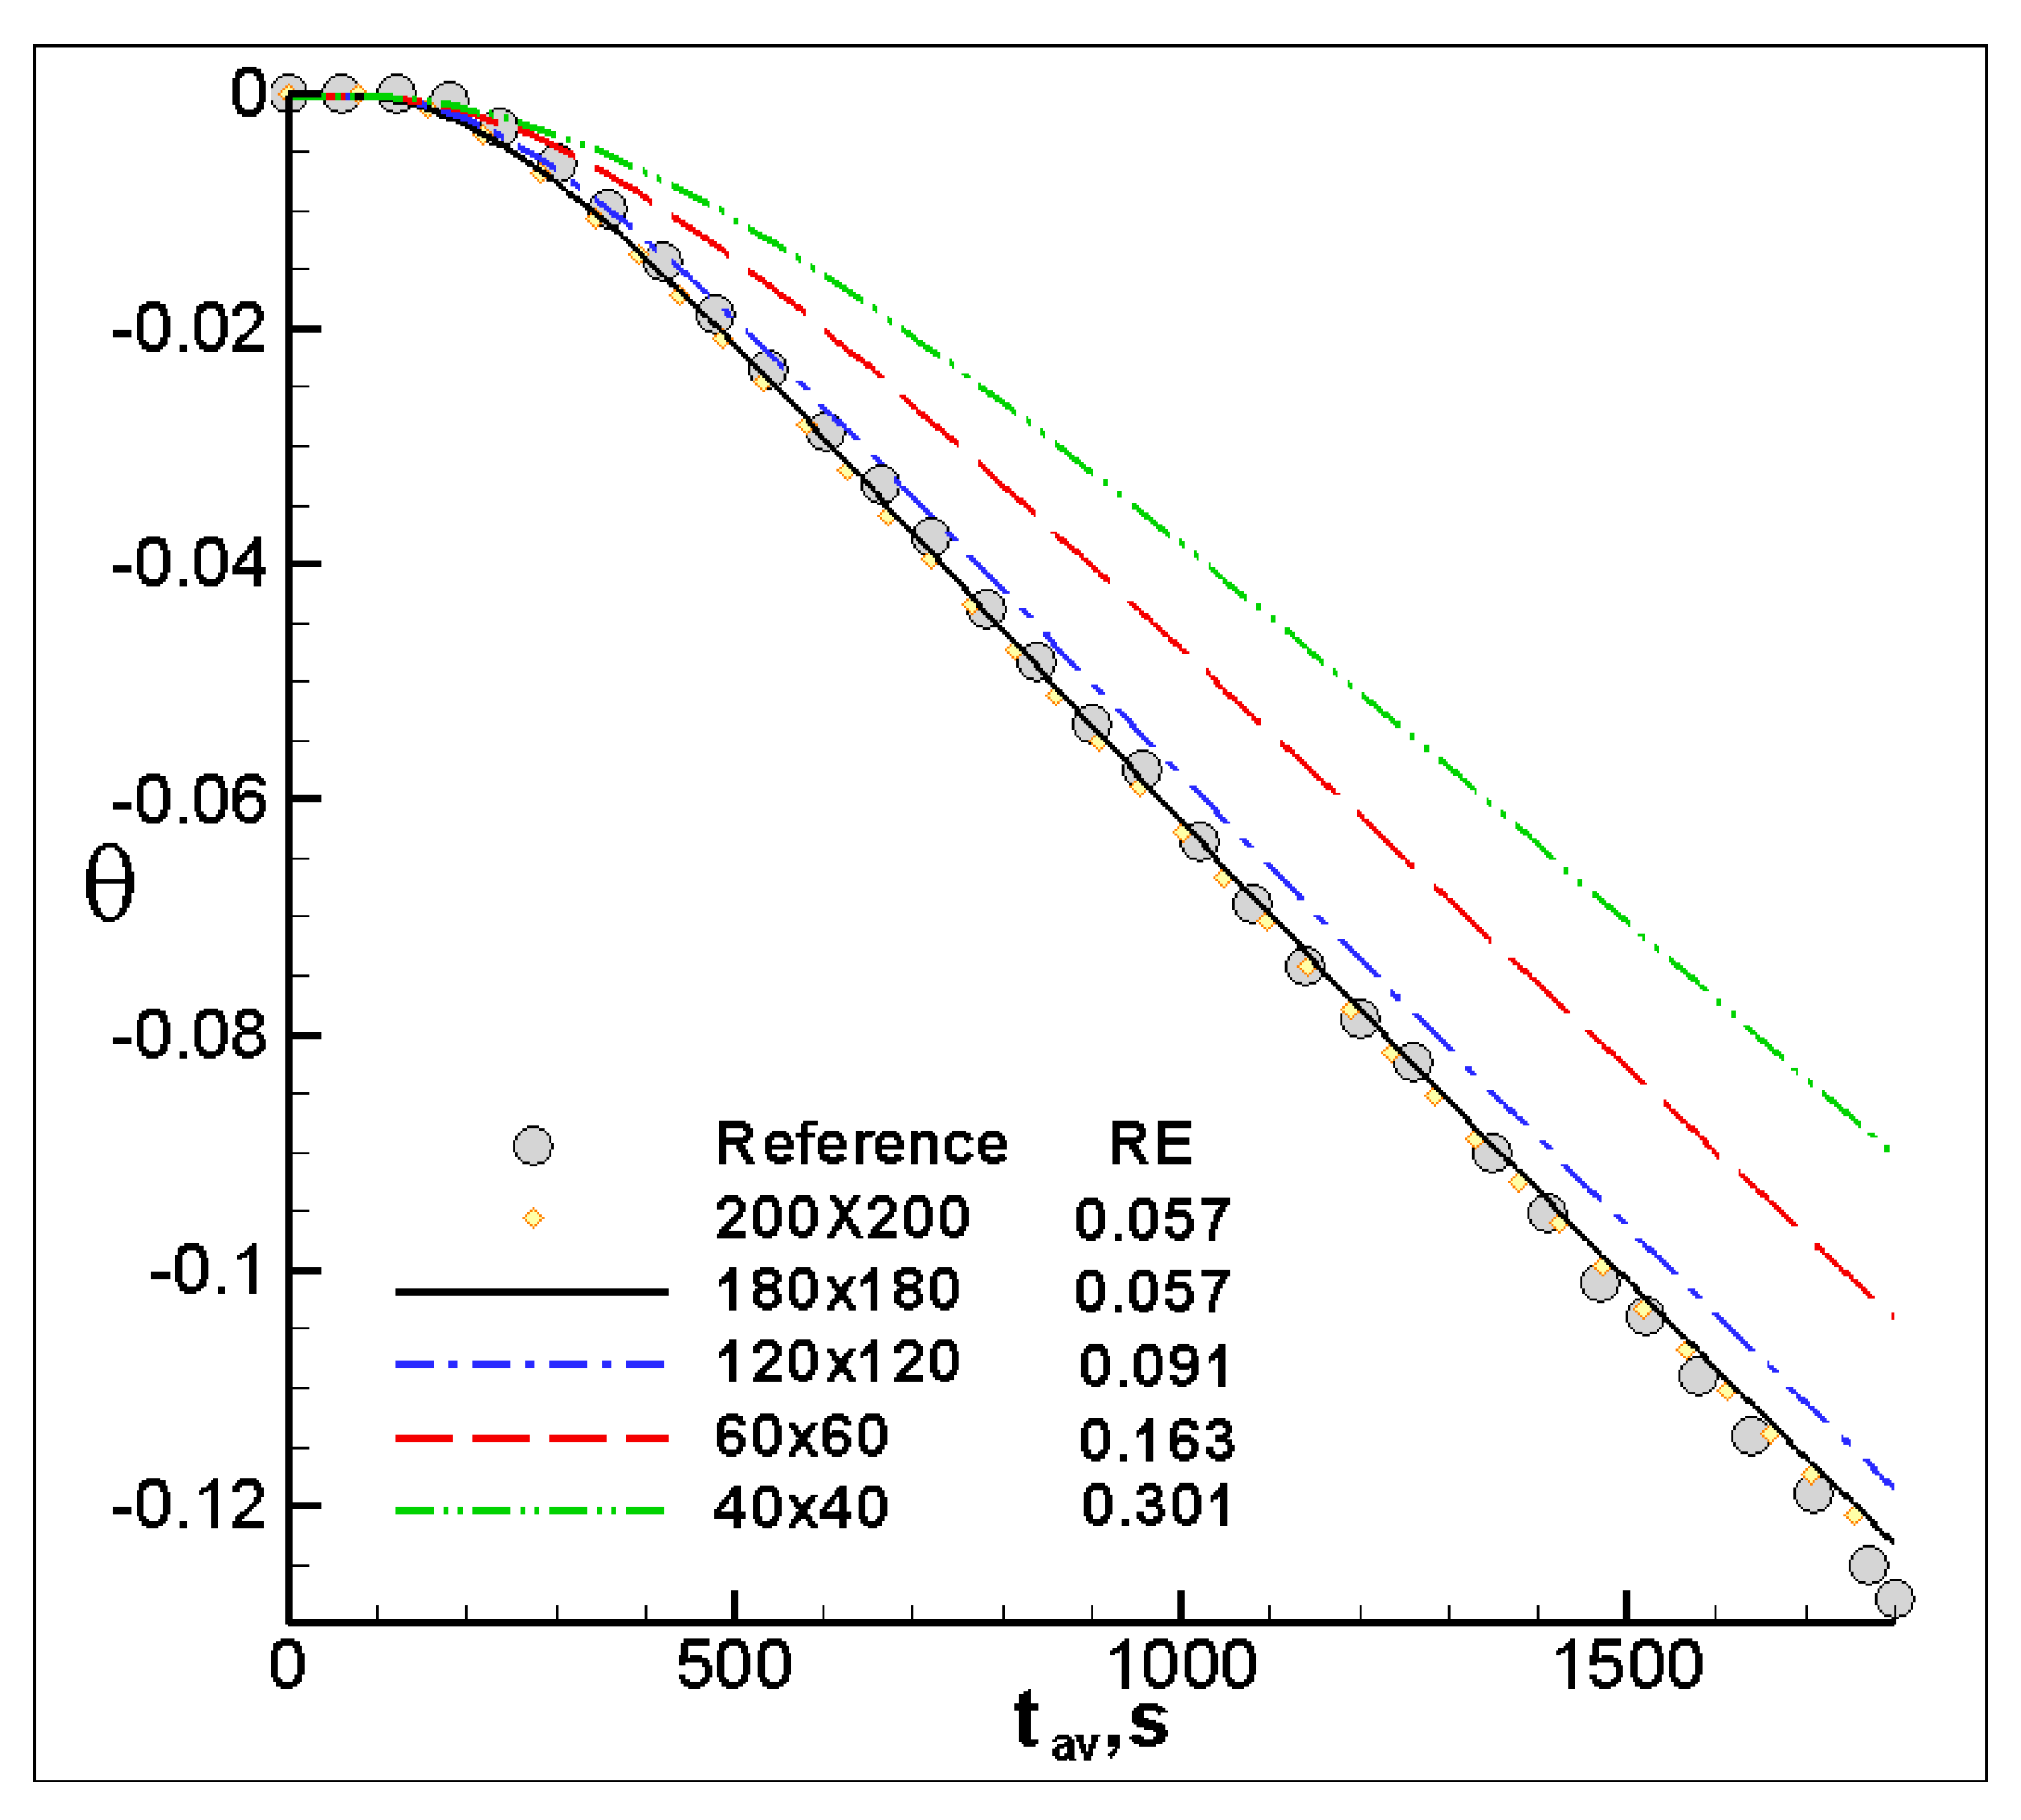
Both the streamlines and the temperature values behaved similar to those in [38] in the two cases compared. The effects of the buoyancy term on current lines and temperatures can be clearly seen. Figure 3 displays the dimensionless average temperatures of the fluid as a function of time for five meshes for the first case study in this section. The results using less refined meshes show RE above 0.16. There is a tendency toward a single result that coincides with that obtained by [38] when the mesh is refined.
The calculated average values with 200 × 200 and 180 × 180 nodes follow the trend obtained from the reference, but there are small deviations which increase slightly at the end of the calculation period. The RE of 0.057 which is the same for both meshes indicates a very good approximation and that the algorithm has converged to its final solution.
The code used to obtain results for the first case in this section can be obtained from the Supplementary Materials (https://bclausen.net/Zambra/Program_Validation.txt. Last access: 20 December 2021).
3.2. Results and Discussion
Three chamber shapes with the same 18 km3 volume are simulated (where the third dimension z is considered to be of unitary magnitude). The cases studied are: rectangular (case 1), hybrid (case 2) and quasi-elliptical (case 3). The last two could have been formed by geological phenomena that have been detailed by [21]. In all cases the simulation was carried out until the temperature at point Pm (12,000 m; −4500 m) was lower than 1448 K. This point is in the center of the rectangular chamber in case 1.
Code used to obtain results for case 3 can be obtained from the Supplementary Materials (https://bclausen.net/Zambra/Program_Chamber_case3.txt. Last access: 20 December 2021).
3.2.1. Temperature Results
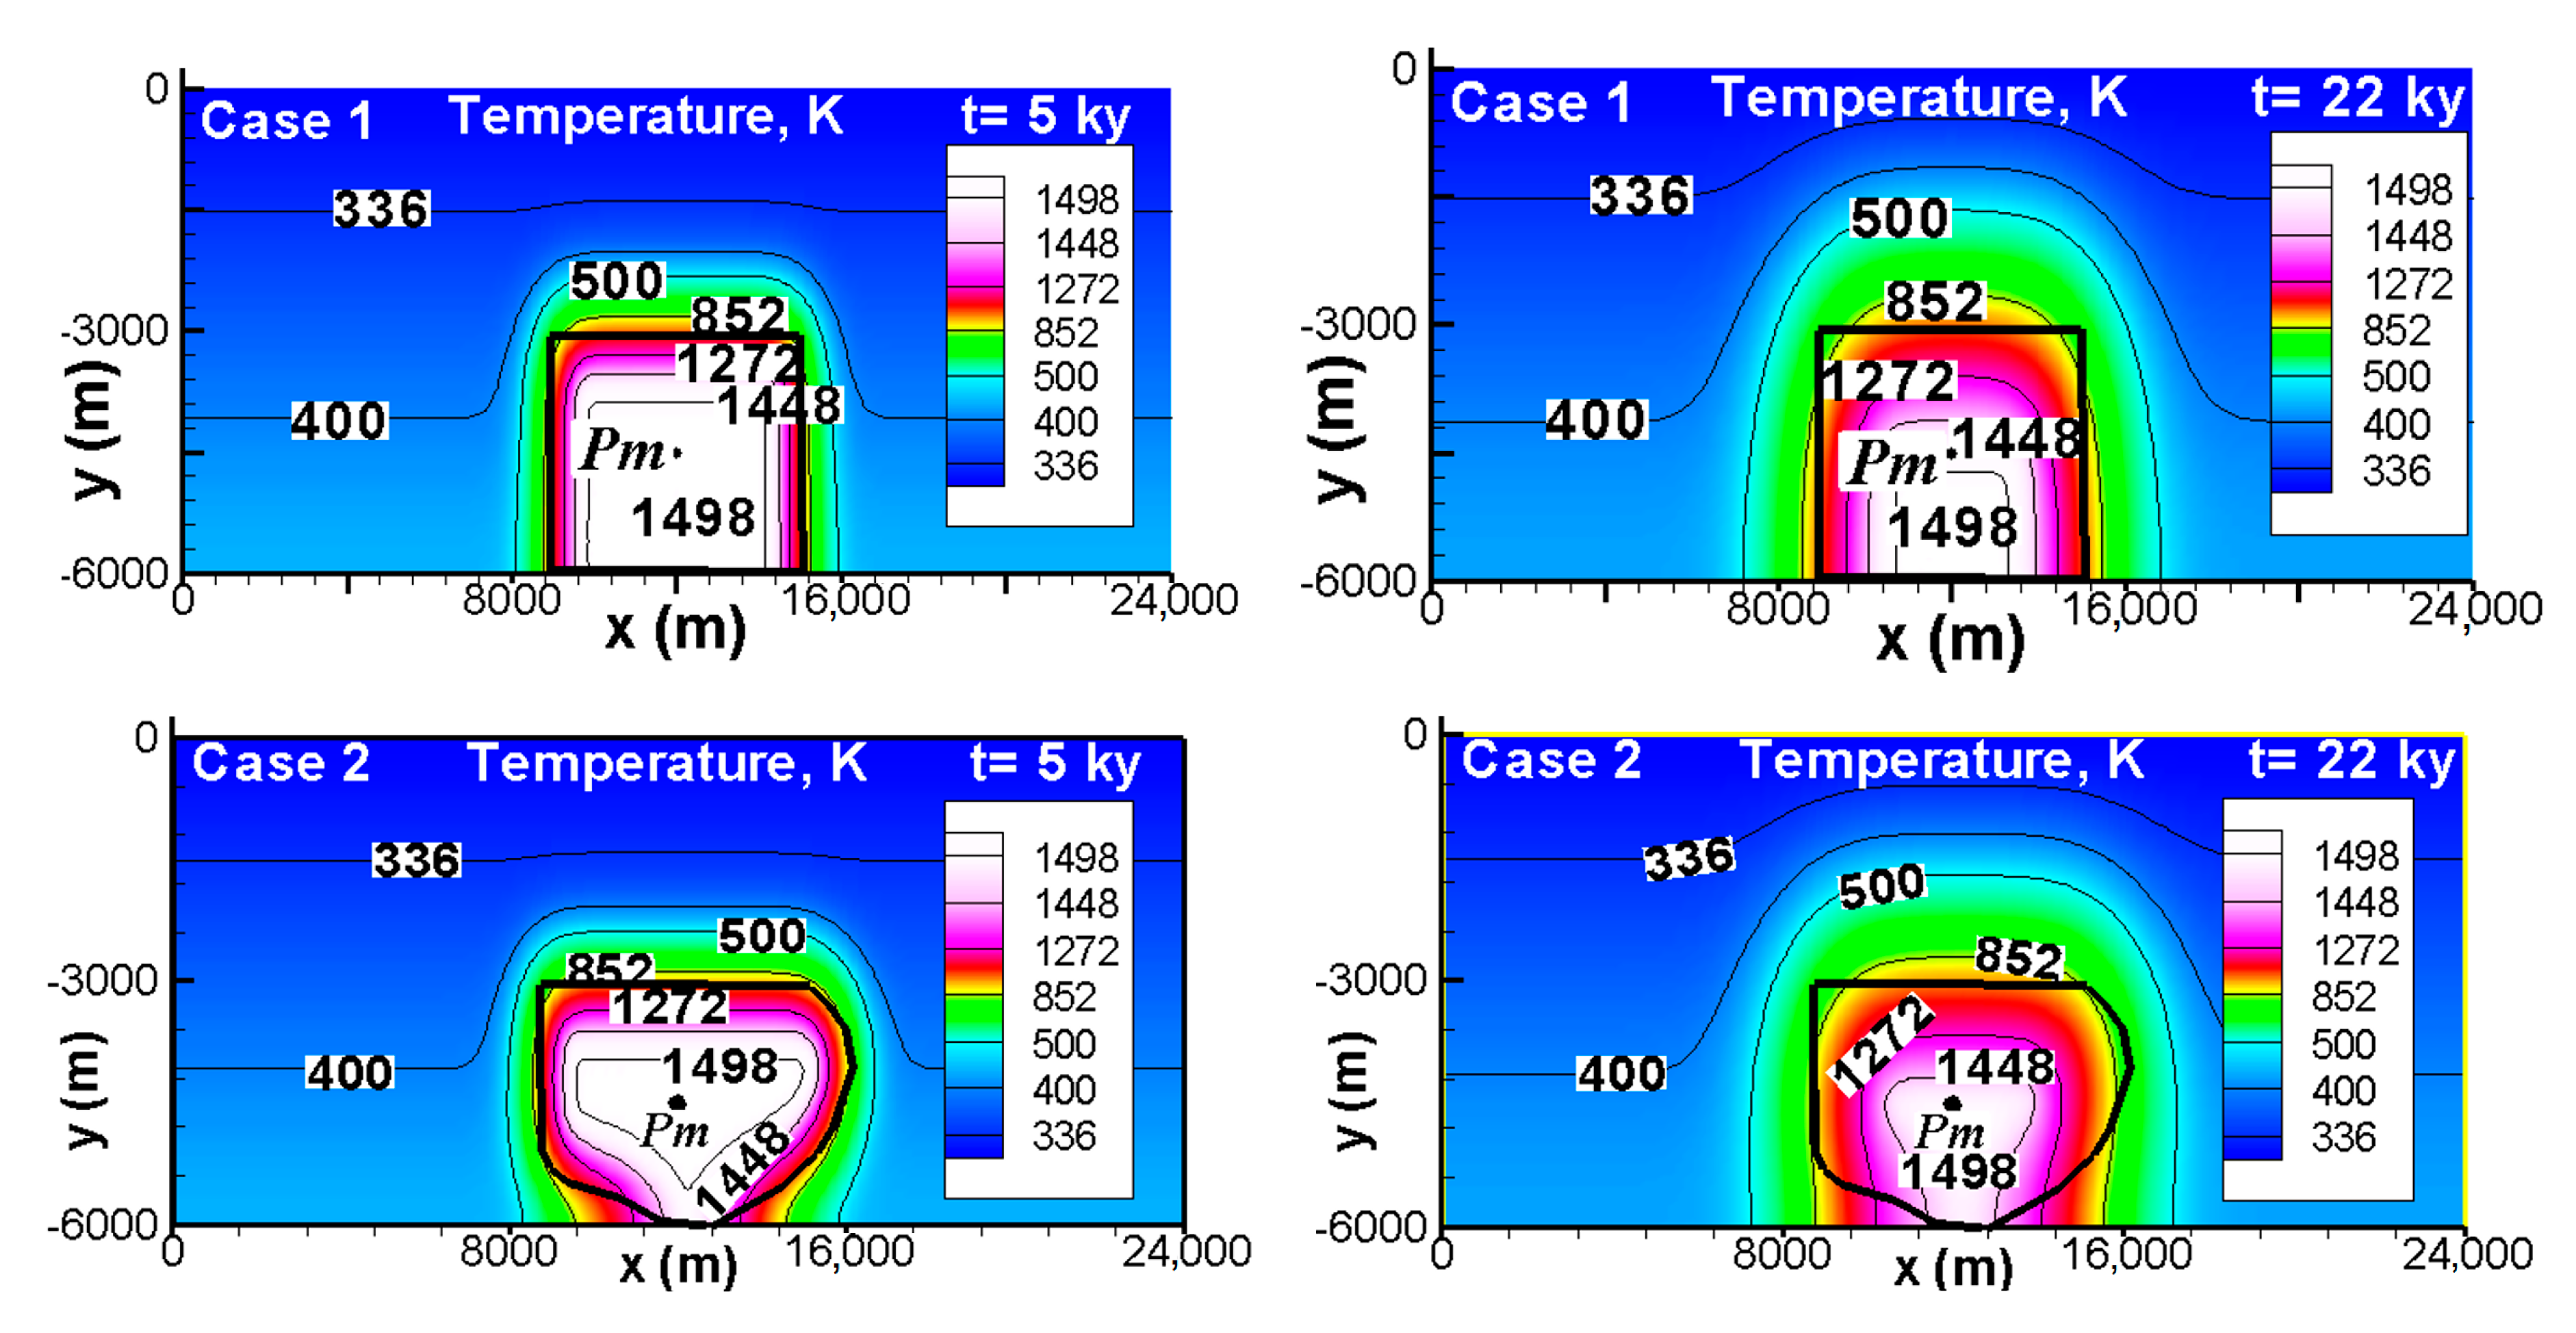
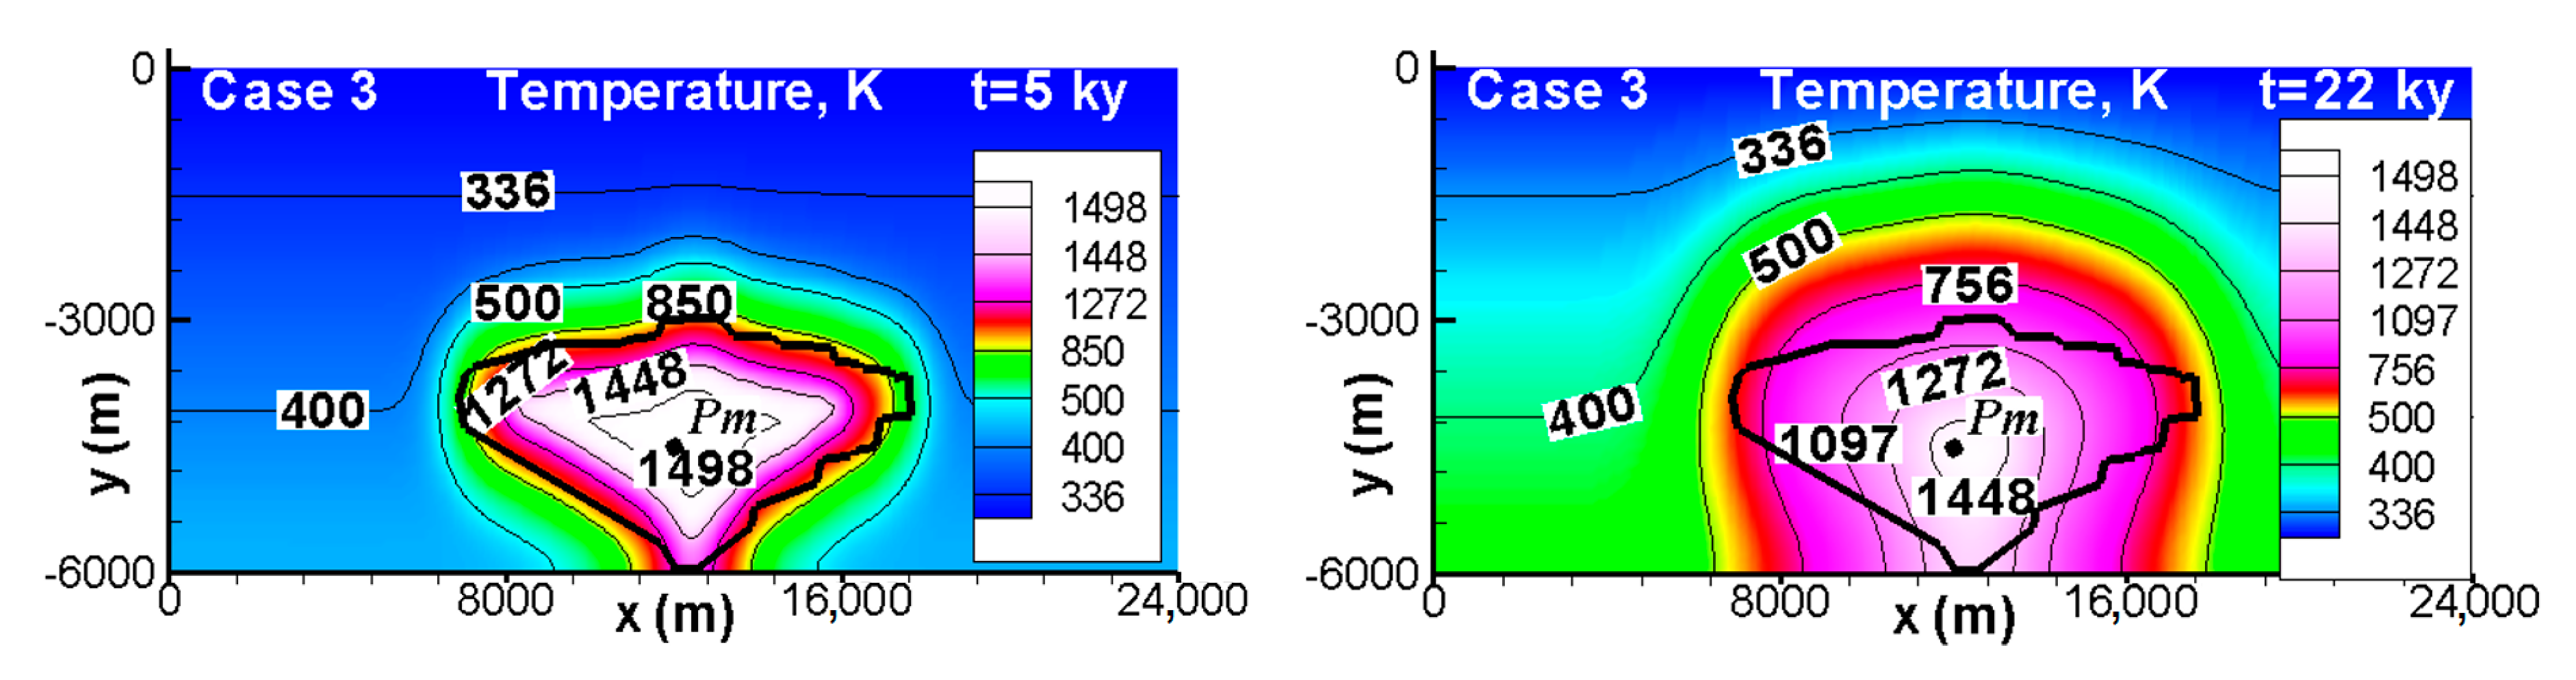
Figure 4 shows the temperature distribution in the host rock and within the chamber at two different times (5 and 22 ky) for three cases. Temperatures decrease from the center to the edges of the chamber except at the bottom edge. The shape of the chamber directly affects the rate of heat loss. In case 1, the heat is retained better and concentrated in the lower central zone. In contrast, case 3 (with a quasi-elliptical shape) enhances heat elimination. This is due to the extreme lateral zones of the chamber where temperatures decrease rapidly (see case 3, t = 22 ky).
Up to 5 ky of cooling, the isotherms in the host rock follow the contour of the chamber. After 22 ky of cooling, the isotherms lose this characteristic and tend to show symmetry. After 22 ky the high temperature isotherms (above 1016 K) are greater in cases 1 and 2, which produce higher average temperatures inside the chamber as presented in Figure 5.
It can be seen that the values of the isotherms decrease regularly, in layers from the edges with lower temperature and towards the center. This occurs on all edges except the bottom edge, where it is adiabatic. This condition is typical of conduction-driven processes. Some examples can be seen in the isotherms of the wall in the cooling of Golden Syrup [38], in a mold in the case of solidification of an aluminum alloy with an adiabatic edge [40] or in the fluid within a cavity when the Rayleigh number is low [41]. The magma is gravitationally stable and the main mechanism of thermal energy transport is conduction. This behavior can be observed throughout the entire simulation time. One of the reasons for this behavior is the high magma apparent viscosity of 9 to 1.8 × 10³ Pa s according to Equations (9) and (10) for the range between 1498 to 1448 K, which produce very low velocities (see Figure 6 and Figure 7) by natural convection in the chamber. Laboratory studies have shown that natural convection may not have visible effects on isotherms when a cavity is heated from the bottom and cooled from the top [41]. The results of the simulations indicate that the velocities produced by natural convection in the magma are not high enough to alter the isotherms. Conduction between the magma and host rock produces a rapid decrease in the temperature at the edges of the chamber. In general, cooling rates are minimized when the temperature difference between magma and host is small [42].
Figure 5 shows (a) the average temperature variation with time inside the chamber until the temperature drops below 1448 K at point Pm and (b) the temperature profile at x = 12,000 m for 0.1 ky and 22 ky. Figure 5a shows that average temperatures for case 1 decrease the slowest and case 3 cools down the fastest. The average temperatures after 40, 37 and 28 ky were 1215, 1156 and 1080 K for cases 1, 2 and 3, respectively. Cooling times are related to heat flow at the edges in contact with the host rock, which depends on the shape of the chamber. These contact areas are 18, 22.3 and 28.2 km2 for cases 1, 2 and 3, respectively. This in itself could explain why the cooling times in Figure 5a are different, but there is another reason. If the same boundary conditions were applied, similar heat losses should occur. However, the chambers have different shapes and this causes the edges of the chamber to come in contact with different temperatures of the host rock where the temperature increases by 25 K/km of depth. Fourier’s law indicates that the greatest heat flux at the host rock/chamber interface is found where there is the highest temperature gradient. In our case, this occurs when the host rock has lower temperatures (where the magma has a uniform initial temperature of Tf,0) at a shallower depth. Case 1 has less area exposed to high gradients, while cases 2 and 3 have larger exposed areas where the temperature gradient is high. These two reasons explain the large differences in temperature between the shapes studied and highlight the effect of chamber shape on the magma’s cooling times. Small batches of magma moving from hotter to colder regions in the upper crust can achieve thermal equilibrium in 1 ky, while larger igneous systems with spatial scales of 10–100 km may have lifetimes of 100 to 10,000 ky [43].
Recent field and laboratory studies for the mafic Humay pluton of the PCB suggest that cooling times for the crystallization of zircons (~1200–1100 K) may be on the order of a million years or more [44]. For comparison to simulations in this section, cooling times at the center of the pluton during the fully liquid stage (1498–1448 K) are 20–40 ky. When the simulations were run until the temperature dropped to 1173 K, the cooling times increased to 419–460 ky depending on the shape of the chamber. The mathematical model for simulations in this study gives a relatively short cooling time, since it does not consider the enthalpy of phase change. A model closer to reality, but not carried out in this work, would incorporate the phase change, thus considerably increasing the cooling time closer to that presented by [44]. Additionally, the Humay pluton could be up to 5 km thick [23], instead of 3 km simulated here, which would also increase the estimated cooling time.
In general, the temperature profiles in Figure 5b show similar variations for the three cases and the two times, except for case 3 (near −6000 m) where the profile at x = 12,000 m is slightly displaced from the area where the chamber has its greatest depth (see Figure 4, case 3). After 22 ky the temperatures inside the chamber first drop in the extreme upper zone to values around 1000 K. The temperatures of the host rock have increased significantly to values around 375 K at a depth of one km from the surface. This is a little more than 50 K higher than the original temperature due to the geothermal depth gradient. At 300 m depth, the temperatures increase by about 10 K.
These simulations can be used to estimate the presence, depth and availability of geothermal reservoirs, which require geothermal fluids at temperatures higher than 433 K to be exploited for high-temperature heat applications at the surface [45]. More accurate simulations of the temperature in the host rock above the magma chamber would require consideration of 3D chamber geometry, latent heat and groundwater/volatile circulation, unless the host rock has very little porosity and/or water content.
3.2.2. Velocity Results
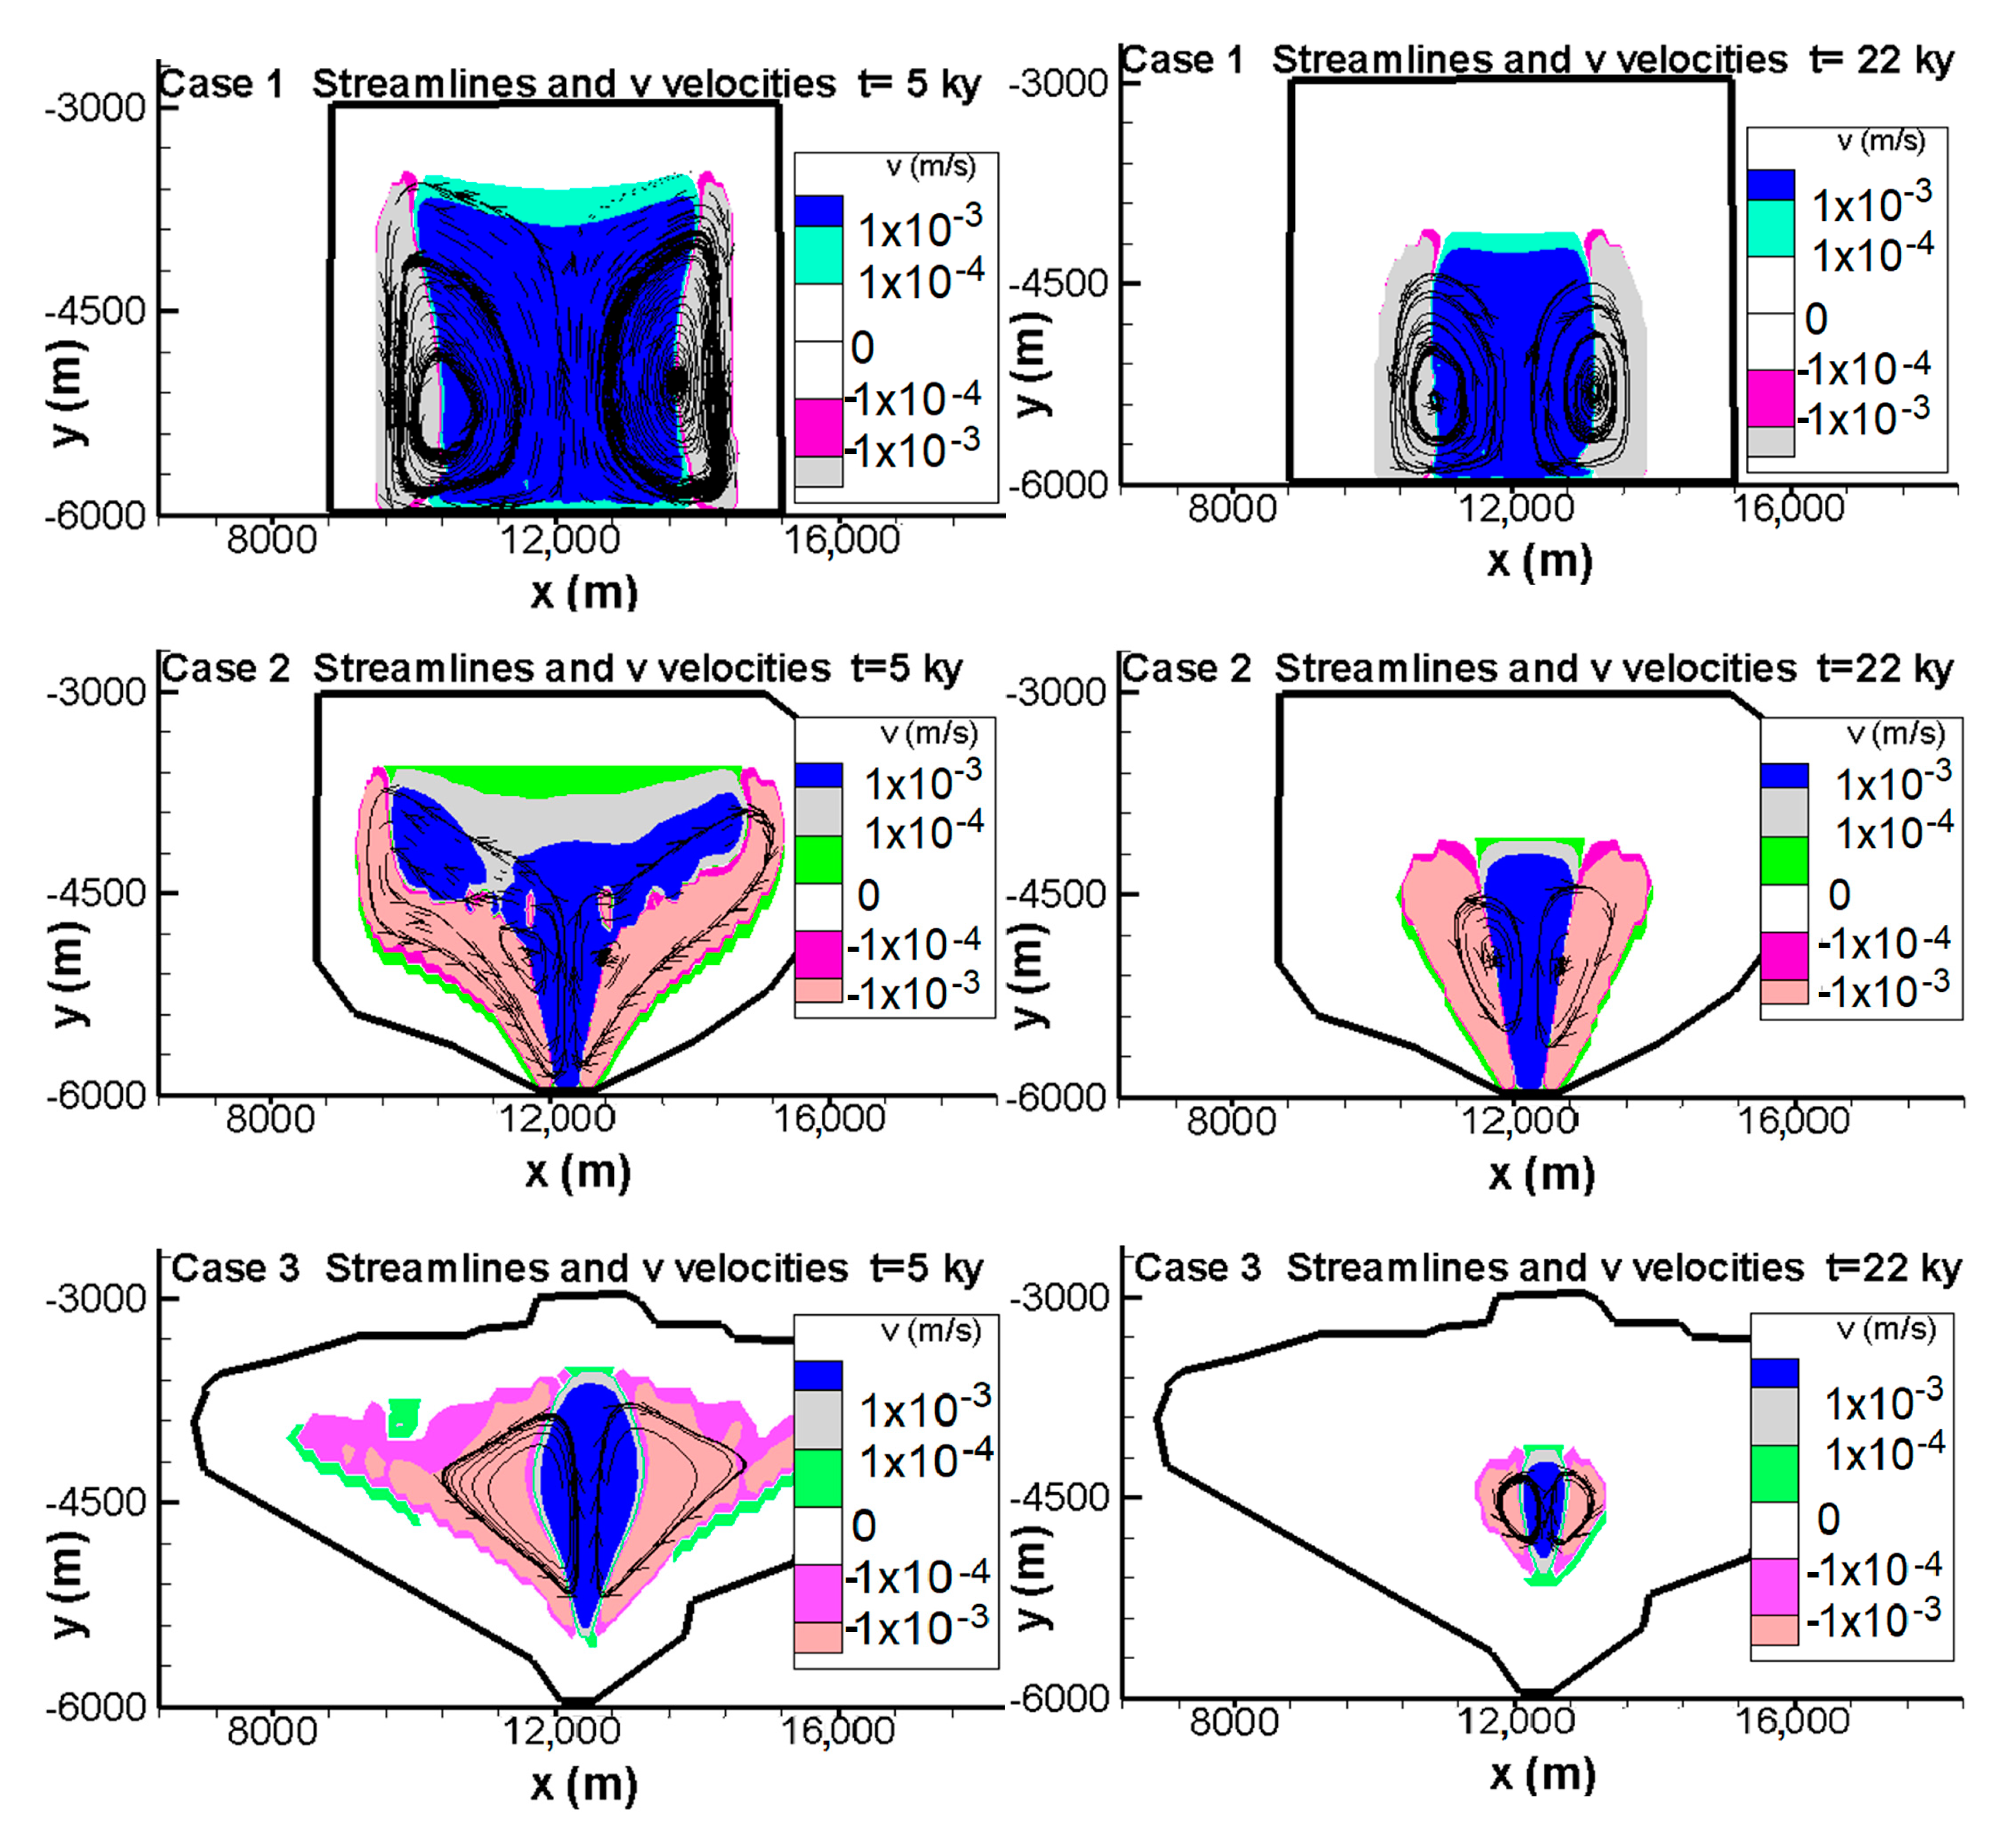
Figure 6 shows the streamlines and velocities in the vertical v-direction within the chamber at two different times for the cases studied. Streamlines in Figure 6 are in the temperature zones above 1223 K (solidus temperature). In all three cases, natural convection produces movement of the magma. For the two times presented, the v velocities do not exceed 1.4 × 10⁻³ m/s or 31.5 km/y. Maximum velocities are observed near the lateral wall. In general, the lower local resultant velocities are in the range of 0.32–0.032 km/y. This means that in 100 years an element of the magma travels at least one complete revolution in the chamber. Case 1 is the one that retains the most heat and therefore has the most movement. Two big vortices are produced in the fluid zone in all cases. In cases 2 and 3, streamlines show the effects of the chamber shape. This is best seen at 5 ky when the fluid area is still large.
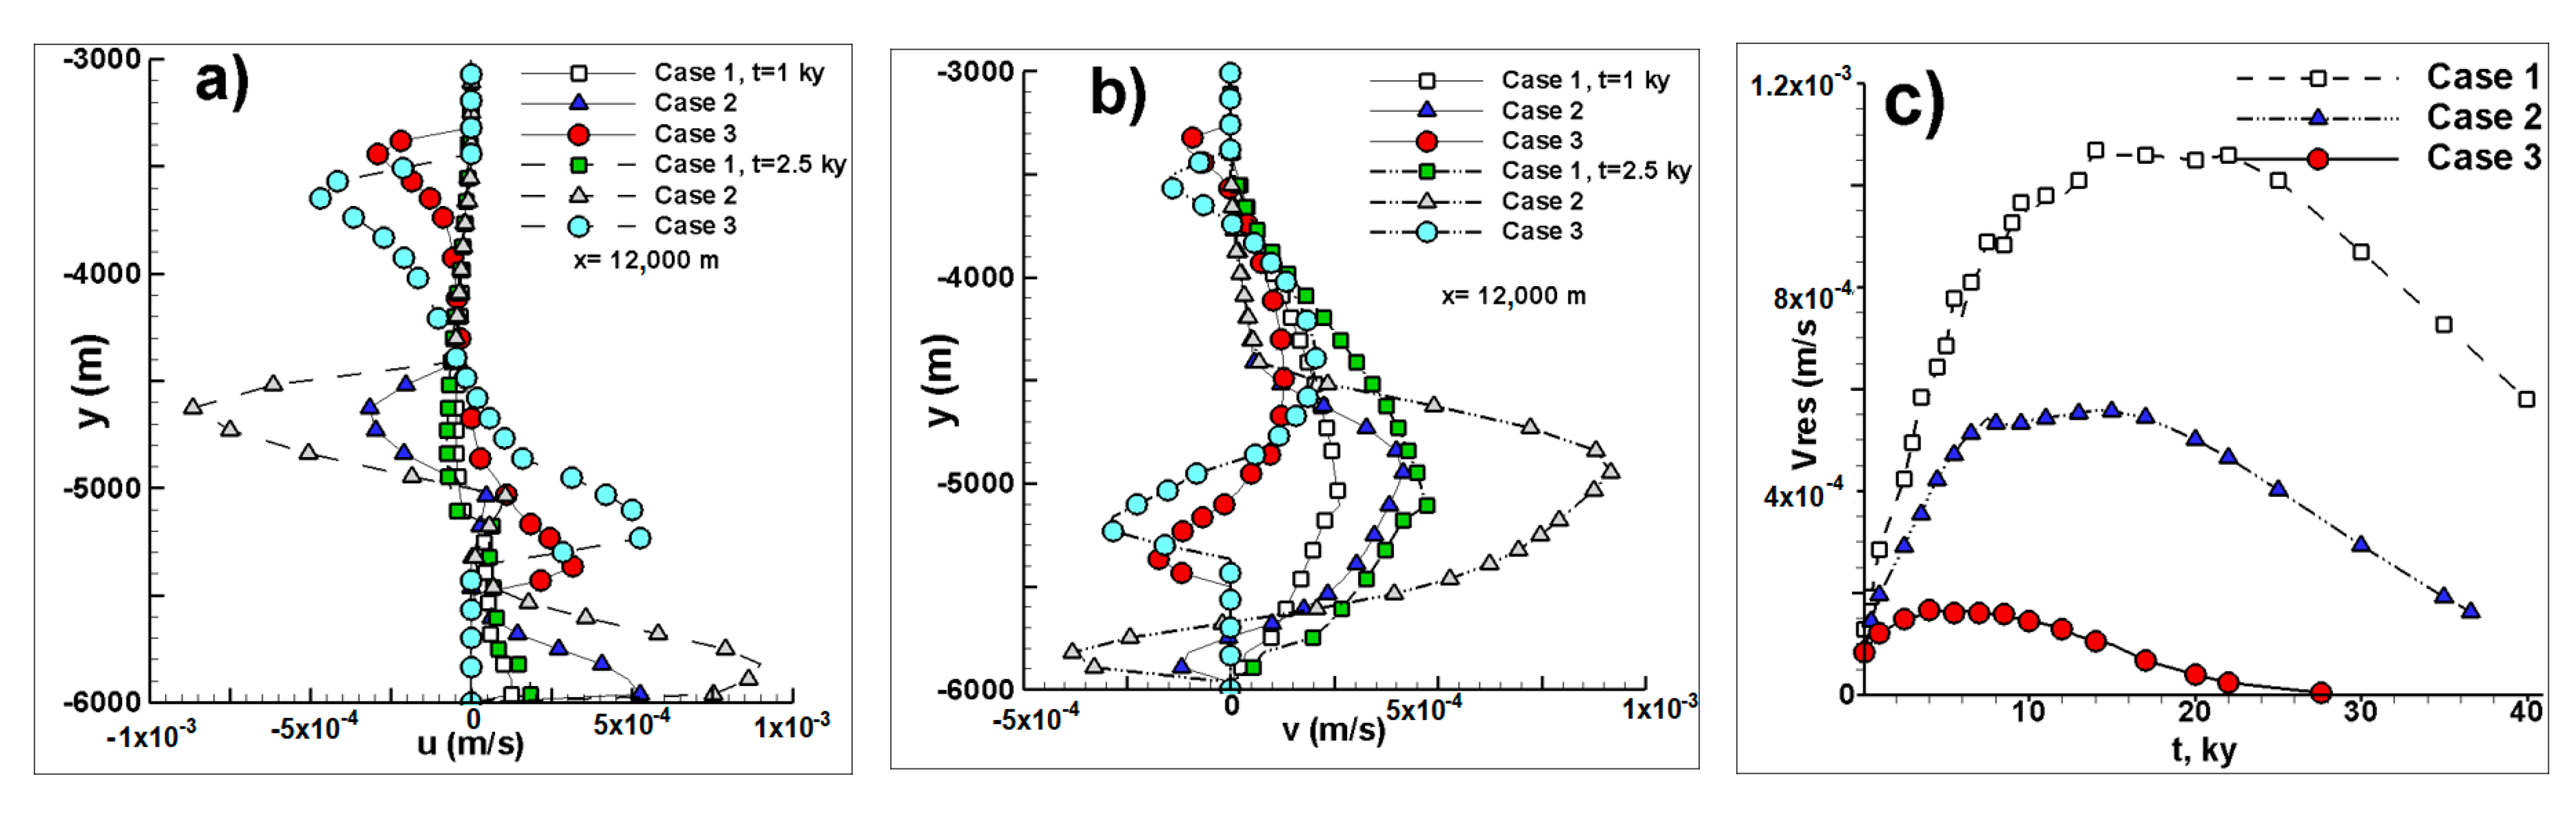
Figure 7a,b show the velocity profiles at x = 12,000 m. The absolute value of the velocities u and v are low at 9 × 10⁻⁴ m/s or less. Velocities within the chamber in each case are distributed in a different form. Cases 2 and 3 show positive and negative values of u and v. The velocities are displaced with time due to the solidification front for case 3. The velocity profile in case 3 has no contact with the lower part of the chamber; this produces velocities of zero near the bottom of the chamber. For this profile, case 1 displays the lowest velocities of the three studied cases. The time evolution of the average resulting velocity (Vres) in the chamber is shown in Figure 7c. The Vres increases rapidly during the first years of cooling. Only in case 1 is the Vres value (1.1 × 10⁻³ m/s) near the maximum calculated by Equation (11) (U0 = 1.4 × 10⁻³ m/s). The maximum Vres are 5.5 × 10⁻⁴ and 1.6 × 10⁻⁴ m/s for cases 2 and 3, respectively. The Vres decreases with: case 1 > case 2 > case 3, which is consistent with the temperature decrease for the studied chambers.
The movement produced by natural convection could transport crystals to areas with different temperatures, where the addition of minerals other than those initially present could occur and thus generate the chemical differentiation that can be observed in plutonic rocks [17]. In the Humay unit of the PCB, crustal assimilation and magmatic recycling provide evidence for magma movement [44] which could result from the natural convection simulated in this paper.
3.2.3. Concentration Results
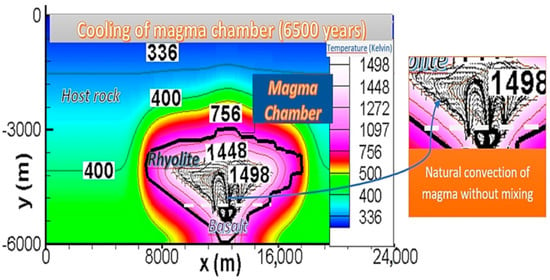
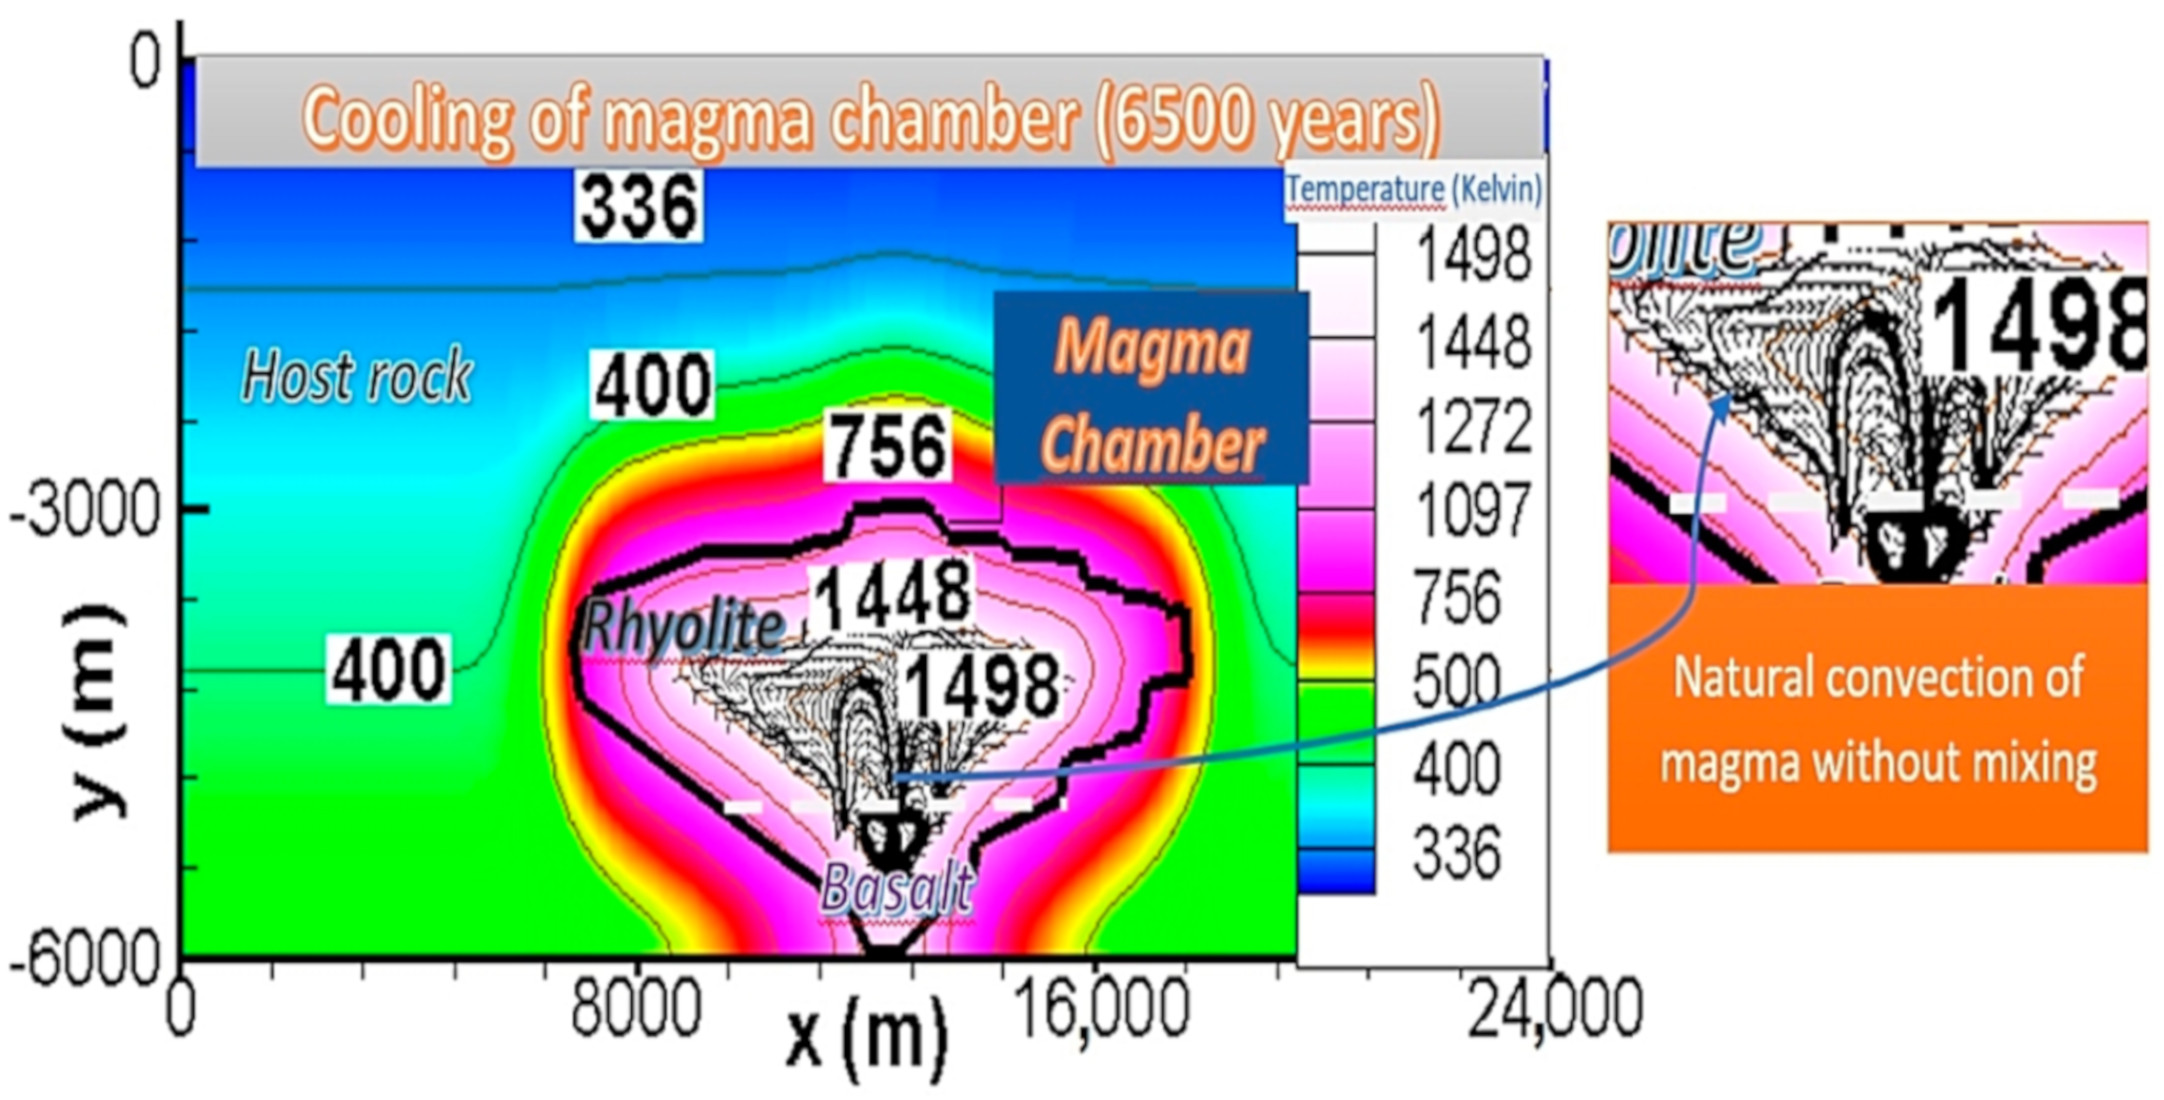
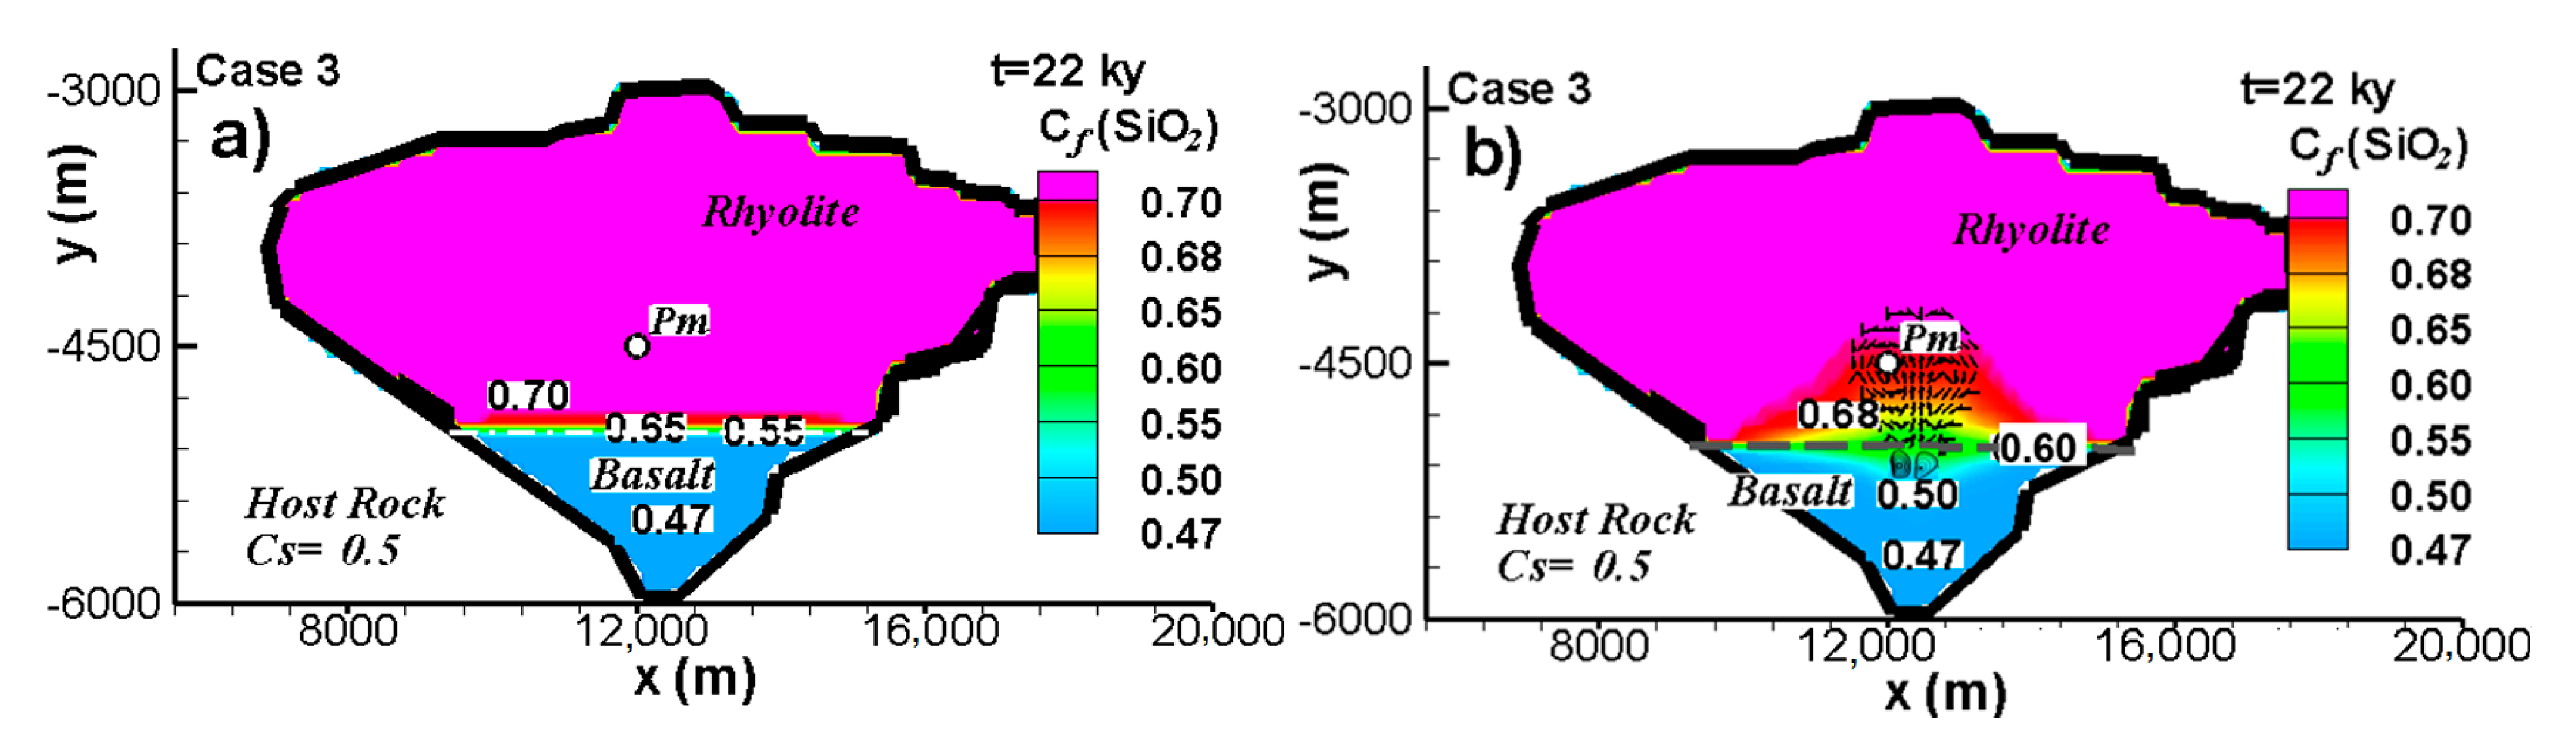
As illustrated in Figure 8, a simulation was run to determine the evolution of SiO2 concentration when basaltic magma is intruded beneath a rhyolitic magma chamber. Both magma bodies initially had the same temperature. The basaltic magma initially had 47 wt% SiO2, the rhyolitic magma 70 wt% and the host rock 50 wt%. Using these parameters and a typical SiO2 diffusion coefficient at atmospheric pressure of D = 3 × 10⁻¹² m2/s [18], no variation was observed in the concentration of SiO2 for the three cases (see Figure 8a for case 3). Additional tests were made with similar results using a self-diffusivity value of D = 6.7 × 10⁻¹¹ m2/s obtained at 1 GPa of pressure and 1873 K for SiO2 in anhydrous basaltic liquid [46]. These diffusivity values are too low to observe the SiO2 transport by molecular diffusion. Advection is not capable of mixing or mingling the two contrasting magma types. It is important to remember that for the magma chambers studied here the Rayleigh, Prandtl and Lewis numbers indicate that the diffusion of momentum is much greater than that of heat, which is much greater than the molecular diffusion of SiO2. Therefore, it was expected that natural convection would not produce changes in the iso-concentration of SiO2.
Our simulation results agree with experimental results that can be found elsewhere [47,48]. These authors concluded that if a new fluid is intruded into a chamber that originally had a fluid with different and homogenous concentration, the new fluid forms a separate layer at the base of the chamber. This is true even if vigorous convection in both fluids is occurring. At the same time there is a negligible compositional flux across the interface between the fluids.
A sensibility analysis was made by carrying out several simulations using artificial diffusion coefficients of 1 × 10⁻¹¹ to 1 × 10⁻⁶ m2/s. Results show that the minimum diffusivity necessary to observe diffusion of silica in the chamber is around 1 × 10⁻⁸ m2/s (Le = 16). The result obtained using a hypothetical value for the diffusivity coefficient of D = 1 × 10⁻⁸ m2/s is presented at 22 ky in Figure 8b. The advection–diffusion transport mechanisms change the concentration of SiO2 while the magma is in the liquid phase. This occurs mainly in the first 10 ky of cooling. Figure 8b shows the variation in concentration level near the boundary between basalt and rhyolite. The SiO2 content increases in the zone where initial basaltic magma intrudes. The rhyolite composition decreases from 0.70 to 0.60 and the basalt composition increases from 0.47 to 0.50 near the boundary interface between rhyolite and the basalt intrusion.
4. Conclusions
Based on the cases proposed in this work for a magma chamber that formed a pluton in the Humay unit of the PCB, the simulations show that the main mechanism of heat transfer for magma cooling is conduction. The magma velocities produced by natural convection within the chamber do not transfer heat fast enough to observe an influence on the isotherms. That does not imply that natural convection does not participate in magmatic differentiation, since the movement of the fluid could transport crystals to areas with different temperatures in which other minerals can be added and thus form magma and rocks with different chemical composition from the original. Molecular diffusivity of SiO2 under the conditions examined in this study produced little chemical differentiation of magma.
Shapes of the magma chamber and the interaction with the host rock determine the cooling rates of the magma chambers. Shapes that have a larger heat transfer area with the host rock will tend to cool faster. Additionally, wider shapes in the upper zone of the chamber will tend to cool faster than taller shapes due to the area exposed to lower temperatures of the host rock.
Based on the results reported in this work, it would seem adequate to affirm that a simpler mathematical model of heat conduction could be used to estimate the cooling times of a magma chamber with these specific conditions. However, a conduction model would not provide any information regarding the movement of the magma in the chamber, which can be observed in field and laboratory studies showing that there was convection. A coupled model of momentum, heat and mass such as the one proposed in this work is more suitable to study the cooling of chambers where magma flows and to explain the origin of what is observed in the field in plutons of the PCB.
Supplementary Materials
The source codes are available for downloading at the link: Code used to obtain validation results in Section 3.1 can be obtained from (https://bclausen.net/Zambra/Program_Validation.txt. Last access 20 December 2021). Code used to obtain results for case 3 (Section 3.2) can be obtained from (https://bclausen.net/Zambra/Program_Chamber_case3.txt. Last access 20 December 2021).
Author Contributions
The contributions of each author to this paper are: L.G.-O. and B.C. inspired this work and provided important discussions about the analysis results and conclusions; B.C. gave important feedback by reviewing. J.G. processed the data for the mesh study and validation. C.E.Z. programmed the algorithm in the FORTRAN language and wrote the paper. Programs were run on computers provided by the Universidad de Talca. All authors have read and agreed to the published version of the manuscript.
Funding
This research was funded by Geoscience Research Institute grant #2019-A-R5 of Loma Linda University.
Institutional Review Board Statement
Not applicable.
Informed Consent Statement
Not applicable.
Data Availability Statement
Luciano Gonzalez Ph.D dissertation about PCB data and simulations. https://scholarsrepository.llu.edu/etd/458/ (accessed on 20 December 2021).
Conflicts of Interest
The authors declare no conflict of interest.
References
- Kavanagh, J.L.; Engwell, S.L.; Martin, S.A. A review of laboratory and numerical modelling in volcanology. Solid Earth 2018, 9, 531–571. [Google Scholar] [CrossRef] [Green Version]
- Pinkerton, H.; Sparks, R.S.J. Field measurements of the rheology of lava. Nature 1978, 276, 383–385. [Google Scholar] [CrossRef]
- Sparks, R.S.J.; Huppert, H.E.; Turner, J.S.; Sakuyama, M.; O’Hara, M.J. The Fluid Dynamics of Evolving Magma Chambers [and Discussion]. Philos. Trans. R. Soc. A Math. Phys. Eng. Sci. 1984, 310, 511–534. [Google Scholar] [CrossRef]
- Sonder, I.; Zimanowski, B.; Büttner, R. Non-Newtonian viscosity of basaltic magma. Geophys. Res. Lett. 2006, 33, 2–5. [Google Scholar] [CrossRef]
- Ryerson, F.J.; Weed, H.C.; Piwinskii, A.J. Rheology of subliquidus magmas. 1. Picritic compositions. J. Geophys. Res. 1988, 93, 3421–3436. [Google Scholar] [CrossRef]
- Shaw, H.R.; Wright, T.L.; Peck, D.L.; Okamura, R. The viscosity of basaltic magma; an analysis of field measurements in Makaopuhi lava lake, Hawaii. Am. J. Sci. 1968, 266, 225–264. [Google Scholar] [CrossRef]
- Spera, F.J. Thermal Evolution of Plutons: A Parameterized Approach. Science 1980, 207, 299–301. [Google Scholar] [CrossRef]
- Cashman, K.V.; Giordano, G. Calderas and magma reservoirs. J. Volcanol. Geotherm. Res. 2014, 288, 28–45. [Google Scholar] [CrossRef]
- Gudmundsson, A. Magma chambers: Formation, local stresses, excess pressures, and compartments. J. Volcanol. Geotherm. Res. 2012, 237–238, 19–41. [Google Scholar] [CrossRef]
- Shaw, H.R. Comments on viscosity, crystal settling, and convection in granitic magmas. Am. J. Sci. 1965, 263, 120–152. [Google Scholar] [CrossRef]
- Bartlett, R.W. Magma convection, temperature distribution, and differentiation. Am. J. Sci. 1969, 267, 1067–1082. [Google Scholar] [CrossRef]
- Eckert, E.R.G.; Goldstein, R.J.; Pfender, E.; Ibele, W.E.; Patankar, S.V.; Ramsey, J.W.; Simon, T.W.; Decker, N.A.; Kuehn, T.H.; Lee, H.; et al. Heat transfer—A review of 1987 literature. Int. J. Heat Mass Transf. 1988, 31, 2401–2488. [Google Scholar] [CrossRef]
- Bergman, T.L.; Lavine, A.S.; Incropera, F.P.; Dewitt, D.P. Fundamentals of Heat and Mass Transfer, 7th ed.; John Wiley & Sons: Hoboken, NJ, USA, 2011; ISBN 9780470501979. [Google Scholar]
- Carrigan, C.R. The magmatic Rayleigh number and time dependent convection in cooling lava lakes. Geophys. Res. Lett. 1987, 14, 915–918. [Google Scholar] [CrossRef]
- Rabbanipour Esfahani, B.; Hirata, S.C.; Berti, S.; Calzavarini, E. Basal melting driven by turbulent thermal convection. Phys. Rev. Fluids 2018, 3, 053501. [Google Scholar] [CrossRef] [Green Version]
- Kaminski, E.; Jaupart, C. Laminar starting plumes in high-Prandtl-number fluids. J. Fluid Mech. 2003, 478, 287–298. [Google Scholar] [CrossRef] [Green Version]
- Clark, S.; Spera, F.J.; Yuen, D.A. Steady state double-diffusive convection in magma chambers heated from below. J. Fluid Mech. 1987, 289–305. [Google Scholar]
- Lesher, C.E.; Spera, F.J. Thermodynamic and Transport Properties of Silicate Melts and Magma. In The Encyclopedia of Volcanoes; Elsevier: Amsterdam, The Netherlands, 2015; pp. 113–141. ISBN 9780123859389. [Google Scholar]
- Cahn, R.W.; Haasen, P. Physical Metallurgy, 4th ed.; Elsevier Science: Amsterdam, The Netherlands, 1996. [Google Scholar]
- Gutiérrez, F.; Parada, M.A. Numerical modeling of time-dependent fluid dynamics and differentiation of a shallow basaltic magma chamber. J. Petrol. 2010, 51, 731–762. [Google Scholar] [CrossRef] [Green Version]
- Cruden, A.R. On the emplacement of granites. J. Geol. Soc. London. 1998, 155, 853–862. [Google Scholar] [CrossRef]
- Agar, R.A. Copper mineralization and magmatic hydrothermal brines in the Rio Pisco section of the Peruvian coastal batholith. Econ. Geol. 1981, 76, 677–693. [Google Scholar] [CrossRef]
- Olivares, L.U.G. Conduction Plus Convection Heat Flow Modeling for the Linga Complex, Peruvian Coastal Batholith. Ph.D. Thesis, Loma Linda University, Loma Linda, CA, USA, 2017. [Google Scholar]
- Couch, R.; Whitsett, R.; Huehn, B.; Luis, B. Structures of the continental margin of Peru and Chile. Geol. Soc. Am. 1981, 703–726. [Google Scholar]
- Haederle, M.; Atherton, M.P. Shape and intrusion style of the Coastal Batholith, Peru. Tectonophysics 2002, 345, 17–28. [Google Scholar] [CrossRef]
- Lowell, R.P.; Kolandaivelu, K.; Rona, P.A. Hydrothermal Activity ☆. In Reference Module in Earth Systems and Environmental Sciences; Elsevier Inc.: Amsterdam, The Netherlands, 2014; pp. 1–19. ISBN 9780124095489. [Google Scholar]
- Ahlers, G.; Grossmann, S.; Lohse, D. Heat transfer and large scale dynamics in turbulent Rayleigh-Bénard convection. Rev. Mod. Phys. 2009, 81, 503–537. [Google Scholar] [CrossRef] [Green Version]
- Yang, L.; Du, K. A comprehensive review on the natural, forced, and mixed convection of non-Newtonian fluids (nanofluids) inside different cavities. J. Therm. Anal. Calorim. 2020, 140, 2033–2054. [Google Scholar] [CrossRef]
- Christiansen, E.B.; Craig, S.E. Heat transfer to pseudoplastic fluids in laminar flow. AIChE J. 1962, 8, 154–160. [Google Scholar] [CrossRef]
- Yoshinobu, A.S.; Okaya, D.A.; Paterson, S.R. Modeling the thermal evolution of fault-controlled magma emplacement models: Implications for the solidification of granitoid plutons. J. Struct. Geol. 1998, 20, 1205–1218. [Google Scholar] [CrossRef]
- Liu, L.; Lowell, R.P. Modeling heat transfer from a convecting, crystallizing, replenished silicic magma chamber at an oceanic spreading center. Geochem. Geophys. Geosyst. 2011, 12, 1–17. [Google Scholar] [CrossRef]
- Patankar, S.V. Numerical Heat Transfer and Fluid Flow; Minkowycz, W.J., Sparrow, E.M., Eds.; Hemisphere Publishing Corporation: Washington, DC, USA, 1980. [Google Scholar]
- Frederick, L.; Moraga, S.G. Three-dimensional natural convection in finned cubical enclosures. Int. J. Heat Fluid Flow 2007, 28, 289–298. [Google Scholar] [CrossRef]
- Zemani, F.; Sabeur-bendehina, A.; Boussoufi, M. Numerical Investigation of Natural Convection in Air Filled Cubical Enclosure with Hot Wavy Surface and Partial Partitions. Procedia Comput. Sci. 2014, 32, 622–630. [Google Scholar] [CrossRef] [Green Version]
- Cherkaoui, A.S.M.; Wilcock, W.S.D.; Dunn, R.A.; Toomey, D.R. A numerical model of hydrothermal cooling and crustal accretion at a fast spreading mid-ocean ridge. Geochem. Geophys. Geosystems 2003, 4, 1–19. [Google Scholar] [CrossRef]
- Versteeg, H.M.; Malalasekera, W. An Introduction to Computational Fluid Dynamics: The Finite Volume Method, 2nd ed.; Limited, P.E., Ed.; Prentice Hall: Harlow, UK, 2007. [Google Scholar]
- Zambra, C.E.; Muñoz, J.F.; Moraga, N.O. A 3D coupled model of turbulent forced convection and diffusion for heat and mass transfer in a bioleaching process. Int. J. Heat Mass Transf. 2015, 85, 390–400. [Google Scholar] [CrossRef]
- Younis, O.; Pallares, J.; Grau, F.X. Transient natural convection cooling of a high Prandtl number fluid in a cubical cavity. Meccanica 2011, 46, 989–1006. [Google Scholar] [CrossRef]
- Fialko, Y.A.; Rubin, A.M. Thermal and mechanical aspects of magma emplacement in giant dike swarms. J. Geophys. Res. Solid Earth 1999, 104, 23033–23049. [Google Scholar] [CrossRef]
- Celentano, D.; Cruchaga, M.; Moraga, N.; Fuentes, J. Modeling Natural Convection with Solidification in Mould Cavities. Numer. Heat Transf. Part A Appl. 2001, 39, 631–654. [Google Scholar] [CrossRef]
- Kim, D.M.; Viskanta, R. Study of the effects of wall conductance on natural convection in differently oriented square cavities. J. Fluid Mech. 1984, 144, 153–176. [Google Scholar] [CrossRef]
- Dufek, J.; Bachmann, O. Quantum magmatism: Magmatic compositional gaps generated by melt-crystal dynamics. Geology 2010, 38, 687–690. [Google Scholar] [CrossRef]
- Cashman, K.; Sparks, R.S.J.; Blundy, J. Vertically extensive and unstable magmatic systems: A unified view of igneous processes. Volcanology 2017, 355, 1–9. [Google Scholar] [CrossRef] [PubMed] [Green Version]
- Martínez Ardila, A.M.; Clausen, B.L.; Memeti, V.; Paterson, S.R. Source contamination, crustal assimilation, and magmatic recycling during three flare-up events in the Cretaceous Peruvian Coastal Batholith: An example from the Ica-Pisco plutons. J. South Am. Earth Sci. 2019, 95, 102300. [Google Scholar] [CrossRef]
- Vidal, J.; Patrier, P.; Genter, A.; Beaufort, D.; Dezayes, C.; Glaas, C.; Lerouge, C.; Sanjuan, B. Clay minerals related to the circulation of geothermal fluids in boreholes at Rittershoffen (Alsace, France). J. Volcanol. Geotherm. Res. 2018, 349, 192–204. [Google Scholar] [CrossRef]
- Lesher, C.E.; Hervig, R.L.; Tinker, D. Self diffusion of network formers (silicon and oxygen) in naturally occurring basaltic liquid. Geochim. Cosmochim. Acta 1996, 60, 405–413. [Google Scholar] [CrossRef]
- Huppert, H.E.; Sparks, R.S.J. restrictions on the compositions of mid-ocean ridge basalts: A fluid dynamical investgation. Nature 1980, 286, 46–48. [Google Scholar] [CrossRef]
- Huppert, H.E.; Stewart Turner, J.J.; Sparks, R.S. Replenished magma chambers: Effects of compositional zonation and input rates. Earth Planet. Sci. Lett. 1982, 57, 345–357. [Google Scholar] [CrossRef] [Green Version]
- Huppert, H.E.; Sparks, R.S.J. Double-diffusive convection due to crustallization in magmas. Annu. Rev. Earth Planet. Sci. 1984, 12, 11–37. [Google Scholar] [CrossRef]
- Ferré, E.C.; Maes, S.M.; Butak, K.C. The magnetic stratification of layered mafic intrusions: Natural examples and numerical models. Lithos 2009, 111, 83–94. [Google Scholar] [CrossRef]
Figure 1.
Cross-section of a quasi-elliptical magma chamber (case 3) surrounded by a host rock approximately representing emplacement of the Humay unit in the PCB. This pluton form is a combination of the cantilever and piston mechanisms [21].
Figure 1.
Cross-section of a quasi-elliptical magma chamber (case 3) surrounded by a host rock approximately representing emplacement of the Humay unit in the PCB. This pluton form is a combination of the cantilever and piston mechanisms [21].

Figure 2.
Convection lines and temperature contours after 1785 s for the cases used to validate the mathematical model and numerical procedure proposed in this work with the obtained by [38]. In (a) the bottom boundary is adiabatic, while in (b) all boundaries have the same non-dimensional temperature.

Figure 3.
Time evolution of the average dimensionless fluid temperature for five meshes is compared with [38] by using relative error (RE). Results were obtained using a constant temperature of outside the container for the first case in Section 3.1.
Figure 3.
Time evolution of the average dimensionless fluid temperature for five meshes is compared with [38] by using relative error (RE). Results were obtained using a constant temperature of outside the container for the first case in Section 3.1.

Figure 4.
Temperature distributions at two different times inside the chamber and host rock for 1498 K and 1223 K correspond to magma (liquid and crystal mixture). Zones with temperatures lower than 1223 K are considered to be solid.
Figure 4.
Temperature distributions at two different times inside the chamber and host rock for 1498 K and 1223 K correspond to magma (liquid and crystal mixture). Zones with temperatures lower than 1223 K are considered to be solid.


Figure 5.
For the three cases studied: (a) Temporal evolution of the temperature average inside the chamber and (b) temperature profile (for x = 12,000 m) at two different times in the host rock and chamber.
Figure 5.
For the three cases studied: (a) Temporal evolution of the temperature average inside the chamber and (b) temperature profile (for x = 12,000 m) at two different times in the host rock and chamber.

Figure 6.
Streamlines and v velocity distributions at two different times inside the chamber. Natural convection produces movement of magma in zones having temperatures of 1498 K to 1223 K.
Figure 6.
Streamlines and v velocity distributions at two different times inside the chamber. Natural convection produces movement of magma in zones having temperatures of 1498 K to 1223 K.

Figure 7.
Velocity profiles for the three cases studied at x = 12,000 m (at the center of the computational domain) for (a) u and (b) v at two different times and (c) the resultant velocity average inside the whole chamber.
Figure 7.
Velocity profiles for the three cases studied at x = 12,000 m (at the center of the computational domain) for (a) u and (b) v at two different times and (c) the resultant velocity average inside the whole chamber.

Figure 8.
Silica concentration distribution (in wt fraction) within a magma chamber when basaltic magma is intruded into rhyolite magma without initially mixing and then the chamber is closed completely. Results for two diffusivities, (a) using D = 3 × 10⁻¹² m2/s as a typical SiO2 diffusivity for basaltic magma in rhyolite and (b) using D = 1 × 10⁻⁸ m2/s as an artificially high diffusivity. The original interface between the two magmas is shown as a dashed horizontal black line in Figure 8b. Streamlines show two vortices in the basaltic and rhyolitic magma that can be seen in Figure 8b.


Table 1.
Magma and host rock properties and parameters used in the mathematical model.
| Transport Properties | Magma [18] | Host Rock [30] | Param. | Param. | ||
|---|---|---|---|---|---|---|
| 2600 | 2670 | 1.62 × 10¹⁷ | Pr | 2.42 × 10⁵ | ||
| 1450 | 1000 | 75 | Le | 5.3 × 10⁴ | ||
| 0.6 | 2.65 | 7426 | Tf,0 (K) | 1498 | ||
| 1.6 × 10⁻⁷ | 9.93 × 10⁻⁷ | 0.4 | Tref (K) | 1473 | ||
| * | 5 × 10⁻⁵ | - | 1.01 × 10⁻² | Cs,0 | 0.5 | |
| 100 | - | 2.19 × 10¹³ | Cf,0,a | 0.47 | ||
| 3 × 10⁻¹² | - | 1.41 × 10⁻³ | Cf,0,b | 0.7 |
* Obtained from [31].
Table 2.
Different meshes studied and the relative errors (RE) between V velocity profiles in position V (2.8–5.2; 0.5), compared with the more refined mesh 1.
Table 2.
Different meshes studied and the relative errors (RE) between V velocity profiles in position V (2.8–5.2; 0.5), compared with the more refined mesh 1.
| Mesh | Nodes X × Y | Total Nodes | N° Nodes in Chamber Zone | N° Nodes in Host Rock | RE | t (s) |
|---|---|---|---|---|---|---|
| 1 | 300 × 90 | 27,000 | 2800 | 24,200 | 0 | 13,180 |
| 2 | 280 × 70 | 19,600 | 2450 | 17,150 | 0.0078 | 9836 |
| 3 | 196 × 58 | 11,368 | 2450 | 8918 | 0.1283 | 4393 |
| 4 | 156 × 60 | 9360 | 1800 | 7560 | 1.1756 | 3440 |
| 5 | 130 × 50 | 6500 | 1250 | 5250 | 2.0933 | 2960 |
Publisher’s Note: MDPI stays neutral with regard to jurisdictional claims in published maps and institutional affiliations. |
© 2022 by the authors. Licensee MDPI, Basel, Switzerland. This article is an open access article distributed under the terms and conditions of the Creative Commons Attribution (CC BY) license (https://creativecommons.org/licenses/by/4.0/).
Share and Cite
MDPI and ACS Style
Zambra, C.E.; Gonzalez-Olivares, L.; González, J.; Clausen, B. Temporal Evolution of Cooling by Natural Convection in an Enclosed Magma Chamber. Processes 2022, 10, 108. https://doi.org/10.3390/pr10010108
AMA Style
Zambra CE, Gonzalez-Olivares L, González J, Clausen B. Temporal Evolution of Cooling by Natural Convection in an Enclosed Magma Chamber. Processes. 2022; 10(1):108. https://doi.org/10.3390/pr10010108
Chicago/Turabian StyleZambra, Carlos Enrique, Luciano Gonzalez-Olivares, Johan González, and Benjamin Clausen. 2022. "Temporal Evolution of Cooling by Natural Convection in an Enclosed Magma Chamber" Processes 10, no. 1: 108. https://doi.org/10.3390/pr10010108
Note that from the first issue of 2016, this journal uses article numbers instead of page numbers. See further details here.