Author Contributions
Conceptualization, C.F.-D., A.O., I.A.C., I.F. and C.J.R.; methodology, C.F.-D., A.O., I.A.C., I.F. and C.J.R.; validation, C.F.-D., A.O., I.A.C., I.F. and C.J.R.; formal analysis, C.F.-D., A.O., I.A.C., I.F. and C.J.R.; investigation, C.F.-D., A.O., I.A.C., I.F. and C.J.R.; resources, C.F.-D., A.O., I.A.C., I.F. and C.J.R.; data curation, C.F.-D., A.O., I.A.C., I.F. and C.J.R.; writing—original draft preparation, C.F.-D., A.O., I.A.C., I.F. and C.J.R.; writing—review and editing, C.F.-D., A.O., I.A.C., I.F. and C.J.R. All authors have read and agreed to the published version of the manuscript.
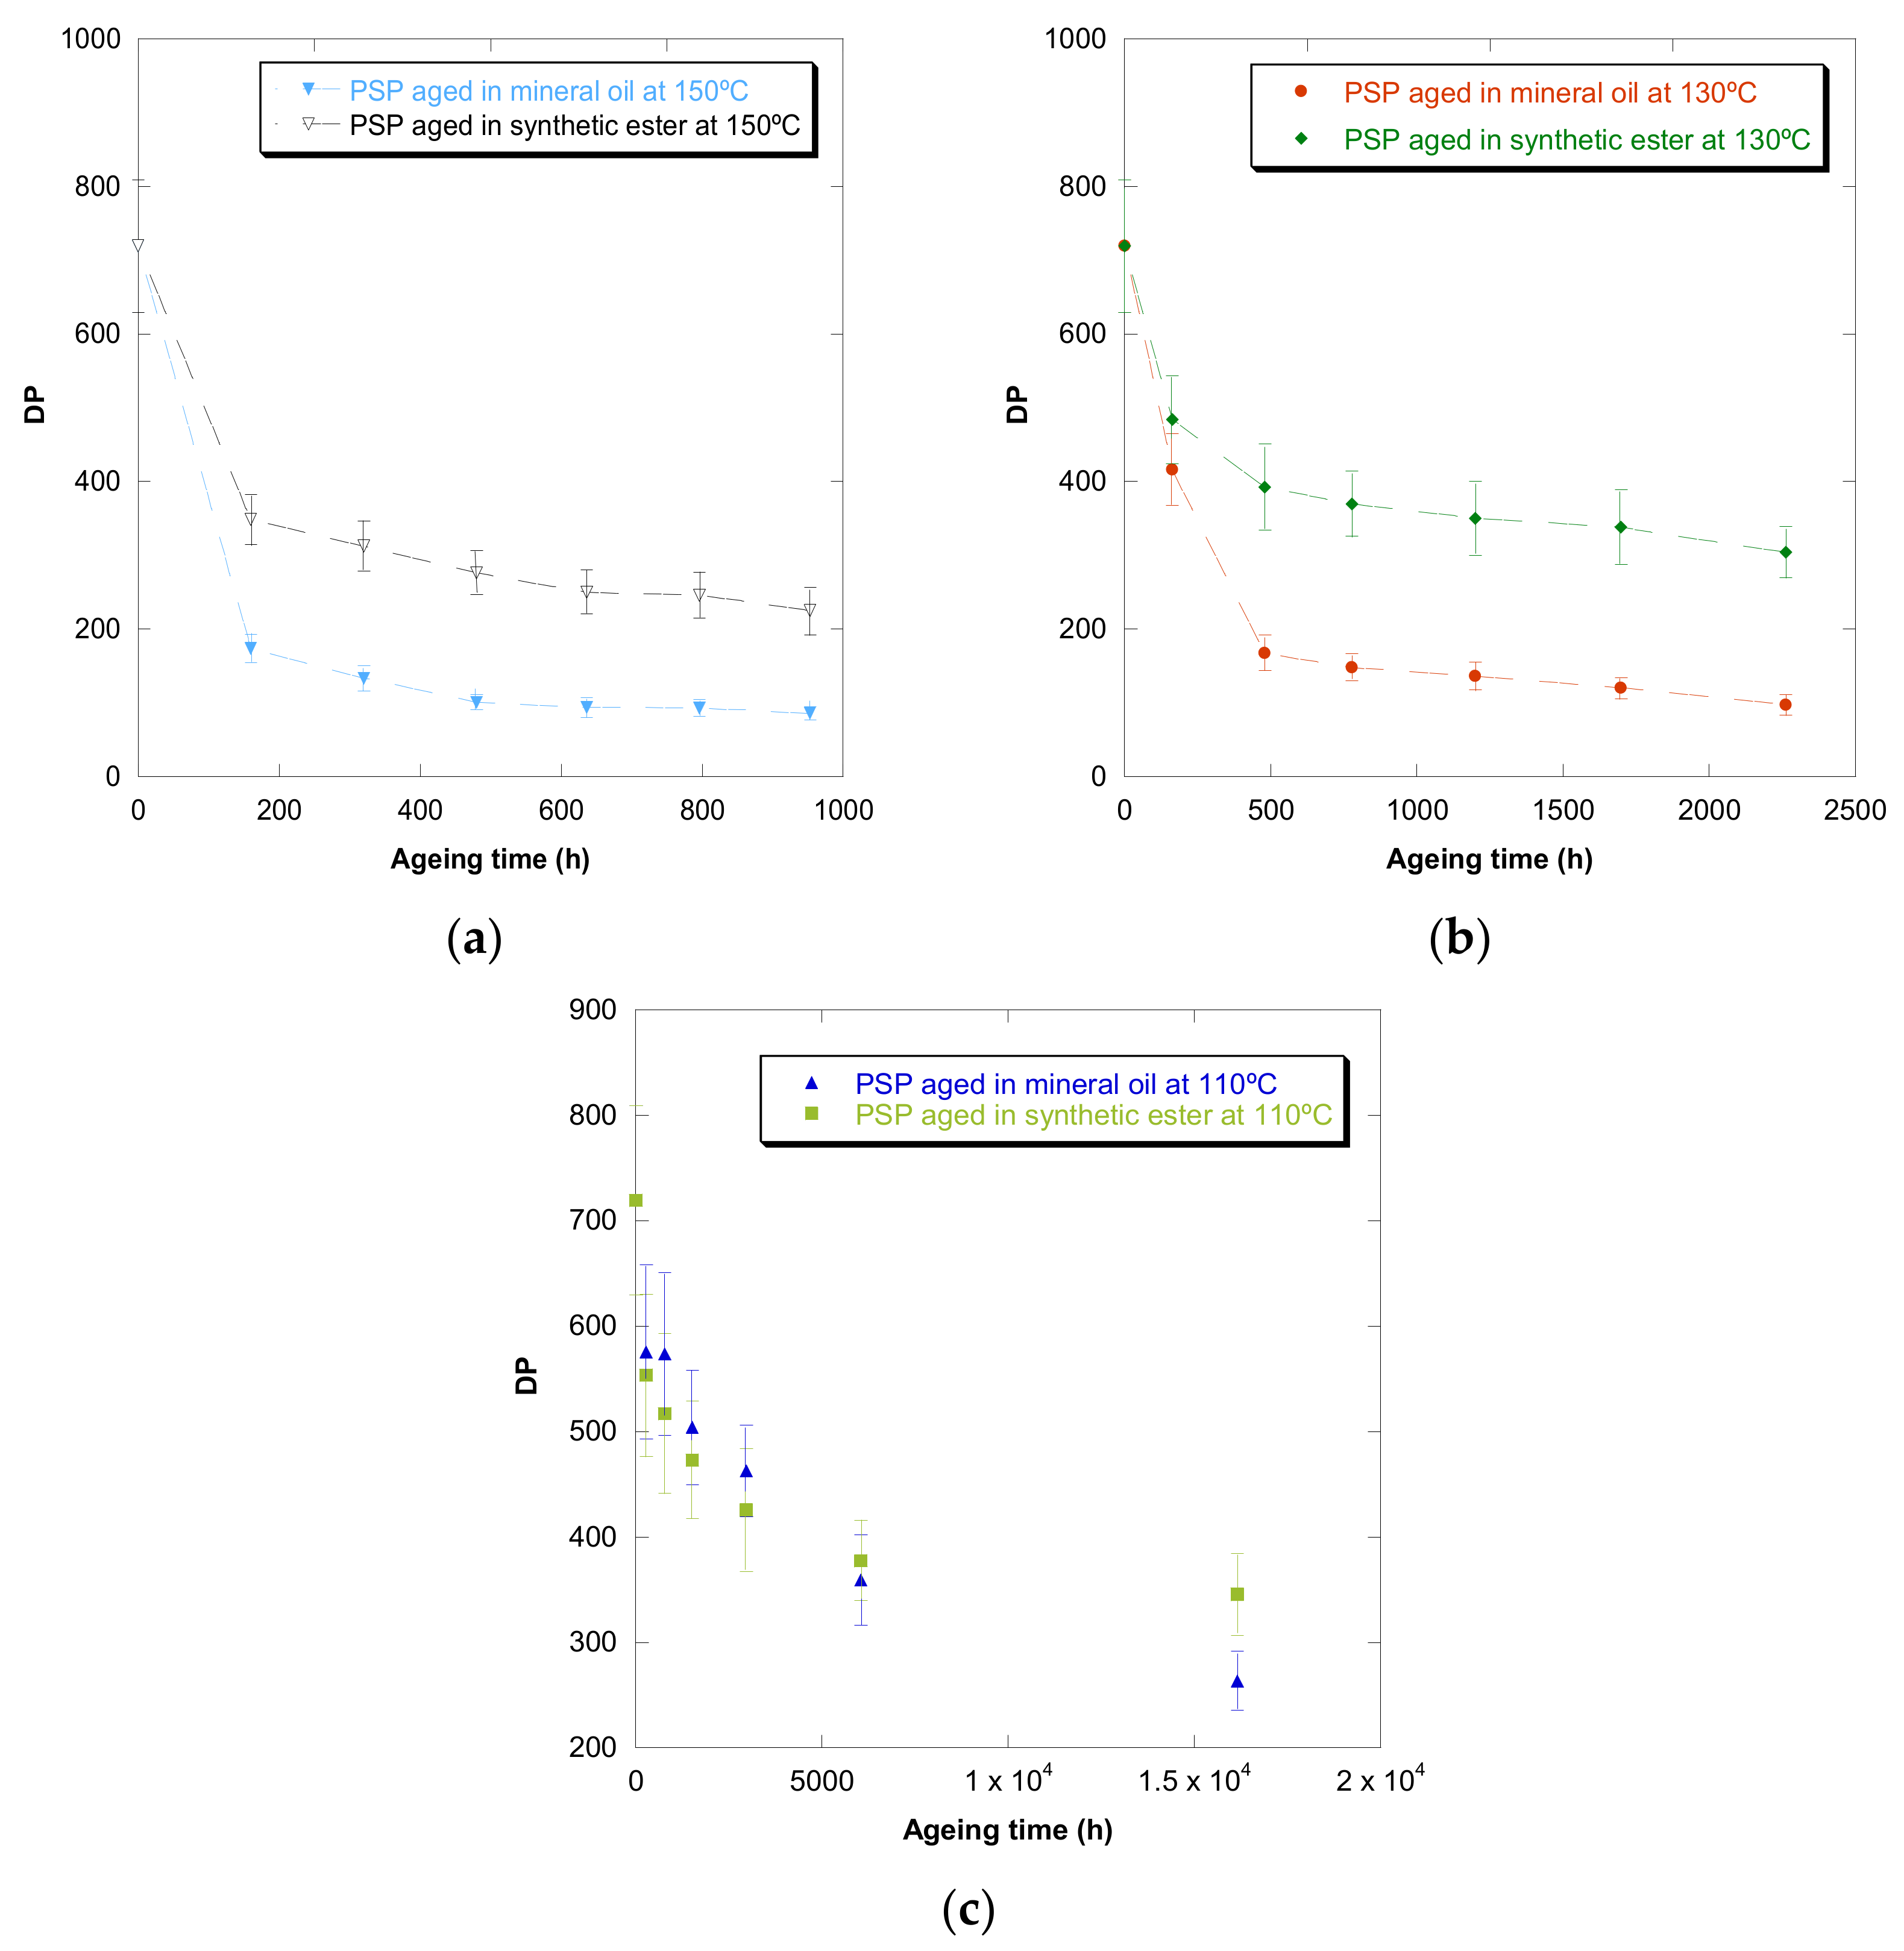
Figure 1.
Evolution of the DP as a function of temperature for cellulose-board PSP 3055 aged in mineral oil and in synthetic ester at 150 °C (a), 130 °C (b), and 110 °C (c).
Figure 1.
Evolution of the DP as a function of temperature for cellulose-board PSP 3055 aged in mineral oil and in synthetic ester at 150 °C (a), 130 °C (b), and 110 °C (c).
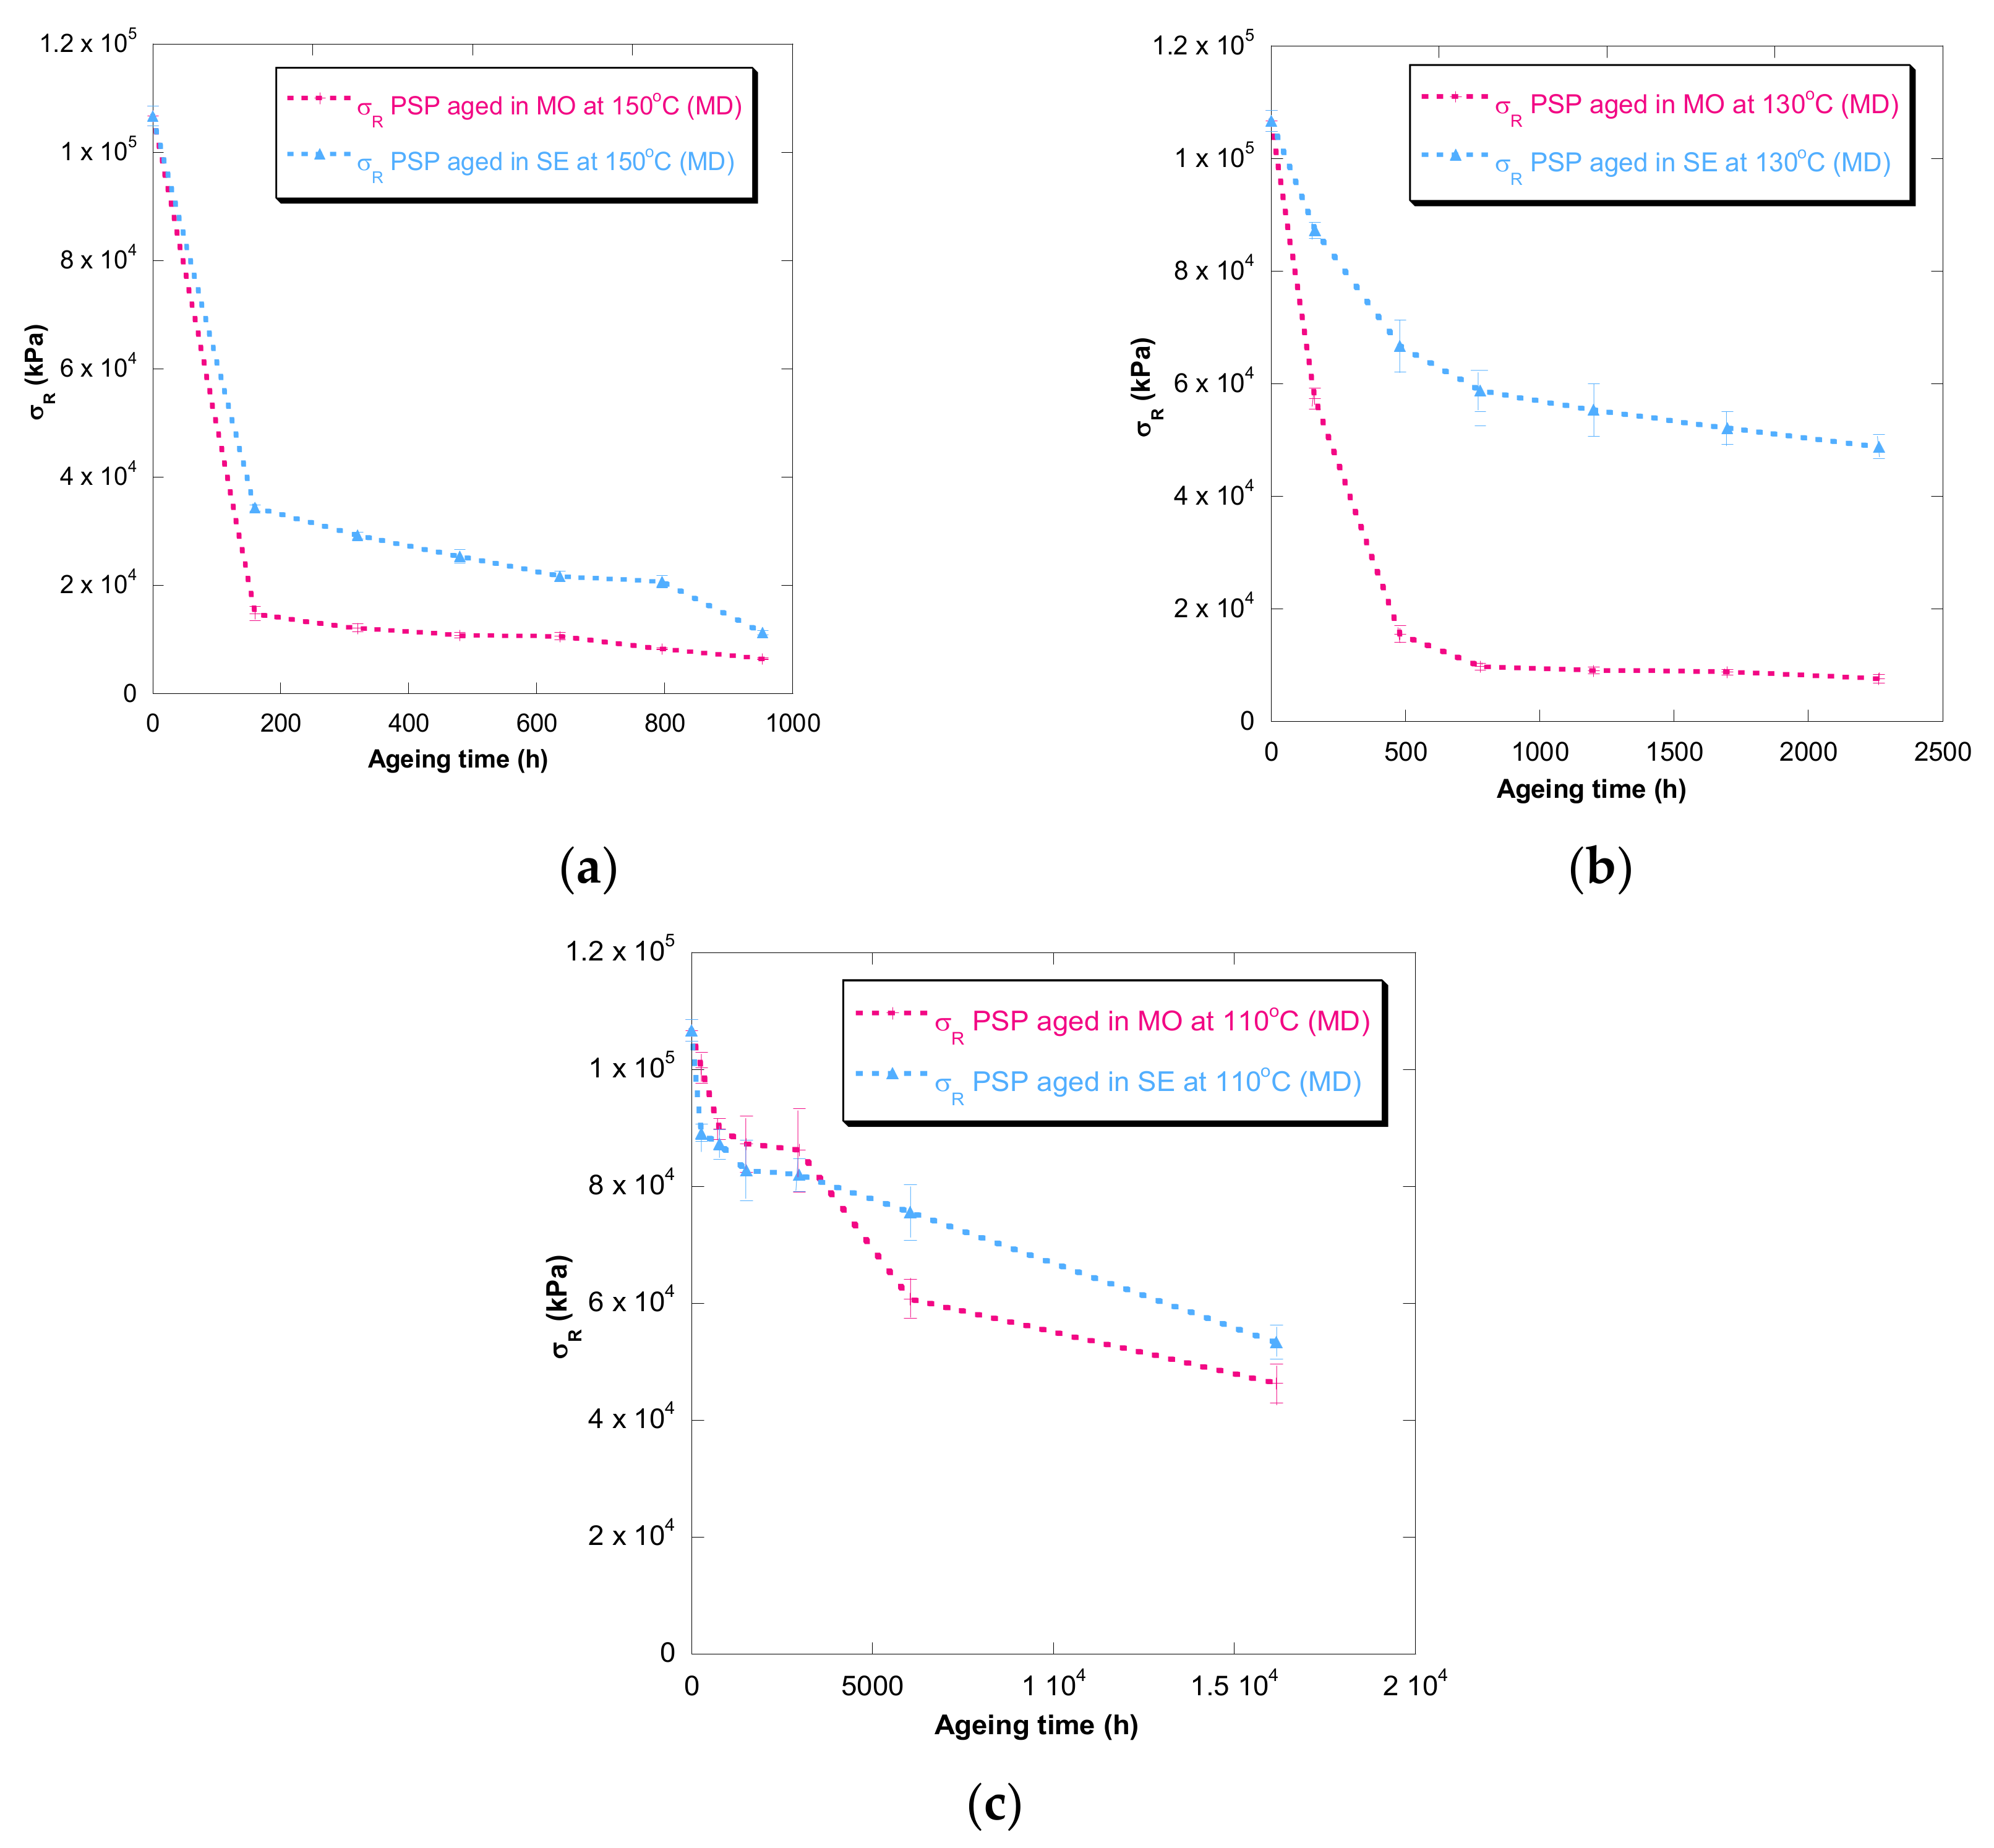
Figure 2.
Evolution of the σR in MD as a function of temperature for cellulose-board PSP 3055 aged in mineral oil and in synthetic ester at 150 °C (a), 130 °C (b), and 110 °C (c).
Figure 2.
Evolution of the σR in MD as a function of temperature for cellulose-board PSP 3055 aged in mineral oil and in synthetic ester at 150 °C (a), 130 °C (b), and 110 °C (c).
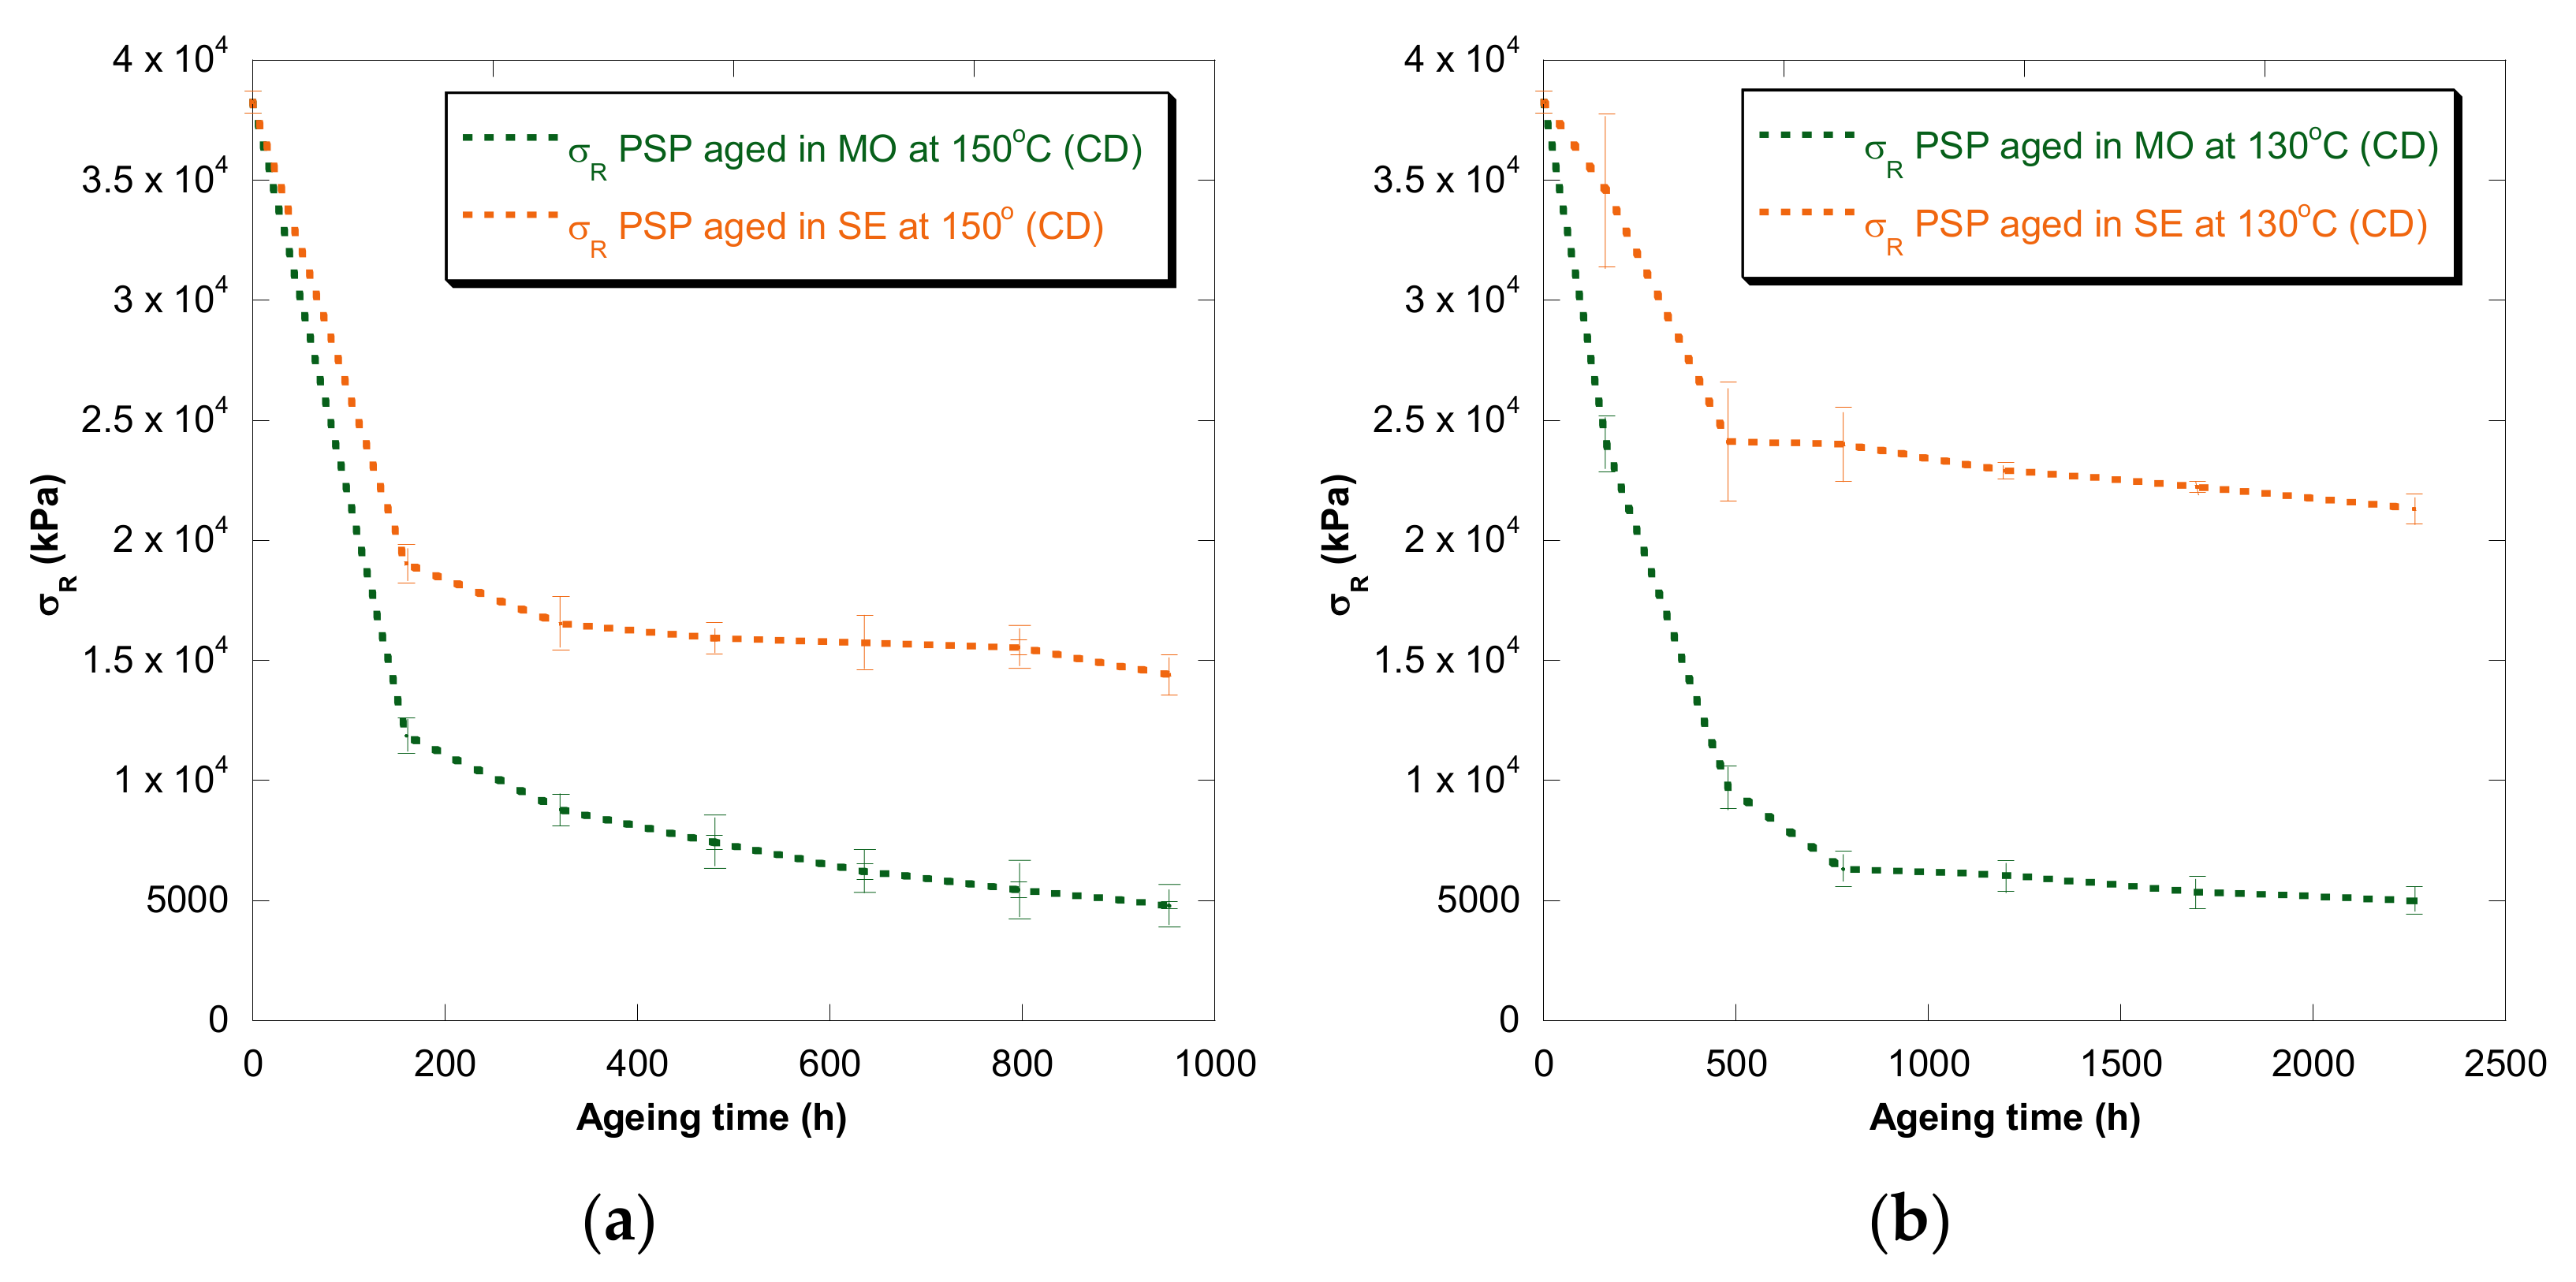
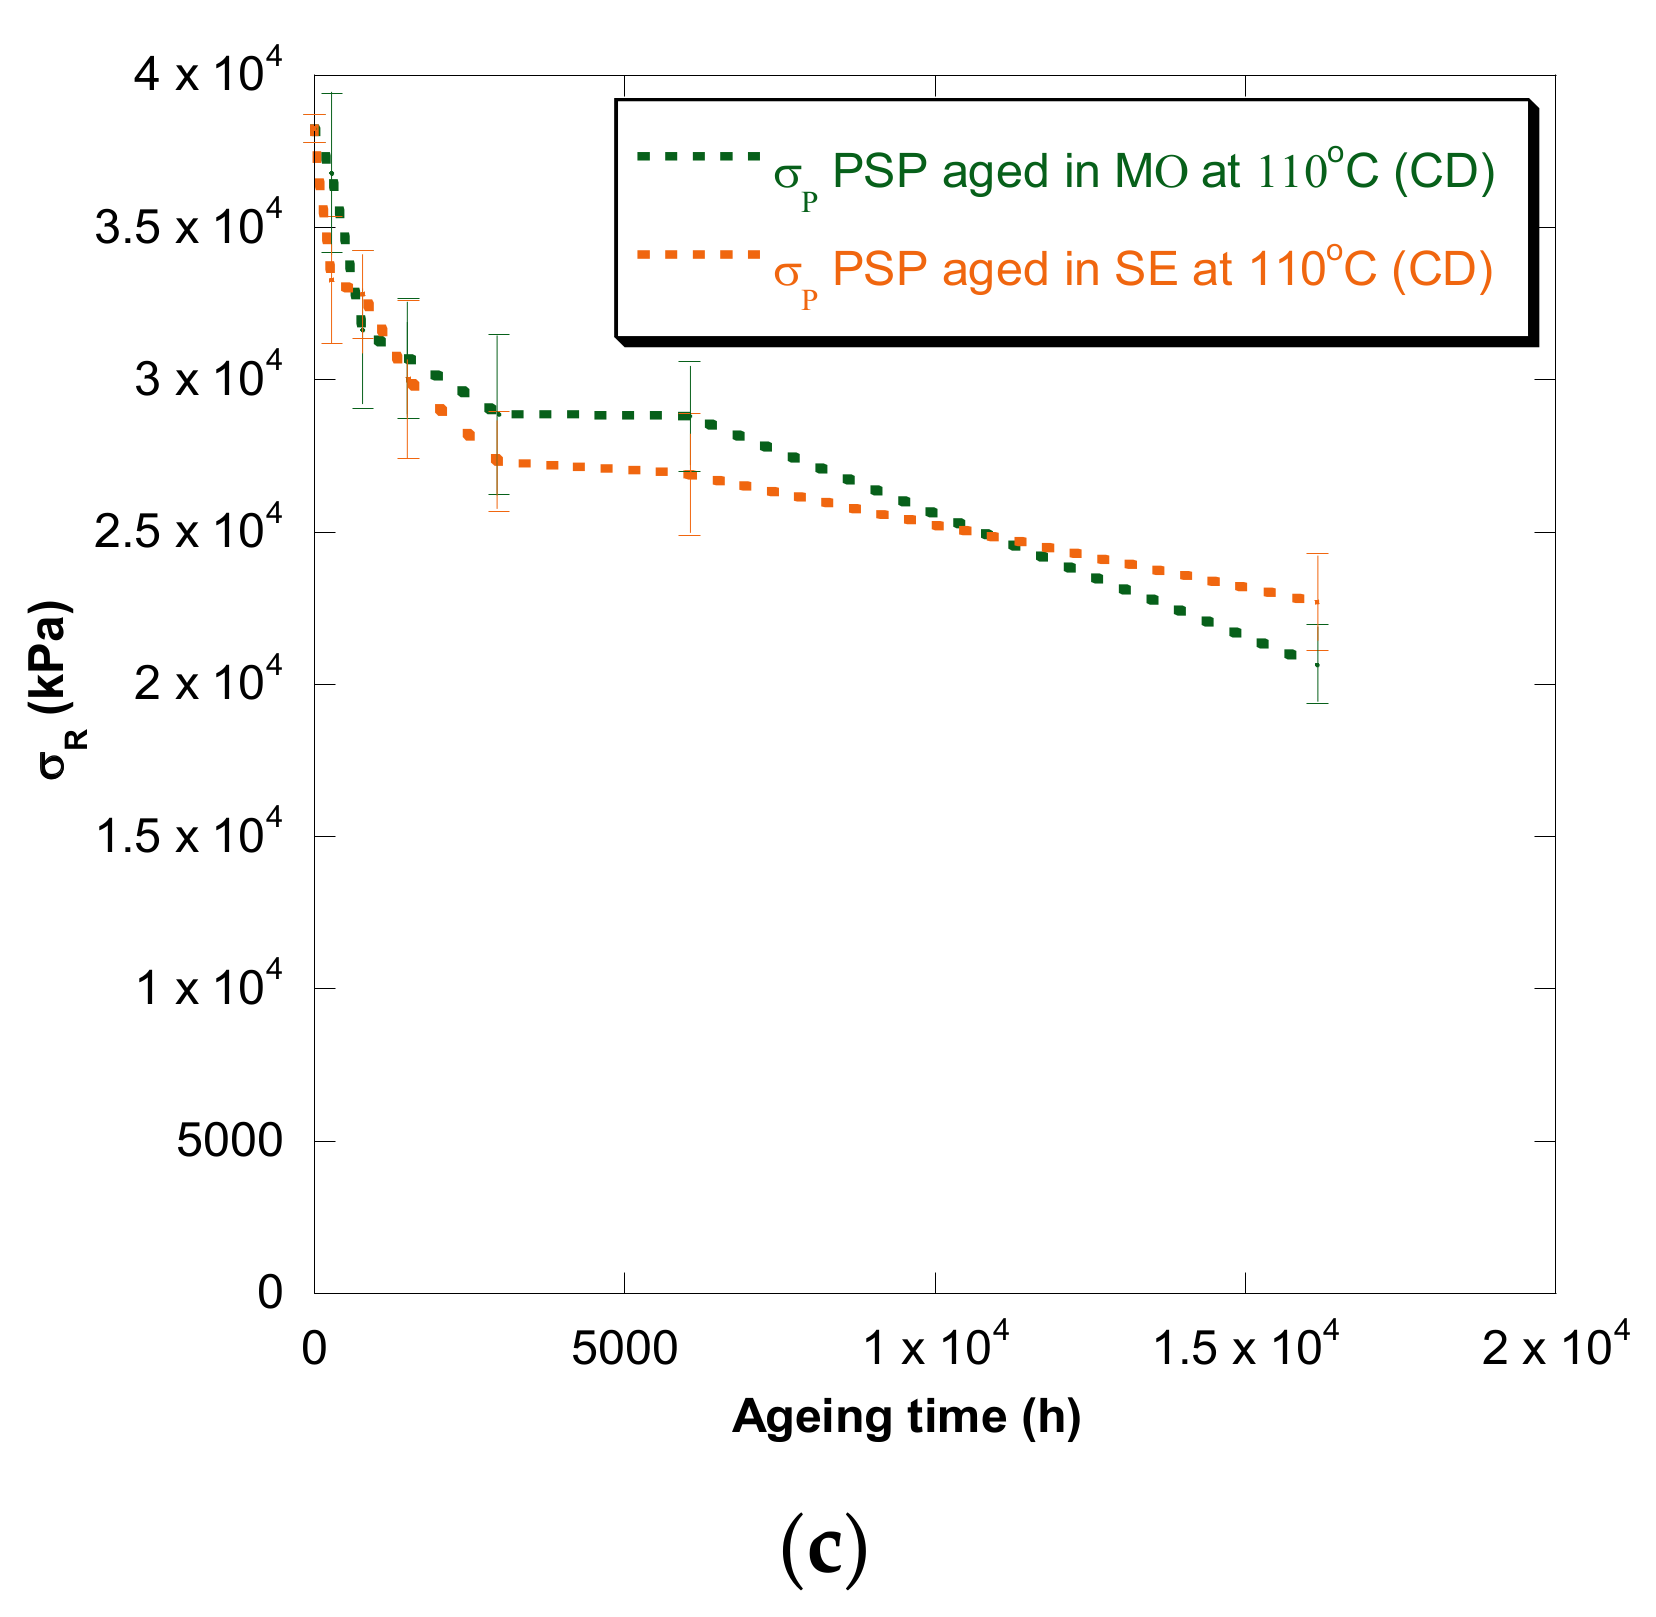
Figure 3.
Evolution of the σR in CD as a function of temperature for cellulose-board PSP 3055 aged in mineral oil and in synthetic ester at 150 °C (a), 130 °C (b), and 110 °C (c).
Figure 3.
Evolution of the σR in CD as a function of temperature for cellulose-board PSP 3055 aged in mineral oil and in synthetic ester at 150 °C (a), 130 °C (b), and 110 °C (c).
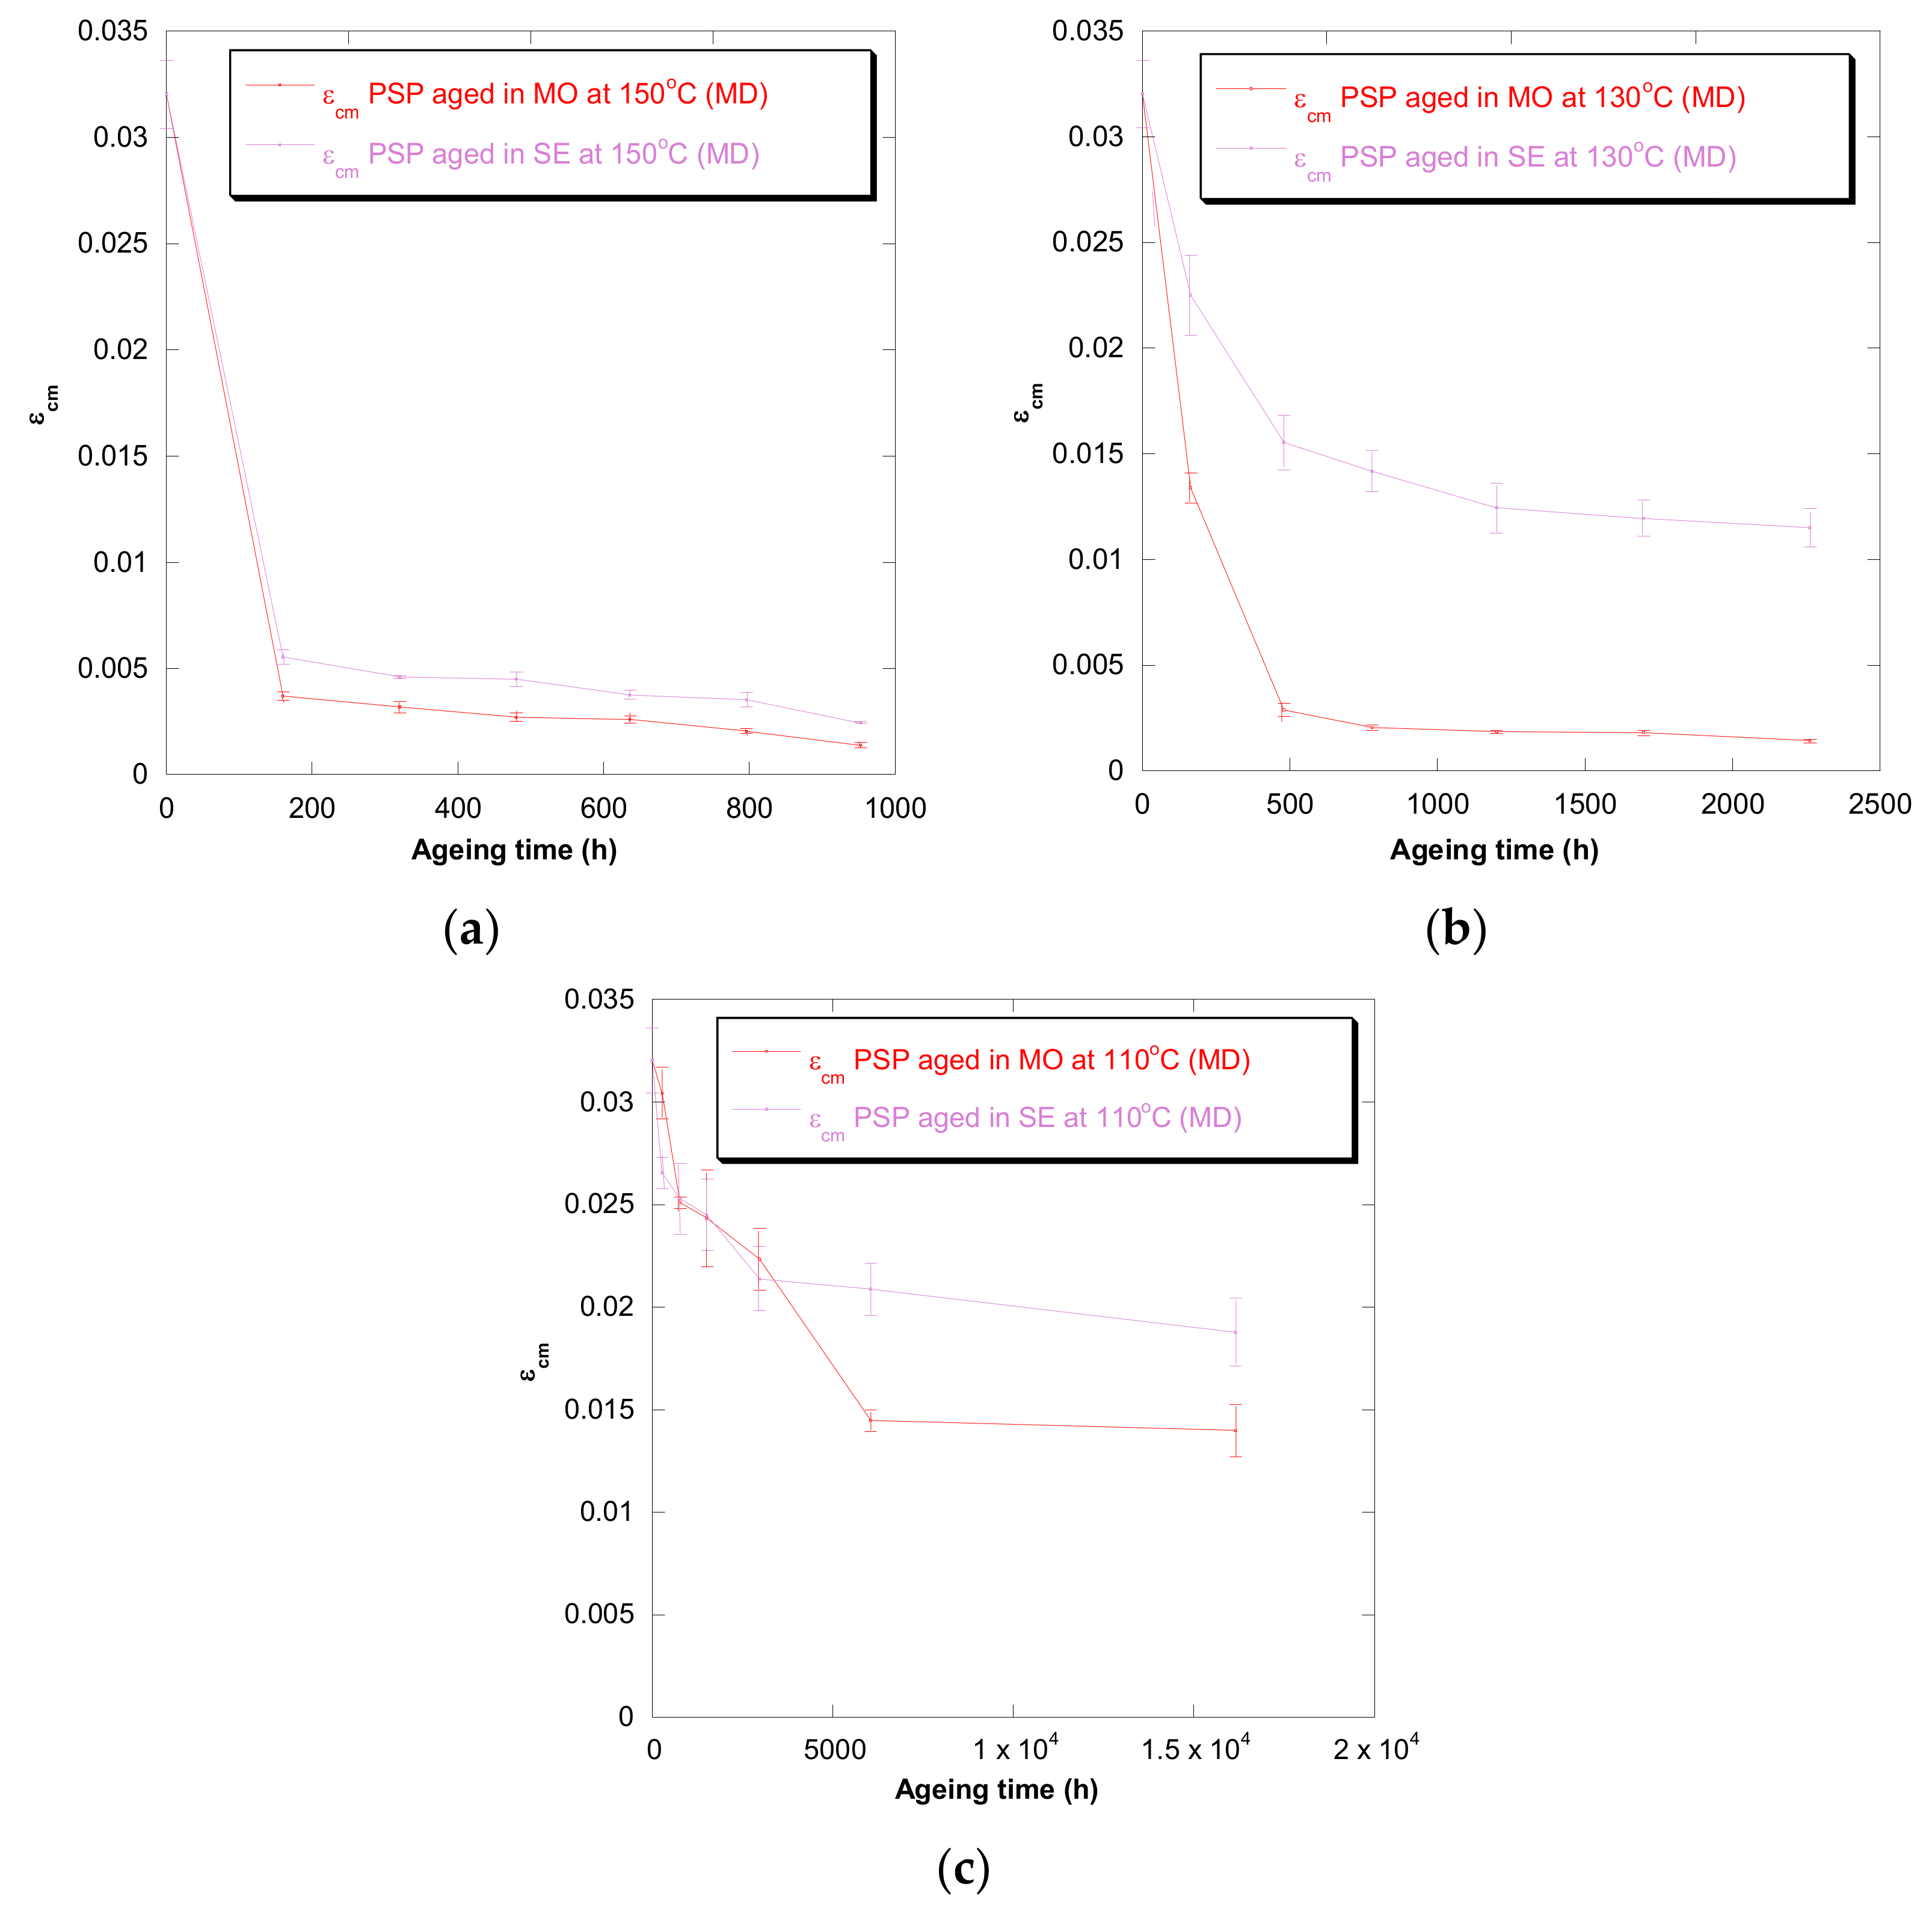
Figure 4.
Evolution of the εcm in MD as a function of temperature for cellulose-board PSP 3055 aged in mineral oil and in synthetic ester at 150 °C (a), 130 °C (b), and 110 °C (c).
Figure 4.
Evolution of the εcm in MD as a function of temperature for cellulose-board PSP 3055 aged in mineral oil and in synthetic ester at 150 °C (a), 130 °C (b), and 110 °C (c).
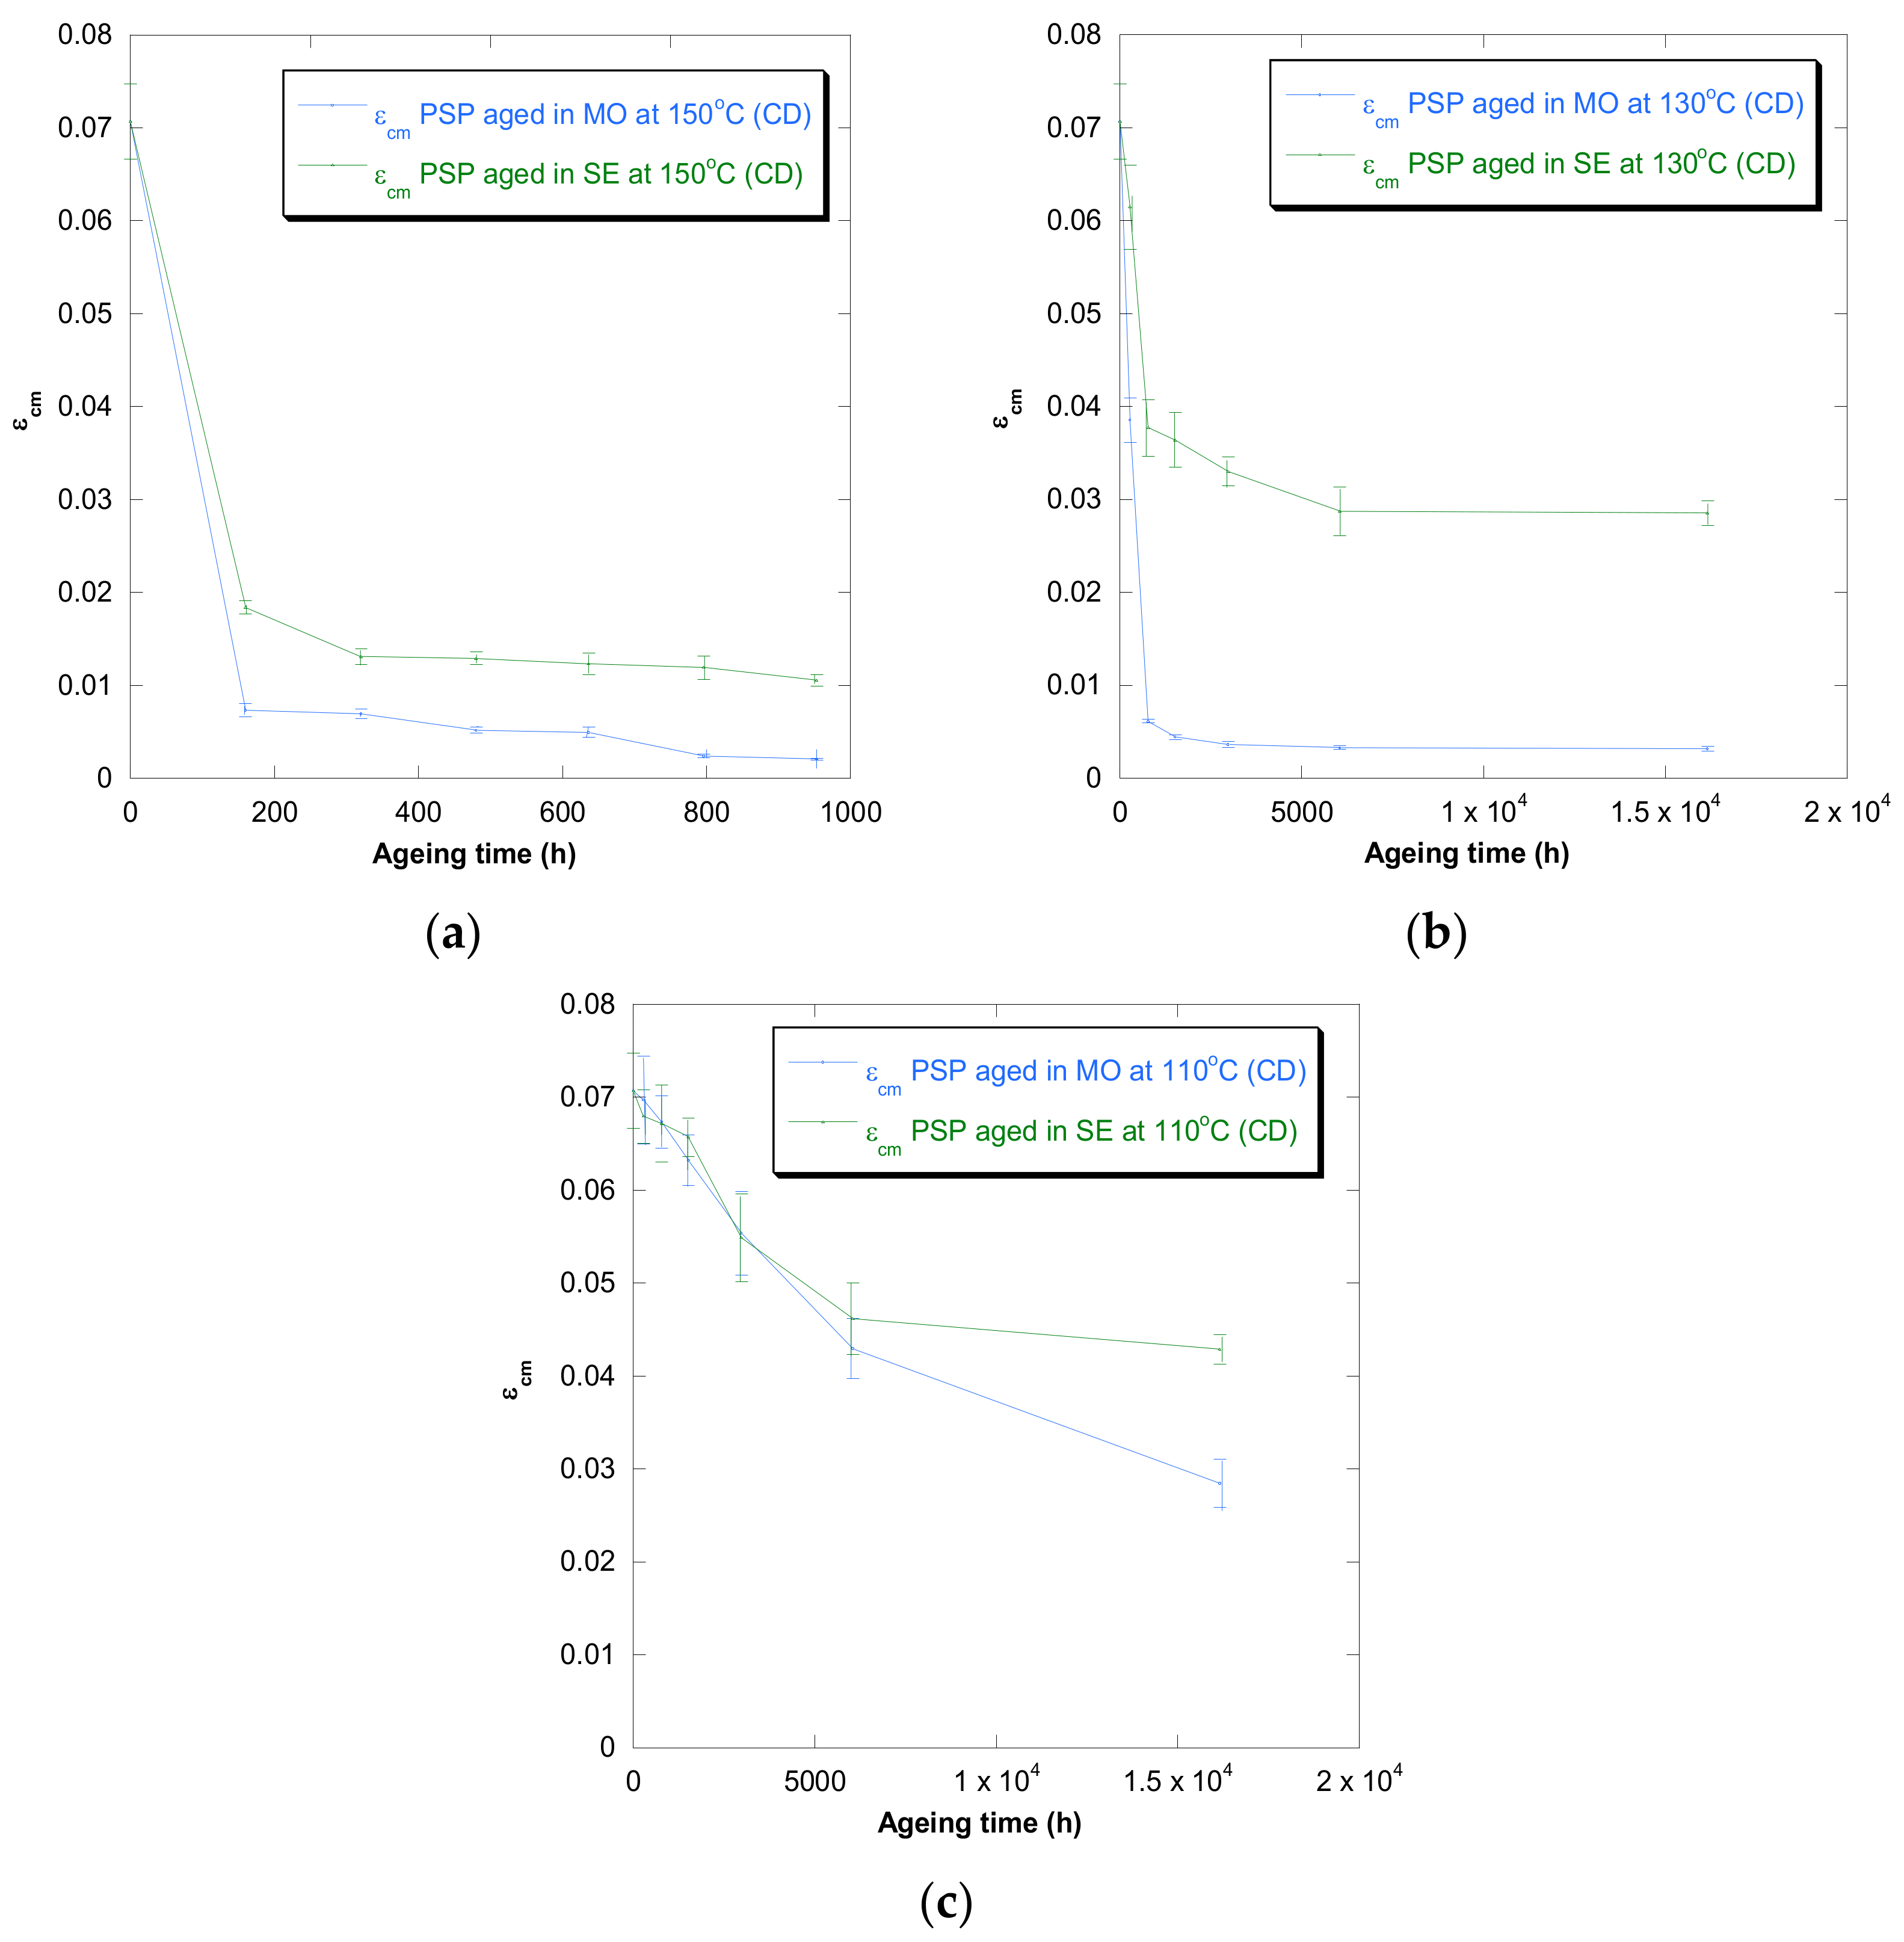
Figure 5.
Evolution of the εcm in CD as a function of temperature for cellulose-board PSP 3055 aged in mineral oil and in synthetic ester at 150 °C (a), 130 °C (b), and 110 °C (c).
Figure 5.
Evolution of the εcm in CD as a function of temperature for cellulose-board PSP 3055 aged in mineral oil and in synthetic ester at 150 °C (a), 130 °C (b), and 110 °C (c).
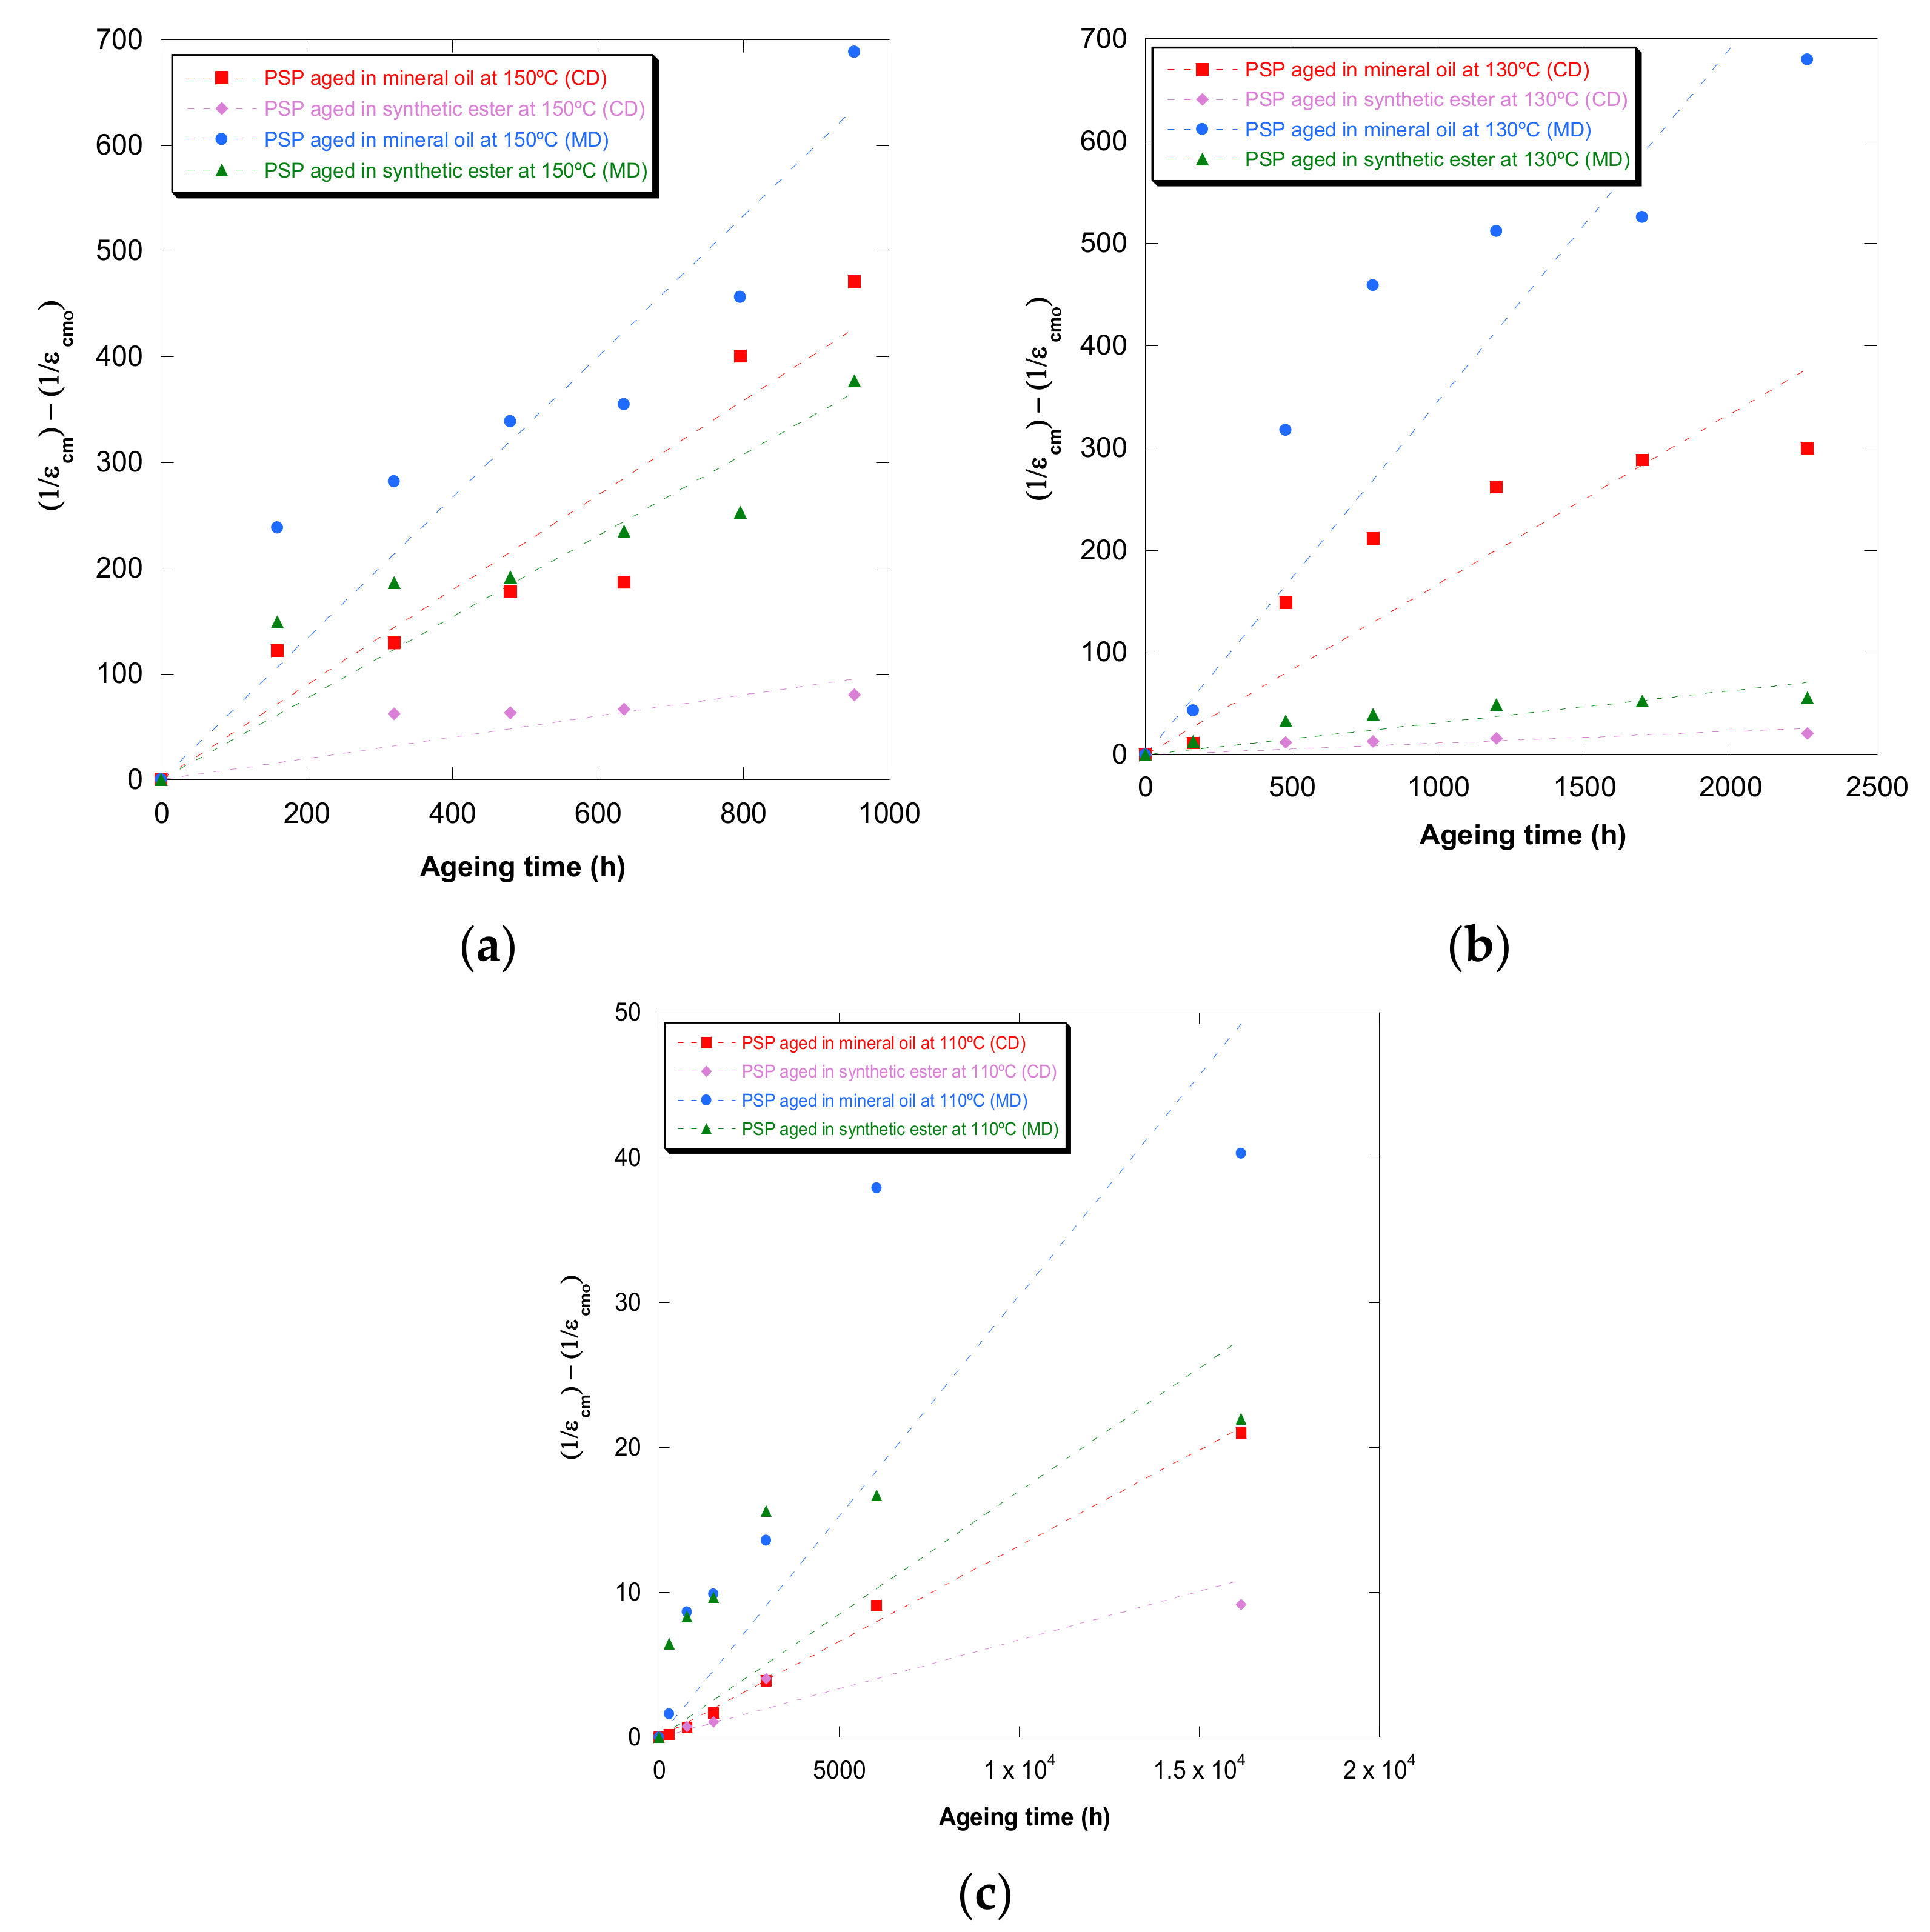
Figure 6.
Evolution of the (1/εcm − 1/εcm0) in MD and CD as a function of temperature for pressboard PSP 3055 aged in mineral oil and in synthetic ester at 150 °C (a), 130 °C (b), and 110 °C (c) and Ekenstam’s function.
Figure 6.
Evolution of the (1/εcm − 1/εcm0) in MD and CD as a function of temperature for pressboard PSP 3055 aged in mineral oil and in synthetic ester at 150 °C (a), 130 °C (b), and 110 °C (c) and Ekenstam’s function.
Figure 7.
Evolution of the (1/εcm − 1/εcm0) in MD and CD as a function of temperature for pressboard PSP 3055 aged in mineral oil and in synthetic ester at 150 °C (a), 130 °C (b), and 110 °C (c) and Emsley’s function.
Figure 7.
Evolution of the (1/εcm − 1/εcm0) in MD and CD as a function of temperature for pressboard PSP 3055 aged in mineral oil and in synthetic ester at 150 °C (a), 130 °C (b), and 110 °C (c) and Emsley’s function.
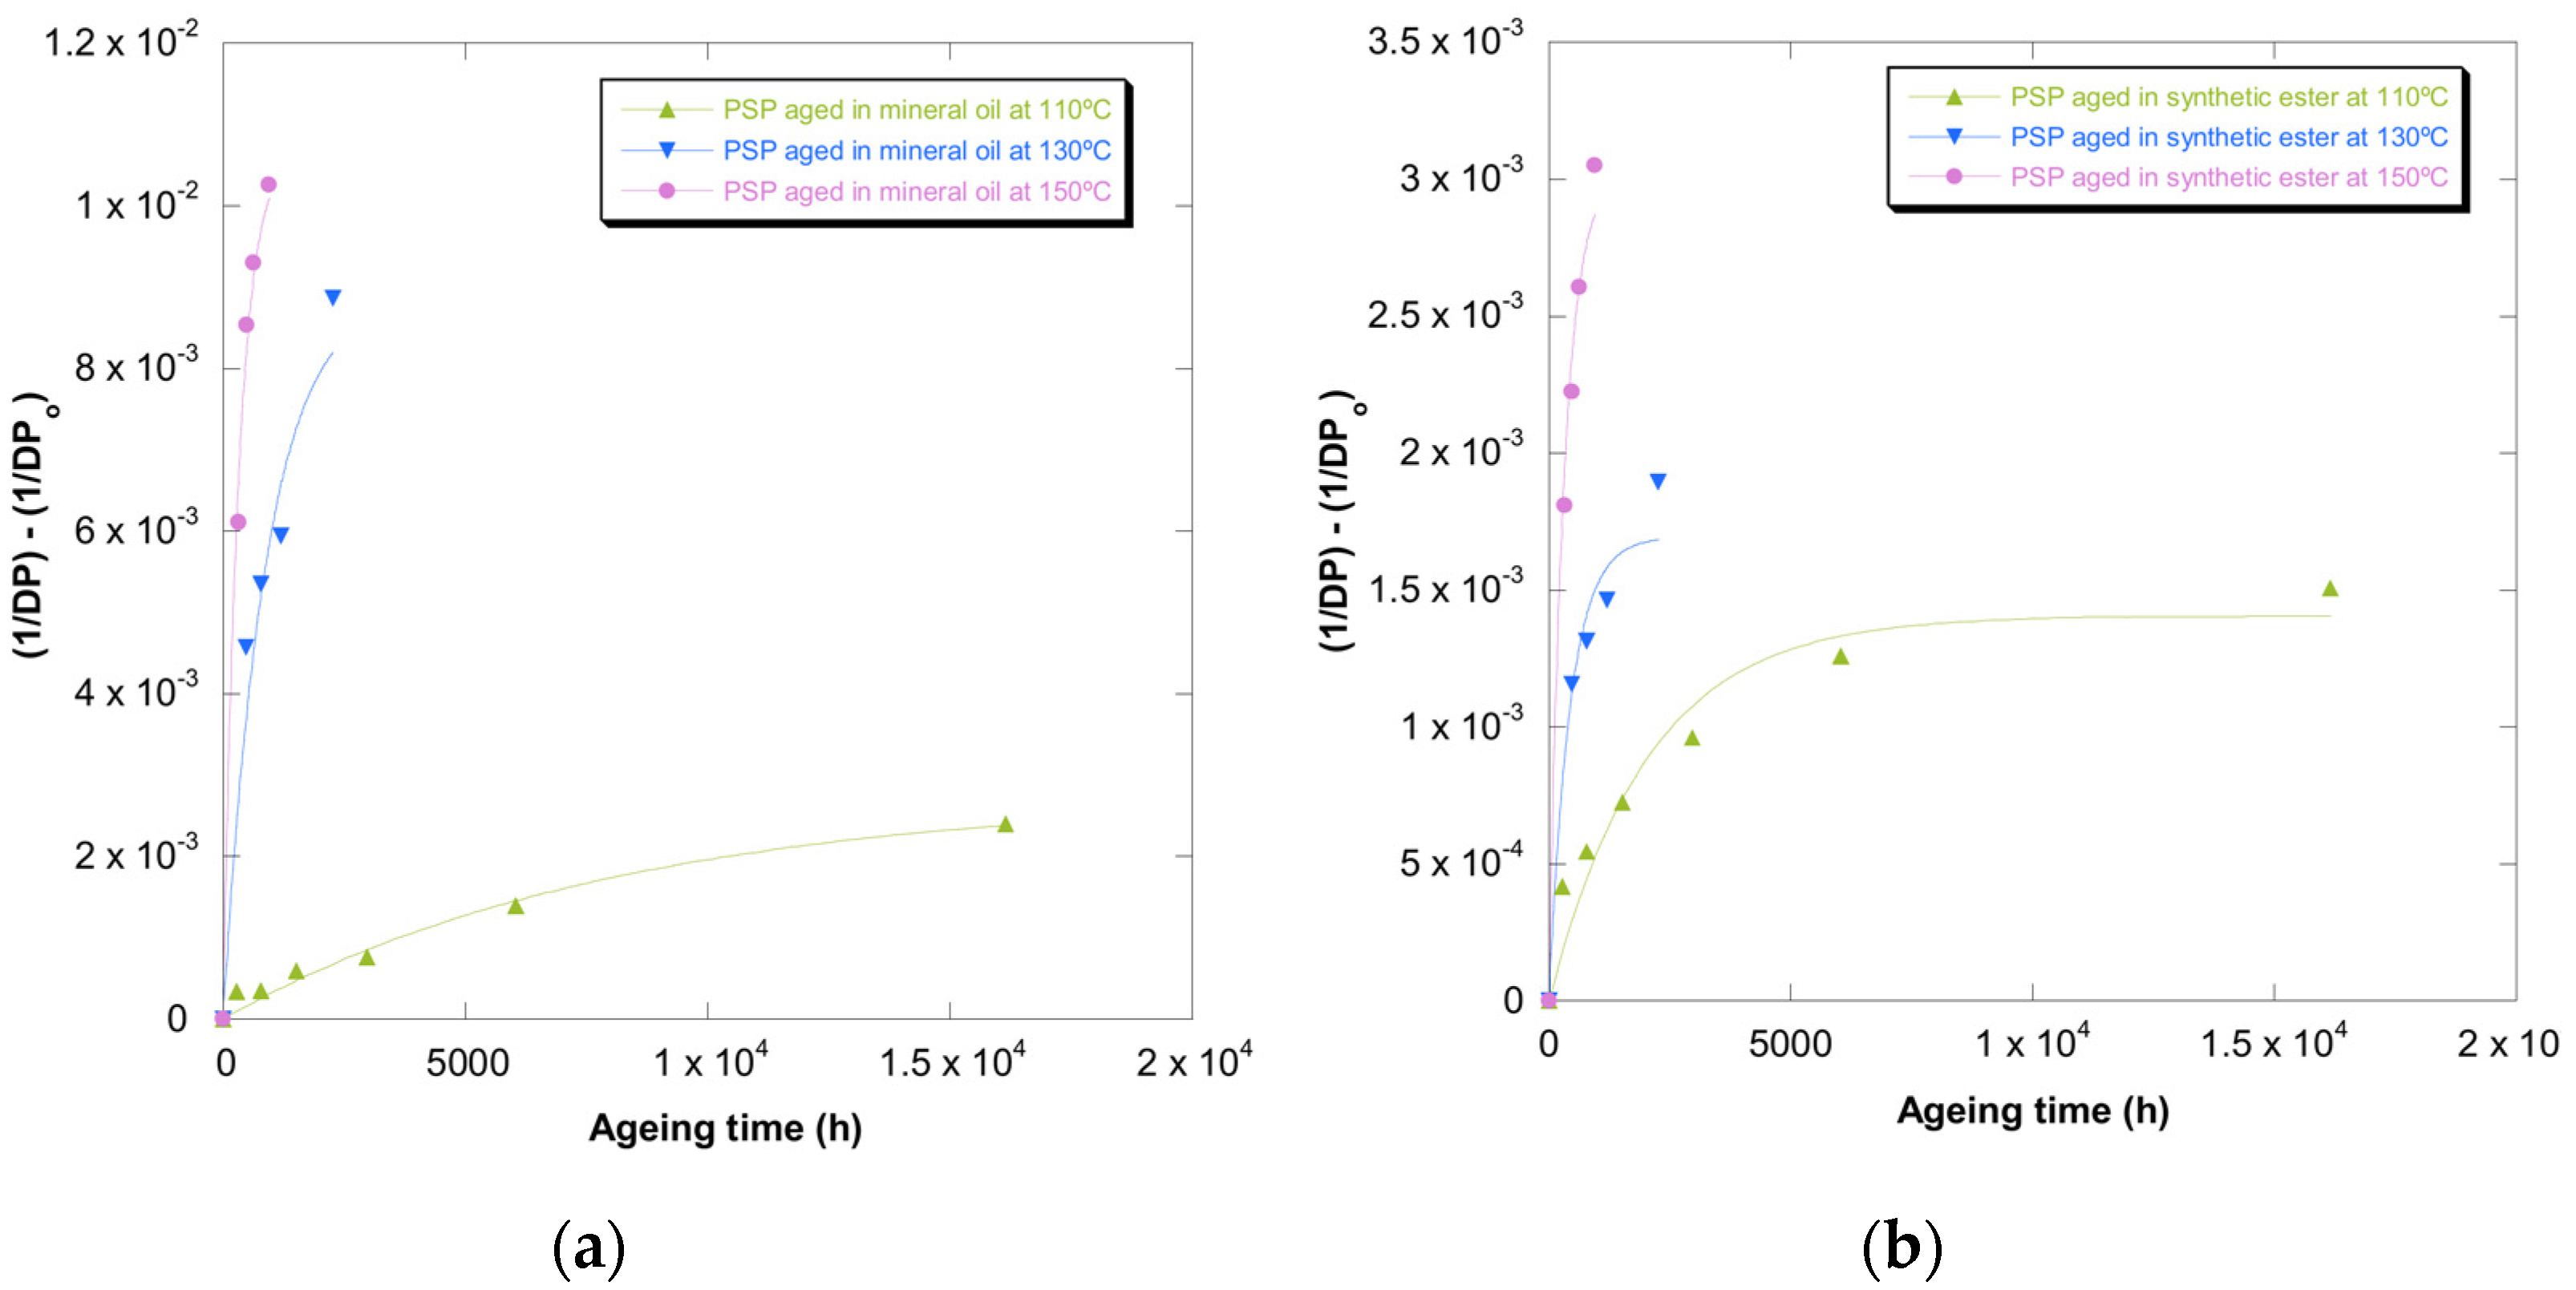
Figure 8.
Evolution of the (1/DP -1/DP0) as a function of temperature for pressboard PSP 3055 aged at 150 °C, 130 °C, and 110 °C, and Zervos’ function, in mineral oil (a) and in synthetic ester (b).
Figure 8.
Evolution of the (1/DP -1/DP0) as a function of temperature for pressboard PSP 3055 aged at 150 °C, 130 °C, and 110 °C, and Zervos’ function, in mineral oil (a) and in synthetic ester (b).
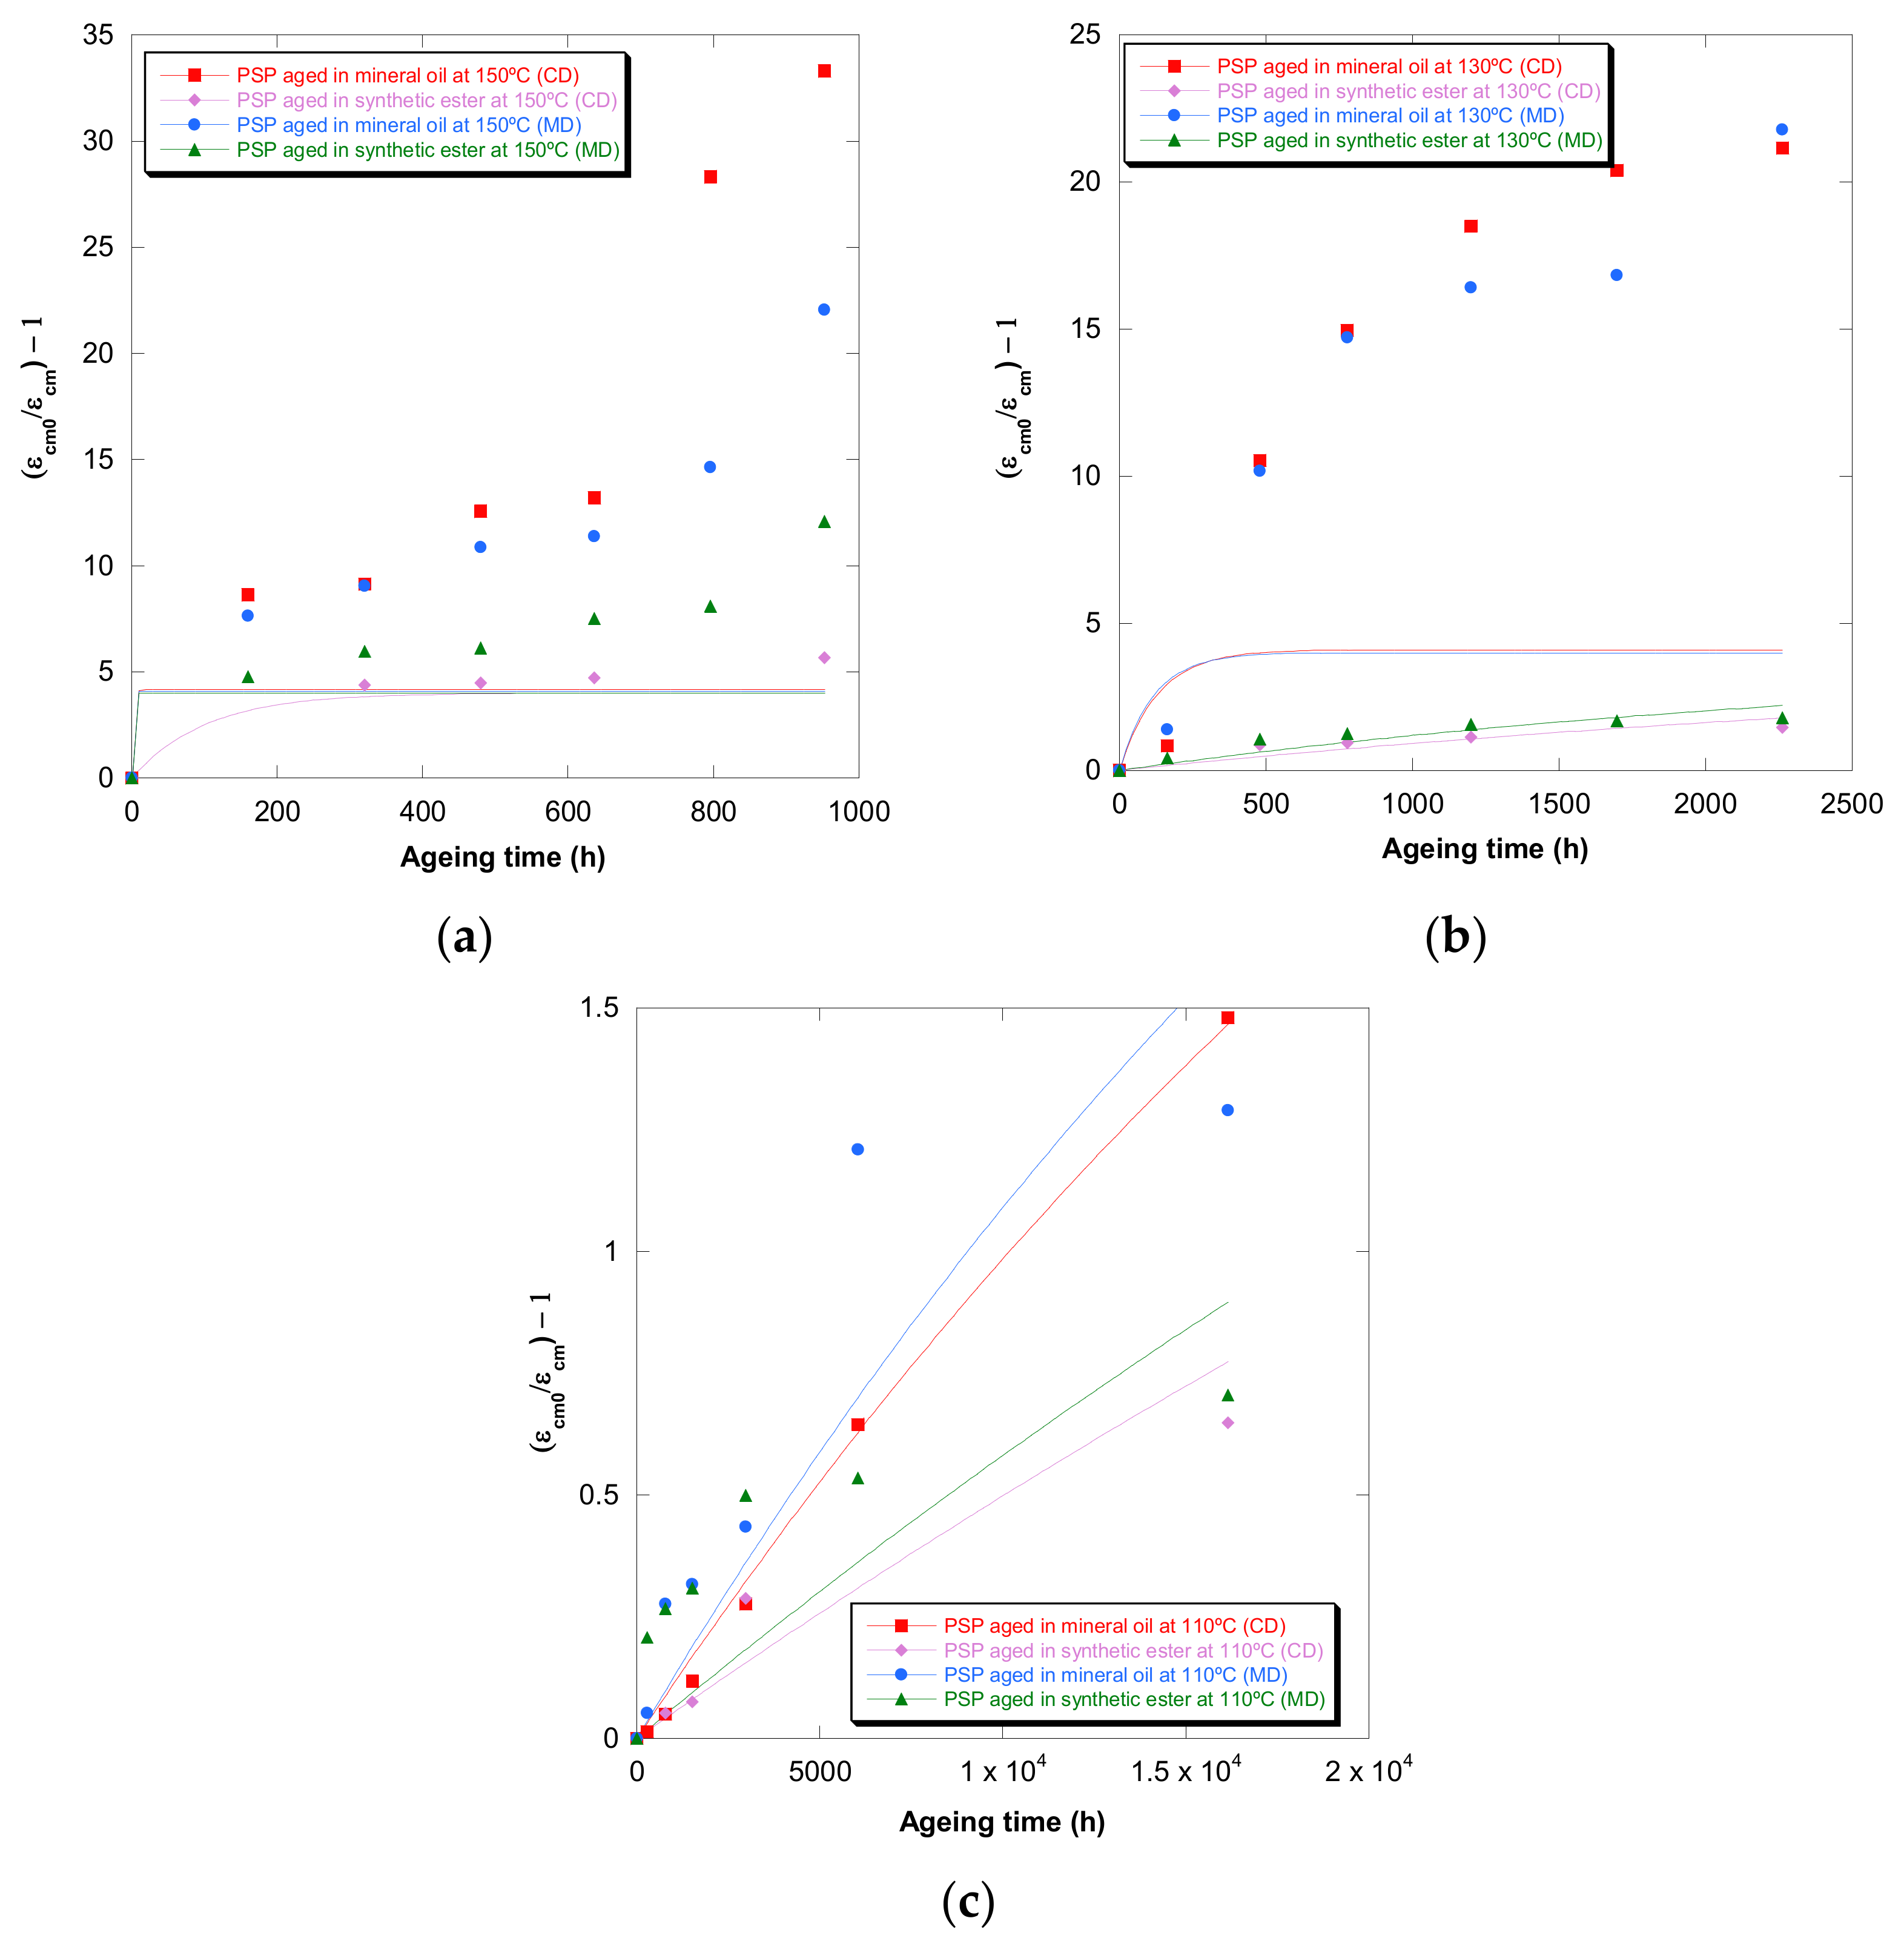
Figure 9.
Evolution of the (εcm0/εcm) − 1 in MD and CD as a function of temperature for pressboard PSP 3055 aged in mineral oil and in synthetic ester at 150 °C (a), 130 °C (b), and 110 °C (c) and Calvini’s function.
Figure 9.
Evolution of the (εcm0/εcm) − 1 in MD and CD as a function of temperature for pressboard PSP 3055 aged in mineral oil and in synthetic ester at 150 °C (a), 130 °C (b), and 110 °C (c) and Calvini’s function.
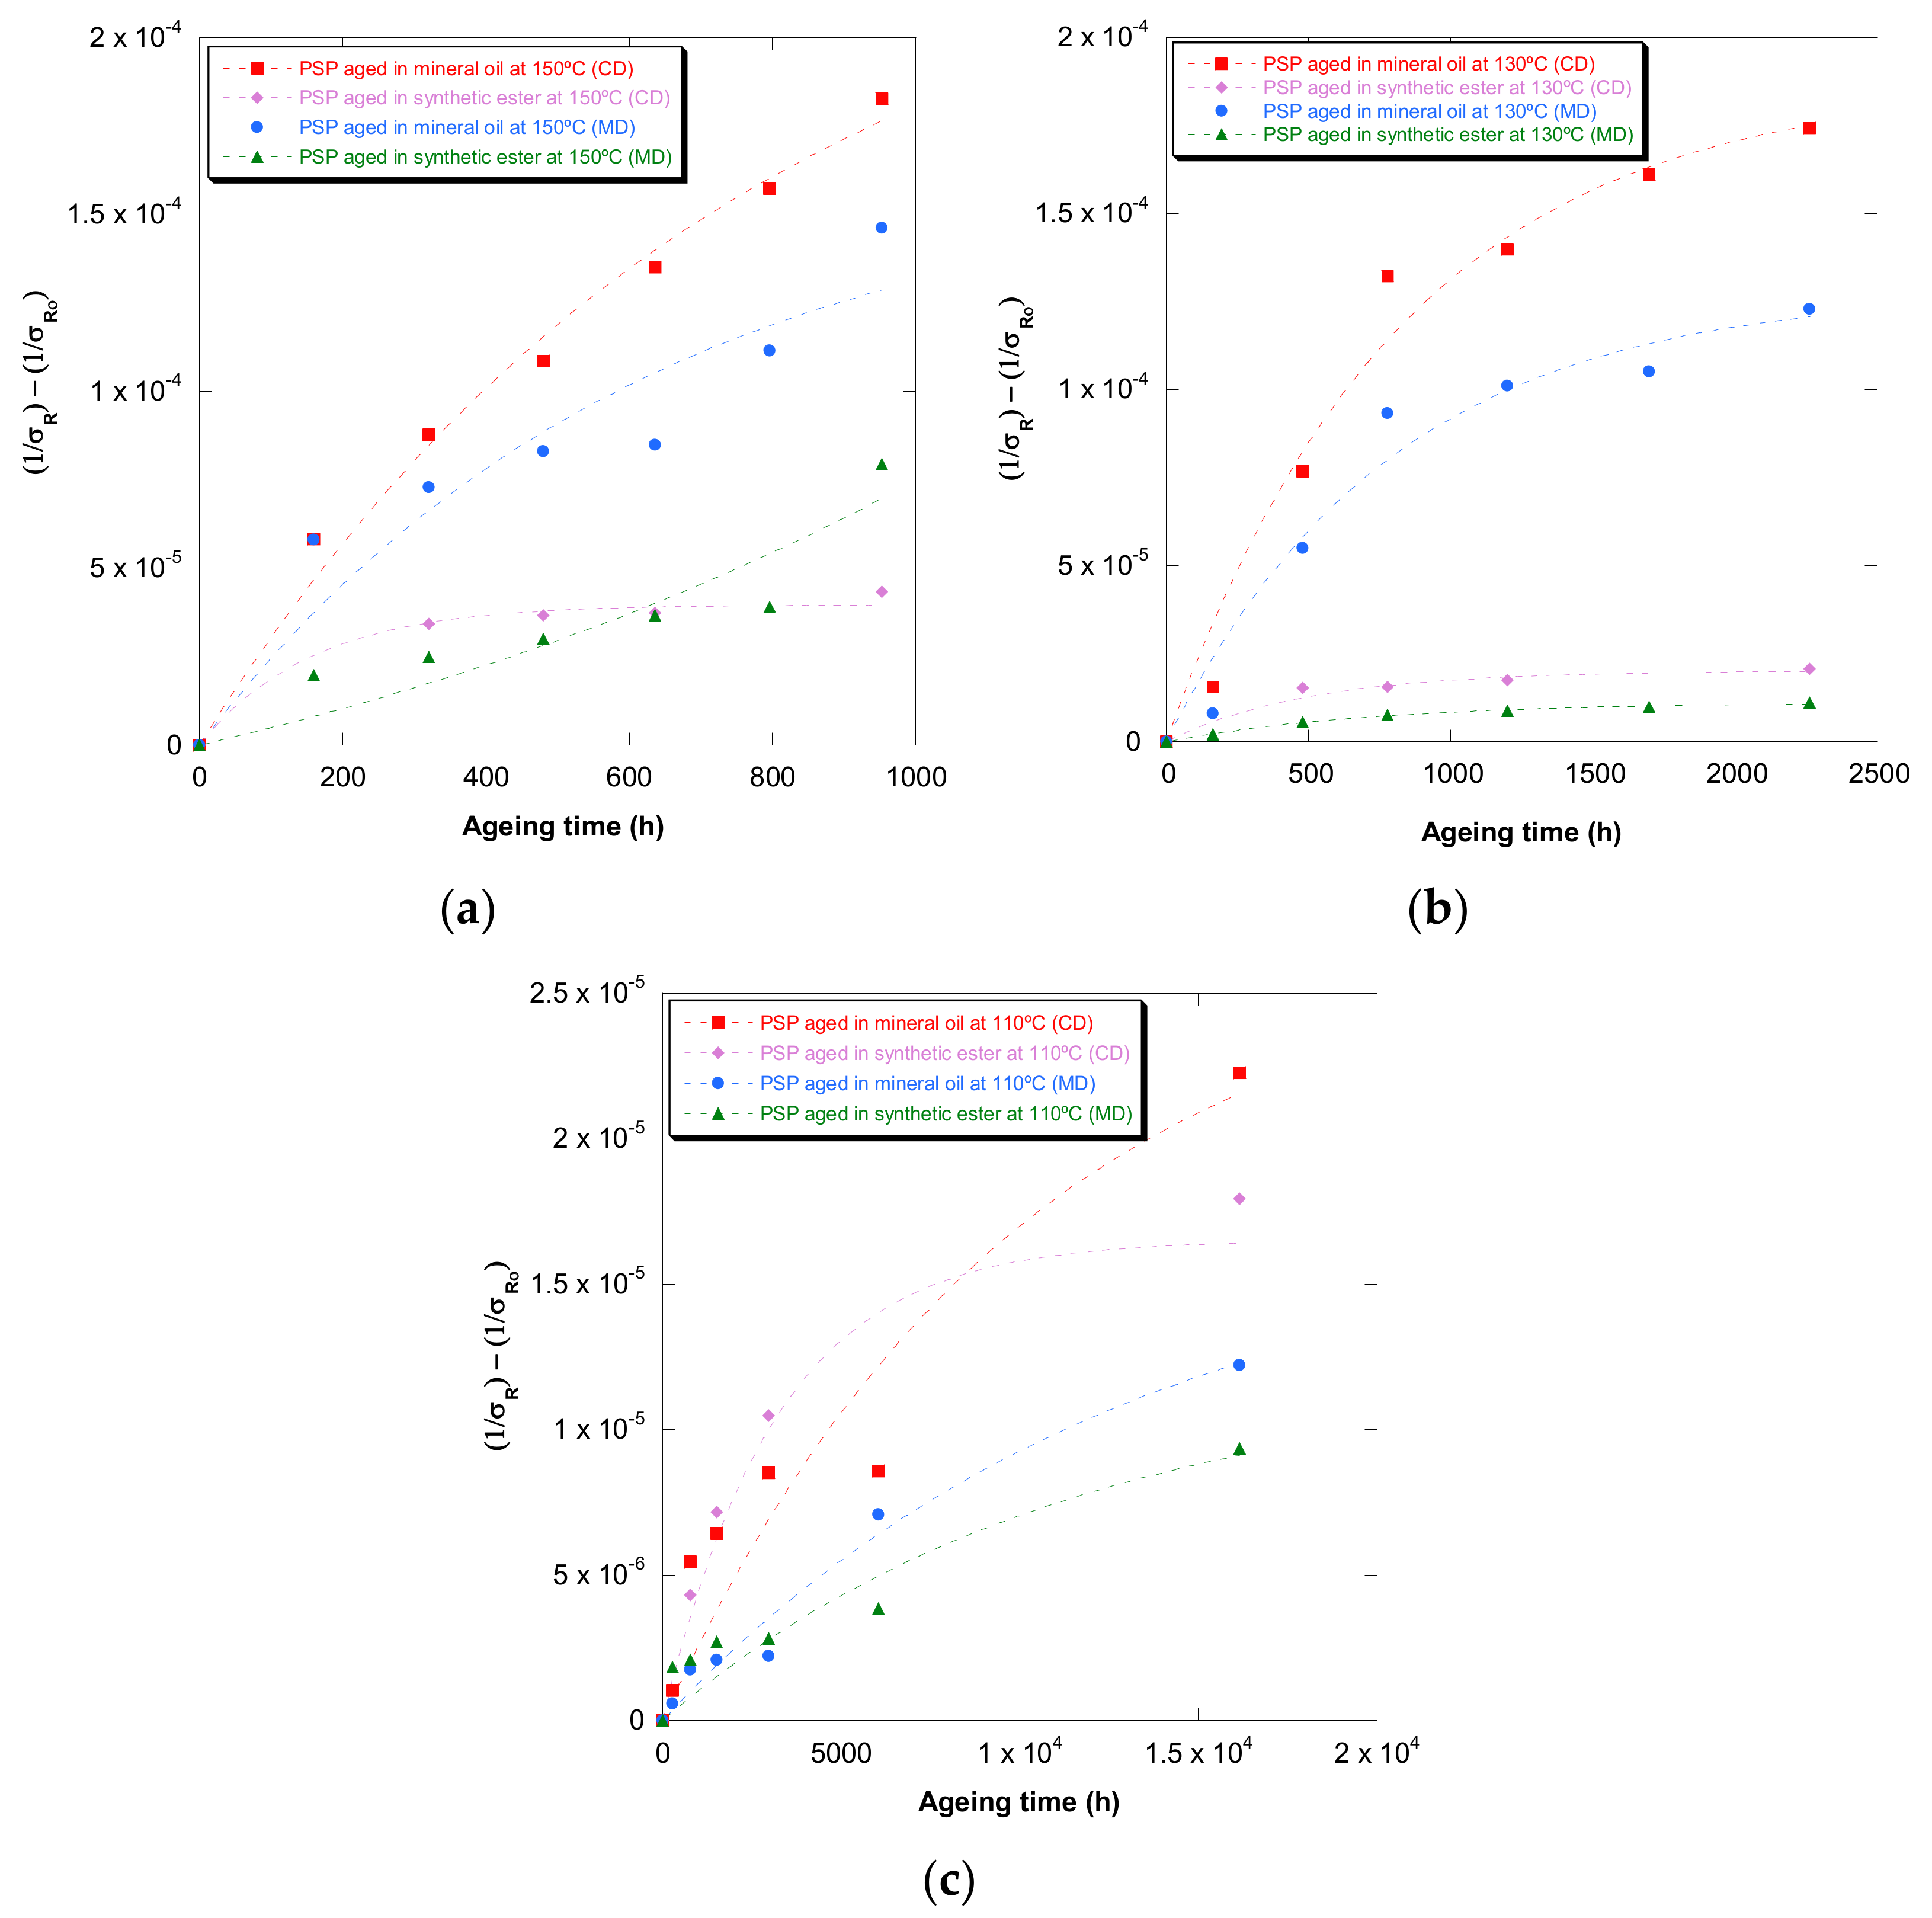
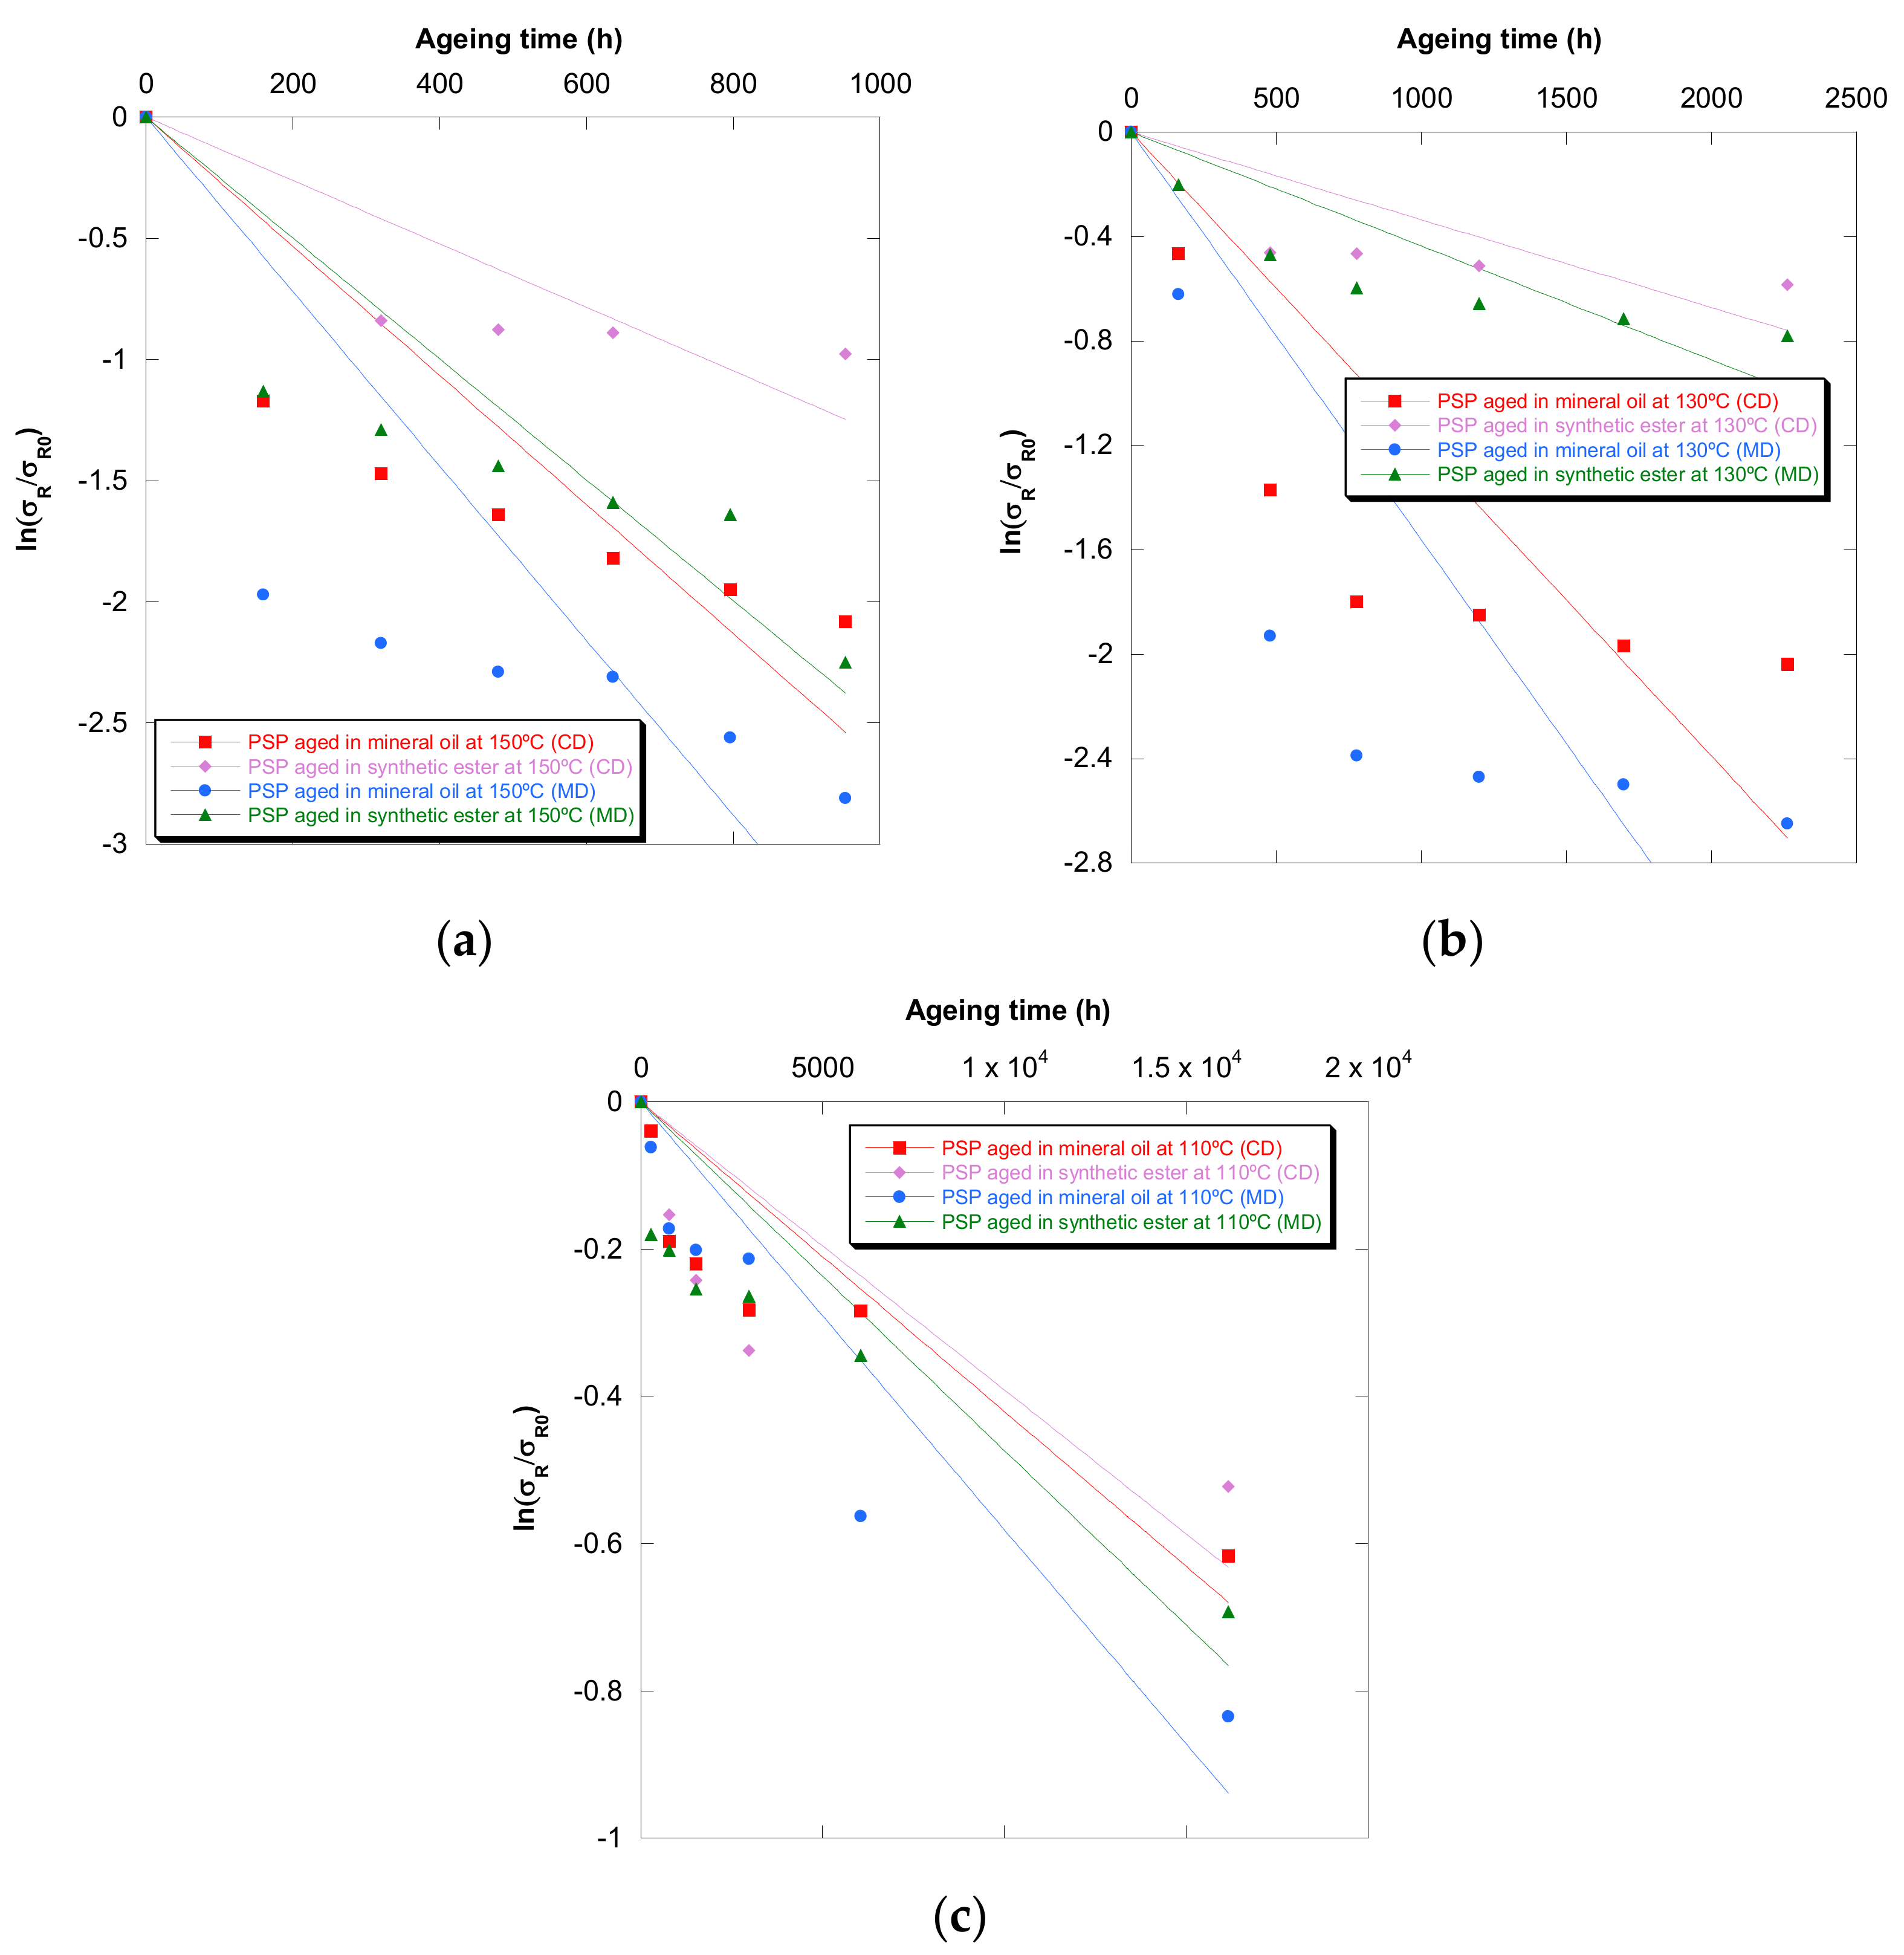
Figure 10.
Evolution of the ln (σR/σR0) in MD and CD as a function of temperature for pressboard PSP 3055 aged in mineral oil and in synthetic ester at 150 °C (a), 130 °C (b), and 110 °C (c) and Weidmann’s function.
Figure 10.
Evolution of the ln (σR/σR0) in MD and CD as a function of temperature for pressboard PSP 3055 aged in mineral oil and in synthetic ester at 150 °C (a), 130 °C (b), and 110 °C (c) and Weidmann’s function.
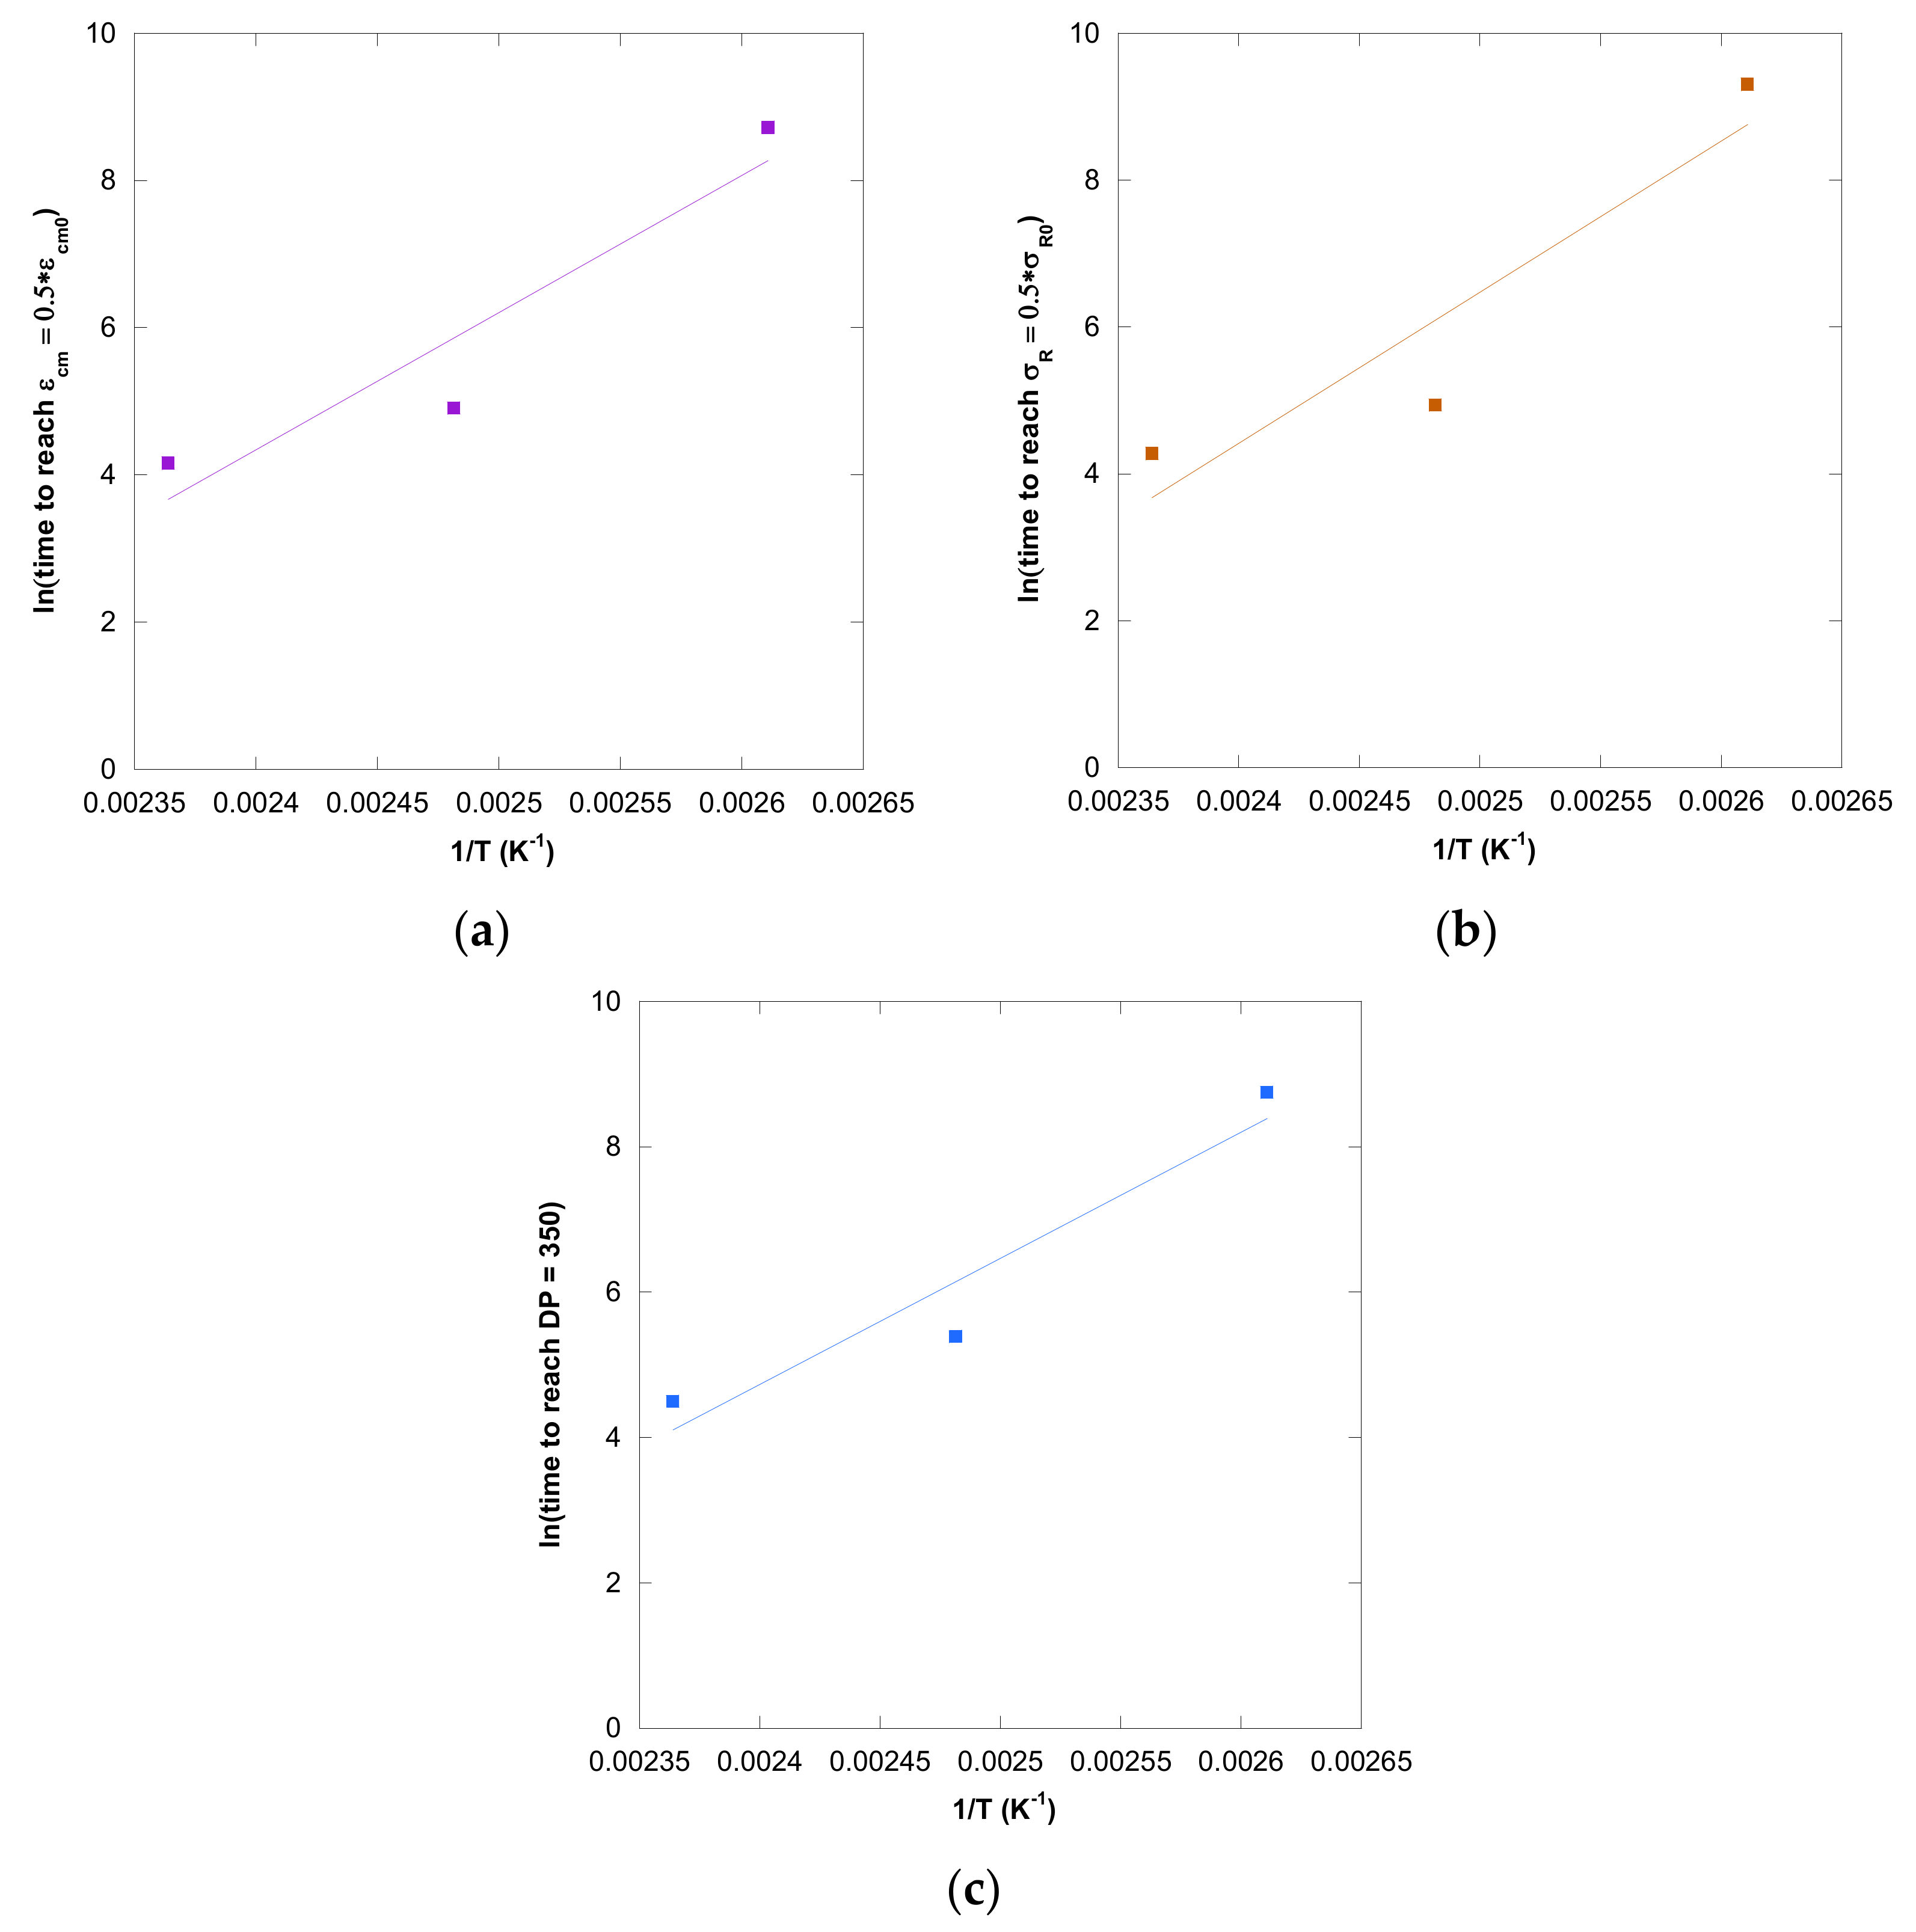
Figure 11.
Evolution of the ln (time) vs. inverse temperature in CD for pressboard PSP 3055 aged in mineral oil considering: εcm (a), σR (b), and DP (c).
Figure 11.
Evolution of the ln (time) vs. inverse temperature in CD for pressboard PSP 3055 aged in mineral oil considering: εcm (a), σR (b), and DP (c).
Table 1.
Kinetic models of cellulose solid deterioration.
Table 1.
Kinetic models of cellulose solid deterioration.
| Ekenstam Kinetic model |
| (1) | [23] |
| where is the Number of average degree of polymerization at the time of 0, is the Number of average degree of polymerization at the time of t, is the Constant rate of reaction, and is the Aging time (h). |
| Emsley kinetic model |
| (2) | [24] |
| where
and
are Temperature-dependent constants. |
| Zervos Kinetic model |
| (3) | [25] |
| where and are Temperature-dependent constants. |
| Calvini Kinetic model |
| (4) | [26] |
| where is the Leveling-off degree of polymerization. |
| Weidmann Kinetic model |
| (5) | [27] |
| (6) |
| where is the Tensile strength aged, is the Tensile strength unaged and and are Coefficients of aging. |
| IEEE Kinetic model |
| (7) | [28] |
| where ln is the Lifetime of the power transformer and and are Temperature-dependent constants. |
Table 2.
PSP 3055 properties.
Table 2.
PSP 3055 properties.
| Property | Value |
|---|
| Apparent density (kg/m3) | 1100 ± 6.20% |
| Degree of polymerization (before impregnation) | 750 ± 9.50% |
| pH of aqueous extract | 7.20 ± 8.41% |
| Moisture content (%) | <8 ± 4.32% |
| Ash content (%) | 0.30 ± 8.22% |
| Conductivity of aqueous extract (mS/m) | 2.0 ± 9.70% |
| Electric strength in air unfolded (kV/mm) | 7 ± 3.11% |
| Electric strength in oil (kV/mm) | 50 ± 5.40% |
Table 3.
Properties of commercial oils analyzed.
Table 3.
Properties of commercial oils analyzed.
| Property | Standard | Mineral Oil (MO) | Synthetic Ester (SE) |
|---|
| Viscosity, 40 °C (mm2/s) | ISO 3104, ASTM D445 | 10.30 ± 2.90% | 29 ± 12.70% |
| Density, 20 °C (kg/dm3) | ISO 3675, ASTM D4052 | 0.84 ± 6.50% | 0.97 ± 3.20% |
| Pour point (°C) | ISO 3016, ASTM D97 | −63 ± 9.70% | −56 ± 10.00% |
| Flash point (°C) | ISO 2719, ASTM D92 | 160 ± 8.60% | 260 ± 9.20% |
| Water content (mg/kg) | IEC 60814 | 15 ± 8.70% | 50 ± 11.50% |
| Breakdown voltage (kV) | IEC 60156 | >70 ± 7.30% | >75 ± 12.40% |
| Acidity (mg KOH/g) | IEC 62021.1, ASTM D974 | <0.01 ± 1.70% | <0.03 ± 3.20% |
| Dielectric dissipation factor (90 °C) | IEC 60247 | 7 × 10⁻⁴ ± 8.20% | <8 × 10⁻³ ± 12.80% |
Table 4.
Constant rates of reaction for Ekenstam model based on DP, εcm, and σR for different insulation oils.
Table 4.
Constant rates of reaction for Ekenstam model based on DP, εcm, and σR for different insulation oils.
|
| |
Mineral oil
|
Synthetic ester
|
| Temperature (°C) | k (DP) | R2 | k (DP) | R2 |
| 150 | 1.30 × 10⁻⁵ ± 10.47% | 0.74 ± 0.82% | 3.72 × 10⁻⁶ ± 11.29% | 0.72 ± 9.33% |
| 130 | 4.41 × 10⁻⁶ ± 11.96% | 0.80 ± 0.06% | 1.01 × 10⁻⁶ ± 12.07% | 0.49 ± 4.84% |
| 110 | 1.65 × 10⁻⁷ ± 8.76% | 0.86 ± 0.55% | 1.17 × 10⁻⁷ ± 8.26% | 0.07 ± 12.38% |
| Temperature (°C) | k (εcm) CD | R2 | k (εcm) CD | R2 |
| 150 | 4.48 × 10⁻¹ ± 6.31% | 0.89 ± 0.47% | 1.01 × 10⁻¹ ± 7.29% | 0.53 ± 8.03% |
| 130 | 1.67 × 10⁻¹ ± 7.02% | 0.77 ± 2.28% | 1.15 × 10⁻² ± 6.53% | 0.76 ± 4.86% |
| 110 | 1.32 × 10⁻³ ± 7.62% | 0.99 ± 4.22% | 6.73 × 10⁻⁴ ± 3.89% | 0.77 ± 9.04% |
| Temperature (°C) | k (εcm) MD | R2 | k (εcm) MD | R2 |
| 150 | 6.67 × 10⁻¹ ± 6.83% | 0.87 ± 0.34% | 3.84 × 10⁻¹ ± 4.69% | 0.81 ± 2.70% |
| 130 | 3.46 × 10⁻¹ ± 5.87% | 0.79 ± 1.01% | 3.13 × 10⁻² ± 8.99% | 0.63 ± 3.56% |
| 110 | 3.05 × 10⁻³ ± 9.08% | 0.66 ± 11.07% | 1.70 × 10⁻³ ± 11.76% | 0.03 ± 7.65% |
| Temperature (°C) | k (σR) CD | R2 | k (σR) CD | R2 |
| 150 | 2.06 × 10⁻⁷ ± 5.13% | 0.94 ± 1.25% | 5.55 × 10⁻⁸ ± 6.50% | 0.37 ± 1.94% |
| 130 | 9.49 × 10⁻⁸ ± 11.82% | 0.77 ± 0.06% | 1.16 × 10⁻⁸ ± 5.54% | 0.54 ± 5.43% |
| 110 | 1.46 × 10⁻⁹ ± 8.74% | 0.83 ± 6.12% | 1.30 × 10⁻⁹ ± 9.16% | 0.45 ± 6.10% |
| Temperature (°C) | k (σR) MD | R2 | k (σR) MD | R2 |
| 150 | 1.54 × 10⁻⁷ ± 3.89% | 0.83 ± 3.32% | 6.79 × 10⁻⁸ ± 4.62% | 0.83 ± 0.82% |
| 130 | 6.58 × 10⁻⁸ ± 7.86% | 0.75 ± 2.58% | 5.94 × 10⁻⁹ ± 9.22% | 0.74 ± 7.06% |
| 110 | 8.13 × 10⁻¹⁰ ± 11.28% | 0.93 ± 0.48% | 6.12 × 10⁻⁶ ± 9.98% | 0.81 ± 1.43% |
Table 5.
Constant rates of reaction for the Emsley model based on DP, εcm, and σR for different insulation oils.
Table 5.
Constant rates of reaction for the Emsley model based on DP, εcm, and σR for different insulation oils.
|
| |
Mineral oil
|
Synthetic ester
|
| Temperature (°C) | k10 (DP) | k2 (DP) | R2 | k10 (DP) | k2 (DP) | R2 |
| 150 | 3.23 × 10⁻⁵ ± 9.31% | 3.02 × 10⁻³ ± 1.23% | 0.99 ± 0.40% | 9.59 × 10⁻⁶ ± 0.78% | 3.18 × 10⁻³ ± 8.30% | 0.98 ± 0.19% |
| 130 | 9.97 × 10⁻⁶ ± 10.35% | 1.12 × 10⁻³ ± 0.97% | 0.96 ± 0.52% | 3.85 × 10⁻⁶ ± 9.80% | 2.28 × 10⁻³ ± 3.46% | 0.96 ± 1.82% |
| 110 | 3.43 × 10⁻⁷ ± 8.26% | 1.25 × 10⁻⁴ ± 0.94% | 0.97 ± 0.51% | 5.03 × 10⁻⁷ ± 10.20% | 3.36 × 10⁻⁴ ± 9.96% | 0.91 ± 4.66% |
| Temperature (°C) | k10 (εcm) CD | k2 (εcm) CD | R2 | k10 (εcm) CD | k2 (εcm) CD | R2 |
| 150 | 2.89 × 10⁻¹ ± 10.54% | −1.05 × 10⁻³ ± 9.69% | 0.92 ± 0.13% | 3.59 × 10⁻¹ ± 0.66% | 4.84 × 10⁻³ ± 8.61% | 0.98 ± 1.16% |
| 130 | 3.95 × 10⁻¹ ± 4.22% | 1.20 × 10⁻³ ± 4.46% | 0.97 ± 0.24% | 2.79 × 10⁻² ± 10.93% | 1.25 × 10⁻³ ± 8.46% | 0.97 ± 0.61% |
| 110 | 1.49 × 10⁻³ ± 6.23% | 1.66 × 10⁻⁵ ± 9.54% | 0.99 ± 1.30% | 1.74 × 10⁻³ ± 10.85% | 1.72 × 10⁻⁴ ± 10.16% | 0.96 ± 1.91% |
| Temperature (°C) | k10 (εcm) MD | k2 (εcm) MD | R2 | k10 (εcm) MD | k2 (εcm) MD | R2 |
| 150 | 8.27 × 10⁻¹ ± 5.97% | 5.90 × 10⁻⁴ ± 4.49% | 0.87 ± 0.42% | 6.60 × 10⁻¹ ± 8.20% | 1.61 × 10⁻³ ± 7.86% | 0.87 ± 3.89% |
| 130 | 8.03 × 10⁻¹ ± 7.84% | 1.17 × 10⁻³ ± 3.25% | 0.96 ± 0.04% | 9.51 × 10⁻² ± 9.56% | 1.69 × 10⁻³ ± 3.64% | 0.99 ± 0.08% |
| 110 | 8.94 × 10⁻³ ± 3.42% | 2.04 × 10⁻⁴ ± 7.71% | 0.94 ± 4.03% | 1.07 × 10⁻² ± 7.80% | 5.43 × 10⁻⁴ ± 9.44% | 0.91 ± 2.72% |
| Temperature (°C) | k10 (σR) CD | k2 (σR) CD | R2 | k10 (σR) CD | k2 (σR) CD | R2 |
| 150 | 3.24 × 10⁻⁷ ± 10.19% | 1.31 × 10⁻³ ± 8.32% | 0.98 ± 0.11% | 2.47 × 10⁻⁷ ± 5.73% | 6.22 × 10⁻³ ± 0.99% | 0.99 ± 0.62% |
| 130 | 2.26 × 10⁻⁷ ± 9.60% | 1.21 × 10⁻³ ± 0.39% | 0.98 ± 0.23% | 4.07 × 10⁻⁸ ± 9.31% | 2.02 × 10⁻³ ± 4.43% | 0.95 ± 0.73% |
| 110 | 2.69 × 10⁻⁹ ± 8.53% | 9.98 × 10⁻⁵ ± 9.37% | 0.89 ± 7.73% | 5.17 × 10⁻⁹ ± 8.32% | 3.13 × 10⁻⁴ ± 7.24% | 0.91 ± 2.08% |
| Temperature (°C) | k10 (σR) MD | k2 (σR) MD | R2 | k10 (σR) MD | k2 (σR) MD | R2 |
| 150 | 2.66 × 10⁻⁷ ± 10.20% | 1.63 × 10⁻³ ± 5.20% | 0.90 ± 0.67% | 4.76 × 10⁻⁸ ± 8.84% | −8.56 × 10⁻⁴ ± 10.11% | 0.85 ± 0.34% |
| 130 | 1.92 × 10⁻⁷ ± 8.20% | 1.26 × 10⁻³ ± 3.49% | 0.97 ± 0.05% | 1.54 × 10⁻⁸ ± 8.13% | 1.37 × 10⁻³ ± 8.82% | 0.99 ± 0.63% |
| 110 | 1.32 × 10⁻⁹ ± 8.16% | 7.63 × 10⁻⁵ ± 8.41% | 0.97 ± 1.59% | 1.07 × 10⁻⁹ ± 9.17% | 8.90 × 10⁻⁵ ± 9.62% | 0.87 ± 1.08% |
Table 6.
Constant rates of reaction for the Zervos model based on DP, εcm, and σR for different insulation oils.
Table 6.
Constant rates of reaction for the Zervos model based on DP, εcm, and σR for different insulation oils.
|
| | Mineral oil | Synthetic ester |
| Temperature (°C) | k (DP) | a (DP) | R2 | k (DP) | a (DP) | R2 |
| 150 | −4.35 × 10⁻³ ± 1.22% | −1.07 ± 9.19% | 0.99 ± 0.40% | −4.58 × 10⁻³ ± 9.39% | −3.02 × 10⁻¹ ± 10.78% | 0.98 ± 0.22% |
| 130 | −1.62 × 10⁻³ ± 0.99% | −8.89 × 10⁻¹ ± 10.22% | 0.96 ± 0.55% | −3.28 × 10⁻³ ± 3.35% | −1.69 × 10⁻¹ ± 9.66% | 0.96 ± 1.73% |
| 110 | −1.80 × 10⁻⁴ ± 9.43% | −2.75 × 10⁻¹ ± 9.39% | 0.97 ± 0.51% | −7.05 × 10⁻⁴ ± 10.63% | −1.41 × 10⁻¹ ± 7.22% | 0.94 ± 1.27% |
| Temperature (°C) | k (εcm) CD | a (εcm) CD | R2 | k (εcm) CD | a (εcm) CD | R2 |
| 150 | −2.89 × 10⁻⁵ ± 8.66% | −2.25 × 10⁶ ± 10.10% | 0.89 ± 3.57% | −7.04 × 10⁻³ ± 7.84% | −7.39 × 10³ ± 8.27% | 0.98 ± 1.08% |
| 130 | −1.72 × 10⁻³ ± 4.46% | −3.31 × 10⁴ ± 8.31% | 0.97 ± 0.25% | −1.80 × 10⁻³ ± 8.59% | −2.24 × 10³ ± 3.68% | 0.97 ± 0.60% |
| 110 | −2.37 × 10⁻⁵ ± 9.16% | −9.03 × 10³ ± 10.76% | 0.99 ± 1.30% | −2.49 × 10⁻⁴ ± 10.19% | −1.01 × 10³ ± 1.70% | 0.96 ± 1.90% |
| Temperature (°C) | k (εcm) MD | a (εcm) MD | R2 | k (εcm) MD | a (εcm) MD | R2 |
| 150 | −8.47 × 10⁻⁴ ± 4.98% | −1.41 × 10⁵ ± 10.32% | 0.87 ± 0.41% | −2.32 × 10⁻³ ± 7.87% | −4.11 × 10⁴ ± 0.73% | 0.87 ± 3.89% |
| 130 | −1.69 × 10⁻³ ± 3.25% | −6.88 × 10⁴ ± 4.74% | 0.96 ± 0.49% | −2.44 × 10⁻³ ± 3.67% | −5.63 × 10³ ± 8.19% | 0.99 ± 7.01% |
| 110 | −2.94 × 10⁻⁴ ± 7.77% | −4.38 × 10³ ± 10.22% | 0.94 ± 4.05% | −7.86 × 10⁻⁴ ± 4.06% | −1.98 × 10³ ± 10.62% | 0.91 ± 2.74% |
| Temperature (°C) | k (σR) CD | a (σR) CD | R2 | k (σR) CD | a (σR) CD | R2 |
| 150 | −1.89 × 10⁻³ ± 11.22% | −2.48 × 10⁻² ± 3.52% | 0.99 ± 1.05% | −9.21 × 10⁻³ ± 1.51% | −3.98 × 10⁻³ ± 6.80% | 0.98 ± 3.70% |
| 130 | −1.74 × 10⁻³ ± 5.01% | −1.87 × 10⁻² ± 11.96% | 0.98 ± 1.355% | −2.91 × 10⁻³ ± 6.34% | −2.02 × 10⁻³ ± 4.63% | 0.95 ± 1.73% |
| 110 | −1.44 × 10⁻⁴ ± 7.81% | −2.69 × 10⁻³ ± 5.14% | 0.89 ± 7.73% | −4.52 × 10⁻⁴ ± 8.24% | −1.65 × 10⁻³ ± 10.26% | 0.91 ± 2.07% |
| Temperature (°C) | k (σR) MD | a (σR) MD | R2 | k (σR) MD | a (σR) MD | R2 |
| 150 | −2.35 × 10⁻³ ± 5.20% | −1.63 × 10⁻² ± 9.51% | 0.90 ± 0.89% | −5.28 × 10⁻⁵ ± 8.69% | −1.87 × 10⁻¹ ± 10.74% | 0.83 ± 1.43% |
| 130 | −1.82 × 10⁻³ ± 3.56% | −1.28 × 10⁻² ± 8.73% | 0.97 ± 1.04% | −1.98 × 10⁻³ ± 9.37% | −1.12 × 10⁻³ ± 5.03% | 0.99 ± 1.50% |
| 110 | −1.10 × 10⁻⁴ ± 10.41% | −1.73 × 10⁻³ ± 3.32% | 0.98 ± 1.57% | −1.29 × 10⁻⁴ ± 9.77% | −1.20 × 10⁻³ ± 2.24% | 0.87 ± 1.12% |
Table 7.
Constant rates of reaction for the Calvini model based on DP, εcm, and σR for different insulation oils.
Table 7.
Constant rates of reaction for the Calvini model based on DP, εcm, and σR for different insulation oils.
|
| |
Mineral oil
|
Synthetic ester
|
| Temperature (°C) | k (DP) | R2 | k (DP) | R2 |
| 150 | 1.23 × 10⁻² ± 3.64% | 0.25 ± 3.82% | 9.69 × 10⁻⁴ ± 0.54% | 0.88 ± 4.77% |
| 130 | 2.97 × 10⁻³ ± 1.65% | 0.75 ± 1.71% | 2.27 × 10⁻⁴ ± 1.43% | 0.62 ± 2.47% |
| 110 | 3.98 × 10⁻⁵ ± 3.85% | 0.92 ± 0.67% | 2.69 × 10⁻⁵ ± 3.03% | 0.21 ± 4.27% |
| Temperature (°C) | k (εcm) CD | R2 | k (εcm) CD | R2 |
| 150 | 5.10 × 10⁻¹ ± 4.75% | <0.01 ± 8.10% | 9.85 × 10⁻³ ± 2.15% | 0.78 ± 3.17% |
| 130 | 7.68 × 10⁻³ ± 3.25% | <0.01 ± 4.20% | 2.61 × 10⁻⁴ ± 1.62% | 0.85 ± 3.24% |
| 110 | 2.83 × 10⁻⁵ ± 5.84% | 0.99 ± 1.05% | 1.33 × 10⁻⁵ ± 1.44% | 0.80 ± 8.22% |
| Temperature (°C) | k (εcm) MD | R2 | k (εcm) MD | R2 |
| 150 | 7.87 × 10⁻¹ ± 3.98% | <0.01 ± 1.12% | 7.41 × 10⁻¹ ± 7.70% | 0.29 ± 4.98% |
| 130 | 8.63 × 10⁻³ ± 4.73% | <0.01 ± 9.31% | 3.53 × 10⁻⁴ ± 6.39% | 0.80 ± 1.70% |
| 110 | 3.18 × 10⁻⁵ ± 5.06% | 0.75 ± 9.71% | 1.57 × 10⁻⁵ ± 8.33% | 0.11 ± 7.11% |
| Temperature (°C) | k (σR) CD | R2 | k (σR) CD | R2 |
| 150 | 9.61 × 10⁻¹ ± 9.37% | 0.05 ± 6.41% | 4.75 × 10⁻³ ± 6.15% | 0.48 ± 9.56% |
| 130 | 3.38 × 10⁻³ ± 5.19% | 0.61 ± 2.07% | 1.27 × 10⁻⁴ ± 5.34% | 0.61 ± 7.18% |
| 110 | 1.57 × 10⁻⁵ ± 4.79% | 0.85 ± 10.20% | 1.41 × 10⁻⁵ ± 6.94% | 0.51 ± 8.80% |
| Temperature (°C) | k (σR) MD | R2 | k (σR) MD | R2 |
| 150 | 6.68 × 10⁻³ ± 9.71% | 0.56 ± 9.64% | 7.15 × 10⁻⁴ ± 4.56% | 0.56 ± 12.23% |
| 130 | 5.90 × 10⁻³ ± 1.43% | 0.36 ± 5.18% | 1.92 × 10⁻⁴ ± 9.69% | 0.82 ± 3.84% |
| 110 | 2.63 × 10⁻⁵ ± 11.59% | 0.96 ± 1.05% | 1.88 × 10⁻⁵ ± 5.49% | 0.83 ± 1.06% |
Table 8.
Coefficients of aging for the Weidmann model based on DP, εcm, and σR for different insulation oils.
Table 8.
Coefficients of aging for the Weidmann model based on DP, εcm, and σR for different insulation oils.
|
| |
Mineral oil
|
Synthetic ester
|
| Temperature (°C) | CDP | R2 | CDP | R2 |
| 150 | 2.89 × 10⁻³ ± 10.27% | 0.31 ± 1.90% | 1.51 × 10⁻³ ± 10.04% | 0.45 ± 4.69% |
| 130 | 1.12 × 10⁻³ ± 9.60% | 0.41 ± 6.30% | 4.81 × 10⁻⁴ ± 9.20% | 0.21 ± 11.35% |
| 110 | 7.28 × 10⁻⁵ ± 1.79% | 0.59 ± 1.24% | 5.91 × 10⁻⁵ ± 2.48% | <0.01 ± 9.26% |
| Temperature (°C) | Cεcm CD | R2 | Cεcm CD | R2 |
| 150 | 4.38 × 10⁻³ ± 9.57% | 0.51 ± 2.97% | 2.56 × 10⁻³ ± 9.08% | 0.15 ± 10.81% |
| 130 | 1.86 × 10⁻³ ± 9.52% | 0.39 ± 3.32% | 5.17 × 10⁻⁴ ± 9.17% | 0.61 ± 6.49% |
| 110 | 6.03 × 10⁻⁵ ± 6.53% | 0.96 ± 1.08% | 3.74 × 10⁻⁵ ± 2.11% | 0.71 ± 8.49% |
| Temperature (°C) | Cεcm MD | R2 | Cεcm MD | R2 |
| 150 | 3.93 × 10⁻³ ± 9.27% | 0.31 ± 1.30% | 3.22 × 10⁻³ ± 9.83% | 0.30 ± 1.70% |
| 130 | 1.83 × 10⁻³ ± 9.54% | 0.32 ± 4.41% | 5.98 × 10⁻⁴ ± 7.05% | 0.38 ± 10.08% |
| 110 | 6.43 × 10⁻⁵ ± 6.75% | 0.53 ± 10.83% | 4.22 × 10⁻⁵ ± 4.14% | <0.01 ± 4.20% |
| Temperature (°C) | CσR CD | R2 | CσR CD | R2 |
| 150 | 2.66 × 10⁻³ ± 8.03% | 0.56 ± 6.23% | 1.31 × 10⁻³ ± 6.07% | 0.16 ± 9.48% |
| 130 | 1.19 × 10⁻³ ± 4.98% | 0.47 ± 2.70% | 3.36 × 10⁻⁴ ± 6.29% | 0.45 ± 6.57% |
| 110 | 4.21 × 10⁻⁵ ± 8.96% | 0.68 ± 6.22% | 3.91 × 10⁻⁵ ± 7.35% | 0.21 ± 4.46% |
| Temperature (°C) | CσR MD | R2 | CσR MD | R2 |
| 150 | 3.60 × 10⁻³ ± 9.07% | 0.27 ± 8.66% | 2.49 × 10⁻³ ± 8.63% | 0.65 ± 2.26% |
| 130 | 1.56 × 10⁻³ ± 7.68% | 0.39 ± 1.28% | 4.36 × 10⁻⁴ ± 9.25% | 0.58 ± 9.59% |
| 110 | 5.81 × 10⁻⁵ ± 2.60% | 0.83 ± 1.66% | 4.73 × 10⁻⁵ ± 10.49% | 0.59 ± 6.65% |
Table 9.
Constants for the IEEE model based on lifetime needed to reach end-of-life criteria (DP = 350, εcm = 0.5 ∗ εcm0, σR = 0.5 ∗ σR0) for different insulation oils.
Table 9.
Constants for the IEEE model based on lifetime needed to reach end-of-life criteria (DP = 350, εcm = 0.5 ∗ εcm0, σR = 0.5 ∗ σR0) for different insulation oils.
|
| Mineral oil | Synthetic ester |
| A (DP) | B (DP) | R2 | A (DP) | B (DP) | R2 |
| 9.16 × 10⁻¹⁷ ± 1.15% | 17,358 ± 2.05% | 0.92 ± 1.08% | 9.17 × 10⁻¹⁸ ± 2.85% | 18,715 ± 2.75% | 0.99 ± 1.35% |
| A (εcm) CD | B (εcm) CD | R2 | A (εcm) CD | B (εcm) CD | R2 |
| 2.79 × 10⁻¹⁸ ± 3.25% | 18,648 ± 1.65% | 0.89 ± 0.95% | 1.01 × 10⁻¹⁹ ± 1.15% | 21,883 ± 0.75% | 0.96 ± 0.85% |
| A (εcm) MD | B (εcm) MD | R2 | A (εcm) MD | B (εcm) MD | R2 |
| 6.55 × 10⁻¹⁶ ± 2.65% | 16,344 ± 4.20% | 0.82 ± 1.11% | 1.57 × 10⁻²¹ ± 3.15% | 21,916 ± 0.97% | 0.94 ± 2.07% |
| A (σR) CD | B (σR) CD | R2 | A (σR) CD | B (σR) CD | R2 |
| 2.55 × 10⁻²⁰ ± 1.15% | 20,637 ± 2.15% | 0.87 ± 2.07% | 2.60 × 10⁻¹⁸ ± 2.95% | 18,982 ± 1.65% | 0.96 ± 4.24% |
| A (σR) MD | B (σR) MD | R2 | A (σR) MD | B (σR) MD | R2 |
| 3.09 × 10⁻²⁰ ± 3.65% | 20,587 ± 3.07% | 0.90 ± 1.19% | 3.64 × 10⁻¹⁹ ± 4.08% | 19,999 ± 3.95% | 0.99 ± 2.67% |


 ,
, 


