Light- and Neutron-Optical Properties of Holographic Transmission Gratings from Polymer-Ionic Liquid Composites with Submicron Grating Spacing

 , , , and
Abstract
:1. Introduction
2. Materials and Methods
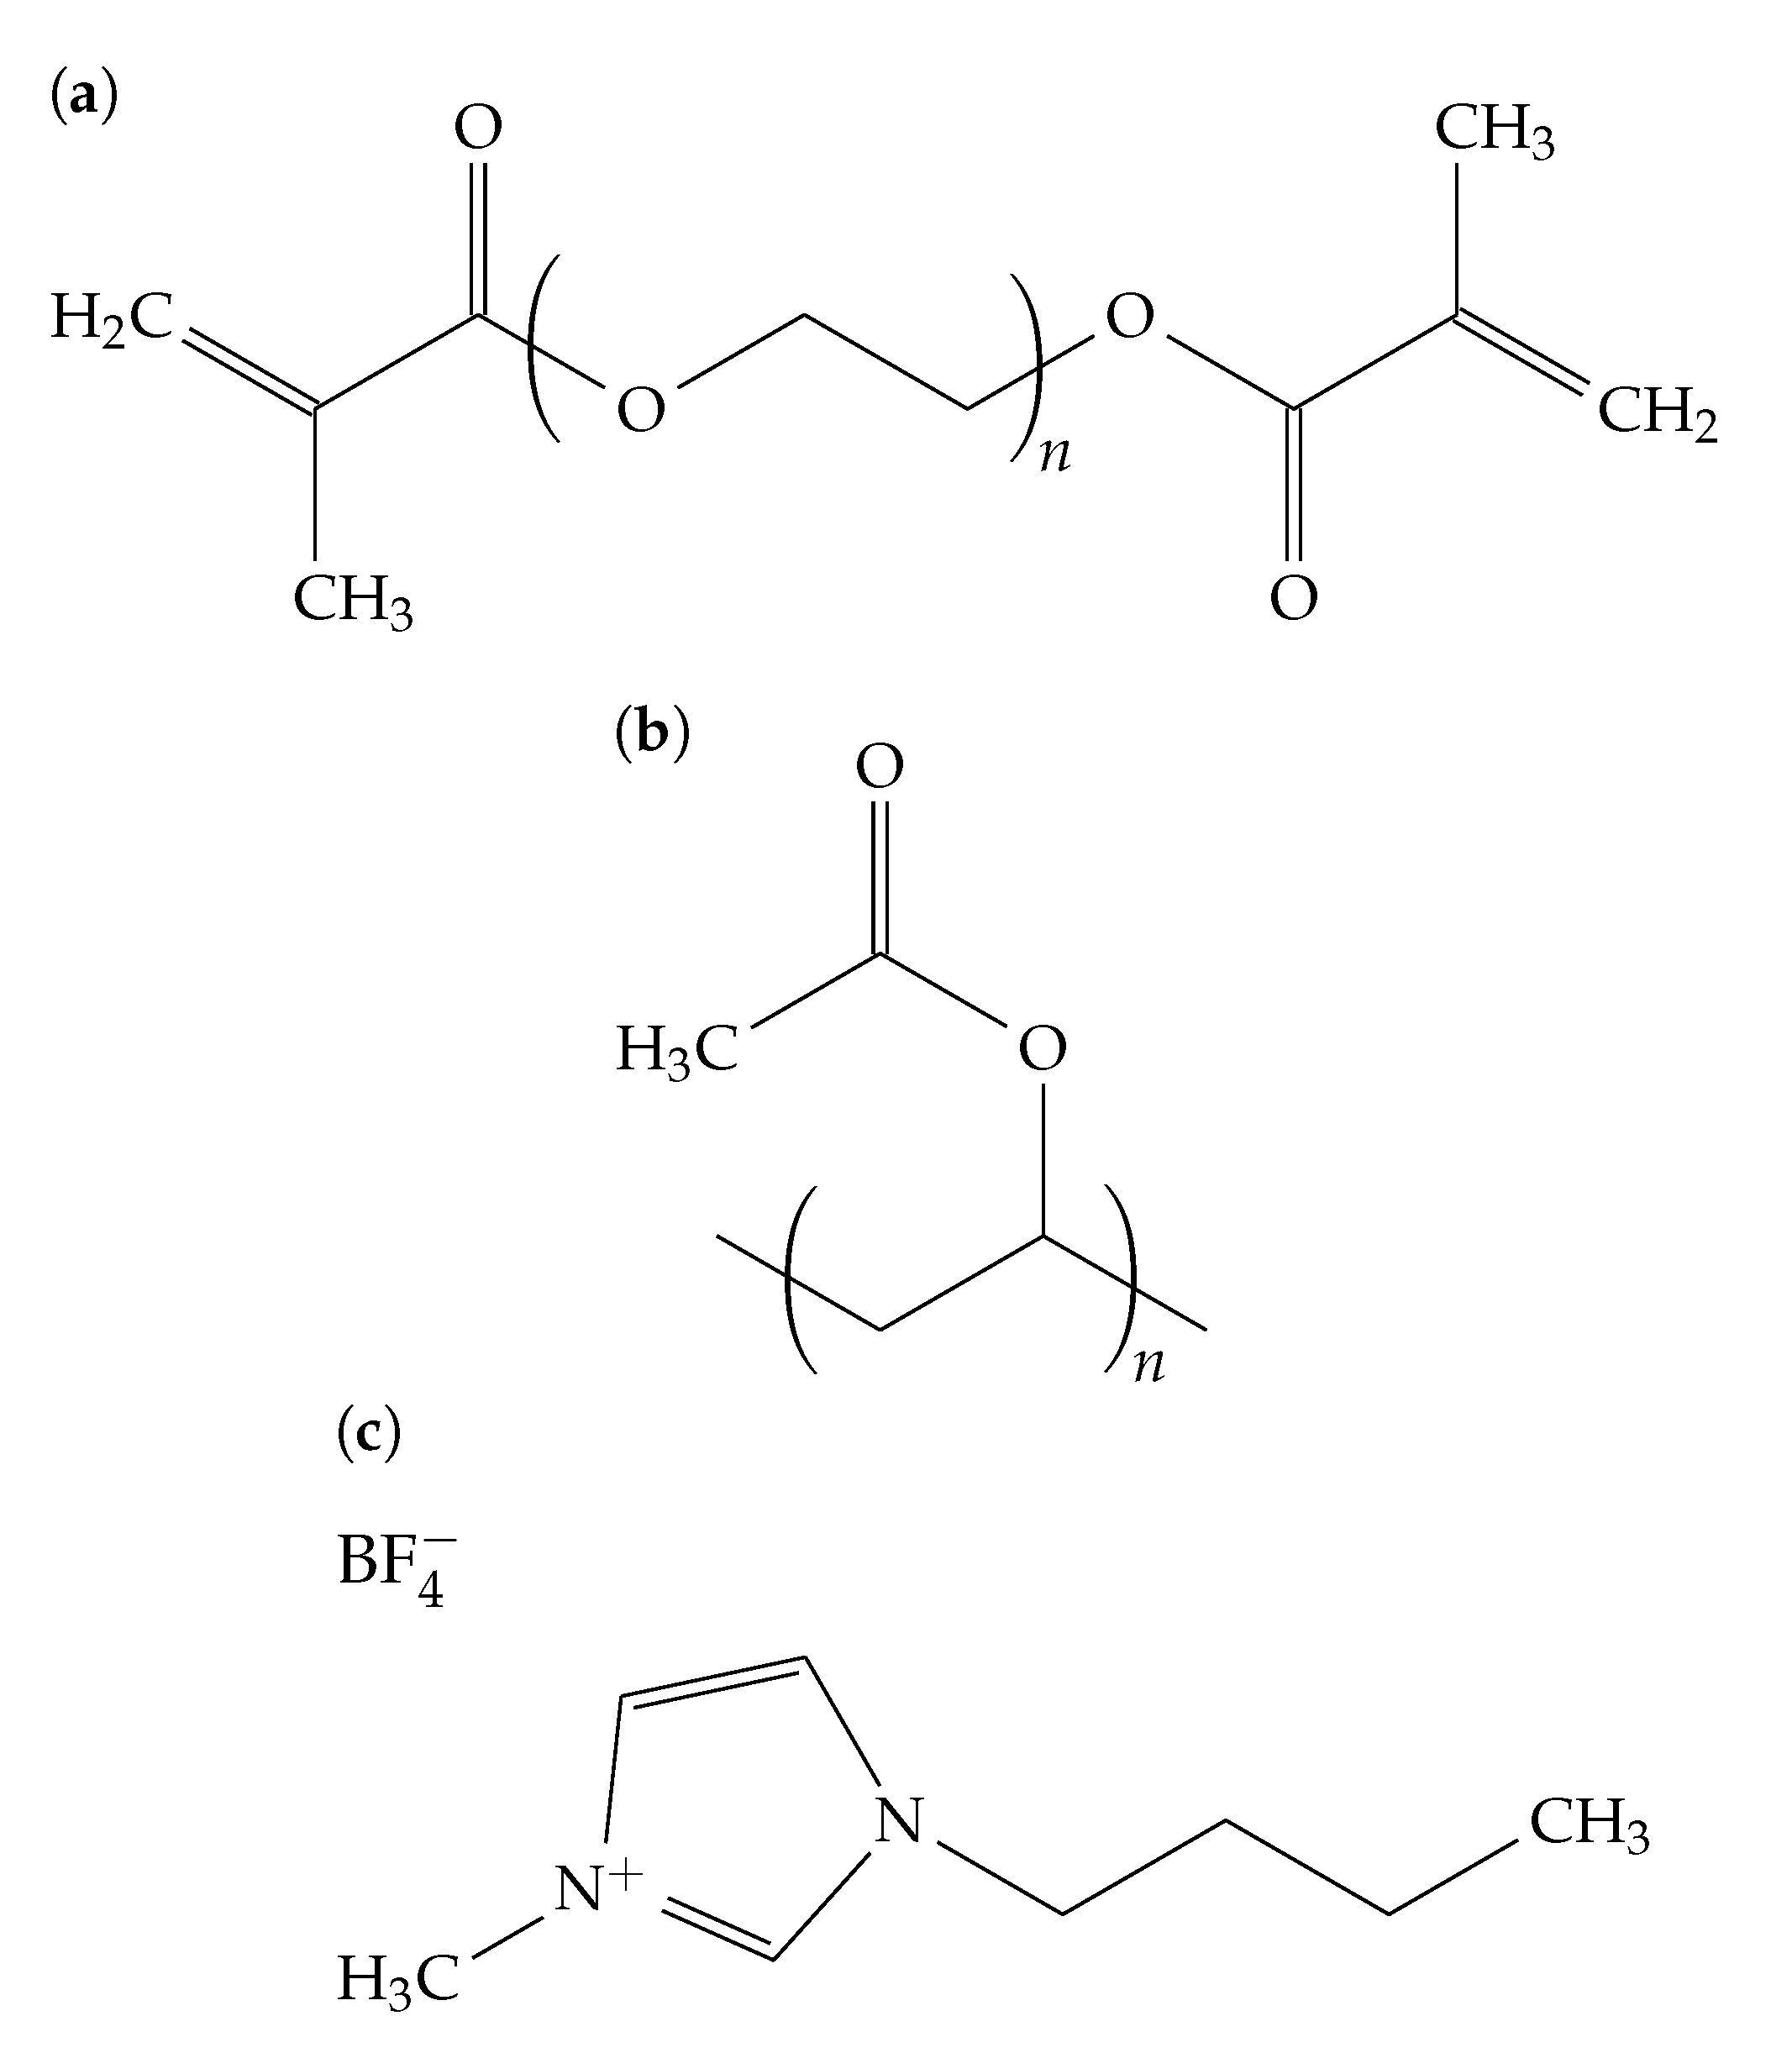
2.1. Materials’ and Sample Preparation
2.2. Sample Characterization
3. Results
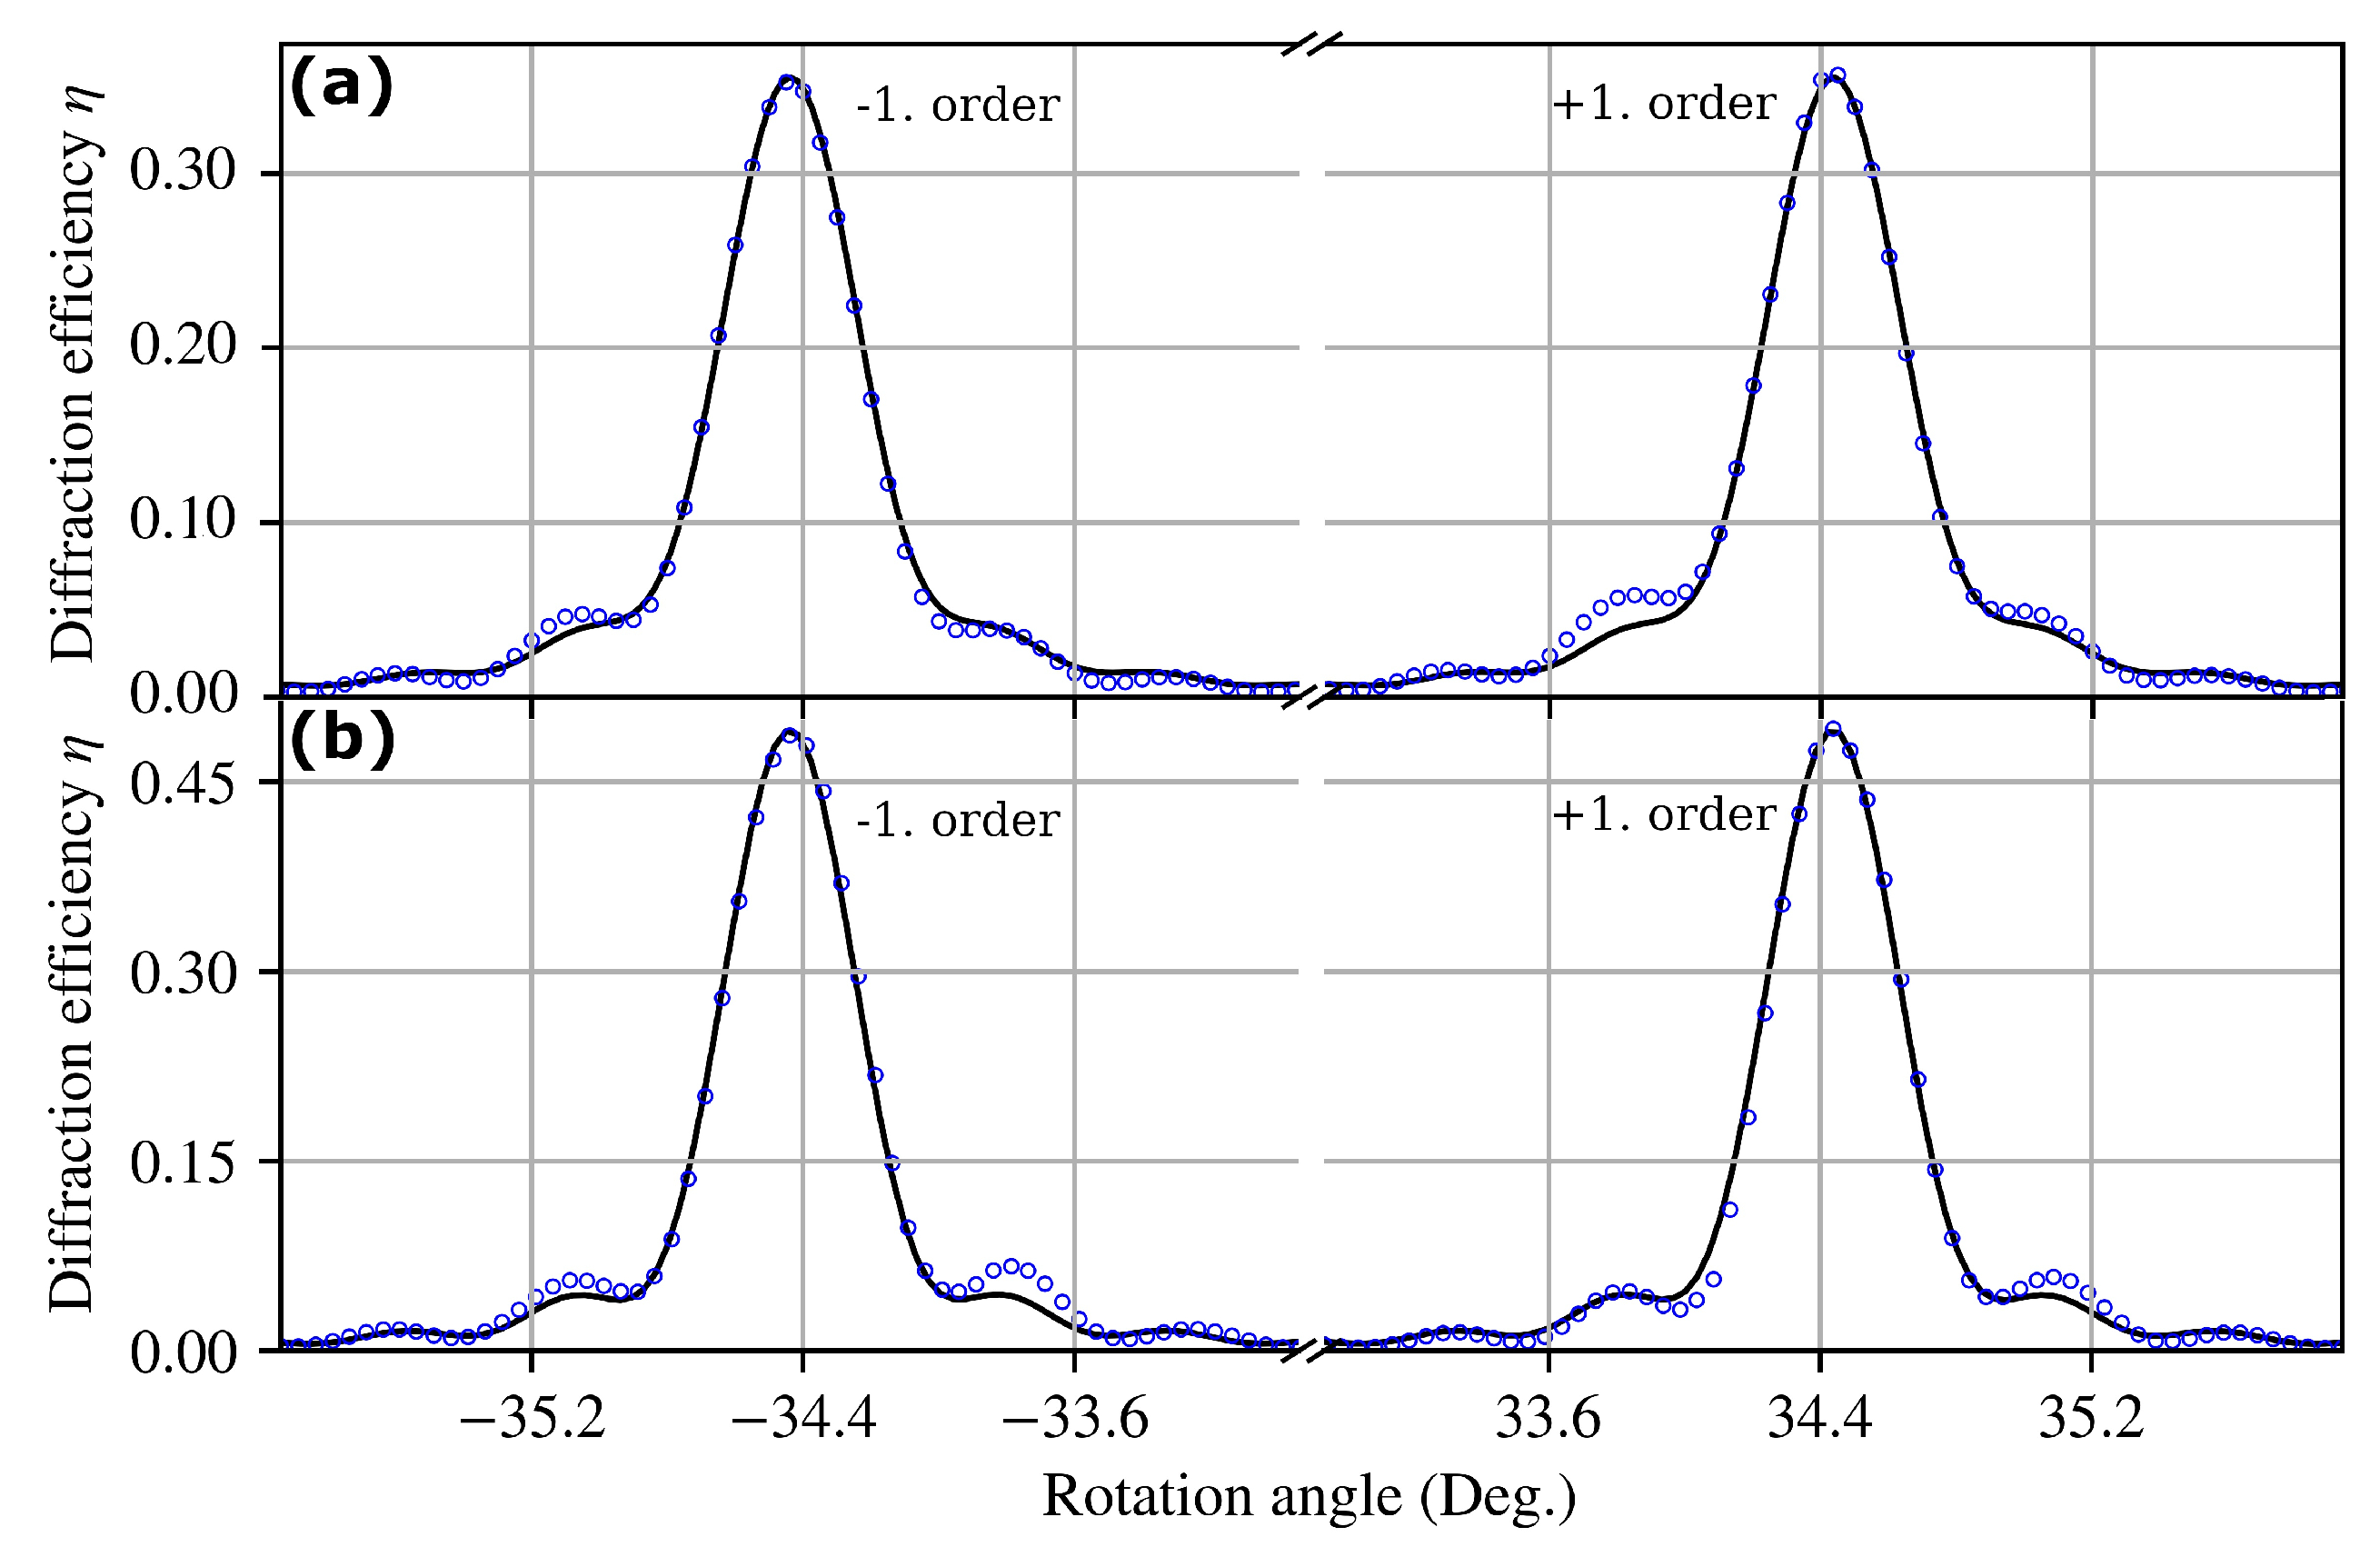
3.1. Light Diffraction Experiments
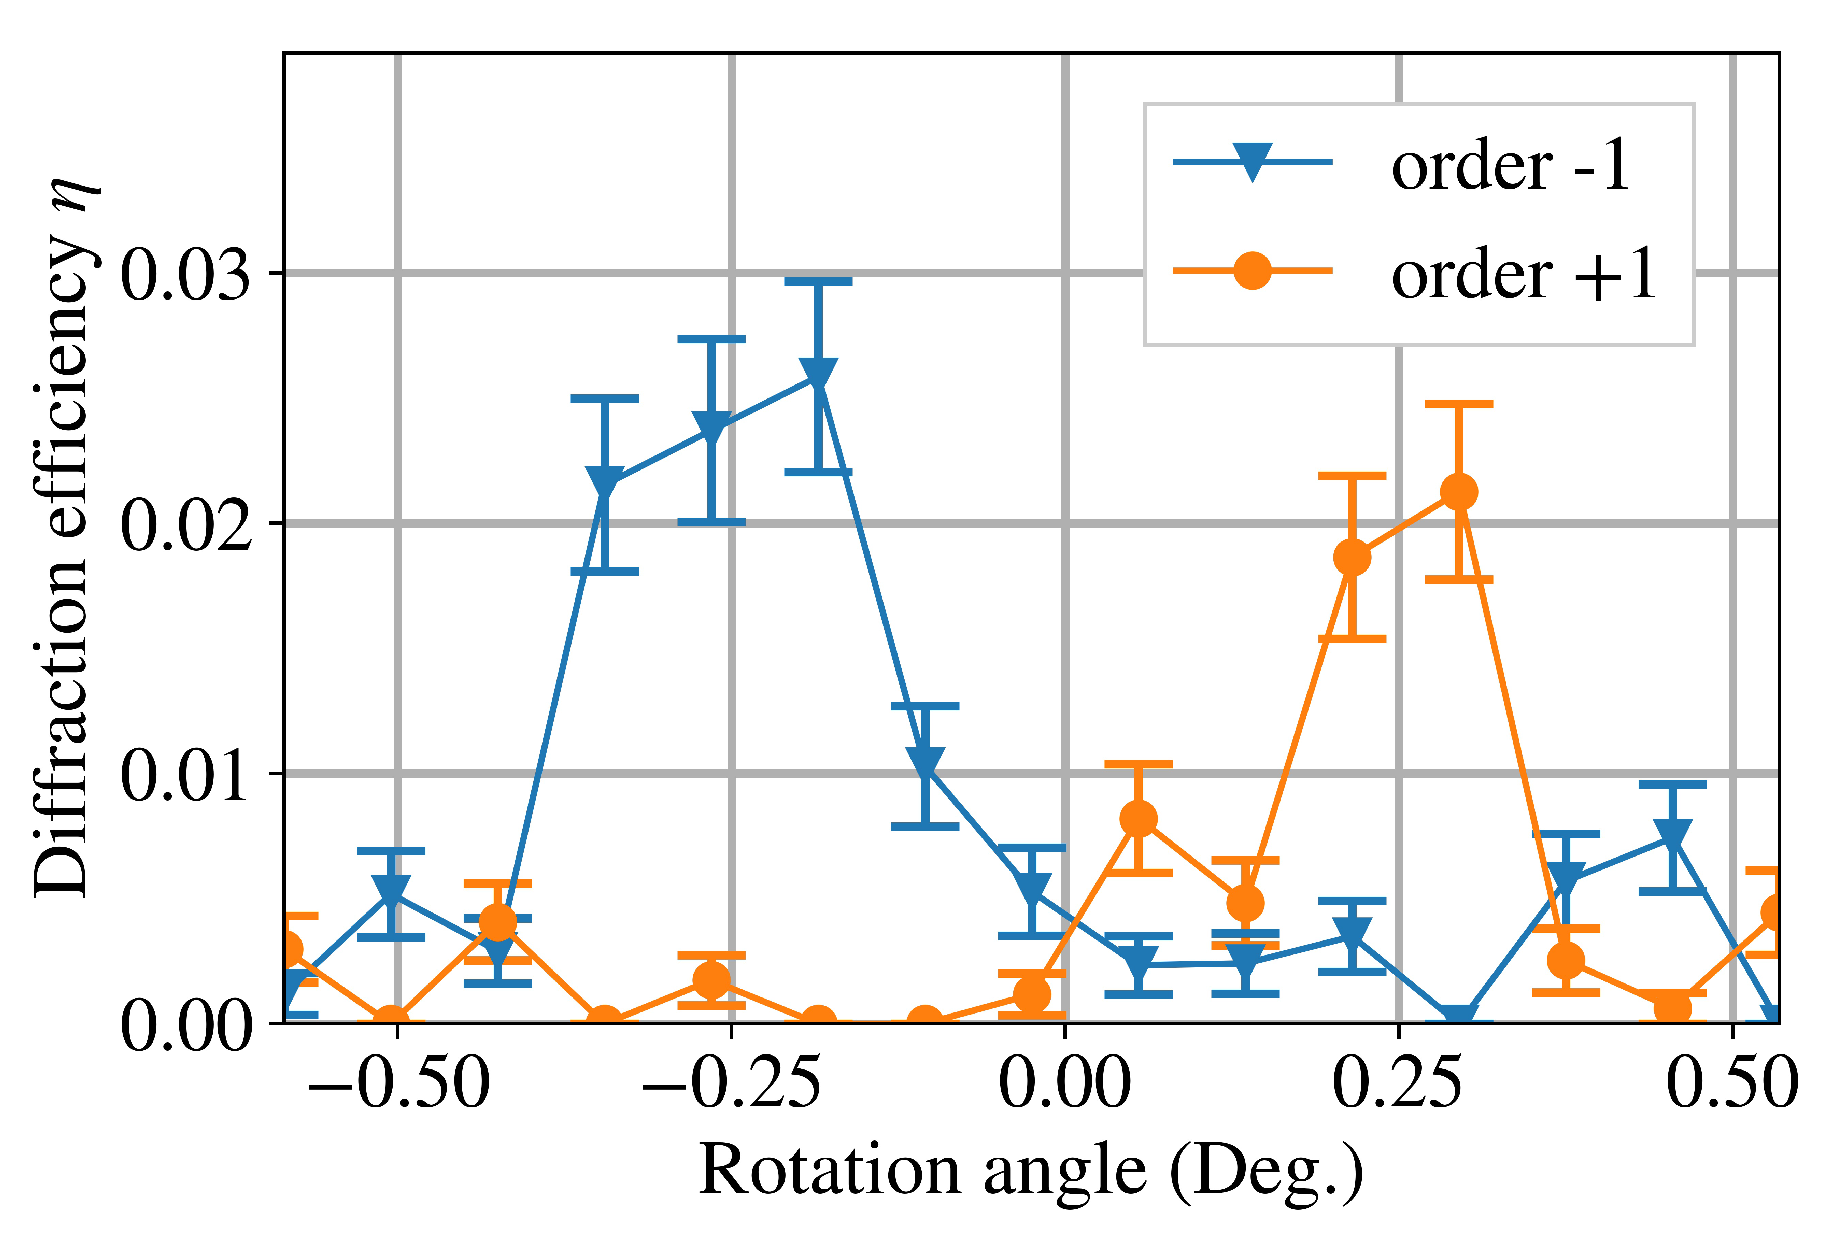
3.2. Neutron Diffraction Experiments
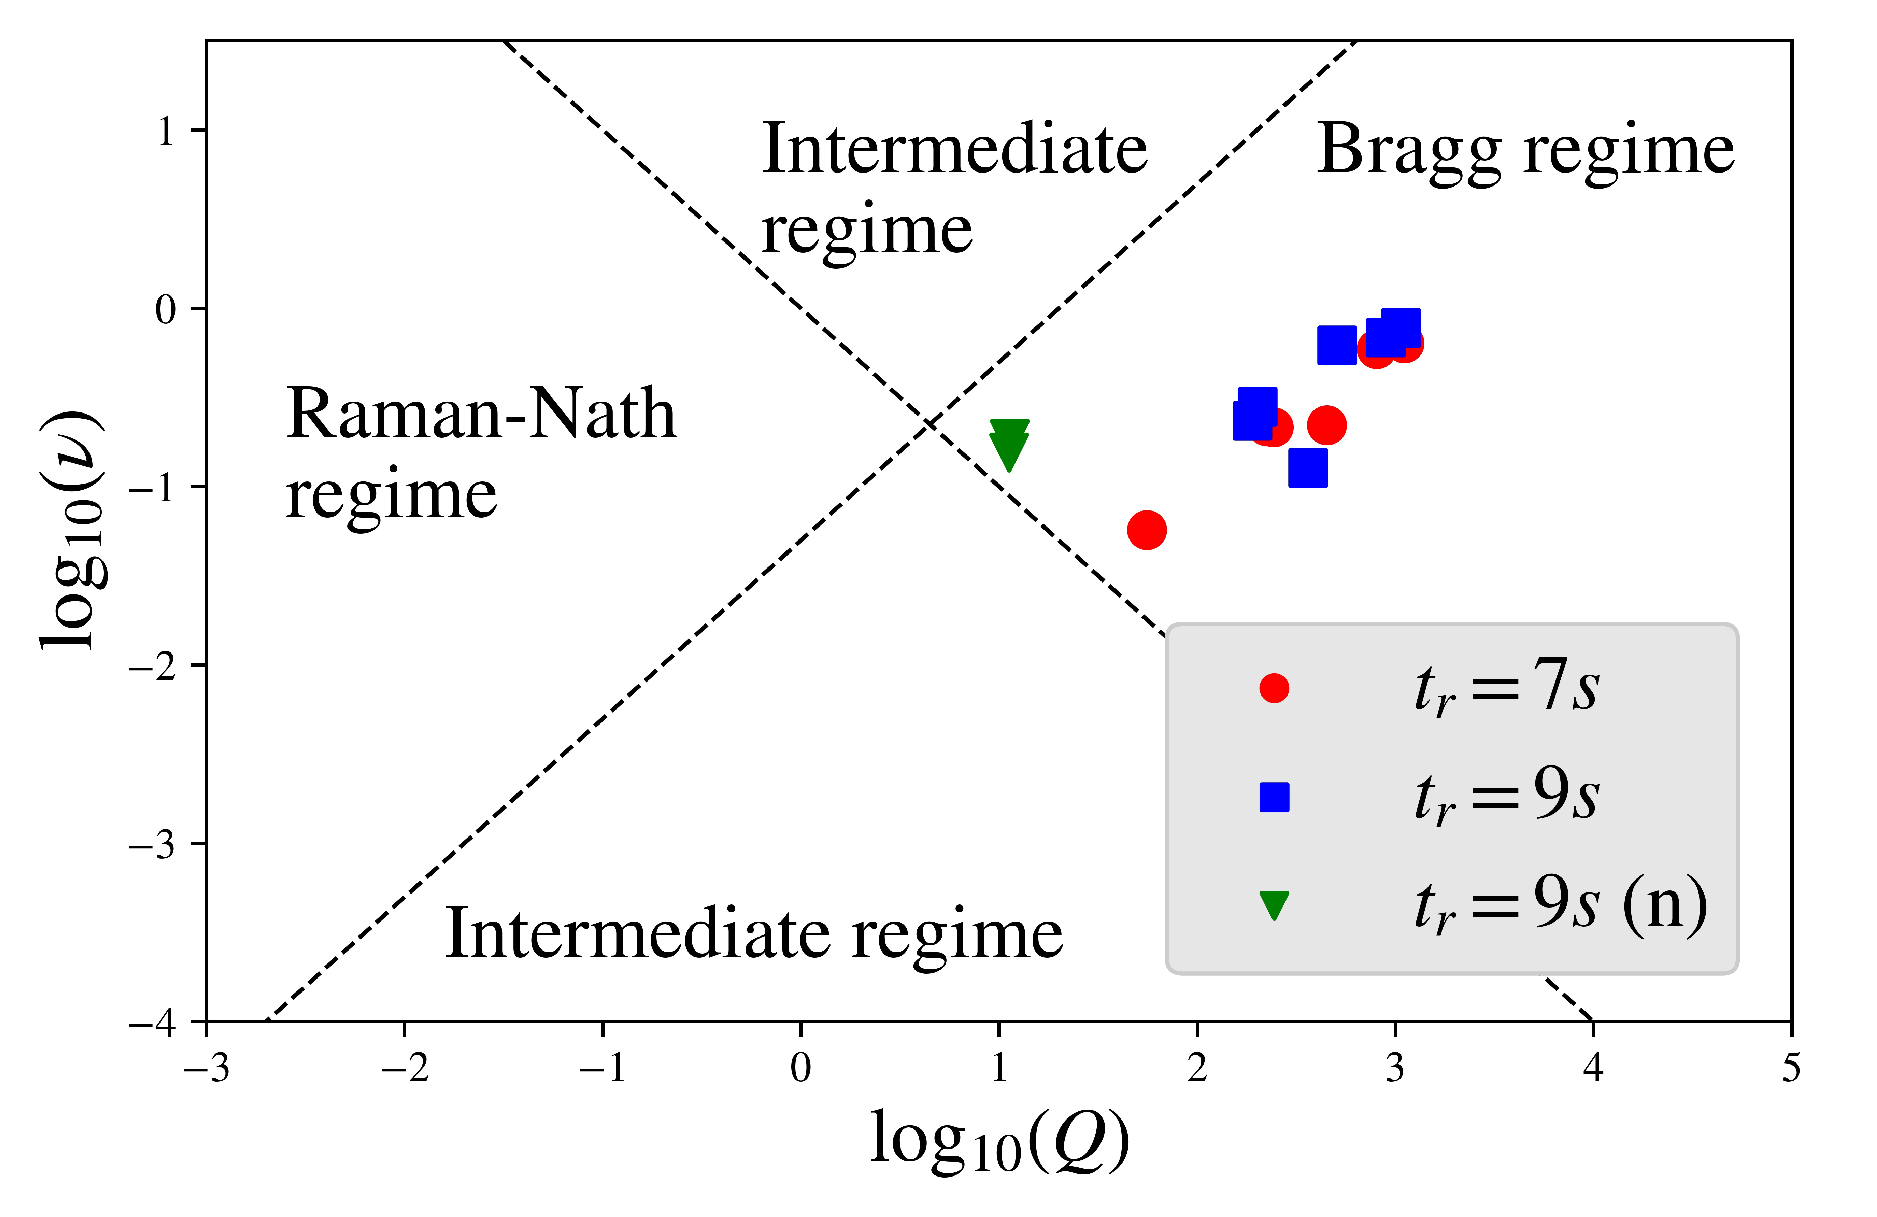
4. Discussion
5. Conclusions
Author Contributions
Funding
Acknowledgments
Conflicts of Interest
Abbreviations
| BMIMBF | 1-butyl-3-methylimidazolium tetrafluoroborate |
| PEGDMA | poly-(ethylene glycol)-dimethacrylate |
| PVAC | polyvinyl acetate |
Appendix A
References
- Solymar, L.L.; Cooke, D.J. Volume Holography and Volume Gratings; Academic Press: London, UK, 1981. [Google Scholar]
- Brunner, R.; Geißler, E.; Messerschmidt, B.; Martin, D.; Soergel, E.; Inoue, K.; Ohtaka, K.; Ghatak, A.; Thyagarajan, K. Advanced optical components. In Springer Handbook of Lasers and Optics; Träger, F., Ed.; Springer: New York, NY, USA, 2007; pp. 419–502. [Google Scholar]
- Hesselink, L.; Orlov, S.S.; Bashaw, M.C. Holographic data storage systems. Proc. IEEE 2004, 92, 1231–1280. [Google Scholar] [CrossRef] [Green Version]
- Mule’, A.V.; Villalaz, R.; Gaylord, T.K.; Meindl, J.D. Photopolymer-based diffractive and MMI waveguide couplers. IEEE Photonics Technol. Lett. 2004, 16, 2490–2492. [Google Scholar] [CrossRef]
- Tomlinson, W.J.; Chandross, E.A.; Weber, H.P.; Aumiller, G.D. Multicomponent photopolymer systems for volume phase holograms and grating devices. Appl. Opt. 1976, 15, 534–541. [Google Scholar] [CrossRef] [PubMed]
- Crawford, G.P. Electrically switchable Bragg gratings. Opt. Photonics News 2003, 14, 54–59. [Google Scholar] [CrossRef]
- Sio, L.D.; Tabiryan, N.; Bunning, T.J. POLICRYPS-based electrically switchable Bragg reflector. Opt. Express 2015, 23, 32696–32702. [Google Scholar] [CrossRef] [PubMed]
- Vita, F.; Lucchetta, D.E.; Castagna, R.; Criante, L.; Simoni, F. Large-area photonic structures in freestanding films. Appl. Phys. Lett. 2007, 91, 103114. [Google Scholar] [CrossRef]
- Sakhno, O.V.; Goldenberg, L.M.; Stumpe, J.; Smirnova, T.N. Surface modified ZrO2 and TiO2 nanoparticles embedded in organic photopolymers for highly effective and UV-stable volume holograms. Nanotechnology 2007, 18, 105704. [Google Scholar] [CrossRef]
- Hata, E.; Tomita, Y. Order-of-magnitude polymerization-shrinkage suppression of volume gratings recorded in nanoparticle-polymer composites. Opt. Lett. 2010, 35, 396–398. [Google Scholar] [CrossRef] [PubMed]
- Guo, J.; Fujii, R.; Ono, T.; Klepp, J.; Pruner, C.; Fally, M.; Tomita, Y. Effects of chain-transferring thiol functionalities on the performance of nanoparticle-polymer composite volume gratings. Opt. Lett. 2014, 39, 6743–6746. [Google Scholar] [CrossRef] [PubMed] [Green Version]
- Tomita, Y.; Hata, E.; Momose, K.; Takayama, S.; Liu, X.; Chikama, K.; Klepp, J.; Pruner, C.; Fally, M. Photopolymerizable nanocomposite photonic materials and their holographic applications in light and neutron optics. J. Mod. Opt. 2016, 63, S1–S31. [Google Scholar] [CrossRef] [PubMed] [Green Version]
- Tomita, Y.; Nakamura, T.; Tago, A. Improved thermal stability of volume holograms recorded in nanoparticle–polymer composite films. Opt. Lett. 2008, 33, 1750–1752. [Google Scholar] [CrossRef] [PubMed]
- Lin, H.; Oliveira, P.W.; Veith, M. Ionic liquid as additive to increase sensitivity, resolution, and diffraction efficiency of photopolymerizable hologram material. Appl. Phys. Lett. 2008, 93, 141101. [Google Scholar] [CrossRef]
- Lin, H.; Oliveira, P.W.; Veith, M.; Gros, M.; Grobelsek, I. Optic diffusers based on photopolymerizable hologram material with an ionic liquid as additive. Opt. Lett. 2009, 34, 1150–1152. [Google Scholar] [CrossRef] [PubMed]
- Lin, H.; de Oliveira, P.W.; Veith, M. Application of ionic liquids in photopolymerizable holographic materials. Optic. Mater. 2011, 33, 759–762. [Google Scholar] [CrossRef]
- Ellabban, M.A.; Glavan, G.; Klepp, J.; Fally, M. A comprehensive study of photorefractive properties in poly(ethylene glycol) dimethacrylate—Ionic liquid composites. Materials 2017, 10, 9. [Google Scholar] [CrossRef]
- Klepp, J.; Pruner, C.; Tomita, Y.; Geltenbort, P.; Drevenšek-Olenik, I.; Gyergyek, S.; Kohlbrecher, J.; Fally, M. Holographic gratings for slow-neutron optics. Materials 2012, 5, 2788–2815. [Google Scholar] [CrossRef]
- Fally, M.; Klepp, J.; Tomita, Y.; Nakamura, T.; Pruner, C.; Ellabban, M.A.; Rupp, R.A.; Bichler, M.; Olenik, I.D.; Kohlbrecher, J.; et al. Neutron optical beam splitter from holographically structured nanoparticle-polymer composites. Phys. Rev. Lett. 2010, 105, 123904. [Google Scholar] [CrossRef]
- Klepp, J.; Pruner, C.; Tomita, Y.; Mitsube, K.; Geltenbort, P.; Fally, M. Mirrors for slow neutrons from holographic nanoparticle-polymer free-standing film-gratings. Appl. Phys. Lett. 2012, 100, 214104. [Google Scholar] [CrossRef] [Green Version]
- Klepp, J.; Tomita, Y.; Pruner, C.; Kohlbrecher, J.; Fally, M. Three-port beam splitter for slow neutrons using holographic nanoparticle-polymer composite diffraction gratings. Appl. Phys. Lett. 2012, 101, 154104. [Google Scholar] [CrossRef] [Green Version]
- Pruner, C.; Fally, M.; Rupp, R.A.; May, R.P.; Vollbrandt, J. Interferometer for cold neutrons. Nucl. Instrum. Methods Phys. Res. A 2006, 560, 598–605. [Google Scholar] [CrossRef]
- Fally, M.; Bichler, M.; Ellabban, M.A.; Olenik, I.D.; Pruner, C.; Eckerlebe, H.; Pranzas, K.P. Diffraction gratings for neutrons from polymers and holographic polymer-dispersed liquid crystals. J. Opt. A Pure Appl. Opt. 2009, 11, 024019. [Google Scholar] [CrossRef]
- Ellabban, M.A.; Glavan, G.; Flauger, P.; Klepp, J.; Fally, M. Properties of diffraction gratings holographically recorded in poly(ethylene glycol)dimethacrylate-ionic liquid composites. Proc. SPIE 2017, 10233, 1023310. [Google Scholar] [CrossRef]
- Gaylord, T.K.; Moharam, M.G. Thin and thick gratings: terminology clarification. Appl. Opt. 1981, 20, 3271–3273. [Google Scholar] [CrossRef]
- Gaylord, T.K.; Moharam, M.G. Planar dielectric grating diffraction theories. Appl. Phys. B 1982, 28, 1–14. [Google Scholar] [CrossRef]
- Moharam, M.; Gaylord, T.; Magnusson, R. Criteria for Bragg regime diffraction by phase gratings. Opt. Commun. 1980, 32, 14–18. [Google Scholar] [CrossRef]
- Moharam, M.; Gaylord, T.; Magnusson, R. Criteria for Raman–Nath regime diffraction by phase gratings. Opt. Commun. 1980, 32, 19–23. [Google Scholar] [CrossRef]
- Fally, M.; Ellabban, M.; Drevenšek-Olenik, I. Out-of-phase mixed holographic gratings: A quantative analysis. Opt. Express 2008, 16, 6528–6536. [Google Scholar] [CrossRef]
- Fally, M.; Ellabban, M.; Drevenšek-Olenik, I. Out-of-phase mixed holographic gratings: A quantative analysis: Erratum. Opt. Express 2009, 17, 23350. [Google Scholar] [CrossRef]
- Uchida, N. Calculation of diffraction efficiency in hologram gratings attenuated along the direction perpendicular to the grating vector. J. Opt. Soc. Am. 1973, 63, 280–287. [Google Scholar] [CrossRef]
- Kogelnik, H. Coupled wave theory for thick hologram gratings. Bell Syst. Tech. J. 1969, 48, 2909–2947. [Google Scholar] [CrossRef]
- Willis, B.T.M.; Carlile, C.J. Experimental Neutron Scattering; Oxford University Press: Oxford, UK; New York, NY, USA, 2009. [Google Scholar]
- Klepp, J.; Fally, M.; Geltenbort, P.; Jenke, T.; Pruner, C. Ionic-Liquids Composites (ILCs) for Holographic-Grating Neutron-Optical Elements; Institut Laue-Langevin (ILL): Grenoble, France, 2018. [Google Scholar]
- Günter, P.; Huignard, J.P. Photorefractive Materials and Their Applications 1, Basic Effects; Number 113 in Springer Series in Optical Sciences; Springer: New York, NY, USA, 2006. [Google Scholar] [CrossRef]


| Material | Percentage (wt%) | Description |
|---|---|---|
| poly-(ethylene glycol)-dimethacrylate (PEGDMA) | Polymer | |
| polyvinyl acetate (PVAC) | Polymer binder | |
| 1-butyl-3-methylimidazolium tetrafluoroborate (BMIMBF) | Ionic liquid | |
| Irgacure184 (Irg184) | UV photoinitiator |
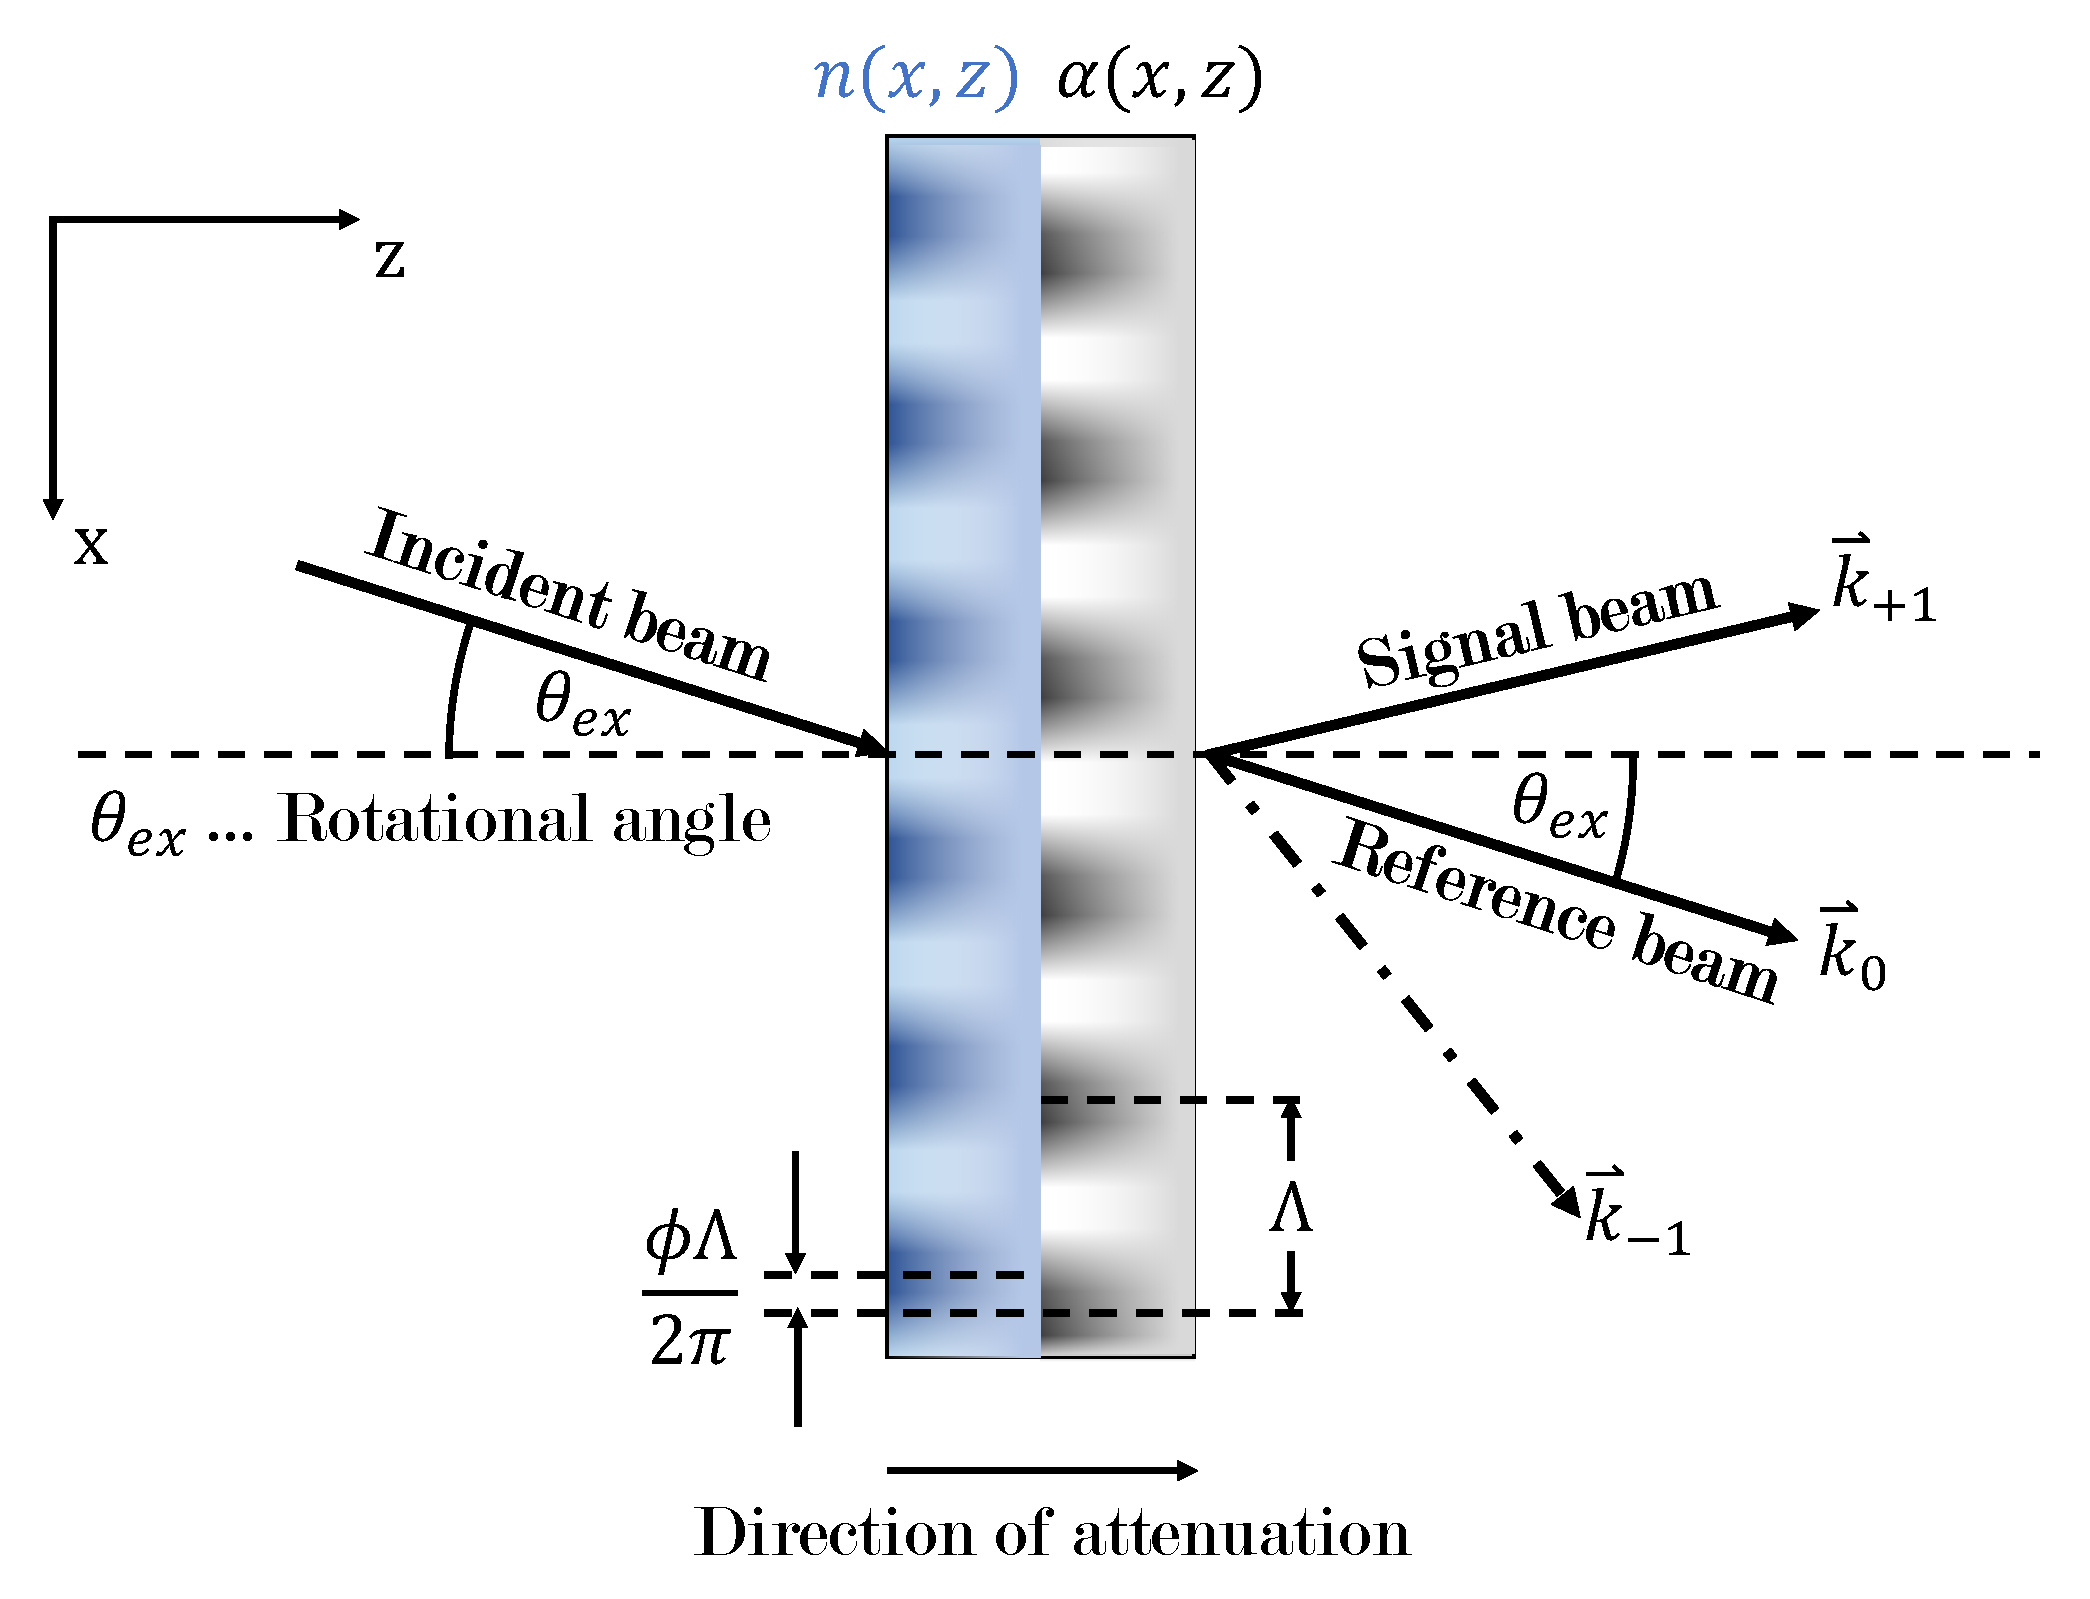
| thickness d | ||
|---|---|---|
| μm | ||
| μm | ||
| μm | ||
| μm | ||
| μm | ||
| μm |
© 2019 by the authors. Licensee MDPI, Basel, Switzerland. This article is an open access article distributed under the terms and conditions of the Creative Commons Attribution (CC BY) license (http://creativecommons.org/licenses/by/4.0/).
Share and Cite
Flauger, P.; Ellabban, M.A.; Glavan, G.; Klepp, J.; Pruner, C.; Jenke, T.; Geltenbort, P.; Fally, M. Light- and Neutron-Optical Properties of Holographic Transmission Gratings from Polymer-Ionic Liquid Composites with Submicron Grating Spacing. Polymers 2019, 11, 1459. https://doi.org/10.3390/polym11091459
Flauger P, Ellabban MA, Glavan G, Klepp J, Pruner C, Jenke T, Geltenbort P, Fally M. Light- and Neutron-Optical Properties of Holographic Transmission Gratings from Polymer-Ionic Liquid Composites with Submicron Grating Spacing. Polymers. 2019; 11(9):1459. https://doi.org/10.3390/polym11091459
Chicago/Turabian StyleFlauger, Peter, Mostafa A. Ellabban, Gašper Glavan, Jürgen Klepp, Christian Pruner, Tobias Jenke, Peter Geltenbort, and Martin Fally. 2019. "Light- and Neutron-Optical Properties of Holographic Transmission Gratings from Polymer-Ionic Liquid Composites with Submicron Grating Spacing" Polymers 11, no. 9: 1459. https://doi.org/10.3390/polym11091459