Genome-Wide Identification, Evolution, and Expression Analysis of TPS and TPP Gene Families in Brachypodium distachyon


1
Key Laboratory of Genetics, Breeding and Multiple Utilization of Crops, Ministry of Education, Fujian Provincial Key Laboratory of Haixia Applied Plant Systems Biology, Fujian Agriculture and Forestry University, Fuzhou 350002, Fujian, China
2
National Engineering Research Center of Sugarcane, Fujian Agriculture and Forestry University, Fuzhou 350002, Fujian, China
3
Key Laboratory of Sugarcane Biology and Genetic Breeding, Ministry of Agriculture and Rural Affairs, Fujian Agriculture and Forestry University, Fuzhou 350002, Fujian, China
*
Author to whom correspondence should be addressed.
Plants 2019, 8(10), 362; https://doi.org/10.3390/plants8100362
Submission received: 1 August 2019
/
Revised: 19 September 2019
/
Accepted: 21 September 2019
/
Published: 23 September 2019
Abstract
:Trehalose biosynthesis enzyme homologues in plants contain two families, trehalose-6-phosphate synthases (TPSs) and trehalose-6-phosphate phosphatases (TPPs). Both families participate in trehalose synthesis and a variety of stress-resistance processes. Here, nine BdTPS and ten BdTPP genes were identified based on the Brachypodium distachyon genome, and all genes were classified into three classes. The Class I and Class II members differed substantially in gene structures, conserved motifs, and protein sequence identities, implying varied gene functions. Gene duplication analysis showed that one BdTPS gene pair and four BdTPP gene pairs are formed by duplication events. The value of Ka/Ks (non-synonymous/synonymous) was less than 1, suggesting purifying selection in these gene families. The cis-elements and gene interaction network prediction showed that many family members may be involved in stress responses. The quantitative real-time reverse transcription (qRT-PCR) results further supported that most BdTPSs responded to at least one stress or abscisic acid (ABA) treatment, whereas over half of BdTPPs were downregulated after stress treatment, implying that BdTPSs play a more important role in stress responses than BdTPPs. This work provides a foundation for the genome-wide identification of the B. distachyon TPS–TPP gene families and a frame for further studies of these gene families in abiotic stress responses.
1. Introduction
Abiotic stress, i.e., drought, chilling, salinity, and heat stress, are limiting factors that seriously affect crop quality and yield; thus, improving the abiotic stress tolerance of plants is highly important for the agricultural industry. Plants have gradually evolved complex molecular mechanisms that respond to environmental stress, resulting in stress tolerance. Complex regulatory networks can cause certain molecular, biochemical, and physiological changes, including the accumulation of osmotic substances, stomatal closure, and decreased photosynthesis [1]. Among these changes, the accumulation of trehalose is also a significant pathway for plants under stress conditions to avoid damage.
Trehalose is a non-reducing disaccharide of glucose that increases under abiotic stress in organisms [2]. Previous studies have found trehalose, for instance, to participate in the responses of microorganism, especially bacteria and yeast to different abiotic stresses [3,4,5,6]. In some microorganisms and invertebrate animals, trehalose acts as a carbon source and an osmoprotectant [7,8], particularly under heat and drought stress [9]. Indeed, some studies have shown that trehalose can protect plant cytomembranes against both drought injuries and freezing injuries [10] and maintain the stability of enzymes [11]. In higher plants, trehalose was determined to provide protection under different abiotic stresses, i.e., drought, heat, chilling, salinity, etc. [12,13,14,15].
It has previously been reported that trehalose can be biosynthesized via more than five routes in prokaryotes, but only one of these pathways exists in plants, namely, the ‘TPS–TPP pathway’ [2]. This route includes two enzymatic steps: The first process is catalyzed by trehalose-6-phosphate synthase (TPS) and synthesizes an intermediate from UDP-glucose (UDPG) and glucose 6-phosphate (G6P); next, trehalose-6-phosphate phosphatase (TPP) dephosphorylates the intermediate to trehalose [2,16]. The TPS protein has been previously identified in many organisms [17,18,19,20], such as Saccharomyces cerevisiae and Escherichia coli. In recent years, TPS and TPP genes have been studied in many higher plants, suggesting that trehalose is likely ubiquitous in flowering plants [2,8,21,22,23,24]. Unlike single TPS and TPP genes in the majority of microorganisms, the genomes of higher plants encode a large family of trehalose biosynthesis enzyme homologues. These members are commonly classified into three classes based on the TPS/TPP protein domain [25,26]. In the Arabidopsis genome, four Class I (AtTPS1–4), seven Class II (AtTPS5–AtTPS11), and ten Class III (AtTPPA–AtTPPJ) genes have been identified [24,27].
In higher plants, trehalose-6-phosphate (T6P) is an indispensable signal intermediate that influences plant growth and development by linking pivotal signaling routes of carbon metabolism [16,24,28,29]. First, T6P plays a vital role in starch synthesis via the post-translational redox activation of ADP-glucose pyrophosphorylase [30,31]. Second, T6P can inhibit the activity of Sn1-related protein kinase (SnRK1) [32], which has a vital role in the transcription networks of plant stress and energy metabolism [33]. From a review of the literature, the genetic manipulation of TPS/TPP genes could improve stress resistance in different species [15,34,35,36,37,38,39]. Moreover, some TPS/TPP genes are directly involved in stress tolerance by improving the trehalose contents in several plants [14,40,41]. However, many of the functions of the TPS/TPP genes are largely unknown, especially for those genes involved in signaling pathways in plant development and stress resistance. Therefore, the identification of TPS and TPP genes is crucial for investigating the molecular mechanisms that combat various environmental stresses.
Brachypodium distachyon L. (2n = 10), as a model system for grasses, has a small genome (~270 Mbp), low plant height, and a short growth cycle [42,43], which enables the evaluation of the molecular mechanisms of growth, development, and abiotic stress. Although TPS genes in other plants were identified [27,44,45,46,47], TPS genes in B. distachyon have not been well studied. Moreover, the TPP family has not yet been characterized in plants other than Arabidopsis [24]. In this study, the characteristics of the BdTPS and BdTPP genes were identified by analyzing the evolutionary tree, intron/exon structure, motifs, and selective forces. We also studied the expression patterns in different tissues and under various stresses. Taken together, our study enhances the understanding of the function and evolution of the TPS and TPP genes.
2. Results
2.1. Identification of TPS and TPP Family Members in Brachypodium distachyon
To identify all homologs of TPS and TPP in B. distachyon, hidden Markov models (HMMs) were performed using the Blast method (E-value < e−10). Ultimately, we identified nine BdTPS and ten BdTPP genes, which were named BdTPS1–BdTPS9 and BdTPPA–BdTPPJ, respectively (Table 1). The number of TPS genes was less than those in Arabidopsis thaliana (11), rice (Oryza sativa, 11), Populus trichocarpa (12), and soybean (13) [27] but more than in potato (8) [47] and drumstick tree (8) [45].
All of the basic information of the family members, including the locus, exon number, gene length, protein length, predicted isoelectric point (pI), and molecular weight (MW), is listed in Table 1. According to the results, BdTPSs/BdTPPs encode proteins with 820–985/351–421 amino acids (AA), predicted isoelectric points (pI) of 5.36–6.09 and 5.64–9.21, and molecular weights (MW) of 91.24–109.37 and 38.58–47.22 kDa, respectively. By predicting their subcellular localization, we found that only four TPSs (BdTPS4, 7, 8, 9) were specifically located in cytoplasm, while the other TPSs were located in cytoplasm, inner membrane, periplasmic membrane, and/or outer membrane. In addition, three TPP genes (BdTPPH, I, J) were located in the cytoplasm, four TPPs (BdTPPB, E, F, G) were located in the periplasm, and three TPPs (BdTPPA, C, D) were located in both positions.
2.2. Gene Structure, Multiple Sequence Alignment, and Phylogenetic Analyses of BdTPSs/BdTPPs
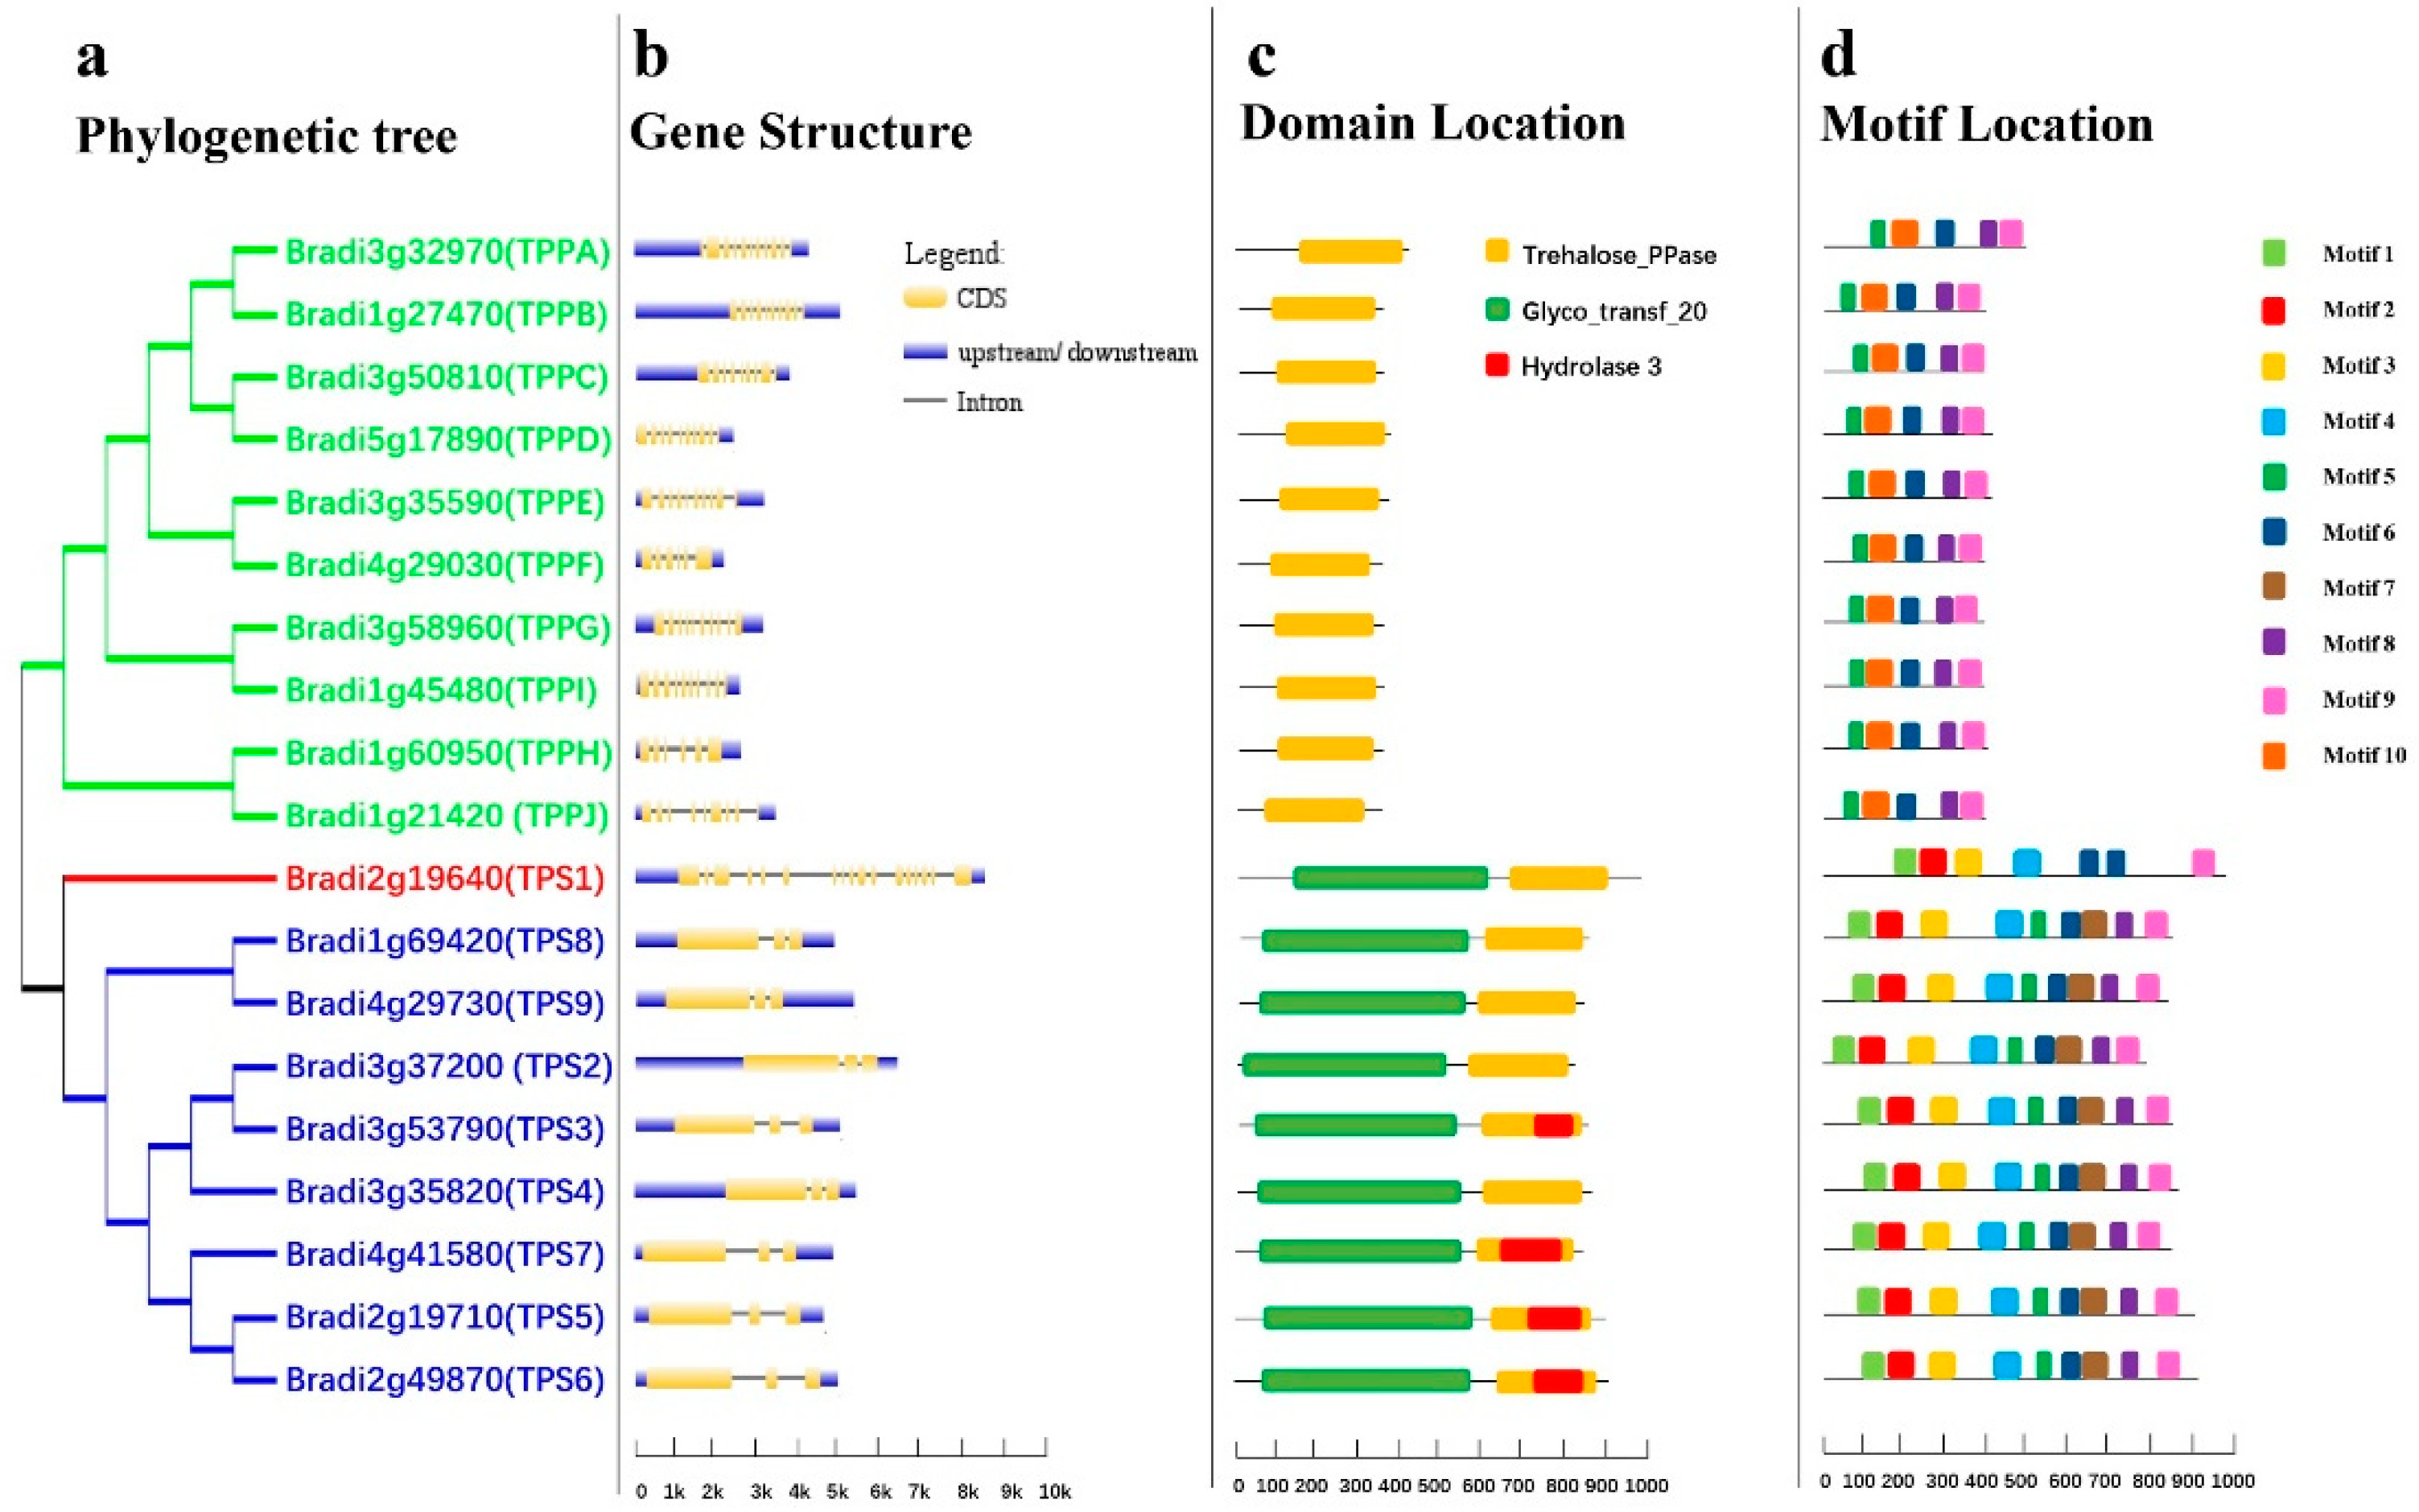
To investigate homologous relationships, an evolutionary tree was constructed using the BdTPS/BdTPP protein sequences with the MEGA 7.0 program [48]. According to the previous classification principles used for rice and Arabidopsis TPS/TPP genes [8,49], BdTPSs/BdTPPs can be divided into three subfamilies. Surprisingly, only the BdTPS1 gene belonged to Class I (Figure 1a), which corresponded to the preceding results in rice, compared with four members (AtTPS1–4) in Arabidopsis and two in Moringa oleifera [21,50,51]. The other BdTPSs (BdTPS2–9) belonged to Class II, similar to AtTPS5–11. In addition, the Class III groups (BdTPPA–BdTPPJ) encoded a family of smaller proteins lacking the N-terminal TPS-like domain and with a conserved TPP catalytic site motif (Figure 1c).
In contrast to the similar CDS length (2463–2958) of the nine TPS genes, there are large differences in genomic length (2783–7172). However, all TPP genes have similar number of exons (6–10), gene lengths (1793–2835), and CDS lengths (1056–1266) (Table 1, Figure 2b). Moreover, the BdTPS1 protein sequences contain an N-terminal extension in comparison with other BdTPS proteins, which has been proven an autoinhibitory domain modulating TPS activity [51].
2.3. Protein Sequences and Motif Analysis in BdTPSs/TPPs
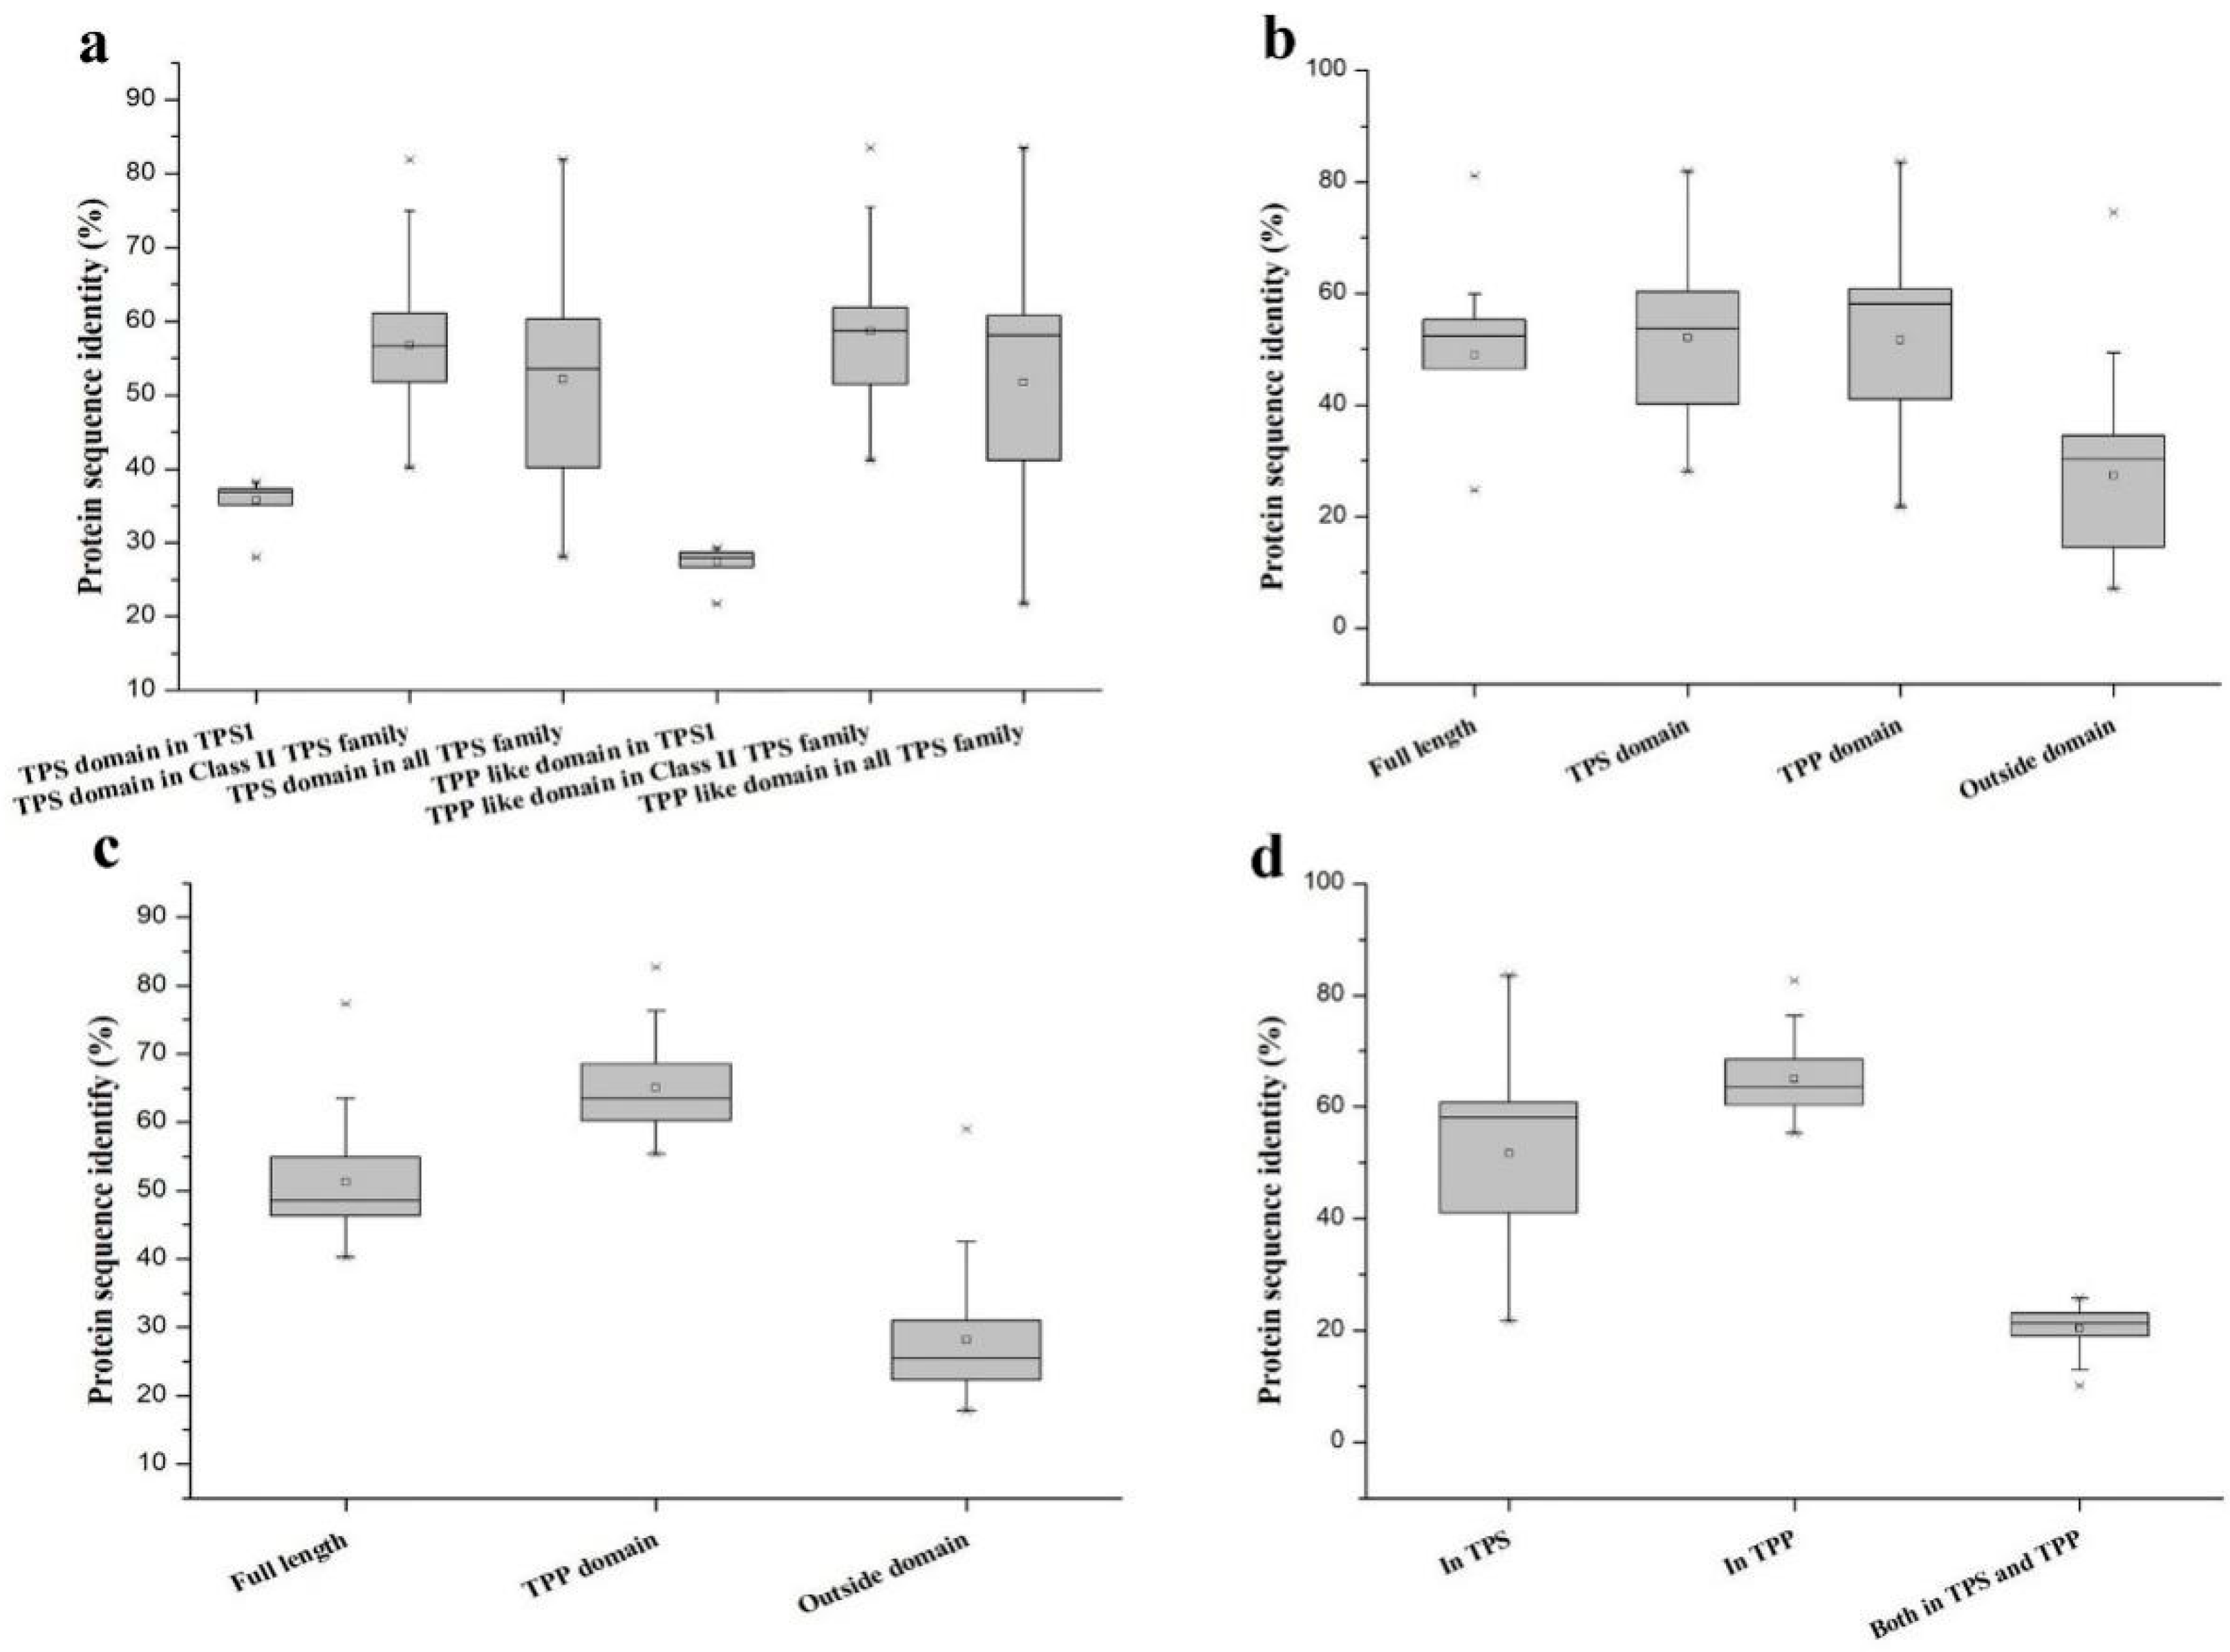
A homology analysis between Class I (BdTPS1) and eight other Class II TPS proteins (BdTPS2–9) indicated that the nucleotide identity between them ranged from 28.07% to 38.16%, while the nucleotide identity among the Class II proteins ranged from 40.12% to 81.87% (Figure 2a). Higher differences were observed in regions of the protein sequences outside of the TPS and TPP domains. The average identities of the peptide sequences of the TPS and TPP domains in BdTPS were about approximately 52%, while the sequence identity outside the domain was only 27% of the sequence identities (Figure 2b). Furthermore, the full protein sequences of the TPP family members had 40.23%–77.39% pairwise sequence identity (Figure 2c). Similarly, the outside domain in BdTPP showed a lower identity of 28% (Figure 2c), suggesting that the outside domain had a more variable sequence than the structural domain.
In addition, to examine the differences in the TPP domains of BdTPS and BdTPP, we also calculated the protein pairwise sequence identities in these two families. The results revealed approximately 52% amino acid identity on average among BdTPSs and BdTPPs, while higher rates (65%) of pairwise sequence identities were observed in BdTPPs (Figure 2a,d). Extraordinarily, the TPP domain region between BdTPS1 and BdTPPs had only 27% pairwise sequence identity (Figure 2a). Furthermore, the protein sequences between the BdTPS and BdTPP groups had only 27% pairwise sequence identity (Figure 2d).
Motif distribution analysis of all BdTPS/BdTPP proteins was performed by the MEME program. A total of ten conserved motifs of BdTPS/BdTPP are shown in Figure 1d. We summarized the three groups as follows. First, all BdTPS proteins of Class II contained nine motifs excluding motif 10. BdTPS1 possessed only seven motifs, lacking motifs 5 and 7 compared with Class II members. Moreover, there were two copies of motif 6 in BdTPS1. These findings support our previous results that BdTPS1 (Class I) has diverse sequences compared with other BdTPSs (Class II). Second, all of the BdTPPs contained five motifs, namely, motifs 5–10, which showed the conserved structure in all BdTPP proteins. Third, we found that the motifs 7 and motif 10 were specifically localized in the TPP domains of BdTPS and BdTPP, respectively.
2.4. Chromosomal Locations and Evolution Analysis
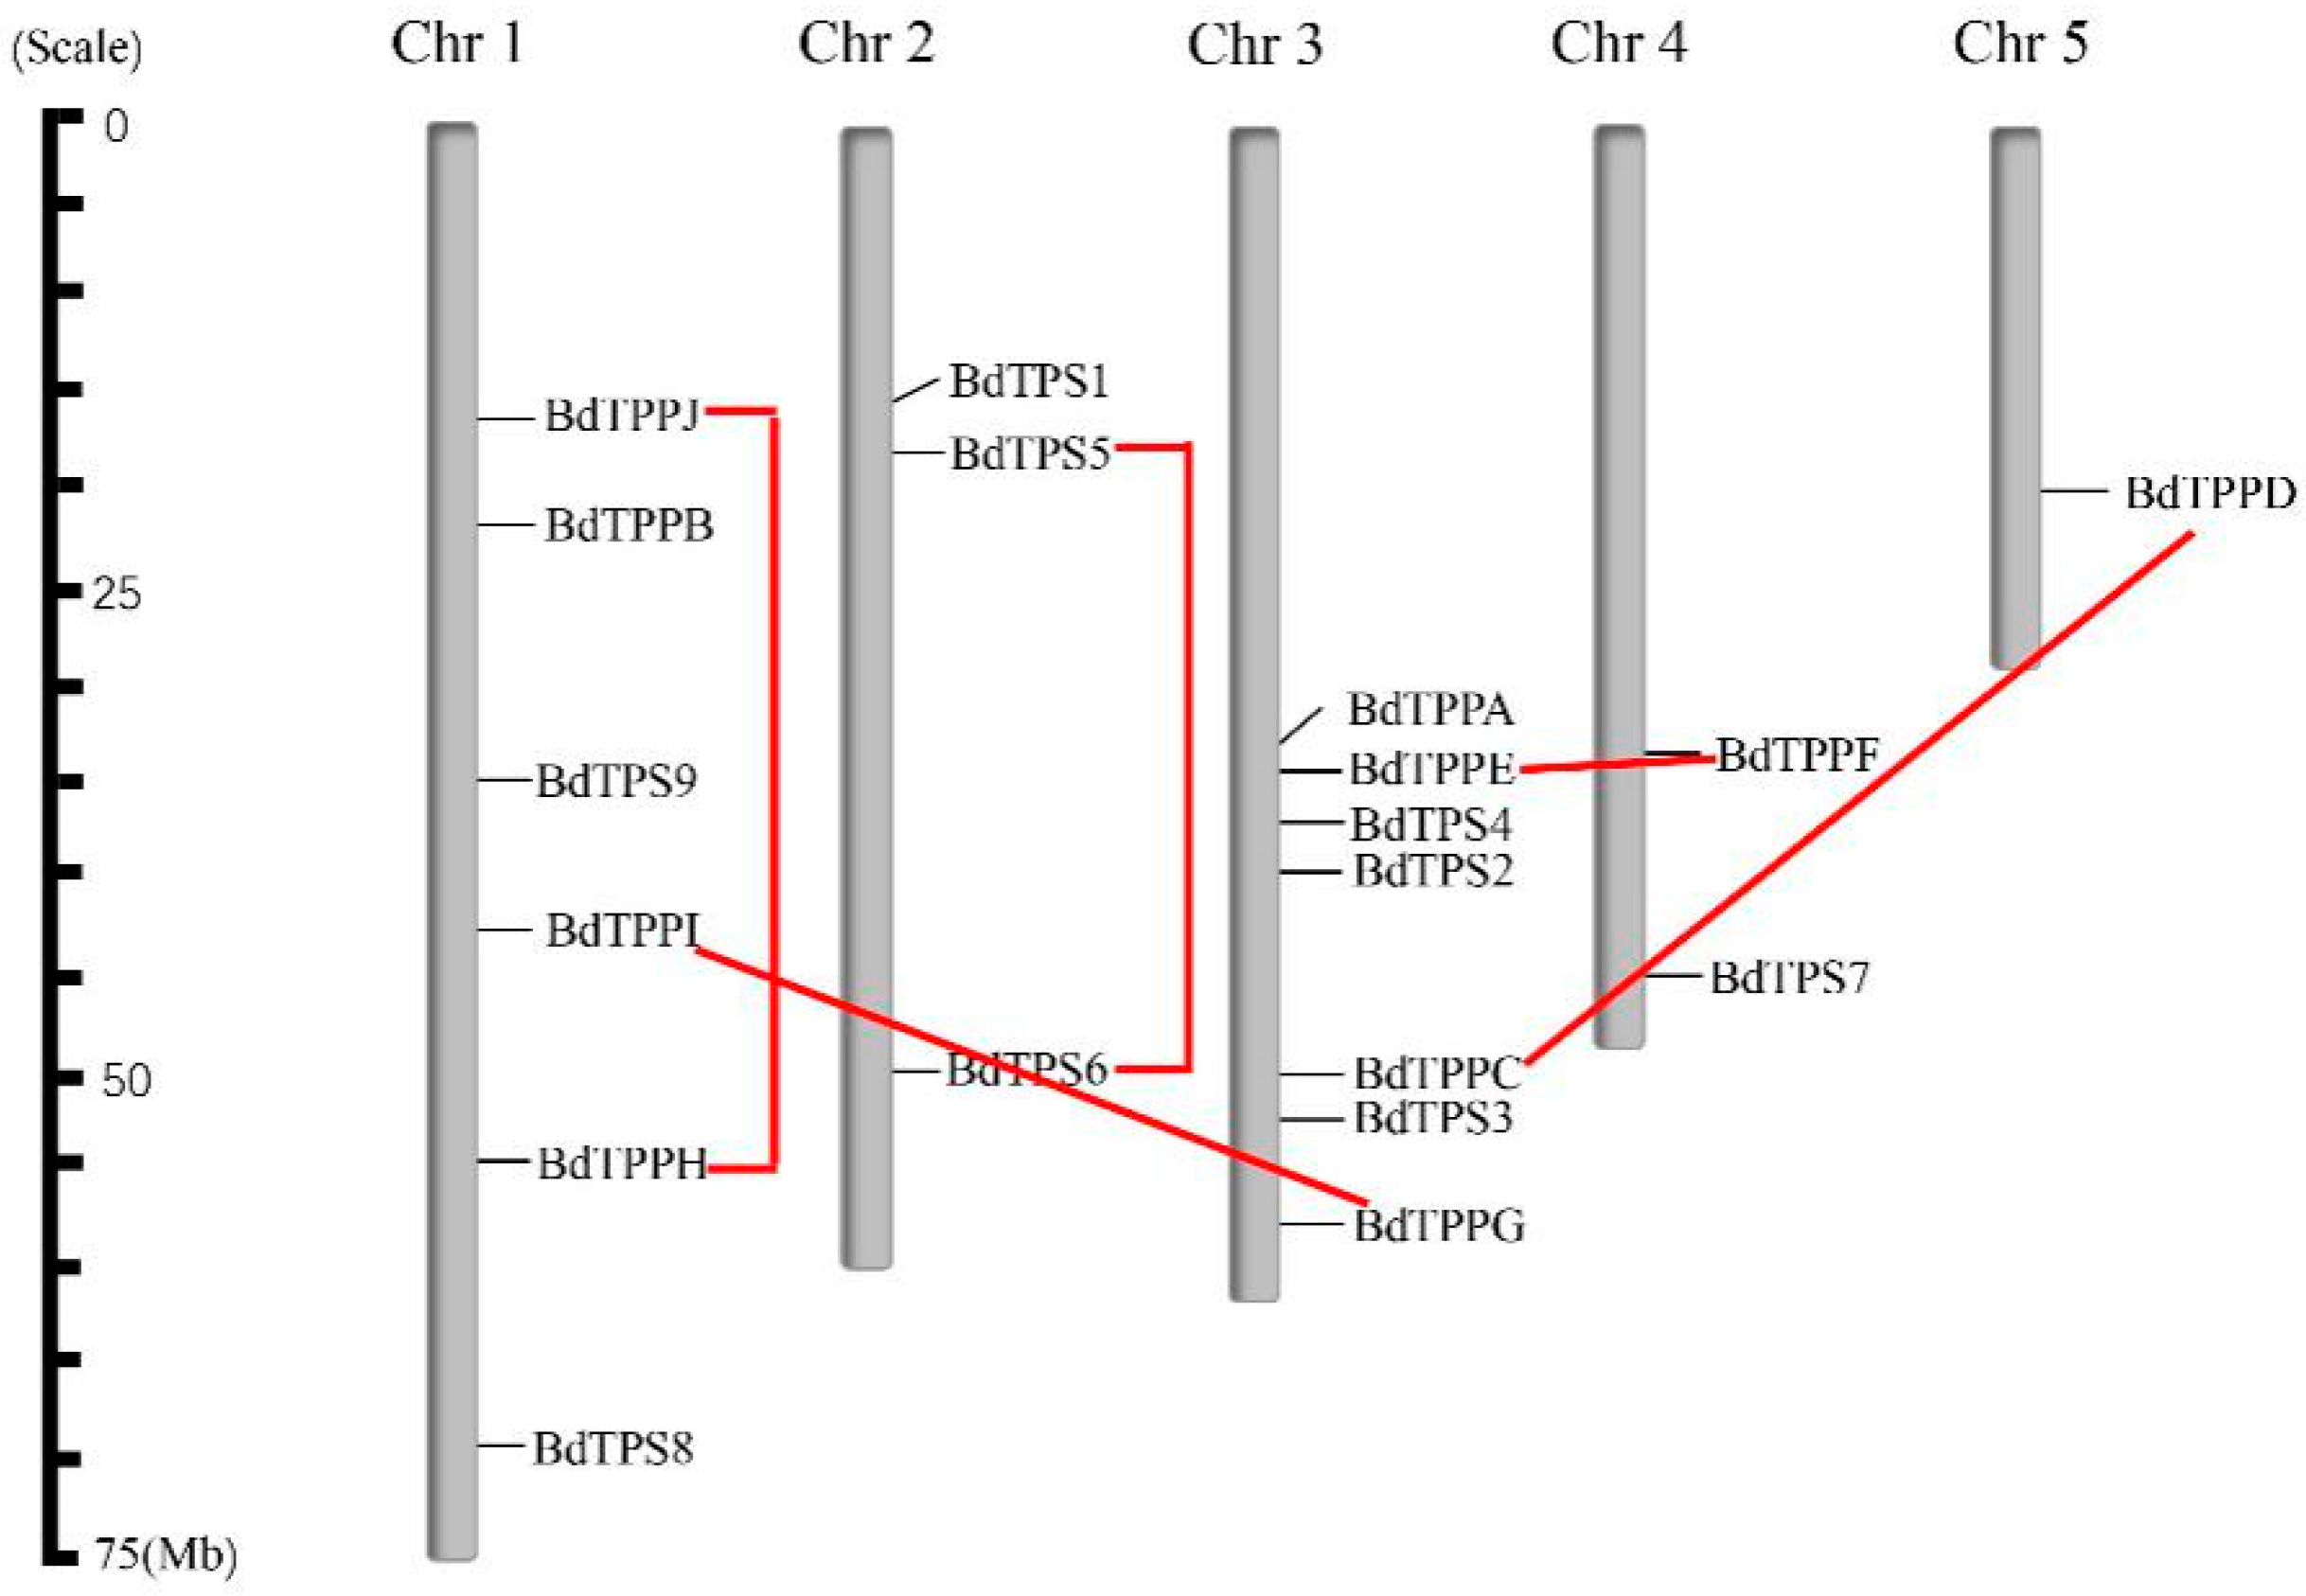
To research the distribution of BdTPS and BdTPP genes in the genome, we showed their position on each chromosome based on the B. distachyon genomic database (Figure 3; Table 2). Both the BdTPS and BdTPP genes were dispersed on four chromosomes. However, we did not find BdTPS genes on chromosome 5 or BdTPP genes on chromosome 2. In detail, chromosome 1 contained five genes (BdTPS8 and BdTPPB, H, I, J), chromosome 2 contained three genes (BdTPS1, 5, 6), chromosome 3 contained seven genes (BdTPS2, 3, 4, and BdTPPA, C, E, G), chromosome 4 contained three genes (BdTPS3, 9, and BdTPPF) and chromosome 5 contained only one gene (BdTPPD).
Gene duplications on genomes could provide significant reference for gene evolution analysis. In the following research, were analyzed these two families. According to the standard for inferring a gene duplication event (>70% protein sequence identity and >75% sequence length identity) [52] and the results of phylogenetic analysis (Figure 1a), we predicted five clustered duplicated gene pairs (BdTPS5–6, BdTPPC–D, BdTPPE–F, BdTPPG–I, and BdTPPH–J) in the B. distachyon genome. We did not find any evidence of a tandem duplication phenomenon between these gene pairs according to the generalized principle that two genes should be separated by less than five genes in a 100 kb region [53]. According to the chromosome locations, two gene pairs (BdTPS5–6, BdTPPH–J) and three gene pairs (BdTPPC–D, BdTPPE–F, BdTPPG–I) may be generated by intrachromosomal duplication and interchromosomal duplication, respectively.
To understand the selective pressure acting on the trehalose biosynthesis enzyme homologue gene family, the Ka/Ks (non-synonymous/synonymous) values of these five duplicate gene pairs were calculated as shown in Table 2. The results indicated that the Ka/Ks values of the five pairs of duplicated genes were less than 1, indicating that they have evolved by purifying selection (Ka/Ks = 1, neutral selection, Ka/Ks < 1, purifying selection, and Ka/Ks > 1, positive selection [54]), which was similar to the results obtained in other plants [27,44,45].
Next, we calculated the divergence time for five pairs of duplicated genes. The results are listed in Table 2, which shows that two pairs of genes, BdTPPE/F and BdTPPG/I, were estimated to diverge at approximately 32.75 and 41.58 million year ago (MYA) and may represent two recently duplicated gene pairs. In contrast, the divergence times of one pair of genes (BdTPPC/D) surpassed the divergence time of grass species (approximately 56–73 MYA) [43]. In addition, two pairs of genes, BdTPS5/6 and BdTPPH/J, existed at the time of the divergence time of grass species, prompting the concomitant formation of those two pairs of genes by whole-genome duplication.
2.5. Transcription Factor Regulatory Network and Stress-Related Cis-Elements in the Promoter Regions and Gene Interaction Expression Network Prediction of BdTPSs/BdTPPs
Many previous researches have demonstrated that the TPS/TPP genes confer biotic and abiotic stress tolerance on different plants in addition to developmental alterations. For example, the overexpression of AtTPS1 significantly improved the drought resistance of Arabidopsis [55]. The overexpression of OsTPS1 increased rice tolerance to abiotic stress [56]. OsMAPK3 was found to phosphorylate OsICE1, inhibit its ubiquitination to activate the expression of the OsTPP1 gene, and improve the chilling tolerance of rice [14]. In this study, we first predicted the stress-related cis-elements and co-expression network using different online tools.
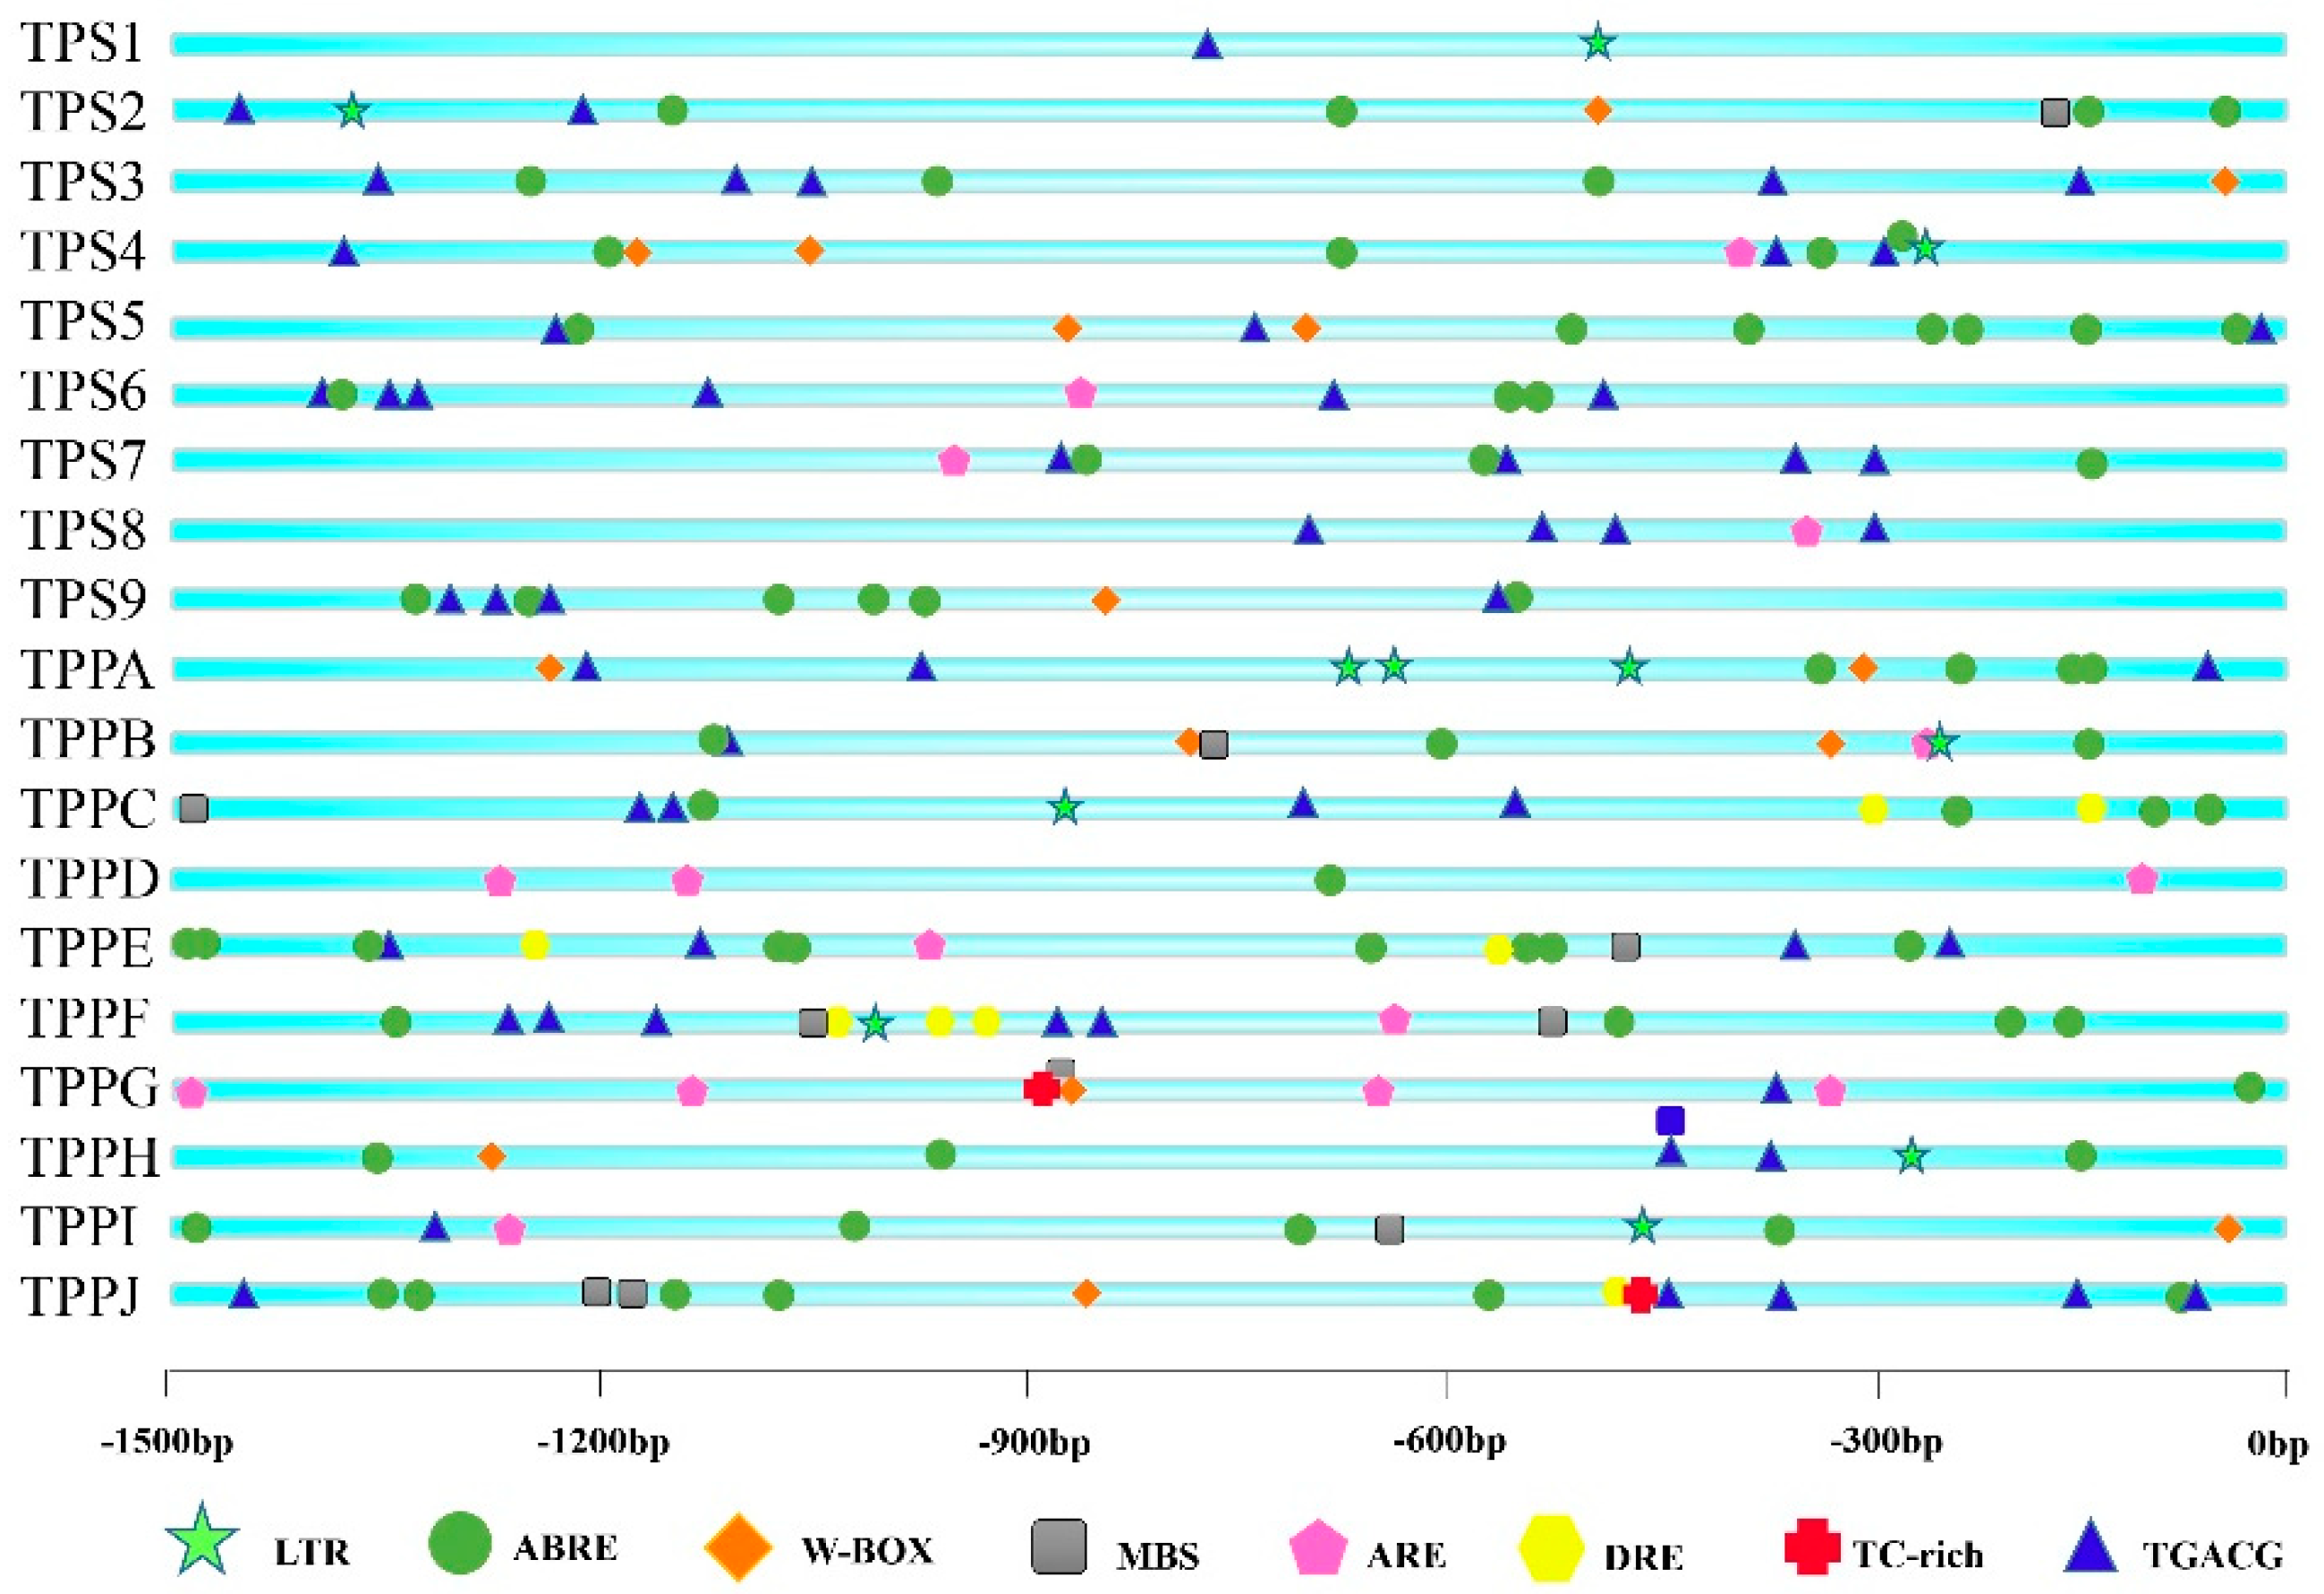
First, we identified cis-elements of all BdTPSs/BdTPPs using an online tool, PlantCARE. Eight abiotic stress-response elements, abscisic acid (ABA)-responsive elements (ABREs), dehydration-responsive elements (DREs), low-temperature-responsive elements (LTREs), stress-response elements (TC-rich repeats LTRs, TGACG motifs), regulatory elements essential for anaerobic induction (AREs), and W-box were identified and are displayed in Figure 4. From the results, we found that almost all of the genes possessed more than two stress-related cis-elements. Remarkably, most of these family members possessed multiple ABREs, excluding BdTPS1 and jasmonic acid methyl ester (MeJA), which respond to ABA, drought or salt signals, and drought, respectively [57,58,59,60]. Furthermore, many other elements were distributed among different family members, such as MBS elements involving drought stress (TPS2 and TPPB, C, E, F, I, J) [61]; DREs concerning dehydration, low-temperature and salt stresses (TPPB, C, E, F, J); TC-rich elements (TPPG and J); LTREs, involved in low-temperature responses (TPS1, 2, 4 and TPPA, B, C, F, H, J); AREs essential for anaerobic induction (TPS4, 6, 7, 8 and TPPA, B, D, E, F, G, H, I); and W-boxes, binding sites for WRKY transcription factors in stress responses (TPS2, 3, 4, 5, 9 and TPPA, B, G, H, I, J). Regrettably, we did not find the HSE element that was involved in the heat-resistance response. In addition to these stress-response elements, plentiful light-response elements were identified, such as the ACE, AE-box, G-box, I-box, and TCT motifs.
Furthermore, to identify the potential transcriptional regulatory network of the BdTPS and BdTPP genes, sequences 600 bp upstream of the genes were analyzed. The results indicated hundreds of the transcription factors involved in the regulation of 19 family members, mainly including MYB, ERF, and bZIP and many other families (Figure 5). Among these family members, many of the transcription factors were related to the response to abiotic stress or phytohormones (Table S2), corresponding to the result of the cis-element analysis.
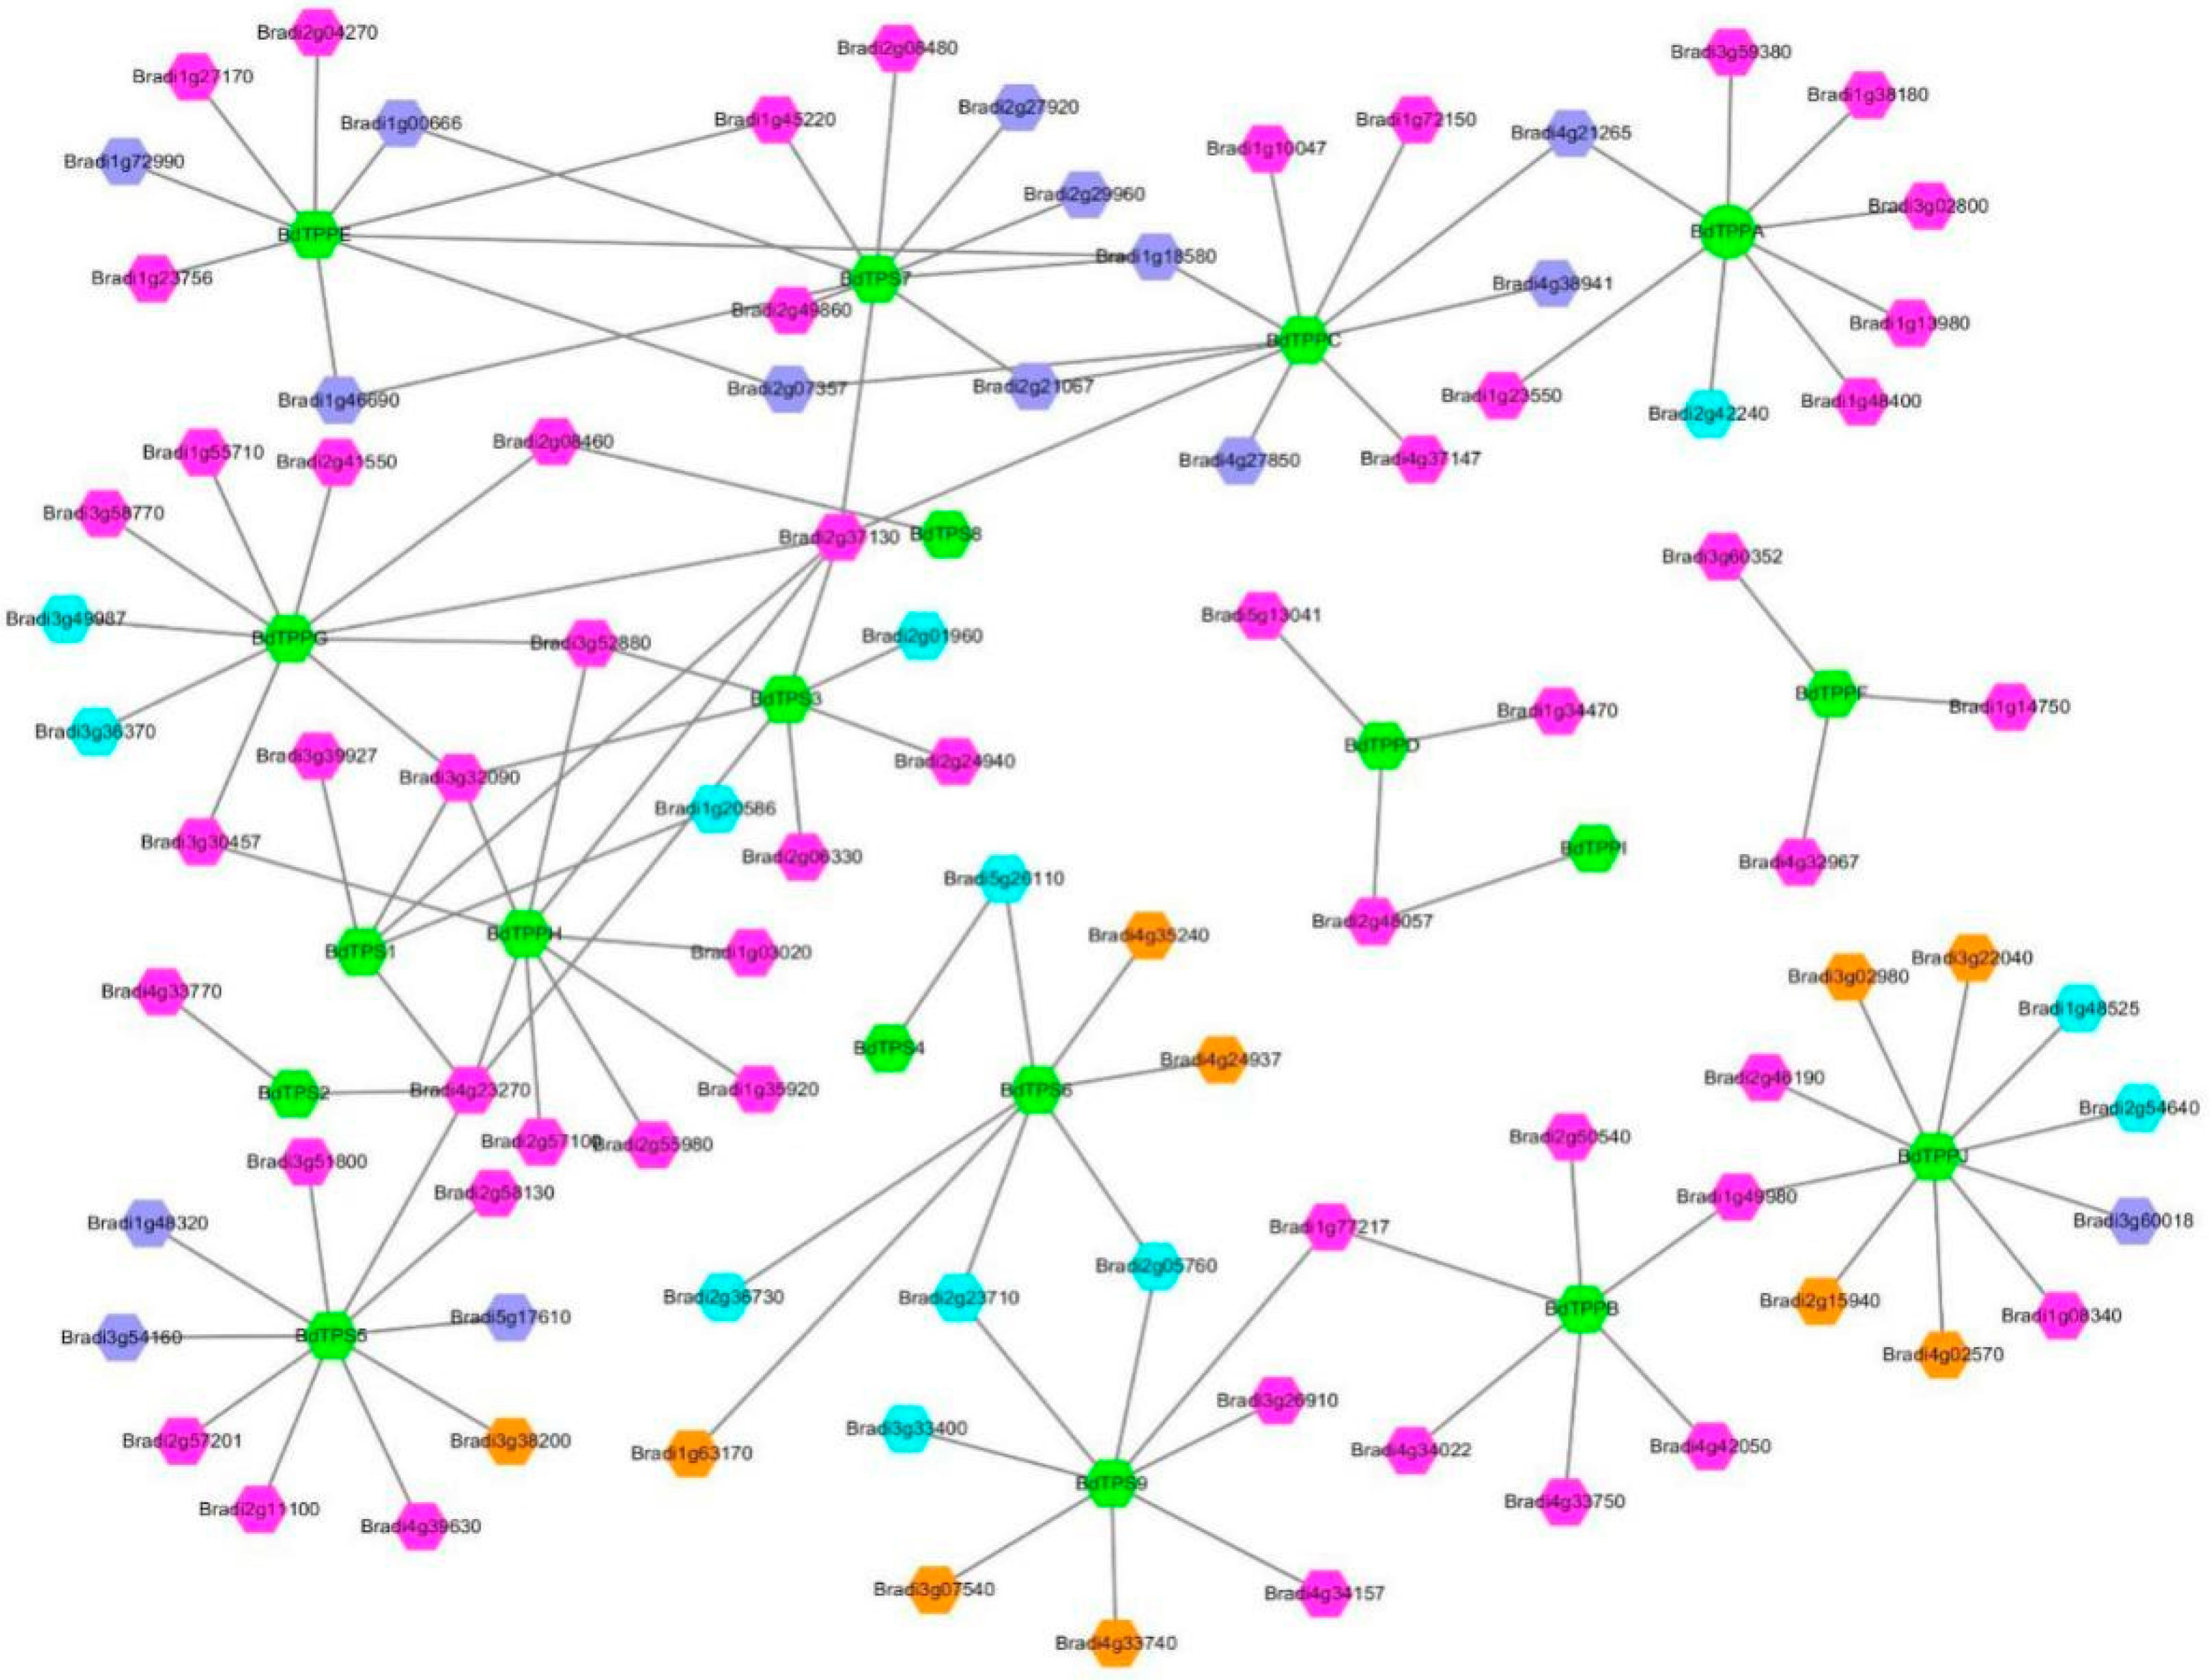
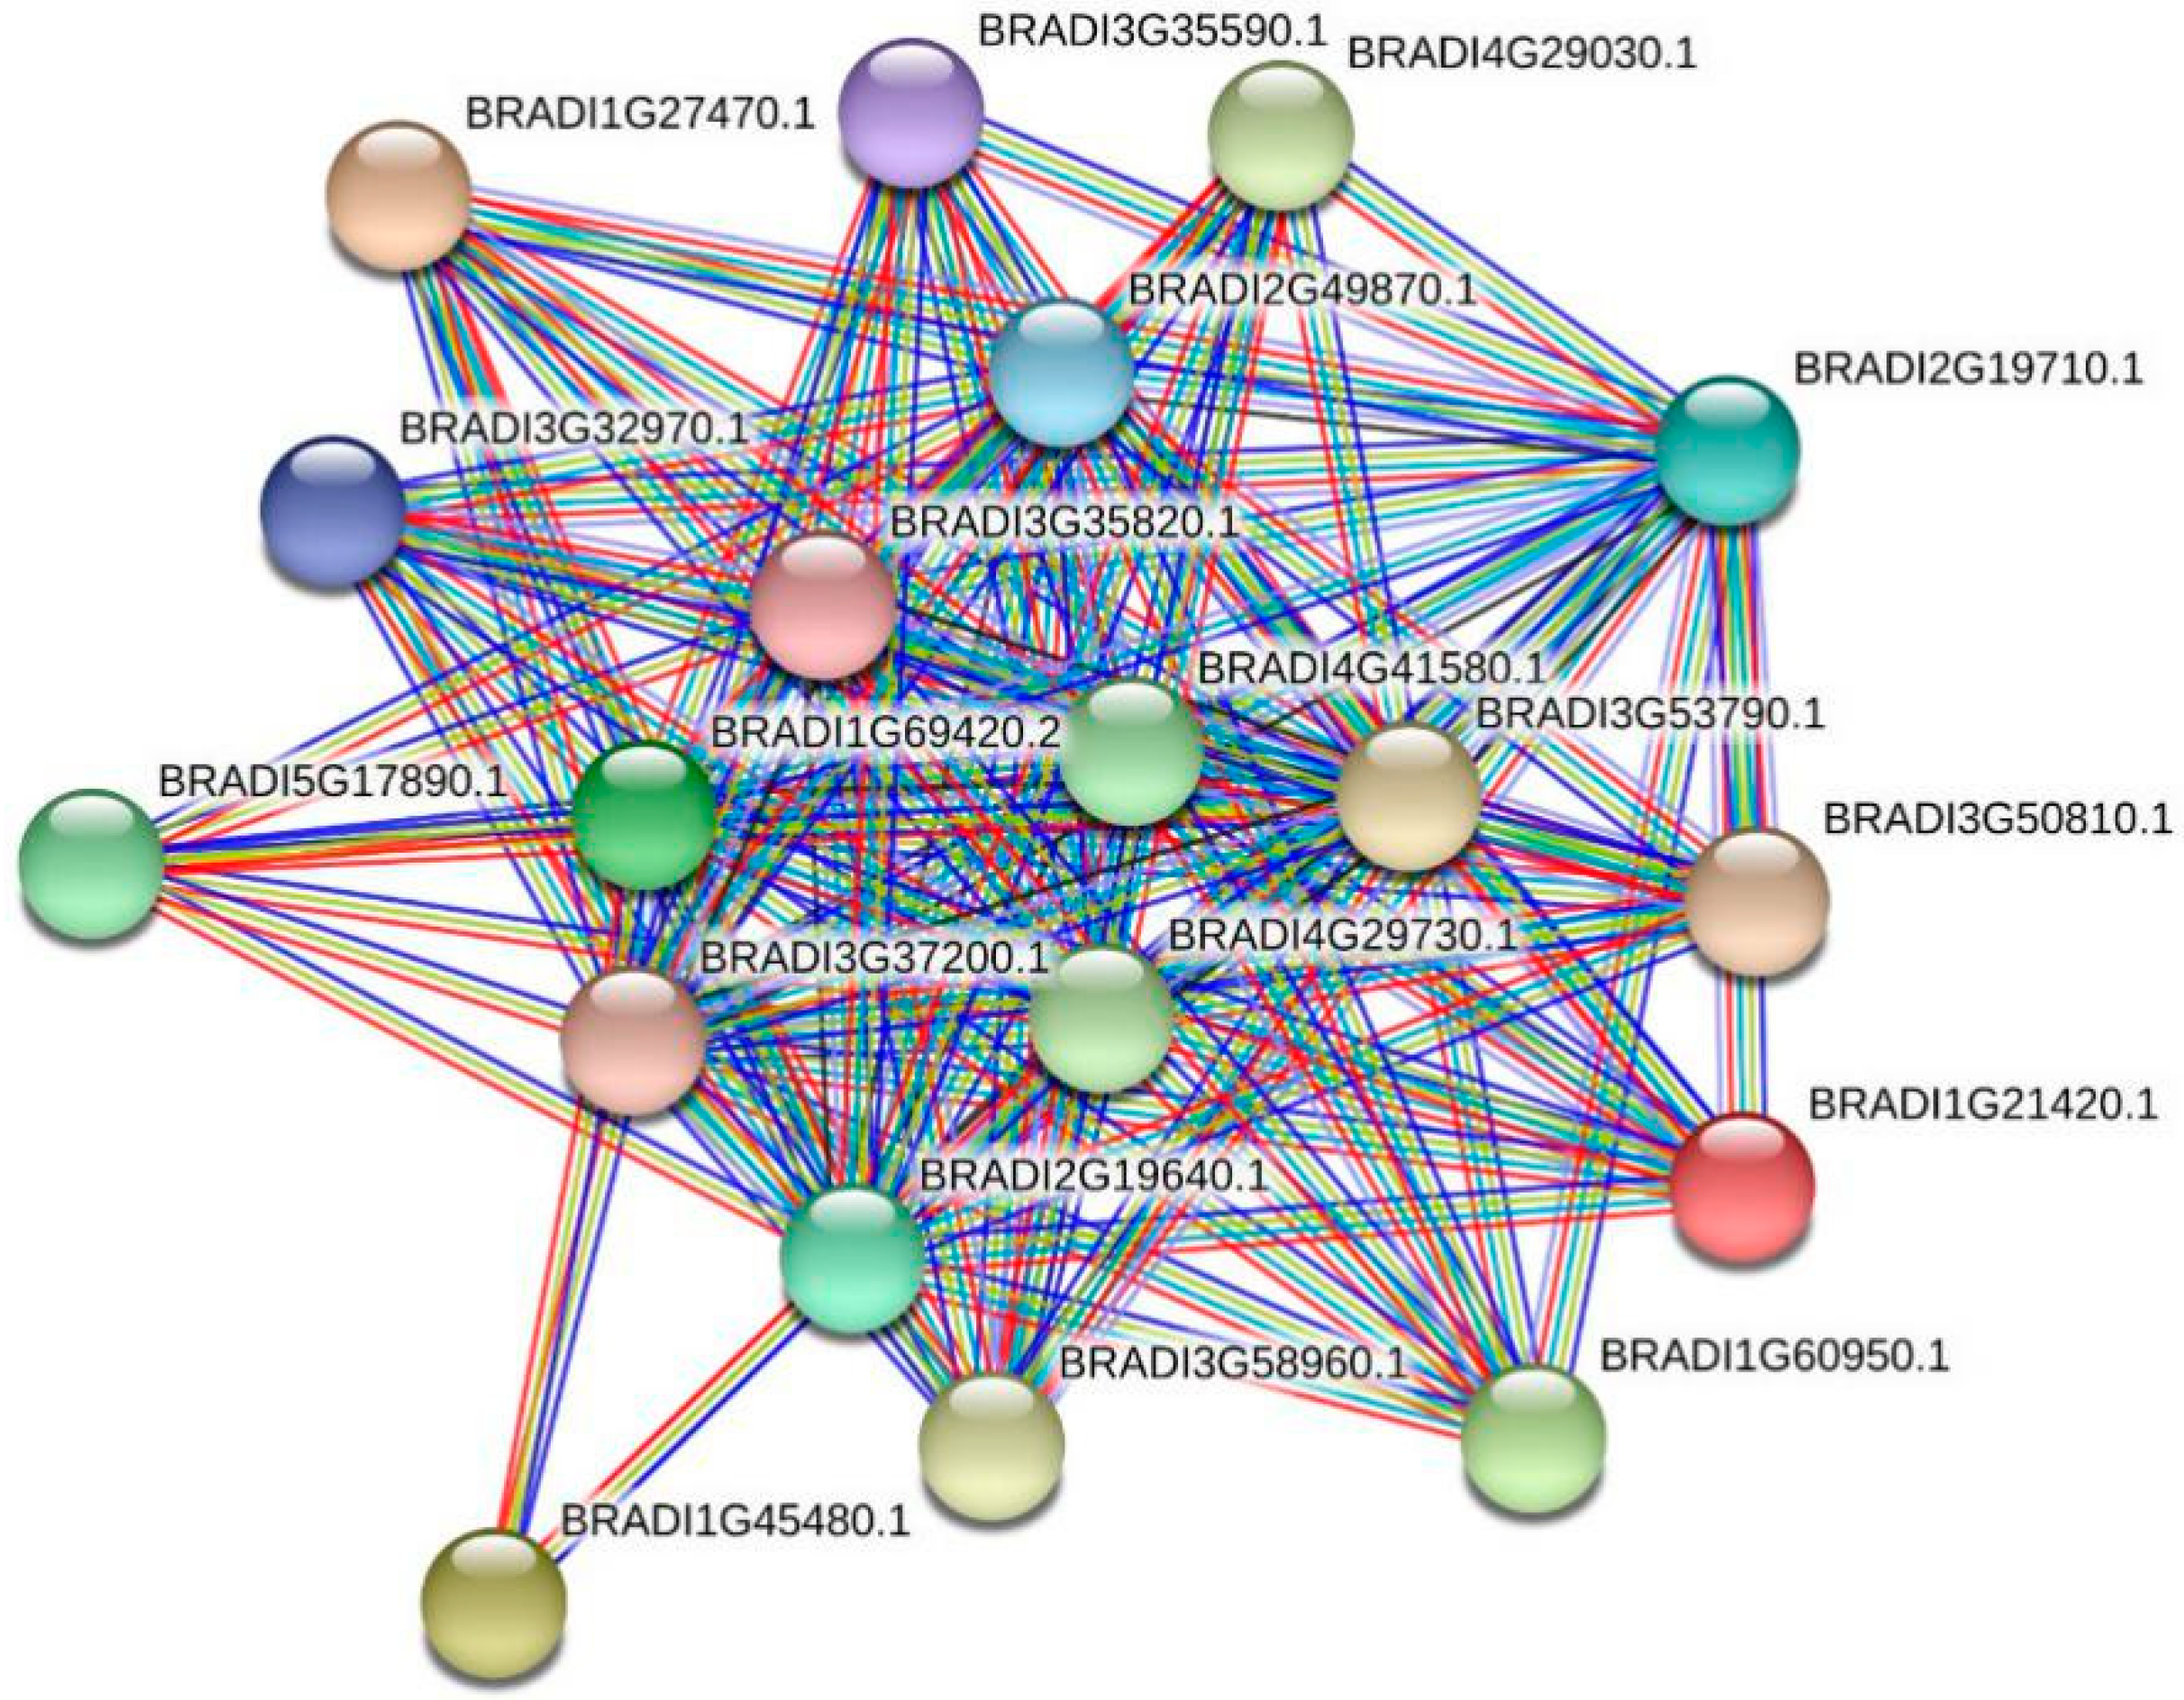
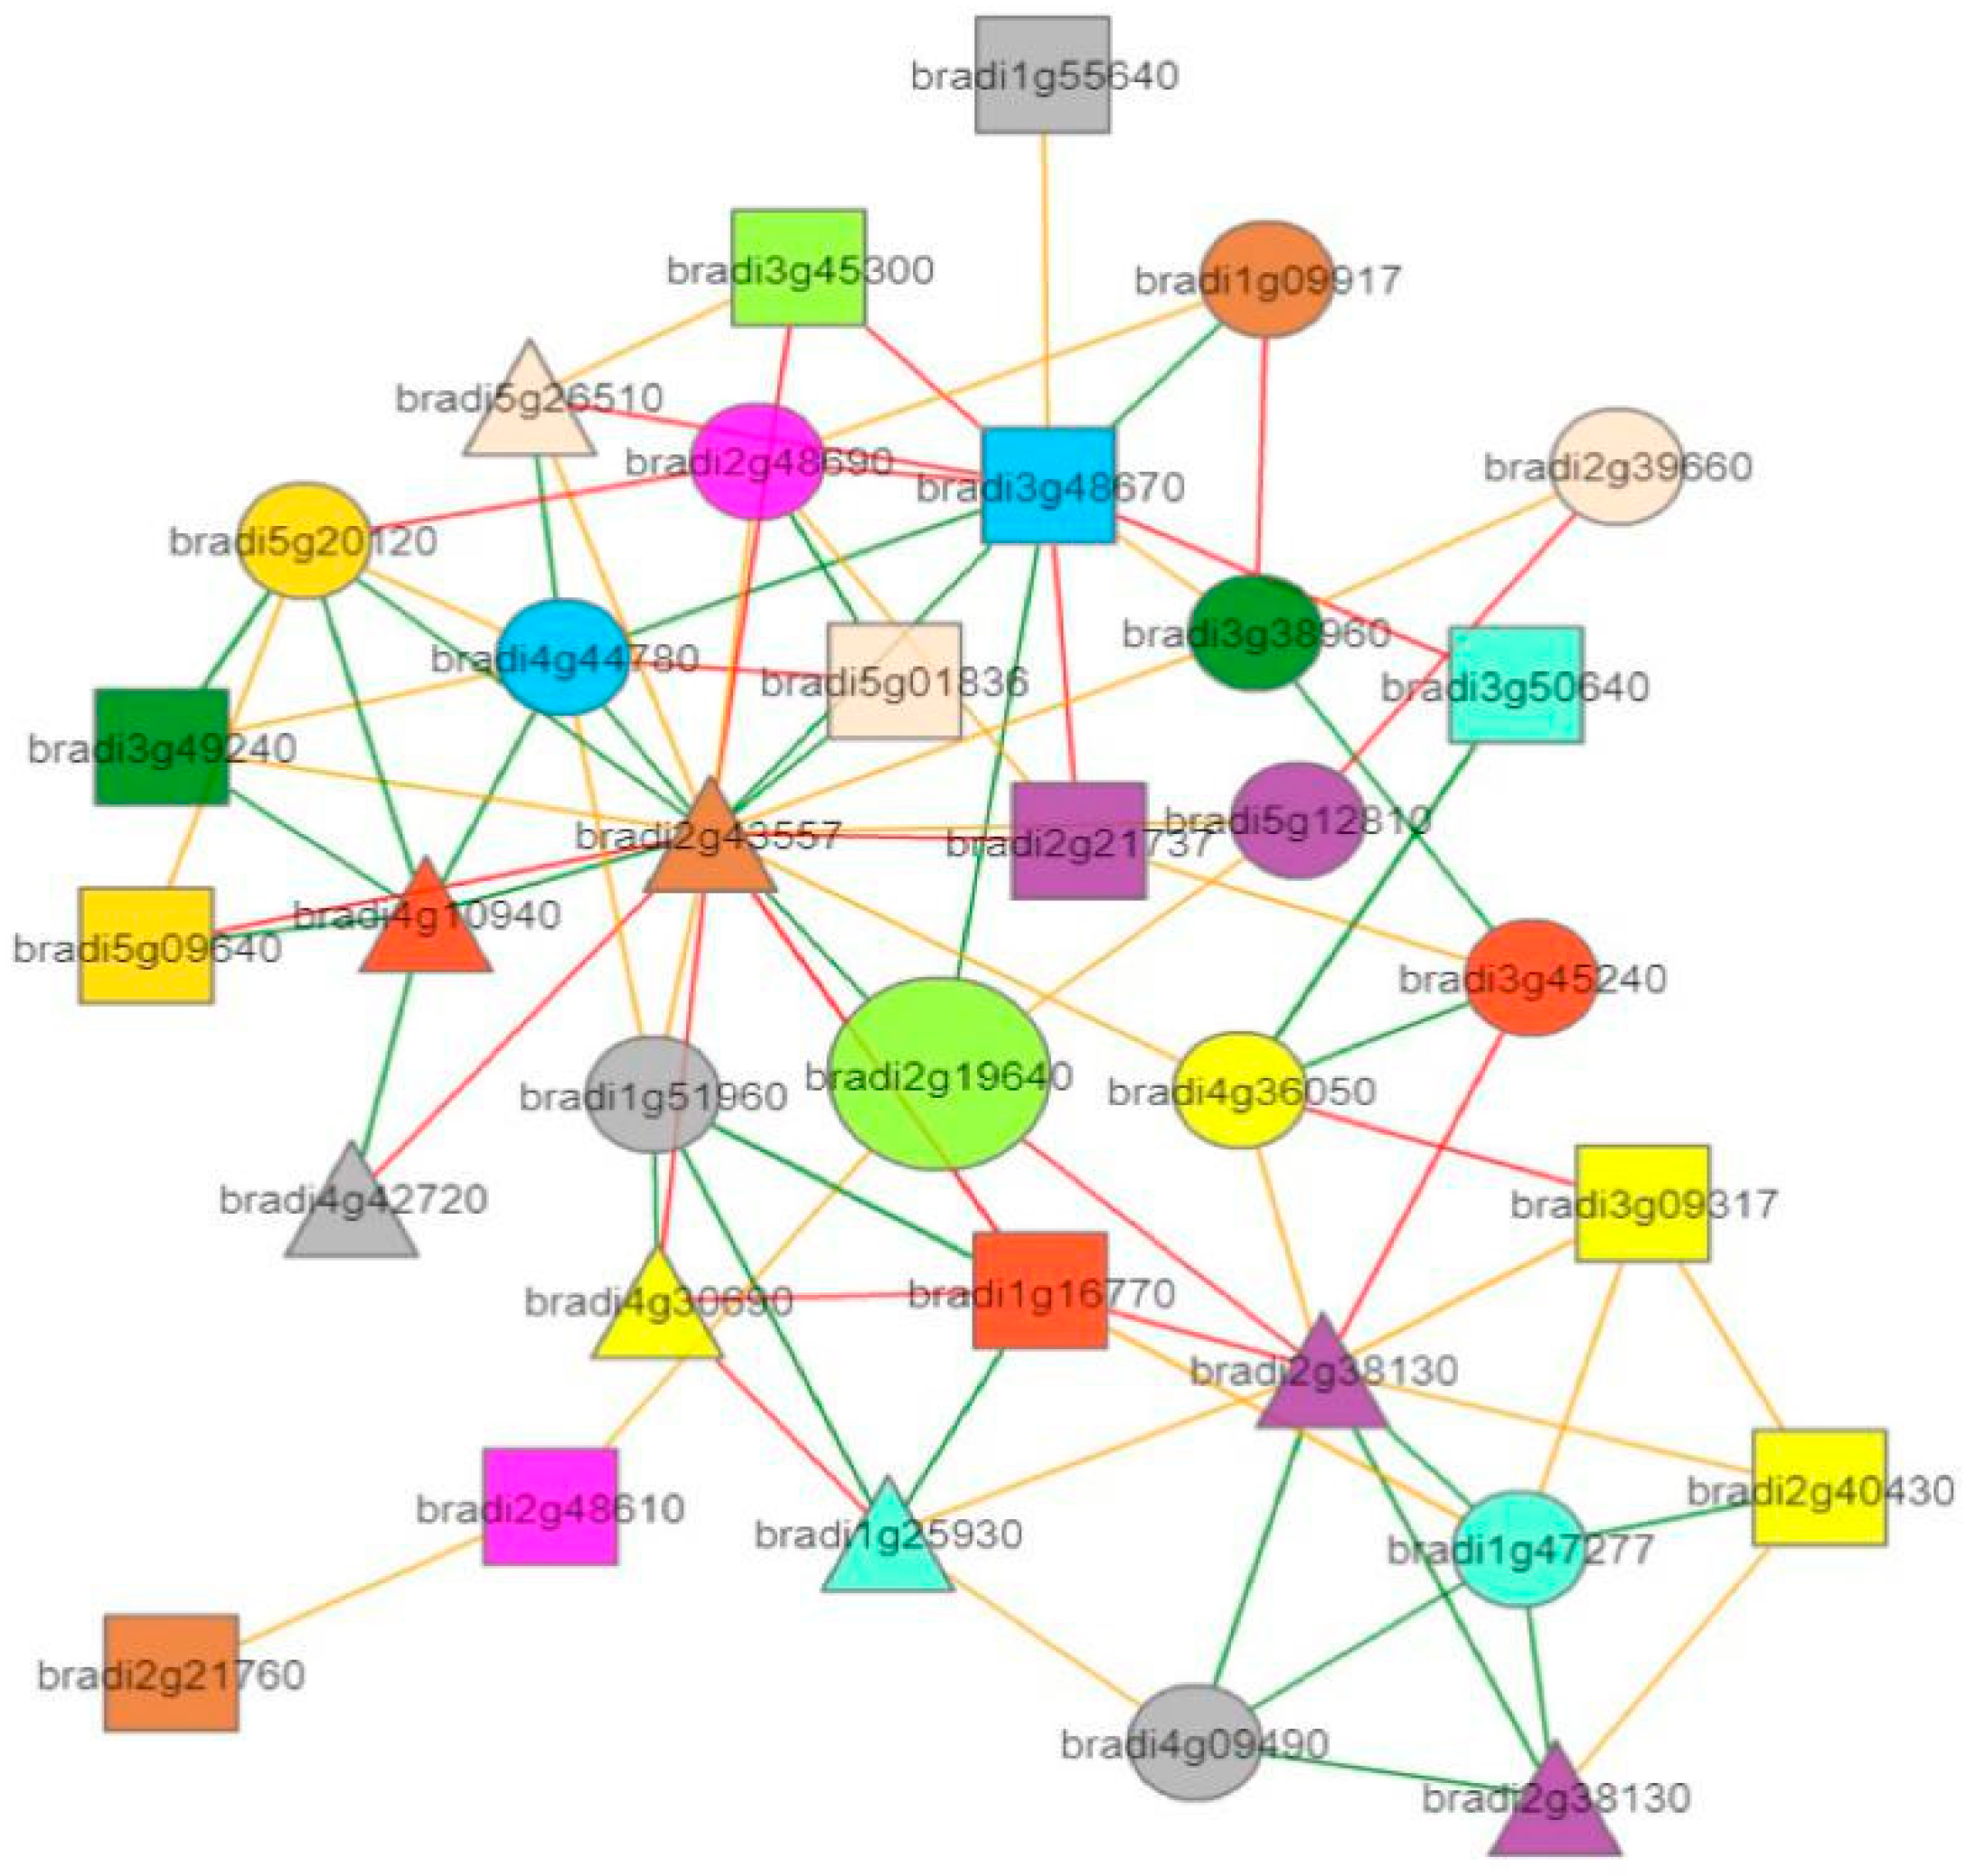
In addition, to obtain information regarding the co-expression relationships between BdTPS/BdTPP and other genes, we constructed a co-expression network using the STRING and PlaNet co-expression databases [62]. First, we used the online program STRING to predict the co-expression networks in 19 family members. The results showed strong ties between these two family members (Figure 6). Second, we also predicted the gene interaction connection on (take BdTPS1 for example) single genes based on PlaNet, which showed several directly and indirectly interacting genes (Figure 7). The GO annotations of directly interacting genes involved in diverse biological functions and are presented in Table S3. Most BdTPS/BdTPP proteins interact with many of these other family members. In particular, some genes may work in response to chilling or other stresses (Table S3). However, there were no co-expression network data on any of the proteins, including BdTPS3, 8, and BdTPPA, J.
2.6. Expression Patterns of BdTPSs–BdTPPs in Different Tissues and Stress Conditions
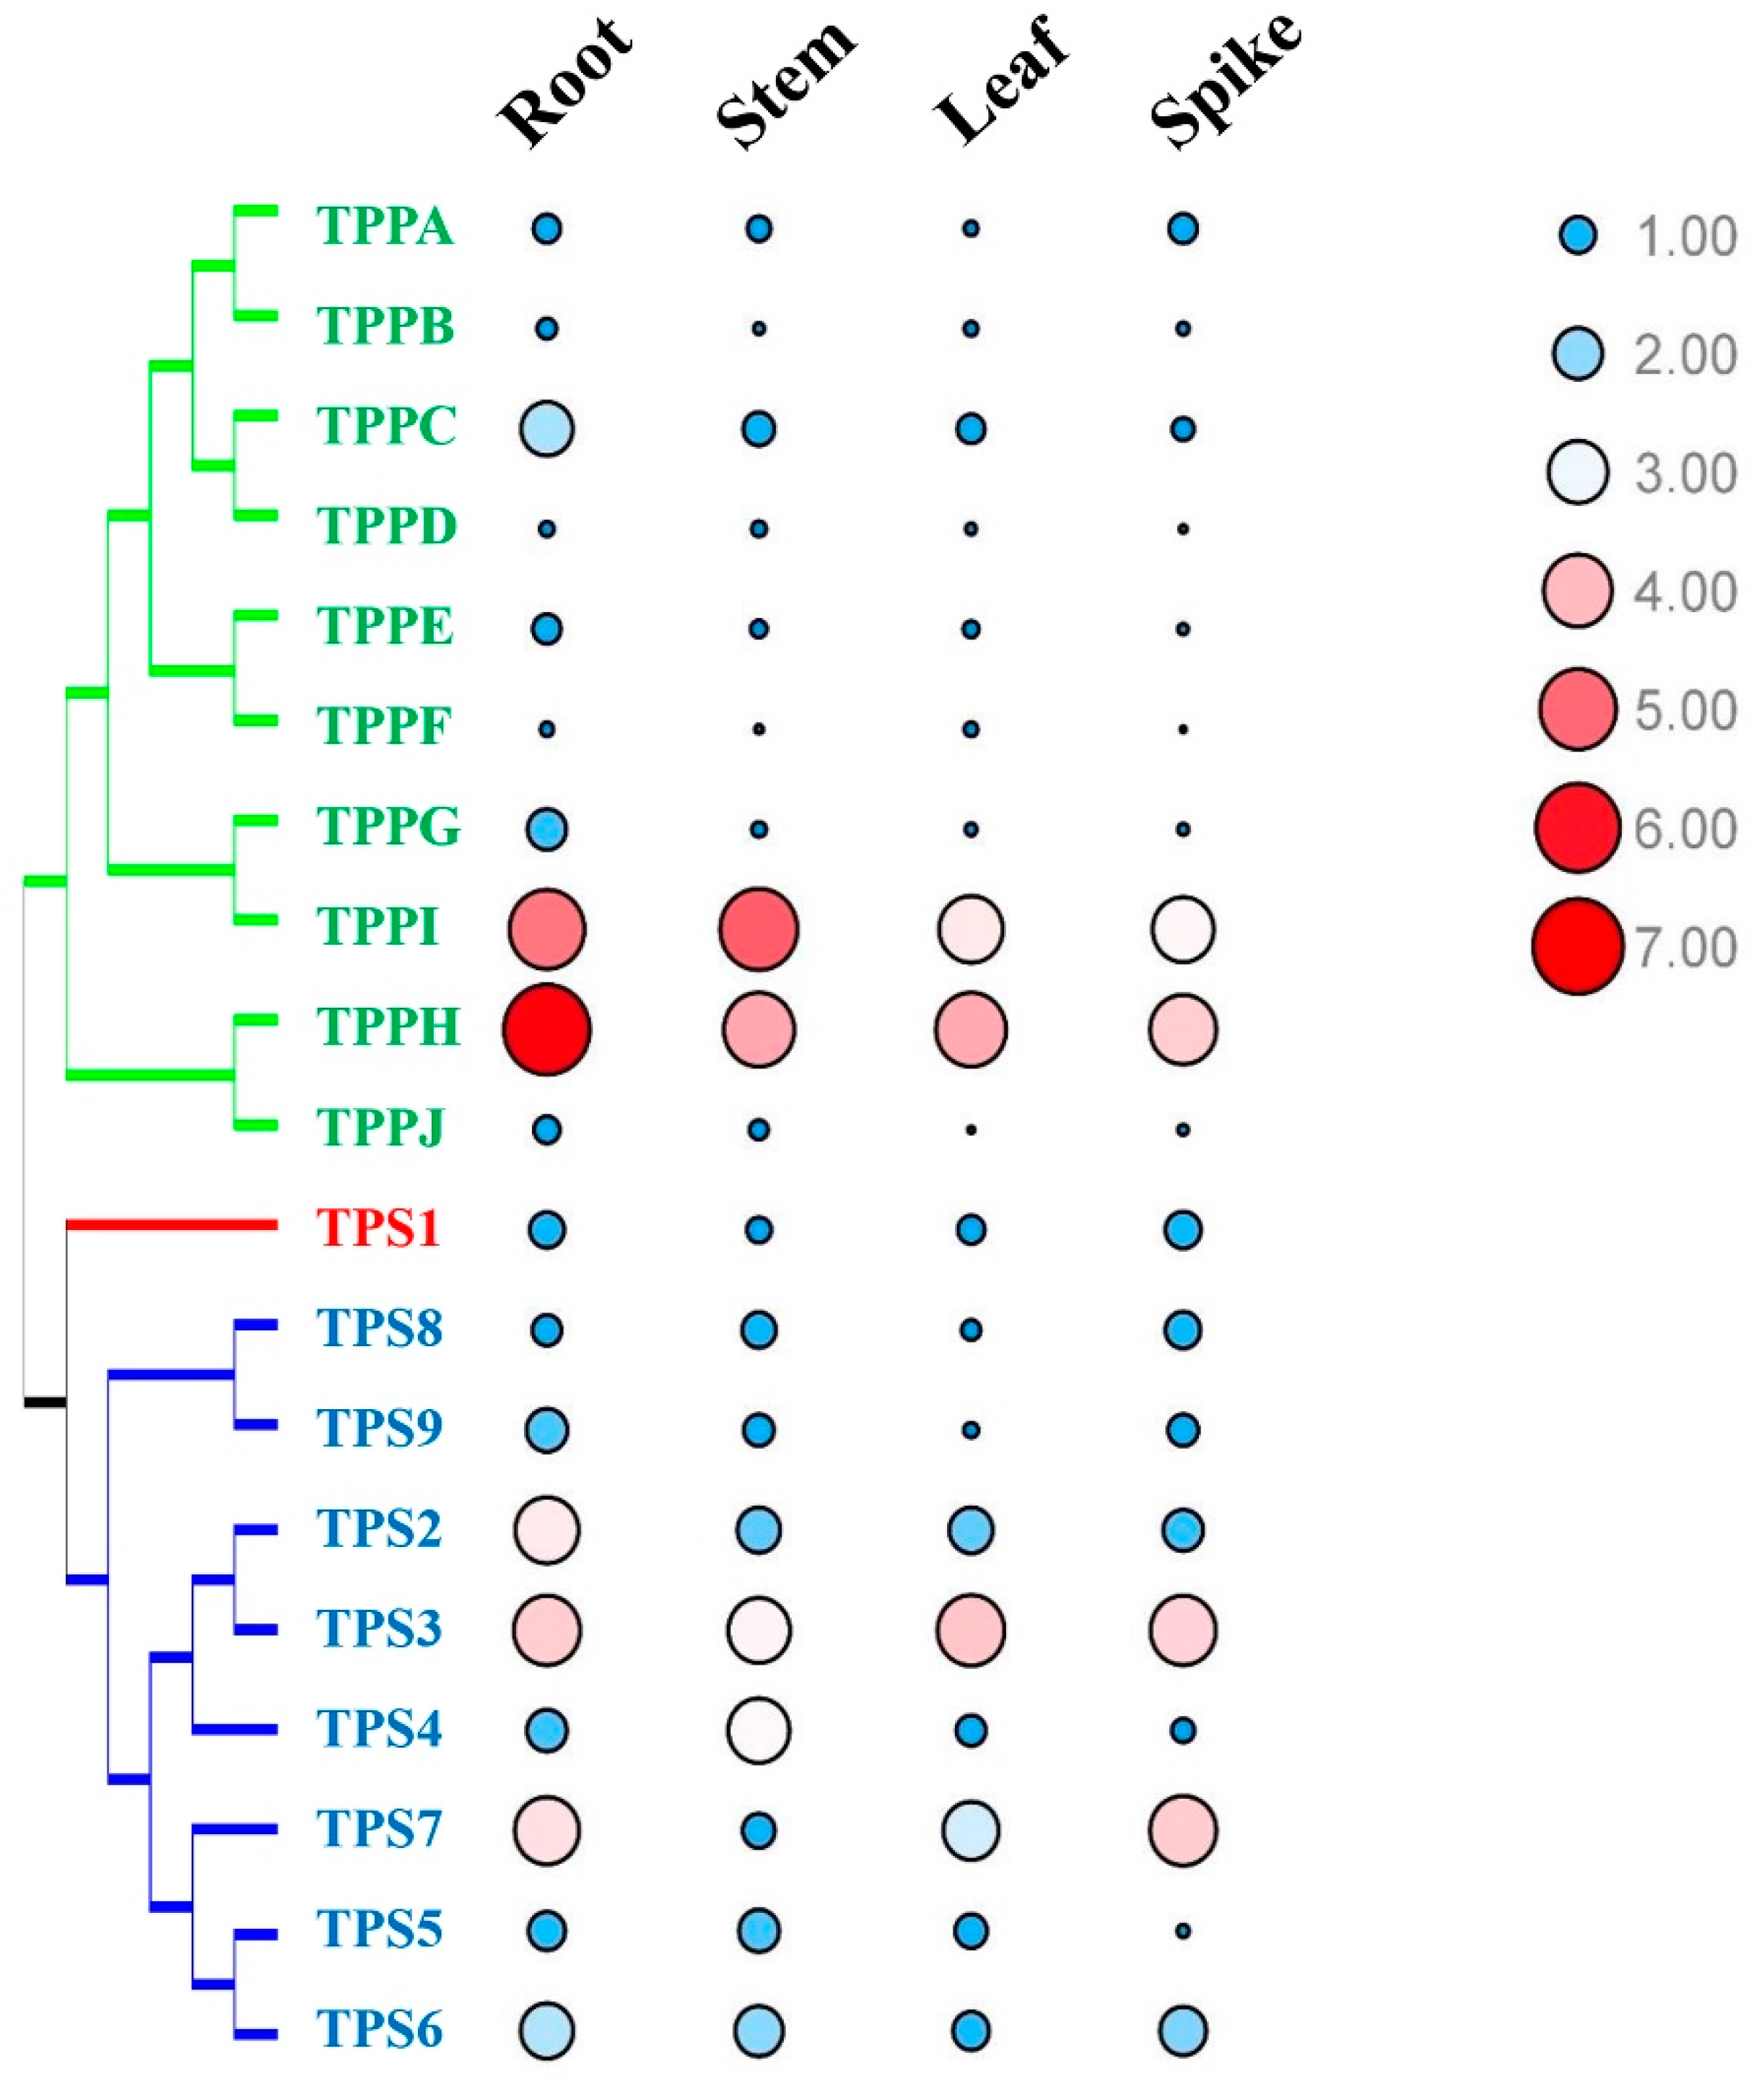
In this study, quantitative real-time reverse transcription (qRT)-PCR was used to examine the expression patterns of the genes BdTPSs-BdTPPs in different tissues, including roots, stems, leaves, and spikes (Figure 8 and Figure S1). All of the BdTPS and BdTPP genes were expressed in all tissues, although majority of the BdTPP genes were expressed at lower levels. In addition, BdTPS3, BdTPPH, and BdTPPI were expressed in four tissues at very high levels. Some genes, such as BdTPS2, BdTPS9, BdTPPC, and BdTPPG, were strongly expressed in roots; BdTPS2 was strongly expressed in stems. Some genes, such as BdTPS5 and BdTPPE in the spikes, BdTPPB and BdTPPF in the stems and spikes, and BdTPPD and BdTPPJ in the leaves and spikes, were expressed at very low levels.
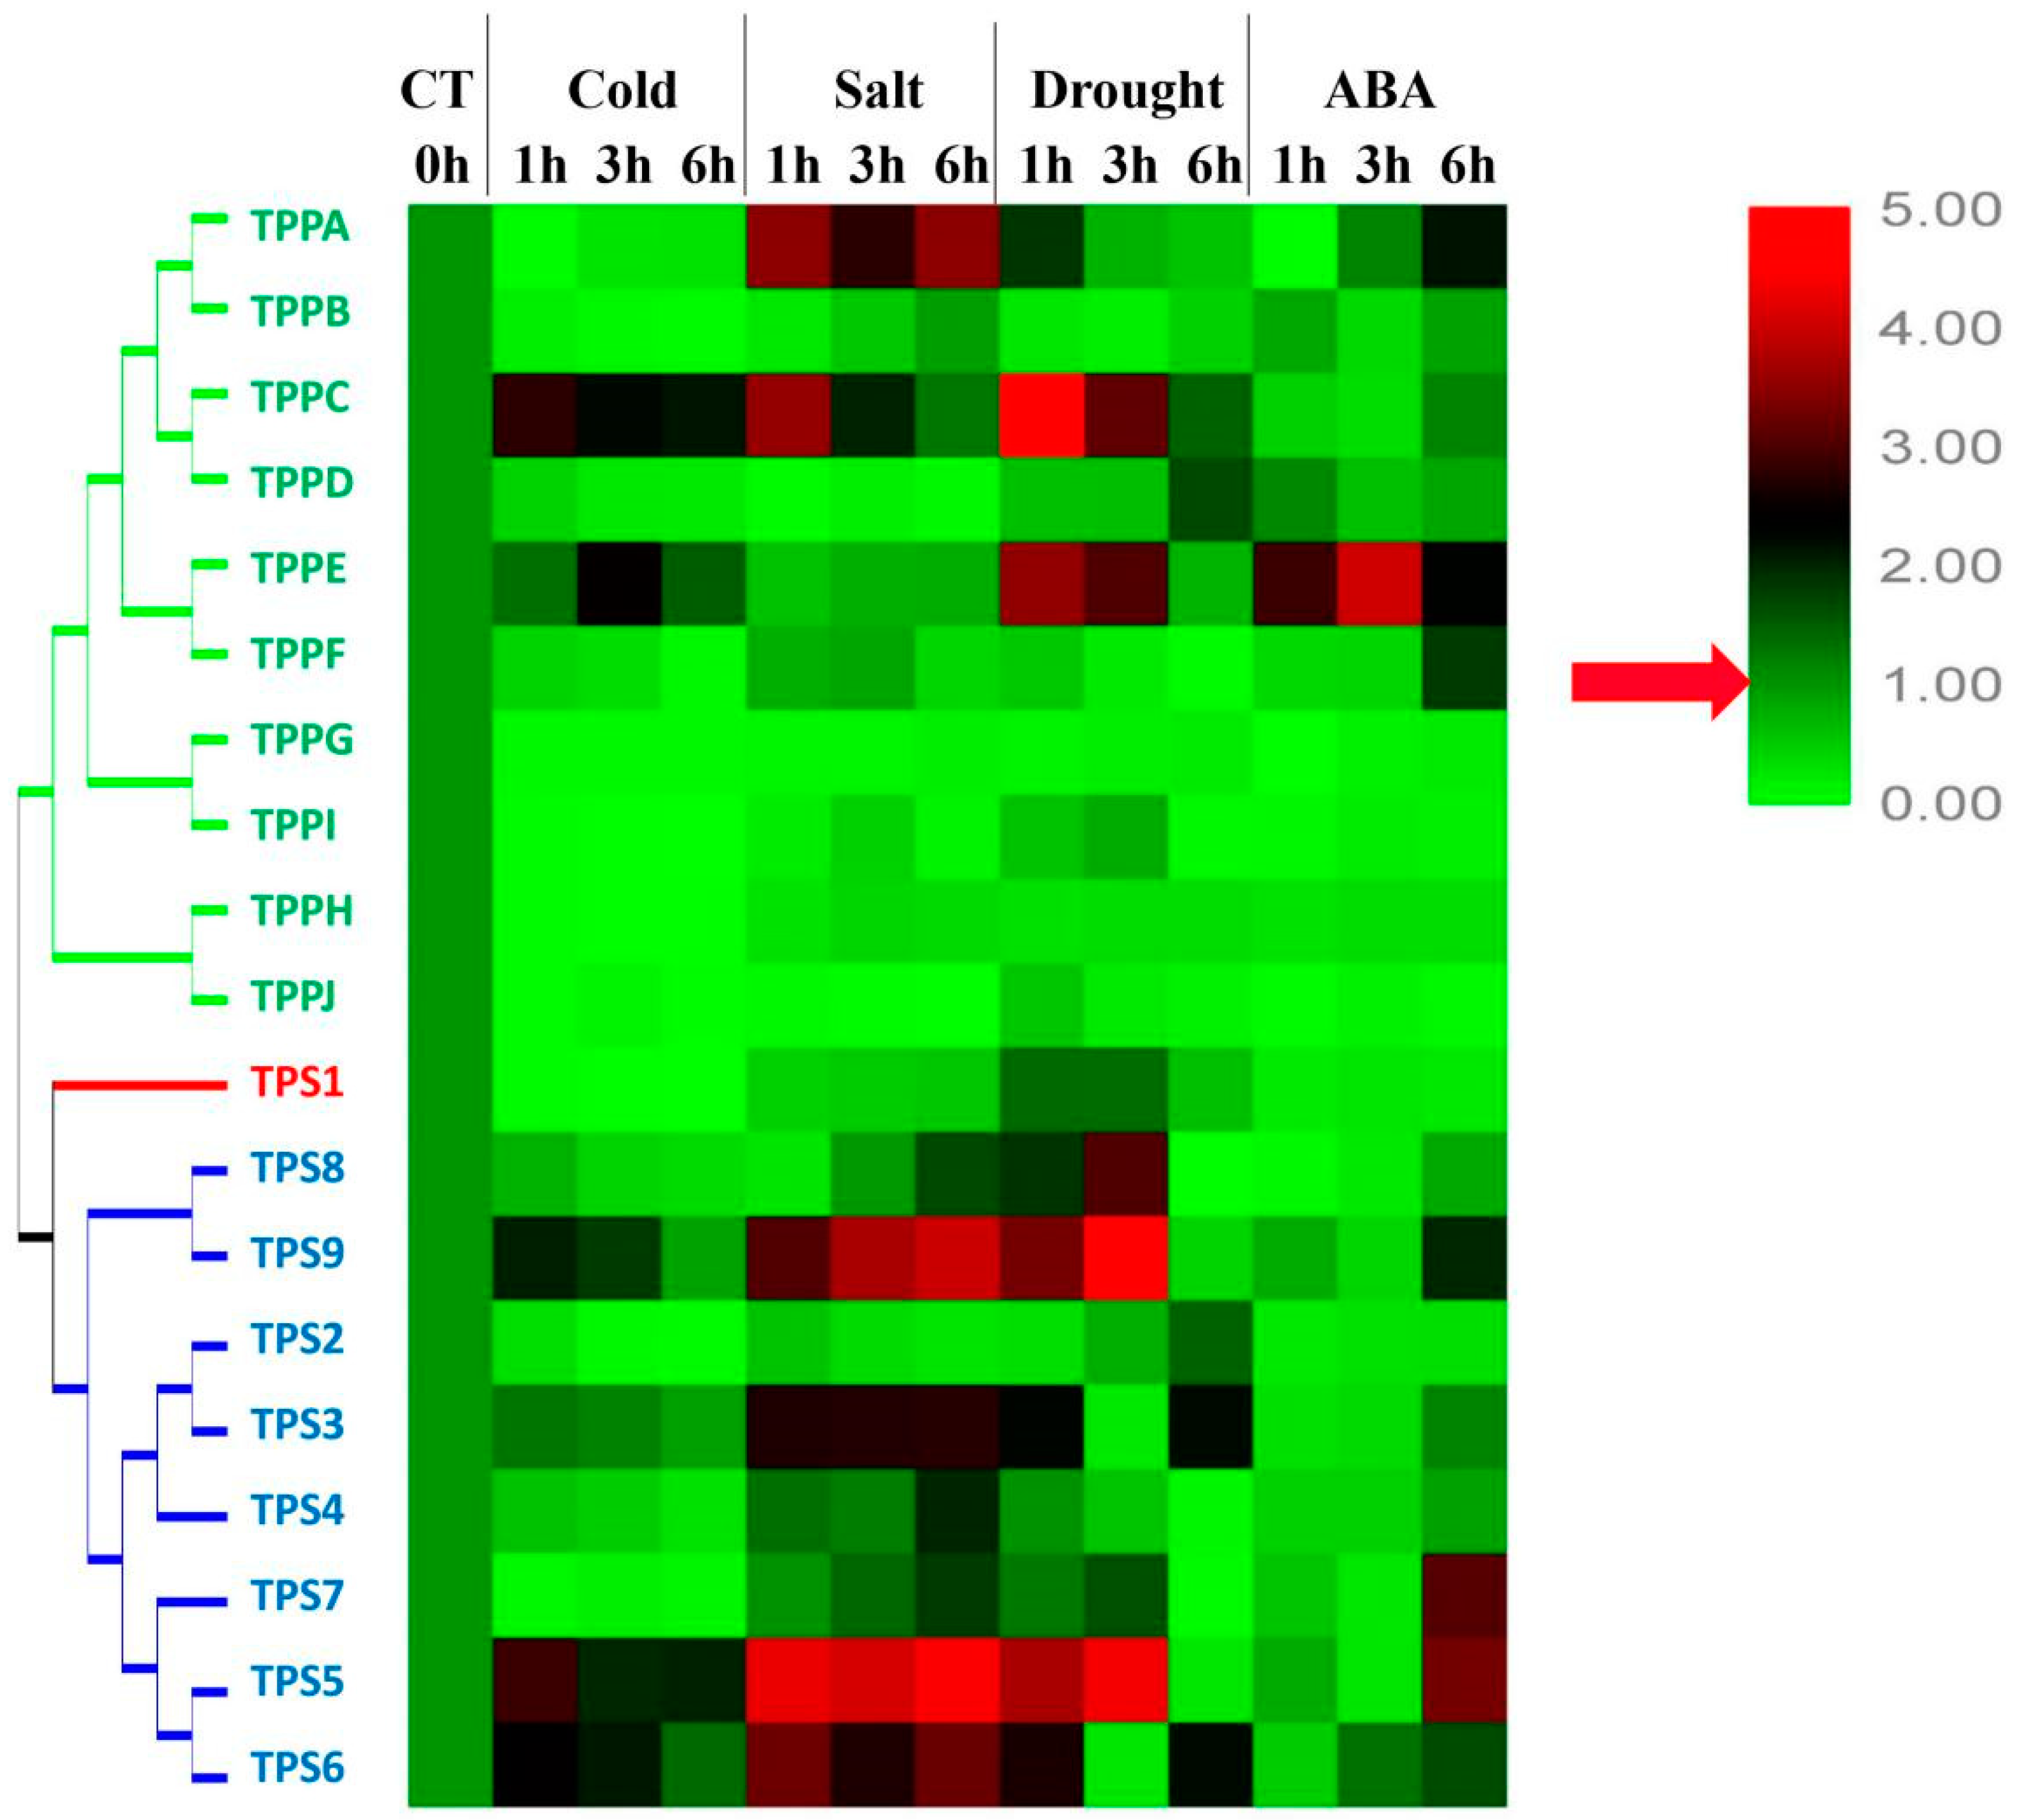
To further investigate the functions of the BdTPSs and BdTPPs in response to abiotic stresses, we determined the expression patterns of family members under three different stress conditions: 4 °C, drought and salinity stress (Figure 9, and Figure S2–S5). As shown in Figure 9 and Figure 10, many of the BdTPS genes and some of the BdTPP genes may be related to various abiotic stress tolerances. Under cold treatment, four genes (BdTPS5, 9 and BdTPPC, E) were upregulated, one gene (BdTPS3) was stabilized, and the other genes were downregulated. After exposure to 200 mM NaCl, eight genes (BdTPS3, 4, 5, 6, 7, 9, and BdTPPA, C) were upregulated, and the other genes were downregulated. After drought stress, seven genes (BdTPS3, 5, 6, 7, 8, 9, and BdTPPC, E) were upregulated at different times. Strikingly, the expression levels of specific genes such as BdTPS5, BdTPS6, BdTPS9, and BdTPPC increased under cold, salinity, and dehydration stress, which was similar to the behavior of rice OsTPS1.
ABA, a crucial phytohormone induced by biotic or abiotic stress, plays important roles in plant tolerance to abiotic stresses [63]. In this paper, we also examined the gene expression patterns after treatment with 100 µM ABA solution. The results showed that only BdTPPE had a higher expression level at all three time points; some genes, such as BdTPS5, 6, 7, 9, and BdTPPA, F, were upregulated after 6 h of exposure, while most other genes were downregulated at all three times points.
3. Discussion
As many species were sequenced, an increasing number of TPS and TPP family members have been identified. The TPS family has been reported in several higher plants, such as A. thaliana, O. sativa, Nelumbo nucifera, Solanum tuberosum, M. oleifera, Gossypium, and Triticum aestivum [8,26,44,45,46,47,64]. However, few studies have systematically reported the TPP family, even though this family, similar to the TPS family, is ubiquitous throughout the plant kingdom. Accumulating evidence has revealed that some TPS/TPP family members are related to responses to abiotic stresses and potentially function in improving stress tolerance and increasing crop yields [14,41]. As B. distachyon is a model plant of Gramineae, it is very important to understand the function and evolution of its TPS and TPP families.
In this research, we identified nine BdTPS and 10 BdTPP genes in B. distachyon. All of the BdTPS genes contained Glyco_transf_20 (TPS) and Trehalose_PPase (TPP) domains, and all of the BdTPP members included only Trehalose_PPase domains. The trehalose biosynthesis enzyme homologue gene families have been classified as three groups according to their protein sequences and phylogenetic relationships. Unlike the four Class I genes distributed among the A. thaliana genome, only one Class I member has been identified in B. distachyon with an N-terminal extension, which has been demonstrated to be an inhibitory domain regulating TPS activity [21,50]. This phenomenon was also consistent with previous studies on A. thaliana (AtTPS1), O. sativa (OsTPS1), Selaginella lepidophylla (SlTPS1), and M. oleifera (MoTPS1) [8,41,45] and may affect the content of trehalose by regulating the TPS1 gene in plants. We do not have enough evidence to explain why there was only one member of Class I TPS in Brachypodium and rice. We hypothesized that the Class I BdTPSs experienced slower duplication speeds than the Class II BdTPSs over the course of genome evolution. Some traits differed between the two TPS groups, such as gene structure, gene length, amino acid identity, and motif structure. Alignment analysis showed that the Class I group gene, BdTPS1, included 17 exons, in contrast to three exons in other BdTPS genes (Table 1, Figure 1b). Previous theories suggested that the rate of intron gain was slower than the rate of intron loss after duplication [44,65]. Therefore, we speculated that BdTPS1 might be the ancestor of other BdTPS genes. By motif analysis, we found that the motif 4–9 region was conserved in Class II BdTPSs instead of in BdTPS1 proteins, suggesting that these differences between the two classes may be involved in various functions. In contrast, BdTPPs have similar characteristics, suggesting they might have similar gene functions.
The sequence alignments indicated that both domains were conserved among BdTPS genes, suggesting that they were mainly formed before the differentiation of these genes. This finding agreed with preceding observations in other plants [27,45]. However, we also noticed that the TPP domains have higher sequence differences between BdTPSs and BdTPPs (Figure 2d). Additionally, by comparison of the motif sequences of the TPP domains in these two families, we found that motif 7 was specific to BdTPS whereas motif 10 was specific to BdTPP. In Arabidopsis, AtTPSs contain a TPP-like domain with no TPP catalytic function, while all of the AtTPPs contain a conserved TPP catalytic site domain [49]. It seems that the TPP domain was either functionally differentiated between the two families or catalytically inactivated in the TPS family. Interestingly, the outside domains of the protein sequences for both BdTPS and BdTPP also showed lower identity than the TPP and/or TPS domains suggesting that these outside domain regions may contribute to the functional differentiation.
Further analysis showed that four pairs of BdTPP genes were formed by duplication events, suggesting that gene duplication might play a vital role in the expansion of the BdTPP genes. Similarly, four pairs of AtTPP genes expanded exclusively upon genome duplication in Arabidopsis, except for AtTPPA and AtTPPD [24], implying similar expansion patterns of TPP in both monocot and dicot plants. In contrast, only one pair of BdTPS genes was relevant to duplication events, implying that most of the TPS genes were formed a very long time ago by duplication events. According to the results of the estimated divergence time analysis, we speculated that two pairs of genes (BdTPPE/F and BdTPPG/I) might represent two newly duplicated gene pairs after a whole-genome duplication event; two pairs of genes (BdTPPH/J and BdTPS5/6) might have duplicated together with the whole-genome duplication event; and one pair of genes (BdTPPC/D) might have existed before Brachypodium diverged from other grass species. This small-scale gene duplication phenomenon in BdTPP was different from whole-genome duplications in AtTPPs. The evolutionary driving force acting on the BdTPS and BdTPP genes was purifying selection, which was similar to what has been observed in other plants [27,44,45].
Many previous studies have found that TPS/TPP genes provide abiotic stress tolerance in different plant species, along with developmental alterations. For example, overexpressed AtTPS1 has significantly improved the drought resistance of Arabidopsis [55]. Overexpressed OsTPS1 could increase rice tolerance to abiotic stress [56]. The activation of OsTPP1 expression can improve chilling tolerance in rice [14]. In this study, we first predicted stress-related cis-elements and co-expression networks using different online tools. All of the results provided a similar conclusion: Namely, the BdTPS/BdTPP gene might be involved in regulating stress tolerance together with other genes. In brief, the co-expression network prediction of BdTPS/BdTPP genes may provide a basic reference for better understanding the signal path in B. distachyon.
ABA, a crucial phytohormone induced by biotic or abiotic stress, plays important roles in plant tolerance to stresses [63]. Our results showed that only BdTPPE was heavily induced after exposure to ABA, strongly supporting that BdTPPE may be related to the ABA signaling pathway. Other genes (BdTPS5, 6, 7, and BdTPPA, F) may also be related to the ABA signaling pathway because these genes were upregulated with increasing treatment time and reached their highest expression levels in 6 h.
Furthermore, we examined the expression patterns of BdTPS and BdTPP genes under cold, salinity, and dehydration stress. As shown in Figure 9 and Figure 10, many of the BdTPS genes and some BdTPP genes might connect with various aspects of abiotic stress tolerance. Furthermore, most of these genes might be involved in two different stress tolerances. For instance, BdTPS7 might be involved in salt and drought resistance, while BdTPPE might participate in cold and drought tolerance. Extraordinary, the expression levels of some specific genes, such as BdTPS5, BdTPS6, BdTPS9, and BdTPPC, increased under chilling, salinity, and dehydration stress, similar to what has been shown in rice OsTPS1 [56]. We speculated that these overexpressed genes might improve stress tolerance for B. distachyon. In addition, we noticed that some family members related to salinity or drought resistance, such as BdTPS5, 6, 7, 9, and BdTPPA, E, also responded to ABA, and ABA-responsive elements (ABRE) have also been found on the promoter regions of these genes (Figure 4), suggesting that these family members might be connected with response to dehydration or salinity by participating in ABA signaling pathways. In contrast, we found that BdTPS2 and five TPP genes (BdTPPB, G, H, I, J) might not be related to these three different abiotic stresses because the expression levels of these genes were downregulated.
4. Conclusions
In this study, we identified nine BdTPS and ten BdTPP genes on the B. distachyon genome and analyzed their evolution by evaluating exon/intron structures, protein motifs, phylogenetic relationships, and Ka/Ks values. These family members were classified as three classes based on an evolutionary tree. Gene structure analysis showed that BdTPS1, which is the only Class I gene, might be the ancestral gene. All of the TPS and TPP genes have evolved mainly by purifying selection. In addition, only one pair of BdTPS genes and four pairs of BdTPP genes expanded in B. distachyon by chromosomal duplication. The tissue specificity profiles of the BdTPS and BdTPP genes in four different tissues suggested that most of these genes were expressed in all tissues at various levels. The expression patterns under various stress conditions showed that most of the TPS genes and approximately half of the TPP genes may be involved in stress resistance. In particular, BdTPS5, BdTPS6, BdTPS9, and BdTPPC might be broad-spectrum abiotic stress resistance genes under abiotic stress conditions. This study provides a foundation for future study on the biological function of BdTPSs and BdTPPs.
5. Materials and Methods
5.1. Gene Identification
BdTPS and BdTPP gene identification was based on the hidden Markov model (HMM) with an E-value < 1e−10 [66]. The TPS domain (glycosyltransferase family 20 (Glyco_transf_20); PF00982) and TPP domain (trehalose-phosphatase (Trehalose_PPase); PF02358) were obtained from the Pfam database (http://pfam.xfam.org/). In addition, the protein sequences of the Arabidopsis and rice TPS/TPP were used as queries for BLASTN searches in the Phytozome database (https://phytozome.jgi.doe.gov/pz/portal.html#). Finally, all candidate genes were examined for the TPS and TPP domains (TPPs only) in the Pfam and SMART databases (http://smart.embl-heidelberg.de/). Both genome data and TPS/TPP protein sequences were obtained from the Phytozome database.
5.2. Gene Structure, Protein Properties, and Conserved Motif Analysis
Motifs in the BdTPS and BdTPP protein sequences were predicted using the online program MEME (http://meme-suite.org) with the following parameters: The maximum number of motifs was set to 10, any number of repetitions was chosen for the site distribution, and the optimum motif width was set to ≥6 and ≤50. Subcellular localizations were predicted with ‘CELLO v.2.5′ (http://cello.life.nctu.edu.tw/). The Compute pI/MW tool (https://web.expasy.org/compute_pi/) was used to predict the isoelectric point (pI) and molecular weight (MW).
5.3. Prediction of Cis-Elements, Transcription Factor Regulatory Network, and Gene Interaction Network
The cis-elements were identified by downloading the 1500 bp upstream sequences [67] of the BdTPS/BdTPP genes from the Phytozome database and then submitting the sequences to PlantCARE (http://bioinformatics.psb.ugent.be/webtools/plantcare/html/) to identify seven stress-related regulatory elements: ABA-responsive elements (ABREs) [68]; dehydration-responsive elements (DREs) [69]; low-temperature-responsive elements (LTREs) [69]; regulatory elements essential for anaerobic induction (AREs) [70]; TC-rich repeats, involved in defense and stress response [71]; MYB-binding sites, involved in drought inducibility (MBS) [71]; jasmonic acid methyl ester (MeJA) responsiveness (CGTCA motif and TGACG motif) to drought stress [72]; and W-boxes, the binding site of WRKY transcription factors in defense responses [68]. The co-expression network was constructed by the online tool STRING (http://string-db.org); the single gene expression network was predicted using the PlaNet (http://www.gene2function.de/) [62,73]. The transcription factors were then predicted using the PTRM database (http://plantregmap.cbi.pku.edu.cn/regulation_prediction.php) with 600 bp sequences upstream from the start codon of the TPS/TPP genes [73].
5.4. Sequence Alignment and Phylogenetic and Evolution Analyses
For the phylogenetic analyses, full-length BdTPS and BdTPP protein sequences from B. distachyon were aligned using ClustalX2.11 [45], and the alignment result was used to construct the phylogenetic tree with MEGA 7 using neighbor joining methods [48]. The exon/intron structures of BdTPSs and BdTPPs were analyzed with Gene Structure Display Server 2.0 (http://gsds.cbi.pku.edu.cn/).
The chromosomal distribution was analyzed with the TBtools software package (http://www.tbtools.com/) [74]. The values of synonymous substitution (Ks) and non-synonymous substitution (Ka) were calculated using the web server with the Nei–Gojobori method (https://github.com/tanghaibao/bio pipeline/tree/master/synonymous_calculation). The divergence time (T) was computed according to the formula T = Ks/2λ based on the Ks rate of λ (λ = 6.5 × 10⁻⁹ for B. distachyon) substitutions per site per year [75,76].
5.5. Plant Growth, Stress Treatment, and qRT-PCR Analysis
The diploid inbred line Bd21 was used for the gene expression level-related experiments. First, seeds were sterilized and germinated in water-soaked filter paper for three days in darkness at 25 °C [77]. Second, seedlings were removed to a cultivating basin with Hoagland solution (5 mM Ca (NO3)2, 5 mM KNO3, 2 mM MgSO4, 1 mM KH2PO4, 0.4 μM CuSO4, 50 μM FeNa2(EDTA)2, 50 μM H3BO3, 10 μM MnC12, 0.02 μM, (NH4)6MoO24, and 0.8 μM ZnSO4) in the greenhouse under a 16/8 h (light/dark) photoperiod at 22 °C [77]. Three different plant tissues (roots, stems, and leaves) were collected after three weeks; spikes were collected from two-month-old Bd21. During the experimental period, the three-week-old seedlings were exposed to low temperature (4.0 °C), salt (200 mM NaCl), simulated drought (20% (w/v) PEG 6000, Coolaber, Beijing, China), and ABA solution (100 μM ABA, Solarbio, Beijing, China). Whole plants were collected, 1, 3, and 6 h after exposure to the abiotic stress in three biological replicates. All samples were immediately frozen in liquid nitrogen and stored at −80 °C until further processing for RNA extraction. Total RNA was extracted using a HiPure Plant RNA Mini Kit (Magen, Guangzhou, China) and cDNA synthesis was performed using StarScript II (GeneStar, Beijing, China). Specific primer pairs and reference genes (SamDC) were designed by qPrimerDB and the ICG database, respectively [78,79] and are listed in Table S1. Transcript levels were quantified using a CFX96 Real-Time PCR Detection System (Bio-Rad, Hercules, USA) under the following conditions: 95 °C for 2 min and 40 cycles of 95 °C for 15 s and 60 °C for 20 s [80]. Four reactions and three independent biological replicates were performed. The relative quantitative analysis of the genes was based on the 2−ΔΔCT method [81]. The expression value of the BdTPS 1 gene in the root is defined as 1. The heat map of 29 genes was constructed using TBtools software. Statistical analyses were performed using a t-test, and p < 0.05 was considered a significant difference.
Supplementary Materials
The following are available online at https://www.mdpi.com/2223-7747/8/10/362/s1, Table S1: The primer sequences used in this work. Table S2: The predicted interaction transcription factor and GO analysis. Table S3: Detail information of direct interaction predicted network of BdTPS and BdTPP with other genes. Figure S1: Expression profiles of BdTPS and BdTPP genes in three different tissues. Figure S2: Expression profiles of BdTPS and BdTPP genes under cold stresses. Figure S3: Expression profiles of BdTPS and BdTPP genes under salt stresses. Figure S4: Expression profiles of BdTPS and BdTPP genes under drought stresses. Figure S5: Expression profiles of BdTPS and BdTPP genes under ABA treatment.
Author Contributions
S.W. conceived and designed the experiments and wrote the manuscript. S.W. and K.O. has carried out all experiments. K.W. modified the manuscript. All authors read and approved the final version of the manuscript.
Funding
This research was supported by the National Natural Science Foundation of China (31771862 and 31628013) and International cooperation project of Fujian Agriculture and Forestry University (KXGH17002).
Conflicts of Interest
The authors declare no conflict of interest.
Abbreviations
TPS, trehalose-6-phosphate synthase; TPP, trehalose-6-phosphate phosphatase; T6P, trehalose-6-phosphate; Bd, Brachypodium distachyon; ABA, abscisic acid; pI, isoelectric point; MW, molecular weight; Ka, non-synonymous; Ks, synonymous; MYA, million years ago; qRT-PCR, quantitative real-time reverse transcription PCR.
References
- Pandey, G.K.; Pandey, A.; Prasad, M.; Böhmer, M. Editorial: Abiotic Stress Signaling in Plants: Functional Genomic Intervention. Front. Plant Sci. 2016, 7, 681–685. [Google Scholar] [CrossRef] [PubMed]
- Avonce, N.; Mendoza-Vargas, A.; Morett, E.; Iturriaga, G. Insights on the evolution of trehalose biosynthesis. BMC Evol. Biol. 2006, 6, 109–114. [Google Scholar] [CrossRef] [PubMed]
- Horlacher, R.; Boos, W. Characterization of TreR, the major regulator of the Escherichia coli trehalose system. J. Biol. Chem. 1997, 272, 13026–13032. [Google Scholar] [CrossRef] [PubMed]
- Hounsa, C.G.; Brandt, E.V.; Thevelein, J.; Hohmann, S.; Prior, B. Role of trehalose in survival of Saccharomyces cerevisiae under osmotic stress. Microbiology 1998, 144, 671–680. [Google Scholar] [CrossRef] [PubMed]
- StrøM, A.R.; Kaasen, I. Trehalose metabolism in Escherichia coli: Stress protection and stress regulation of gene expression. Mol. Microbiol. 2010, 8, 205–210. [Google Scholar] [CrossRef]
- Thevelein, J.M. Regulation of trehalose mobilization in fungi. Microbiol. Rev. 1984, 48, 42–59. [Google Scholar]
- Elbein, A.D.; Pan, Y.T.; Irena, P.; David, C. New insights on trehalose: a multifunctional molecule. Glycobiology 2003, 13, 17R–27R. [Google Scholar] [CrossRef]
- Zang, B.; Li, H.; Li, W.; Deng, X.W.; Wang, X. Analysis of trehalose-6-phosphate synthase (TPS) gene family suggests the formation of TPS complexes in rice. Plant Mol. Biol. 2011, 76, 507–522. [Google Scholar] [CrossRef]
- Müller, J.; Boller, T. Trehalose and trehalase in plants: Recent developments. Plant Sci. 1995, 112, 1–9. [Google Scholar]
- Bhandal, I.S.; Hauptmann, R.M.; Widholm, J. Trehalose as cryoprotectant for the freeze preservation of carrot and tobacco cells. Plant Physiol. 1985, 78, 430–432. [Google Scholar] [CrossRef]
- Hottiger, T.; De, V.C.; Hall, M.N.; Boller, T.; Wiemken, A. The role of trehalose synthesis for the acquisition of thermotolerance in yeast: II. Physiological concentrations of trehalose increase the thermal stability of proteins in vitro. Eur. J. Biochem. 2010, 219, 187–193. [Google Scholar] [CrossRef] [PubMed]
- Cai, Z.; Peng, G.; Cao, Y.; Liu, Y.; Jin, K.; Xia, Y. Bioengineering, Trehalose-6-phosphate synthase 1 from Metarhizium anisopliae: clone, expression and properties of the recombinant. J. Biosci. Bioeng. 2009, 107, 499–505. [Google Scholar] [CrossRef] [PubMed]
- Marquez-Escalante, J.A.; Figueroa-Soto, C.G.; Valenzuela-Soto, E.M. Isolation and partial characterization of trehalose 6-phosphate synthase aggregates from Selaginella lepidophylla plants. Biochimie (Paris) 2006, 88, 1505–1510. [Google Scholar] [CrossRef] [PubMed]
- Zhang, Z.; Li, J.; Li, F.; Liu, H.; Yang, W.; Chong, K.; Xu, Y. OsMAPK3 Phosphorylates OsbHLH002/OsICE1 and inhibits its ubiquitination to activate OsTPP1 and enhances rice chilling tolerance. Dev. Cell. 2017, 43, 731. [Google Scholar] [CrossRef] [PubMed]
- Lyu, J.I.; Min, S.R.; Lee, J.H.; Lim, Y.H.; Kim, J.K.; Bae, C.H.; Liu, J. Overexpression of a trehalose-6-phosphate synthase/phosphatase fusion gene enhances tolerance and photosynthesis during drought and salt stress without growth aberrations in tomato. Plant Cell Tissue Organ. Cult. 2013, 112, 257–262. [Google Scholar] [CrossRef]
- Figueroa, C.M.; Lunn, J. A tale of two sugars - trehalose 6-phosphate and sucrose. Plant Physiol. 2016, 172, 7. [Google Scholar] [CrossRef] [PubMed]
- Londesborough, J.; Vuorio, O.E. Purification of trehalose synthase from baker’s yeast. Its temperature-dependent activation by fructose 6-phosphate and inhibition by phosphate. Eur. J. Biochem. 1993, 216, 841–848. [Google Scholar] [CrossRef]
- Pan, Y.T.; Carroll, J.D.; Elbein, A.D. Trehalose-phosphate synthase of Mycobacterium tuberculosis. Cloning, expression and properties of the recombinant enzyme. Eur. J. Biochem. 2002, 269, 6091–6100. [Google Scholar] [CrossRef]
- Valenzuela-Soto, E.M.; Marquez-Escalante, J.A.; Iturriaga, G.; Figueroa-Soto, C.G. Trehalose 6-phosphate synthase from Selaginella lepidophylla: purification and properties. Biochem. Biophys. Res. Commun. 2004, 313, 314–319. [Google Scholar] [CrossRef]
- Pan, Y.T.; Koroth Edavana, V.; Jourdian, W.J.; Edmondson, R.; Carroll, J.D.; Pastuszak, I.; Elbein, A.D. Trehalose synthase of Mycobacterium smegmatis: purification, cloning, expression, and properties of the enzyme. Eur. J. Biochem. 2004, 271, 4259–4269. [Google Scholar] [CrossRef]
- Avonce, N.; Wuyts, J.; Verschooten, K.; Vandesteene, L.; Van Dijck, P. The Cytophaga hutchinsonii ChTPSP: First characterized bifunctional TPS-TPP protein as putative ancestor of all eukaryotic trehalose biosynthesis proteins. Mol. Biol. Evol. 2010, 27, 359–369. [Google Scholar] [CrossRef] [PubMed]
- Lunn, J.E. Gene families and evolution of trehalose metabolism in plants. Funct. Plant Biol. 2007, 34, 550–563. [Google Scholar] [CrossRef]
- Lunn, J.E.; Delorge, I.; Dijck, P. Trehalose metabolism in plants. Plant J. Cell Mol. Biol. 2015, 79, 544–567. [Google Scholar] [CrossRef] [PubMed]
- Vandesteene, L.; López-Galvis, L.; Vanneste, K.; Feil, R.; Maere, S.; Lammens, W.; Rolland, F.; Lunn, J.E.; Avonce, N.; Beeckman, T.; et al. Expansive evolution of the trehalose-6-phosphate phosphatase gene family in Arabidopsis. Plant Physiol. 2012, 160, 884–896. [Google Scholar] [CrossRef] [PubMed]
- Eastmond, P.J.; Li, Y.; Graham, I. Is trehalose-6-phosphate a regulator of sugar metabolism in plants? J. Exp. Bot. 2003, 54, 533–537. [Google Scholar] [CrossRef] [PubMed] [Green Version]
- Leyman, B.; Van Dijck, P.; Thevelein, J.M. An unexpected plethora of trehalose biosynthesis genes in Arabidopsis thaliana. Trends Plant Sci. 2001, 6, 510–513. [Google Scholar] [CrossRef]
- Yang, H.; Liu, Y.; Wang, C.; Zeng, Q. Molecular evolution of trehalose-6-phosphate synthase (TPS) gene family in Populus, Arabidopsis and rice. PLoS ONE 2012, 7, e42438. [Google Scholar] [CrossRef]
- Figueroa, C.M.; Feil, R.; Ishihara, H.; Watanabe, M.; Kölling, K.; Krause, U.; Höhne, M.; Encke, B.; Plaxton, W.C.; Zeeman, S.; et al. Trehalose 6-phosphate coordinates organic and amino acid metabolism with carbon availability. Plant J. 2016, 85, 410–423. [Google Scholar] [CrossRef]
- Yadav, U.P.; Ivakov, A.; Feil, R.; Duan, G.Y.; Walther, D.; Giavalisco, P.; Piques, M.; Carillo, P.; Hubberten, H.M.; Stitt, M.; et al. The sucrose-trehalose 6-phosphate (Tre6P) nexus: Specificity and mechanisms of sucrose signalling by Tre6P. J. Exp. Bot. 2014, 65, 1051–1068. [Google Scholar] [CrossRef]
- Kolbe, A.; Tiessen, A.; Schluepmann, H.; Paul, M.; Ulrich, S.; Geigenberger, P. Trehalose 6-phosphate regulates starch synthesis via posttranslational redox activation of ADP-glucose pyrophosphorylase. Proc. Natl. Acad. Sci. USA 2005, 102, 11118–11123. [Google Scholar] [CrossRef] [Green Version]
- Wingler, A.; Fritzius, T.; Wiemken, A.; Boller, T.; Aeschbacher, R.A. Trehalose induces the ADP-glucose pyrophosphorylase gene, ApL3, and starch synthesis in Arabidopsis. Plant Physiol. 2000, 124, 105–114. [Google Scholar] [CrossRef]
- Zhang, Y.; Primavesi, L.F.; Jhurreea, D.; Andralojc, P.J.; Mitchell, R.A.; Powers, S.J.; Schluepmann, H.; Delatte, T.; Wingler, A.; Paul, M.J. Inhibition of SNF1-related protein kinase1 activity and regulation of metabolic pathways by trehalose-6-phosphate. Plant Physiol. 2009, 149, 1860–1871. [Google Scholar] [CrossRef]
- Baena-Gonzalez, E.; Rolland, F.; Thevelein, J.M.; Sheen, J. A central integrator of transcription networks in plant stress and energy signalling. Nature 2007, 448, 938–942. [Google Scholar] [CrossRef]
- Garg, A.K.; Kim, J.K.; Owens, T.G.; Ranwala, A.P.; Choi, Y.D.; Kochian, L.V.; Wu, R.J. Trehalose accumulation in rice plants confers high tolerance levels to different abiotic stresses. Proc. Natl. Acad. Sci. USA 2002, 99, 15898–15903. [Google Scholar] [CrossRef] [Green Version]
- Ge, L.F.; Chao, D.Y.; Shi, M.; Zhu, M.Z.; Gao, J.P.; Lin, H.X. Overexpression of the trehalose-6-phosphate phosphatase gene OsTPP1 confers stress tolerance in rice and results in the activation of stress responsive genes. Planta 2008, 228, 191–201. [Google Scholar] [CrossRef]
- Guo, B.T.; Weng, M.L.; Qiao, L.X.; Feng, Y.B.; Li, W.; Zhang, P.Y.; Wang, X.L.; Sui, J.M.; Tao, L.; Duan, D. Expression of Porphyra yezoensis TPS gene in transgenic rice enhanced the salt tolerance. Int. J. Plant Breed. Genet. 2014, 2, 45–55. [Google Scholar]
- Jang, I.-C.; Oh, S.J.; Seo, J.S.; Choi, W.B.; Song, S.I.; Kim, C.H.; Kim, Y.S.; Seo, H.S.; Choi, Y.D.; Nahm, B.H.; et al. Expression of a bifunctional fusion of the Escherichia coli genes for trehalose-6-phosphate synthase and trehalose-6-phosphate phosphatase in transgenic rice plants increases trehalose accumulation and abiotic stress tolerance without stunting growth. Plant Physiol. 2003, 131, 516–524. [Google Scholar] [CrossRef]
- Miranda, J.A.; Avonce, N.; Suárez, R.; Thevelein, J.M.; Van Dijck, P.; Iturriaga, G. A bifunctional TPS-TPP enzyme from yeast confers tolerance to multiple and extreme abiotic-stress conditions in transgenic Arabidopsis. Planta 2007, 226, 1411–1421. [Google Scholar] [CrossRef]
- Romero, C.; Bellés, J.M.; Vayá, J.L.; Serrano, R.; Culiánez-Macià, F.A. Expression of the yeast trehalose-6-phosphate synthase gene in transgenic tobacco plants: pleiotropic phenotypes include drought tolerance. Planta 1997, 201, 293–297. [Google Scholar] [CrossRef]
- Avonce, N.; Leyman, B.; Mascorro-Gallardo, J.O.; Van Dijck, P.; Thevelein, J.M.; Iturriaga, G. The Arabidopsis trehalose-6-P synthase AtTPS1 gene is a regulator of glucose, abscisic acid, and stress signaling. Plant Physiol. 2004, 136, 3649–3659. [Google Scholar] [CrossRef]
- Nuccio, M.L.; Wu, J.; Mowers, R.; Zhou, H.P.; Meghji, M.; Primavesi, L.F.; Paul, M.J.; Chen, X.; Gao, Y.; Haque, E.; et al. Expression of trehalose-6-phosphate phosphatase in maize ears improves yield in well-watered and drought conditions. Nat. Biotechnol. 2015, 33, 862–869. [Google Scholar] [CrossRef] [PubMed]
- Brkljacic, J.; Grotewold, E.; Scholl, R.; Mockler, T.; Garvin, D.F.; Vain, P.; Brutnell, T.; Sibout, R.; Bevan, M.; Budak, H.; et al. Brachypodium as a model for the grasses: today and the future. Plant Physiol. 2011, 157, 3–13. [Google Scholar] [CrossRef] [PubMed]
- The International Brachypodium Initiative. Genome sequencing and analysis of the model grass Brachypodium distachyon. Nature 2010, 463, 763–770. [Google Scholar]
- Jin, Q.; Hu, X.; Li, X.; Wang, B.; Wang, Y.; Jiang, H.; Mattson, N.; Xu, Y. Genome-Wide Identification and Evolution Analysis of Trehalose-6-Phosphate Synthase Gene Family in Nelumbo nucifera. Front. Plant Sci. 2016, 7, 1445–1457. [Google Scholar] [CrossRef] [PubMed]
- Lin, M.; Jia, R.; Li, J.; Zhang, M.; Chen, H.; Zhang, D.; Zhang, J.; Chen, X. Evolution and expression patterns of the trehalose-6-phosphate synthase gene family in drumstick tree (Moringa oleifera Lam.). Planta 2018, 248, 999–1015. [Google Scholar] [CrossRef]
- Mu, M.; Lu, X.K.; Wang, J.J.; Wang, D.L.; Yin, Z.J.; Wang, S.; Fan, W.L.; Ye, W. Genome-wide Identification and analysis of the stress-resistance function of the TPS (Trehalose-6-Phosphate Synthase) gene family in cotton. BMC Genet. 2016, 17, 54. [Google Scholar]
- Xu, Y.; Wang, Y.; Mattson, N.; Yang, L.; Jin, Q. Genome-wide analysis of the Solanum tuberosum (potato) trehalose-6-phosphate synthase (TPS) gene family: evolution and differential expression during development and stress. BMC Genom. 2017, 18, 926. [Google Scholar] [CrossRef]
- Kumar, S.; Stecher, G.; Tamura, K. MEGA7: Molecular Evolutionary Genetics Analysis version 7.0 for bigger datasets. Mol. Biol. Evol. 2016, 33, 1870–1874. [Google Scholar] [CrossRef]
- Vandesteene, L.; Ramon, M.; Le Roy, K.; Van Dijck, P.; Rolland, F. A single active trehalose-6-P synthase (TPS) and a family of putative regulatory TPS-like proteins in Arabidopsis. Mol. Plant. 2010, 3, 406–419. [Google Scholar] [CrossRef]
- Poueymiro, M.; Cazalé, A.C.; Francois, J.M.; Parrou, J.L.; Peeters, N.; Genin, S. A Ralstonia solanacearum type III effector directs the production of the plant signal metabolite trehalose-6-phosphate. mBio 2014, 5, e02065-14. [Google Scholar] [CrossRef]
- Van Dijck, P.; Mascorro-Gallardo, J.O.; De Bus, M.; Royackers, K.; Iturriaga, G.; Thevelein, J.M. Truncation of Arabidopsis thaliana and Selaginella lepidophylla trehalose-6-phosphate synthase unlocks high catalytic activity and supports high trehalose levels on expression in yeast. Biochem. J. 2002, 366, 63–71. [Google Scholar] [CrossRef] [PubMed]
- Gu, Z.; Cavalcanti, A.; Chen, F.C.; Bouman, P.; Li, W. Extent of Gene Duplication in the Genomes of Drosophila, Nematode, and Yeast. Mol. Biol. Evol. 2002, 19, 256–262. [Google Scholar] [CrossRef] [PubMed]
- Yuan, J.; Liu, T.; Yu, Z.; Li, Y.; Ren, H.; Hou, X.; Li, Y. Genome-wide analysis of the Chinese cabbage IQD gene family and the response of BrIQD5 in drought resistance. Plant Mol. Biol. 2019, 99, 603–620. [Google Scholar] [CrossRef] [PubMed]
- Hurst, L.D. The Ka/Ks ratio: diagnosing the form of sequence evolution. Trends Genet. 2002, 18, 486–487. [Google Scholar] [CrossRef]
- Van Dijken, A.J.H.; Schluepmann, H.; Smeekens, S.C.M. Arabidopsis trehalose-6-phosphate synthase 1 is essential for normal vegetative growth and transition to flowering. Plant Physiol. 2004, 135, 969–977. [Google Scholar] [CrossRef] [PubMed]
- Li, H.W.; Zang, B.S.; Deng, X.W.; Wang, X.P. Overexpression of the trehalose-6-phosphate synthase gene OsTPS1 enhances abiotic stress tolerance in rice. Planta 2011, 234, 1007–1018. [Google Scholar] [CrossRef] [PubMed]
- Cao, J.; Min, J.; Peng, L.; Chu, Z. Genome-wide identification and evolutionary analyses of the PP2C gene family with their expression profiling in response to multiple stresses in Brachypodium distachyon. BMC Genom. 2016, 17, 175. [Google Scholar] [CrossRef]
- Kuromori, T.; Mizoi, J.; Umezawa, T.; Yamaguchi-Shinozaki, K.; Shinozaki, K. Stress Signaling Networks: Drought Stress. In Molecular Biology; Springer: New York, NY, USA, 2013; pp. 1–23. [Google Scholar]
- Wei, L.; Xiao, C.; Zhaolu, M.; Xiahe, H.; Qi, X.; Heng, W.; Hailing, J.; Dabing, Z.; Wanqi, L. Transcriptional regulation of Arabidopsis MIR168a and ARGONAUTE1 homeostasis in abscisic acid and abiotic stress responses. Plant Physiol. 2012, 158, 1279–1292. [Google Scholar]
- Todaka, D.; Shinozaki, K.; Yamaguchi-Shinozaki, K. Recent advances in the dissection of drought-stress regulatory networks and strategies for development of drought-tolerant transgenic rice plants. Front. Plant Sci. 2015, 6, 84–104. [Google Scholar] [CrossRef]
- Zhang, T.; Tan, D.; Li, Z.; Zhang, X.; Han, Z. Phylogenetic analysis and drought-responsive expression profiles of the WRKY transcription factor family in maize. Agri Gene. 2017, 3, 99–108. [Google Scholar] [CrossRef]
- Sibout, R.; Proost, S.; Hansen, B.O.; Vaid, N.; Giorgi, F.M.; Ho-Yue-Kuang, S.; Legee, F.; Cezart, L.; Bouchabke-Coussa, O.; Soulhat, C.; et al. Expression atlas and comparative coexpression network analyses reveal important genes involved in the formation of lignified cell wall in Brachypodium distachyon. New Phytol. 2017, 215, 1009–1025. [Google Scholar] [CrossRef] [PubMed]
- Lee, S.C.; Luan, S. ABA signal transduction at the crossroad of biotic and abiotic stress responses. Plant Cell Environ. 2012, 35, 53–60. [Google Scholar] [CrossRef] [PubMed]
- Xie, D.W.; Wang, X.; Sun, J.; Zheng, W. Identification of the trehalose-6-phosphate synthase gene family in winter wheat and expression analysis under conditions of freezing stress. J. Genet. 2015, 94, 55–65. [Google Scholar] [CrossRef] [PubMed]
- Nuruzzaman, M.; Manimekalai, R.; Sharoni, A.M.; Satoh, K.; Kondoh, H.; Ooka, H.; Kikuchi, S. Genome-wide analysis of NAC transcription factor family in rice. Gene 2010, 465, 30–44. [Google Scholar] [CrossRef] [PubMed]
- Koski, T. Hidden Markov models for bioinformatics. J. Roy. Statis. Soc. 2001, 167, 194–195. [Google Scholar]
- Zhang, T.; Lv, W.; Zhang, H.; Ma, L.; Li, P.; Ge, L.; Li, G. Genome-wide analysis of the basic Helix-Loop-Helix (bHLH) transcription factor family in maize. BMC Plant Biol. 2018, 18, 235. [Google Scholar] [CrossRef] [PubMed]
- Zhao, P.; Wang, D.; Wang, R.; Kong, N.; Zhang, C.; Yang, C.; Wu, W.; Ma, H.; Chen, Q. Genome-wide analysis of the potato Hsp20 gene family: identification, genomic organization and expression profiles in response to heat stress. BMC Genom. 2018, 19, 61. [Google Scholar] [CrossRef] [PubMed]
- Qi, X.; Xie, S.; Liu, Y.; Yi, F.; Yu, J. Genome-wide annotation of genes and noncoding RNAs of foxtail millet in response to simulated drought stress by deep sequencing. Plant Mol. Biol. 2013, 83, 459–473. [Google Scholar] [CrossRef] [PubMed]
- Kaur, C.; Mustafiz, A.; Sarkar, A.K.; Ariyadasa, T.U.; Singla-Pareek, S.L.; Sopory, S. Expression of abiotic stress inducible ETHE1-like protein from rice is higher in roots and is regulated by calcium. Physiol. Plant. 2014, 152, 1–16. [Google Scholar] [CrossRef] [PubMed]
- Rajsz, A.; Warzybok, A.; Migocka, M. Genes encoding cucumber full-size ABCG proteins show different responses to plant growth regulators and sclareolide. Plant Mol. Biol. Rep. 2016, 34, 720–736. [Google Scholar] [CrossRef] [PubMed]
- Li, W.; Wang, J.; Sun, Q.; Li, W.; Yu, Y.; Zhao, M.; Meng, Z. Expression analysis of genes encoding double B-box zinc finger proteins in maize. Funct. Integr. Genom. 2017, 17, 1–14. [Google Scholar] [CrossRef] [PubMed]
- Wang, W.; Gao, T.; Chen, J.; Yang, J.; Huang, H.; Yu, Y. The late embryogenesis abundant gene family in tea plant (Camellia sinensis): Genome-wide characterization and expression analysis in response to cold and dehydration stress. Plant Physiol. Biochem. 2019, 135, 277–286. [Google Scholar] [CrossRef] [PubMed]
- Chen, C.; Xia, R.; Chen, H.; He, Y. TBtools, a Toolkit for Biologists integrating various HTS-data handling tools with a user-friendly interface. bioRxiv 2018, 289660. [Google Scholar]
- Blanc, G.; Wolfe, K.H. Widespread paleopolyploidy in model plant species inferred from age distributions of duplicate genes. Plant cell. 2004, 16, 1667–1678. [Google Scholar] [CrossRef] [PubMed]
- Zhang, M.; Shen, Z.; Meng, G.; Lu, Y.; Wang, Y. Genome-wide analysis of the Brachypodium distachyon (L.) P. Beauv. Hsp90 gene family reveals molecular evolution and expression profiling under drought and salt stresses. PLoS ONE 2017, 12, e0189187. [Google Scholar] [CrossRef] [PubMed]
- Liu, N.; Dong, L.; Deng, X.; Liu, D.; Liu, Y.; Li, M.; Hu, Y.; Yan, Y. Genome-wide identification, molecular evolution, and expression analysis of auxin response factor (ARF) gene family in Brachypodium distachyon L. BMC Plant Biol. 2018, 18, 336. [Google Scholar] [CrossRef] [PubMed]
- Lu, K.; Li, T.; He, J.; Chang, W.; Zhang, R.; Liu, M.; Yu, M.; Fan, Y.; Ma, J.; Sun, W.; et al. qPrimerDB: A thermodynamics-based gene-specific qPCR primer database for 147 organisms. Nucleic Acids Res. 2018, 46, 1229–1236. [Google Scholar] [CrossRef] [PubMed]
- Sang, J.; Wang, Z.; Li, M.; Cao, J.; Niu, G.; Xia, L.; Zou, D.; Wang, F.; Xu, X.; Han, X.; et al. ICG: a wiki-driven knowledgebase of internal control genes for RT-qPCR normalization. Nucleic Acids Res. 2018, 46, 121–126. [Google Scholar] [CrossRef] [PubMed]
- Gay, S.; Bugeon, J.; Bouchareb, A.; Henry, L.; Montfort, J.; Cam, A.L.; Bobe, J.; Thermes, V. MicroRNA-202 (miR-202) controls female fecundity by regulating medaka oogenesis. PLoS Genet. 2018, 14, e1007593. [Google Scholar] [CrossRef]
- Livak, K.J.; Schmittgen, T.D. Analysis of relative gene expression data using real-time quantitative PCR and the 2(-Delta Delta C (T)) Method. Methods 2001, 25, 402–408. [Google Scholar] [CrossRef]
Figure 1.
Phylogenetic relationships and gene structures, domains, and motifs of the BdTPS and BdTPP family. (a) Phylogenetic analysis, Class I, II, and III genes are shown in red, blue, and green, respectively. (b) Gene structure, introns, exons, and upstream/downstream regions are shown as straight lines and yellow and blue bars, respectively. (c) The conserved trehalose-6-phosphate synthase (TPS) domain (Glyco_transf_20), trehalose-6-phosphate phosphatase (TPP) domain (Trehalose_PPase), and haloacid dehalogenase-like hydrolase domain containing 3 (Hydrolase 3) are shown by yellow, green, and red, respectively. (d) Motif analysis, all motifs were identified by MEME tools, as shown in different bars.

Figure 2.
Pairwise sequence identities for different regions of the B. distachyon TPS and TPP proteins. (a) Pairwise sequence identities of the TPS and TPP domains in BdTPS. (b) Comparison of the TPS domain, TPP domain, protein sequence, and sequence outside the domain in BdTPS. (c) Comparison of the TPP domain, full-length protein sequence, and sequence outside the domain in BdTPP. (d) Comparison of the TPP domains in BdTPS and BdTPP.

Figure 3.
Chromosomal location and gene duplication of BdTPSs/BdTPPs. The chromosome numbers are indicated above, and red lines represent the duplication gene pairs.
Figure 3.
Chromosomal location and gene duplication of BdTPSs/BdTPPs. The chromosome numbers are indicated above, and red lines represent the duplication gene pairs.

Figure 4.
Predicted cis-elements related to stress resistance in the BdTPS/BdTPP promoters. Promoter sequences (−1500 bp) of 19 genes were analyzed using the PlantCARE database. The different colors and shapes of markers represent various cis-elements.
Figure 4.
Predicted cis-elements related to stress resistance in the BdTPS/BdTPP promoters. Promoter sequences (−1500 bp) of 19 genes were analyzed using the PlantCARE database. The different colors and shapes of markers represent various cis-elements.

Figure 5.
Prediction of the transcriptional regulatory network. The green hexagon represents BdTPS/BdTPP genes. Different colors represent different transcription factor families, with brilliant blue, dark blue, orange and purple hexagons indicating MYB, ERF, bZIP and 21 other transcription factor families, including B3, bHLH, C2H2, MIKC_MADS, TCP, LBD, NAC, BES1, EIL, Dof, E2F/DP, G2-like, Nin-like, CAMTA, CPP, Trihelix, ARF, C3H, GATA, TALE, and BBR-BPC family members.

Figure 6.
The interaction network between members of the family. Protein interaction network prediction showed that most BdTPS and BdTPP proteins interact with more than one other family member. Line colors represent the various types of evidence used to predict the protein interaction network.
Figure 6.
The interaction network between members of the family. Protein interaction network prediction showed that most BdTPS and BdTPP proteins interact with more than one other family member. Line colors represent the various types of evidence used to predict the protein interaction network.

Figure 7.
Co-expression neighborhood of PsaN (take BdTPS1 for example, large light green circle). The straight lines of different colors show how strongly two genes are co-expressed, with green, yellow, and red edges indicating strong, medium, and weak co-expression, respectively.
Figure 7.
Co-expression neighborhood of PsaN (take BdTPS1 for example, large light green circle). The straight lines of different colors show how strongly two genes are co-expressed, with green, yellow, and red edges indicating strong, medium, and weak co-expression, respectively.

Figure 8.
Expression profiles of BdTPS and BdTPP genes in four tissues. Blue color and small circle/red color and large circle that represent low/high expression, respectively.
Figure 8.
Expression profiles of BdTPS and BdTPP genes in four tissues. Blue color and small circle/red color and large circle that represent low/high expression, respectively.

Figure 9.
Expression patterns of BdTPS and BdTPP genes under three different abiotic stresses and abscisic acid (ABA) treatment in the whole plants. The gradient ramp represents different relative expression levels. The green indicates a low expression level and the red indicates a high expression level.

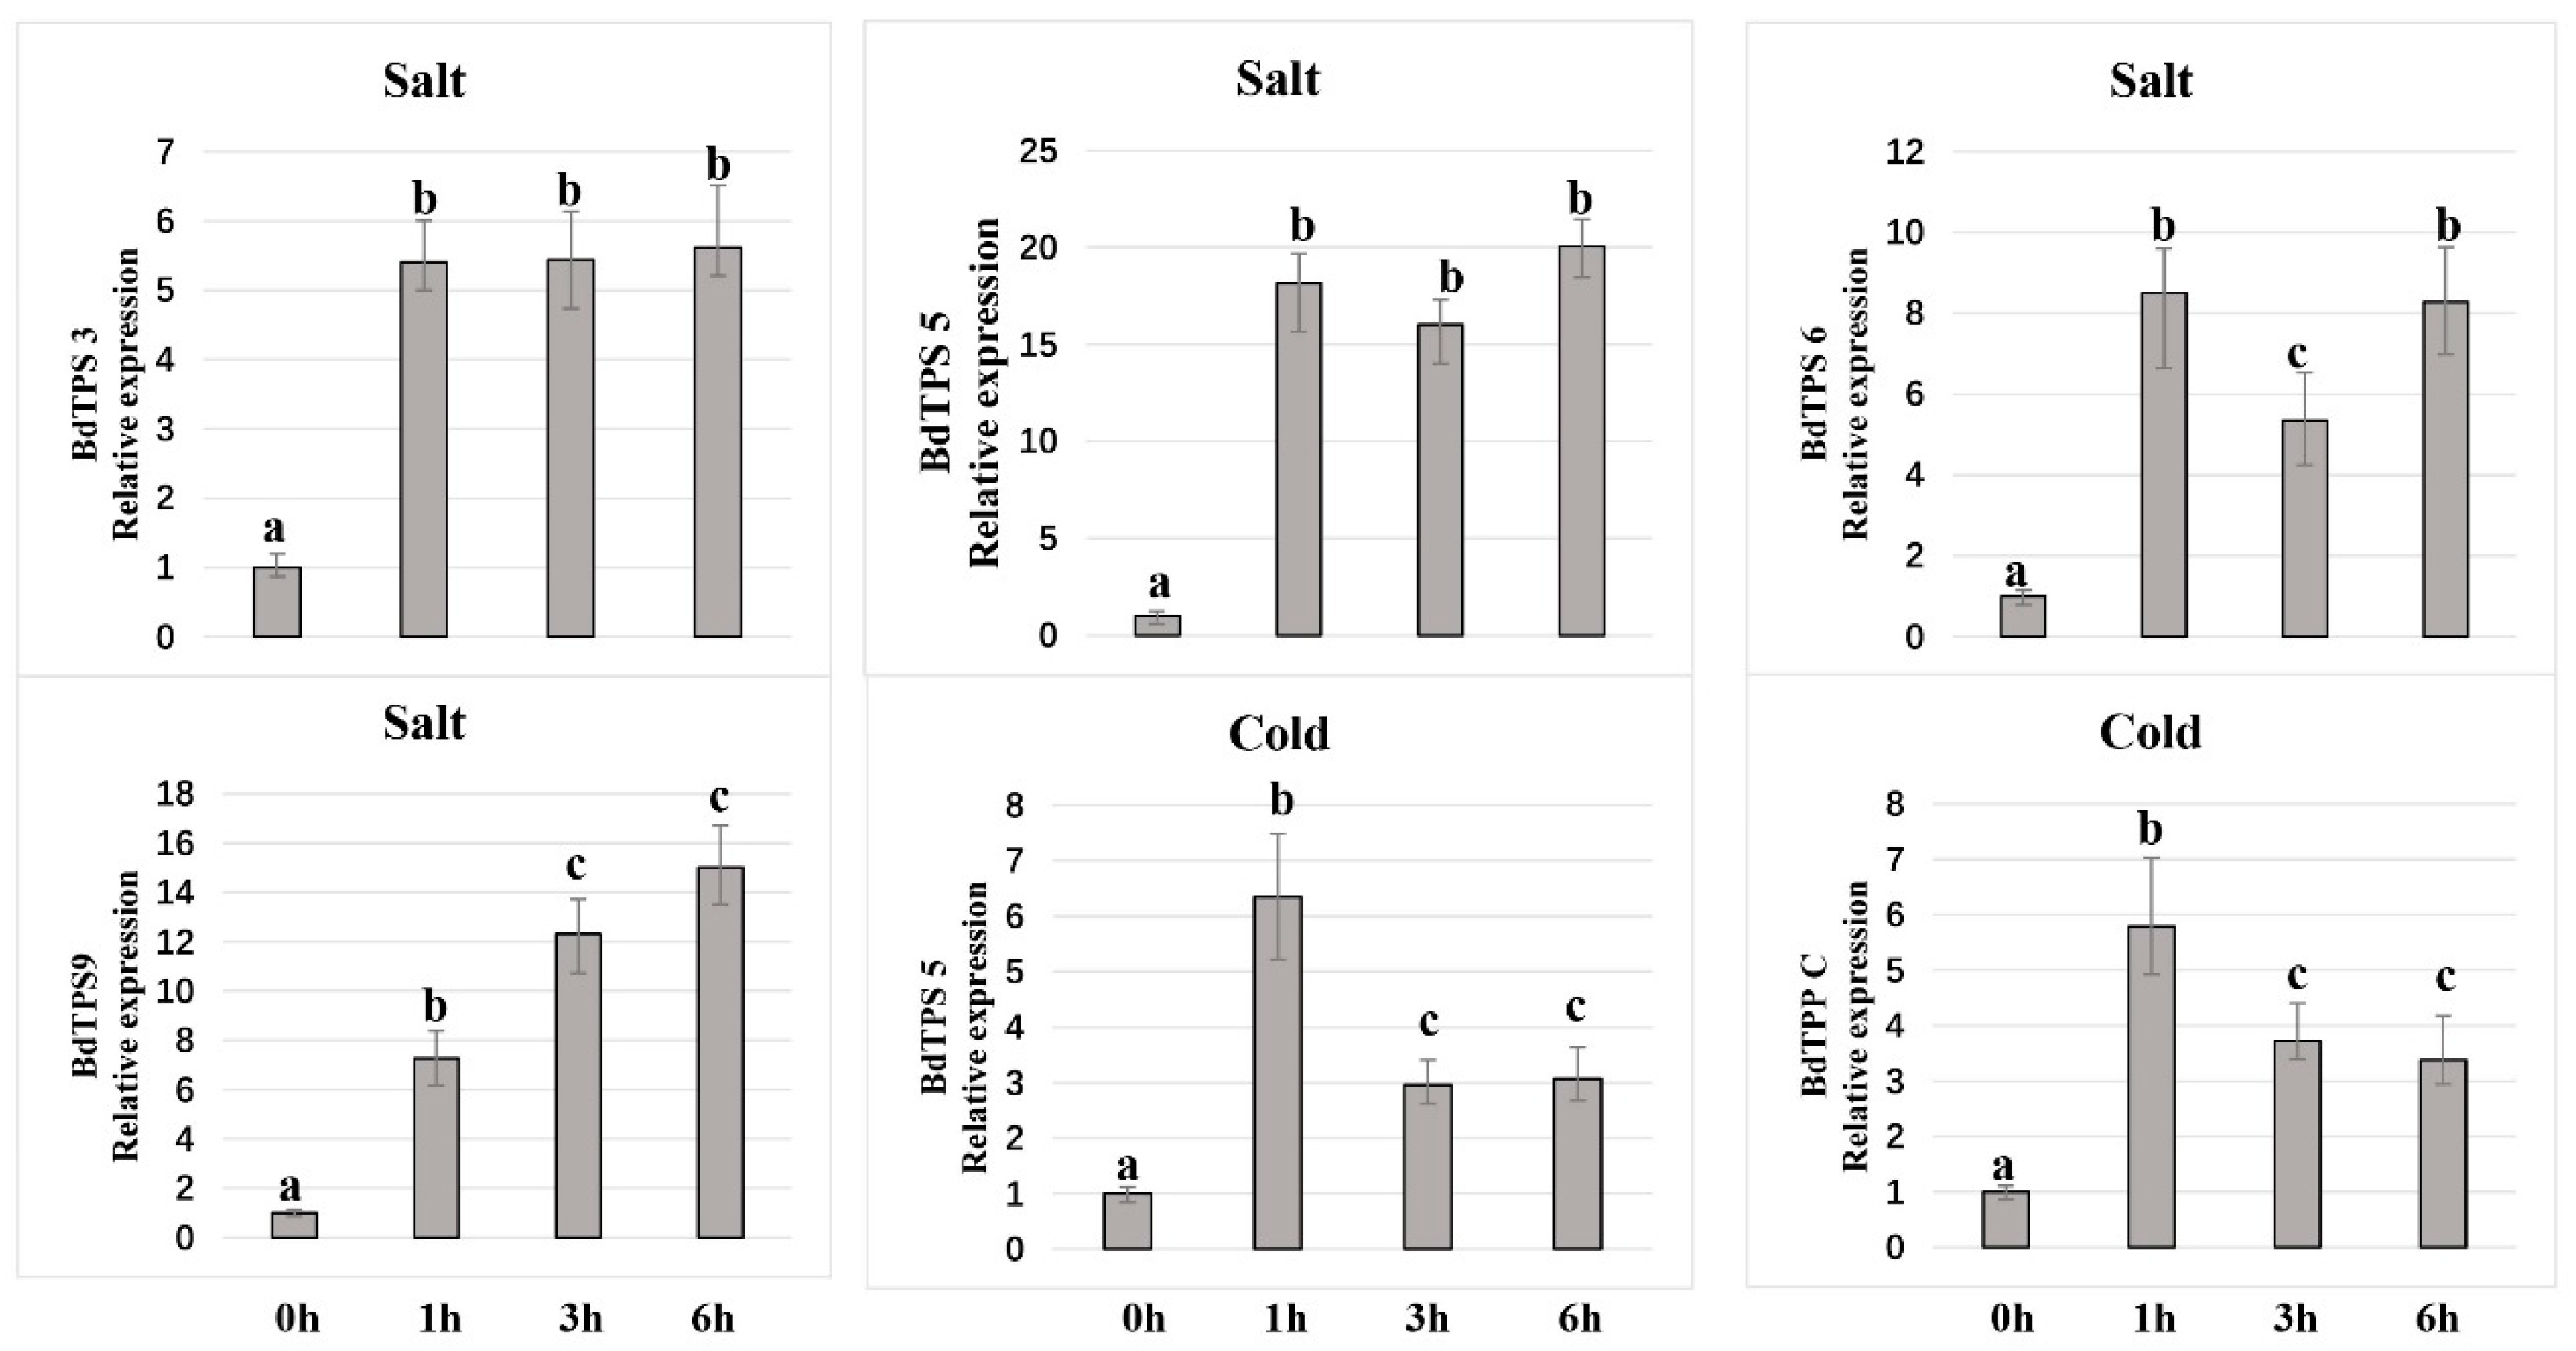
Figure 10.
Relative expression level of some BdTPS/BdTPP genes under salt and cold stress conditions at 1, 3, and 6 h after exposure to the abiotic stress. Different lowercase letters (a, b, c) above the bars indicate significantly different values (p < 0.05, t-test).
Figure 10.
Relative expression level of some BdTPS/BdTPP genes under salt and cold stress conditions at 1, 3, and 6 h after exposure to the abiotic stress. Different lowercase letters (a, b, c) above the bars indicate significantly different values (p < 0.05, t-test).


Table 1.
Basic characteristics of TPS and TPP genes in Brachypodium distachyon.
| Name | Gene ID | Locus | Exon Number | Gene Length | CDS (bp) | No. of AA | pI | MW (kDa) | PSL |
|---|---|---|---|---|---|---|---|---|---|
| BdTPS1 | Bradi2g19640 | 17272345..17280887 | 17 | 7172 | 2958 | 985 | 6.09 | 109.37 | C,P,OM |
| BdTPS2 | Bradi3g37200 | 39265879..39272239 | 3 | 3409 | 2463 | 820 | 6.04 | 91.24 | C,IM |
| BdTPS3 | Bradi3g53790 | 54157803..54162799 | 3 | 3375 | 2556 | 851 | 6.47 | 94.76 | C,P,IM |
| BdTPS4 | Bradi3g35820 | 37837473..37842899 | 3 | 2783 | 2589 | 862 | 6.06 | 97.71 | C |
| BdTPS5 | Bradi2g19710 | 17341436..17346150 | 3 | 3783 | 2709 | 902 | 5.36 | 100.85 | C,OM |
| BdTPS6 | Bradi2g49870 | 49645444..49650378 | 3 | 4238 | 2730 | 909 | 5.47 | 101.74 | C,OM |
| BdTPS7 | Bradi4g41580 | 45574020..45578868 | 3 | 3755 | 2634 | 877 | 5.82 | 98.58 | C |
| BdTPS8 | Bradi1g69420 | 68065706..68070557 | 3 | 3067 | 2604 | 867 | 5.99 | 97.75 | C |
| BdTPS9 | Bradi4g29730 | 35237459..35242687 | 3 | 2823 | 2610 | 869 | 5.99 | 97.75 | C |
| BdTPPA | Bradi3g32970 | 35087863..35092068 | 11 | 2203 | 1266 | 421 | 6.24 | 47.22 | P,C |
| BdTPPB | Bradi1g27470 | 22586832..22591975 | 10 | 1874 | 1056 | 351 | 6.16 | 39.19 | C |
| BdTPPC | Bradi3g50810 | 51669711..51673415 | 9 | 1900 | 1119 | 372 | 5.68 | 41.06 | P,C |
| BdTPPD | Bradi5g17890 | 21178294..21180648 | 10 | 1999 | 1077 | 358 | 8.52 | 39.93 | P,C |
| BdTPPE | Bradi3g35590 | 37622570..37625654 | 10 | 2300 | 1098 | 365 | 9.21 | 40.52 | P |
| BdTPPF | Bradi4g29030 | 34348411..34350663 | 6 | 1793 | 1158 | 385 | 8.98 | 41.79 | P |
| BdTPPG | Bradi3g58960 | 58022082..58025342 | 10 | 2243 | 1101 | 366 | 8.59 | 39.92 | P |
| BdTPPH | Bradi1g60950 | 60533219..60535884 | 6 | 2071 | 1080 | 359 | 6.22 | 39.08 | C |
| BdTPPI | Bradi1g45480 | 43862356..43865024 | 10 | 2266 | 1101 | 366 | 6.27 | 40.05 | C |
| BdTPPJ | Bradi1g21420 | 17249655..17253046 | 9 | 2835 | 1062 | 353 | 5.64 | 38.58 | C |
Note: CDS, protein length in bp; pI, isoelectric point; PSL, predicted subcellular localization; No. of AA, number of amino acids; C, cytoplasmic; P, periplasmic; OM, outer membrane, IM, inner membrane.
Table 2.
The duplicated BdTPS/BdTPP genes and Ka/Ks analysis.
| Gene Pairs | Identity (%) | Ka | Ks | Ka/Ks | MYA |
|---|---|---|---|---|---|
| BdTPS5–BDTPS6 | 81.10 | 0.1108 | 0.8821 | 0.1256 | 67.85 |
| BdTPPC–BdTPPD | 63.44 | 0.2185 | 1.0765 | 0.2030 | 82.80 |
| BdTPPE–BdTPPF | 74.16 | 0.1278 | 0.4258 | 0.3000 | 32.75 |
| BdTPPG–BdTPPI | 63.64 | 0.2354 | 0.5406 | 0.4354 | 41.58 |
| BdTPPH–BdTPPJ | 63.66 | 0.2619 | 0.8726 | 0.3001 | 67.12 |
Note: Identity, protein sequences similarity; Ka, non-synonymous; Ks, synonymous; MYA, million years ago.
© 2019 by the authors. Licensee MDPI, Basel, Switzerland. This article is an open access article distributed under the terms and conditions of the Creative Commons Attribution (CC BY) license (http://creativecommons.org/licenses/by/4.0/).
Share and Cite
MDPI and ACS Style
Wang, S.; Ouyang, K.; Wang, K. Genome-Wide Identification, Evolution, and Expression Analysis of TPS and TPP Gene Families in Brachypodium distachyon. Plants 2019, 8, 362. https://doi.org/10.3390/plants8100362
AMA Style
Wang S, Ouyang K, Wang K. Genome-Wide Identification, Evolution, and Expression Analysis of TPS and TPP Gene Families in Brachypodium distachyon. Plants. 2019; 8(10):362. https://doi.org/10.3390/plants8100362
Chicago/Turabian StyleWang, Song, Kai Ouyang, and Kai Wang. 2019. "Genome-Wide Identification, Evolution, and Expression Analysis of TPS and TPP Gene Families in Brachypodium distachyon" Plants 8, no. 10: 362. https://doi.org/10.3390/plants8100362
Note that from the first issue of 2016, this journal uses article numbers instead of page numbers. See further details here.