
Nitrogen Use Efficiency in Parent vs. Hybrid Canola under Varying Nitrogen Availabilities


1
Department of Soil Science, University of Saskatchewan, Saskatoon, SK S7N 5A8, Canada
2
Saskatoon Research Centre, Agriculture and Agri-Food Canada, Saskatoon, SK S7N 0X2, Canada
*
Authors to whom correspondence should be addressed.
Plants 2021, 10(11), 2364; https://doi.org/10.3390/plants10112364
Submission received: 30 September 2021
/
Revised: 27 October 2021
/
Accepted: 27 October 2021
/
Published: 2 November 2021
(This article belongs to the Topic Soil Fertility and Plant Nutrition for Sustainable Agriculture)
Abstract
:Improving nitrogen use efficiency (NUE) is essential for sustainable agriculture, especially in high-N-demanding crops such as canola (Brassica napus). While advancements in above-ground agronomic practices have improved NUE, research on soil and below-ground processes are limited. Plant NUE—and its components, N uptake efficiency (NUpE), and N utilization efficiency (NUtE)—can be further improved by exploring crop variety and soil N cycling. Canola parental genotypes (NAM-0 and NAM-17) and hybrids (H151857 and H151816) were grown on a dark brown chernozem in Saskatchewan, Canada. Soil and plant samples were collected at the 5–6 leaf stage and flowering, and seeds were collected at harvest maturity. Soil N cycling varied with phenotypic stage, with higher potential ammonium oxidation rates at the 5–6 leaf stage and higher urease activity at flowering. Seed N uptake was higher under higher urea-N rates, while the converse was true for NUE metrics. Hybrids had higher yield, seed N uptake, NUtE, and NUE, with higher NUE potentially owing to higher NUtE at flowering, which led to higher yield and seed N allocation. Soil N cycling and soil N concentrations correlated for improved canola NUE, revealing below-ground breeding targets. Future studies should consider multiple root characteristics, including rhizosphere microbial N cycling, root exudates, and root system architecture, to determine the below-ground dynamics of plant NUE.
1. Introduction
Canola (Brassica napus) is an important oilseed crop grown globally, with Canada producing over 20.7 and 19.6 million metric tons of canola in 2018 and 2019, respectively [1], making Canada one of the largest canola producers globally. Canola is used in human consumption, animal feed, and feedstock for biofuels, requiring relatively large inputs of N to produce high yields [2,3,4,5,6,7,8,9]. However, there are negative environmental concerns, with excessive N fertilizer use affecting the soil and waterways through nitrate leaching and runoff [10]. The future of sustainable agriculture requires increased and stable crop yields, with decreasing amounts of N fertilization [11,12,13] to protect ecosystem health while feeding the growing population. Thus, researchers must find solutions to maximize agronomic and economic competitiveness while reducing associated negative environmental impacts [14]. Agronomic and economic competitiveness is achievable by improving and enhancing crop N use efficiency (NUE) [11].
Improvements in NUE and seed yield traits in hybrid varieties are crucial outcomes in the development of canola [15,16,17,18]. The selection of enhanced NUE traits in hybrid canola might have occurred passively; for example, winter canola hybrids outcompeted older varieties concerning NUE traits regardless of N fertilizer rates [18]. High NUE in hybrid canola also correlates to specific traits, including increased plant biomass at flowering and increased seed yield [17]. Higher NUE in spring hybrid canola may also be associated with below-ground interactions, including better scavenging of soil and fertilizer N [15].
Crop NUE consists of two components: N uptake efficiency (NUpE) and N utilization efficiency (NUtE) [19]. NUpE represents the plant’s ability to absorb N from the soil (whether derived from native soil N or fertilizer N), while NUtE represents the plant’s ability to partition absorbed N to specific plant organs [19]. However, of the two components, NUpE is more directly influenced by the soil and root–soil interactions. Thus, plants affect NUE by regulating N uptake rates, modifying biomass allocation, and adapting root system architecture to improve N capture [20,21,22]. Genotypic variability in NUpE and NUtE have been observed in numerous agriculturally relevant crops, including wheat (Triticum aestivum) [23,24], maize (Zea mays) [25], rice (Oryza sativa) [26,27], barley (Hordeum vulgare) [28,29], and canola (Brassica napus) [17,18].
Crop breeding has focused efforts on developing crop varieties capable of scavenging plant-available soil N [30]. Plant inherited traits are involved in soil N processes across different crop species [23,31,32,33]. Pathan et al. (2015) reported that a maize variety with higher NUE could induce faster soil inorganic N depletion in the rhizosphere than a variety that had lower NUE [33]. The high NUE maize variety also had a distinct microbial community structure and soil extracellular enzyme activity, potentially increasing inorganic N supply than the low NUE variety [33]. The synchronicity between below-ground processes and plant N status, growth, and productivity is complex due to the dynamic soil processes at play. Plant roots stimulate and select distinct microbial communities, which access plant carbon and hydrolyze organic N to inorganic N forms. A better understanding of the below-ground synchronicity between plant N demand and soil N cycling can improve crop NUE further. For example, crop breeding has altered soil N acquisition, with newer maize varieties exhibiting increased soil N cycling processes and crop N uptake [34]. Further, higher mineralization and nitrification rates enhanced NUE under high NUE maize than the low NUE maize varieties [35]. To our knowledge, no such data exist on soil N cycling, plant nitrogen uptake, and NUE components for spring canola; however, this could inform canola breeding programs’ efforts in selecting varieties that can exploit naturally occurring processes to improve NUE.
Our objective for this study was to evaluate how (1) soil N cycling processes affecting plant-available N, (2) soil inorganic N concentrations, and (3) canola NUE (including NUpE and NUtE) differed between canola varieties (hybrids vs. parent genotypes) grown under varying urea-N fertilizer rates. Two important reactions associated with the concentrations of soil NH4+ and NO3− include the hydrolysis of urea—a predominant source of N fertilizer in agricultural soils—to NH4+ by urease enzyme [36], and the oxidation of NH4+ to nitrite (NO2−) during the first step of nitrification by ammonia monooxygenase [37]. Plants mainly absorb NH4+-N and NO3−-N [38], though canola preferentially absorbs NO3−-N [39]. Urease produces NH4+-N, and urease activity is responsive to urea-N fertilizer [40], while nitrification results in the formation of NO3−-N, and potential ammonium oxidation is an indicator of nitrification [41,42]. Thus, the soil N cycling processes we focused on were urease activity and potential ammonium oxidation because they affect plant-available N. We examined whether soil N cycling, NUpE, and NUtE varied with phenological stage within the growing season (5–6 leaves and flowering) and the resulting NUE at crop harvest. We hypothesized that canola varieties with higher plant NUE (and the two NUE components: NUpE and NUtE) would be associated with increased soil N cycling and passive plant trait yield components like higher thousand-seed weight, earlier start to flowering, and longer duration of flowering. Passive plant traits can affect canola yield and NUE for different canola varieties [17,18]; these traits, like earlier flowering and longer flowering duration, were also hypothesized to positively influence hybrid yields and NUE in our study.
2. Results
2.1. Category A Variables: Within Growing Season Soil N Cycling and Crop NUE Components
2.1.1. Soil Inorganic N Concentrations
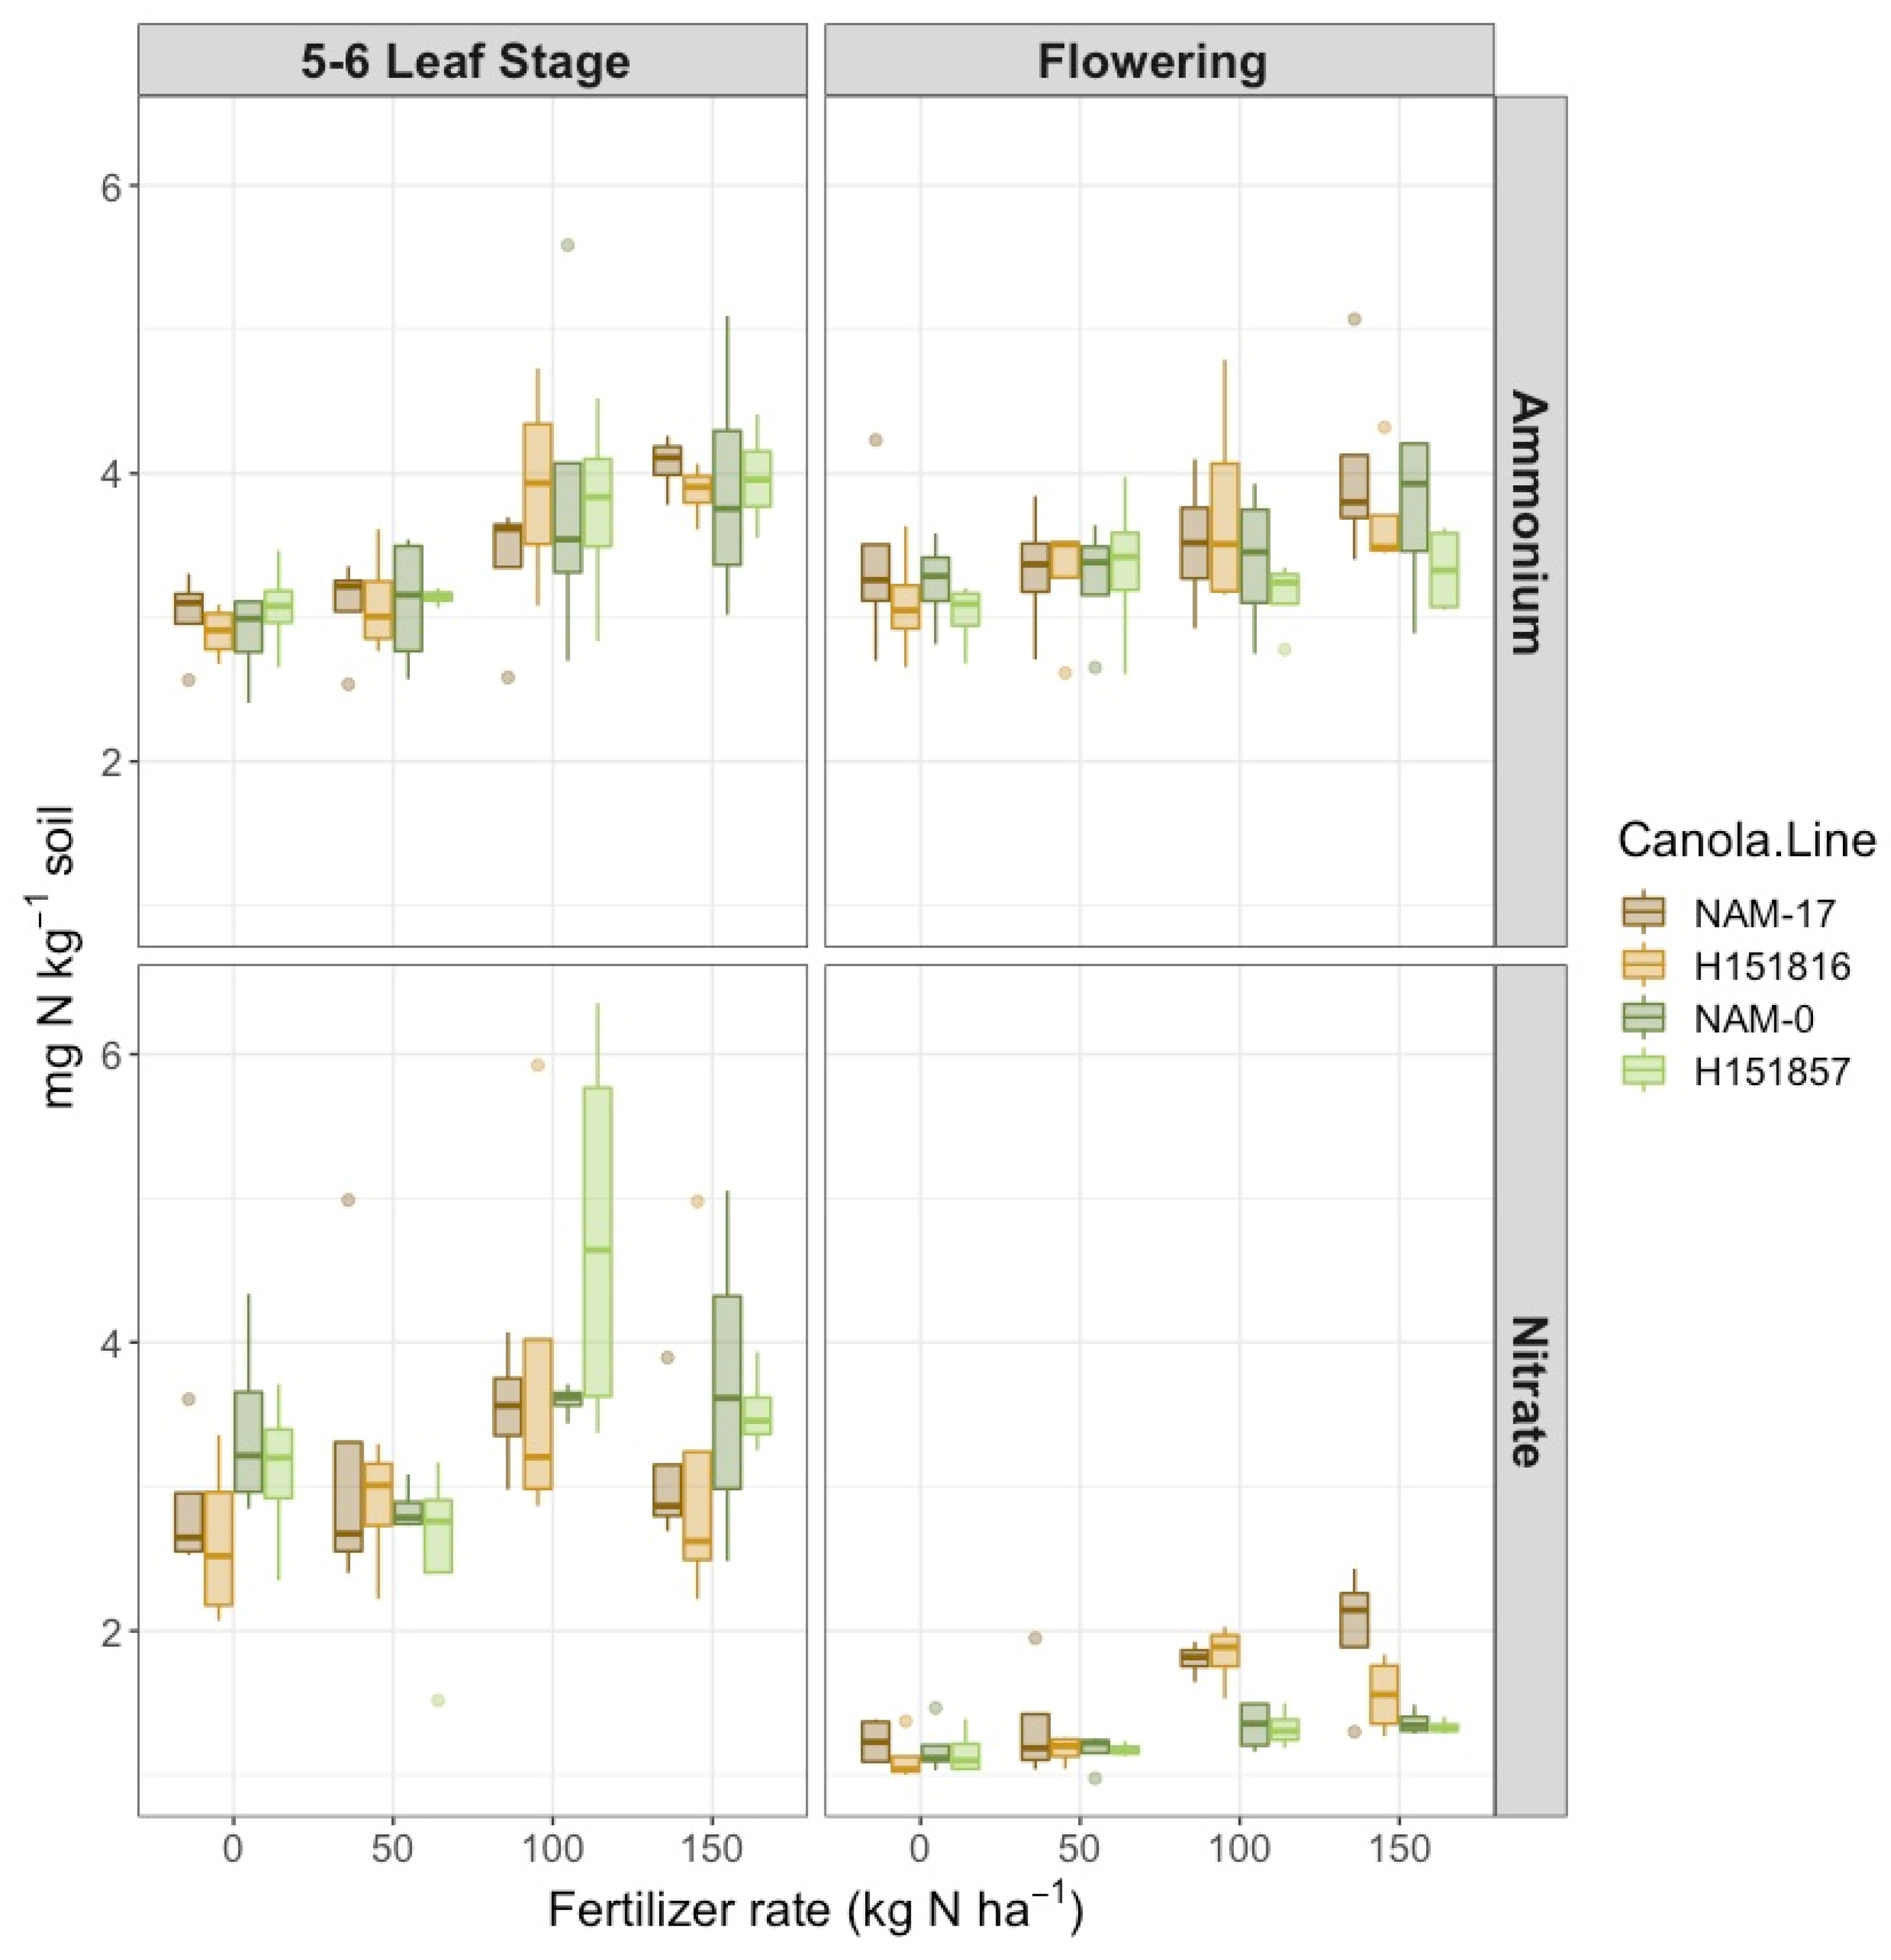
There was a two-way interaction between fertilizer N rates and phenological stage on soil NH4+-N concentration (Table 1), where NH4+-N concentration was highest under the 150 kg ha−1 N rate at both phenological stages and lowest under the 0 kg ha−1 N rate at the 5–6 leaf stage (Figure 1). Canola varieties did not affect soil NH4+-N nor soil NO3−-N concentrations. However, there was a two-way interaction between canola variety and phenological stage on soil NO3−-N concentration (Table 1). Soil NO3−-N concentrations were highest and highly variable at the 5–6 leaf stage, but unlike soil NH4+-N, soil NO3−-N was less variable at flowering (Figure 1). At flowering, soil NO3−-N was lowest under the experimental hybrid H151857 and its parental genotype NAM-0, and was highest under NAM-17; soil NO3−-N was most similar between hybrid–parent pairs (Figure 1). Soil NO3−-N concentrations increased with increasing urea-N fertilizer rates at both phenological stages (Figure 1).
2.1.2. Urease Activity and Potential Ammonium Oxidation Rates
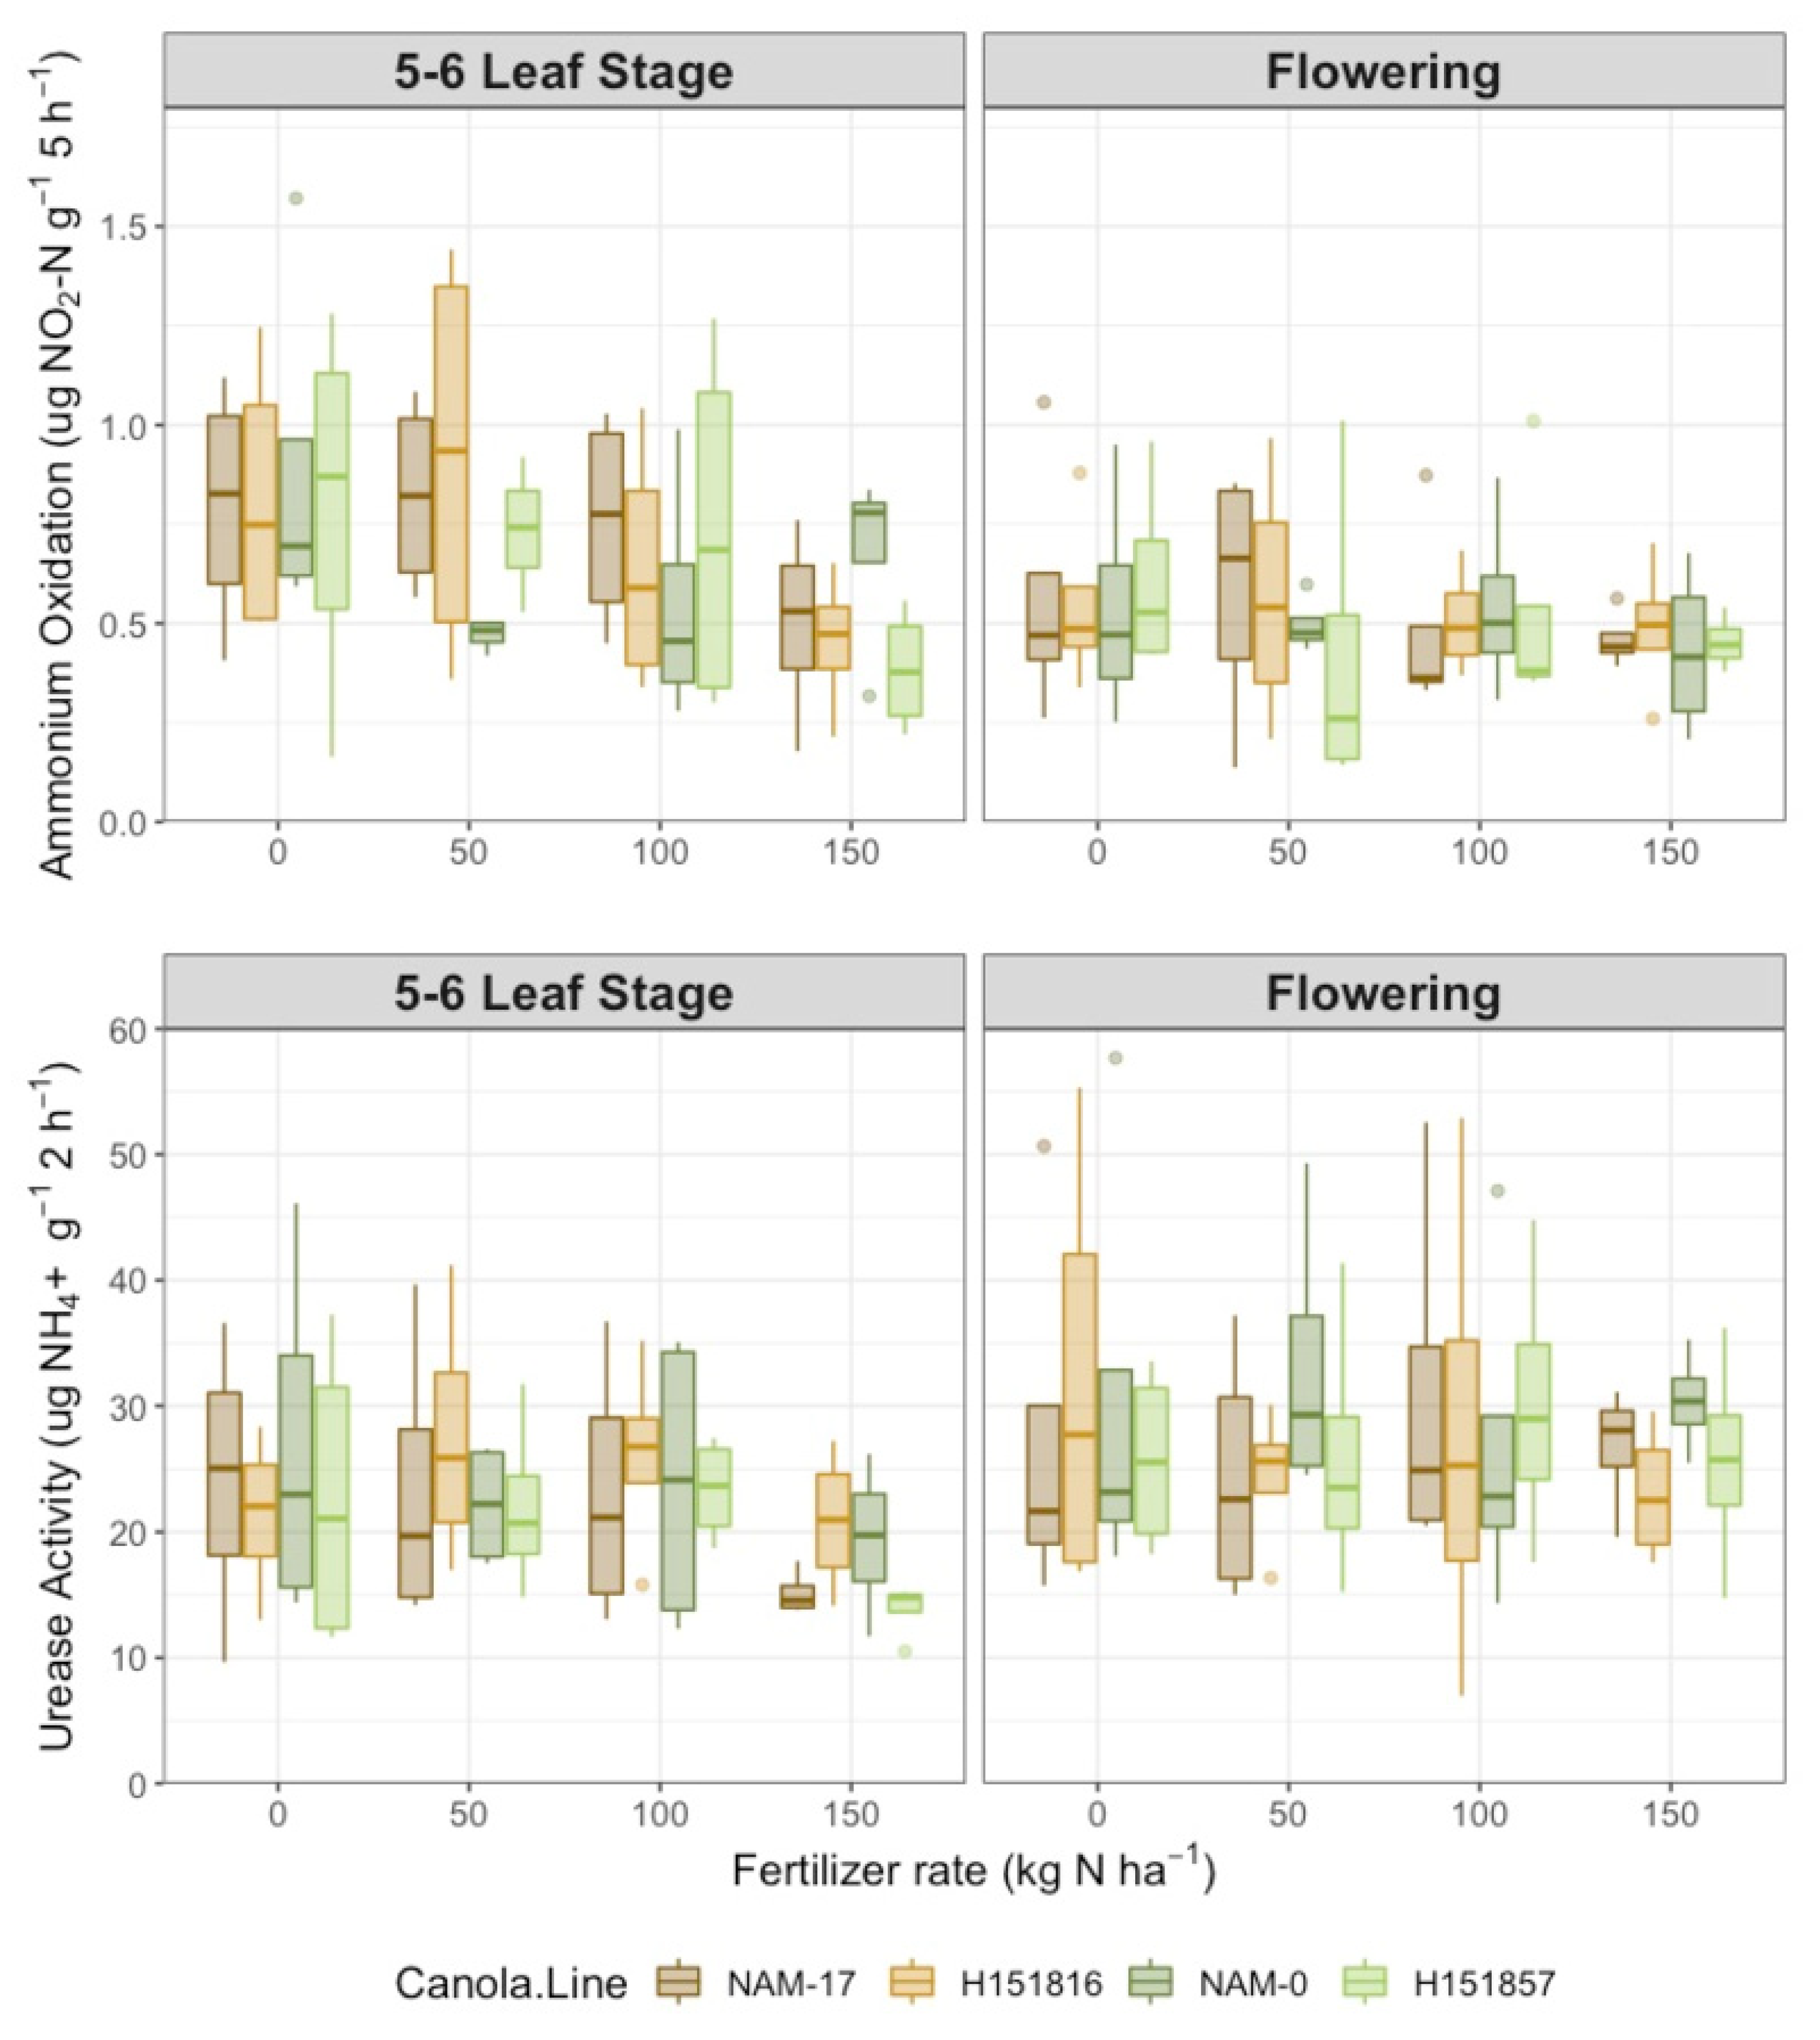
Urease activity varied with phenological stage (Table 1); it was 20.0% higher at flowering than at the 5–6 leaf stage (Figure 2). However, urease activity was not affected by either canola variety or fertilizer N rate. Similarly, potential ammonium oxidation rate was not affected by canola variety or N rate but changed with phenological stage (Table 1). Inverse to urease activity, potential ammonium oxidation rates were 24.9% higher at the 5–6 leaf stage than at flowering (Figure 2). Soil pH varied with phenological stage (Table 1), with higher pH at flowering versus the 5–6 leaf stage.
2.1.3. Canola Nitrogen Use Efficiency Components
Above-ground plant biomass varied with two-way interactions between (1) urea-N fertilizer rates and canola varieties and (2) canola varieties and phenological stage (Table 1). Plant biomass was highest under H151816 at 100 kg ha−1 N, and lowest under NAM-17 at 50 kg ha−1 N; parental genotypes had the lowest plant biomass at the 5–6 leaf stage but the highest biomass at flowering (Figure S1). Plant N uptake also varied with two-way interactions between (1) fertilizer N rates and canola varieties and (2) canola varieties and phenological stage (Table 1). Plant N uptake, like above-ground biomass, was highest under H151816 at the 100 kg ha−1 N rate and lowest under NAM-17 at the 50 kg ha−1 N rate (Figure S2). At the 5–6 leaf stage, H151857 and its corresponding parental genotype, NAM-0, had the highest N uptake; however, at flowering, both hybrids had lower N uptake than the parental genotypes (Figure S2).
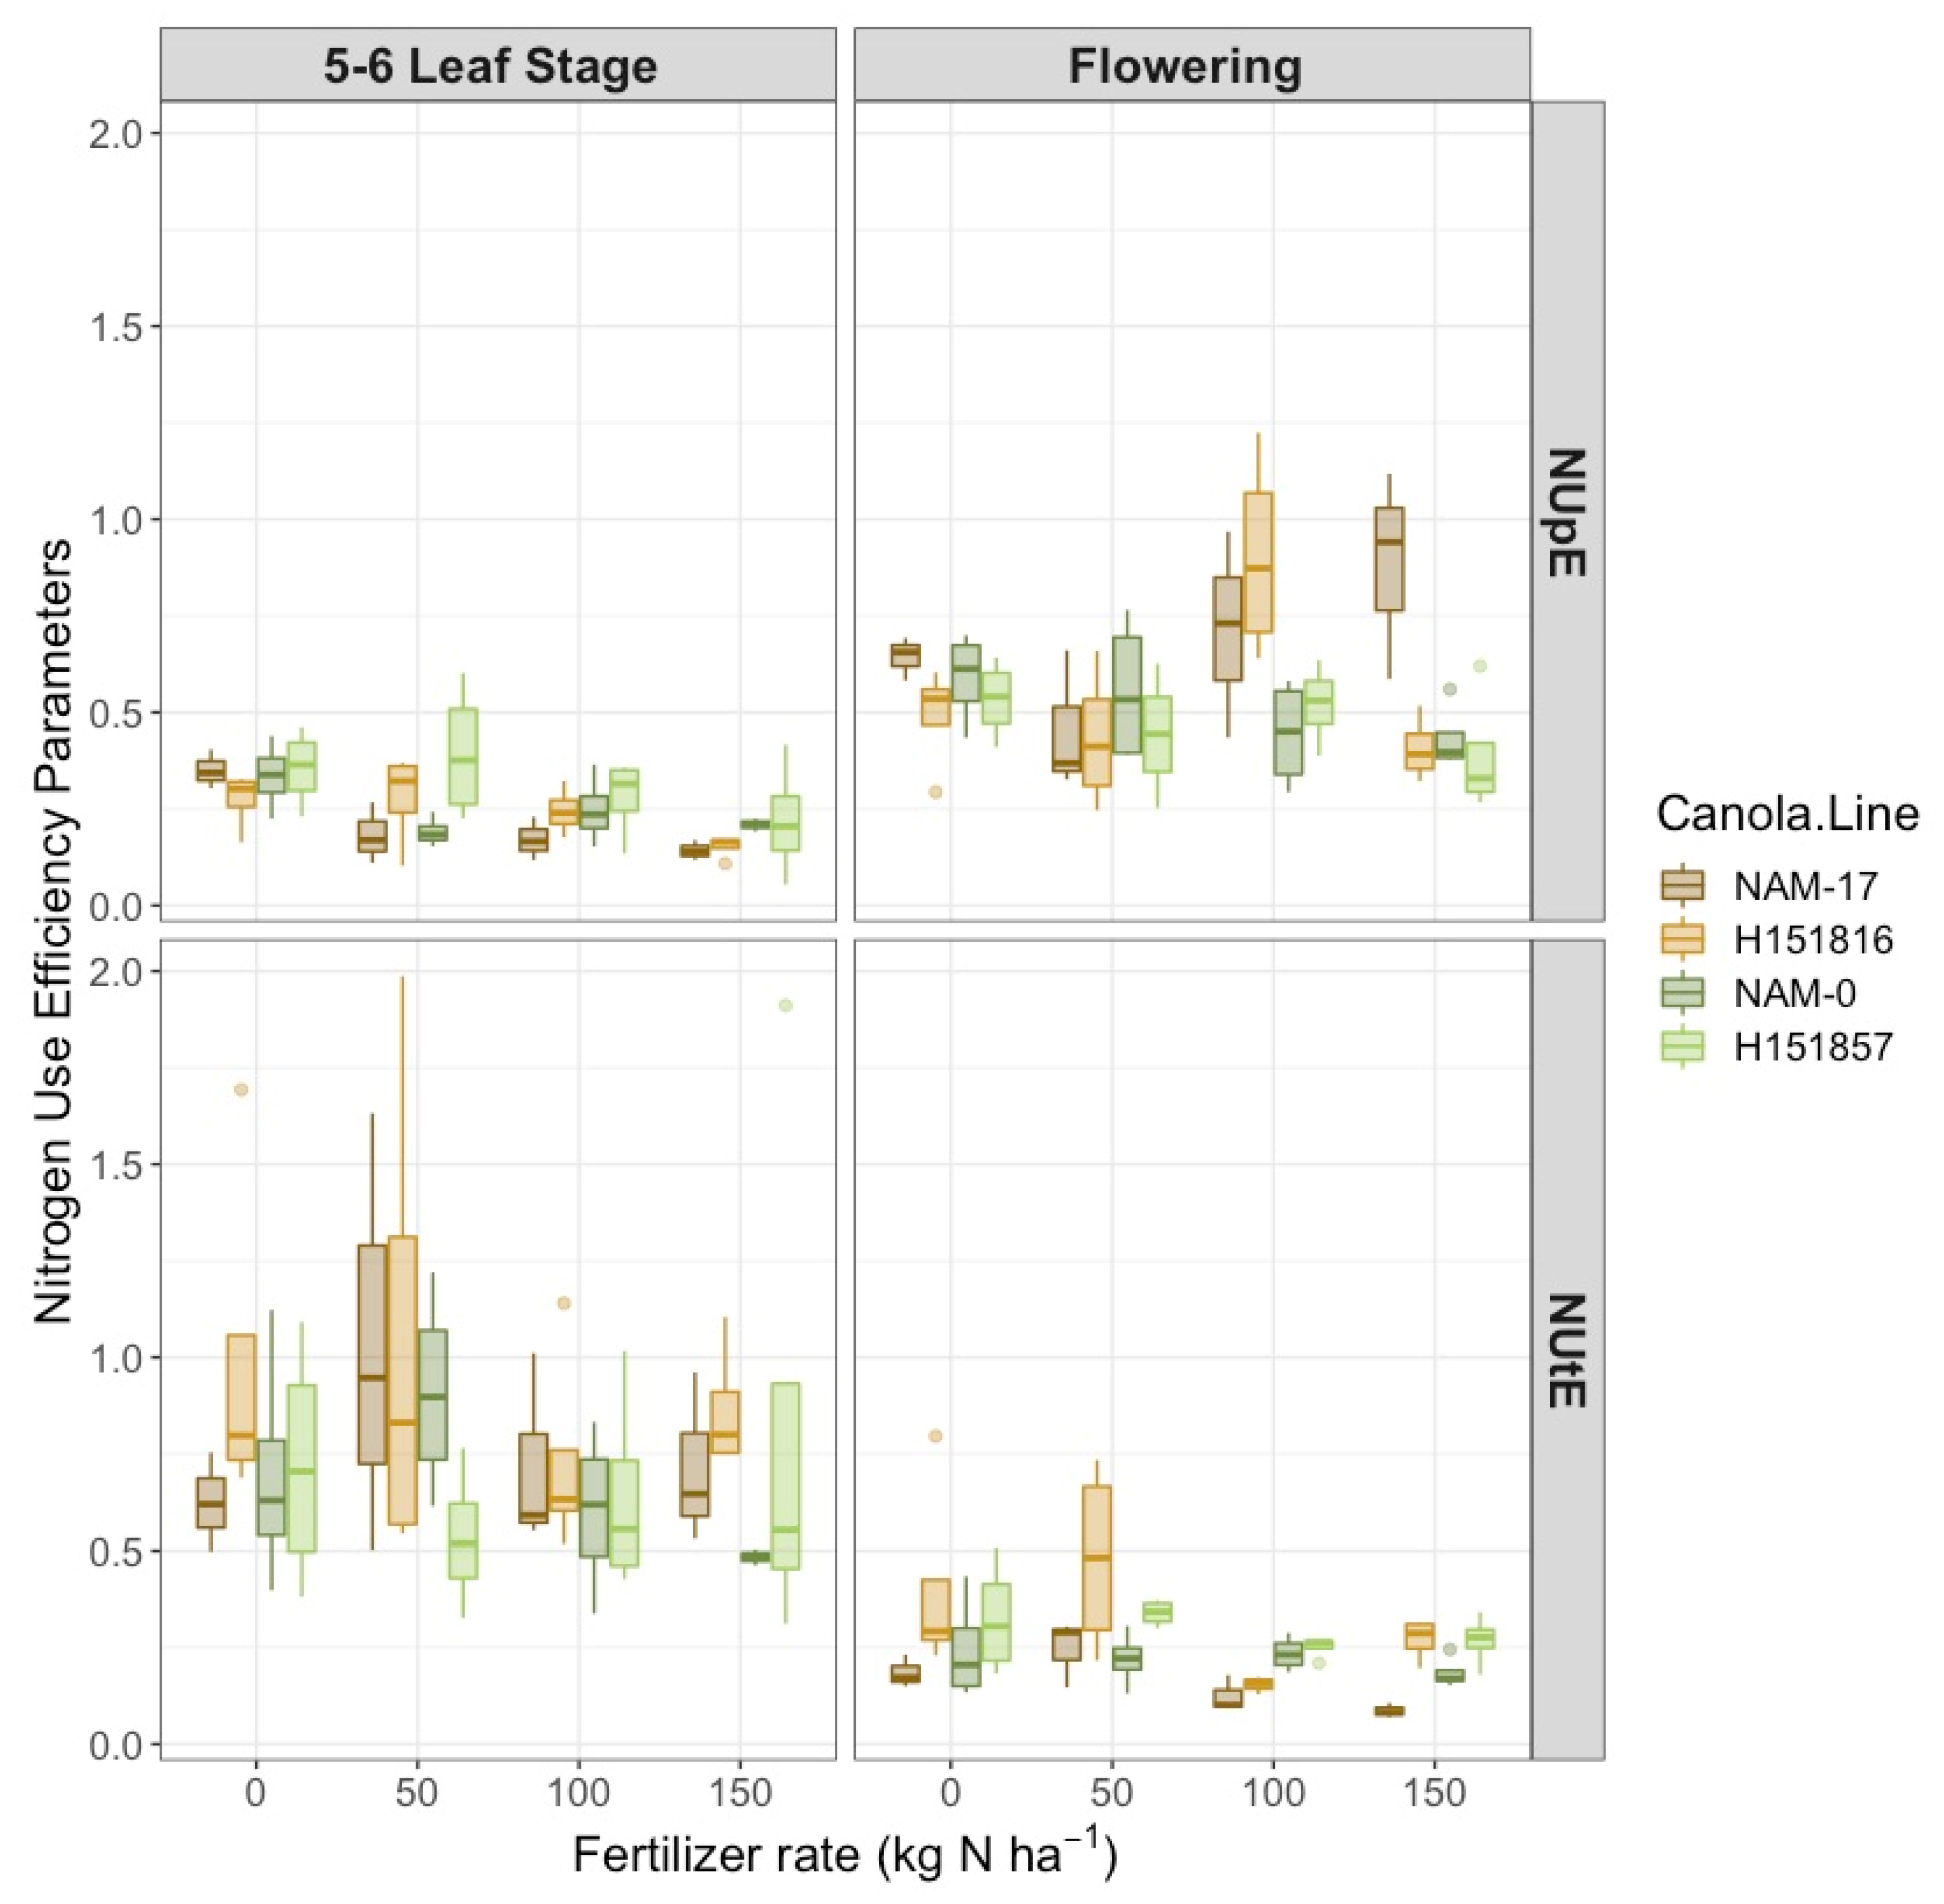
Nitrogen uptake efficiency (NUpE) was affected by a two-way interaction between canola varieties and phenological stage (Table 1). Hybrid H151816 and its corresponding parental genotype NAM-17 had the highest NUpE at flowering, while H151857 and its corresponding parental genotype, NAM-0, had the highest NUpE at the 5–6 leaf stage (Figure 3). There was also a two-way interaction between urea-N fertilizer rates and phenological stage on NUpE (Table 1). Plant NUpE decreased with increasing urea-N rates at the 5–6 leaf stage; however, NUpE was highest at the 0 and 100 kg ha−1 N rates at flowering (Figure 3).
Like NUpE, plant NUtE was affected by a two-way interaction between canola varieties and phenological stage (Table 1). At the 5–6 leaf stage, H151816 and its corresponding parental genotype, NAM-17, had the highest NUtE compared to H151857 and its corresponding parental genotype, NAM-0. However, both hybrids tended to have higher NUtE than the parental genotypes at flowering (Figure 3). Fertilizer N rates tended to affect plant NUtE (Table 1). Like NUpE, NUtE decreased with increasing N rates, with the 0 and 50 kg ha−1 N rates generally having the highest NUtE. Experimental hybrid H151816 had the highest NUtE at 50 kg ha−1 N, while its parental genotype, NAM-17, had the lowest NUtE at 150 kg ha−1 N.
2.2. Category B Variables: Within Season Crop Growth and Harvest Metrics
2.2.1. Flowering Time
The start of flowering among canola varieties depended on urea-N fertilizer rate (Table 2). Genotype NAM-17 and its associated hybrid, H151816, tended toward a later onset flowering at higher N rates, while NAM-0 and its associated hybrid, H151857, tended towards an earlier onset flowering at lower N rates. The end of flowering was affected by canola variety and N fertilizer rate, but there was no interaction between these two factors (Table 2). Parent genotype NAM-17 finished flowering later than all other varieties. Flowering ended under the 0 kg ha−1 N controls before any of the urea-N fertilized treatments. The flowering duration was affected by canola variety and urea-N fertilizer rate, but there was no interaction between the two factors (Table 2). Both NAM-17 and its associated hybrid, H151816, had the shortest flowering duration of all genotypes, and flowering duration was shorter under the 0 kg N ha−1 plots.
2.2.2. Yield, Seed Nitrogen Uptake, and Nitrogen Use Efficiency
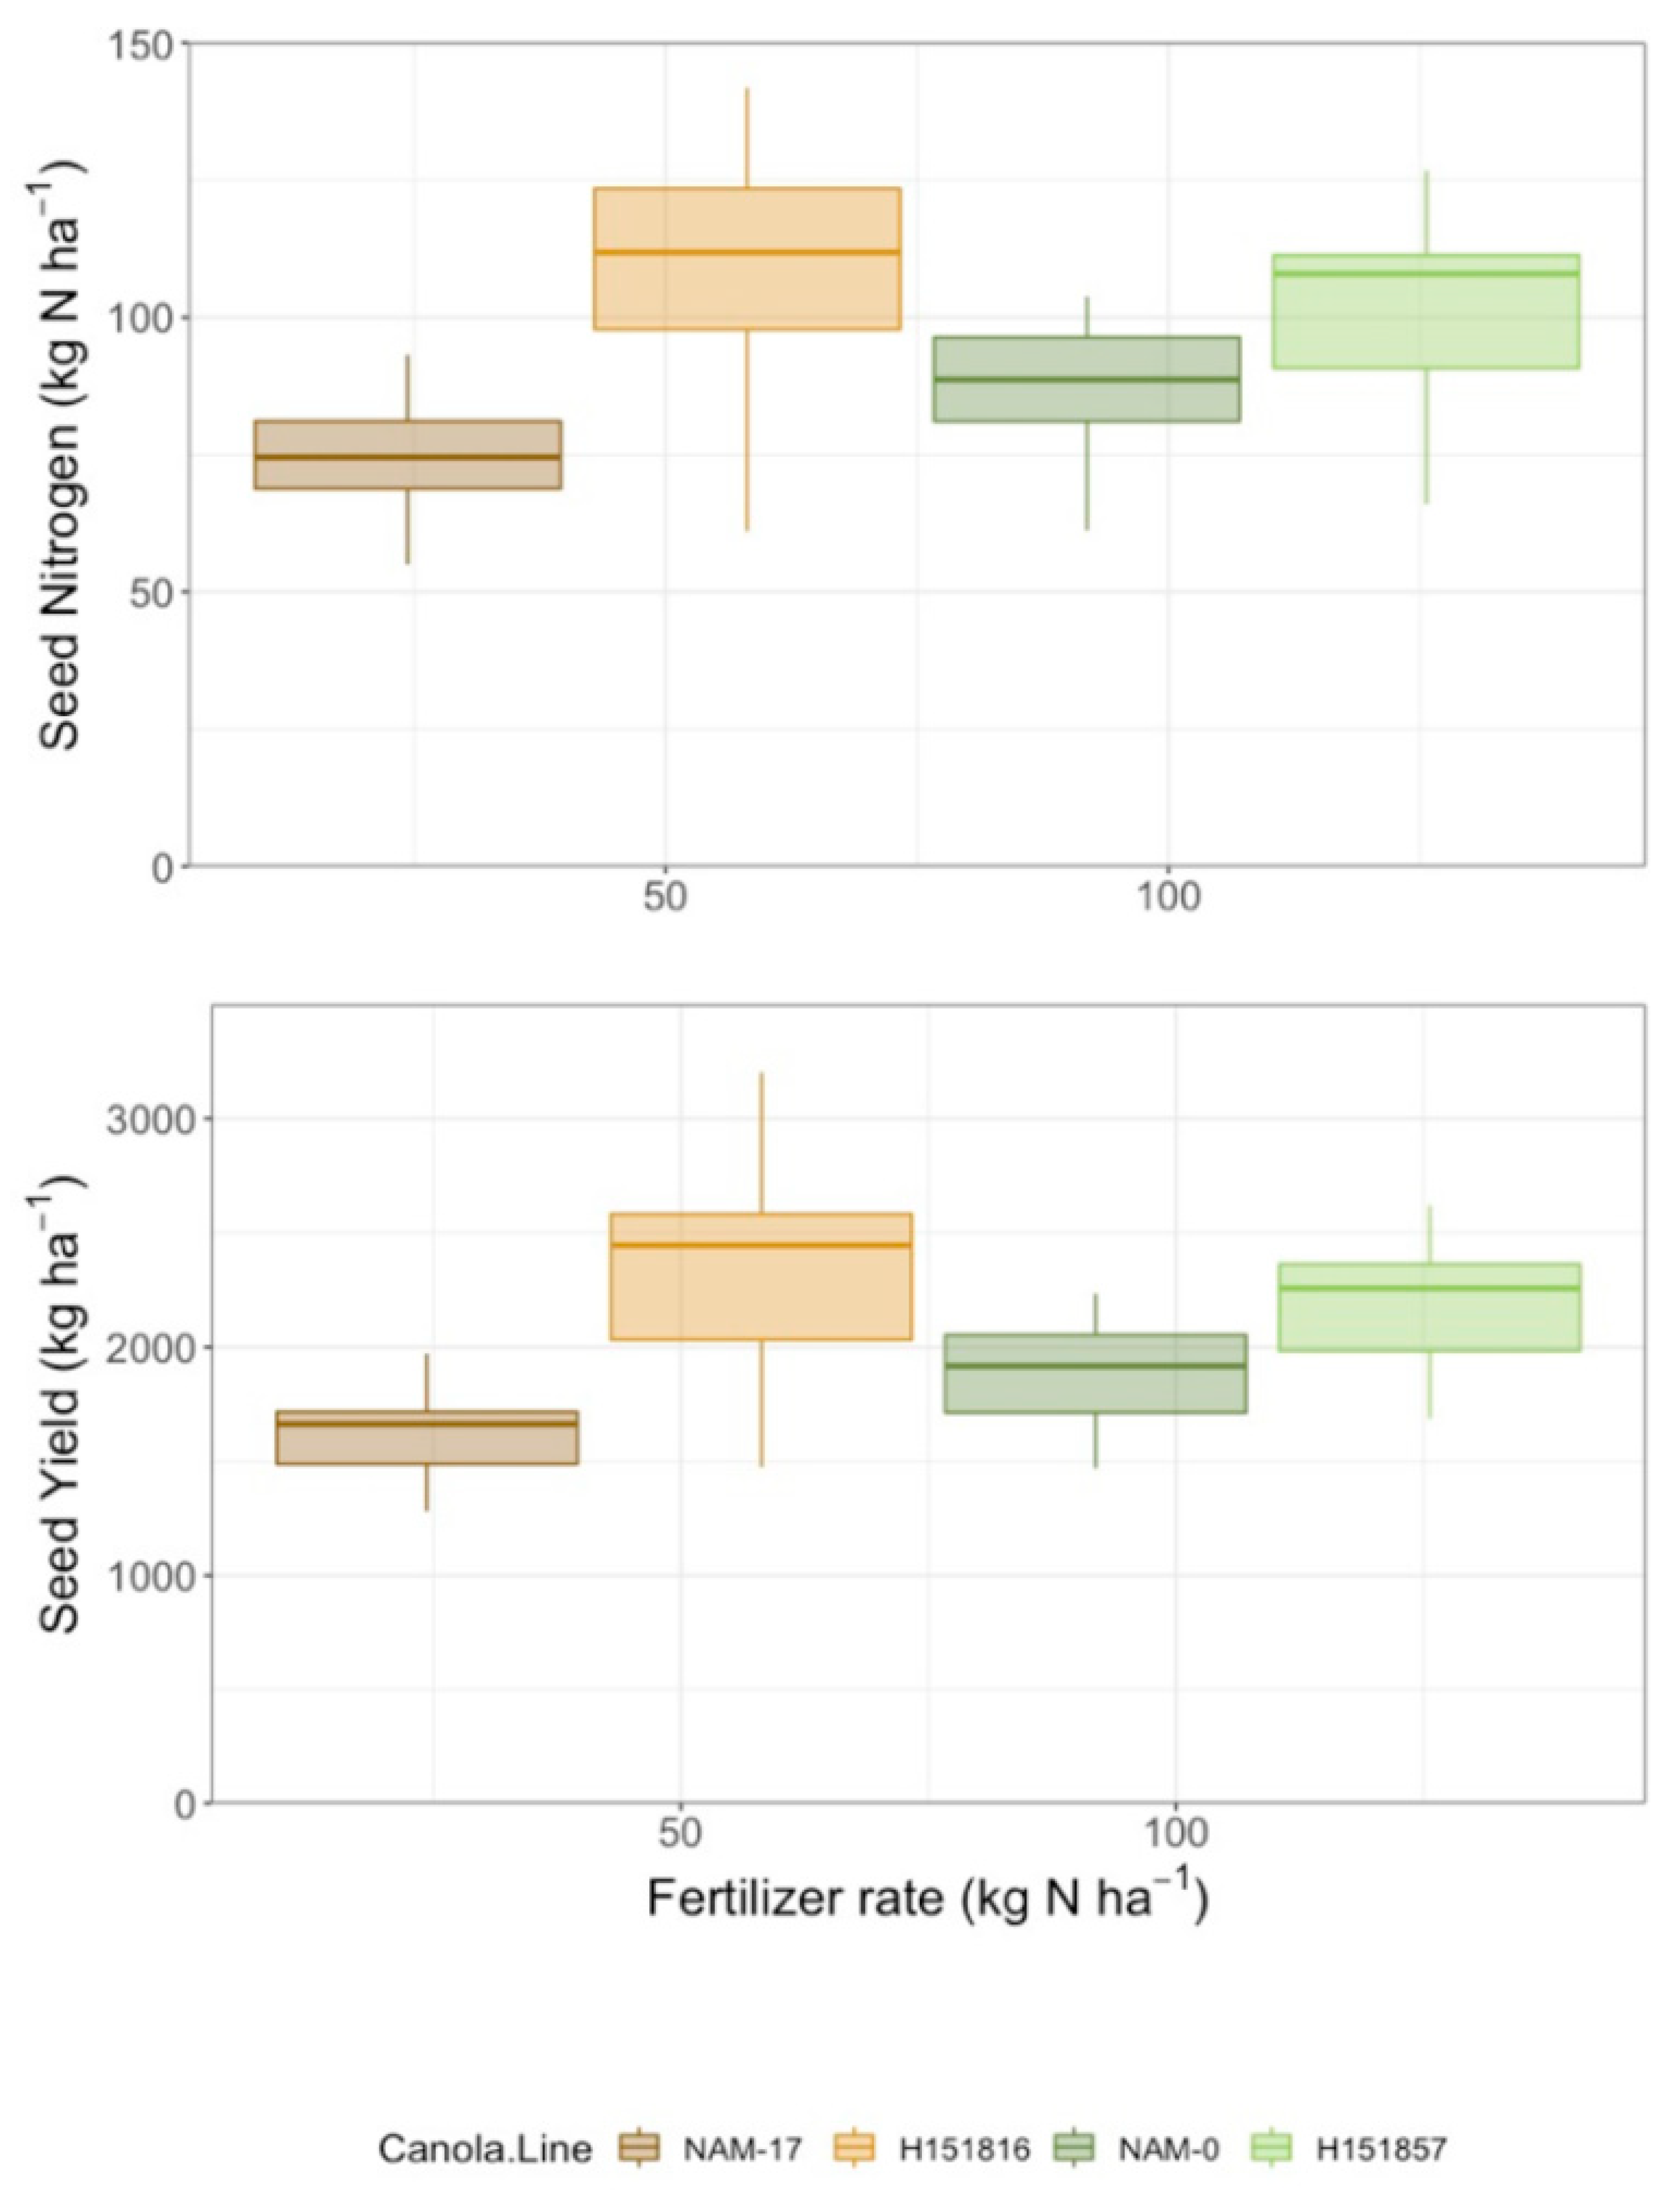
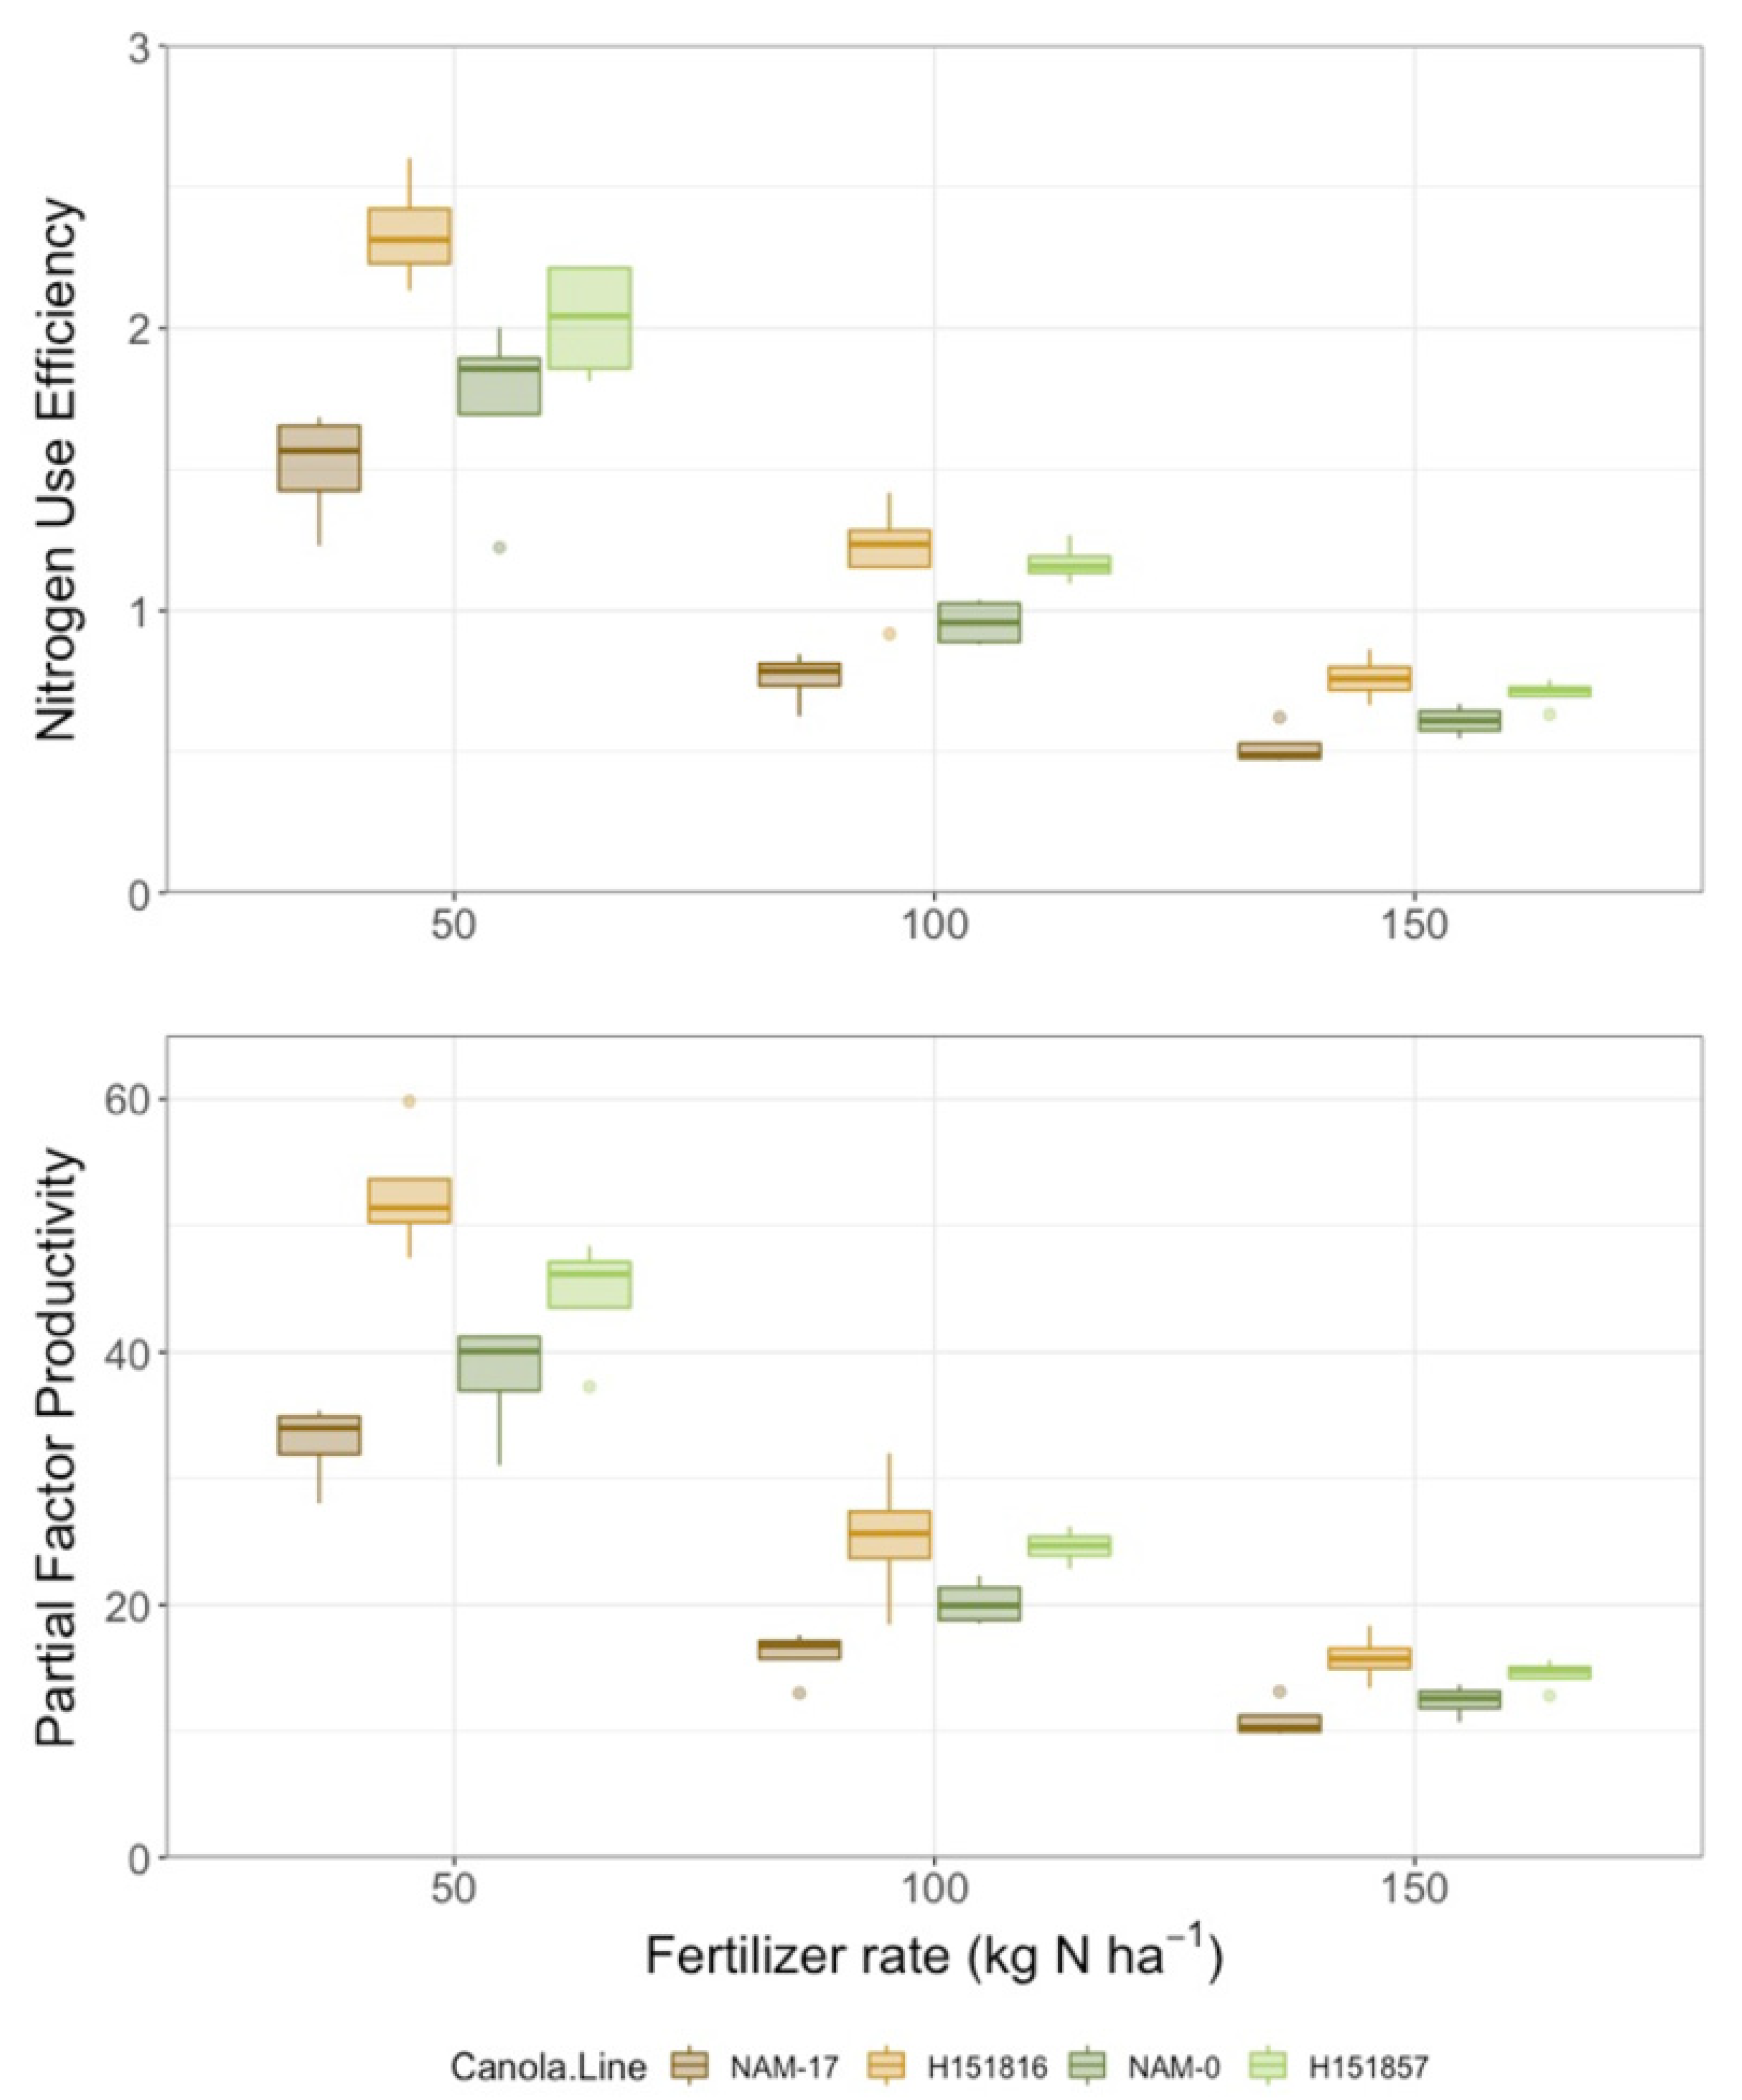
Yield differed among canola varieties and urea-N fertilizer rates, but there was no interaction between these two factors (Table 2). Seed yield was lowest under both parental genotypes and highest under both hybrids; urea-N fertilizer treatment increased seed yield at all application rates relative to the 0 kg ha−1 N control (Figure 4). Similarly, seed N uptake differed among canola varieties and urea-N fertilizer rates, but there was no interaction between these two factors (Table 2). Like yield, seed N uptake was lowest under both parental genotypes and highest under both hybrids. Seed N uptake was lowest in the control plots (0 kg ha−1 fertilizer N) and increased with fertilizer application, though there were no differences among the urea-N rates (50, 100, and 150 kg ha−1; Figure 4). There was high variability in seed N uptake under the four genotypes and, like seed yield, parental genotype NAM-17 plateaued after the 50 kg ha−1 N fertilizer rate (Figure 4). Canola NUE (seed N uptake/urea-N fertilizer rate) and partial factor productivity (seed yield/urea-N fertilizer rate) varied among canola varieties and N fertilizer rates, and there was an interaction between the two factors (Table 2). Canola NUE and partial factor productivity were higher under both hybrids and lower under the parental genotypes, though the rankings of the parental genotypes did not align with their corresponding hybrids. Canola NUE and partial factor productivity were higher under the 50 kg ha−1 N fertilizer rate than the higher N fertilizer rates (Figure 5). Variability in NUE and partial factor productivity between genotypes decreased at the higher urea-N fertilizer rates (Figure 5).
2.3. Category A and B Variables’ Inter-Relationships
Spearman’s rank correlation coefficient was calculated based on the adjusted means of the variables of the Category A and B datasets. We conducted these correlations to determine the relationships between the above- and below-ground parameters that affected canola growth and seed production. For Category A variables (Figure 6), soil NO3−-N content negatively correlated with days after sowing (DAS), plant N uptake, NUpE, and plant biomass, and positively correlated with NUtE. Soil NH4+-N content negatively correlated with potential ammonium oxidation rates, urease activity, and soil pH and positively correlated with N fertilizer rate. Soil pH positively correlated with potential ammonium oxidation rates and urease activity and negatively correlated with N fertilizer rate. Also, above-ground plant biomass positively correlated with plant N uptake, NUpE, and DAS and negatively correlated with NUtE. Finally, NUpE was positively correlated with DAS urease activity and negatively correlated with NUtE, while NUtE correlated negatively with DAS. Nitrogen fertilizer rate negatively correlated with urease and potential ammonium oxidation rates.
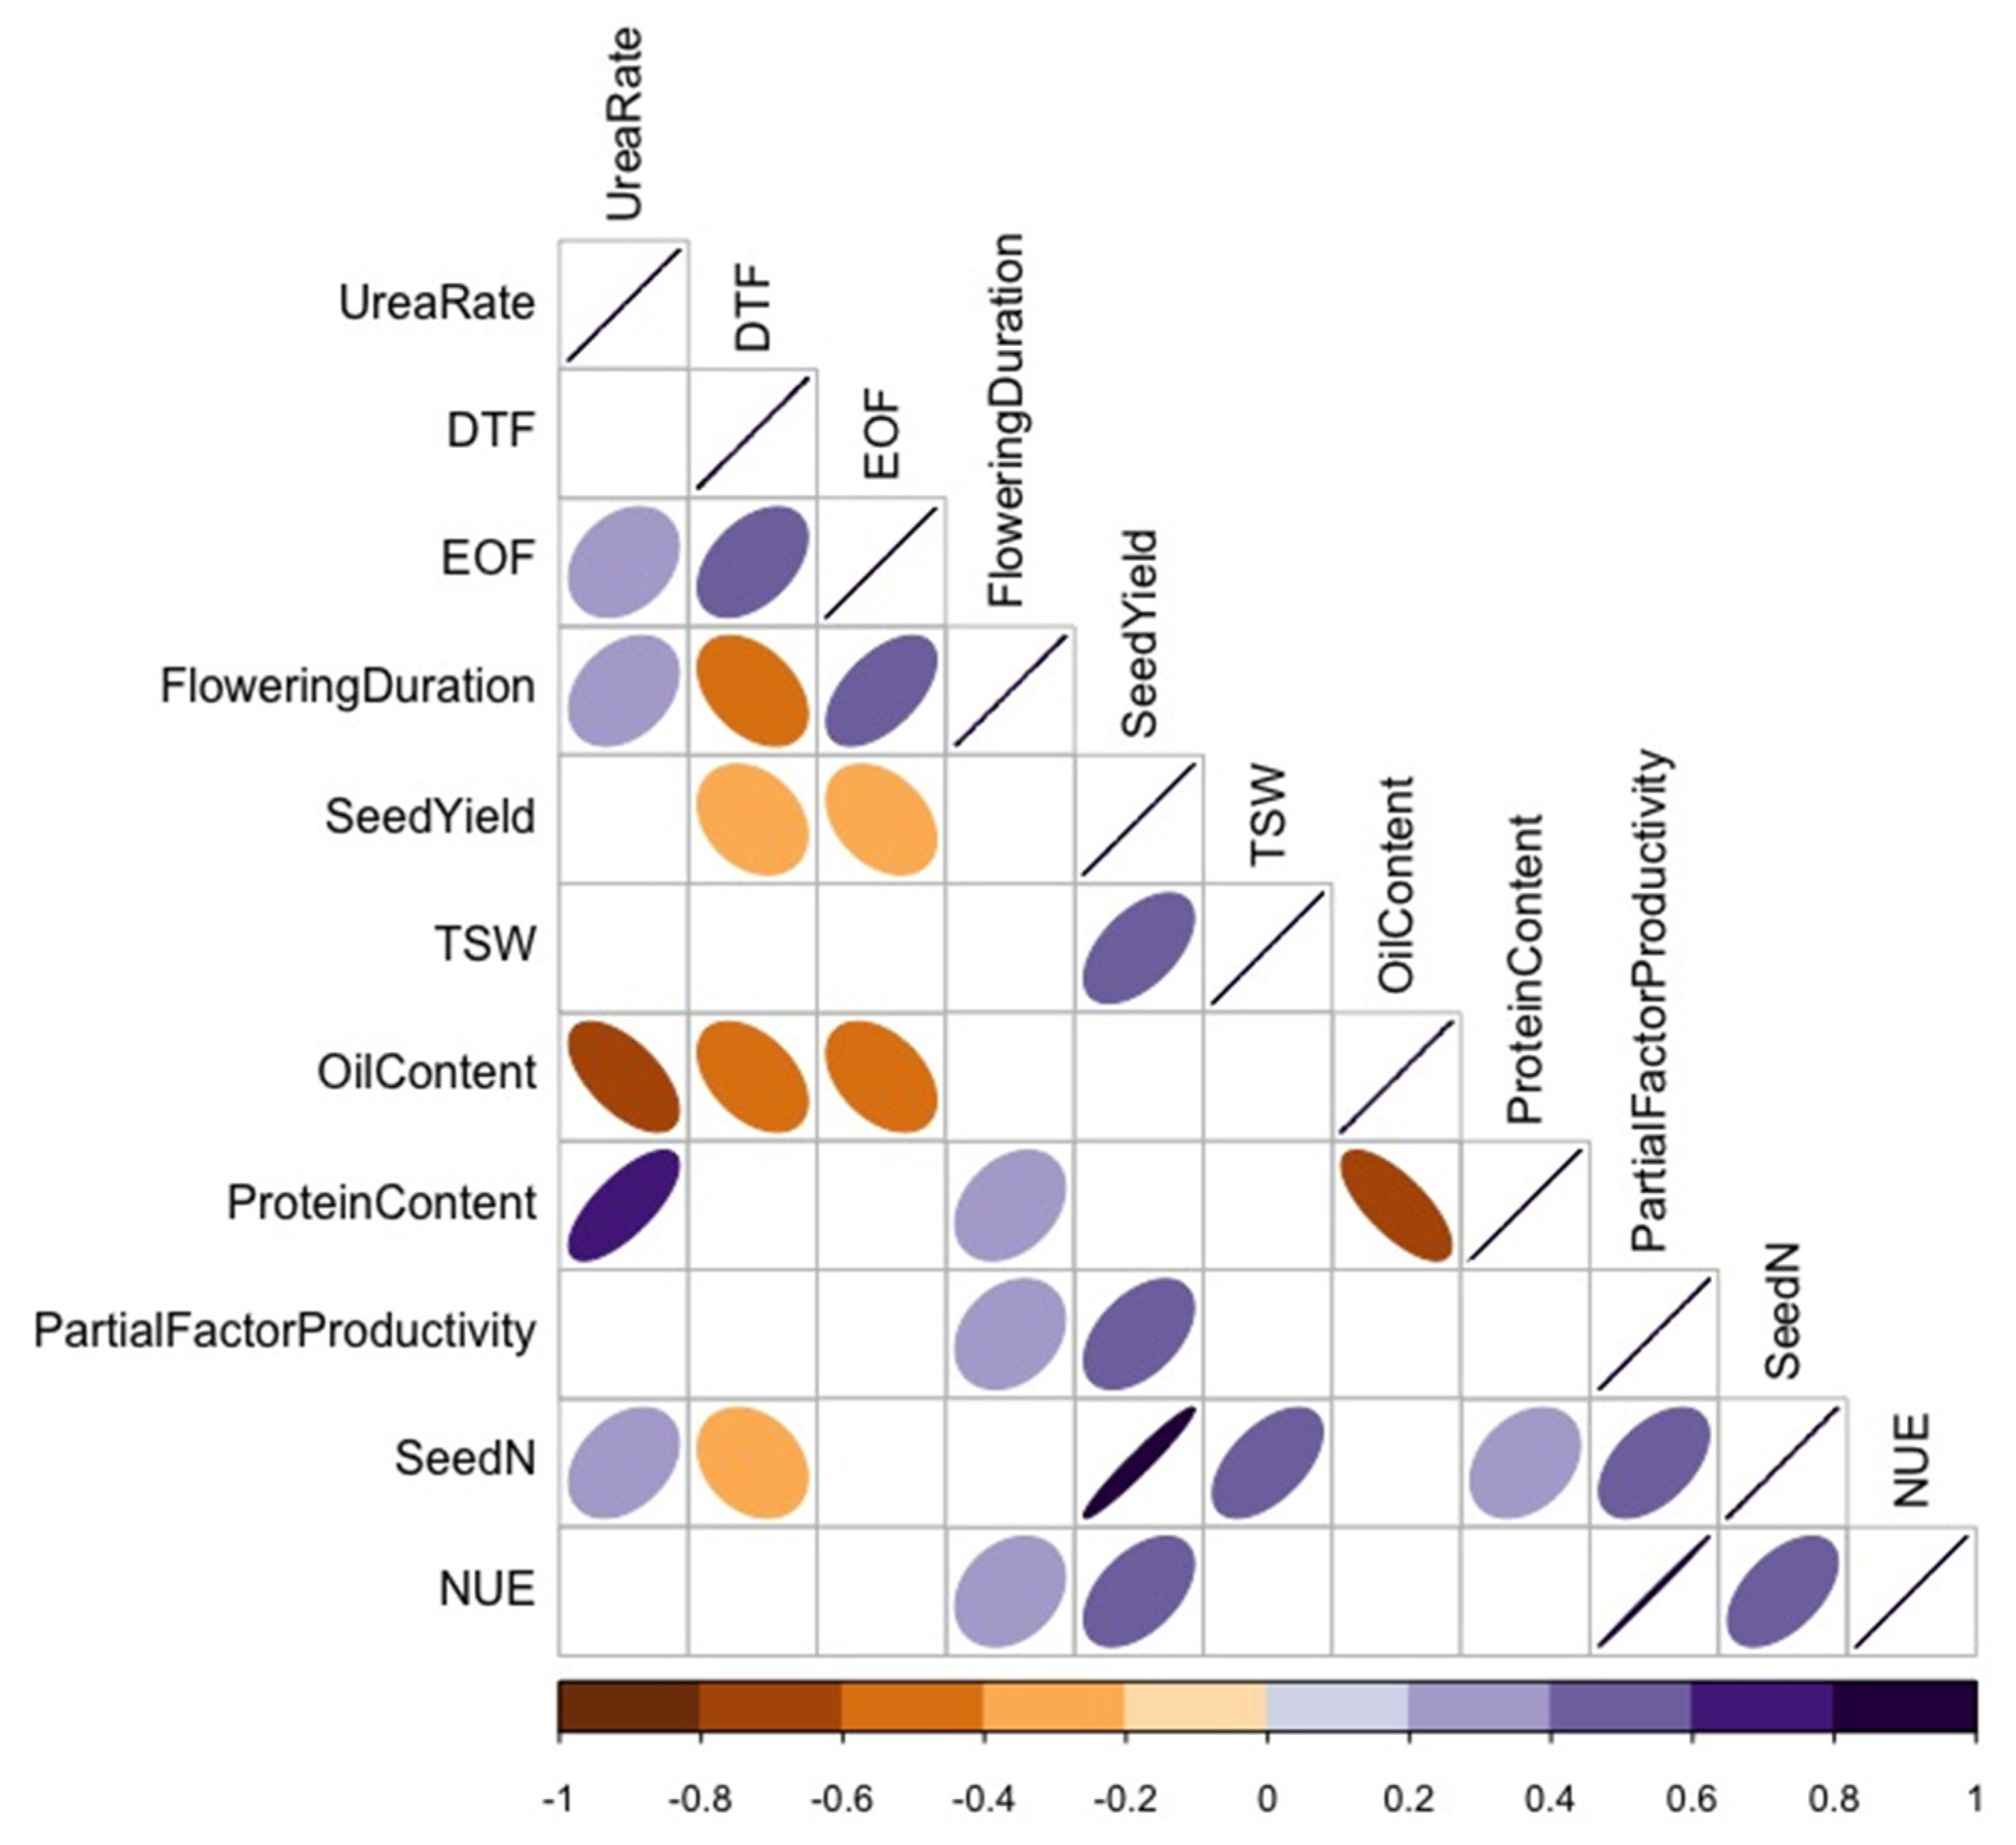
For Category B variables (Figure 7), TSW positively correlated with seed N uptake and seed yield. Seed yield negatively correlated with the end of flowering and flowering duration and positively correlated with partial factor productivity, seed N uptake, and NUE. As expected, seed protein content negatively correlated with seed oil content, and canola NUE positively correlated with flowering duration, seed yield, and seed N uptake. The correlations between 1) NUE and flowering duration and 2) NUE and the end of flowering were only significant for parent varieties (p < 0.05). Fertilizer N rate was positively correlated with seed protein content and negatively correlated with seed oil content. Flowering duration positively correlated with the end of flowering.
Category A soil variables collected at the 5–6 leaf stage were compared to Category B yield and NUE harvest metrics. Canola NUE positively correlated with potential ammonium oxidation rates (r = 0.30, p = 0.0216), urease activity (r = 0.26, p = 0.0520, marginally significant), NUtE (r = 0.31, p = 0.0173), and NUpE (r = 0.45, p = 0.0005), and negatively correlated with NH4+-N concentrations (r = −0.52, p < 0.0001). Seed yield negatively correlated with soil pH (r = −0.46, p = 0.0004) and potential ammonium oxidation rates (r = −0.28, p = 0.0320), and positively correlated with soil NH4+-N concentrations (r = 0.39, p = 0.0024) and plant NUtE (r = 0.24, p = 0.0713, marginally significant). Similarly, seed N uptake negatively correlated with soil pH (r = −0.40, p = 0.0021) and potential ammonium oxidation (r = −0.31, p = 0.0200), and positively correlated with soil NH4+-N (r = 0.49, p < 0.0001) and NO3−-N concentrations (r = 0.26, p = 0.0535, marginally significant).
Category A soil variables collected at flowering were also compared to Category B yield and NUE harvest metrics. Canola NUE negatively correlated with soil NH4+-N (r = −0.38, p = 0.0027) and NO3−-N concentrations (r = −0.45, p = 0.0003), and positively correlated with plant NUtE (r = 0.45, p = 0.0003). Seed yield negatively correlated with soil pH (r = −0.42, p = 0.0008), potential ammonium oxidation rates (r = −0.28, p = 0.0328), and urease activity (r = −0.30, p = 0.0204), and positively correlated with plant NUtE (r = 0.42, p = 0.0008). Likewise, seed N uptake negatively correlated with soil pH (r = −0.40, p = 0.0018), potential ammonium oxidation rates (r = −0.29, p = 0.0240), and urease activity (r = −0.27, p = 0.0337), and positively correlated with plant NUtE (r = 0.32, p = 0.0124).
3. Discussion
Previous studies have found variation in NUE among crop varieties, but they have focused mainly on above-ground plant traits [17,18,43,44,45], without regard for soil N cycling processes. Therefore, we examined soil N cycling and NUE in canola hybrids compared to parental genotypes under varying N rates. We hypothesized that canola varieties with higher NUE (and NUpE and NUtE) would be associated with increased soil N cycling and passive plant traits like higher thousand-seed weight (TSW), earlier start to flowering, and longer flowering duration. Since passive plant traits can affect yield and NUE in hybrid canola [17], we hypothesized that these traits might also positively influence hybrid yield and NUE in our study. Understanding the soil N processes that affect canola NUE can further build on recent advancements in understanding NUE across different crops [46,47,48,49] and improvements in breeding for N-efficient crop varieties [30].
We explored the hypothesis that canola varieties with higher soil N cycling would have higher NUE. A recent study proposed that higher NUE in hybrid canola may be associated with increased below-ground interactions that result in better scavenging of native soil and fertilizer N [15]. Although NUE was higher under hybrids than parental varieties, we did not observe varietal differences in soil N cycling, but rather a strong phenological effect. We demonstrated that canola NUE correlated positively with soil urease activity and potential ammonium oxidation rates at the 5–6 leaf stage. Greater soil N cycling resulted in higher concentrations of plant-available N, though plant phenology constrained these results. Ammonium oxidation rates were higher earlier in the growing season, likely driven by urea-N fertilizer application, resulting in higher soil NO3− concentrations for plant N uptake. As plants developed, soil NO3−-N concentrations declined, likely due to increased canola N demands [50]. Plant N uptake negatively correlated with soil NO3−-N concentrations, supporting this idea [39]. Therefore, the production of soil mineral N through soil N cycling likely resulted in high canola NUE, with greater soil N availability resulting in higher soil N acquisition. Our sampling depth was limited to the soil surface; expanding sampling depth, possibly to 40 cm, may better explain genotypic differences in soil N availability and N cycling since up to 85% of the canola root mass is located in the 0–40 cm soil depth [51]).
Soil NO3−-N concentrations declined as plants were in their reproductive phase and N demands increased, but soil NH4+-N increased and was unexpectedly higher than NO3−-N at flowering. These dynamics may be due to canola’s preference for soil NO3− over NH4+ [39] and changing dynamics in soil N cycling. For instance, NH4+ produced from higher mineralization (increase in urease activity) at flowering may not have been rapidly nitrified (decline in potential ammonium oxidation rates). Indeed, N mineralization may have been stimulated at flowering by root exudates when root exudation would be expectedly high because of greater root biomass [52,53,54,55]. Previous work has shown an increase in canola root biomass between late flowering and late pod filling [51]. Further, in a previous study, soil NO3− increased from the seedling to late-flowering stages, decreased between late flowering and late pod filling, and increased after that [50]. With the limited phenological stages in this study, it is likely that if we expanded our scope to include the seed ripening stage, we would have observed an increase in NO3−-N as the plants matured.
Canola N uptake increased with increasing urea-N fertilizer rates, as was expected [48,56], but a fertilizer N rate and variety interaction meant that varieties with similar N uptake at the lower fertilizer N rates did not have similar N uptake at the higher N rates. Parent and hybrid pairs had similar N accumulation at low N rates, while hybrids were more similar at the 100 kg ha−1 and 150 kg ha−1 N rates. We posit that hybrid and parent pairs had similar N uptake at lower urea-N fertilizer rates because of genotypic traits between the pairs and because hybrids were not receiving optimal N. At the 100 kg ha−1 and 150 kg ha−1 N rates, N uptake increased under both parents and hybrids. However, hybrids outperformed the parental varieties at these higher N rates, acquiring more N. Some studies revealed that hybrid canola responded to higher N availability over parental varieties because the N requirements for hybrids were higher than parental varieties, needing higher rates of fertilizer N [57,58]. However, NUpE did not follow the same patterns (though only marginally significant) and was higher at the 0 kg ha−1 N rate and lower at the 150 kg ha−1 N rate. There likely was an oversupply of N at the 150 kg ha−1 N rate. Canola NUtE decreased with increasing N rates, suggesting low N recovery and remobilization when fertilizer N was high. Our results also suggest that because NUpE and NUtE (significant predictors of canola NUE [17]) were lower at the higher N rates [56], there is a need to proportion fertilizer N rates to improve NUE. Indeed, canola NUE decreased with increasing urea-N fertilizer rates, possibly because of the limited ability of these varieties to transport plant N to seeds during N remobilization.
We predicted that soil N cycling rates would also respond positively to urea-N fertilizer rates, but neither urease activity nor potential ammonium oxidation rates were affected by urea-N fertilizer rates. For urease, this supports similar results from one meta-analysis [59]. However, in two more comprehensive meta-analyses, each analyzing larger datasets, it was determined that urease activity increased with increasing N rates in agricultural soils [40,60]. Similarly, a recent meta-analysis [61] indicated that potential ammonium oxidation rates increased with increasing fertilizer rates, contradicting our findings. It is possible that soil N cycling did not increase with increased urea-N fertilizer application because N was not deficient (though marginal based on pre-seeding soil tests) in our soil, providing native soil N for mineralization and nitrification.
Canola N uptake was more similar between corresponding parent and hybrid varieties, especially when plants were young. For example, at the 5–6 leaf stage, parental genotype NAM-0 and corresponding hybrid H151857 had higher NUpE than parental genotype NAM-17 and its corresponding hybrid, H151816. However, all varieties had similar NUpE rates by flowering, but these were more similar between related parent and hybrid varieties, suggesting an inherited trait for NUpE. Further, soil NO3−-N differences were not distinguishable between parent vs. hybrid varieties, but rather corresponding hybrid–parent pairs. For instance, at the 5–6 leaf stage, lower soil NO3−-N concentrations under parent genotype NAM-0 and corresponding hybrid H151857 indicated that plants absorbed much of the soil NO3−-N (or microorganisms immobilized soil NO3−-N) more rapidly than the NAM-17 and its corresponding hybrid. Though NAM-17 and its corresponding hybrid, H151816, had lower NUpE than NAM-0 and its corresponding hybrid, H151857, hybrid H151816 had higher NUtE, indicating an enhanced ability to remobilize plant N, even with reduced soil N absorption. At flowering, there were varietal-specific traits that potentially resulted in higher NUE. For example, hybrids surpassed the parental varieties in NUtE, ultimately leading to higher seed N uptake, yield, and NUE. Indeed, parent genotype NAM-17 was the most inefficient at N utilization at flowering and had the lowest yield and NUE. Further, NAM-17 seed yield stagnated after 50 kg ha−1 N because it had the lowest yield potential, whereas the other genotypes were more responsive to increasing urea-N fertilizer rates, at least up to 100 kg N ha−1. At 150 kg N ha−1, yields declined, suggesting that excessive N [62,63] likely caused lodging [64,65,66].
Plant N remobilization is important in canola NUE because when canola shifts from the vegetative to the generative phase, leaves senesce and are aborted before seed maturity [18,67]. Therefore, for increased NUE, N must be remobilized from leaves to stems, then to siliques, and finally to seeds under cases of complete remobilization [18,67]. Both hybrids had high NUtE at the 5–6 leaf stage and flowering. Therefore, higher NUtE might play a more critical role in high NUE in canola varieties than NUpE. Differences in maturity time may also explain varietal differences in NUE. Varieties that shift earlier from the vegetative to the generative developmental stage can have higher NUE because of the extended time for N remobilization and the longer seed developmental period [18]. Parent genotype NAM-17 took the longest to transition from the vegetative to the generative stage, was inefficient in N utilization, and had the lowest NUE. However, our results demonstrated that longer flowering duration did not necessarily lead to higher NUE. While flowering duration correlated positively with NUE, only hybrid variety H151857 had higher NUE and prolonged flowering duration. Parent genotype NAM-0 had a long flowering duration but did not have a high NUE. While an early switch from the vegetative to the generative stage can result in higher NUE [18], this increase may be limited to phenological stages after flowering, such as seed pod filling [67,68], and seems to be more varietal driven, though further research is needed.
We also explored the hypothesis that canola varieties with higher passive plant yield components would have higher NUE. Passive traits, such as TSW, may influence crop NUE—Stahl et al. determined that higher hybrid canola NUE related to increased seed TSW [17]. We also found that hybrids had higher seed TSW, but this did not correlate with NUE. We determined that NAM-17 and its corresponding hybrid, H151816, had a shorter flowering duration and later onset of flowering overall; this meant a prolonged switch from vegetative to generative growth, allowing for an extended period for N absorption and remobilization. At least for H151816, these passive traits could have allowed for higher NUE, while the hybrid variety H151857 could have had higher NUE because of its ability for high soil nitrate absorption earlier in the growing season.
4. Materials and Methods
4.1. Site Characteristics
The field experiment was conducted on a dark brown chernozem over one growing season in 2018 at the Agriculture and Agri-Food Canada Saskatoon Research Centre Farm in Saskatoon, SK, Canada (52°9′2.52″ N, 106°32′37.32″ W). Wheat was grown in this field before the present study. Table S1 reports the average daily spring and summer temperature and rainfall for the growing season [69], and Table S2 indicates pre-seeding soil properties, sowing date, and maturity date. Soil inorganic N prior to seeding was 26.9 kg ha−1 in the 0–15 cm soil profile and 56.0 kg ha−1 in the 15–60 cm soil profile, representing marginal N in relation to fertility recommendations for optimal yield.
4.2. Field Management and Experimental Design
The experimental design was a randomized split-plot design with four replications. Each main plot was 1.2 m wide and 5.94 m long and contained four rows spaced 0.3 m apart. The spacing between each replicate block—gaps between plots planted with barley within the blocks—was 0.6 m. Four urea-N fertilizer rates (0, 50, 100, and 150 kg ha−1) were randomly assigned to the main plots and four canola varieties (described below) to the sub-plots. The treatments were replicated four times to give a total of 64 experimental units. Seeds from all varieties were sown in rows at a 1.27 cm depth in May 2018, with a seeding rate of 1027 g/plot; seeds were pretreated with insecticide and fungicide (Helix® Vibrance®; Syngenta Canada Inc., Guelph, ON, Canada) before planting. Nitrogen was applied as urea (46% N) and was mid-row banded at seeding at rates of 50, 100, and 150 kg N ha−1. Control plots that did not receive urea (0 kg N ha−1) were included. Fertilizers for sulfur and phosphorus were added pre-seeding as 23.3 kg ha−1 ammonium sulfate and 39.8 kg ha−1 mono-ammonium phosphate, while potassium (K) fertilizer was not required due to naturally high K fertility in these soils (Table S2). Edge® granular herbicide (Gowan Company, Yuma, AZ, USA) was applied to the field in spring at 20.5 kg ha−1.
4.3. Canola Varieties
This study was comprised of four spring growth B. napus varieties: two parental genotypes and two experimental hybrids. Parental genotypes included NAM-0 and NAM-17, both from the Agriculture and Agri-Food Canada canola breeding program. The two genotypes were breeding lines selected for production in western Canada but had genetically different germplasms. The experimental hybrid combinations for this study included H151816 (where parental genotype NAM-17 was the male crossed with a female tester) and H151857 (where parental genotype NAM-0 was crossed with the same female tester).
4.4. Plant and Soil Sampling and Biomass Determination
Canola growth and development were recorded based on phenological growth stage [68]—above-ground plant samples were collected at the 5–6 leaf stage, flowering, and harvest maturity. The 5–6 leaf stage encompassed varieties at the 5-leaf, 6-leaf, and 5–6 leaf transition stage because of the varying emergence and growth rates among the different varieties. At the 5–6 leaf stage and flowering, plant roots and root-associated soils were collected using a soil corer (10 cm in length × 5 cm in diameter). We focused on the surface–10 cm depth because of higher soil microbial activity in this soil layer [70] and because soil nutrients and water are typically concentrated in this layer [51]. Canola roots were removed from the soil sample, and the soils were sieved (2 mm) and stored at −20 °C for nutrient and biochemical analyses. The above-ground plant material was cut from the roots and oven-dried at 60 °C for 72 h, then weighed. At harvest maturity, above-ground plant material was collected, and the number of plants was counted on an area basis (0.5 m × 0.5 m). Above-ground plant biomass was determined by multiplying individual plant dry biomass by the number of plants per 0.5 m × 0.5 m area. The start of flowering was determined when >50% of the plot had a minimum of one flower, the end of flowering was determined when >90% of the plants had no flowers remaining, and flowering duration was calculated as the number of days from the start of flowering to the end of flowering. Physiological maturity was determined when 50% of the seed color changed halfway up the main raceme, and harvest maturity represented the date when plants were harvested through direct cut. At maturity, the seed was mechanically harvested, and seed yield was determined by dividing the seed weight collected within a plot by the plot size per unit area. The thousand-seed weight (TSW) was determined based on the counting and weighing of 1000 seeds twice, from a representative 100 g aliquot from each sample.
4.5. Canola N Uptake and NUE Metrics
Total N concentration was determined for finely ground above-ground plant tissue samples and whole seed samples following the Dumas combustion protocol [71,72] using a TruMac analyzer (LECO Corporation, MI, USA). Nitrogen uptake was calculated by multiplying the amount of N at the individual level by the ratio of plant dry biomass per hectare over the individual plant dry biomass [17]. Seed oil and protein content were determined by near-infrared reflectance (NIR) [73]. A Foss NIRSystems Model 6500 analyzer calibrated with appropriate oilseed samples was used. The NIRSystems Model 6500 was calibrated with oilseed samples extracted with hexane [74] for oil content, and the NIRSystems Model 6500 was calibrated with oilseed samples whose protein contents had been determined prior [75] for protein content. Results were reported as a percentage on a whole seed dry matter (zero moisture) basis, and the NIR calibrations used in this study were certified through the Canadian Grain Commission’s WCC/RRC Laboratory Proficiency Program using known check samples.
Canola NUE metrics were calculated as suggested by Gan et al. [15] and Stahl et al. [17]. Canola NUpE was calculated by dividing the total above-ground plant N uptake by urea-N supplied, NUpE = plant N/(Nt + Nf). Specifically, Nt represents the N derived from the soil determined from the N uptake in above-ground plant biomass in control plots where no urea-N fertilizer was applied and soil was the sole N source, while Nf represents the amount of urea-N fertilizer applied [15]. Canola NUpE was determined at the 5–6 leaf stage and flowering because canola drops most of its leaves after flowering, and leaves represent a large N sink [18]. Canola NUtE was calculated as the ratio of seed yield at harvest maturity to N uptake in the plants at the 5–6 leaf stage and flowering (seed yield/plant N uptake) to account for the net effects of subcellular N recycling in the plants before leaves are lost [18]. Canola NUE was calculated by dividing seed N uptake by urea-N fertilizer [76,77], and partial factor productivity (PFP) was calculated by dividing seed yield by urea-N fertilizer [78].
4.6. Soil Analyses
Soil NO3−-N and NH4+-N were extracted using 2 M KCl, where field-fresh soil was weighed (5 g) and 50 mL of 2 M KCl was added to each sample [79]. Samples were shaken at 160 rpm for 30 min, then filtered through Whatman 42 filter paper. Filtered samples were analyzed using a Technicon Autoanalyzer (Technicon Industrial Systems, Tarrytown, NY, USA). Urease activity was determined for each sample [80]. Briefly, 5 g of each soil sample was weighed in triplicate and 2.5 mL of 720 mM urea substrate was added to two of the triplicates, leaving the third triplicate as a control. Next, 20 mL of 0.1 M borate buffer (pH = 10) was added to all samples, including the control, and samples were incubated for 2 h at 37 °C. After incubation, 2.5 mL of the substrate was added to the control solution, and the release of NH4+-N was extracted using 30 mL of a 2 M KCl–0.01 M HCl solution. The samples were shaken on a rotary shaker at 150 rpm for 30 min, after which the soil suspension was filtered. Samples were quantified along an NH4Cl calibration curve at 660 nm using a spectrophotometer (Thermo Scientific™ Evolution 60S) to determine the NH4+-N released. Potential ammonium oxidation rates, a proxy for ammonia monooxygenase activity, were determined [80]. Triplicate subsamples of 5 g of soil were weighed, and 20 mL of 1 mM ammonium sulfate solution and 0.1 mL of 1.5 M sodium chlorate solution were added to all triplicates. Two of the triplicates were incubated at 21 °C on a rotary shaker (150 rpm), and the third triplicate sample, serving as the control, was incubated at −20 °C; all samples were incubated for 5 h. After incubation, the control was thawed at room temperature, and 5 mL of 2 M KCl was added to the two triplicates, which were immediately filtered. The same was done for the control sample once it was thawed. Samples were quantified along a sodium nitrite (NaNO2) calibration curve at 520 nm using a spectrophotometer (Thermo Scientific™ Evolution 60S) to determine the nitrite released. Soil pH was determined by suspending air-dried soil samples in a 1:2 weight: volume ratio of 0.01 M CaCl2 solution [81].
4.7. Data Analysis
Our data were divided into two categories, Category A and Category B. Category A included soil and plant data collected from plot composite soil and plant samples at the 5–6 leaf stage and flowering, while Category B included plant data collected at harvest maturity on a per plot level, as well as days to flowering and flowering duration. The Category A data included the soil inorganic N and soil N cycling rates, plant biomass and N uptake, NUtE, and NUpE, while the Category B data included TSW, seed yield, seed N uptake, seed oil concentration, protein concentration, and NUE and PFP (partial factor productivity). Category A data were analyzed using mixed-effects analysis of variance with canola variety, N fertilizer rate, and phenological stage as fixed factors and replicate block and N fertilizer rate as the random factors. Category B data were also analyzed using mixed-effects analysis of variance with variety and N fertilizer rate as fixed factors and replicate block and N fertilizer rate as the random factors. For Category A and B models, variety was nested within N rate to account for the split-plot design. Canola varieties were nested within N rates because N rates were randomly assigned to each plot, then for each plot, canola varieties were randomly assigned to the split portions, creating different levels of randomization applied to each subject [82]. Data were tested for normality using the Shapiro–Wilk test—normality was assumed if p-values were greater than 0.05. Tukey HSD post hoc tests were used to determine significant differences between treatments.
All statistical analyses were conducted in R [83] using the packages ggpubr [84], nlme [85], lsmeans [86], and multcomp [87] and data visualization was conducted using the packages plyr [88], reshape2 [89], lattice [90], gridExtra [91], and ggplot2 [92]. Spearman’s rank correlation coefficient was conducted for all canola varieties with n = 128 (Category A variables, among phenological stages, block, and N rate) and n = 64 (Category B variables, among block and N rate), using the package Hmisc [93] for statistics and corrplot [94] for plotting.
5. Conclusions
This study revealed complex N dynamics in below-ground soil N processing and canola NUE. The objective of this study was to evaluate how canola varieties (hybrids vs. parent) under varying fertilizer urea-N rates affect (1) soil N cycling processes, (2) soil N concentration, and (3) plant NUE (including NUpE and NUtE); and how this varies over the growing season. We observed significant varietal differences in soil NO3−-N concentrations associated with higher plant NUpE at flowering when plant demand for N was higher. Hybrids had significantly higher seed yield and seed N allocation. Varietal differences in seed N uptake, seed yield, NUtE, and NUE related to hybrid canola efficiently using soil N and allocating N to the seeds. Hybrids had the highest NUE compared to the parental genotypes, potentially owing to their ability to have high NUpE (hybrid H151816 at flowering and H151857 at the 5–6 leaf stage) and high NUtE at flowering, a known bottleneck to canola NUE. Increasing urea-N fertilizer rates did not result in higher NUE, possibly because of saturated N uptake ability or N remobilization (NUpE and NUtE were highest at the lower N rates). The efficiency of hybrids to remobilize N for seed production allowed these varieties to maintain productivity even at the lower N rates. Beyond varietal differences, we demonstrated that canola NUE increased with decreasing soil mineral N—linked to increased N uptake. We also demonstrated critical relationships between soil N cycling and canola NUE, where soil N cycling positively correlated with NUE. Future studies should expand our knowledge of below-ground dynamics, focusing on microbial N cycling and soil N status, root exudate, and root system architecture, extending our measurements to greater soil depths. Future studies should also expand our knowledge of passive traits that affect NUE, especially the onset and duration of flowering. Varieties with extended vegetative periods should be selected because they will likely have higher N absorption and N remobilization with a prolonged vegetative stage.
Supplementary Materials
The following are available online at https://www.mdpi.com/article/10.3390/plants10112364/s1, Figure S1: Above-ground plant biomass over four diverse canola varieties and four varying N treatment rates at two phenological growth stages (5–6 leaf stage and flowering, n = 4). Figure S2: Canola N uptake over four diverse canola varieties and four varying N treatment rates at two phenological growth stages (5–6 leaf stage and flowering, n = 4). Table S1: Meteorological condition during the canola growing period for the 2018 season. Meteorological data obtained from Environment and Climate Change Canada. Table S2: Physio-chemical properties of study site prior to seeding in 2018.
Author Contributions
Conceptualization, S.V. and M.M.A.; investigation, S.T.W. and S.V.; resources, M.M.A. and S.V.; methodology, S.T.W. and S.V.; data curation, S.T.W.; formal analysis, S.T.W.; validation, S.T.W.; visualization, S.T.W.; writing—original draft preparation, S.T.W.; writing—review and editing, S.T.W., S.V. and M.M.A.; supervision, M.M.A.; project administration, M.M.A.; funding acquisition, S.V. and M.M.A. All authors have read and agreed to the published version of the manuscript.
Funding
This research was funded by: Canada First Research Excellence Fund through the Designing Crops for Global Food Security initiative at the University of Saskatchewan Theme 1 Phenometrics—Leveraging the power of precision digital phenotyping and genomics for crop breeding (Project 1.2, SV; Project 1.3, MA); the Canola AgriScience Cluster, funded through Agriculture and Agri-Food Canada’s Canadian Agricultural Partnership to the Canola Council of Canada, Alberta Canola, SaskCanola and the Manitoba Canola Growers Association to SV; joint funding from the Agricultural Development Fund from the Saskatchewan Ministry of Agriculture and SaskCanola to MA grant number ADF-20170182; and the Natural Science and Engineering Research Council of Canada Discovery Grant to MA grant number RGPIN-2016-04968. A SaskCanola and Robert P. Knowles scholarship to SW was also obtained.
Institutional Review Board Statement
Not applicable.
Informed Consent Statement
Not applicable.
Data Availability Statement
The data presented in this study are openly available in FigShare: “Canola nitrogen use efficiency and soil nitrogen cycling in response to varying nitrogen fertilizer rates across hybrid canola varieties and their parents”. Direct URL to data: https://doi.org/10.6084/m9.figshare.16654804.v4 (accessed on 21 September 2021) [95].
Acknowledgments
The development of the hybrids used in this study was only possible through collaborations with DL Seeds Inc. and Agriculture and Agri-Food Canada, including seed production supported by DL Seeds Inc. Field and crop management, harvest collection, and seed analyses were only possible through collaboration was Agriculture and Agri-Food Canada. We acknowledge research technicians Ranjan Kar, Gourango Kar, Elizabeth Shirley, and Dale Barks, as well as lab/field crew Erin White, Jacob Eberley, and Sarah Valentine. We thank Megan Horachek for assistance with the figures included in this manuscript and with the graphical abstract. The graphical abstract was created in BioRender.com (accessed on 30 September 2021).
Conflicts of Interest
The authors declare no conflict of interest.
References
- Statistics Canada Estimated Areas, Yield, Production, Average Farm Price and Total Farm Value of Principal Field Crops, in Metric and Imperial Units. 2020. Available online: https://www150.statcan.gc.ca/t1/tbl1/en/tv.action?pid=3210035901 (accessed on 30 August 2021).
- Grant, C.A.; Bailey, L.D. Fertility Management in Canola Production. Can. J. Plant Sci. 1993, 73, 651–670. [Google Scholar] [CrossRef]
- Hocking, P.J.; Stapper, M. Effects of Sowing Time and Nitrogen Fertiliser on Canola and Wheat, and Nitrogen Fertiliser on Indian Mustard. I. Dry Matter Production, Grain Yield, and Yield Components. Aust. J. Agric. Res. 2001, 52, 623–634. [Google Scholar] [CrossRef]
- Jackson, G.D. Effects of Nitrogen and Sulfur on Canola Yield and Nutrient Uptake. Agron. J. 2000, 92, 644–649. [Google Scholar] [CrossRef]
- Rathke, G.-W.; Christen, O.; Diepenbrock, W. Effects of Nitrogen Source and Rate on Productivity and Quality of Winter Oilseed Rape (Brassica napus L.) Grown in Different Crop Rotations. Field Crop. Res. 2005, 94, 103–113. [Google Scholar] [CrossRef]
- Schjoerring, J.K.; Bock, J.G.H.; Gammelvind, L.; Jensen, C.R.; Mogensen, V.O. Nitrogen Incorporation and Remobilization in Different Shoot Components of Field-Grown Winter Oilseed Rape (Brassica napus L.) as Affected by Rate of Nitrogen Application and Irrigation. Plant Soil 1995, 177, 255–264. [Google Scholar] [CrossRef]
- Sieling, K.; Christen, O.; Nemati, B.; Hanus, H. Effects of Previous Cropping on Seed Yield and Yield Components of Oil-Seed Rape (Brassica napus L.). Eur. J. Agron. 1997, 6, 215–223. [Google Scholar] [CrossRef]
- Sieling, K.; Christen, O. Effect of Preceding Crop Combination and N Fertilization on Yield of Six Oil-Seed Rape Cultivars (Brassica napus L.). Eur. J. Agron. 1997, 7, 301–306. [Google Scholar] [CrossRef]
- Taylor, A.J.; Smith, C.J.; Wilson, I.B. Effect of Irrigation and Nitrogen Fertilizer on Yield, Oil Content, Nitrogen Accumulation and Water Use of Canola (Brassica napus L.). Fertil. Res. 1991, 29, 249–260. [Google Scholar] [CrossRef]
- Tilman, D. Global Environmental Impacts of Agricultural Expansion: The Need for Sustainable and Efficient Practices. Proc. Natl. Acad. Sci. USA 1999, 96, 5995–6000. [Google Scholar] [CrossRef] [Green Version]
- Good, A.G.; Shrawat, A.K.; Muench, D.G. Can Less Yield More? Is Reducing Nutrient Input into the Environment Compatible with Maintaining Crop Production? Trends Plant Sci. 2004, 9, 597–605. [Google Scholar] [CrossRef]
- Gross, M. We Need to Talk about Nitrogen. Curr. Biol. 2012, 22, R1–R4. [Google Scholar] [CrossRef] [PubMed] [Green Version]
- Tilman, D.; Cassman, K.G.; Matson, P.A.; Naylor, R.; Polasky, S. Agricultural Sustainability and Intensive Production Practices. Nature 2002, 418, 671–677. [Google Scholar] [CrossRef] [PubMed]
- Ma, B.L.; Liang, B.C.; Biswas, D.K.; Morrison, M.J.; McLaughlin, N.B. The Carbon Footprint of Maize Production as Affected by Nitrogen Fertilizer and Maize-Legume Rotations. Nutr. Cycl. Agroecosyst. 2012, 94, 15–31. [Google Scholar] [CrossRef]
- Gan, Y.; Malhi, S.S.; Brandt, S.; Katepa-Mupondwa, F.; Stevenson, C. Nitrogen Use Efficiency and Nitrogen Uptake of Canola under Diverse Environments. Agron. J. 2008, 100, 285–295. [Google Scholar] [CrossRef]
- Malhi, S.S.; Gill, K.S. Interactive Effects of N and S Fertilizers on Canola Yield and Seed Quality on S-Deficient Gray Luvisol Soils in Northeastern Saskatchewan. Can. J. Plant Sci. 2007, 87, 211–222. [Google Scholar] [CrossRef] [Green Version]
- Stahl, A.; Vollrath, P.; Samans, B.; Frisch, M.; Wittkop, B.; Snowdon, R.J. Effect of Breeding on Nitrogen Use Efficiency-Associated Traits in Oilseed Rape. J. Exp. Bot. 2019, 70, 1969–1986. [Google Scholar] [CrossRef] [Green Version]
- Stahl, A.; Friedt, W.; Wittkop, B.; Snowdon, R.J. Complementary Diversity for Nitrogen Uptake and Utilisation Efficiency Reveals Broad Potential for Increased Sustainability of Oilseed Rape Production. Plant Soil 2016, 400, 245–262. [Google Scholar] [CrossRef]
- Moll, R.H.; Kamprath, E.J.; Jackson, W.A. Analysis and Interpretation of Factors Which Contribute to Efficiency of Nitrogen Utilization. Agron. J. 1982, 74, 562–564. [Google Scholar] [CrossRef]
- Drew, M.C.; Sacker, R.L.; Ashley, T.W. Nutrient Supply and the Growth of the Seminal Root System in Barley. J. Exp. Bot. 1973, 24, 1189–1202. [Google Scholar] [CrossRef]
- Gersani, M.; Sachs, T. Development Correlations between Roots in Heterogeneous Environments. Plant Cell Environ. 1992, 15, 463–469. [Google Scholar] [CrossRef]
- Granato, T.C.; Raper, C.D. Proliferation of Maize (Zea mays L.) Roots in Response to Localized Supply of Nitrate. J. Exp. Bot. 1989, 40, 263–275. [Google Scholar] [CrossRef] [PubMed]
- Gaju, O.; Allard, V.; Martre, P.; Snape, J.W.; Heumez, E.; LeGouis, J.; Moreau, D.; Bogard, M.; Griffiths, S.; Orford, S.; et al. Identification of Traits to Improve the Nitrogen-Use Efficiency of Wheat Genotypes. Field Crop. Res. 2011, 123, 139–152. [Google Scholar] [CrossRef]
- Swain, E.Y.; Rempelos, L.; Orr, C.H.; Hall, G.; Chapman, R.; Almadni, M.; Stockdale, E.A.; Kidd, J.; Leifert, C.; Cooper, J.M. Optimizing Nitrogen Use Efficiency in Wheat and Potatoes: Interactions between Genotypes and Agronomic Practices. Euphytica 2014, 199, 119–136. [Google Scholar] [CrossRef]
- Li, P.; Chen, F.; Cai, H.; Liu, J.; Pan, Q.; Liu, Z.; Gu, R.; Mi, G.; Zhang, F.; Yuan, L. A Genetic Relationship between Nitrogen Use Efficiency and Seedling Root Traits in Maize as Revealed by QTL Analysis. J. Exp. Bot. 2015, 66, 3175–3188. [Google Scholar] [CrossRef] [PubMed] [Green Version]
- Cassman, K.G.; Gines, G.C.; Dizon, M.A.; Samson, M.I.; Alcantara, J.M. Nitrogen-Use Efficiency in Tropical Lowland Rice Systems: Contributions from Indigenous and Applied Nitrogen. Field Crop. Res. 1996, 47, 1–12. [Google Scholar] [CrossRef]
- Sun, Y.; Ma, J.; Sun, Y.; Xu, H.; Yang, Z.; Liu, S.; Jia, X.; Zheng, H. The Effects of Different Water and Nitrogen Managements on Yield and Nitrogen Use Efficiency in Hybrid Rice of China. Field Crop. Res. 2012, 127, 85–98. [Google Scholar] [CrossRef]
- Anbessa, Y.; Juskiw, P.; Good, A.; Nyachiro, J.; Helm, J. Genetic Variability in Nitrogen Use Efficiency of Spring Barley. Crop Sci. 2009, 49, 1259–1269. [Google Scholar] [CrossRef]
- Sinebo, W.; Gretzmacher, R.; Edelbauer, A. Genotypic Variation for Nitrogen Use Efficiency in Ethiopian Barley. Field Crop. Res. 2004, 85, 43–60. [Google Scholar] [CrossRef]
- Grami, B.; Lacroix, L.J. Cultivar Variation in Total Nitrogen Uptake in Rape. Can. J. Plant Sci. 1977, 57, 619–624. [Google Scholar] [CrossRef]
- Bogard, M.; Allard, V.; Brancourt-Hulmel, M.; Heumez, E.; Machet, J.-M.; Jeuffroy, M.-H.; Gate, P.; Martre, P.; Le Gouis, J. Deviation from the Grain Protein Concentration–Grain Yield Negative Relationship Is Highly Correlated to Post-Anthesis N Uptake in Winter Wheat. J. Exp. Bot. 2010, 61, 4303–4312. [Google Scholar] [CrossRef] [Green Version]
- Foulkes, M.J.; Hawkesford, M.J.; Barraclough, P.B.; Holdsworth, M.J.; Kerr, S.; Kightley, S.; Shewry, P.R. Identifying Traits to Improve the Nitrogen Economy of Wheat: Recent Advances and Future Prospects. Field Crop. Res. 2009, 114, 329–342. [Google Scholar] [CrossRef]
- Pathan, S.I.; Ceccherini, M.T.; Pietramellara, G.; Puschenreiter, M.; Giagnoni, L.; Arenella, M.; Varanini, Z.; Nannpieri, P.; Renella, G. Enzyme Activity and Microbial Community Structure in the Rhizosphere of Two Maize Lines Differing in N Use Efficiency. Plant Soil 2015, 387, 413–424. [Google Scholar] [CrossRef]
- Emmett, B.D.; Buckley, D.H.; Smith, M.E.; Drinkwater, L.E. Eighty Years of Maize Breeding Alters Plant Nitrogen Acquisition but Not Rhizosphere Bacterial Community Composition. Plant Soil 2018, 431, 53–69. [Google Scholar] [CrossRef]
- Pathan, S.I.; Větrovský, T.; Giagnoni, L.; Datta, R.; Baldrian, P.; Nannipieri, P.; Renella, G. Microbial Expression Profiles in the Rhizosphere of Two Maize Lines Differing in N Use Efficiency. Plant Soil 2018, 433, 401–413. [Google Scholar] [CrossRef]
- Juan, Y.H.; Chen, L.J.; Wu, Z.J.; Wang, R. Kinetics of Soil Urease Affected by Urease Inhibitors at Contrasting Moisture Regimes. Rev. Cienc. Suelo Nutr. 2009, 9, 125–133. [Google Scholar] [CrossRef]
- Stark, J.M.; Firestone, M.K. Kinetic Characteristics of Ammonium-Oxidizer Communities in a California Oak Woodland-Annual Grassland. Soil Biol. Biochem. 1996, 28, 1307–1317. [Google Scholar] [CrossRef]
- Garnett, T.; Conn, V.; Kaiser, B.N. Root Based Approaches to Improving Nitrogen Use Efficiency in Plants. Plant Cell Environ. 2009, 32, 1272–1283. [Google Scholar] [CrossRef]
- Laine, P.; Ourry, A.; Macduff, J.; Boucaud, J.; Salette, J. Kinetic Parameters of Nitrate Uptake by Different Catch Crop Species: Effects of Low Temperatures or Previous Nitrate Starvation. Physiol. Plant 1993, 88, 85–92. [Google Scholar] [CrossRef]
- Chen, H.; Li, D.; Zhao, J.; Xiao, K.; Wang, K. Effects of Nitrogen Addition on Activities of Soil Nitrogen Acquisition Enzymes: A Meta-Analysis. Agric. Ecosyst. Environ. 2018, 252, 126–131. [Google Scholar] [CrossRef]
- Berg, P.; Rosswall, T. Ammonium Oxidizer Numbers, Potential and Actual Oxidation Rates in Two Swedish Arable Soils. Biol. Fert. Soils 1985, 1, 131–140. [Google Scholar] [CrossRef]
- Belser, L.W.; Mays, E.L. Specific Inhibition of Nitrite Oxidation by Chlorate and Its Use in Assessing Nitrification in Soils and Sediments. Appl. Environ. Microbiol. 1980, 39, 505–510. [Google Scholar] [CrossRef] [Green Version]
- Berry, P.M.; Spink, J.; Foulkes, M.J.; White, P.J. The Physiological Basis of Genotypic Differences in Nitrogen Use Efficiency in Oilseed Rape (Brassica napus L.). Field Crop. Res. 2010, 119, 365–373. [Google Scholar] [CrossRef]
- Lynch, J.M.; Schepers, J.S.; Ünver, I. Development Innovative Soil-Plant Systems for Sustainable Agricultural Practices. In Proceedings of the International Workshop Organised by the University of Ankara, Faculty of Agriculture, Department of Soil Science, Izmir, Turkey, 3–7 June 2002; OECD: Paris, France, 2003. ISBN 978-92-64-09971-5. [Google Scholar]
- Svečnjak, Z.; Rengel, Z. Canola Cultivars Differ in Nitrogen Utilization Efficiency at Vegetative Stage. Field Crop. Res. 2006, 97, 221–226. [Google Scholar] [CrossRef]
- Baraniya, D.; Puglisi, E.; Ceccherini, M.T.; Pietramellara, G.; Giagnoni, L.; Arenella, M.; Nannipieri, P.; Renella, G. Protease Encoding Microbial Communities and Protease Activity of the Rhizosphere and Bulk Soils of Two Maize Lines with Different N Uptake Efficiency. Soil Biol. Biochem. 2016, 96, 176–179. [Google Scholar] [CrossRef]
- Khan, S.; Anwar, S.; Kuai, J.; Ullah, S.; Fahad, S.; Zhou, G. Optimization of Nitrogen Rate and Planting Density for Improving Yield, Nitrogen Use Efficiency, and Lodging Resistance in Oilseed Rape. Front. Plant Sci. 2017, 8, 532–541. [Google Scholar] [CrossRef] [Green Version]
- Ma, B.L.; Herath, A.W. Timing and Rates of Nitrogen Fertiliser Application on Seed Yield, Quality and Nitrogen-Use Efficiency of Canola. Crop Pasture Sci. 2016, 67, 167–180. [Google Scholar] [CrossRef]
- Zamboni, A.; Astolfi, S.; Zuchi, S.; Pii, Y.; Guardini, K.; Tononi, P.; Varanini, Z. Nitrate Induction Triggers Different Transcriptional Changes in a High and a Low Nitrogen Use Efficiency Maize Inbred Line: Maize Root Transcriptome and Nitrate Induction. J. Integr. Plant Biol. 2014, 56, 1080–1094. [Google Scholar] [CrossRef]
- Gan, Y.; Campbell, C.A.; Janzen, H.H.; Lemke, R.L.; Basnyat, P.; McDonald, C.L. Nitrogen Accumulation in Plant Tissues and Roots and N Mineralization under Oilseeds, Pulses, and Spring Wheat. Plant Soil 2010, 332, 451–461. [Google Scholar] [CrossRef]
- Gan, Y.T.; Campbell, C.A.; Janzen, H.H.; Lemke, R.; Liu, L.P.; Basnyat, P.; McDonald, C.L. Root Mass for Oilseed and Pulse Crops: Growth and Distribution in the Soil Profile. Can. J. Plant Sci. 2009, 89, 883–893. [Google Scholar] [CrossRef]
- Palta, J.A.; Gregory, P.J. Drought Affects the Fluxes of Carbon to Roots and Soil in 13C Pulse-Labelled Plants of Wheat. Soil Biol. Biochem. 1997, 29, 1395–1403. [Google Scholar] [CrossRef]
- Palta, J.A.; Chen, X.; Milroy, S.P.; Rebetzke, G.J.; Dreccer, M.F.; Watt, M. Large Root Systems: Are They Useful in Adapting Wheat to Dry Environments? Funct. Plant Biol. 2011, 38, 347–354. [Google Scholar] [CrossRef] [PubMed] [Green Version]
- Monti, A.; Zatta, A. Root Distribution and Soil Moisture Retrieval in Perennial and Annual Energy Crops in Northern Italy. Agric. Ecosyst. Environ. 2009, 132, 252–259. [Google Scholar] [CrossRef]
- Passioura, J.B. Roots and Drought Resistance. Agric. Water Manag. 1983, 7, 265–280. [Google Scholar] [CrossRef]
- Chamorro, A.M.; Tamagno, L.N.; Bezus, R.; Sarandón, S.J. Nitrogen Accumulation, Partition, and Nitrogen-Use Efficiency in Canola under Different Nitrogen Availabilities. Commun. Soil Sci. Plant Anal. 2002, 33, 493–504. [Google Scholar] [CrossRef]
- Smith, E.G.; Upadhyay, B.M.; Favret, M.L.; Karamanos, R.E. Fertilizer Response for Hybrid and Open-Pollinated Canola and Economic Optimal Nutrient Levels. Can. J. Plant Sci. 2010, 90, 305–310. [Google Scholar] [CrossRef]
- Karamanos, R.E.; Goh, T.B.; Flaten, D.N. Nitrogen and Sulphur Fertilizer Management for Growing Canola on Sulphur Sufficient Soils. Can. J. Plant Sci. 2007, 87, 201–210. [Google Scholar] [CrossRef]
- Geisseler, D.; Scow, K.M. Long-Term Effects of Mineral Fertilizers on Soil Microorganisms—A Review. Soil Biol. Biochem. 2014, 75, 54–63. [Google Scholar] [CrossRef]
- Jian, S.; Li, J.; Chen, J.; Wang, G.; Mayes, M.A.; Dzantor, K.E.; Hui, D.; Luo, Y. Soil Extracellular Enzyme Activities, Soil Carbon and Nitrogen Storage under Nitrogen Fertilization: A Meta-Analysis. Soil Biol. Biochem. 2016, 101, 32–43. [Google Scholar] [CrossRef] [Green Version]
- Lu, M.; Yang, Y.; Luo, Y.; Fang, C.; Zhou, X.; Chen, J.; Yang, X.; Li, B. Responses of Ecosystem Nitrogen Cycle to Nitrogen Addition: A Meta-Analysis. New Phytol. 2011, 189, 1040–1050. [Google Scholar] [CrossRef]
- Cheema, M.A.; Malik, M.A.; Hussain, A.; Shah, S.H.; Basra, S.M.A. Effects of Time and Rate of Nitrogen and Phosphorus Application on the Growth and the Seed and Oil Yields of Canola (Brassica napus L.). J. Agron. Crop Sci. 2001, 186, 103–110. [Google Scholar] [CrossRef]
- Laaniste, P.; Joudu, J.; Eremeev, V. Oil Content of Spring Oilseed Rape Seeds According to Fertilisation. Agron. Res. 2004, 2, 83–86. [Google Scholar]
- Scott, R.K.; Ogunremi, E.A.; Ivins, J.D.; Mendham, N.J. The Effect of Fertilizers and Harvest Date on Growth and Yield of Oilseed Rape Sown in Autumn and Spring. J. Agric. Sci. 1973, 81, 287–293. [Google Scholar] [CrossRef]
- Sheppard, S.C.; Bates, T.E. Yield and Chemical Composition of Rape in Response to Nitrogen, Phosphorus and Potassium. Can. J. Soil. Sci. 1980, 60, 153–162. [Google Scholar] [CrossRef] [Green Version]
- Wright, G.C.; Smith, C.J.; Woodroofe, M.R. The Effect of Irrigation and Nitrogen Fertilizer on Rapeseed (Brassica Napes) Production in South-Eastern Australia: I. Growth and Seed Yield. Irrig. Sci. 1988, 9, 1–13. [Google Scholar] [CrossRef]
- Malagoli, P. Dynamics of Nitrogen Uptake and Mobilization in Field-Grown Winter Oilseed Rape (Brassica napus) from Stem Extension to Harvest: I. Global N Flows between Vegetative and Reproductive Tissues in Relation to Leaf Fall and Their Residual N. Ann. Bot. 2005, 95, 853–861. [Google Scholar] [CrossRef] [Green Version]
- Lancashire, P.D.; Bleiholder, H.; Boom, T.V.D.; Langelüddeke, P.; Stauss, R.; Weber, E.; Witzenberger, A. A Uniform Decimal Code for Growth Stages of Crops and Weeds. Ann. Appl. Biol. 1991, 119, 561–601. [Google Scholar] [CrossRef]
- Environment and Climate Change Canada. 2018. Available online: https://Climate.Weather.Gc.ca/Climate_data (accessed on 2 March 2020).
- Finzi, A.C.; Abramoff, R.Z.; Spiller, K.S.; Brzostek, E.R.; Darby, B.A.; Kramer, M.A.; Phillips, R.P. Rhizosphere Processes Are Quantitatively Important Components of Terrestrial Carbon and Nutrient Cycles. Glob. Chang. Biol. 2015, 21, 2082–2094. [Google Scholar] [CrossRef]
- Buckee, G.K. Determination of Total Nitrogen in Barley, Malt and Beer by Kjeldahl Procedures and the Dumas Combustion Method Collaborative Trial. J. Inst. Brew. 1994, 100, 57–64. [Google Scholar] [CrossRef]
- Dumas, J. Memoire Sur Quelques Points de La Théorie Atomistique. Ann. De Chim. Phys. 1826, 33, 33–55. [Google Scholar]
- American Oil Chemist Society Determination of Fatty Acids in Edible Oils and Fats by Capillary GLC. AOAC Official Method Ce Le-91; American Oil Chemist Society: Urbana, IL, USA, 1997; 3p. [Google Scholar]
- Raney, J.P.; Love, H.K.; Rakow, G.F.W.; Downey, R.K. An Apparatus for Rapid Preparation of Oil and Oil-Free Meal from Brassica Seed. Fett. Wiss. Technol. 1987, 89, 235–237. [Google Scholar] [CrossRef]
- AOCS. Official Method Ba 4e-93 AOCS Official Method Ba 4e-93, Revised 2003: Generic Combustion Method for Determination of Crude Protein Using a LECO FP-528 Protein Analyzer; American Oil Chemist Society: Urbana, IL, USA, 2003. [Google Scholar]
- Martinez-Feria, R.A.; Castellano, M.J.; Dietzel, R.N.; Helmers, M.J.; Liebman, M.; Huber, I.; Archontoulis, S.V. Linking Crop- and Soil-Based Approaches to Evaluate System Nitrogen-Use Efficiency and Tradeoffs. Agric. Ecosyst. Environ. 2018, 256, 131–143. [Google Scholar] [CrossRef]
- Congreves, K.A.; Otchere, O.; Ferland, D.; Farzadfar, S.; Williams, S.; Arcand, M.M. Nitrogen Use Efficiency Definitions of Today and Tomorrow. Front. Plant Sci. 2021, 12, 1–10. [Google Scholar] [CrossRef]
- Dobermann, A. Nutrient Use Efficiency. Measurement and Management. In Fertilizers Best Management Practices, Proceeding of the International Fertilizer Industry Association, Brussels, Belgium, 7–9 March 2007; Kraus, A., Isherwood, K., Heffer, P., Eds.; International Fertilizer Industry Association: Paris, France, 2007; pp. 1–22. [Google Scholar]
- Maynard, D.G.; Kalra, Y.P.; Crumbaugh, J.A. Nitrate and exchangeable ammonium nitrogen. In Soil Sampling and Methods for Analysis; CRC Press: Boca Raton, FL, USA, 2008; pp. 71–75. [Google Scholar]
- Dick, R.P. Methods of Soil Enzymology; Soil Science Society of America, Inc.: Madison, WI, USA, 2011. [Google Scholar]
- Hendershot, W.H.; Lalande, H.; Duquette, M. Soil reaction and exchangeable acidity. In Soil Sampling and Methods of Analysis, 2nd ed.; CRC Press: Boca Raton, FL, USA, 2008; pp. 173–178. [Google Scholar]
- Altman, N.; Krzywinski, M. Split Plot Design. Nat. Methods 2015, 12, 165–166. [Google Scholar] [CrossRef] [PubMed]
- R Core Team R. A Language and Environment for Statistical Computing; R Foundation for Statistical Computing: Vienna, Austria, 2017; Available online: https://www.R-project.org/ (accessed on 29 January 2020).
- Kassambara, A. R Package Ggpubr: “ggplot2” Based Publication Ready Plots. R Package Version 0.4.0. 2020. Available online: https://CRAN.R-project.org/Package=ggpubr (accessed on 29 January 2020).
- Pinheiro, J.; Bates, D.; DebRoy, S.; Sarkar, D. R Core Team R Package nlme: Linear and Nonlinear Mixed Effects Models_. R Package Version 3.1-137. 2018. Available online: https://CRAN.R-project.org/Package=nlme (accessed on 29 January 2020).
- Lenth, R.V. Least-Squares Means: The R Package Lsmeans. J. Stat. Soft. 2016, 69. Available online: http://www.jstatsoft.org/v69/i01/ (accessed on 29 January 2020). [CrossRef] [Green Version]
- Hothorn, T.; Bretz, F.; Westfall, P. Simultaneous Inference in General Parametric Models. Biom. J. 2008, 50, 346–363. [Google Scholar] [CrossRef] [PubMed] [Green Version]
- Wickham, H. The Split-Apply-Combine Strategy for Data Analysis. J. Stat. Softw. 2011, 40, 1–29. [Google Scholar] [CrossRef] [Green Version]
- Wickham, H. Reshaping Data with the Reshape Package. J. Stat. Softw. 2007, 21, 1–20. Available online: http://www.jstatsoft.org/V21/I12/ (accessed on 30 January 2020). [CrossRef]
- Sarkar, D. Lattice: Multivariate Data Visualization with R.; Springer: New York, NY, USA, 2008; ISBN 978-0-387-75968-5. [Google Scholar]
- Auguie, B. GridExtra: Miscellaneous Functions for “Grid” Graphics. R Package Version 2.3. 2017. Available online: https://CRAN.R-project.org/Package=gridExtra (accessed on 29 January 2020).
- Wickham, H. R Package Ggplot2: Elegant Graphics for Data Analysis; Springer: New York, NY, USA, 2016. [Google Scholar]
- Harrell, F.E., Jr. With Contributions from Charles Dupont and Many Others. Hmisc: Harrell Miscellaneous. R Package Version 4.2-0. 2019. Available online: https://CRAN.R-project.org/Package=Hmisc (accessed on 24 August 2021).
- Wei, T.; Simko, V. R Package “Corrplot”: Visualization of a Correlation Matrix (Version 0.84). 2017. Available online: https://github.com/taiyun/corrplot (accessed on 29 January 2020).
- Williams, S.T.; Vail, S.; Arcand, M.M. [Dataset] Canola Nitrogen Use Efficiency and Soil Nitrogen Cycling in Response to Varying Nitrogen Fertilizer Rates across Hybrid Canola Varieties and Their Parents. 2021. Available online: https://doi.org/10.6084/m9.figshare.16654804.v4 (accessed on 21 September 2021).
Figure 1.
Soil ammonium-N concentration (mg NH4+-N kg−1 soil) and soil nitrate concentration (mg NO3−-N kg−1 soil) over four diverse canola varieties and four varying urea-N treatment rates at two phenological growth stages (5–6 leaf stage and flowering, n = 4).
Figure 1.
Soil ammonium-N concentration (mg NH4+-N kg−1 soil) and soil nitrate concentration (mg NO3−-N kg−1 soil) over four diverse canola varieties and four varying urea-N treatment rates at two phenological growth stages (5–6 leaf stage and flowering, n = 4).

Figure 2.
Potential ammonium oxidase rate (µg NO2-N g−1 5 h−1) and urease activity (µg NH4+ g−1 2 h−1) over four diverse canola varieties and four varying urea-N treatment rates at two phenological growth stages (5–6 leaf stage and flowering, n = 4).
Figure 2.
Potential ammonium oxidase rate (µg NO2-N g−1 5 h−1) and urease activity (µg NH4+ g−1 2 h−1) over four diverse canola varieties and four varying urea-N treatment rates at two phenological growth stages (5–6 leaf stage and flowering, n = 4).

Figure 3.
Canola (top) N uptake efficiency and (bottom) N utilization efficiency over four diverse canola varieties and four varying N treatment rates at two phenological growth stages (5–6 leaf stage and flowering, n = 4).
Figure 3.
Canola (top) N uptake efficiency and (bottom) N utilization efficiency over four diverse canola varieties and four varying N treatment rates at two phenological growth stages (5–6 leaf stage and flowering, n = 4).

Figure 4.
Yield (kg ha−1) and seed N uptake (kg ha−1) over four diverse canola varieties and four varying N treatment rates (n = 4).
Figure 4.
Yield (kg ha−1) and seed N uptake (kg ha−1) over four diverse canola varieties and four varying N treatment rates (n = 4).

Figure 5.
Nitrogen use efficiency (NUE) and partial factor productivity over four diverse canola varieties and three varying N treatment rates (n = 4).
Figure 5.
Nitrogen use efficiency (NUE) and partial factor productivity over four diverse canola varieties and three varying N treatment rates (n = 4).

Figure 6.
Spearman’s rank correlation coefficient (p < 0.05) of Category A variables showing correlation (r) among urea-N rates, days after sowing (DAS), plant biomass, nitrogen uptake efficiency (NUpE), nitrogen utilization efficiency (NUtE), ammonium-N, nitrate-N, ammonium oxidation, urease, plant N content, N uptake, and pH in varying canola varieties. Colours and shapes of ellipses indicate the strength of the correlations, with only significant correlations at a confidence level of 95% depicted. Positive and negative correlations are depicted by the respective direction of each ellipse, and positive correlations are depicted with the colour purple and negative correlations are depicted with the colour orange.

Figure 7.
Spearman’s rank correlation coefficient (p < 0.05) of Category B variables showing correlation (r) among urea-N rate, % oil content, nitrogen use efficiency (NUE), thousand-seed weight (TSW), seed yield, seed N, start of flowering (DTF), % protein content, end of flowering (EOF), partial factor productivity, and duration of flowering in varying canola varieties. Colours and shapes of ellipses indicate the strength of the correlations, with only significant correlations at a confidence level of 95% depicted. Positive and negative correlations are depicted by the respective direction of each ellipse, and positive correlations are depicted with the colour purple and negative correlations are depicted with the colour orange.


Table 1.
ANOVA of Category A variables under four varying urea-N fertilizer rates. V: canola varieties; NR: urea-N fertilizer rates; PS: phenological stage; NUtE: nitrogen utilization efficiency; NUpE: nitrogen uptake efficiency.
Table 1.
ANOVA of Category A variables under four varying urea-N fertilizer rates. V: canola varieties; NR: urea-N fertilizer rates; PS: phenological stage; NUtE: nitrogen utilization efficiency; NUpE: nitrogen uptake efficiency.
| Factors | Urease Rate (μg NH4+ g−1 2 h−1) | Potential Ammonium Oxidation Rate (μg NO2−-N g−1 5 h−1) | Soil NO3−-N (mg kg−1) | Soil NH4+-N (mg kg−1) | Soil pH | Plant Biomass (kg ha−1) | N Uptake (kg ha−1) | NUtE | NUpE |
|---|---|---|---|---|---|---|---|---|---|
| V | 0.4652 | 0.6585 | 0.3542 | 0.6169 | 0.9723 | 0.5262 | 0.6483 | 0.0010 | 0.9405 |
| NR | 0.7557 | 0.5350 | 0.0010 | 0.0002 | 0.6209 | 0.2569 | 0.0260 | 0.0944 | 0.0703 |
| PS | 0.0001 | 0.0003 | <0.0001 | 0.8743 | 0.0069 | <0.0001 | <0.0001 | <0.0001 | <0.0001 |
| V × NR | 0.8916 | 0.9317 | 0.5148 | 0.4735 | 0.3033 | 0.0777 | 0.0442 | 0.1118 | 0.0549 |
| V × PS | 0.3135 | 0.9281 | 0.0055 | 0.1268 | 0.9152 | 0.0001 | 0.0001 | 0.0003 | 0.0029 |
| NR × PS | 0.1238 | 0.1623 | 0.2954 | 0.0072 | 0.9829 | 0.7930 | 0.1824 | 0.2440 | 0.0107 |
| V × NR × PS | 0.8061 | 0.2085 | 0.2273 | 0.9610 | 0.9677 | 0.1556 | 0.1868 | 0.2424 | 0.1588 |
Significant at the 0.05 probability level is represented in bold font. Significance at the 0.1 probability level is represented in italic font.
Table 2.
ANOVA of Category B variables under four varying urea-N fertilizer rates. V: canola varieties; NR: urea-N fertilizer rates; TSW: thousand-seed weight; NUE: nitrogen use efficiency.
Table 2.
ANOVA of Category B variables under four varying urea-N fertilizer rates. V: canola varieties; NR: urea-N fertilizer rates; TSW: thousand-seed weight; NUE: nitrogen use efficiency.
| Factors | Start of Flowering (Julian Days) | End of Flowering (Julian Days) | Flowering Duration (No. of Days) | Yield (kg ha−1) | Seed N (kg ha−1 N) | TSW (g) | Seed Oil (%) | Seed Protein (%) | Partial-Factor Productivity | NUE |
|---|---|---|---|---|---|---|---|---|---|---|
| Treatments | ||||||||||
| V | <0.0001 | <0.0001 | <0.0001 | <0.0001 | <0.0001 | <0.0001 | 0.0001 | 0.3820 | <0.0001 | <0.0001 |
| NR | 0.3128 | 0.0137 | 0.0025 | 0.0149 | 0.0006 | 0.4138 | 0.0040 | 0.0015 | <0.0001 | <0.0001 |
| Interaction | ||||||||||
| V × NR | 0.0350 | 0.2819 | 0.4411 | 0.3764 | 0.3163 | 0.6557 | 0.7850 | 0.8069 | 0.6689 | 0.8216 |
Significant at the 0.05 probability level is represented in bold font.
Publisher’s Note: MDPI stays neutral with regard to jurisdictional claims in published maps and institutional affiliations. |
© 2021 by the authors. Licensee MDPI, Basel, Switzerland. This article is an open access article distributed under the terms and conditions of the Creative Commons Attribution (CC BY) license (https://creativecommons.org/licenses/by/4.0/).
Share and Cite
MDPI and ACS Style
Williams, S.T.; Vail, S.; Arcand, M.M. Nitrogen Use Efficiency in Parent vs. Hybrid Canola under Varying Nitrogen Availabilities. Plants 2021, 10, 2364. https://doi.org/10.3390/plants10112364
AMA Style
Williams ST, Vail S, Arcand MM. Nitrogen Use Efficiency in Parent vs. Hybrid Canola under Varying Nitrogen Availabilities. Plants. 2021; 10(11):2364. https://doi.org/10.3390/plants10112364
Chicago/Turabian StyleWilliams, Shanay T., Sally Vail, and Melissa M. Arcand. 2021. "Nitrogen Use Efficiency in Parent vs. Hybrid Canola under Varying Nitrogen Availabilities" Plants 10, no. 11: 2364. https://doi.org/10.3390/plants10112364
Note that from the first issue of 2016, this journal uses article numbers instead of page numbers. See further details here.