Clinical Evaluation of Acetaminophen–Galgeuntang Interaction Based on Population Approaches

 , , , ,
Abstract
:1. Introduction
2. Materials and Methods
2.1. Materials
2.2. Participants
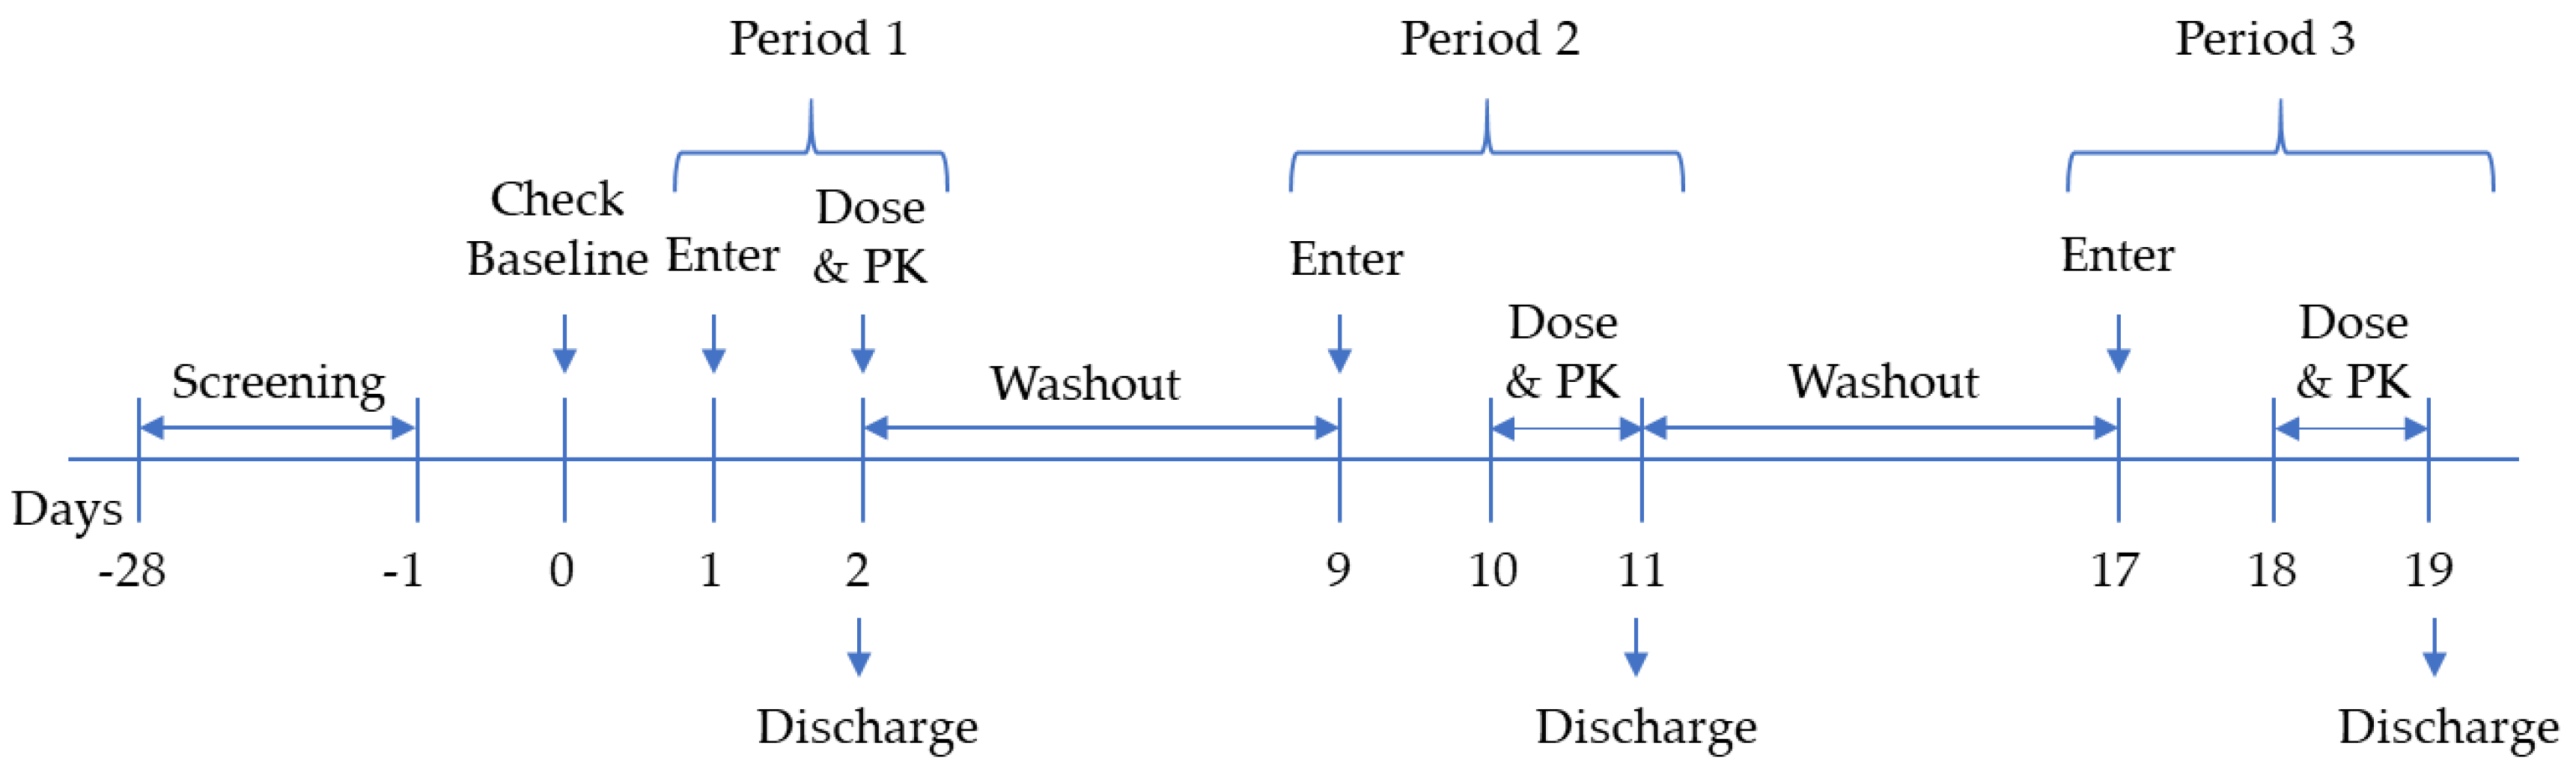
2.3. Clinical Trial
2.4. Drug Quantification
2.5. Non-Compartmental PK Analysis
2.6. Population PK Analysis
2.7. Simulation Scenarios
3. Results
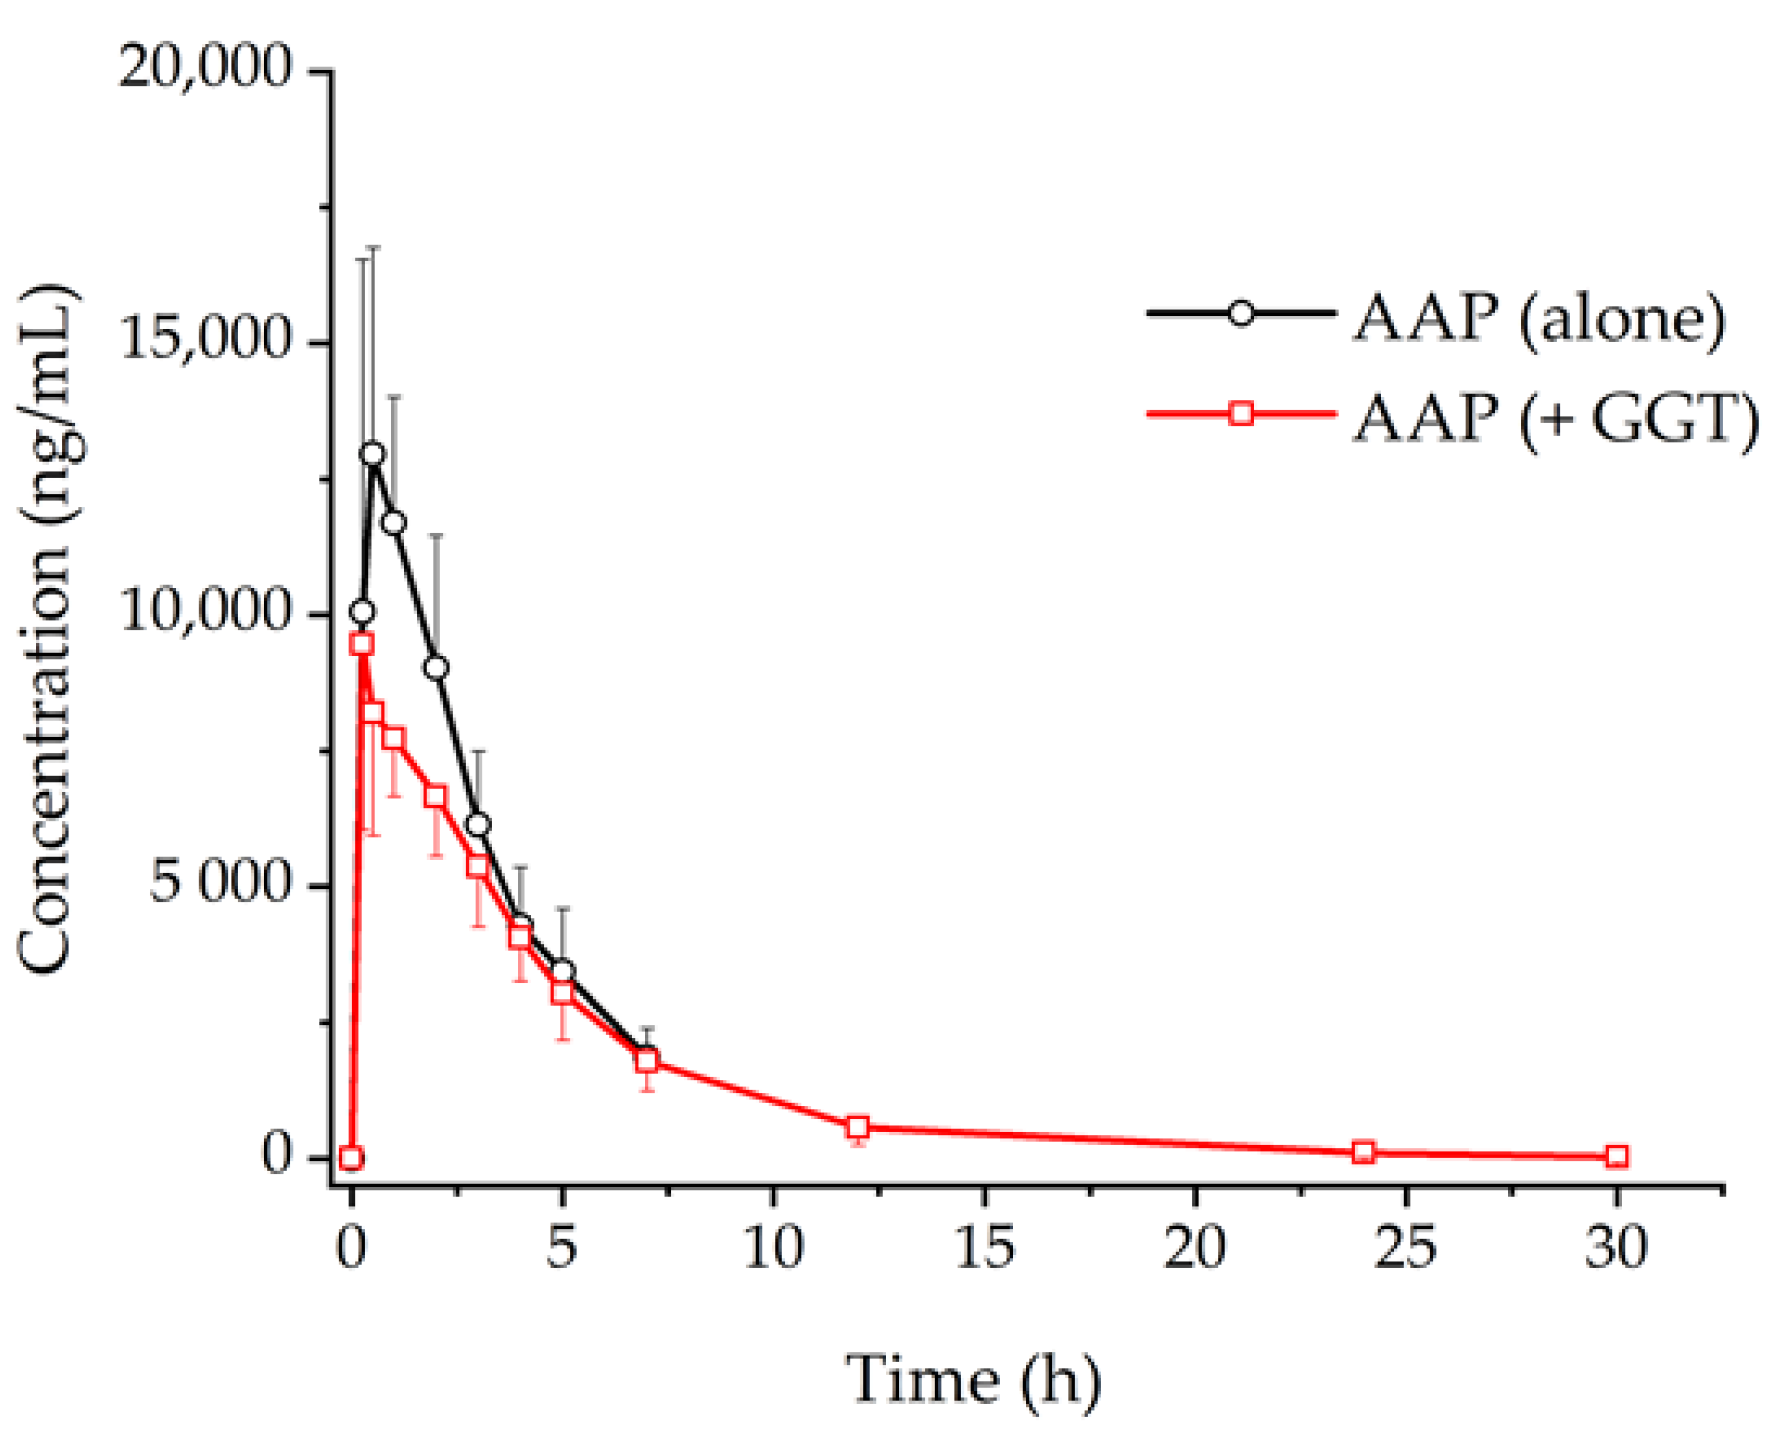
3.1. Non-Compartmental PK Analysis
3.2. Population PK Analysis
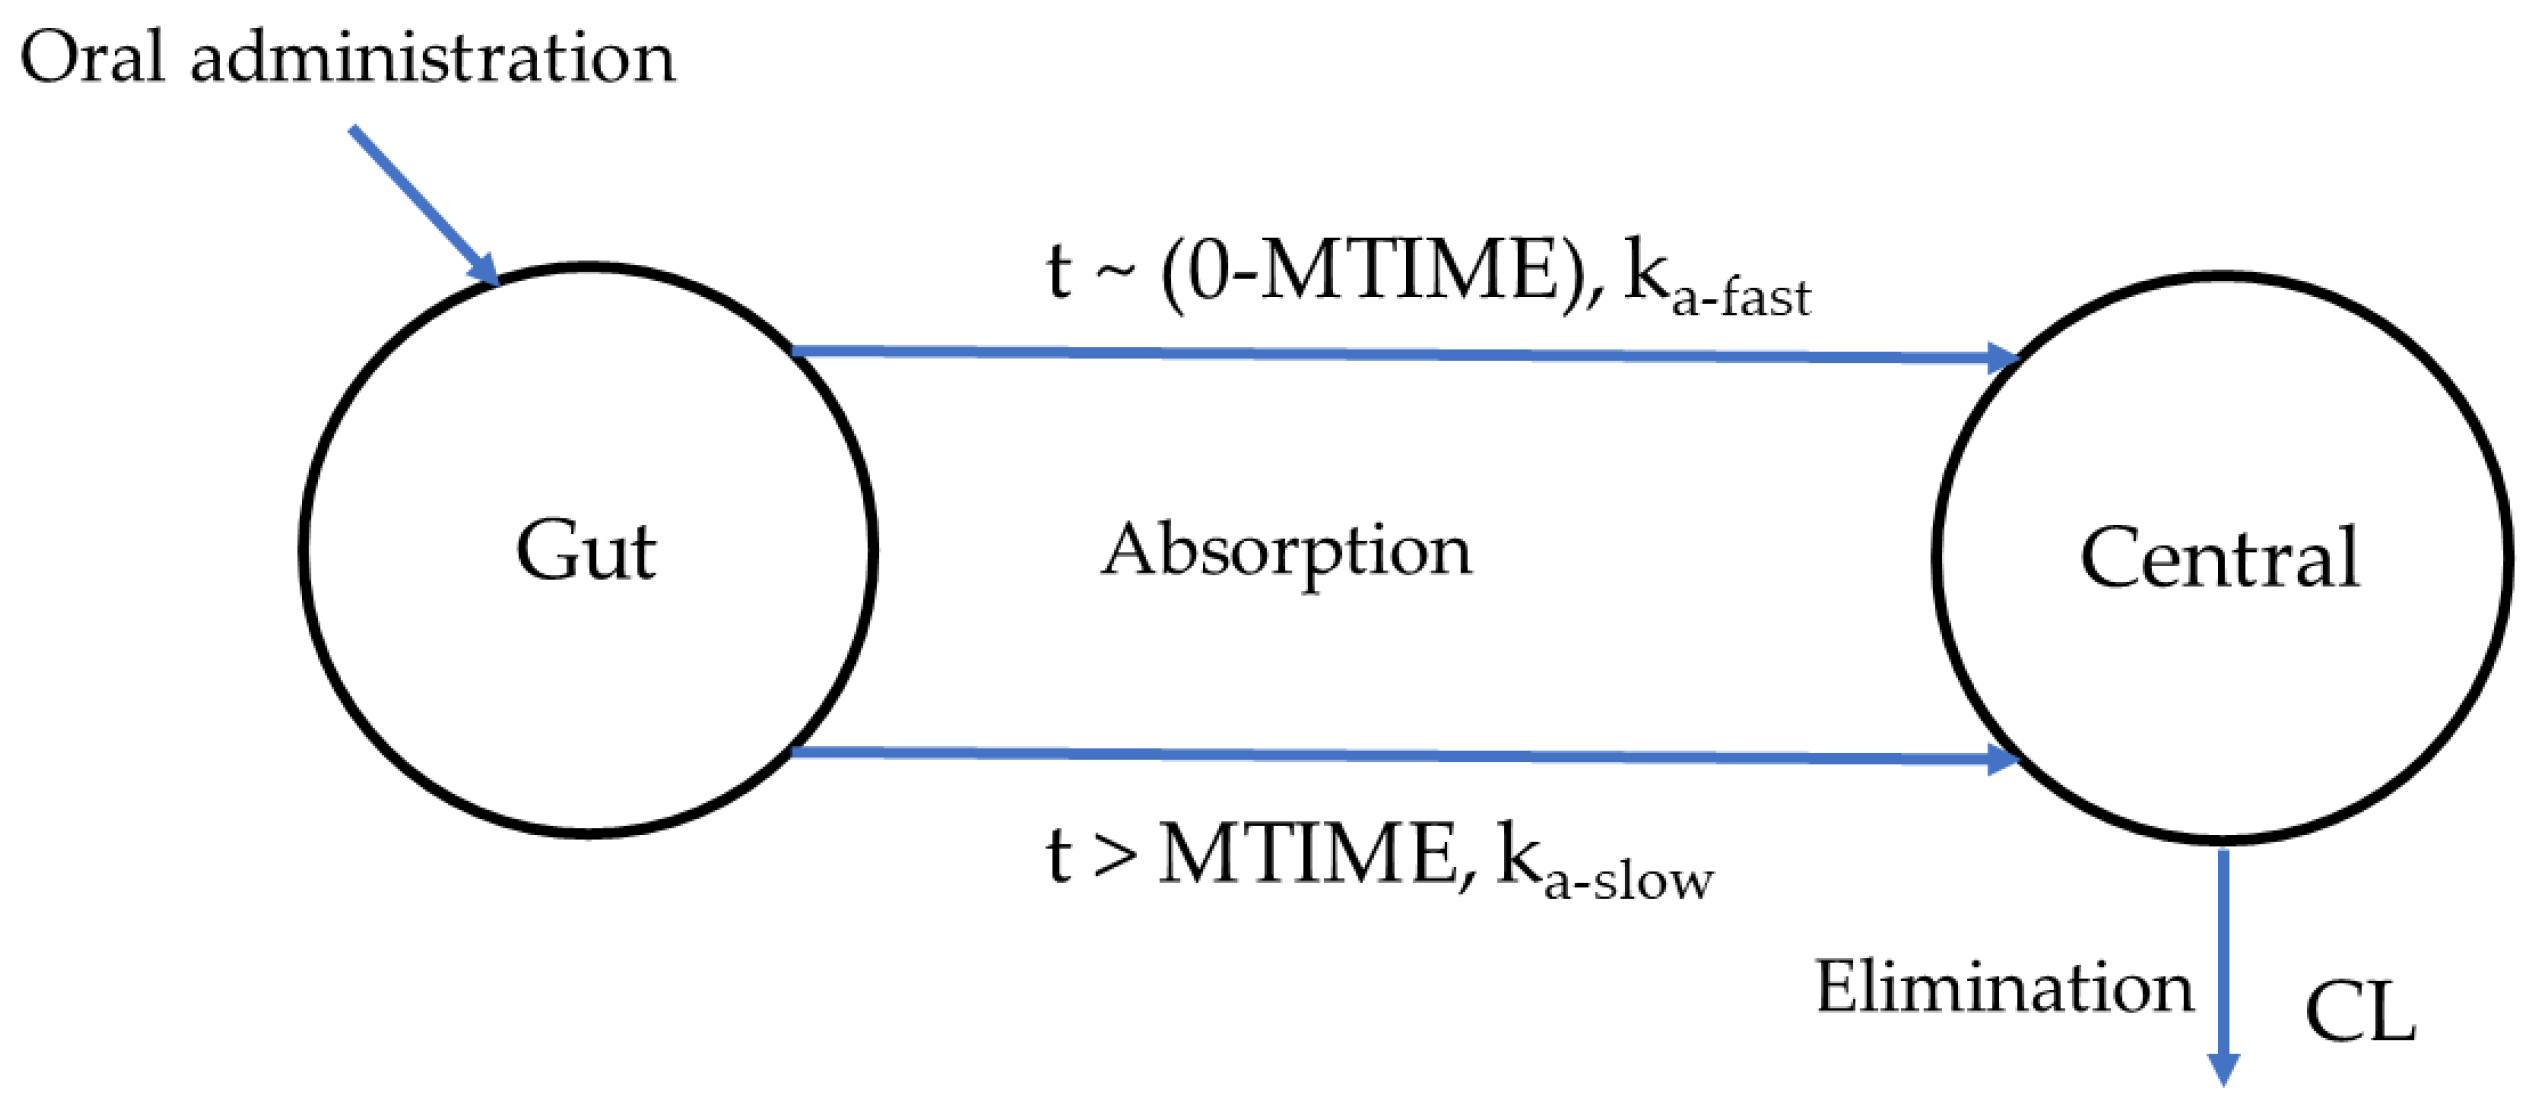
3.2.1. Base Model
3.2.2. Covariate Model and Drug Interactions
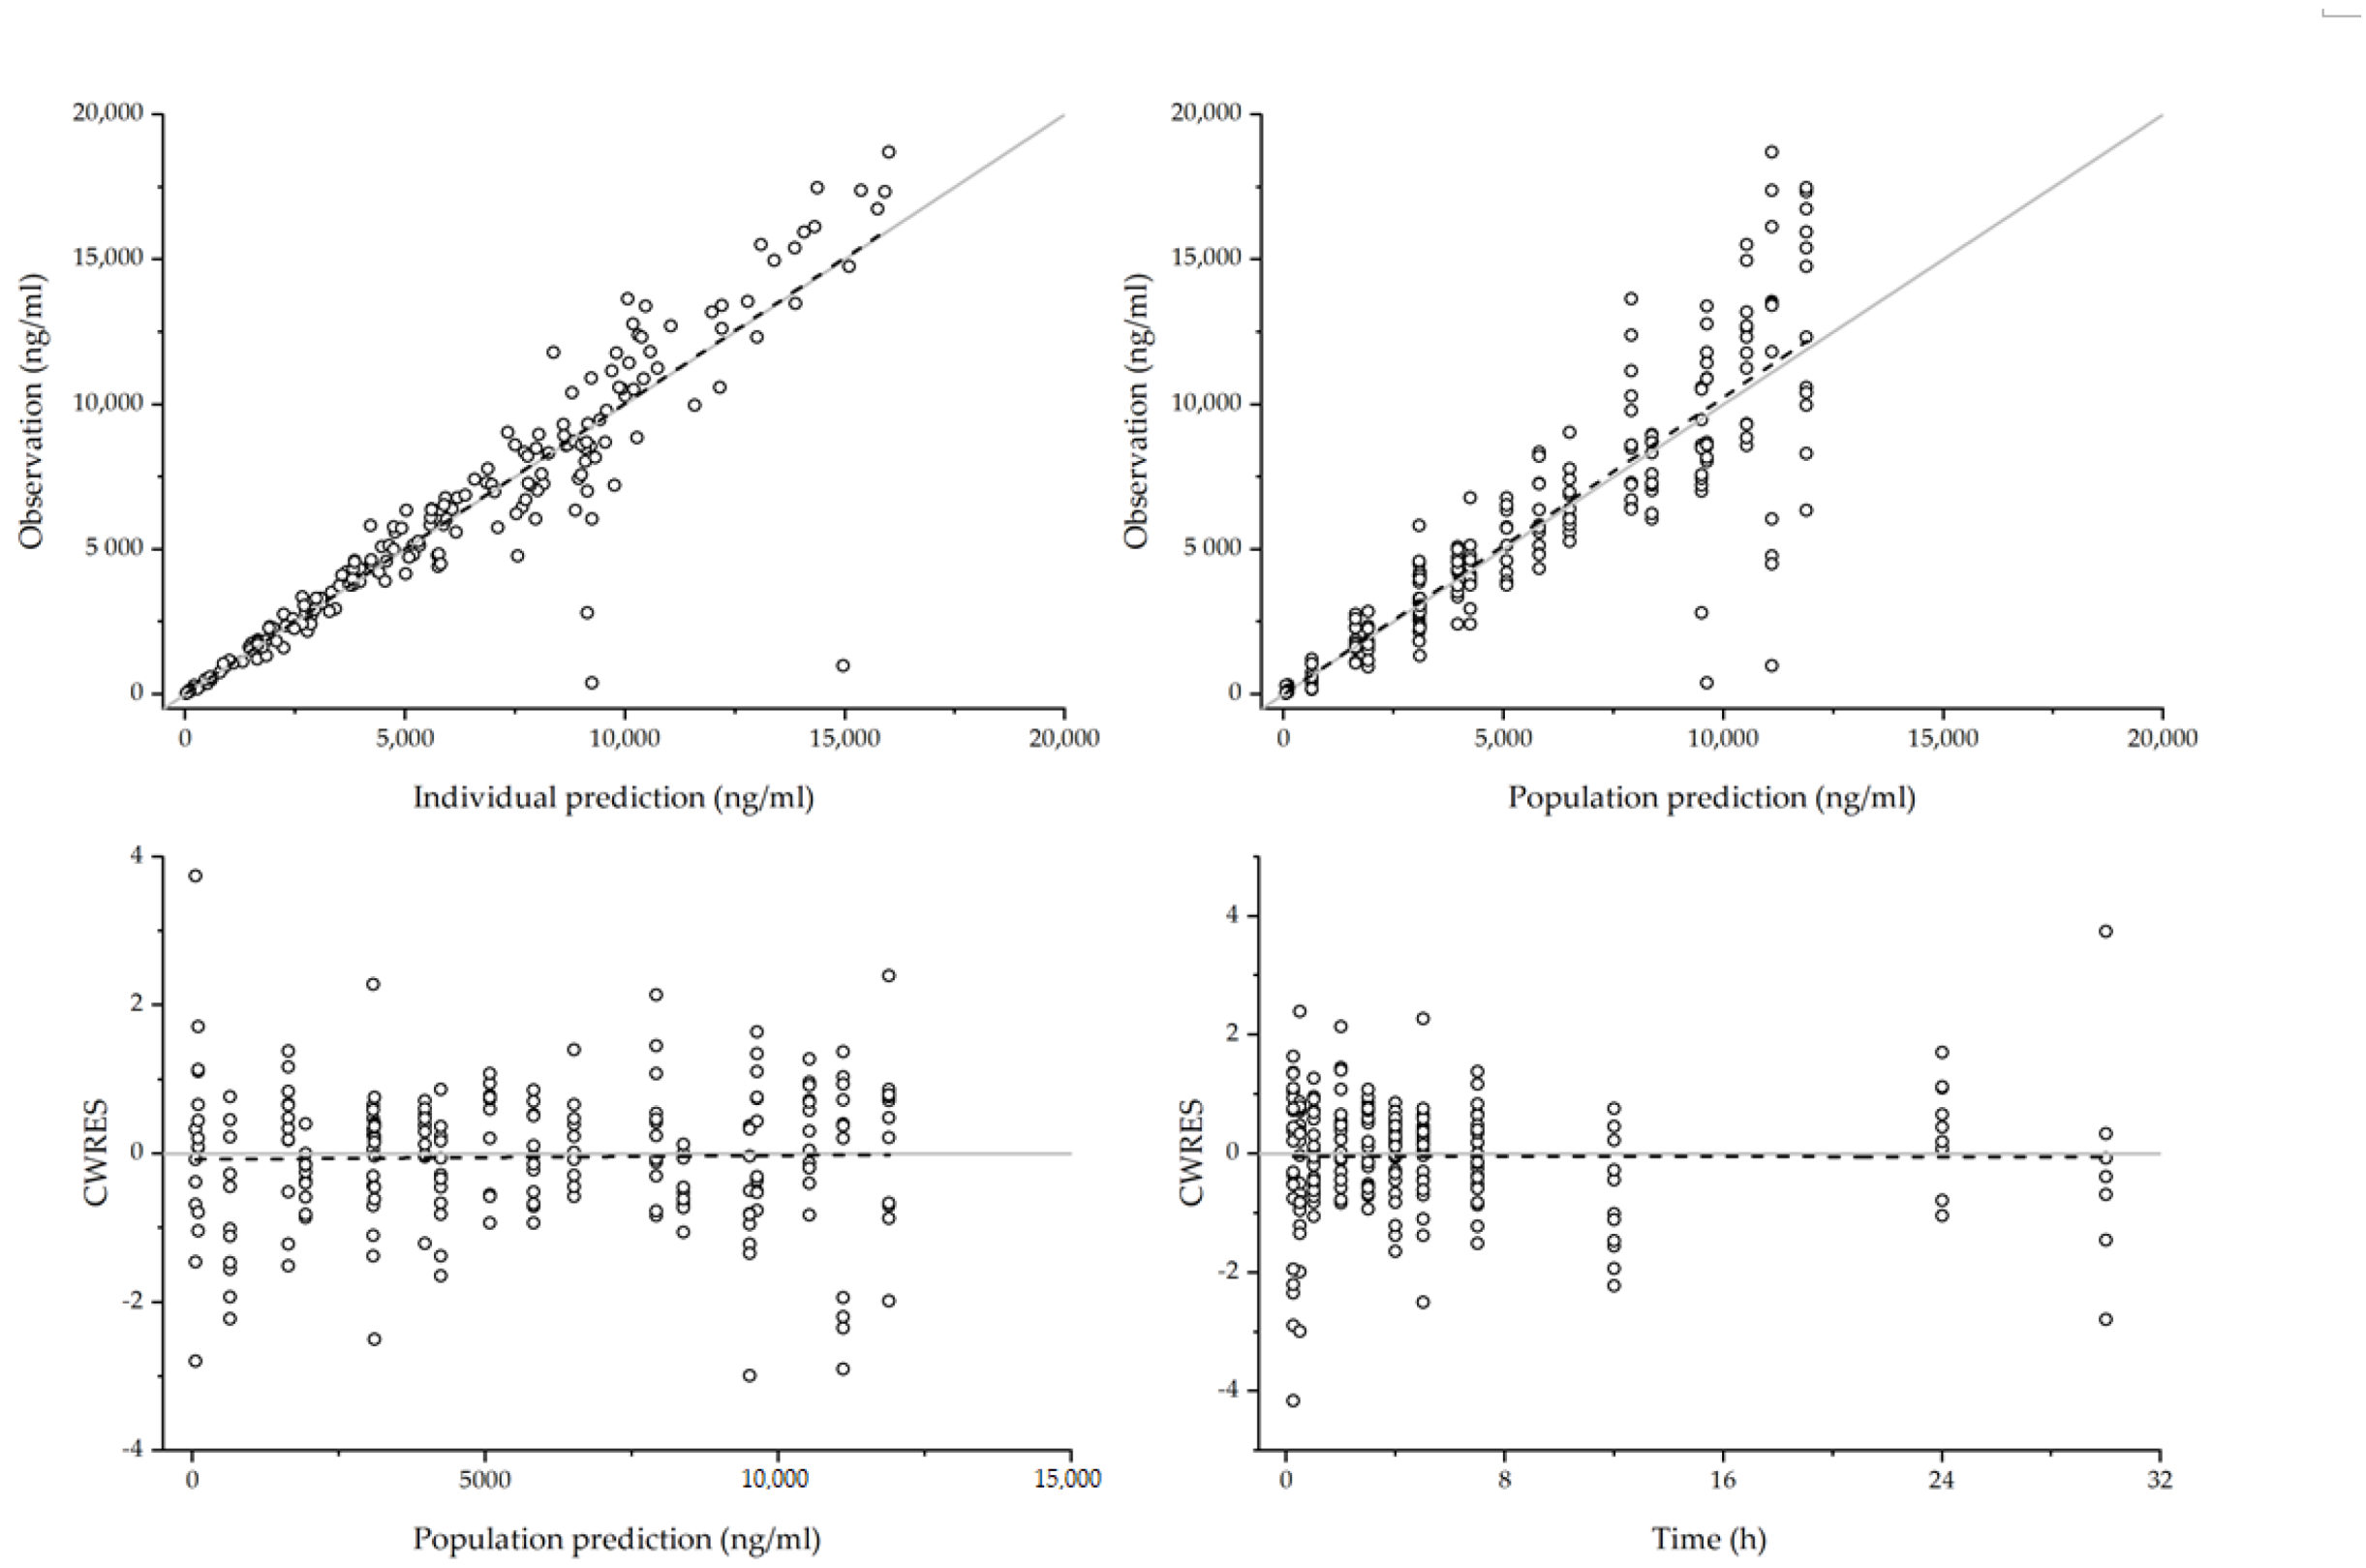
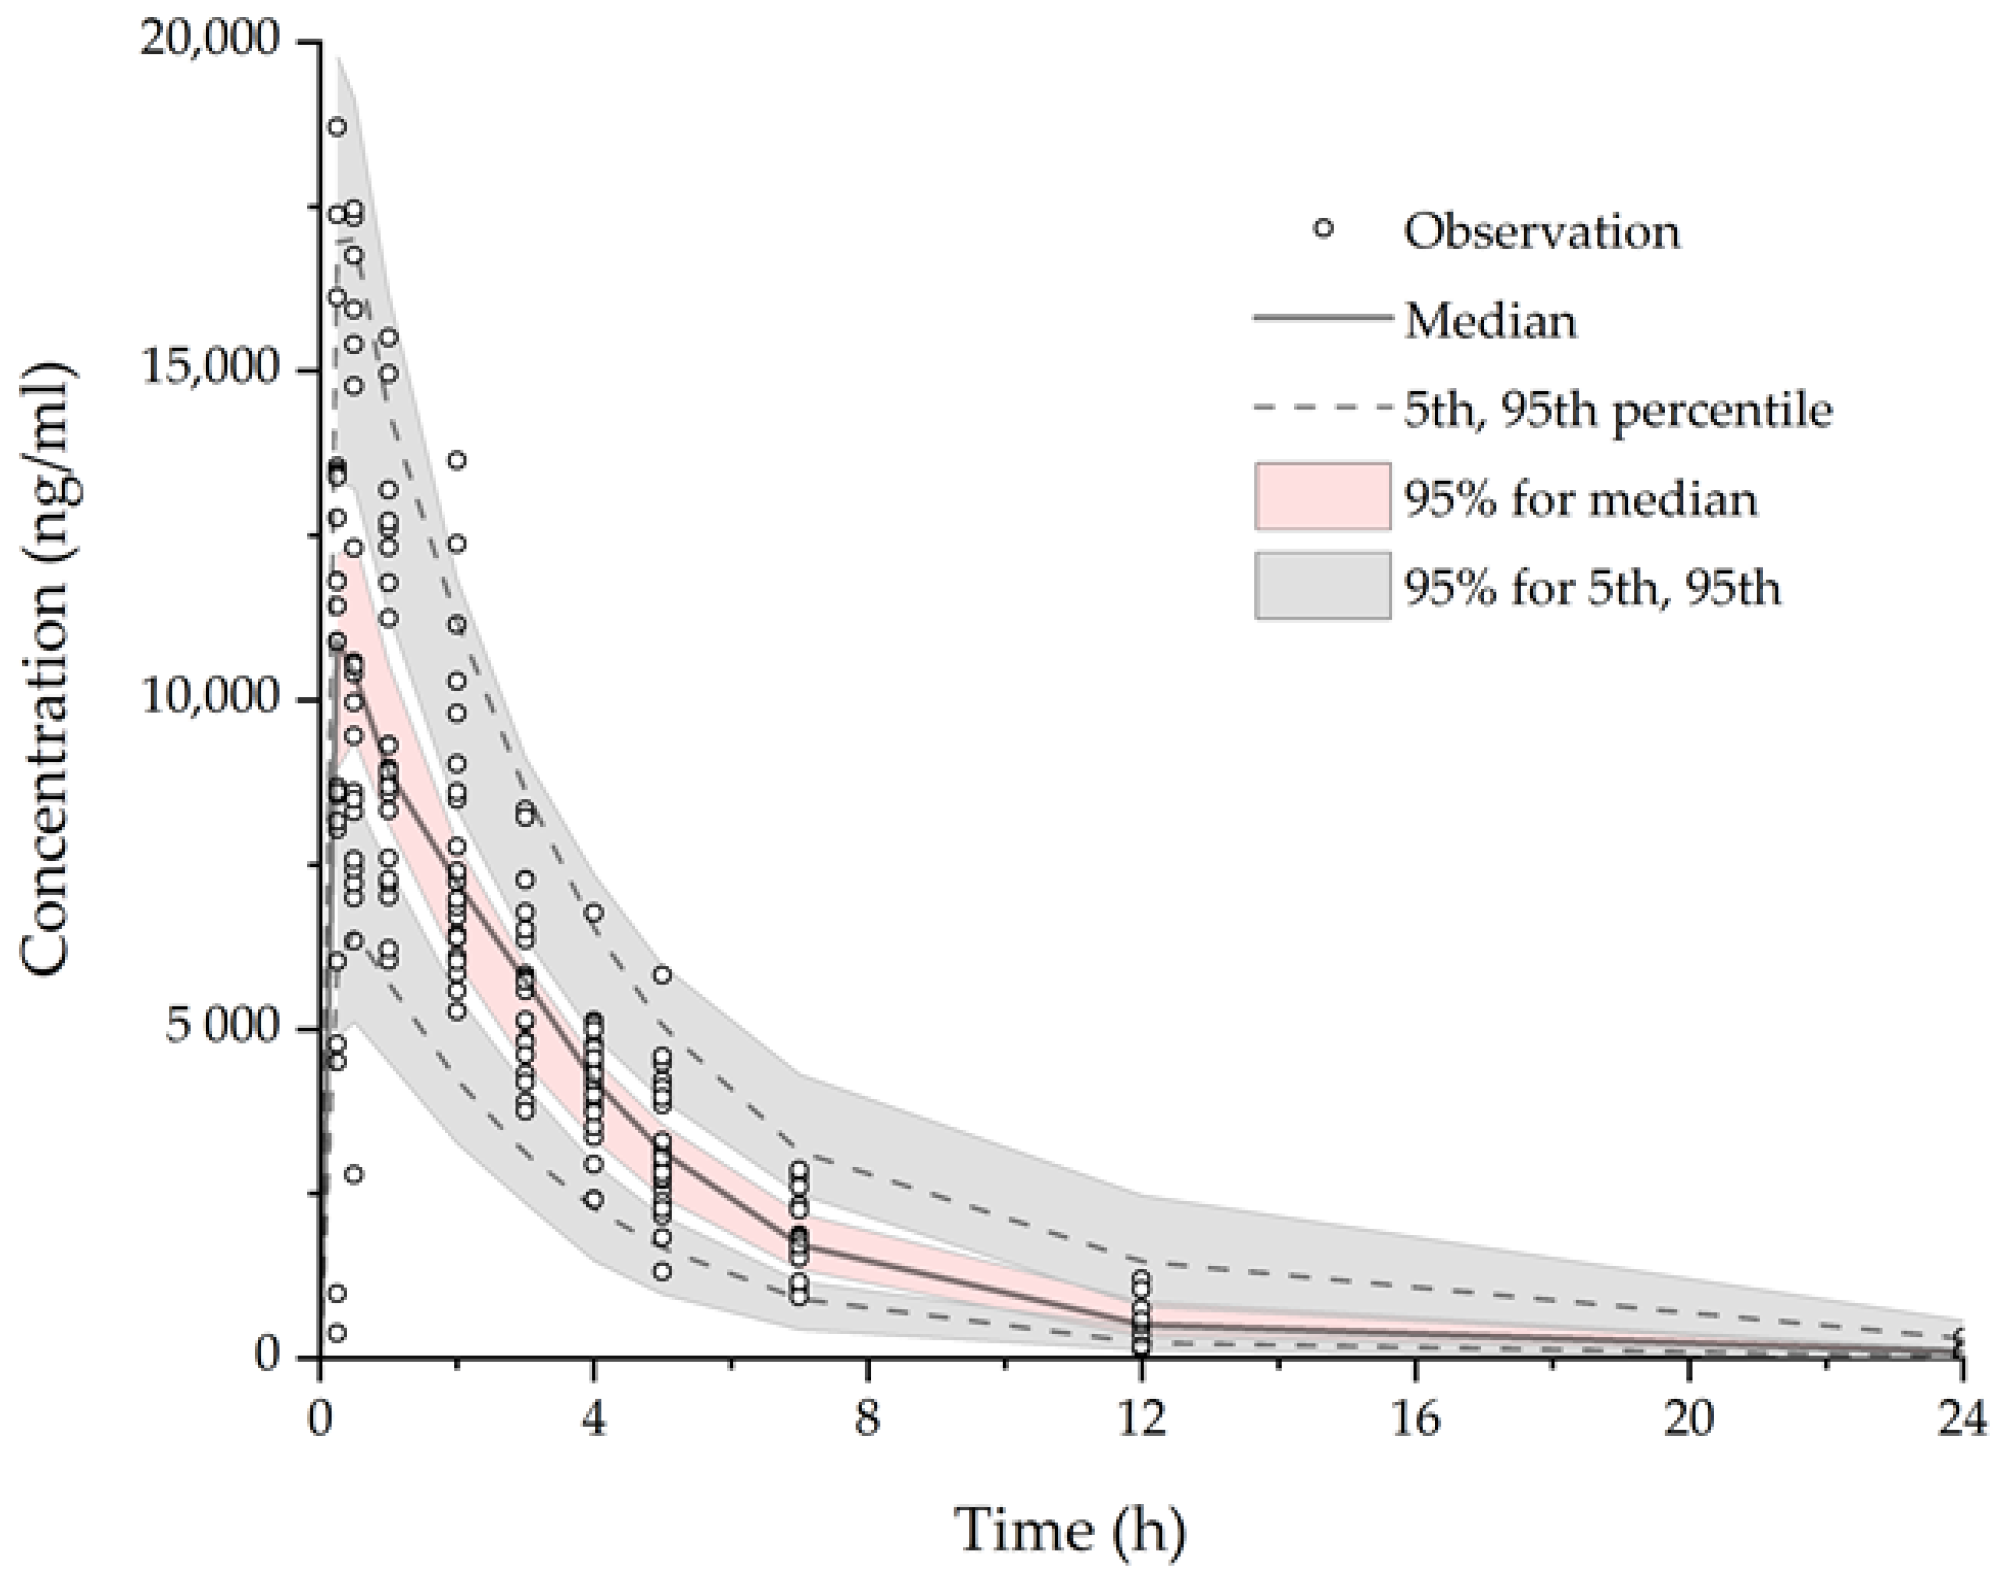
3.2.3. Model Evaluation
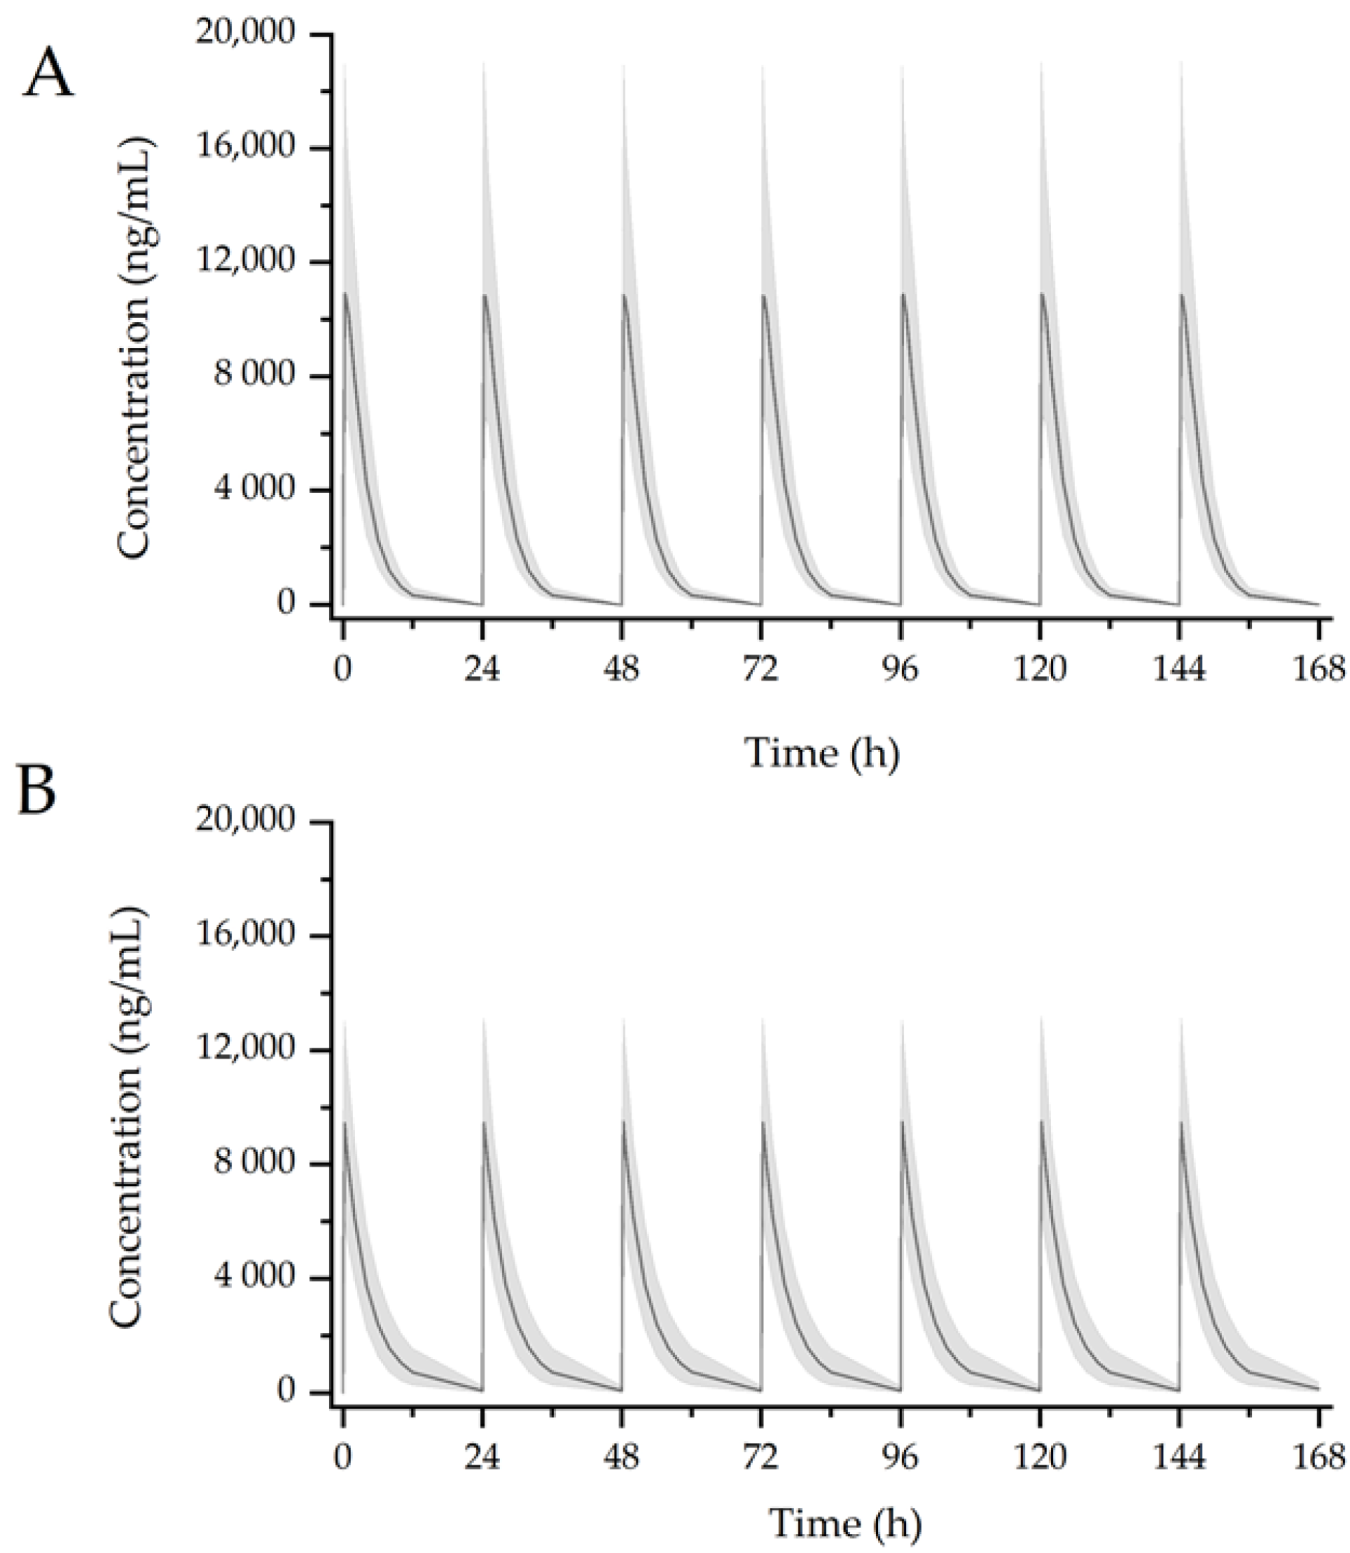
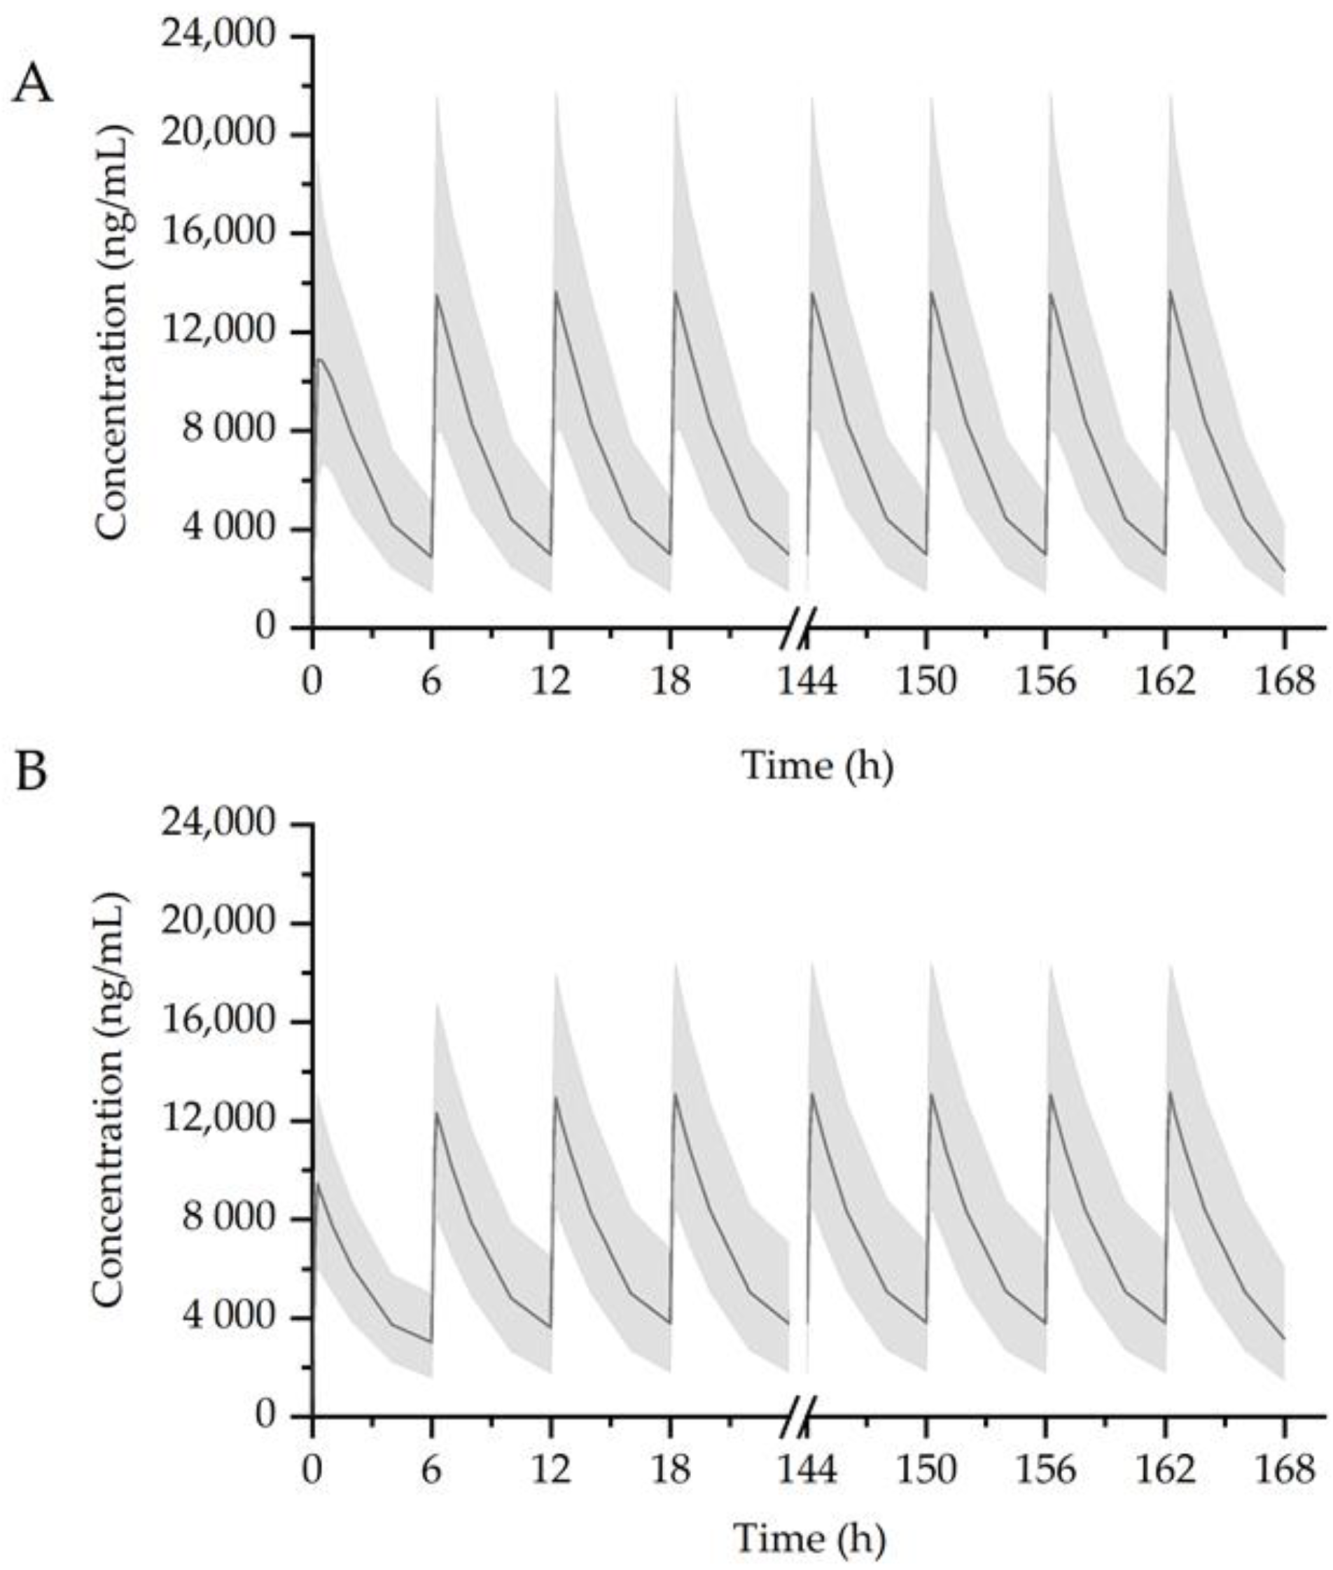
3.3. Simulation of Drug Interaction
4. Discussion
5. Conclusions
Supplementary Materials
Author Contributions
Funding
Conflicts of Interest
References
- Williamson, E.M. Interactions between herbal and conventional medicines. Expert Opin. Drug Saf. 2005, 4, 355–378. [Google Scholar] [CrossRef] [PubMed]
- Yang, T.; Kim, Y.; Chae, B. An experimental study on the anti-allergic effects, anti-inflammatory action, anti-pyretic action and analgesic action of Galgeun-tang, Gamigalgeun-tang and Geomahwanggalgeun-ang. J. Korean Orient. Med. Ophthalmol. Tolaryngol. Dermatol. 2002, 15, 1824. [Google Scholar]
- Shin, J.-M.; Kim, Y.-O.; Baek, S.-H. Free radical scavenging activity and kinetic behavior of the Galgeuntang water extract. Orient. Pharm. Exp. Med. 2008, 8, 32–38. [Google Scholar] [CrossRef] [Green Version]
- Wu, M.S.; Yen, H.R.; Chang, C.W.; Peng, T.Y.; Hsieh, C.F.; Chen, C.J.; Lin, T.Y.; Horng, J.T. Mechanism of action of the suppression of influenza virus replication by Ko-Ken Tang through inhibition of the phosphatidylinositol 3-kinase/Akt signaling pathway and viral RNP nuclear export. J. Ethnopharmacol. 2011, 134, 614–623. [Google Scholar] [CrossRef]
- Ha, H.; Lee, J.K.; Lee, M.-Y.; Lim, H.-S.; Shin, H. Galgeun-tang, an Herbal Formula, Ameliorates Atopic Dermatitis Responses in Dust Mite Extract-treated NC/Nga Mice. J. Korean Med. 2013, 34, 1–11. [Google Scholar] [CrossRef] [Green Version]
- Son, M.J.; Kwon, O.; Kim, S.; Kim, Y.E.; Jung, S.Y.; Kim, B.Y.; Kang, J.I.; Lee, J.H.; Lee, D.H. Safety and efficacy of Galgeun-tang-ga-cheongung-sinyi, a herbal formula, for the treatment of chronic rhinosinusitis: A study protocol for a randomized controlled trial. Medicine 2018. [Google Scholar] [CrossRef]
- Guerra, M.C.; Speroni, E.; Broccoli, M.; Cangini, M.; Pasini, P.; Minghetti, A.; Crespi-Perellino, N.; Mirasoli, M.; Cantelli-Forti, G.; Paolini, M. Comparison between Chinese medical herb Pueraria lobata crude extract and its main isoflavone puerarin: Antioxidant properties and effects on rat liver CYP-catalysed drug metabolism. Life Sci. 2000, 67, 2997–3006. [Google Scholar] [CrossRef]
- Wu, W.H.; Liu, L.; Han, F.M.; Chen, Y. Effect of pseudoephedrine and ephedrine on the activities of cytochrome P450 enzymes in rat liver microsomes. China J. Tradit. Chin. Med. Pharm. 2011, 26, 1804–1807. [Google Scholar]
- Guo, Y.J.; Liang, D.L.; Xu, Z.S.; Ye, Q. In vivo inhibitory effects of puerarin on selected rat cytochrome P450 isoenzymes. Pharmazie 2014, 69, 367–370. [Google Scholar] [CrossRef]
- Kim, J.Y.; Kim, J.S.; Jung, J.H.; Chun, P.; Rhew, K.Y. Inhibitory effects of puerarin on cytochrome P450 subfamilies in vitro. Orient. Pharm. Exp. Med. 2014, 14, 1–5. [Google Scholar] [CrossRef]
- Zhao, K.; Ding, M.; Cao, H.; Cao, Z.X. In-vitro metabolism of glycyrrhetinic acid by human and rat liver microsomes and its interactions with six CYP substrates. J. Pharm. Pharmacol. 2012, 64, 1445–1451. [Google Scholar] [CrossRef] [PubMed]
- Lv, Q.-L.L.; Wang, G.-H.H.; Chen, S.-H.H.; Hu, L.; Zhang, X.; Ying, G.; Qin, C.-Z.Z.; Zhou, H.-H.H. In Vitro and in Vivo Inhibitory Effects of Glycyrrhetinic Acid in Mice and Human Cytochrome P450 3A4. Int. J. Environ. Res. Public Health 2015, 13, 84. [Google Scholar] [CrossRef] [PubMed] [Green Version]
- Hwang, Y.P.; Choi, C.Y.; Chung, Y.C.; Jeon, S.S.; Jeong, H.G. Protective effects of Puerarin on carbon tetrachloride-induced hepatotoxicity. Arch. Pharm. Res. 2007, 30, 1309–1317. [Google Scholar] [CrossRef] [PubMed]
- Zheng, J.; Chen, B.; Jiang, B.; Zeng, L.; Tang, Z.R.; Fan, L.; Zhou, H.H. The effects of puerarin on CYP2D6 and CYP1A2 activities in vivo. Arch. Pharm. Res. 2010. [Google Scholar] [CrossRef] [PubMed]
- Kim, J. Effects of 6-Shogaol, A Major Component of Zingiber officinale Roscoe, on Human Cytochrome P450 Enzymes in vitro. Korean J. Med. Crop Sci. 2016, 24, 7–13. [Google Scholar] [CrossRef]
- Jin, S.E.; Ha, H.; Jeong, S.-J.; Shin, H.-K. Effects of Korean traditional herbal formula for common cold on the activities of human CYP450 isozymes. J. Korean Med. 2014, 35, 47–59. [Google Scholar] [CrossRef]
- Li, S.; Li, X.; Yuan, D.; Wang, B.; Yang, R.; Zhang, M.; Li, J.; Zeng, F. Effects of paeoniflorin on the activities and mRNA expression of rat CYP1A2, CYP2C11 and CYP3A1 enzymes in vivo. Xenobiotica 2017, 1–26. [Google Scholar] [CrossRef]
- Kim, S.B.; Yoon, I.S.; Kim, K.S.; Cho, S.J.; Kim, Y.S.; Cho, H.J.; Chung, S.J.; Chong, S.; Kim, D.D. In vitro and in vivo evaluation of the effect of puerarin on hepatic cytochrome P450-mediated drug metabolism. Planta Med. 2014, 80, 561–567. [Google Scholar] [CrossRef]
- Li, H.Y.; Xu, W.; Su, J.; Zhang, X.; Hu, L.W.; Zhang, W.D. In vitro and in vivo inhibitory effects of glycyrrhetinic acid on cytochrome P450 3A activity. Pharmacology 2010, 86, 287–292. [Google Scholar] [CrossRef]
- Bessems, J.G.; Vermeulen, N.P. Paracetamol (acetaminophen)-induced toxicity: Molecular and biochemical mechanisms, analogues and protective approaches. Crit. Rev. Toxicol. 2001, 31, 55–138. [Google Scholar] [CrossRef]
- Mazaleuskaya, L.L.; Sangkuhl, K.; Thorn, C.F.; Fitzgerald, G.A.; Altman, R.B.; Klein, T.E.; Alvarellos, M.L.; McDonagh, E.M.; Patel, S.; McLeod, H.L.; et al. PharmGKB summary: Pathways of acetaminophen metabolism at the therapeutic versus toxic doses. Pharmacogenet. Genom. 2015, 25, 622–630. [Google Scholar] [CrossRef] [PubMed] [Green Version]
- Uptodate.com. Acetaminophen (Paracetamol): Drug Information. Available online: https://www.uptodate.com/contents/acetaminophen-paracetamol-drug-information (accessed on 24 November 2020).
- The Electronic Medicines Compendium. Paracetamol 500 mg Tablets (P). Available online: https://www.medicines.org.uk/emc/product/9128/smpc#gref (accessed on 24 November 2020).
- Heading, R.C.; Nimmo, J.; Prescott, L.F.; Tothill, P. The dependence of paracetamol absorption on the rate of gastric emptying. Br. J. Pharmacol. 1973, 47, 415–421. [Google Scholar] [CrossRef] [PubMed]
- Clements, J.A.; Heading, R.C.; Nimmo, W.S.; Prescott, L.F. Kinetics of acetaminophen absorption and gastric emptying in man. Clin. Pharmacol. Ther. 1978, 24, 420–431. [Google Scholar] [CrossRef] [PubMed]
- Nimmo, W.; Heading, R.; Wilson, J.; Tothill, P.; Prescott, L. Inhibition of gastric emptying and drug absorption by narcotic analgesics. Br. J. Clin. Pharmacol. 1975, 2, 509–513. [Google Scholar] [CrossRef] [Green Version]
- Lee, S.Y.; Lee, J.Y.; Kang, W.; Kwon, K.I.; Park, S.K.; Oh, S.J.; Ma, J.Y.; Kim, S.K. Cytochrome P450-mediated herb-drug interaction potential of Galgeun-tang. Food Chem. Toxicol. 2013, 51, 343–349. [Google Scholar] [CrossRef]
- Nnane, I.P. Pharmacokinetics—Absorption, Distribution, and Elimination. In Encyclopedia of Analytical Science: Second Edition; Elsevier: Amsterdam, The Netherlands, 2004; pp. 126–133. ISBN 9780123693976. [Google Scholar]
- Ahmad, A.M. Potential pharmacokinetic interactions between antiretrovirals and medicinal plants used as complementary and African traditional medicines. Biopharm. Drug Dispos. 2007, 28, 135–143. [Google Scholar] [CrossRef]
- Lee, W.M. Acetaminophen (APAP) hepatotoxicity—Isn’t it time for APAP to go away? J. Hepatol. 2017, 67, 1324–1331. [Google Scholar] [CrossRef] [Green Version]
- Sahajwalla, C.G.; Ayres, J.W. Multiple-dose acetaminophen pharmacokinetics. J. Pharm. Sci. 1991, 80, 855–860. [Google Scholar] [CrossRef]
- Drugs.com. Acetaminophen and Pseudoephedrine. Available online: https://www.drugs.com/mtm/acetaminophen-and-pseudoephedrine.html#:~:text=Acetaminophenandpseudoephedrineisa,listedinthismedicationguide (accessed on 25 November 2020).
- Drugbank.com. Ephedrine. Available online: https://go.drugbank.com/drugs/DB01364 (accessed on 25 November 2020).
- Drugbank.com. Pseudoephedrine. Available online: https://go.drugbank.com/drugs/DB00852 (accessed on 25 November 2020).
- PubChem Ephedrine. Available online: https://pubchem.ncbi.nlm.nih.gov/compound/9294#section=Vapor-Pressure (accessed on 25 November 2020).
- PubChem Pseudoephedrine. Available online: https://pubchem.ncbi.nlm.nih.gov/compound/Pseudoephedrine#section=Vapor-Pressure (accessed on 25 November 2020).
- Loftsson, T. Physicochemical Properties and Pharmacokinetics. In Essential Pharmacokinetics; Elsevier Science: Amsterdam, The Netherlands, 2015; pp. 85–104. ISBN 9780128014110. [Google Scholar]
- Moore, R.A.; Derry, S.; Wiffen, P.J.; Straube, S. Effects of food on pharmacokinetics of immediate release oral formulations of aspirin, dipyrone, paracetamol and NSAIDs—A systematic review. Br. J. Clin. Pharmacol. 2015, 80, 381–388. [Google Scholar] [CrossRef] [Green Version]


| Major Ingredient | Amount in One Tablet |
|---|---|
| Puerarin | 3.65 mg |
| Ephedrine | 2.63 mg |
| Paeoniflorin | 6.07 mg |
| Glycyrrhetic acid | 1.23 mg |
| (6)-shogaol | - |
| Parameter | G1 (AAP alone) (n = 12) (Mean ± SD) | G2 (AAP + GGT) (n = 11) (Mean ± SD) | P-Value |
|---|---|---|---|
| AUCinf (ng h/mL) | 48,126 ± 9530 | 44,054 ± 10,330 | p < 0.001 |
| Cmax (ng/mL) | 14,441 ± 2896 | 10,212 ± 2151 | p < 0.001 |
| ‡Tmax (h) | 0.250 (0.250–2.00) | 0.250 (0.250–2.00) | - |
| t1/2 (h) | 2.23 ± 0.274 | 4.39 ± 1.01 | p < 0.001 |
| CL/F (L/h) | 21.6 ± 4.37 | 23.8 ± 5.53 | p > 0.05 |
| V/F (L/h) | 69.2 ± 17.0 | 147 ± 36.7 | p < 0.001 |
| Model No. | Model Description | OFV | ΔOFV | Compare with |
|---|---|---|---|---|
| 1 | One-compartment, first-order elimination, first-order absorption | 1493 | ||
| 2 | Two-compartment, first-order elimination, first-order absorption | 1527 | +34.6 | 1 |
| 3 | One-compartment, first-order elimination + Gastric emptying pattern | 1487 | −5.73 | 1 |
| 4 | One-compartment, first-order elimination + two-phase absorption (ka-fast + ka-slow) | 1485 | −7.94 | 1 |
| Model No. | Model Description | ΔOFV | DF | Compare with | Significance (p-Value) |
|---|---|---|---|---|---|
| 1 | Base model | - | - | - | - |
| 2 | Base model, EPD as covariate on CL/F | Fail | |||
| 3 | Base model, EPD as covariate on Ka-slow | −11.9 | 1 | 1 | p < 0.05 |
| 4 | Base model, EPD as covariate on Ka-fast | Fail | |||
| 5 | Base model, EPD as covariate on V/F | −16.6 | 1 | 1 | p < 0.05 |
| 3 | Base model, EPD as covariate on Ka-slow | −11.9 | 1 | 1 | p < 0.05 |
| 6 | Base model, EPD as covariate on Ka-slow, V/F | −6.87 | 2 | 3 | p < 0.05 |
| 7 | Base model, EPD as covariate on Ka-slow, V/F, Ka-fast | −18.2 | 1 | 6 | p < 0.05 |
| Parameters | Description | Final Model Estimate | RSE (%) | Bootstrap Median (n = 1000) Median (95% CI) |
|---|---|---|---|---|
| CL/F (L/h) | Apparent clearance | 22.5 | 5.60 | 22.4 (20.6–24.1) |
| V/F (L) | Apparent volume of distribution | 16.3 | 57.3 | 16.1 (5.60–29.0) |
| Ka-fast (1/h) | Rapid absorption rate constant | 0.970 | 53.4 | 0.950 (0.360–2.32) |
| Ka-slow (1/h) | Slow absorption rate constant | 0.320 | 9.50 | 0.320 (0.300–0.340) |
| MTIME (h) | The time at which absorption rate change | 0.294 | 18.1 | 0.289 (0.250–0.342) |
| Prop.RE | Proportional random error | 0.196 | 2.70 | 0.187 (0.145–0.233) |
| COVV/F | EPD as covariate on V/F | 13.3 | 75.0 | 12.7 (5.80–45.3) |
| COVKa-slow | EPD as covariate on Ka-slow | 2.28 | 11.2 | 2.23 (1.82–2.87) |
| COVKa-fast | EPD as covariate on Ka-fast | 21.7 | 95.9 | 19.8 (6.95–69.6) |
| ΩCL/F (%) | Inter-individual variability of CL/F | 19.8 | 43.4 | |
| Ωka-fast (%) | Inter-individual variability of Ka-fast | 33.3 | 24.7 |
| Group | Cmax (ng/mL) Median (5–95% Percentile) | AUCt (ng h/mL) Median (5–95% Percentile) | AUCinf (ng h/mL) Median (5–95% Percentile) | t1/2 (h) Median (5–95% Percentile) |
|---|---|---|---|---|
| AAP (1000mg once per day) | 10,872 (6627–19,042) | * 43,606 (25,436–71,008) | 43,628 (25,449–71,047) | 2.17 (2.16–2.17) |
| AAP (1000mg once per day) + GGT (7680 mg once per day) | 9474 (6118–13,114) | * 43,024 (24,144–70,517) | 43,883 (24,340–73,246) | 4.69 (3.93–5.43) |
| AAP (1000mg × 4 times per day) | 13,679 (8132–21,658) | ‡ 40,940 (23,735–66,138) | 51,855 (28,504–88,671) | 2.17 (2.12–2.35) |
| AAP (1000mg × 4 times per day) + GGT (7680 mg once per day) | 13,149 (8634–18,323) | ‡ 42,854 (25,266–67,489) | 60,357 (61,955–110,028) | 2.80 (2.24–3.67) |
Publisher’s Note: MDPI stays neutral with regard to jurisdictional claims in published maps and institutional affiliations. |
© 2020 by the authors. Licensee MDPI, Basel, Switzerland. This article is an open access article distributed under the terms and conditions of the Creative Commons Attribution (CC BY) license (http://creativecommons.org/licenses/by/4.0/).
Share and Cite
Tran, Q.T.; Park, S.J.; Back, H.-m.; Ngo, L.T.; Cao, D.T.; Nguyen, H.V.; Jung, S.; Chae, J.-w.; Park, Y.C.; Yun, H.-y. Clinical Evaluation of Acetaminophen–Galgeuntang Interaction Based on Population Approaches. Pharmaceutics 2020, 12, 1182. https://doi.org/10.3390/pharmaceutics12121182
Tran QT, Park SJ, Back H-m, Ngo LT, Cao DT, Nguyen HV, Jung S, Chae J-w, Park YC, Yun H-y. Clinical Evaluation of Acetaminophen–Galgeuntang Interaction Based on Population Approaches. Pharmaceutics. 2020; 12(12):1182. https://doi.org/10.3390/pharmaceutics12121182
Chicago/Turabian StyleTran, Quyen Thi, So Jung Park, Hyun-moon Back, Lien Thi Ngo, Duc Tuan Cao, Hung Van Nguyen, Sangkeun Jung, Jung-woo Chae, Yang Chun Park, and Hwi-yeol Yun. 2020. "Clinical Evaluation of Acetaminophen–Galgeuntang Interaction Based on Population Approaches" Pharmaceutics 12, no. 12: 1182. https://doi.org/10.3390/pharmaceutics12121182