Article

Changes in the Sodium Content of New Zealand Processed Foods: 2003–2013

1
Heart Foundation of New Zealand, PO Box 17160, Greenlane, Auckand 1546, New Zealand
2
National Institute for Health Innovation, The University of Auckland, Private Bag 92019, Auckland 1142, New Zealand
3
Epidemiology and Biostatistics, The University of Auckland, Private Bag 92019, Auckland 1142, New Zealand
*
Author to whom correspondence should be addressed.
Nutrients 2015, 7(6), 4054-4067; https://doi.org/10.3390/nu7064054
Submission received: 6 March 2015 / Revised: 12 May 2015 / Accepted: 20 May 2015 / Published: 27 May 2015

Abstract

:
Decreasing population sodium intake has been identified as a “best buy” for reducing non-communicable disease. The aim of this study was to explore 10-year changes in the sodium content of New Zealand processed foods. Nutrient data for nine key food groups were collected in supermarkets in 2003 (n = 323) and 2013 (n = 885). Mean (SD) and median (min, max) sodium content were calculated by food group, year and label type (private/branded). Paired t-tests explored changes in sodium content for all products available for sale in both years (matched; n = 182). The mean (SD) sodium content of all foods was 436 (263) mg (100 g)−1 in 2003 and 433 (304) mg (100 g)−1 in 2013, with no significant difference in matched products over time (mean (SD) difference, −56 (122) mg (100 g)−1, 12%; p = 0.22). The largest percentage reductions in sodium (for matched products) were observed for Breakfast Cereals (28%; −123 (125) mg (100 g)−1), Canned Spaghetti (15%; −76 (111) mg (100 g)−1) and Bread (14%; −68 (69) mg (100 g)−1). The reduction in sodium was greater for matched private vs. branded foods (−69 vs. −50 mg (100 g)−1, both p < 0.001). There has been modest progress with sodium reduction in some New Zealand food categories over the past 10 years. A renewed focus across the whole food supply is needed if New Zealand is to meet its global commitment to reducing population sodium intake.

1. Introduction

Salt is the leading source of sodium in the human diet and has been used for many generations as a key ingredient in cooking and food manufacturing. However, high salt intakes are linked to high blood pressure, the leading risk factor for early death globally [1]. Salt intakes in most high income countries far exceed the World Health Organization (WHO) guideline for reducing blood pressure and risk of cardiovascular disease, stroke, and coronary heart disease in adults (<5 g salt or <2000 mg sodium day−1 [2]); UK, 8.1 g salt day−1 (3200 mg sodium; 2011) [3]; US, 8.3 g salt day−1 (3330 mg sodium; 2008 [4]); and New Zealand, 8.4 g salt day−1 (3373 mg sodium; 2012).
The majority of dietary energy and nutrients (~75%) consumed in high income countries come from processed foods [5]. As such, healthier reformulation of processed foods has gained increasing support in the past decade. Reduction of sodium in packaged foods was identified at the 2011 United Nations (UN) high level meeting as a “best buy” for reducing non-communicable diseases (NCDs) and is likely to be cost effective [6,7,8]. Moreover, reduction of population salt intakes by 30% relative to 2010 levels (by 2025) is one of nine global targets agreed upon by UN committed member states (including New Zealand) [9].
Nonetheless, sodium reduction efforts globally have been mixed, with a number of governments and health agencies creating programmes to work in partnership with the food industry to encourage sodium reduction, yet only nine countries have legislation to improve population salt intakes [10]. Of the countries which have national sodium reduction strategies, manufacturer targets for reduction of salt in processed foods are a mainstay of the plan; in the UK such targets have led to a 7% fall in the salt content of processed foods [11] and contributed to a reduction in salt intakes from 9.5 g day−1 in 2001 to 8.1 g day−1 in 2011 [3]. However, there has been very little robust monitoring of changes in the salt content of packaged foods internationally.
In New Zealand there is no government-led national sodium reduction strategy, yet some food companies have created their own internal salt reduction programmes. Furthermore, the Heart Foundation of New Zealand has been running the Tick Programme which encourages reformulation and healthier consumer food choices, since 1991. The Tick is a manufacturer-funded initiative in Australia and New Zealand where products that meet certain nutrient criteria are eligible to carry a Tick logo to indicate a healthier choice within category [12]. In 2010 the Heart Foundation of New Zealand also established HeartSAFE to support food companies to meet voluntary sodium reduction guidelines [13]. In order to produce the greatest population health impacts the HeartSAFE programme is particularly focused on reducing sodium in low cost, high volume foods, including private label (retailer own) products. The aim of this study was to explore 10-year (2003 to 2013) changes in the sodium content of key packaged foods in New Zealand. Changes in sodium content by food group and category, and by label (private or branded) were also explored.

2. Experimental Section

2.1. Data Sources, Food Groups and Categories

In 2003, data on the sodium content of New Zealand food products were collected from the four major supermarkets in Dunedin, New Zealand [14]. Sodium values were collected directly from the Nutrition Information Panels (NIP) on product packages and entered into Microsoft Excel. Data were collected for nine food categories (Table 1) selected on the following criteria:
(1)
Were major contributors to population sodium intakes [15]
(2)
Included a wide range of sodium contents across the food category; a wide range of sodium contents indicates the potential or feasibility for producing lower sodium products, i.e., sodium reduction
(3)
Displayed a NIP (a new Food Standards Code came into effect in 2002 requiring almost all packaged food to display a NIP) [16]. In 2003, some food products did not yet meet these requirements as companies were still working towards the requirements of the new Code (e.g., sausages)
Corresponding data for 2013 were obtained from the Nutritrack database, a branded food composition database managed by the National Institute for Health Innovation at The University of Auckland [17]. Nutritrack data are collected directly from the NIPs of all packaged food products available for sale at major supermarkets in Auckland. A bespoke smartphone application was used to collect data where product photos were taken and nutrition information entered into an on-line database (NutriWeb). Auckland is New Zealand’s largest city with approximately one third of the country’s supermarkets (~1200 stores). Supermarkets chosen for data collection in 2013 represented the largest stores of the biggest retail brands of the two main supermarket retailers in New Zealand (Foodstuffs (54% grocery market share) and Progressive Enterprises (38% market share [18])). The nine food groups were further broken down into smaller categories for analysis. Food groups and categories included are shown in Table 1.

2.2. Data Cleaning and Matching

Only one package size for each food product was included in the analysis. This was to ensure that averages were not skewed by products with multiple pack sizes. Where the sodium content differed between different pack sizes the value for the most common pack size with the greatest shelf presence was used.
Value range checks were carried out on the sodium values for all products and checked against source data and photographs where necessary and possible. Some exclusions were made to ensure the types of products included for 2003 and 2013 were consistent. For example, in 2003 rolled oats and “heat and serve” porridge style cereals were not included in the Breakfast Cereal food group because they contained very little sodium and were not considered a focus for reformulation. Therefore, they were also excluded from the 2013 Breakfast Cereal data set. Similarly, wraps and pita breads were excluded from the 2013 data set because these types of products were not available in 2003.
Table 1. Sodium content of key packaged food products available for sale in New Zealand supermarkerts in 2003 and 2013.
Sodium content 2003 (mg 100 g−1)Sodium content 2013 (mg 100 g−1)
N% total foods *MeanSDMedianMinMaxN% total foods *MeanSDMedianMinMax
BreadAll4514%4726145035060010412%41068410380630
White175%51652515450600233%43362410346630
Whole Meal/Grain289%44551450350540819%403684101530
Breakfast cereals$All10934%348275289693317620%2151832051780
Childrens’3411%5742865776933425%3582293782780
Museli227%1111256114479475%6481434479
Other4414%30321628610714748%2111332151520
Wheat Biscuits & Bites93%29776280205437131%31754300235410
Butter, Margarine & Dairy BlendsAll5015%474135400360772587%4211393601700
Butter72%4800480480480111%57947600480600
Dairy Blends62%46712340039070091%39434400360470
Margarine3711%474150380360772384%3821403601700
Canned Corned BeefAll103%7702657504631369111%718164750460920
Canned SalmonAll93%34719542580600324%36413436959580
Canned SpaghettiAll93%474127460370800131%3701253901505
Canned VegetablesAll3912%241174270078011613%2001371850583
Asparagus72%2892328028034071%23862240120310
Baked Beans93%445194365270780222%3841244150583
Beetroot41%27315733540380121%2346723770330
Creamed Corn72%1675515014029081%19465165130300
Tomatoes72%9089600190566%120961280350
Whole Corn Kernels52%94521105140111%185901622340
Cheese ^All155%66156630590800597%67361670315760
CrackersAll3711%6373696108139031636%60436759401810
Total323 43626343001390885 43330440001810
$ Other cereals included light flakes and fruit, brans, and all other cereals; ^Cheese included only plain hard cheeses, e.g., Edam, Colby as these were the only types of cheeses collected in 2003; * Percentage of total foods based on proportion of total products in analysis, e.g., 45 breads of 323 products = 14%.
Manual data matching was carried out in Excel for products available for sale in both 2003 and 2013. Where changes had been made to product names, authors (DM, HE) used their knowledge of the New Zealand grocery sector to match products as appropriate.

2.3. Statistical Analysis

For all products in the dataset, mean (SD) and median (min, max) sodium content was calculated for each year overall, by food group and category, and by label type (private or branded). Means for private label and branded sub-categories were calculated for food groups, but not for smaller food categories due to insufficient numbers.
Significance testing was not undertaken for all products available for sale (unpaired data) due to the large difference in numbers and types of products available in each food group in 2003 compared with 2013. Two-sided paired t-tests were undertaken on all products that were available for sale in both years to explore changes in sodium content over 10 year time period, i.e., matched data. These data were normally distributed and a significance level of 5% was used. Significance testing was not undertaken by food group due to small product numbers and differences between means and medians indicating these data were skewed. No adjustment was made for multiple comparisons. However, the number of tests was considered in interpreting the findings.

3. Results

The final dataset included 323 products from 2003 and 885 products from 2013. One hundred and eighty two products were available for sale in both 2003 and 2013.

3.1. Sodium Content of Food Groups and Categories in 2003 and 2013

The mean (SD) and, median (range) sodium content overall for each year and for food groups and categories in 2003 and 2013 are shown in Table 1.
The mean (SD) sodium content of all foods was 436 (263) mg (100 g)−1 in 2003 and 433 (304) mg (100 g)−1 in 2013. Food categoriess with the highest mean (SD) sodium content per 100g for both 2003 and 2013 were Canned Corned Beef (770 (265) mg (100 g)−1 and 718 (164) mg (100 g)−1, respectively), Cheese (661 (56) mg (100 g)−1 and 673 (61) mg (100 g)−1, respectively), and Crackers (637 (369) mg (100 g)−1 and 604 mg (367) (100 g)−1, respectively). Food categories with the lowest mean sodium content in both years were Muesli (111 (125) mg (100 g)−1 in 2003 and 64 (81) mg (100 g)−1 in 2013), Canned Tomatoes (90 (89) mg (100 g)−1 vs. 120 (96) mg (100 g)−1, respectively), and Canned Whole Corn Kernels (94 (52) mg (100 g)−1 vs. 175 (162) mg (100 g)−1, respectively) (Table 1).

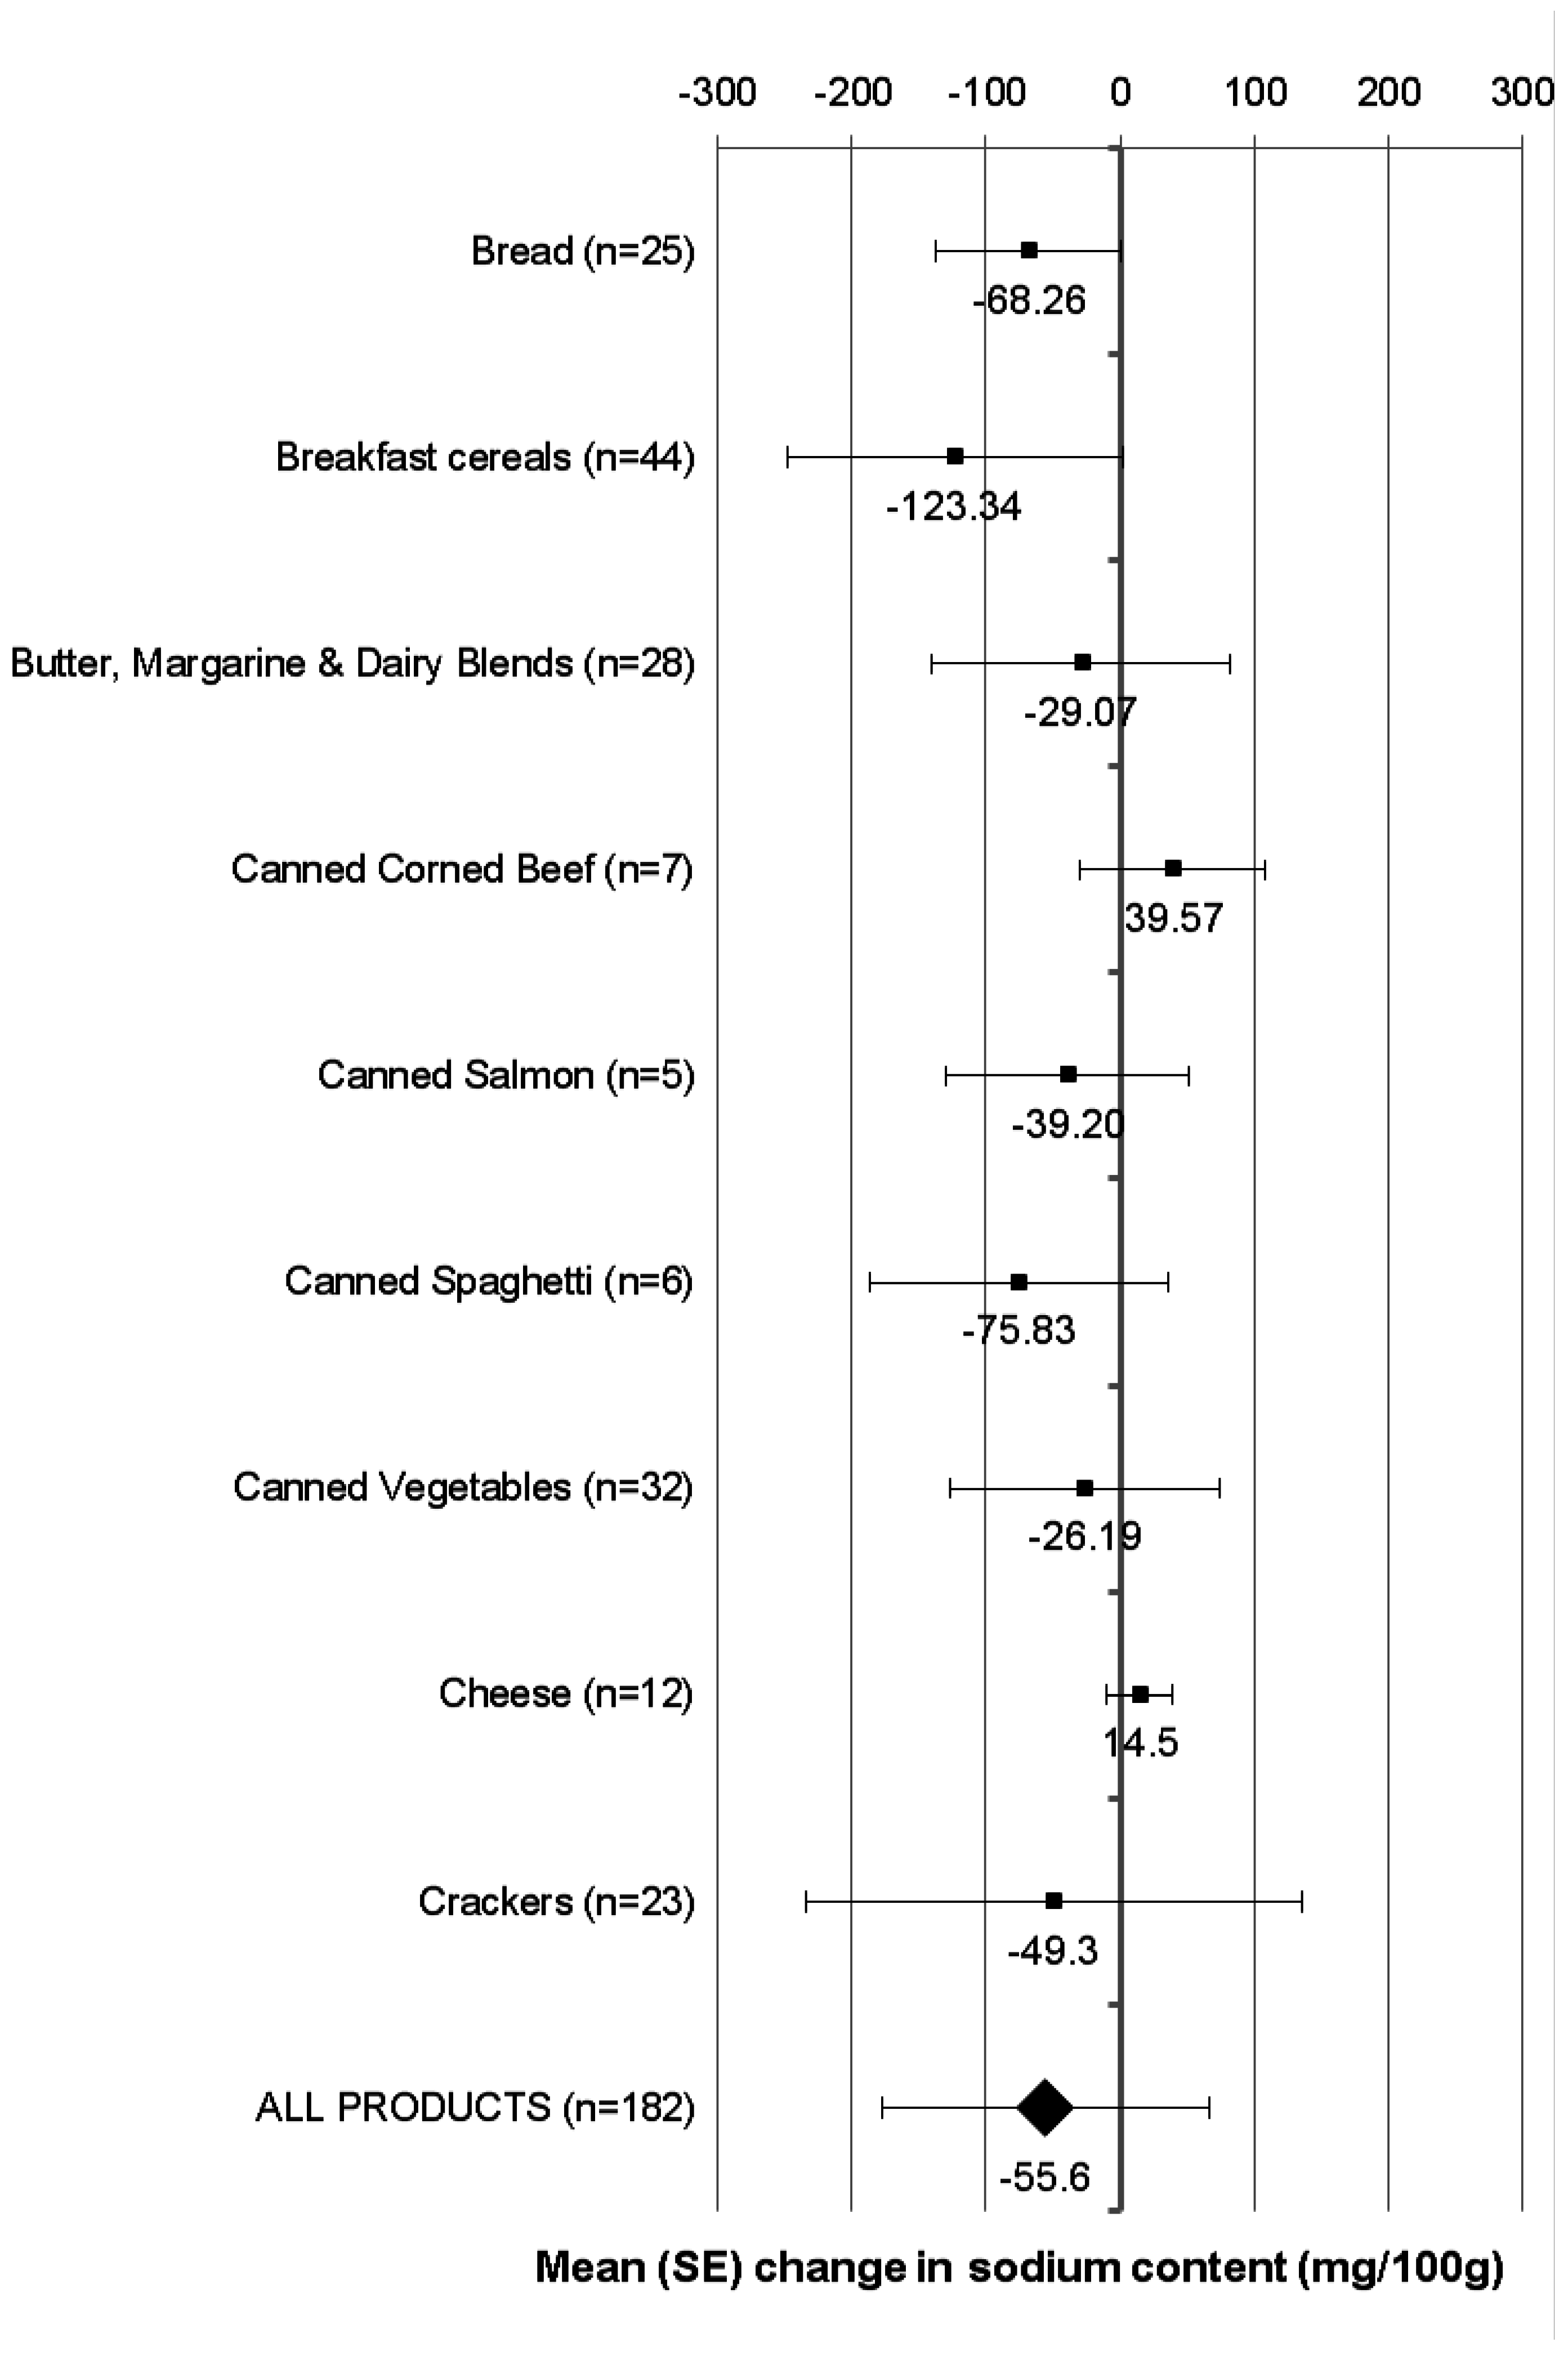
3.2. Change in Sodium Content of Matched Products Available for Sale in Both 2003 and 2013

The mean (SD) sodium content of matched products available for sale (n = 182) in 2003 was 454 (257) mg(100 g)−1 and in 2013 was 399 (232) mg (100 g)−1 (Supplementary data). The overall mean (SD) difference in sodium content was −56 (122) mg (100 g)−1 or 12% (p = 0.22; Figure 1). In seven of nine food groups assessed reductions in mean sodium content were evident (Figure 1), although there were too few products within food groups to undertake significance testing. The largest percentage reductions in sodium were observed for Breakfast Cereals (28%; mean (SD difference, −123 (125) mg (100 g)−1), Canned Spaghetti (15%; −76 (111) mg (100 g)−1) and Bread (14%; −68 (69) mg (100 g)−1). For two food groups there was an increase in mean sodium content (mean (SD) difference: Canned Corned Beef (40 (91) mg (100 g)−1 or 6%, and Cheese (15 (24) mg (100 g)−1 or 2%).
Figure 1. Mean difference in the sodium content of matched processed food products available for sale in both 2003 and 2013 (n = 182).
Nutrients 07 04054 g001

3.3. Sodium Content of Private Label and Branded Products in 2003 and 2013

For both years and for the majority of food groups assessed, the mean sodium content of private label products was higher than that of branded products (Table 2). The largest differences in mean sodium between branded and private label products in any year were: Canned Corned Beef in 2013 (645 vs. 910 mg (100 g)−1, respectively), Butter and Margarine in 2003 (421 vs. 608 mg (100 g)−1, respectively), Canned Salmon in 2003 (297 vs. 445 mg (100 g)−1), and Canned Spaghetti in 2013 (345 vs. 453 mg (100 g)−1, respectively) (Table 2).
Overall, there were statistically significant reductions in the sodium content of branded (n = 132) and private label (n = 52) matched products available for sale in both years (mean (SD) reduction: −50 (118) mg (100 g)−1 (p < 0.001) and −69 (133) mg (100 g)−1 (p < 0.001), respectively). There were too few products available to undertake paired/matched analyses by food group or category.

4. Discussion

The aim of this study was to explore 10-year (2003 to 2013) changes in the sodium content of New Zealand processed foods. The number of overall products available for sale each year in selected food groups was 323 in 2003 and 885 in 2013.
The mean (SD) sodium content of all products available for sale was similar in 2003 and 2013 (436 (263) mg (100 g)−1 vs. 433 (304) mg (100 g)−1, respectively). No significant difference was observed in the overall sodium content of matched products (available for sale in both years; n = 182; mean (SD) difference −56 (122) mg (100 g)−1, or 12%; p = 0.22). Too few products were available to undertake significance testing of matched products by food group. However, food groups with the largest percentage reductions were Breakfast cereals (28%), Canned Spaghetti (15%) and Bread (14%). Increases in sodium were observed for 2/9 food groups assessed (Canned corned beef and Cheese). Overall, the sodium content of matched branded (n = 132) and private label (n = 52) products reduced significantly over the ten year time period (mean (SD) reductions: −50 (118) mg (100 g)−1 (p < 0.001) in 2003 and −69 (133) mg (100 g)−1 (p < 0.001) in 2013).
These data are novel in that little data exists nationally on the sodium content of the processed food supply over longer periods of time, including for branded vs. private label foods, and across a wide range of food categories. However, the following limitations must be considered in reading the study findings. First, there were major changes in the food supply between 2003 and 2013 which impacted on the current analysis. For example, the availability of different types of food products has changed; the current analyses included 37 types of crackers in 2003 vs. 316 in 2013, and some products (such as sachets of flavoured oats) were not available in 2003. Changes in the number of products in a category may impact the overall mean sodium content of food products as categories with more products will provide a greater percentage contribution to the overall concentration of sodium in the total food supply. For example, crackers which have a high sodium content (637 mg (100 g)−1 in 2003 and 604 mg (100 g)−1 in 2013) comprised 11% of all products measured in 2003 and 36% of products in 2013. Inclusion of new products such as sachets of flavoured oats may also impact the overall mean sodium concentration, but would not have affected matched/paired analyses. Thus new products coming onto the market may increase the overall sodium concentration and off-set reformulation undertaken in foods such as Bread and Breakfast Cereals. Nonetheless, this reflects actual availability of sodium to consumers.
Table 2. Sodium content of key packaged food products available for sale in New Zealand supermarkets in 2003 and/or 2013, by brand or private label.
Sodium Content 2003 (mg (100 g)−1)Sodium Content 2013 (mg (100 g)−1)
NMeanSDMedianMinMaxNMeanSDMedianMinMax
BreadBranded294635945035056085408734101630
Private Label16488654903666001941634410366503
Breakfast cereals $Branded7332024728969201462011671911725
Private Label364063202947933302792372803780
Butter, margarine, and dairy blendsBranded3642189380360700524141363601700
Private Label146081425753777726486157475339680
Canned corned beefBranded977228175046313698645128637460820
Private Label1750.75075075039109905905920
Canned salmonBranded6297227273806002437312437576580
Private Label344539468400468833716536759538
Canned spaghettiBranded342040420380460103451303851455
Private Label6502151460370800345358465390505
Canned vegetablesBranded252231661900740792081461850583
Private Label1427319028010780371851131685440
Cheese ^Branded7669726705908004267269685315760
Private Label8653416306207101767634668620740
CrackersBranded336323846108139027760537860001810
Private Label4678238690410920395982845531001370
ALL PRODUCTSBranded2214212694000139072343631240001810
Private Label102468247475793316241726540031370
$ Other cereals included light flakes and fruit, brans, and all other cereals; ^ Cheese included only plain hard cheeses, e.g., Edam, Colby as these were the only types of cheeses collected in 2003.
Other limitations of the current analyses include that they may not represent the entire New Zealand food supply and are not weighted by sales; inclusion of sales weighted data gives a better indication of where best to reformulate to achieve the largest health gain [19]. Furthermore, a more precise picture of the trend in sodium levels would have been achieved should data have been available for each of the years between 2003 and 2013, and collection made from the same city and supermarkets to keep datasets more consistent. The collection of data in 2013 was more comprehensive and took place in a larger city meaning a larger overall data set for 2013 and a greater number of products within certain categories. However, some of this increase in products would likely have been due to natural increases in product variety in the food supply during the 10 year period of data coverage. Finally, our analyses do not include processed foods purchased for consumption outside the home including fast food and other restaurants. Food away from home is a significant contributor to nutrient intakes and comprises approximately one-quarter to one third of household food purchases by expenditure in New Zealand [20,21].
Reductions observed in matched food products in New Zealand over the past 10 years suggest reformulation efforts are likely due, at least in part, to manufacturer own internal sodium reduction programmes and support for sodium reduction from the Heart Foundation in the form of HeartSAFE [13] and the Tick Programme [22]. HeartSAFE for example has had sodium reduction guidelines in place for bread, breakfast cereals, and some processed meats (ham, bacon and sausages, but excluding canned corned beef) since 2010, and the Tick programme was estimated to have removed 33 tonnes of salt from the New Zealand food supply in the one year period between July 1998 and June 1999 [22].
However, these analyses illustrate that while progress with sodium reduction has been made in some important New Zealand food groups over the past 10 years, little progress has been made in the sodium density of the overall New Zealand food supply. As such, Government leadership of a national sodium reduction strategy including widespread action across the whole food supply and larger reductions in leading food sources such as bread will be key to achieving the UN (committed) 30% relative reduction [23] in the sodium intakes by 2025.
In addition to widespread reformulation efforts these analyses indicate where sodium reduction needs particular focus. Specific food groups and categories where there has been little change in the overall sodium concentration over the past 10 years (or even increases in sodium) were: Wheat Biscuits and Bites, Butter, Canned Salmon, Canned Tomatoes and Corn, and Cheese (Table 1). Moreover, food groups where little reformulation has taken place (according to matched analyses) were Canned Corned Beef and Cheese (Figure 1). The wide ranges observed (Table 1) across food groups and categories illustrate potential for sodium reduction, even in food groups where reductions have already been made.
Despite progress with reformulation in some food groups, the finding of no significant change in the average sodium content across the New Zealand processed food supply over the past 10 years is in contrast to what has been achieved via The United Kingdom’s (UK) salt reduction programme, which was led by the Food Standards Agency for approximately 10 years and is now being overseen by the Food Responsibility Deal [24]. The UK programme is recognised as one of the most successful salt reduction programmes globally and resulted in a 7% reduction (−26 mg (100 g)−1; p ≤ 0.001) in the sodium concentration of all processed foods between 2006 and 2011 indicating reformulation across the wider food supply [11]. In addition, a corresponding 7% reduction (−23 mg (100 g)−1; p < 0.001) was observed for matched/paired products. The reduction in sodium in UK processed foods was accompanied by a decrease in population dietary sodium intake, as assessed by 24-h urinary sodium excretion over a similar time period (1.4 g of salt (560 mg sodium) per day from 2001 to in 2011) [3]. Although the current New Zealand analysis included only nine food groups, compared with the UK analysis of the whole food supply, the reductions achieved in the UK for Bread and Breakfast Cereals were larger than the current findings for New Zealand (20% vs. 14% and 50% vs. 27%, respectively) [11].
In Australia the Food and Health Dialogue was launched by Federal Government in 2009 with voluntary targets for 10 categories of processed food. The targets for Bread, Ready-to-eat breakfast cereals and Processed meat were scheduled to be achieved by December 2013. Similar to the current findings for New Zealand, reductions were observed in the mean sodium content of matched Breads (New Zealand, 487 to 419 mg (100 g)−1 or 14%; Australia, 454 to 415 mg (100 g)−1 or 9%) and Breakfast Cereals (448 to 325 mg (100 g)−1 or 27% and 316 to 237 mg (100 g)−1 or 25%, respectively) [25]. Processed meats were not assessed in the current analyses, but reductions were observed over four years in Australia (2009 to 2013; 1215 to 1114 mg (100 g)−1 or 8%).
The UK and Australia successes indicate that a government-led national salt reduction strategy should be now be considered for New Zealand. Such a strategy should include targets for manufacturers, but also support as per the UK programme including a public awareness campaign of the importance of salt and health, and improved labelling (a new Health Star Rating front of pack labelling system has just been launched in New Zealand).
Further research should explore trends over time in the sodium content of the entire New Zealand food supply, ideally weighted by sales [19]. Key categories omitted from this analysis but important in terms of sodium intakes in New Zealand include Sauces, Soups, and Processed meats (particularly sausages, bacon and ham; processed meats in New Zealand have been shown to have a higher sodium content compared with the United Kingdom and Australia [26]).

5. Conclusions

There has been modest progress with sodium reduction in some New Zealand food categories over the past 10 years. However, increased action across the whole food supply and a greater focus on food categories which have shown minimal change or have increased since 2003 (Wheat Biscuits and Bites, Butter, Canned Salmon, Canned Tomatoes and Corn, Cheese, and Corned Beef) is now required. This is essential if New Zealand is to meet its commitment to a 30% relative reduction in population sodium intake by 2025 [23].

Supplementary Files

Supplementary File 1

Acknowledgments

Jo Wilson for collecting 2003 food composition data; and Ashmita Chand, Rita George, and Emma Shields for collecting and quality checking 2013 food composition data. Helen Eyles was funded by at Heart Foundation of New Zealand fellowship at the time of writing (#1463).

Author Contributions

DM conceived the study, managed collection of 2003 data, drafted the initial manuscript, and contributed to study design; CNM contributed to study design and provided overall advice on analyses and interpretation; YJ contributed to study design, provided statistical advice, and undertook paired analyses; DG provided overall advice on study design and interpretation of results; HE managed the collection of 2013 data, contributed to study design, revised the manuscript for submission, and undertook all other analyses. All authors contributed to the revision of the manuscript.

Conflicts of Interest

DM manages a government contract to support the food industry to reduce salt levels in processed foods. CNM has held two Heart Foundation of NZ Fellowships, been the recipient of Heart Foundation project grants, and is a member of the Heart Foundation Food and Nutrition Working Group. HE has held two Heart Foundation of NZ Fellowships, the recipient of two Heart Foundation project grants, and is a member of the Heart Foundation Tick Criteria Working Group (New Zealand).

References

  1. Lim, S.S.; Vos, T.; Flaxman, A.D.; Danaei, G.; Shibuya, K.; Adair-Rohani, H.; AlMazroa, M.A.; Amann, M.; Anderson, H.R.; Andrews, K.G.; et al. A comparative risk assessment of burden of disease and injury attributable to 67 risk factors and risk factor clusters in 21 regions, 1990–2010: A systematic analysis for the Global Burden of Disease Study 2010. Lancet. 2012, 380, 2224–2260. [Google Scholar] [CrossRef] [PubMed]
  2. World Health Organization. Guideline: Sodium Intake for Adults and Children. Available online: http://www.who.int/nutrition/publications/guidelines/sodium_intake_printversion.pdf (accessed on 18 February 2013).
  3. Sadler, K.; Nicholson, S.; Steer, T.; Gill, V.; Bates, B.; Tipping, S.; Cox, L.; Lennox, A.; Prentice, A. National Diet and Nutrition Survey—Assessment of Dietary Sodium in Adults (Aged 19 to 64 years) in England, 2011; Department of Health: London, United Kingdom, 2012.
  4. United States Department of Agriculture, Food Surveys Research Group. Sodium intake of the US population. In What We Eat in America, NHANES 2007–2008; 2011. Available online: www.ars.usda.gov/ba/bhnrc/fsrg (accessed on 22 May 2015). [Google Scholar]
  5. Slimani, N.; Deharveng, G.; Southgate, D.A.T.; Biessy, C.; Chajès, V.; van Bakel, M.M.E.; Boutron-Ruault, M.C.; McTaggart, A.; Grioni, S.; Verkaik-Kloosterman, J.; et al. Contribution of highly industrially processed foods to the nutrient intakes and patterns of middle-aged populations in the European Prospective Investigation into Cancer and Nutrition study. Eur. J. Clin. Nutr. 2009, 63, S206–S225. [Google Scholar] [CrossRef] [PubMed]
  6. Mason, H.; Shoaibi, A.; Ghandour, R.; O’Flaherty, M.; Capewell, S.; Khatib, R.; Jabr, S.; Unal, B.; Sözmen, K.; Arfa, C.; et al. A cost effectiveness analysis of salt reduction policies to reduce coronary heart disease in four Eastern Mediterranean countries. PLoS ONE 2014, 9, e84445. [Google Scholar] [CrossRef] [PubMed]
  7. Barton, P.; Andronis, L.; Briggs, A.; McPherson, K.; Capewell, S. Effectiveness and cost effectiveness of cardiovascular disease prevention in whole populations: Modelling study. Br. Med. J. 2011, 343, d4044. [Google Scholar] [CrossRef]
  8. Smith-Spangler, C.M.; Juusola, J.L.; Enns, E.A.; McPherson, K.; Capewell, S. Population strategies to decrease sodium intake and the burden of cardiovascular disease: A cost-effectiveness analysis. Ann. Int. Med. 2010, 1552, 481–487. [Google Scholar] [CrossRef]
  9. Kontis, V.; Mathers, C.D.; Rehm, J.; Stevens, G.A.; Shield, K.D.; Bonita, R.; Riley, L.M.; Poznyak, V.; Beaglehole, R.; Ezzati, M. Contribution of six risk factors to achieving the 25 × 25 non-communicable disease mortality reduction target: A modelling study. Lancet 2014. [Google Scholar] [CrossRef]
  10. Webster, J.L.; Trieu, K.; Dunford, E.; Hawkes, C. Target salt 2025: A global overview of national programs to encourage the food industry to reduce salt in foods. Nutrients 2014, 6, 3274–3287. [Google Scholar] [CrossRef] [PubMed]
  11. Eyles, H.; Webster, J.L.; Jebb, S.A.; Capelin, C.; Neal, B.; Ni, M.C. Impact of the UK voluntary sodium reduction targets on the sodium content of processed foods from 2006 to 2011: Analysis of household consumer panel data. Prev. Med. 2013, 57, 555–560. [Google Scholar] [CrossRef] [PubMed]
  12. Heart Foundation Tick Programme. Available online: http://www.heartfoundation.org.nz/healthy-living/healthy-eating/heart-foundation-tick/what-is-the-tick (accessed on 5 March 2015).
  13. Heart Foundation of New Zealand. HeartSAFE: Industry Commitment to Sodium Reduction. 2014. Available online: http://www.heartfoundation.org.nz/programmes-resources/food-industry-and-hospitality/heartsafe/industry-commitment-to-sodium-reduction (accessed on 27 May 2014).
  14. Monro, D.; Young, L.; Wilson, J.; Chisholm, A. The sodium content of low cost and private label foods; Implications for public health. J. N. Z. Diet. Assoc. 2004, 58, 4–10. [Google Scholar]
  15. Ministry of Health; University of Auckland. Nutrition and the Burden of Disease: New Zealand 1997–2011; Ministry of Health: Wellington, New Zealand, 2003.
  16. Food Standards Australia New Zealand. Nutrition Information User Guide to Standard 1.2.8 Nutrition Information Requirements. Available online: http://www.foodstandards.govt.nz/code/userguide/pages/nutritioninformation1406.aspx (accessed on 27 February 2015).
  17. National Institute for Health Innovation. Nutritrack: Reformulation of Processed Foods to Promote Health. Available online: http://nihi.auckland.ac.nz/page/current-research/our-nutrition-and-physical-activity-research/nutritrack-reformulation-processe (accessed on 12 February 2013).
  18. Global Market Information Database, 2014 version; Euromonitor International: London, UK, 2014.
  19. Eyles, H.; Ni Mhhurchu, C. Potential for electronic household food purchase data to enhance population nutrition monitoring. N. Z. Med. J. 2014, 127, 68–71. [Google Scholar] [PubMed]
  20. Australian Bureau of Statistics. Australian Social Trends; Australian Bureau of Statistics: Canberra, Australia, 2006.
  21. Statistics New Zealand. Household Economic Survey: Year Ended June 2013; Statistics New Zealand: Wellington, New Zealand, 2013.
  22. Young, L.; Swinburn, B. Impact of the Pick the Tick food information programme on the salt content of food in New Zealand. Health Prom. Int. 2002, 17, 13–19. [Google Scholar] [CrossRef]
  23. Beaglehole, R.; Bonita, R.; Ezzati, M.; Alleyne, G.; Dain, K.; Kishore, S.P.; Horton, R. NCD Countdown 2025: Accountability for the 25 × 25 NCD mortality reduction target. Lancet 2014, 384, 105–107. [Google Scholar] [CrossRef] [PubMed]
  24. Wyness, L.A.; Butriss, J.L.; Stanner, S.A. Reducing the population’s sodium intake: The UK Food Standards Agency’s salt reduction programme. Public Health Nutr. 2012, 15, 254–261. [Google Scholar] [CrossRef] [PubMed]
  25. Trevena, H.; Neal, B.; Dunford, E.; Wu, J.H.Y. An evaluation of the effects of the Australian Food and Health Dialogue targets on the sodium content of bread, breakfast cereals, and processed meats. Nutrients 2014, 6, 3802–3817. [Google Scholar] [CrossRef] [PubMed]
  26. Woodward, E.; Eyles, H.; Ni Mhurchu, C. Key opportunities for sodium reduction in New Zealand processed foods. Aust. N. Z. J. Public Health 2012, 36, 84–89. [Google Scholar] [CrossRef] [PubMed]

