
Effects of Interaction between SLC35F3 and Carbohydrate Intake on the Incidence of Metabolic Syndrome in Korean Middle-Aged Adults

Department of Food and Nutrition, Inha University, Incheon 22212, Republic of Korea
*
Author to whom correspondence should be addressed.
Nutrients 2023, 15(2), 469; https://doi.org/10.3390/nu15020469
Submission received: 13 December 2022
/
Revised: 6 January 2023
/
Accepted: 11 January 2023
/
Published: 16 January 2023
(This article belongs to the Section Carbohydrates)
Abstract
:Solute carrier family 35 member F3 (SLC35F3) mediates intracellular thiamine transport, which is crucial for carbohydrate metabolism as thiamine is required for key pathways such as glycolysis and the tricarboxylic acid cycle. This study aimed to investigate the impact of the interaction between SLC35F3 and dietary carbohydrate intake on the incidence of metabolic syndrome (MetS). The study included 3923 Korean adults over 40 years of age from the Korean Genome and Epidemiology Study. The association between dietary carbohydrate intake, SLC35F3 rs10910387 genotypes, and MetS incidence was studied using multivariable Cox proportional hazard models. Over an average of 8.5 years of follow-ups, we documented 1471 MetS cases. MetS incidence was 1.88 times greater in men with the TT genotype and the highest carbohydrate intake than in those with the CC genotype and lowest carbohydrate intake (Hazard Ratio (HR) 1.88, 95% confidence interval (CI) 1.03–3.41). MetS incidence were 2.22 and 2.53 times higher in women with the TT genotype and carbohydrate intake tertile 2 and 3, respectively, than those with the CC genotype and carbohydrate intake tertile 1 (HR 2.22, 95% CI 1.12–4.42; HR 2.53, 95% CI 1.38–4.61). In summary, we report a novel interaction between SLC35F3 rs10910387 genotypes and dietary carbohydrate intake on MetS in Koreans.
1. Introduction
The “Syndrome X” cluster of clinical features include hypertension, dyslipidemia, abdominal obesity, diabetes, and insulin resistance [1]. Syndrome X, renamed metabolic syndrome (MetS), is defined as condition characterized by three or more of the following five conditions: abdominal obesity, hypertriglyceridemia, hypertension, diabetes, and low-density lipoprotein (HDL) cholesterolemia [2,3].
The prevalence of MetS has increased in Korea over the last 12 years, from 21.5% in 2007 to 22.9% in 2018 [4]. It increased considerably among men, from 22.5% in 2007 to 27.9% in 2018 [4]. Cardiovascular and cerebrovascular diseases are the primary causes of death in Korea, and MetS further increases the prevalence and mortality rate of these disorders [5]. Furthermore, because MetS is primarily caused by insulin resistance, it may also increase the prevalence of type 2 diabetes. Therefore, addressing MetS from a preventive perspective is critical as this condition can increase the prevalence of other chronic diseases.
MetS is caused by complex interactions between environmental, metabolic, and genetic factors [6]. Dietary factors, along with environmental factors, contribute to the genetic susceptibility to MetS [7]. A high-carbohydrate diet is associated with an elevated risk of MetS, especially as rice is a core food in the Korean diet [8,9]. Studies performed in Korean adults aged between 40 and 69 years showed that a carbohydrate-derived energy higher than 75.2% increased the risk of MetS by 1.34 times compared to a carbohydrate-derived energy lower than 67% and was particularly associated with abdominal obesity (Odds ratio (OR) 1.34; 95% confidence interval (CI) 1.08–1.66) [10]. In Korean adults aged between 20 and 64 years, people who consumed more than 70.1% carbohydrate-derived energy increased the risk of MetS by 1.35 times in men and 1.27 times in women than those who consumed less than 61% of carbohydrates, regardless of other nutrients (OR 1.35, 95% CI 1.08–1.68; OR 1.27, 95% CI 1.03–1.56, respectively) [8]. Men aged 30-65 in the quintile 5 group with the highest carbohydrate intake were at 1.46 times higher risk of MetS than the lowest quintile group; moreover, women who consumed the highest in the quintiles of white rice and refined carbohydrates had a 1.72- and 1.74-fold higher risk of MetS, respectively, in comparison to those who consumed the lowest quintile of white rice and refined carbohydrates (OR 1.46, 95% CI 1.07–2.01; OR 1.72, 95% CI 1.24–2.40; OR 1.74, 95% CI 1.23–2.48, respectively) [9]. Therefore, these results show that high carbohydrate intake in Koreans increases the risk of MetS.
A genome-wide association study (GWAS), which has made it possible to study complex diseases affected by various genetic or environmental factors due to the development of human genetic projects and microarray technology, revealed the association between solute carrier family 35 member F3 (SLC35F3) and MetS risk [11]. SLC35F3 encodes a protein that facilitates intracellular thiamine migration. [12]. This gene is found on chromosome 1q42.2 and contains nine exons that encode a protein with 421 amino acids [13]. Korean men with the AT and AA genotypes of SLC35F3 rs12135117 had a 0.86-fold lower risk of hypertension than those with the TT genotype (OR 0.86, 95% CI 0.74–1.00); furthermore, Korean women with the TC genotype of rs10910387 had a 1.17-fold higher risk of hypertension than those with the TT genotype (OR 1.17, 95% CI 1.00–1.37) [14]. In Chinese patients with hypertension, the CG and GG genotypes of SLC35F3 rs34032258 were associated with elevated diastolic blood pressure levels [13]. Additionally, rs6699737 was associated with visceral fat and fasting plasma insulin [15]. Thus, SLC35F3 was associated with MetS risk factors such as blood pressure, insulin, and visceral fat.
SLC35F3 is also involved in carbohydrate metabolism [16,17,18]. SLC35F3 transports thiamine into the cell, a coenzyme of pyruvate dehydrogenase [16]. The pyruvate dehydrogenase complex acts as a central regulator of the tricarboxylic acid cycle, a determinant step in carbohydrate metabolism [17,18]. Thiamine deficiency reduces pyruvate dehydrogenase activity and decreases oxidation capacity [17]. In subjects with the rs17514104 TT genotype of SLC35F3, erythrocyte thiamine content was decreased, and hereditary cardiovascular characteristics associated with thiamine deficiency were predicted [19]. This is because people with this genotype exhibit changes in cardiac output and systemic vascular resistance, which are consistent with people with thiamine deficiency, who also experience both cardiovascular and neurological signs [19]. Elevated blood pressure has been linked to SLC35F3 variations associated with carbohydrate intake. SLC35F3 has been linked to hypertension risk and protein-caloric malnutrition, thereby reflecting the coenzyme function of thiamine in carbohydrate metabolism [20]. This suggests that the SLC35F3 may affect MetS through its role in carbohydrate metabolism.
Several studies have reported a link between carbohydrates and MetS, or between SLC35F3 and MetS components such as hypertension. However, few studies have investigated the association between carbohydrates, MetS, and SLC35F3. Moreover, few studies have used a prospective cohort study design to elucidate the association between variations in this gene and the incidence of MetS associated with carbohydrate intake in Korean adults. Therefore, the present study aimed to examine the effects of the interaction between SLC35F3 and carbohydrate consumption on the incidence of MetS in middle-aged Koreans.
2. Materials and Methods
2.1. Data Source and Study Participants
This prospective cohort study, which was based on Ansan-Ansung cohort data from the Korean Genome and Epidemiology Study (KoGES), utilized the Korean Association Resource Consortium (KARE) data. KoGES is a cohort study conducted to identify gene–environment interactions in chronic diseases common to Koreans [21]. Beginning in 2001, men and women between the ages of 40 and 69 who resided in Ansan and Ansung were recruited, and repeated examinations were conducted by recontacting the individuals every 2 years, with the 6th follow-up in 2013–2014. This study used data from the baseline to the 6th follow-up examination (2013–2014).
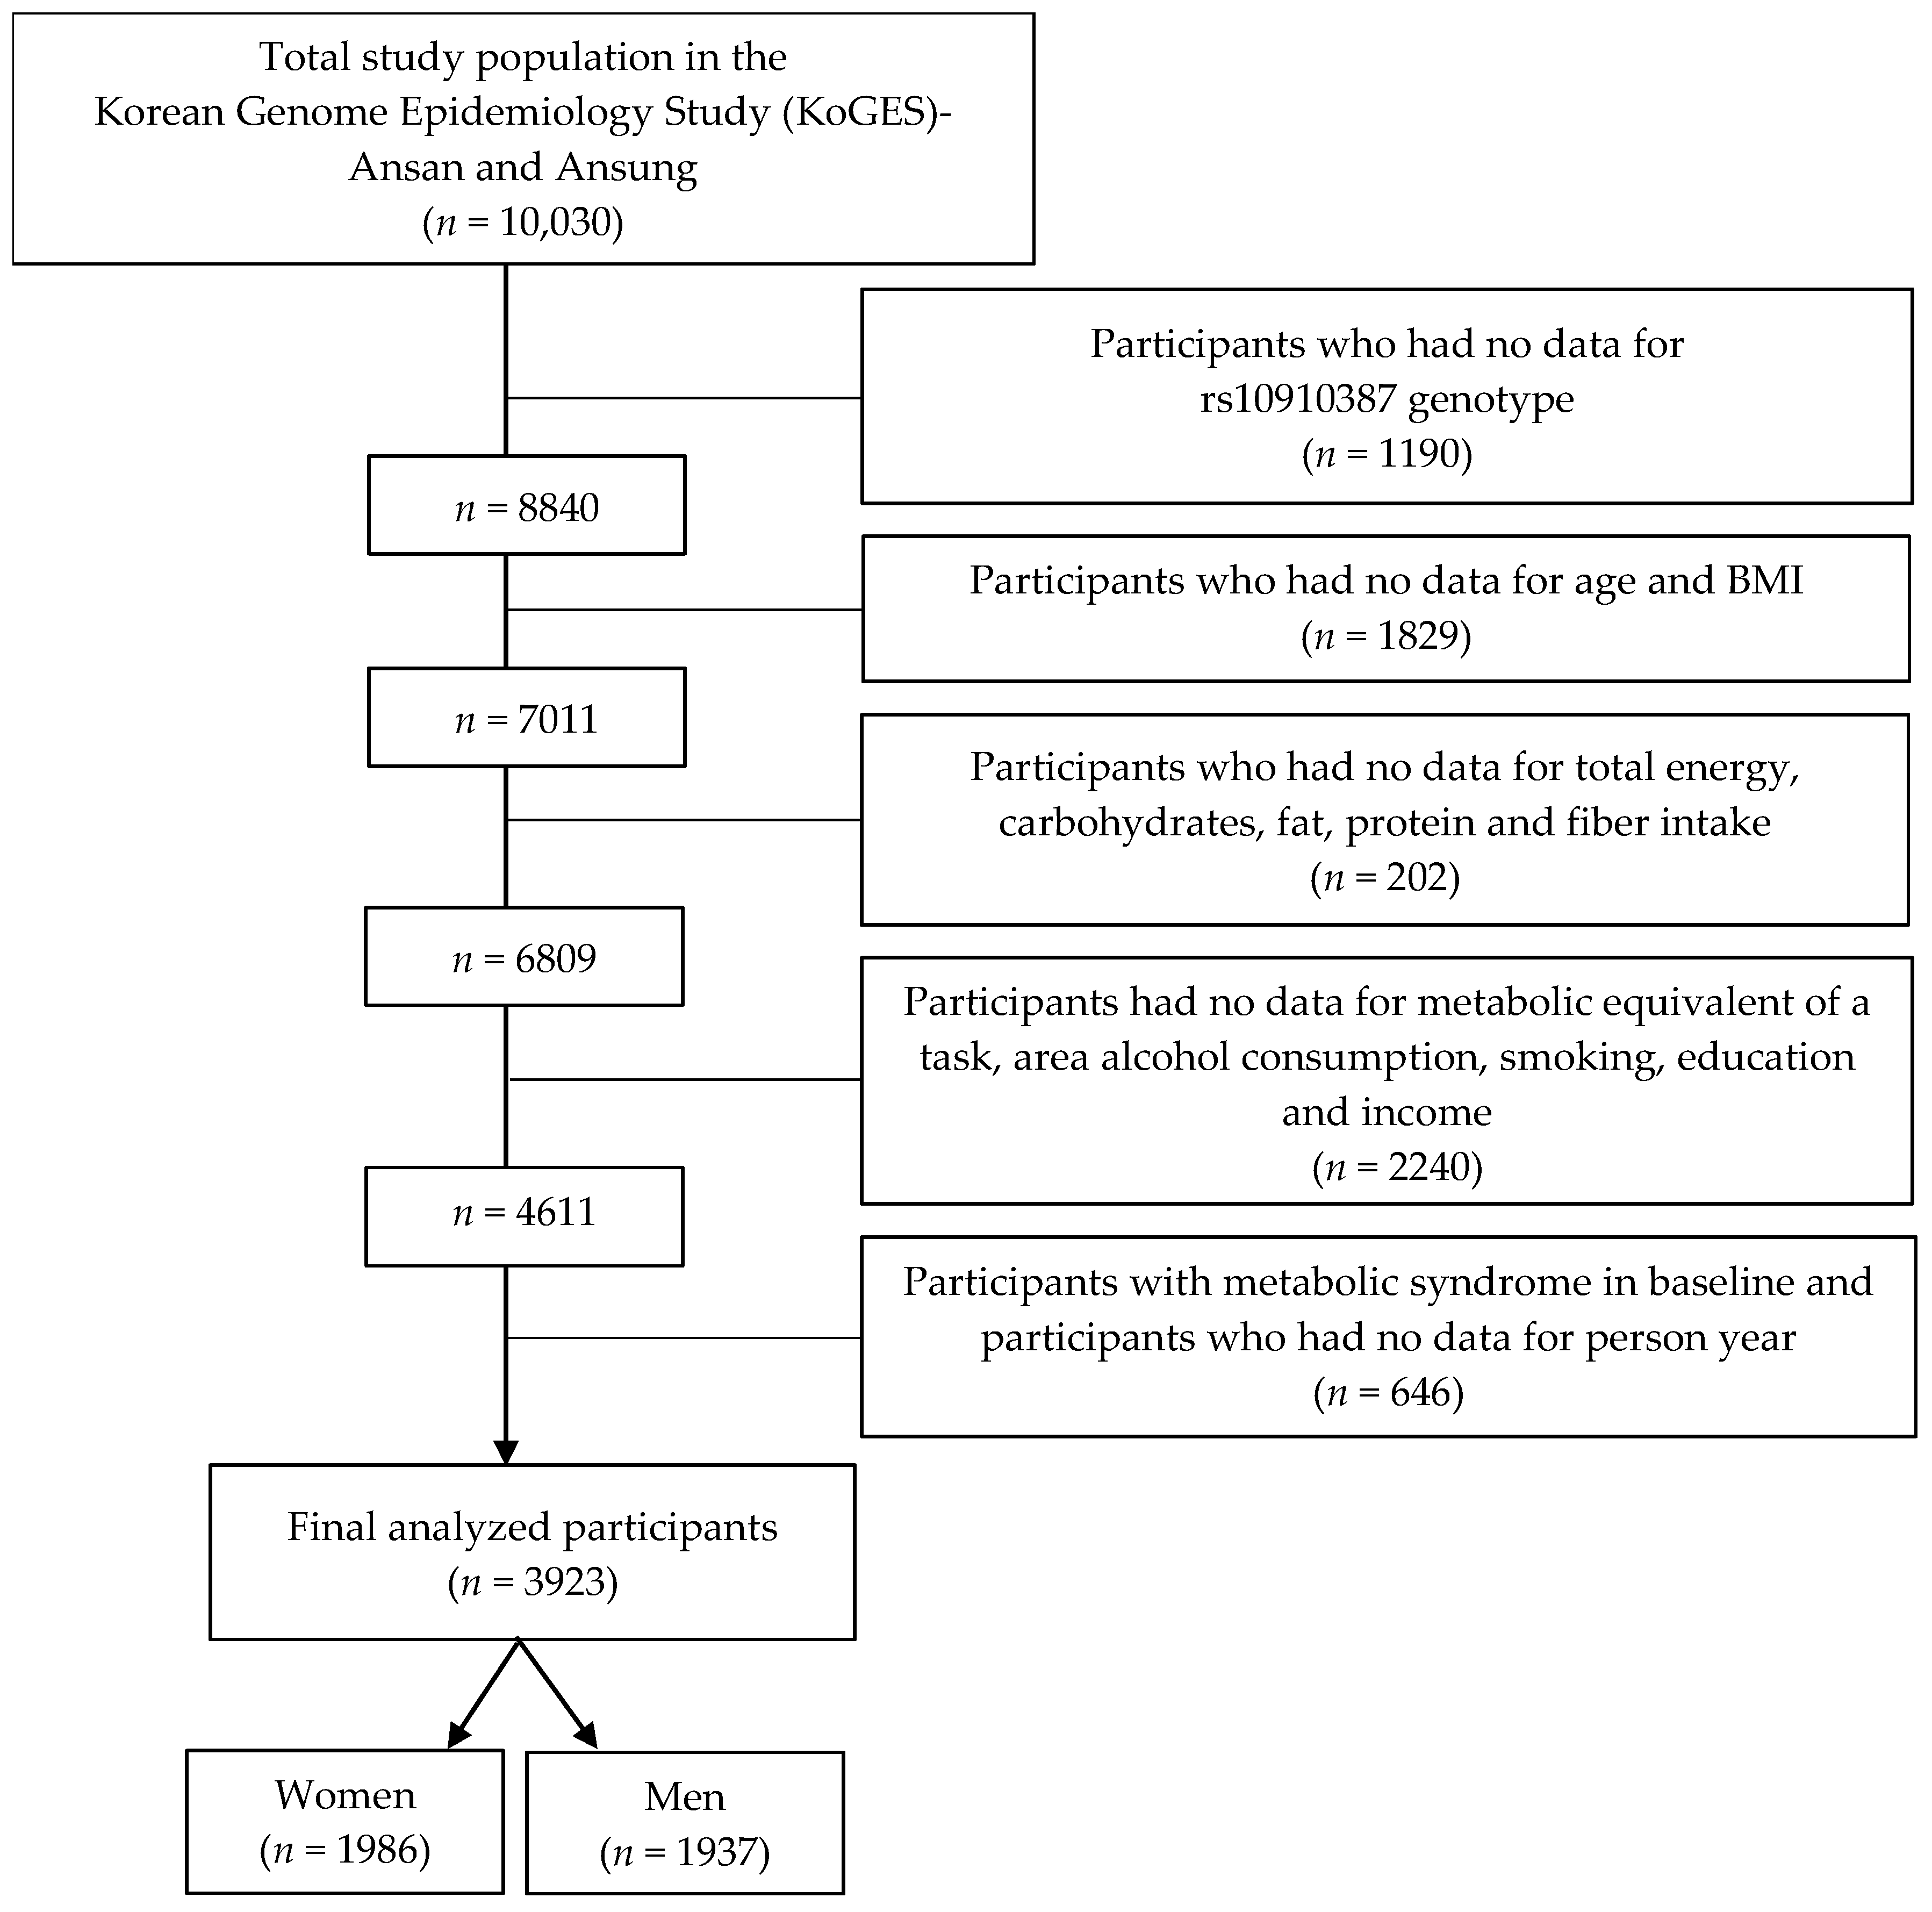
Out of a total of 10,030 participants, individuals were excluded according to the following criteria: individuals without rs10910387 genotyping data (n = 1190); people without age and body mass index (BMI) data (n = 1829); people without data on total energy, carbohydrate, fat, protein, and fiber intake (n = 202); people without data on metabolic equivalent of a task (MET), area, drinking status, smoking, education, and income (n = 2240); people with MetS in baseline and people without data on person-years (n = 646) (Figure 1). Ultimately, 3923 participants (1986 men and 1937 women) were included in the study.
2.2. Dietary Assessment
A baseline semi-quantitative food-frequency questionnaire (FFQ) was used to collect diet information. This FFQ presents 106 foods commonly consumed by Koreans, along with the reference amount, to investigate the yearly average consumption frequency and intake. This investigation was conducted under the assumption that eating habits do not change significantly. The intake frequency of food items was surveyed at a total of nine stages: almost no eating; once per month; 2–3 times per month; 1–2 times per week; 3–4 times per week; 5–6 times per week; once, twice, and thrice per day. The amount of intake for each food was assessed in three classifications: large, medium, and small. Responses were provided through observation of a picture of the presented amount. However, if there was no response to all FFQ items, there was no response to more than 12 FFQ items, there was no response to all rice items, or there was a high frequency of non-response, it was excluded from FFQ subjects. Additionally, a total energy intake per day lower than 100 kcal or greater than 10,000 kcal was removed from the FFQ analysis as abnormal energy intake. When calculating carbohydrate intake, foods that contribute to carbohydrates reaching 90% were selected, therefore, rice, barley, multigrain rice, rice cakes, ramen, noodles, dumplings, bread, pizza, hamburgers, cookies, potatoes, and sweet potatoes were used to obtain carbohydrate intake among 106 food groups in the FFQ.
Carbohydrate intake was differentially calculated to analyze HR and beta values. For the HR analysis, carbohydrate intake (g/day) was converted into % energy from carbohydrates. This was calculated by multiplying carbohydrate consumption (g/day) by four, dividing total energy intake (kcal/day), and multiplying by 100.
For beta value analysis, carbohydrate intake (g/day) was converted to carbohydrate intake g per 1000 kcal. This was calculated by dividing the carbohydrate intake (g/day) by the total energy intake (kcal/day) and multiplying by 1000.
2.3. Genotyping and Imputation
Based on the KARE genotyping data, single-nucleotide polymorphism (SNP) genotypes were chosen for this investigation. Affymetrix Genome-Wide Human SNP Array 5.0 (Affymetrix, Santa Clara, CA, USA) was used to genotype DNA samples. The exclusion criteria from analysis were as follows: genotype reading accuracy of less than 98%, high rates of missed genotype calls (4% or more), heterozygosity greater than 30%; or gender mismatch [22,23,24]. After genotyping, a GWAS was performed to select SNPs related to MetS. The relationship between each SNP and MetS incidence was assessed using multivariate logistic regression analysis adjusted for confounding variables.
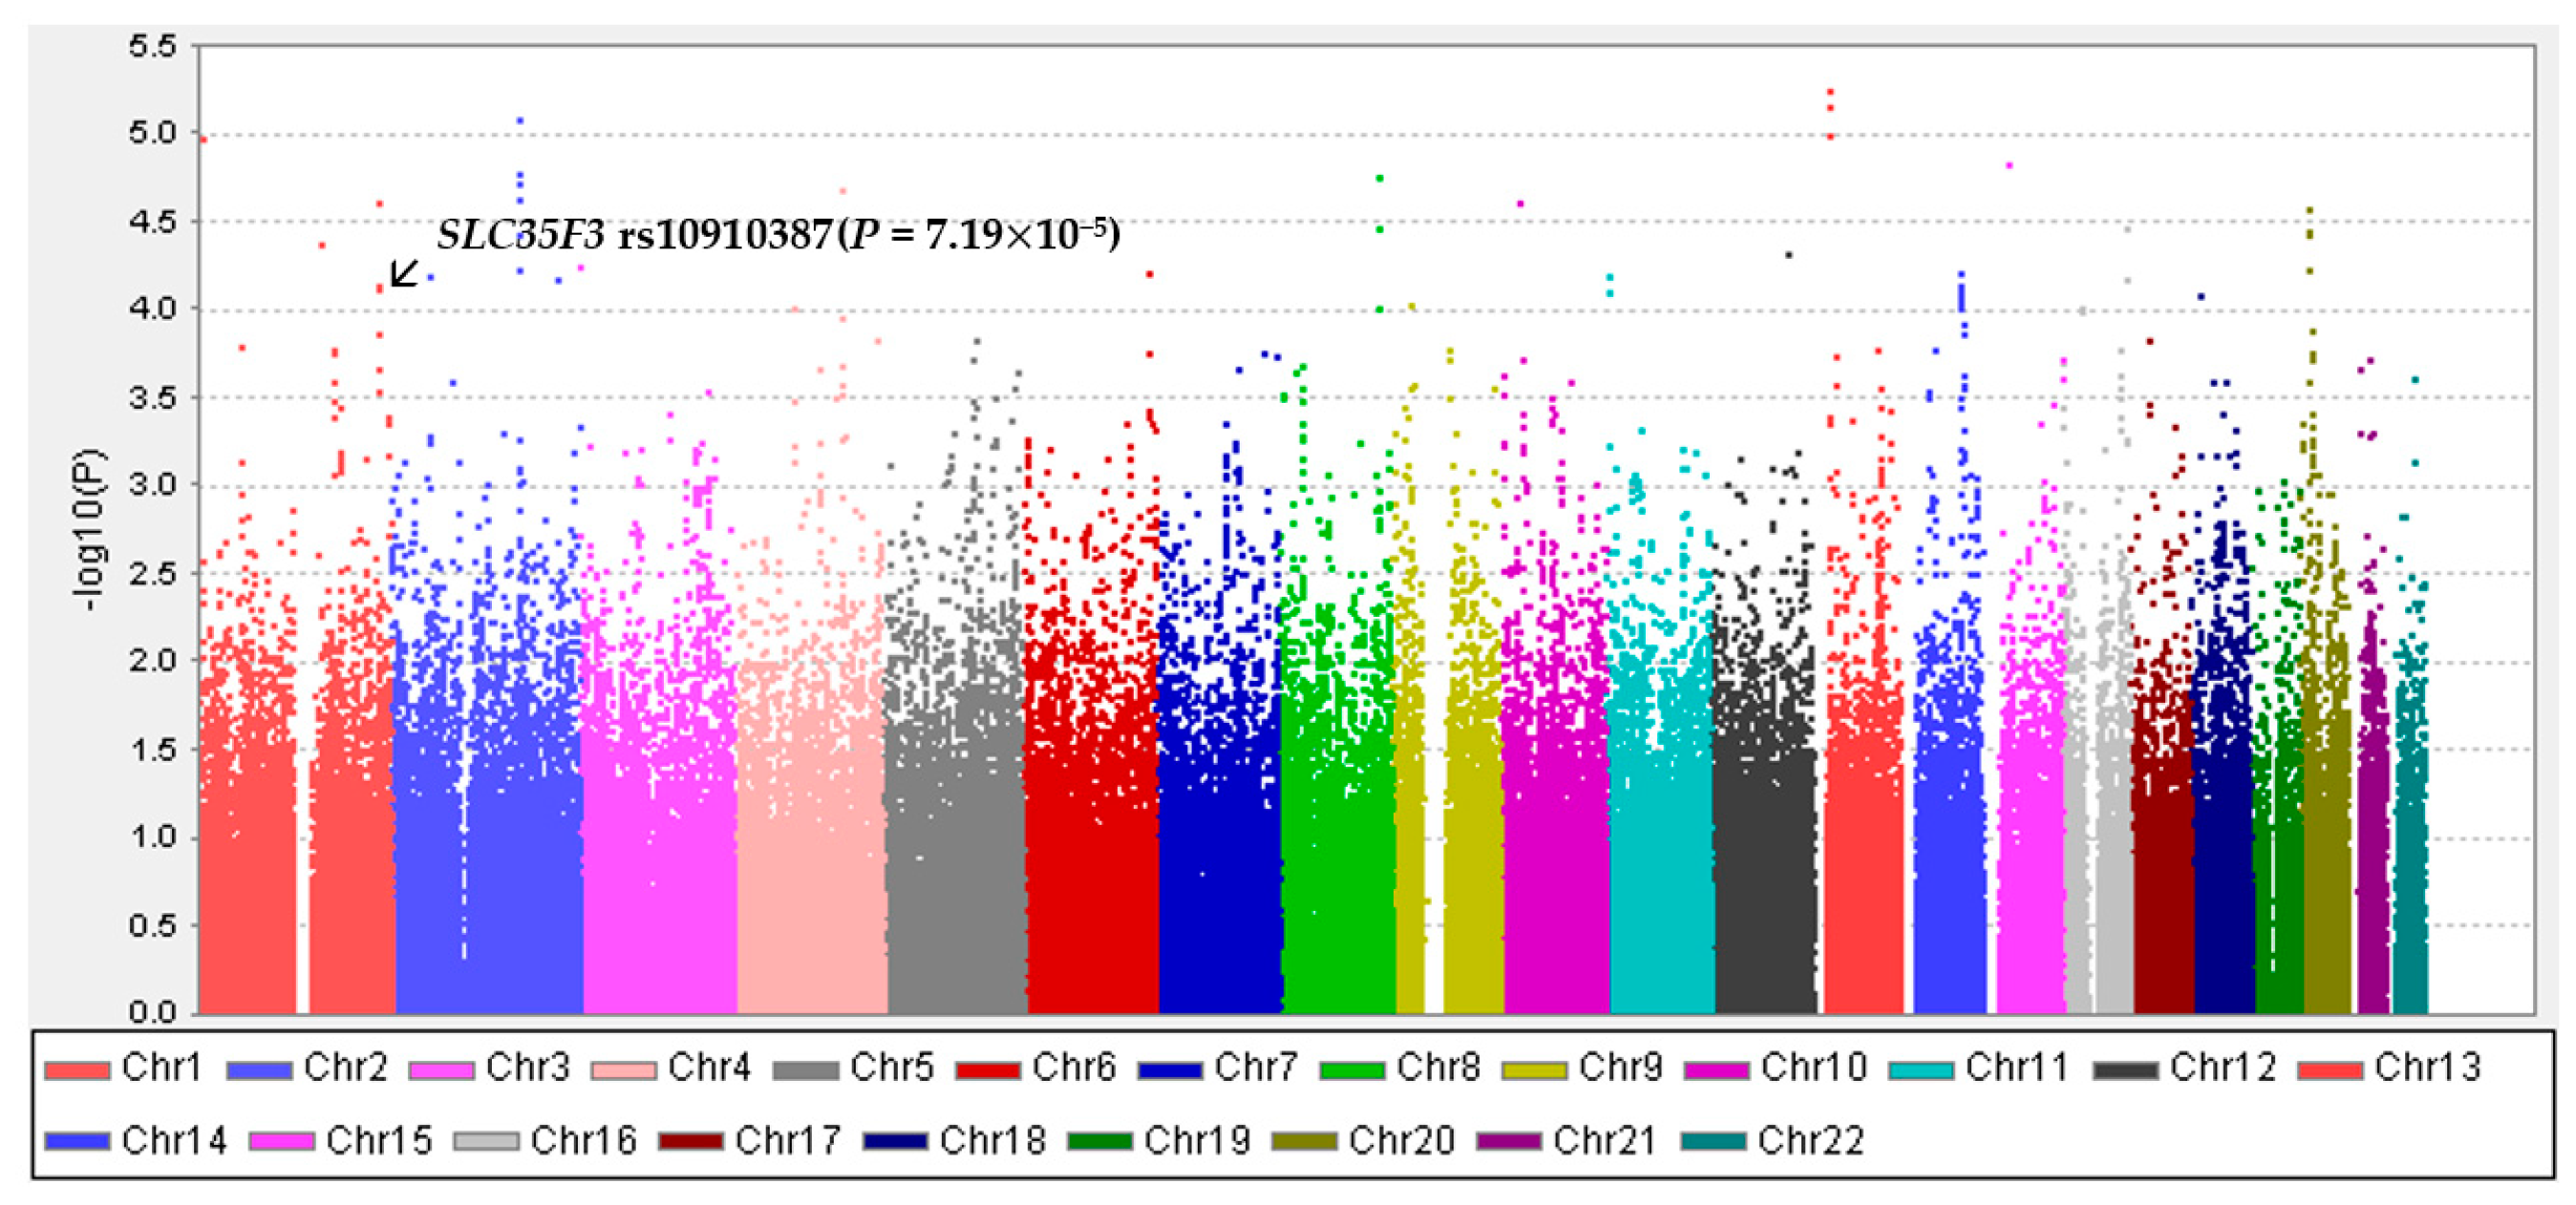
Rs10910387 of SLC35F3 with a p-value of 7.19 × 10⁻⁵ was selected (Figure 2). Of the 352,228 SNPs obtained, 8840 corresponding to rs10910387 were used in this study, and an additive model for rs10910387 was used. The rs10910387 CC genotype was divided into major genotypes, and the TC and TT genotypes were divided into minor genotypes.
2.4. Assessment of Metabolic Syndrome (MetS)
MetS was defined as the presence of three or more of the five following five components above the diagnostic threshold: waist circumference, blood pressure, blood glucose, triglycerides, and HDL-cholesterol. Participants with MetS were excluded from the analysis at baseline. MetS was evaluated from the second to the sixth follow-up. Clinical figures for the diagnosis of MetS were derived from the NCEP-ATP III and KSSO recommendations [25].
Abdominal obesity was considered as a waist measurement ≥90 cm for men and ≥80 cm for women. Waist circumference was measured horizontally between the iliac ridge and rib without the clothes except for light inner wear [26]. A systolic blood pressure of at least 130 mmHg, diastolic blood pressure of at least 85 mmHg, history of hypertension, use of antihypertensive drugs, or ongoing hypertension treatment were all considered elevated blood pressure. Blood pressure was measured at least twice per visit while supporting the arms and back and measuring the arms at the heart level. Elevated fasting blood glucose was defined if the fasting blood glucose exceeds 100 mg/dL, diagnosed with diabetes, ongoing diabetes treatment, insulin treatment, or oral diabetes medication [27]. Triglyceride levels above 150 mg/dL were defined as hypertriglyceridemia [28]. Hypo HDL-cholesterolemia was defined as HDL cholesterol levels of <40 mg/dL for men and 50 mg/dL for women [2]. Triglyceride, HDL-C, and fasting blood glucose levels were assessed using ADVIA 1650 [24].
2.5. Assessment of Other Variables
The study was conducted by correcting variables such as age, sex, region, smoking and drinking status, BMI, education, income, and MET. Categorical variables were sex (men/women), region (Ansan/Ansung), smoking (none/past/current), drinking (none/past/current), education (elementary—technical college/university/graduate school), and income (<1, 1–3, >3 million won/month).
Age, BMI, MET score, and total energy intake were continuous variables. BMI was measured using Inbody 3.0 (Biospace). Physical activity was measured based on MET, and the average MET value for each physical activity was calculated by distributing each MET value based on the amount of physical activity. The average MET value was multiplied by the conversion of activity to hours, and the sum of all values was used to calculate MET hours per day, which was then multiplied by seven to obtain MET hours per week.
2.6. Statistical Analyses
To compare the general characteristics of the participants depending on the presence of MetS and the genotype of SLC35F3 rs10910387, continuous variables were represented as mean standard deviation (SD) using the t-test and general linear model, and categorical variables were represented as frequency (%) using the chi-square test. PLINK 1.9 software (https://www.cog-genomics.org/plink/1.9, accessed on 20 October 2020) was used for genetic analysis. Carbohydrate intake in men and women was divided into tertiles to analyze the relationship between carbohydrate intake and MetS and the interaction between carbohydrates and genes on MetS and its elements (median (% energy from carbohydrates): men 63.4/69.5/75.3, women 64.9/71.6/77.4). MetS and its elements were set as dependent variables, and the genotype of SLC35F3 rs10910387 and carbohydrate intake were set as independent variables.
A multivariate Cox proportional hazards model was used to calculate the HR and 95% CI for the following associations: carbohydrate intake and MetS; genetic variants and MetS; gene variants and MetS and its elements based on carbohydrate. The relationship between gene and MetS components and between carbohydrate intake and MetS components was estimated using multiple linear regression analysis for beta values and standard deviations. For the analysis, age, area, drinking and smoking status, BMI, total energy consumption, level of education, income, and MET were adjusted. SAS 9.4 (SAS Institute, Cary, NC, USA) was used for each statistical analysis; the results were considered significant when the p-value was less than 0.05.
3. Results
3.1. General Characteristics of the Study Participants Based on the Presence of Metabolic Syndrome
Table 1 shows the general characteristics of the study participants according to the presence or absence of MetS. The proportion of rs10910387 genotypes differed significantly only in men (p < 0.05). The normal group had a higher proportion of CC genotypes than the MetS group, whereas the MetS group had a higher proportion of TC and TT genotypes. Women in the MetS group were older than those in the normal group (p < 0.05). BMI and MetS risk factors, such as triglyceride levels, systolic and diastolic blood pressure, waist circumference, and fasting blood glucose values, were significantly higher in the MetS group than in the normal group in both men and women, whereas HDL-cholesterol levels were significantly lower (all, p < 0.05). In women, dietary intake differed significantly between the two groups: the MetS group showed a higher daily average consumption of protein and fiber, and a lower daily average fat intake (all, p < 0.05). Women with MetS also showed higher MET levels (p < 0.05). Ansan (urban) had a higher proportion of men and women than Ansung (rural) in both of the groups (p < 0.05). Furthermore, education and income levels differed significantly only in women. In terms of education level, both the MetS and normal groups had significantly higher rates of elementary/technical college than the rate of more than university. In the case of income level, the rate of 1–3 million won per month was much higher than the rate of 1 or 3 million won per month (all, p < 0.05). In men, there were significant differences in smoking status, and in both the MetS and normal groups, the current smoking rate was considerably greater than the past/non-smoking rates (all, p < 0.05).
3.2. General Characteristics of the Study Participants Based on Genetic Variation
The general characteristics of the study participants based on the SLC35F3 rs10910387 genotype are shown in Table 2. Significant differences in the general characteristics according to genotype were found only in men. In men, the rs10910387 TC genotype had significantly higher diastolic blood pressure than the CC and TT genotypes (p < 0.05). The other variables did not differ significantly between the groups. Additionally, no significant differences were observed among the women.
3.3. Association of SLC35F3 rs10910387 with Metabolic Syndrome Components
Table 3 shows the GWAS results for the association between SLC35F3 rs10910387 and MetS components. The analysis was performed using an additive model of the gene. This relationship was investigated using linear regression analysis, while controlling for age, region, and sex. The rs10910387 minor allele was positively related with diastolic blood pressure and triglyceride levels (beta 0.46, p = 0.036; beta 5.54, p = 0.007). There were no significant associations with other metabolic syndrome components.
3.4. Metabolic Syndrome Incidence Depending on Genotypes of SLC35F3 rs10910387
Table 4 shows MetS incidence based on the rs10910387 genotype. In men, TC and TT genotypes of rs10910387 had a higher incidence of MetS. In a multivariate Cox proportional hazards model, men with the TC and TT genotypes had a 1.19- and 1.48-fold greater incidence of MetS, respectively, adjusting for confounding factors such as age, compared to men with the CC genotype (HR 1.19, 95% CI 1.02–1.39, p = 0.03; HR 1.48, 95% CI 1.07–2.04, p = 0.02). Among women, MetS incidence was shown to be higher in people with the TT genotype. MetS incidence was 2.15 times higher in women with the TT genotype than in women with the CC genotype in an adjusted multivariable Cox proportional hazard model (HR 2.15, 95% CI 1.44–3.21, p = 0.0002).
3.5. Association of Carbohydrate Intake with Metabolic Syndrome Components
The relationship between carbohydrate intake and MetS components is shown in Table 5. Triglycerides and HDL-C values were significantly associated with carbohydrate intake in men. As carbohydrate intake increased, triglyceride levels increased, and HDL-C levels decreased (beta 0.42, p = 0.005; beta −0.02, p = 0.043). In women, carbohydrate intake was significantly negatively related to HDL-C levels. As carbohydrate intake increased, HDL-C levels decreased (beta −0.04, p = 0.004).
3.6. Metabolic Syndrome Incidence Depending on Carbohydrate Intake
Table 6 shows the incidence of MetS according to the carbohydrate intake. In men, there was an inconsistent trend of decrease and then increase in the number of patients with MetS as carbohydrate intake increased. However, in women, a consistent pattern of increase in carbohydrate intake was observed. The association between carbohydrate intake and MetS was not significant in men (HR 0.98, 95% CI 0.80–1.19, p = 0.83). In women, there were no statistically significant findings (HR 0.95, 95% CI 0.77–1.17, p = 0.64).
3.7. Metabolic Syndrome Incidence Depending on the Genotype of rs10910387 by Carbohydrate Intake
Table 7 shows the effect of carbohydrate intake on the association between the rs10910387 genotype and MetS incidence. In both men and women, the effect of SLC35F3 variants on MetS incidence varied with carbohydrate intake. MetS incidence was 1.88 times higher in men with the TT genotype and with the highest carbohydrate intake than in those with the CC genotype and lowest carbohydrate intake (HR 1.88, 95% CI 1.03–3.41). In women, compared to the group with the CC genotype and tertile 1 of carbohydrate intake, the groups with the TT genotype and tertile 2 and 3 of carbohydrate intake exhibited a 2.22- and 2.53-fold increase in MetS incidence, respectively (HR 2.22, 95% CI 1.12–4.42; HR 2.53, 95% CI 1.38–4.61, respectively).
3.8. Metabolic Syndrome Components Incidence Depending on the Genotype of rs10910387 by Carbohydrate Intake
Table 8 displays the HR and 95% CI for the association between SLC35F3 rs10910387 genotype and MetS components related to carbohydrate intake. In the group with the lowest carbohydrate intake, men with the TT genotype had a higher incidence of low HDL-cholesterolemia than those with the CC genotype (HR 1.79, 95% CI 1.02–3.16). In the group with the lowest carbohydrate intake, women with the TC and TT genotypes were more likely to develop hyperglycemia than women with the CC genotype (HR 1.34, 95% CI 1.02–1.75; HR 1.93, 95% CI 1.04–3.57).
4. Discussion
In this study, the KoGES data was used to investigate the relationship between MetS and SLC35F3 in relation to carbohydrate intake. The T allele of SLC35F3 rs10910387 was a risk allele, increasing the incidence of MetS, and its components, such as triglyceride, and diastolic blood pressure levels. Although carbohydrate intake had no effect on MetS, it did affect triglyceride and HDL-C levels, both of which are MetS components. The effect of SLC35F3 variants on MetS incidence was found to be dependent on dietary carbohydrate intake. Men and women with the TT genotype and high carbohydrate intake had a higher MetS incidence than those with the CC genotype and low carbohydrate intake.
In this study, the SLC35F3 rs10910387 T allele is a risk allele, and people with this allele had an increased incidence of MetS, as well as high triglyceride and diastolic blood pressure levels, both of which are indicators of MetS. Therefore, this study supports the findings of previous research. Hypertension, a risk factor for MetS, has been linked with SLC35F3 [14,19]. In one study, SLC35F3 rs10910387 was found to be positively related to systolic blood pressure in Korean women, and the TC genotype of the SNP was positively related to diastolic blood pressure [14]. In a Chinese study, hypertensive individuals with the risk allele of SLC35F3 had higher diastolic blood pressure than those with the major allele [13]. According to another study, the risk allele of SLC35F3 predicted genetic cardiovascular characteristics with decreased vascular resistance [19]. SLC35F3 was significantly associated with visceral fat and fasting plasma insulin in addition to blood pressure [15].
Carbohydrate intake was not found to be related to MetS in this study, but was significantly associated with triglycerides and HDL-C, both of which are MetS components. Previous research into the link between carbohydrate intake and MetS has yielded inconsistent results. Studies conducted in Korea have discovered a significant relationship between carbohydrate consumption and MetS [8,9,10,29]. In one study, those with high carbohydrate intake had an unbalanced intake of macronutrients and other nutrients because they consumed more grains such as rice and fewer side dishes, and the risk of MetS increased with carbohydrate intake [10,30]. In another study, more than 70% of the energy intake ratio from carbohydrates was linked to an increase in BMI, blood pressure, fasting blood glucose, LDL cholesterol, and triglycerides in Korean women [29]. Even after controlling for covariates, low HDL-cholesterol and diabetes risk were found to be more prevalent among women with higher carbohydrate consumption [29]. However, other studies found no relationship between MetS and carbohydrate intake. No association between carbohydrate intake and MetS was found in a cross-sectional study of American adults [31]. Studies in China and Japan also revealed no connection between rice intake and metabolic diseases such as MetS and cardiovascular disorders [32,33]. Among elderly men living in Yangpyeong, no significant relationship was found between MetS elements and carbohydrate-related blood glucose values [34,35]. The carbohydrate glycemic index and load showed no association with HDL-C level, waist circumference, triglycerides, and fasting blood glucose [34]. Previous studies, including this study, would have been inconsistent with the results because the participants had different races and regions of residence, and, thus, different sources of carbohydrate intake. Furthermore, differences were observed based on the carbohydrate intake calculation method and dietary factors examined. Studies in Korea that found significant results mostly analyzed the association with MetS using the energy percentage of carbohydrates, whereas studies that did not show significant results were analyzed using carbohydrate intake (g/day) and carbohydrate-related dietary factors rather than a nutrient called carbohydrate. These studies indicate that it is difficult to conclude whether a single carbohydrate nutrient is directly related to MetS [36]. A type of carbohydrate, dietary fiber intake, was inversely associated with the risk of MetS [37,38]. Dietary fiber is carbohydrate that resists digestion and absorption in the small intestine with full or partial fermentation in the large intestine [39]. Dietary fiber reduces appetite and energy intake by inducing a feeling of satiety, and phytochemicals found in foods rich in dietary fiber help prevent MetS by suppressing oxidative stress and inflammation [40,41,42].
The carbohydrate quality index (CQI) is defined by the combination of several single components into a composite index, because a single nutrient cannot adequately capture the total quality of carbohydrate nutrition [43,44]. This index is an indicator of dietary carbohydrate quality, including the intake of whole grains, total fiber, glycemic index, and solid and liquid carbohydrates [45]. A previous study found an inverse relationship between the CQI and MetS [46]. In other words, MetS can be affected by the quality of carbohydrates as well as the amount of carbohydrates.
The present study showed that individuals with the TT genotype of SLC35F3 rs10910387 were more likely to develop incidence of MetS when consuming a high-carbohydrate diet. In the analysis with MetS components, men with the TT genotype and the lowest carbohydrate intake were more likely to develop hypo HDL-cholesterolemia than men with the CC genotype and the lowest carbohydrate intake. Women with the TC and TT genotypes and the lowest carbohydrate intake had an increased incidence of hyperglycemia. This demonstrated that the SLC35F3 rs10910387 T allele is a risk allele associated with MetS and its components, thereby clarifying the effect of SLC35F3 and carbohydrate intake interactions on MetS. SLC35F3 mediates the transport of thiamine, which acts as a coenzyme in carbohydrate metabolism in cells with increased energy requirements [47]. However, the SLC35F3 risk allele (T allele) reduces the blood thiamine content [19]. In a previous study, the SLC35F3 risk allele was found to be associated with inherited cardiovascular traits related to thiamine deficiency [19]. The cardiovascular characteristics induced by this allele include changes in heart rate, systemic vascular resistance, and pressure response, as well as impaired insulin synthesis and secretion and increased metabolic dysfunction [48,49]. In patients with diabetes, plasma thiamine levels were up to 76% lower than those in the control group, and thiamine-dependent enzymatic activity was found to be decreased in diabetic patients [50,51]. This showed that the risk allele of SLC35F3 decreases thiamine, which is related to MetS such as cardiovascular disease and diabetes. In previous studies, thiamine deficiency is particularly dangerous in high-carbohydrate diets as it increased the metabolic requirements for thiamine [52]. However, a high-carbohydrate diet also lowers thiamine levels [53]. Adults who consumed high carbohydrates extracted from refined sugar and rice and had an unbalanced diet that consumed high carbohydrates were more likely to develop thiamine deficiency [54]. According to a previous study, when more than 55% of the total caloric intake was carbohydrate, the thiamine concentration decreased, and as carbohydrate intake increased, the thiamine concentration decreased further [53]. Thiamine deficiency caused by high carbohydrate intake is common in MetS and causes hypertension, hyperglycemia, and insulin resistance [55,56,57]. That is, a high-carbohydrate diet is metabolically linked to cardiovascular and metabolic illnesses by interacting with SLC35F3 in connection with thiamine [58]. In summary, a high-carbohydrate diet and SLC35F3 genetic variants induced thiamin deficiency, which may lead to the incidence of MetS.
This study has several strengths. First, it is the first study to identify how the interaction of SLC35F3 with carbohydrates affects MetS in the Korean population. Additionally, this study has the distinction of being the first to use a prospective study design to identify the link between SLC35F3 and MetS. Finally, as the study’s confounding variables, including age and BMI, were adjusted for in the analysis, it was possible to identify an independent impact of the interaction between carbohydrates and the SLC35F3 gene variants on MetS. However, this study has some limitations. First, because this was a prospective cohort study, it was not possible to determine the mechanism by which the interaction between carbohydrates and genes affects MetS. Additionally, because the study was conducted on a specific population residing in Ansan and Ansung, generalizing the results to the entire Korean population is difficult. Finally, as the participants in this study were middle-aged and generally consumed large amount of carbohydrates, the carbohydrate intake variations of the participants were not large.
In conclusion, the risk allele of SLC35F3 rs10910387 increased the incidence of MetS. The TC and TT genotypes of SLC35F3 rs10910387 increased the incidence of MetS in men, and the TT genotype increased the incidence of MetS in women. Furthermore, high carbohydrate intake strengthened the link between SLC35F3 rs10910387 minor allele and MetS in middle-aged Koreans. The incidence of MetS was further increased when both men and women had the rs10910387 TT genotype and were on a high-carbohydrate diet. This suggests that a genetic predisposition may synergistically interact with dietary carbohydrates to determine MetS risk in the future. It is difficult to conclude that the intake amount of a single nutrient called carbohydrates is directly related to MetS, and Koreans consume carbohydrates through various sources. In the future, it will be necessary to study the effect of the interaction between the quality of carbohydrate intake and genetic variation on MetS, considering both carbohydrate intake and carbohydrate intake from various sources.
Author Contributions
Conceptualization, H.P. and D.S.; Methodology, H.P. and D.S.; Investigation, H.P. and D.S.; Data Curation, H.P. and D.S.; Writing—Original Draft Preparation, H.P. and D.S.; Writing—Review and Editing, H.P. and D.S.; Supervision, D.S.; Funding Acquisition, D.S. All authors have read and agreed to the published version of the manuscript.
Funding
This research was supported by the National Research Foundation of Korea (NRF) grant funded by the Korean government (MSIT) (No. 2020R1G1A1004940).
Institutional Review Board Statement
The studies involving human participants were reviewed and approved by the Institutional Review Board (IRB) of Inha University on 18 February 2022 (IRB No. 220215-1A).
Informed Consent Statement
The KoGES study was reviewed and approved by the institutional review board of the Korea Centers for Disease Control and Prevention. All participants voluntarily enrolled in the study and provided written informed consent. All study methods and protocols were conducted in accordance with the relevant institutional guidelines and regulations.
Data Availability Statement
The data underlying the results of our study are not publicly available, because of the data policy of KoGES. Data are available from the Division of Genetic Epidemiology and Health Index, NIH, Korea Centers for Disease Control and Prevention, for researchers who meet the criteria for access to confidential data.
Acknowledgments
This study was conducted with biosources from the National Biobank of Korea, Centers for Disease Control and Prevention, Republic of Korea (KBN-2020-016).
Conflicts of Interest
The authors declare no conflict of interest.
References
- Azeez, T.A.; Adeleye, J.; Enigbokan, O.A.; Adejimi, B.; Oladapo, J.S. Metabolic syndrome among Nigerians with type 2 diabetes mellitus: A comparative study of the diagnostic criteria. J. Cardio-Diabetes Metab. Disord. 2021, 1, 51. [Google Scholar] [CrossRef]
- Expert Panel on Detection, Evaluation; Treatment of High Blood Cholesterol in Adults. Executive summary of the third report of the National Cholesterol Education Program (NCEP) expert panel on detection, evaluation, and treatment of high blood cholesterol in adults (adult treatment panel III). JAMA 2001, 285, 2486–2497. [Google Scholar] [CrossRef]
- Meigs, J.B. Metabolic Syndrome (Insulin Resistance Syndrome or Syndrome X). 2019. Available online: https://www.uptodate.com/contents/metabolic-syndrome-insulin-resistance-syndrome-or-syndrome-x (accessed on 8 June 2022).
- Korean Society of Cardiometabolic Syndrome. Metabolic Syndrome Fact Sheet in Korea 2021. 2021. Available online: http://www.kscms.org/bbs//uploads/2021-04-28/6088c0095b48f.pdf (accessed on 30 March 2022).
- Park, S.; Yang, S.J. Factors Affecting Health Promotion Behavior among Workers with High Risk of Metabolic Syndrome: Based on Theory of Planned Behavior. J. Korean Acad. Community Health Nurs. 2015, 26, 128–139. [Google Scholar] [CrossRef]
- Feldeisen, S.E.; Tucker, K.L. Nutritional strategies in the prevention and treatment of metabolic syndrome. Appl. Physiol. Nutr. Metab. 2007, 32, 46–60. [Google Scholar] [CrossRef] [Green Version]
- Phillips, C.; Lopez-Miranda, J.; Perez-Jimenez, F.; McManus, R.; Roche, H.M. Genetic and nutrient determinants of the metabolic syndrome. Curr. Opin. Cardiol. 2006, 21, 185–193. [Google Scholar] [CrossRef] [PubMed]
- Kwon, Y.-J.; Lee, H.-S.; Lee, J.-W. Association of carbohydrate and fat intake with metabolic syndrome. Clin. Nutr. 2018, 37, 746–751. [Google Scholar] [CrossRef] [PubMed]
- Song, S.; Lee, J.E.; Song, W.O.; Paik, H.-Y.; Song, Y. Carbohydrate intake and refined-grain consumption are associated with metabolic syndrome in the Korean adult population. J. Acad. Nutr. Diet. 2014, 114, 54–62. [Google Scholar] [CrossRef] [PubMed]
- Cho, Y.-A.; Choi, J.-H. Association between carbohydrate intake and the prevalence of metabolic syndrome in Korean women. Nutrients 2021, 13, 3098. [Google Scholar] [CrossRef]
- Weiss, S.T.; Silverman, E.K. Pro: Genome-wide association studies (GWAS) in asthma. Am. J. Respir. Crit. Care Med. 2011, 184, 631–633. [Google Scholar] [CrossRef]
- Ortigoza-Escobar, J.D.; Molero-Luis, M.; Arias, A.; Martí-Sánchez, L.; Rodriguez-Pombo, P.; Artuch, R.; Pérez-Dueñas, B. Treatment of genetic defects of thiamine transport and metabolism. Expert Rev. Neurother. 2016, 16, 755–763. [Google Scholar] [CrossRef]
- Zang, X.-L.; Han, W.-Q.; Yang, F.-P.; Ji, K.-D.; Wang, J.-G.; Gao, P.-J.; He, G.; Wu, S.-N. Association of a SNP in SLC35F3 gene with the risk of hypertension in a Chinese han population. Front. Genet. 2016, 7, 108. [Google Scholar] [CrossRef] [Green Version]
- Seo, J.-Y.; Choi, J.-H. Genetic Variations in Thiamin Transferase SLC35F3 and the Risk of Hypertension in Koreans. Clin. Nutr. Res. 2021, 10, 140. [Google Scholar] [CrossRef]
- Hong, J.T.; Cho, Y.S. Identification of genetic loci associated with abdominal visceral adiposity in Korean populations. Genes Genom. 2017, 39, 541–548. [Google Scholar] [CrossRef]
- Sedel, F.; Challe, G.; Mayer, J.-M.; Boutron, A.; Fontaine, B.; Saudubray, J.M.; Brivet, M. Thiamine responsive pyruvate dehydrogenase deficiency in an adult with peripheral neuropathy and optic neuropathy. J. Neurol. Neurosurg. Psychiatry 2008, 79, 846–847. [Google Scholar] [CrossRef]
- Masuda, H.; Masuda, T.; Hatta, H. Effect of thiamin (vitamin B1) on carbohydrate metabolism at rest and during exercise. J. Sport. Med. Phys. Fit. 2015, 4, 337–341. [Google Scholar] [CrossRef] [Green Version]
- Seheult, J.; Fitzpatrick, G.; Boran, G. Lactic acidosis: An update. Clin. Chem. Lab. Med. 2017, 55, 322–333. [Google Scholar] [CrossRef] [PubMed]
- Zhang, K.; Huentelman, M.J.; Rao, F.; Sun, E.I.; Corneveaux, J.J.; Schork, A.J.; Wei, Z.; Waalen, J.; Miramontes-Gonzalez, J.P.; Hightower, C.M.; et al. Genetic implication of a novel thiamine transporter in human hypertension. J. Am. Coll. Cardiol. 2014, 63, 1542–1555. [Google Scholar] [CrossRef]
- Kim, M.K.; Park, J.H. Metabolic syndrome. J. Korean Med. Assoc. 2012, 55, 1005–1013. [Google Scholar] [CrossRef] [Green Version]
- Kim, Y.; Han, B.-G.; KoGES Group. Cohort profile: The Korean Genome and Epidemiology Study (KoGES) consortium. Int. J. Epidemiol. 2017, 46, e20. [Google Scholar]
- Choi, J.W.; Park, J.-S.; Lee, C.H. Genetically determined hypoalbuminemia as a risk factor for hypertension: Instrumental variable analysis. Sci. Rep. 2021, 11, 11290. [Google Scholar] [CrossRef] [PubMed]
- Ko, B.; Jin, H.-S. MACROD2 polymorphisms are associated with hypertension in Korean population. Korean J. Clin. Lab. Sci. 2019, 51, 57–63. [Google Scholar] [CrossRef]
- Park, H.-J.; Kim, S.-S.; Jin, H.-S. Genetic polymorphisms of SLC8A1 are associated with hypertension and left ventricular hypertrophy in the korean population. Korean J. Clin. Lab. Sci. 2019, 51, 286–293. [Google Scholar] [CrossRef] [Green Version]
- Choi, S.H.; Ahn, C.W.; Cha, B.S.; Chung, Y.-S.; Lee, K.W.; Lee, H.C.; Huh, K.B.; Kim, D.J. The prevalence of the metabolic syndrome in Korean adults: Comparison of WHO and NCEP criteria. Yonsei Med. J. 2005, 46, 198–205. [Google Scholar] [CrossRef] [Green Version]
- Lee, S.; Park, H.S.; Kim, S.M.; Kwon, H.S.; Kim, D.Y.; Kim, D.J.; Cho, G.J.; Han, J.H.; Kim, S.R.; Park, C.Y.; et al. Cut-off Points of Waist Circumference for Defining Abdominal Obesity in the Korean Population. J. Korean Soc. Study Obes. 2006, 15, 1–9. [Google Scholar]
- Ha, K.H.; Kim, D.J. Current status of managing diabetes mellitus in Korea. Korean J. Intern. Med. 2016, 31, 845. [Google Scholar] [CrossRef] [PubMed] [Green Version]
- Alberti, K.G.M.M.; Eckel, R.H.; Grundy, S.M.; Zimmet, P.Z.; Cleeman, J.I.; Donato, K.A.; Fruchart, J.-C.; James, W.P.T.; Loria, C.M.; Smith, S.C., Jr. Harmonizing the metabolic syndrome: A joint interim statement of the international diabetes federation task force on epidemiology and prevention; national heart, lung, and blood institute; American heart association; world heart federation; international atherosclerosis society; and international association for the study of obesity. Circulation 2009, 120, 1640–1645. [Google Scholar] [PubMed] [Green Version]
- Park, S.-H.; Lee, K.-S.; Park, H.-Y. Dietary carbohydrate intake is associated with cardiovascular disease risk in Korean: Analysis of the third Korea National Health and Nutrition Examination Survey (KNHANES III). Int. J. Cardiol. 2010, 139, 234–240. [Google Scholar] [CrossRef]
- Sakurai, M.; Nakagawa, H.; Kadota, A.; Yoshita, K.; Nakamura, Y.; Okuda, N.; Nishi, N.; Miyamoto, Y.; Arima, H.; Ohkubo, T.; et al. Macronutrient intake and socioeconomic status: NIPPON DATA2010. J. Epidemiol. 2018, 28 (Suppl. 3), S17–S22. [Google Scholar] [CrossRef] [Green Version]
- McKeown, N.M.; Meigs, J.B.; Liu, S.; Saltzman, E.; Wilson, P.W.F.; Jacques, P.F. Carbohydrate nutrition, insulin resistance, and the prevalence of the metabolic syndrome in the Framingham Offspring Cohort. Diabetes Care 2004, 27, 538–546. [Google Scholar] [CrossRef] [Green Version]
- Eshak, E.S.; Iso, H.; Yamagishi, K.; Kokubo, Y.; Saito, I.; Yatsuya, H.; Sawada, N.; Inoue, M.; Tsugane, S. Rice consumption is not associated with risk of cardiovascular disease morbidity or mortality in Japanese men and women: A large population-based, prospective cohort study. Am. J. Clin. Nutr. 2014, 100, 199–207. [Google Scholar] [CrossRef] [Green Version]
- Shi, Z.; Taylor, A.W.; Hu, G.; Gill, T.; Wittert, G.A. Rice intake, weight change and risk of the metabolic syndrome development among Chinese adults: The Jiangsu Nutrition Study (JIN). Asia Pac. J. Clin. Nutr. 2012, 21, 35–43. [Google Scholar] [PubMed]
- Dam, R.V.; Visscher, A.; Feskens, E.; Verhoef, P.; Kromhout, D. Dietary glycemic index in relation to metabolic risk factors and incidence of coronary heart disease: The Zutphen Elderly Study. Eur. J. Clin. Nutr. 2000, 54, 726–731. [Google Scholar] [PubMed]
- Kim, K.; Yun, S.H.; Choi, B.Y.; Kim, M.K. Cross-sectional relationship between dietary carbohydrate, glycaemic index, glycaemic load and risk of the metabolic syndrome in a Korean population. Br. J. Nutr. 2008, 100, 576–584. [Google Scholar] [CrossRef] [PubMed] [Green Version]
- Majdi, M.; Imani, H.; Bazshahi, E.; Hosseini, F.; Djafarian, K.; Lesani, A.; Akbarzade, Z.; Shab-Bidar, S. Habitual-and Meal-Specific Carbohydrate Quality Index and Their Relation to Metabolic Syndrome in a Sample of Iranian Adults. Front. Nutr. 2022, 9, 763345. [Google Scholar] [CrossRef] [PubMed]
- Silva, F.M.; Steemburgo, T.; de Mello, V.D.; Tonding, S.F.; Gross, J.L.; Azevedo, M.J. High dietary glycemic index and low fiber content are associated with metabolic syndrome in patients with type 2 diabetes. J. Am. Coll. Nutr. 2011, 30, 141–148. [Google Scholar] [CrossRef] [PubMed]
- Hosseinpour-Niazi, S.; Mirmiran, P.; Sohrab, G.; Hosseini-Esfahani, F.; Azizi, F. Inverse association between fruit, legume, and cereal fiber and the risk of metabolic syndrome: Tehran Lipid and Glucose Study. Diabetes Res. Clin. Pract. 2011, 94, 276–283. [Google Scholar] [CrossRef]
- Chen, J.-P.; Chen, G.-C.; Wang, X.-P.; Qin, L.; Bai, Y. Dietary fiber and metabolic syndrome: A meta-analysis and review of related mechanisms. Nutrients 2017, 10, 24. [Google Scholar] [CrossRef] [Green Version]
- Heaton, K.W. Food fibre as an obstacle to energy intake. Lancet 1973, 302, 1418–1421. [Google Scholar] [CrossRef]
- Slavin, J.L. Dietary fiber and body weight. Nutrition 2005, 21, 411–418. [Google Scholar] [CrossRef]
- Jakobsdottir, G.; Nyman, M.; Fåk, F. Designing future prebiotic fiber to target metabolic syndrome. Nutrition 2014, 30, 497–502. [Google Scholar] [CrossRef]
- Zazpe, I.; Sánchez-Taínta, A.; Santiago, S.; Fuente-Arrillaga, C.D.L.; Bes-Rastrollo, M.; Martínez, J.A.; Martínez-González, M.Á. Association between dietary carbohydrate intake quality and micronutrient intake adequacy in a Mediterranean cohort: The SUN (Seguimiento Universidad de Navarra) Project. Br. J. Nutr. 2014, 111, 2000–2009. [Google Scholar] [CrossRef] [PubMed] [Green Version]
- Suara, S.B.; Siassi, F.; Saaka, M.; Foroshani, A.R.; Sotoudeh, G. Association between Carbohydrate Quality Index and general and abdominal obesity in women: A cross-sectional study from Ghana. BMJ Open 2019, 9, e033038. [Google Scholar] [CrossRef] [PubMed]
- Bulló, M.; Papandreou, C.; Ruiz-Canela, M.; Guasch-Ferré, M.; Li, J.; Hernández-Alonso, P.; Toledo, E.; Liang, L.; Razquin, C.; Corella, D.; et al. Plasma metabolomic profiles of glycemic index, glycemic load, and carbohydrate quality index in the PREDIMED study. J. Nutr. 2021, 151, 50–58. [Google Scholar] [CrossRef] [PubMed]
- Suara, S.B.; Siassi, F.; Saaka, M.; Rahimiforoushani, A.; Sotoudeh, G. Relationship between dietary carbohydrate quality index and metabolic syndrome among type 2 diabetes mellitus subjects: A case-control study from Ghana. BMC Public Health 2021, 21, 526. [Google Scholar] [CrossRef] [PubMed]
- Martin, P.R.; Singleton, C.K.; Hiller-Sturmhöfel, S. The role of thiamine deficiency in alcoholic brain disease. Alcohol Res. Health 2003, 27, 134. [Google Scholar]
- Page, G.L.J.; Laight, D.; Cummings, M.H. Thiamine deficiency in diabetes mellitus and the impact of thiamine replacement on glucose metabolism and vascular disease. Int. J. Clin. Pract. 2011, 65, 684–690. [Google Scholar] [CrossRef] [Green Version]
- Shen, J.; Lai, C.-Q.; Mattei, J.; Ordovas, J.M.; Tucker, K.L. Association of vitamin B-6 status with inflammation, oxidative stress, and chronic inflammatory conditions: The Boston Puerto Rican Health Study. Am. J. Clin. Nutr. 2010, 91, 337–342. [Google Scholar] [CrossRef] [Green Version]
- Thornalley, P.J.; Babaei-Jadidi, R.; Ali, H.A.; Rabbani, N.; Antonysuni, A.; Larkin, J.; Ahmed, A.; Rayman, G.; Bodmer, C.W. High prevalence of low plasma thiamine concentration in diabetes linked to a marker of vascular disease. Diabetologia 2007, 50, 2164–2170. [Google Scholar] [CrossRef] [Green Version]
- Luong, K.V.Q.; Nguyena, L.T.H. The impact of thiamine treatment in the diabetes mellitus. J. Clin. Med. Res. 2012, 4, 153. [Google Scholar] [CrossRef] [Green Version]
- Fattal-Valevski, A.; Azouri-Fattal, I.; Greenstein, Y.J.; Guindy, M.; Blau, A.; Zelnik, N. Delayed language development due to infantile thiamine deficiency. Dev. Med. Child Neurol. 2009, 51, 629–634. [Google Scholar] [CrossRef]
- Elmadfa, I.; Majchrzak, D.; Rust, P.; Genser, D. The thiamine status of adult humans depends on carbohydrate intake. Int. J. Vitam. Nutr. Res. 2001, 71, 217–221. [Google Scholar] [CrossRef] [PubMed]
- Carrodeguas, L.; Kaidar-Person, O.; Szomstein, S.; Antozzi, P.; Rosenthal, R. Preoperative thiamine deficiency in obese population undergoing laparoscopic bariatric surgery. SOARD 2005, 1, 517–522. [Google Scholar] [CrossRef] [PubMed]
- Kerns, J.C.; Arundel, C.; Chawla, L.S. Thiamin deficiency in people with obesity. Adv. Nutr. 2015, 6, 147–153. [Google Scholar] [CrossRef] [PubMed]
- Mahdavifard, S.; Nakhjavani, M. Thiamine pyrophosphate improved vascular complications of diabetes in rats with type 2 diabetes by reducing glycation, oxidative stress, and inflammation markers. Med. J. Islam. Repub. Iran 2020, 34, 331–336. [Google Scholar] [CrossRef]
- Alaei-Shahmiri, F.; Soares, M.J.; Zhao, Y.; Sherriff, J. The impact of thiamine supplementation on blood pressure, serum lipids and C-reactive protein in individuals with hyperglycemia: A randomised, double-blind cross-over trial. Diabetes Metab. Syndr. Clin. Res. Rev. 2015, 9, 213–217. [Google Scholar] [CrossRef]
- Araújo, J.; Cai, J.; Stevens, J. Prevalence of optimal metabolic health in American adults: National Health and Nutrition Examination Survey 2009–2016. Metab. Syndr. Relat. Disord. 2019, 17, 46–52. [Google Scholar] [CrossRef]
Figure 1.
Flow chart for the study design: participants and exclusion criteria.

Figure 2.
Manhattan plots for genome-wide association study (GWAS) of metabolic syndrome.


Table 1.
General characteristics of the study participants based on the presence of metabolic syndrome.
Table 1.
General characteristics of the study participants based on the presence of metabolic syndrome.
| Variables | Men | p Value | Women | p Value | ||
|---|---|---|---|---|---|---|
| Metabolic Syndrome (n = 747) | No Metabolic Syndrome (n = 1239) | Metabolic Syndrome (n = 706) | No Metabolic Syndrome (n = 1231) | |||
| rs10910387 | 0.0002 | 0.05 | ||||
| CC | 470 (62.9%) | 864 (69.7%) | 479 (67.9%) | 870 (70.7%) | ||
| TC | 236 (31.6%) | 344 (27.8%) | 201 (28.5%) | 337 (27.4%) | ||
| TT | 41 (5.5%) | 31 (2.5%) | 26 (3.7%) | 24 (2.0%) | ||
| Age (years) | 50.4 ± 8.2 | 50.1 ± 8.6 | 0.47 | 52.7 ± 8.6 | 48.2 ± 7.7 | <0.0001 |
| BMI (kg/m2) | 24.7 ± 2.4 | 23.1 ± 2.5 | <0.0001 | 25.1 ± 2.9 | 23.4 ± 2.7 | <0.0001 |
| Waist circumference (cm) | 84.5 ± 5.8 | 79.7 ± 6.4 | <0.0001 | 81.2 ± 7.5 | 75.2 ± 7.5 | <0.0001 |
| Blood pressure | ||||||
| Systolic blood pressure (mmHg) | 121.5 ± 16.3 | 115.9 ± 15.0 | <0.0001 | 120.0 ± 16.6 | 109.5 ± 14.9 | <0.0001 |
| Diastolic blood pressure (mmHg) | 82.0 ± 10.5 | 78.1 ± 10.2 | <0.0001 | 78.4 ± 9.9 | 72.3 ± 9.7 | <0.0001 |
| Triglycerides (mg/dL) | 181.3 ± 128.4 | 132.7 ± 65.6 | <0.0001 | 133.2 ± 67.3 | 109.8 ± 49.0 | <0.0001 |
| Glucose (mg/dL) | 89.9 ± 19.8 | 85.6 ± 15.3 | <0.0001 | 83.9 ± 15.4 | 80.1 ± 9.7 | <0.0001 |
| HDL-cholesterol (mg/dL) | 42.6 ± 8.4 | 47.0 ± 10.0 | <0.0001 | 45.9 ± 9.1 | 49.9 ± 10.4 | <0.0001 |
| Dietary intake | ||||||
| Calorie intake (kcal) | 2038.7 ± 697.2 | 2013.6 ± 594.6 | 0.41 | 1901.9 ± 674.6 | 1881.8 ± 682.4 | 0.53 |
| Carbohydrate intake (g) | 71.5 ± 30.2 | 69.7 ± 26.2 | 0.18 | 64.1 ± 27.0 | 65.4 ± 32.7 | 0.34 |
| Fat intake (g) | 37.3 ± 23.2 | 36.6 ± 18.8 | 0.48 | 29.4 ± 17.3 | 32.3 ± 22.2 | 0.002 |
| Protein intake (g) | 348.7 ± 109.8 | 345.7 ± 97.7 | 0.54 | 340.8 ± 123.3 | 328.4 ± 108.1 | 0.03 |
| Fiber intake (g) | 7.0 ± 3.6 | 6.8 ± 3.0 | 0.11 | 7.2 ± 3.8 | 6.9 ± 3.3 | 0.04 |
| MET (hours/week) | 166.1 ± 102.4 | 159.2 ± 97.3 | 0.13 | 163.4 ± 102.3 | 143.0 ± 82.9 | <0.0001 |
| Area | 0.004 | <0.0001 | ||||
| Ansung | 241 (32.3%) | 325 (26.2%) | 329 (46.6%) | 295 (24.0%) | ||
| Ansan | 506 (67.7%) | 914 (73.8%) | 377 (53.4%) | 936 (76.0%) | ||
| Education | 0.07 | 0.007 | ||||
| Elementary/technical college | 611 (81.8%) | 1017 (82.1%) | 680 (96.3%) | 1143 (92.9%) | ||
| University | 119 (15.9%) | 173 (14.0%) | 23 (3.3%) | 81 (6.6%) | ||
| Graduate school | 17 (2.3%) | 49 (4.0%) | 3 (0.4%) | 7 (0.6%) | ||
| Income (million won/month) | 0.63 | <0.0001 | ||||
| <1 | 160 (21.4%) | 268 (21.6%) | 281 (39.8%) | 282 (22.9%) | ||
| 1–3 | 381 (51.0%) | 653 (52.7%) | 326 (46.2%) | 669 (54.4%) | ||
| >3 | 206 (27.6%) | 318 (25.7%) | 99 (14.0%) | 280 (22.8%) | ||
| Smoking | 0.004 | 0.49 | ||||
| None | 132 (17.7%) | 285 (23.0%) | 675 (95.6%) | 1189 (96.6%) | ||
| Past | 227 (30.4%) | 394 (31.8%) | 8 (1.1%) | 13 (1.1%) | ||
| Current | 388 (51.9%) | 560 (45.2%) | 23 (3.3%) | 29 (2.4%) | ||
| Drinking | 0.16 | 0.61 | ||||
| None | 129 (17.3%) | 237 (19.1%) | 470 (66.6%) | 837 (68.0%) | ||
| Past | 57 (7.6%) | 118 (9.5%) | 24 (3.4%) | 33 (2.7%) | ||
| Current | 561 (75.1%) | 884 (71.4%) | 212 (30.0%) | 361 (29.3%) | ||
Categorical variables are represented as number (%). Continuous variables are represented as mean ± SD. The p values were based on the t-test for continuous variables and the chi-square test for categorical variables. Abbreviations: BMI—Body mass index; HDL—High-density lipoprotein; MET—Metabolic equivalent of task.
Table 2.
General characteristics of the study participants based on the SLC35F3 rs10910387 genotype.
Table 2.
General characteristics of the study participants based on the SLC35F3 rs10910387 genotype.
| Variables | Men | p Value | Women | p Value | ||||
|---|---|---|---|---|---|---|---|---|
| CC (n = 1334) | TC (n = 580) | TT (n = 72) | CC (n = 1349) | TC (n = 538) | TT (n = 50) | |||
| Age (years) | 50.0 ± 8.3 | 50.6 ± 8.7 | 50.5 ± 9.3 | 0.42 | 49.9 ± 8.4 | 49.7 ± 8.1 | 48.1 ± 7.8 | 0.27 |
| BMI (kg/m2) | 23.6 ± 2.6 | 23.8 ± 2.6 | 24.3 ± 2.4 | 0.06 | 24.0 ± 2.8 | 24.0 ± 3.0 | 24.0 ± 2.8 | 0.98 |
| Waist circumference (cm) | 81.4 ± 6.7 | 81.8 ± 6.4 | 81.7 ± 6.4 | 0.39 | 77.3 ± 7.9 | 77.6 ± 8.3 | 77.1 ± 8.6 | 0.73 |
| Blood pressure | ||||||||
| Systolic blood pressure (mmHg) | 117.5 ± 15.5 | 119.0 ± 15.8 | 119.6 ± 18.9 | 0.09 | 113.2 ± 16.0 | 113.7 ± 17.0 | 112.2 ± 16.8 | 0.75 |
| Diastolic blood pressure (mmHg) | 79.2 ± 10.5 | 80.5 ± 10.5 | 79.2 ± 10.3 | 0.04 | 74.5 ± 10.1 | 74.5 ± 10.6 | 75.1 ± 9.7 | 0.92 |
| Triglycerides (mg/dL) | 148.0 ± 91.7 | 156.8 ± 109.4 | 158.5 ± 86.6 | 0.15 | 118.1 ± 56.9 | 119.5 ± 60.5 | 112.7 ± 37.0 | 0.7 |
| Glucose (mg/dL) | 87.5 ± 18.1 | 86.6 ± 15.1 | 87.3 ± 17.1 | 0.61 | 81.5 ± 12.3 | 81.3 ± 12.2 | 81.1 ± 7.3 | 0.92 |
| HDL-cholesterol (mg/dL) | 45.6 ± 9.6 | 44.8 ± 9.7 | 45.5 ± 10.6 | 0.23 | 48.4 ± 10.2 | 48.6 ± 10.0 | 47.7 ± 9.7 | 0.76 |
| Dietary intake | ||||||||
| Calorie intake (kcal) | 2018.2 ± 649.8 | 2035.0 ± 608.9 | 2018.7 ± 578.7 | 0.87 | 1889.0 ± 669.8 | 1903.8 ± 716.4 | 1735.6 ± 496.1 | 0.25 |
| Protein intake (g) | 70.1 ± 28.0 | 71.1 ± 27.7 | 69.3 ± 24.0 | 0.75 | 64.7 ± 29.4 | 65.9 ± 34.5 | 61.4 ± 22.9 | 0.54 |
| Fat intake (g) | 36.8 ± 20.9 | 37.3 ± 20.2 | 36.0 ± 16.5 | 0.81 | 31.1 ± 19.6 | 31.7 ± 23.1 | 29.4 ± 18.4 | 0.7 |
| Carbohydrate intake (g) | 346.1 ± 104.4 | 348.4 ± 98.8 | 348.8 ± 94.8 | 0.89 | 333.3 ± 113.1 | 334.8 ± 118.2 | 302.5 ± 85.7 | 0.16 |
| Fiber intake (g) | 6.8 ± 3.2 | 7.0 ± 3.3 | 6.8 ± 2.8 | 0.35 | 6.9 ± 3.4 | 7.2 ± 3.8 | 6.4 ± 2.9 | 0.3 |
| MET (hours/week) | 163.2 ± 99.0 | 161.1 ± 101.3 | 142.4 ± 86.6 | 0.22 | 149.7 ± 90.6 | 149.8 ± 91.9 | 178.8 ± 86.8 | 0.08 |
| Area | 0.29 | 0.67 | ||||||
| Ansung | 379 (28.4%) | 172 (29.7%) | 15 (20.8%) | 434 (32.2%) | 171 (31.8%) | 19 (38.0%) | ||
| Ansan | 955 (71.6%) | 408 (70.3%) | 57 (79.2%) | 915 (67.8%) | 367 (68.2%) | 31 (62.0%) | ||
| Education | 0.24 | 0.47 | ||||||
| Elementary/technical college | 1082 (81.1%) | 483 (83.3%) | 63 (87.5%) | 1267 (93.9%) | 506 (94.1%) | 50 (100.0%) | ||
| University | 208 (15.6%) | 75 (12.9%) | 9 (12.5%) | 74 (5.5%) | 30 (5.6%) | 0 (0%) | ||
| Graduate school | 44 (3.3%) | 22 (3.8%) | 0 (0%) | 8 (0.6%) | 2 (0.4%) | 0 (0%) | ||
| Income (million won/month) | 0.78 | 0.43 | ||||||
| <1 | 282 (21.1%) | 130 (22.4%) | 16 (22.2%) | 388 (28.8%) | 161 (29.9%) | 14 (28.0%) | ||
| 1–3 | 688 (51.6%) | 308 (53.1%) | 38 (52.8%) | 691 (51.2%) | 282 (52.4%) | 22 (44.0%) | ||
| >3 | 364 (27.3%) | 142 (24.5%) | 18 (25.0%) | 270 (20.0%) | 95 (17.7%) | 14 (28.0%) | ||
| Smoking | 0.7 | 0.32 | ||||||
| None | 281 (21.1%) | 118 (20.3%) | 18 (25.0%) | 1299 (96.3%) | 519 (96.5%) | 46 (92.0%) | ||
| Past | 410 (30.7%) | 192 (33.1%) | 19 (26.4%) | 12 (0.9%) | 8 (1.5%) | 1 (2.0%) | ||
| Current | 643 (48.2%) | 270 (46.6%) | 35 (48.6%) | 38 (2.8%) | 11 (2.0%) | 3 (6.0%) | ||
| Drinking | 0.81 | 0.61 | ||||||
| None | 243 (18.2%) | 106 (18.3%) | 17 (23.6%) | 907 (67.2%) | 367 (68.2%) | 33 (66.0%) | ||
| Past | 120 (9.0%) | 50 (8.6%) | 5 (6.9%) | 36 (2.7%) | 18 (3.4%) | 3 (6.0%) | ||
| Current | 971 (72.8%) | 424 (73.1%) | 50 (69.4%) | 406 (30.1%) | 153 (28.4%) | 14 (28.0%) | ||
Continuous variables are represented as mean ± SD. Categorical variables are represented as a number (%). The p values were based on the general linear model for continuous variables and the chi-square test for categorical variables. Abbreviations: BMI—Body mass index: HDL—High-density lipoprotein; MET—Metabolic equivalent of task.
Table 3.
Association of SLC35F3 rs10910387 with metabolic syndrome components.
| SNP | rs10910387 (SLC35F3) | |
|---|---|---|
| Minor Allele: T | Beta ± SE | Add p |
| Waist circumference (cm) | 0.23 ± 0.17 | 0.161 |
| Systolic blood pressure (mmHg) | 0.38 ± 1.11 | 0.266 |
| Diastolic blood pressure (mmHg) | 0.46 ± 2.10 | 0.036 |
| Triglycerides (mg/dL) | 5.54 ± 2.68 | 0.007 |
| Glucose (mg/dL) | 0.12 ± 0.27 | 0.784 |
| HDL-cholesterol (mg/dL) | −0.30 ± −1.53 | 0.126 |
Abbreviations: SE—Standard Error; Add—Additive model; HDL—High-Density Lipoprotein. Adjusted for age, area, and sex.
Table 4.
Adjusted hazard ratios (HRs) and 95% confidence intervals (CIs) of metabolic syndrome incidence depending on the genotype of SLC35F3 rs10910387.
Table 4.
Adjusted hazard ratios (HRs) and 95% confidence intervals (CIs) of metabolic syndrome incidence depending on the genotype of SLC35F3 rs10910387.
| Men | Metabolic Syndrome | ||
| rs10910387 (SLC35F3) | Cases/Total | HR (95% CI) | p Value |
| CC | 470/1334 | 1.00 (Ref) | |
| TC | 236/580 | 1.19 (1.02–1.39) | 0.03 |
| TT | 41/72 | 1.48 (1.07–2.04) | 0.02 |
| Women | Metabolic Syndrome | ||
| rs10910387 (SLC35F3) | Cases/Total | HR (95% CI) | p Value |
| CC | 479/1349 | 1.00 (Ref) | |
| TC | 201/538 | 1.11 (0.94–1.31) | 0.22 |
| TT | 26/50 | 2.15 (1.44–3.21) | 0.0002 |
Abbreviations: HR—Hazard Ratio; CI—Confidence Interval. Adjusted for age (years, continuous), area (Ansung, Ansan), BMI (kg/m2, continuous), smoking (none, past, current), drinking status (none, past, current), education (elementary—technical college, university, grade school), income (<1, 1–3, >3 million won/month), total energy intake (%, continuous), and metabolic equivalent of a task (continuous).
Table 5.
Association of carbohydrate intake (g/1000 kcal per day) with metabolic syndrome components.
Table 5.
Association of carbohydrate intake (g/1000 kcal per day) with metabolic syndrome components.
| Men (n = 1986) | Women (n = 1937) | |||
|---|---|---|---|---|
| Beta ± SE | p Value | Beta ± SE | p Value | |
| Waist circumference (cm) | −0.01 ± 0.01 | 0.082 | 0.01 ± 0.01 | 0.310 |
| Systolic blood pressure (mmHg) | 0.01 ± 0.02 | 0.648 | −0.003 ± 0.02 | 0.896 |
| Diastolic blood pressure (mmHg) | −0.01 ± 0.02 | 0.739 | 0.01 ± 0.01 | 0.375 |
| Triglycerides (mg/dL) | 0.42 ± 0.15 | 0.005 | 0.09 ± 0.09 | 0.284 |
| Fasting blood glucose (mg/dL) | −0.04 ± 0.03 | 0.113 | −0.003 ± 0.02 | 0.863 |
| HDL-cholesterol (mg/dL) | −0.02 ± 0.01 | 0.043 | −0.04 ± 0.02 | 0.004 |
Abbreviations: SE—Standard Error; CI—Confidence Interval; HDL—High-Density Lipoprotein. Adjusted for age (years, continuous), area (Ansung, Ansan), BMI (kg/m2, continuous), smoking (none, past, current), drinking status (none, past, current), education (elementary—technical college, university, grade school), income (<1, 1–3, >3 million won/month), total energy intake (%, continuous), and metabolic equivalent of a task (continuous).
Table 6.
Adjusted hazard ratios (HRs) and 95% confidence intervals (CIs) of metabolic syndrome incidence depending on carbohydrate intake.
Table 6.
Adjusted hazard ratios (HRs) and 95% confidence intervals (CIs) of metabolic syndrome incidence depending on carbohydrate intake.
| Men | Metabolic Syndrome | ||
| Carbohydrate (% Energy) | Cases/Total | HR (95% CI) | p Value |
| Tertile 1 | 258/662 | 1.00 (Ref) | |
| Tertile 2 | 231/662 | 0.87 (0.73–1.05) | 0.14 |
| Tertile 3 | 258/662 | 0.98 (0.80–1.19) | 0.83 |
| Women | Metabolic Syndrome | ||
| Carbohydrate (% Energy) | Cases/Total | HR (95% CI) | p Value |
| Tertile 1 | 191/645 | 1.00 (Ref) | |
| Tertile 2 | 233/646 | 1.07 (0.86–1.30) | 0.53 |
| Tertile 3 | 282/646 | 0.95 (0.77–1.17) | 0.64 |
Abbreviations: HR—Hazard Ratio; CI—Confidence Interval. Adjusted for age (years, continuous), area (Ansung, Ansan), BMI (kg/m2, continuous), smoking (none, past, current), drinking status (none, past, current), education (elementary—technical college, university, grade school), income (<1, 1–3, >3 million won/month), total energy intake (%, continuous), and metabolic equivalent of a task (continuous).
Table 7.
Adjusted hazard ratios (HRs) and 95% confidence intervals (CIs) of metabolic syndrome incidence depending on the genotype of SLC35F3 rs10910387 by carbohydrate intake.
Table 7.
Adjusted hazard ratios (HRs) and 95% confidence intervals (CIs) of metabolic syndrome incidence depending on the genotype of SLC35F3 rs10910387 by carbohydrate intake.
| Men | Carbohydrate (% Energy) | Women | Carbohydrate (% Energy) | ||||||
| Tertile 1 | Tertile 2 | Tertile 3 | Tertile 1 | Tertile 2 | Tertile 3 | ||||
| Median | 63.4 | 69.5 | 75.3 | Median | 64.9 | 71.6 | 77.4 | ||
| Person-years | 5599 | 5688 | 5434 | 16,721 | Person-years | 5809 | 5742 | 5235 | 16,786 |
| Incident cases (n) | 258/662 | 231/662 | 258/662 | 747/1986 | Incident cases (n) | 191/645 | 233/646 | 282/646 | 706/1937 |
| Adjusted HR (95% CI) | HR (95% CI) | HR (95% CI) | HR (95% CI) | p interaction | Adjusted HR (95% CI) | HR (95% CI) | HR (95% CI) | HR (95% CI) | p interaction |
| CC | 1.00 (Ref) | 0.83 (0.66–1.04) | 0.90 (0.71–1.14) | 0.16 | CC | 1.00 (Ref) | 1.01 (0.80–1.28) | 0.95 (0.75–1.21) | 0.79 |
| TC | 1.02 (0.77–1.34) | 1.03 (0.78–1.36) | 1.19 (0.90–1.57) | TC | 1.11 (0.80–1.54) | 1.26 (0.94–1.69) | 0.97 (0.72–1.30) | ||
| TT | 1.48 (0.86–2.56) | 1.02 (0.60–1.74) | 1.88 (1.03–3.41) | TT | 1.45 (0.59–3.57) | 2.22 (1.12–4.42) | 2.53 (1.38–4.61) | ||
Abbreviations: HR—Hazard Ratio; CI—Confidence Interval. Adjusted for age (years, continuous), area (Ansung, Ansan), BMI (kg/m2, continuous), smoking (none, past, current), drinking status (none, past, current), education (elementary—technical college, university, grade school), income (<1, 1–3, >3 million won/month), total energy intake (%, continuous), and metabolic equivalent of a task (continuous).
Table 8.
Adjusted hazard ratios (HRs) and 95% confidence intervals (CIs) of metabolic syndrome components incidence depending on the genotype of SLC35F3 rs10910387 by carbohydrate intake.
Table 8.
Adjusted hazard ratios (HRs) and 95% confidence intervals (CIs) of metabolic syndrome components incidence depending on the genotype of SLC35F3 rs10910387 by carbohydrate intake.
| Men | Women | ||||||||
|---|---|---|---|---|---|---|---|---|---|
| Carbohydrate (% Energy) | Carbohydrate (% Energy) | ||||||||
| Tertile 1 | Tertile 2 | Tertile 3 | Tertile 1 | Tertile 2 | Tertile 3 | ||||
| HR (95% CI) | HR (95% CI) | HR (95% CI) | p Interaction | HR (95% CI) | HR (95% CI) | HR (95% CI) | p Interaction | ||
| Abdominal obesity | 0.89 | Abdominal obesity | 0.21 | ||||||
| CC | 1.00 (Ref) | 1.00 (0.78–1.29) | 0.85 (0.65–1.11) | CC | 1.00 (Ref) | 0.97 (0.76–1.25) | 1.04 (0.81–1.34) | ||
| TC | 1.10 (0.80–1.52) | 1.21 (0.90–1.62) | 0.96 (0.69–1.33) | TC | 1.33 (0.95–1.86) | 1.06 (0.77–1.46) | 0.92 (0.66–1.27) | ||
| TT | 1.32 (0.64–2.71) | 1.38 (0.79–2.40) | 1.17 (0.63–2.17) | TT | 0.70 (0.22–2.19) | 1.72 (0.70–4.22) | 1.00 (0.50–1.99) | ||
| Elevated blood pressure | 0.53 | Elevated blood pressure | 0.74 | ||||||
| CC | 1.00 (Ref) | 0.82 (0.65–1.04) | 0.90 (0.71–1.14) | CC | 1.00 (Ref) | 1.10 (0.87–1.41) | 0.98 (0.77–1.27) | ||
| TC | 0.92 (0.68–1.24) | 0.86 (0.64–1.16) | 0.98 (0.73–1.32) | TC | 1.02 (0.73–1.44) | 1.21 (0.89–1.64) | 1.01 (0.74–1.37) | ||
| TT | 0.89 (0.42–1.91) | 0.93 (0.52–1.68) | 0.79 (0.35–1.81) | TT | 1.10 (0.48–2.50) | 1.67 (0.80–3.47) | 0.78 (0.32–1.91) | ||
| Elevated fasting glucose | 0.68 | Elevated fasting glucose | 0.17 | ||||||
| CC | 1.00 (Ref) | 0.90 (0.74–1.08) | 0.83 (0.68–1.02) | CC | 1.00 (Ref) | 0.96 (0.77–1.19) | 0.87 (0.69–1.09) | ||
| TC | 1.05 (0.83–1.33) | 0.92 (0.72–1.18) | 1.03 (0.81–1.31) | TC | 1.34 (1.02–1.75) | 1.09 (0.83–1.43) | 0.95 (0.72–1.25) | ||
| TT | 1.28 (0.71–2.29) | 0.87 (0.50–1.49) | 0.74 (0.36–1.52) | TT | 1.93 (1.04–3.57) | 0.92 (0.38–2.26) | 1.03 (0.55–1.92) | ||
| Elevated triglycerides | 0.84 | Elevated triglycerides | 0.1 | ||||||
| CC | 1.00 (Ref) | 0.95 (0.74–1.23) | 1.06 (0.81–1.38) | CC | 1.00 (Ref) | 1.12 (0.89–1.41) | 1.02 (0.80–1.30) | ||
| TC | 1.03 (0.74–1.42) | 1.11 (0.80–1.55) | 0.96 (0.68–1.37) | TC | 0.80 (0.57–1.12) | 1.19 (0.88–1.61) | 1.26 (0.93–1.71) | ||
| TT | 1.35 (0.55–3.32) | 0.87 (0.44–1.73) | 1.59 (0.76–3.31) | TT | 1.30 (0.57–2.96) | 1.05 (0.42–2.60) | 1.50 (0.80–2.79) | ||
| Low HDL cholesterol | 0.56 | Low HDL cholesterol | 0.76 | ||||||
| CC | 1.00 (Ref) | 0.95 (0.77–1.19) | 0.98 (0.79–1.23) | CC | 1.00 (Ref) | 0.99 (0.75–1.29) | 1.01 (0.76–1.35) | ||
| TC | 0.81 (0.60–1.09) | 1.11 (0.84–1.46) | 1.10 (0.83–1.47) | TC | 1.03 (0.72–1.48) | 1.17 (0.83–1.67) | 0.96 (0.67–1.37) | ||
| TT | 1.79 (1.02–3.16) | 0.79 (0.42–1.51) | 1.16 (0.60–2.29) | TT | 1.01 (0.37–2.75) | 1.32 (0.53–3.33) | 1.96 (0.91–4.24) | ||
Abbreviations: HR—Hazard Ratio; CI—Confidence Interval. Adjusted for age (years, continuous), area (Ansung, Ansan), BMI (kg/m2, continuous), smoking (none, past, current), drinking status (none, past, current), education (elementary—technical college, university, grade school), income (<1, 1–3, >3 million won/month), total energy intake (%, continuous), and metabolic equivalent of a task (continuous).
Disclaimer/Publisher’s Note: The statements, opinions and data contained in all publications are solely those of the individual author(s) and contributor(s) and not of MDPI and/or the editor(s). MDPI and/or the editor(s) disclaim responsibility for any injury to people or property resulting from any ideas, methods, instructions or products referred to in the content. |
© 2023 by the authors. Licensee MDPI, Basel, Switzerland. This article is an open access article distributed under the terms and conditions of the Creative Commons Attribution (CC BY) license (https://creativecommons.org/licenses/by/4.0/).
Share and Cite
MDPI and ACS Style
Park, H.; Shin, D. Effects of Interaction between SLC35F3 and Carbohydrate Intake on the Incidence of Metabolic Syndrome in Korean Middle-Aged Adults. Nutrients 2023, 15, 469. https://doi.org/10.3390/nu15020469
AMA Style
Park H, Shin D. Effects of Interaction between SLC35F3 and Carbohydrate Intake on the Incidence of Metabolic Syndrome in Korean Middle-Aged Adults. Nutrients. 2023; 15(2):469. https://doi.org/10.3390/nu15020469
Chicago/Turabian StylePark, Haeun, and Dayeon Shin. 2023. "Effects of Interaction between SLC35F3 and Carbohydrate Intake on the Incidence of Metabolic Syndrome in Korean Middle-Aged Adults" Nutrients 15, no. 2: 469. https://doi.org/10.3390/nu15020469
Note that from the first issue of 2016, this journal uses article numbers instead of page numbers. See further details here.