
The Effects of Green Tea on Diabetes and Gut Microbiome in db/db Mice: Studies with Tea Extracts vs. Tea Powder

 , ,
, ,  and
and 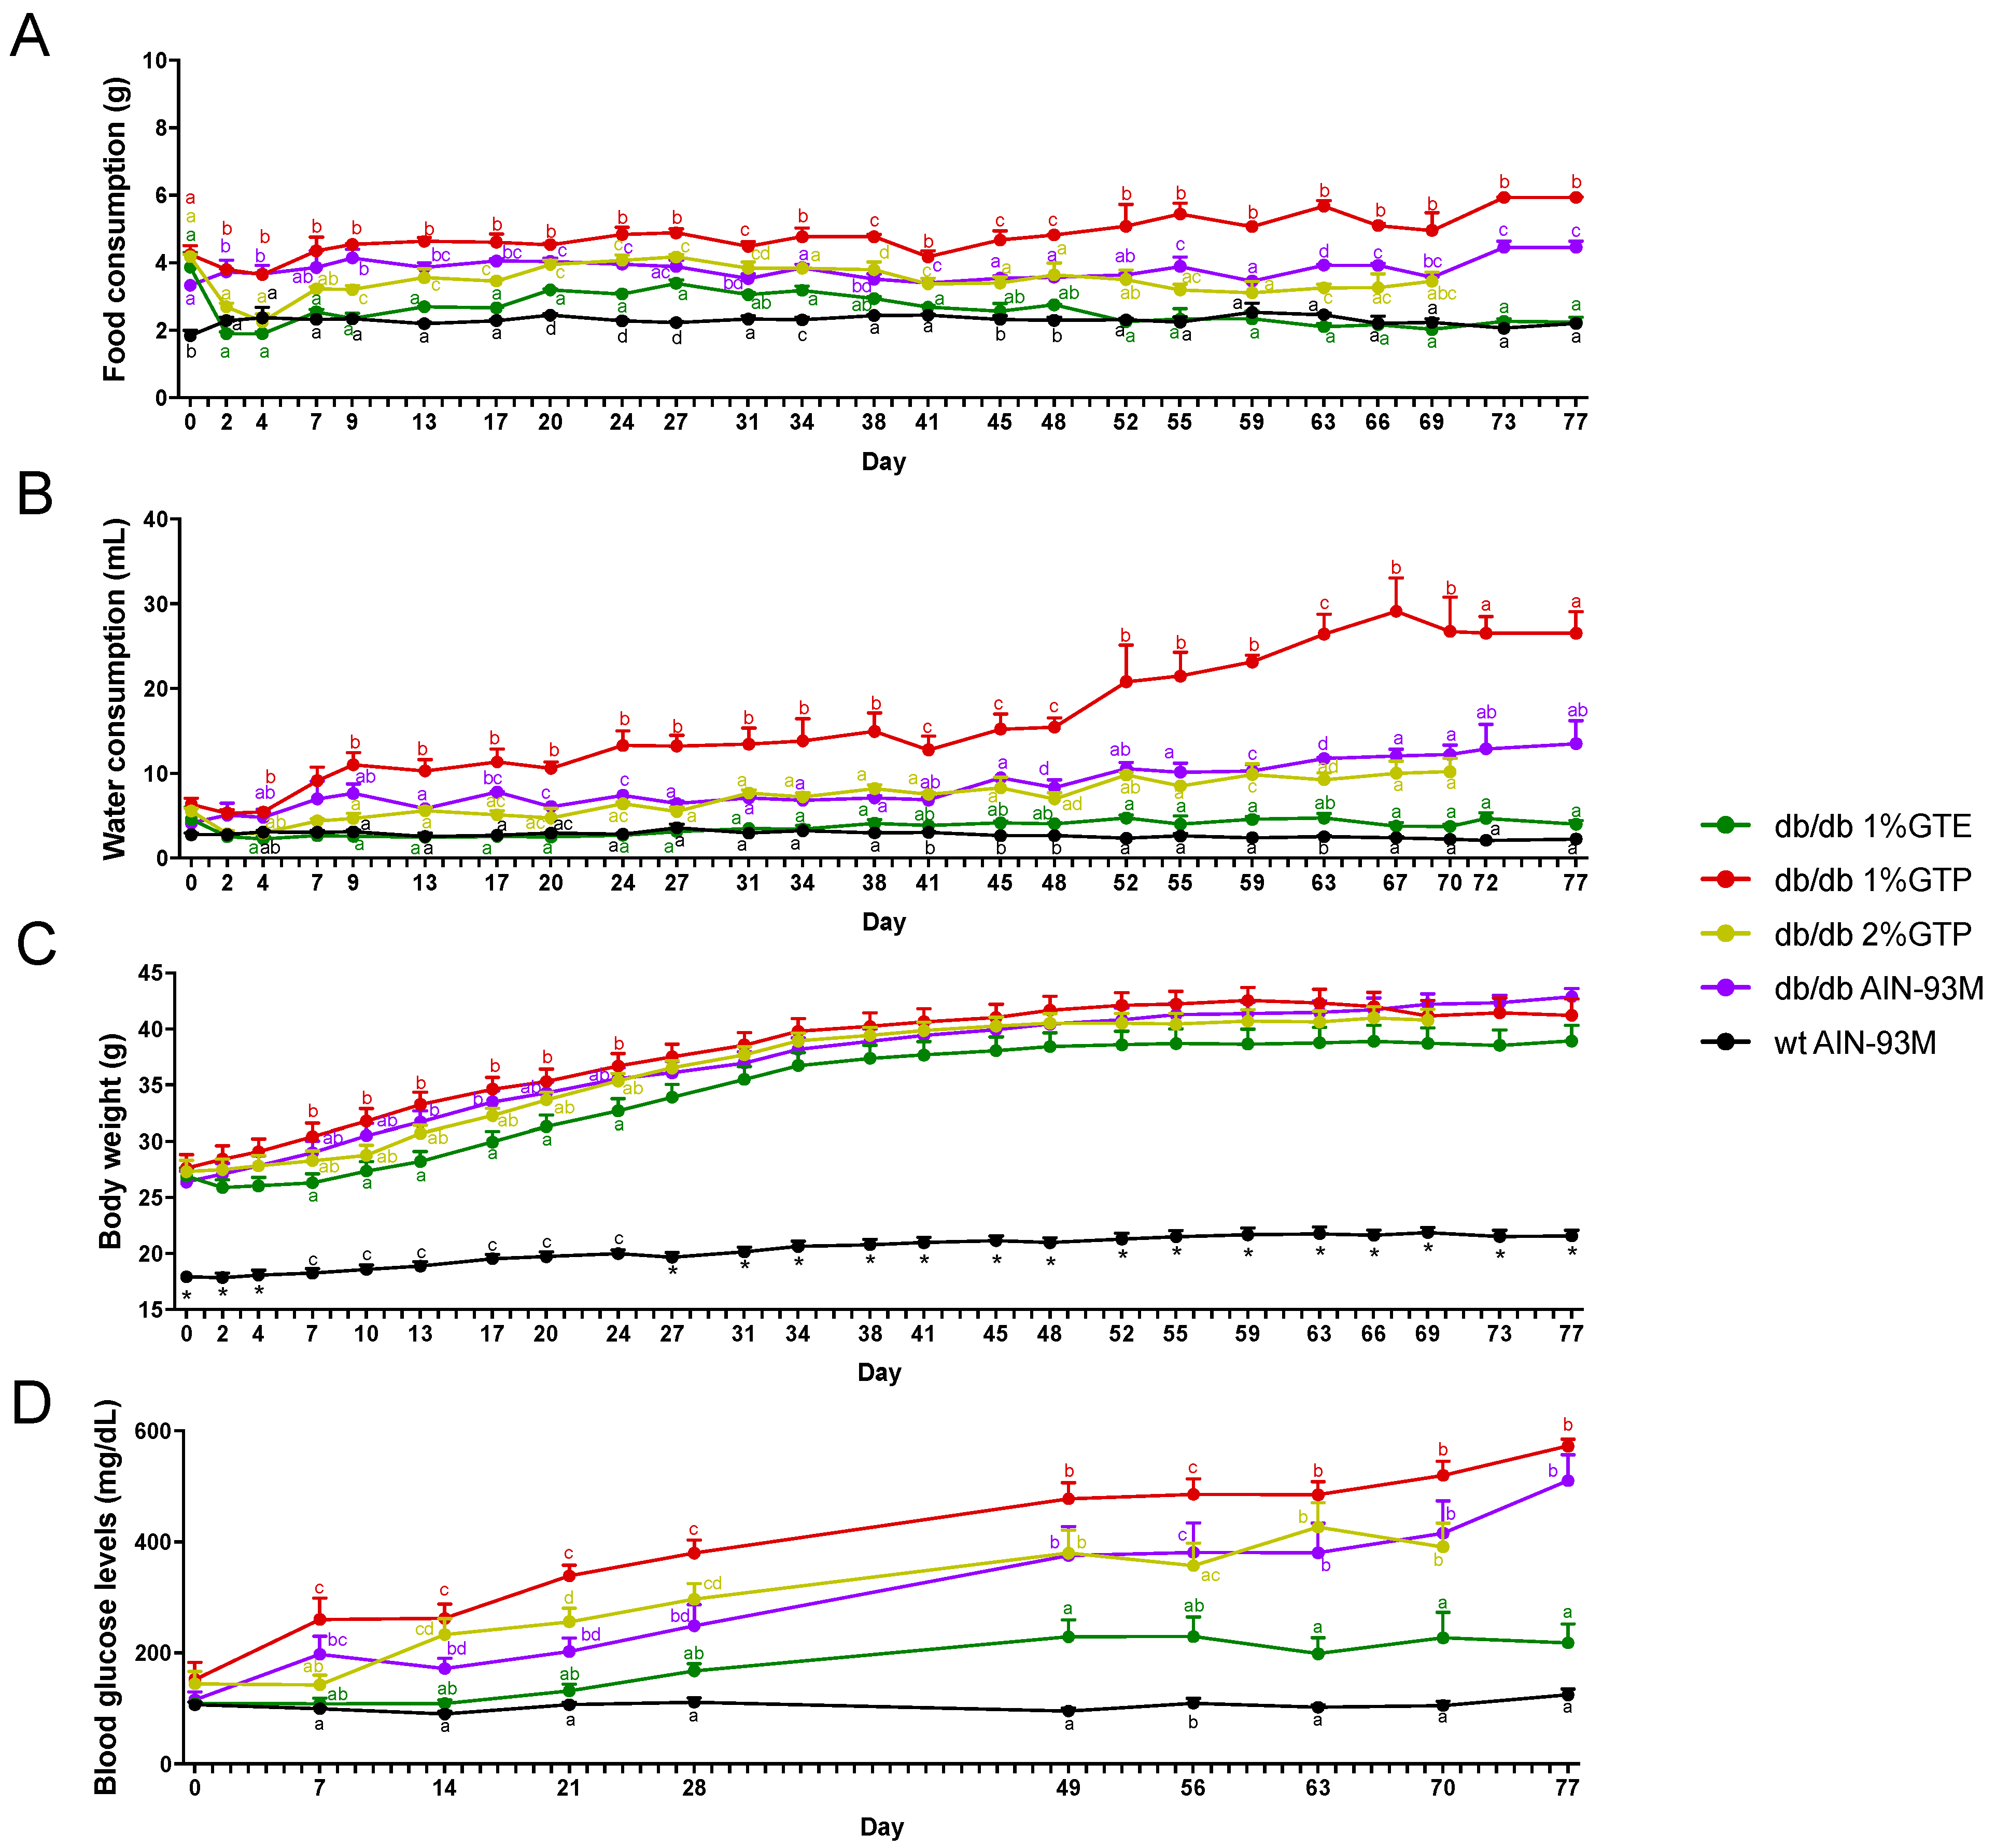
Abstract
:1. Introduction
2. Materials and Methods
2.1. Tea and Diet Preparations
2.2. Animal Studies
2.3. Fasting Blood Glucose and Insulin
2.4. Immunohistochemistry
2.5. Sample Collection and Analysis of Intestinal Microbiome
2.6. Statistical Analysis
3. Results
3.1. Food and Water Consumption
3.2. Body Weight and Fasting Blood Glucose Levels
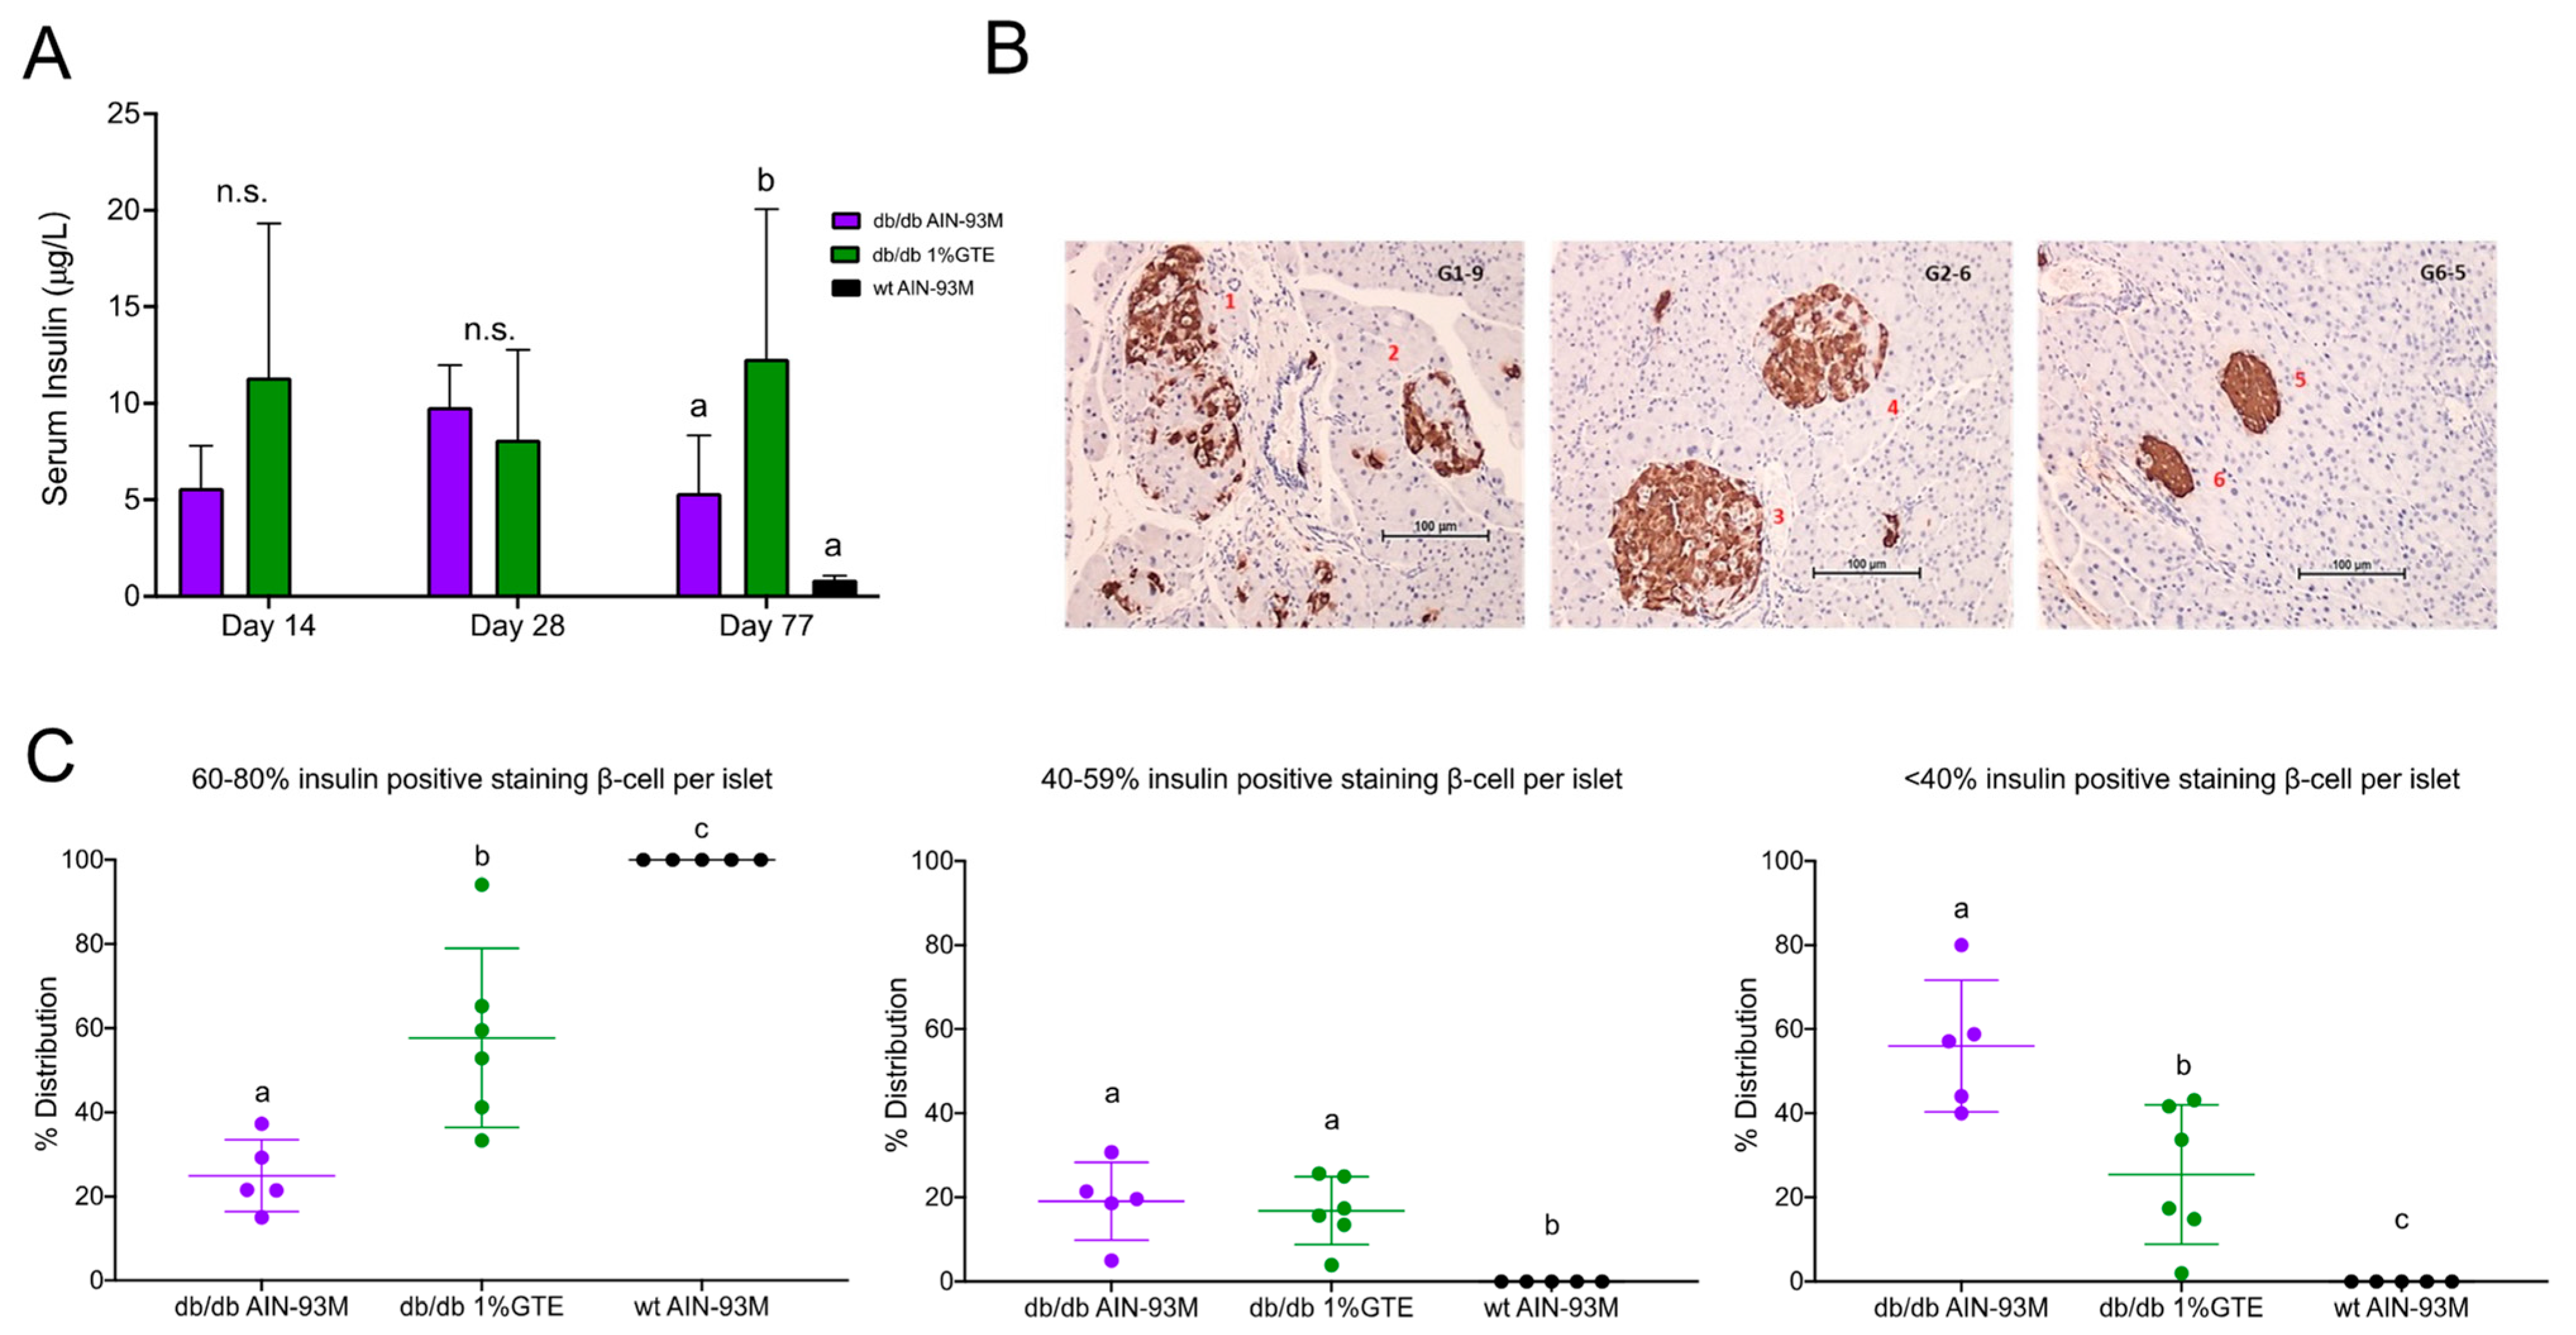
3.3. Fasting Insulin Levels and Pancreatic Insulin Immunostaining
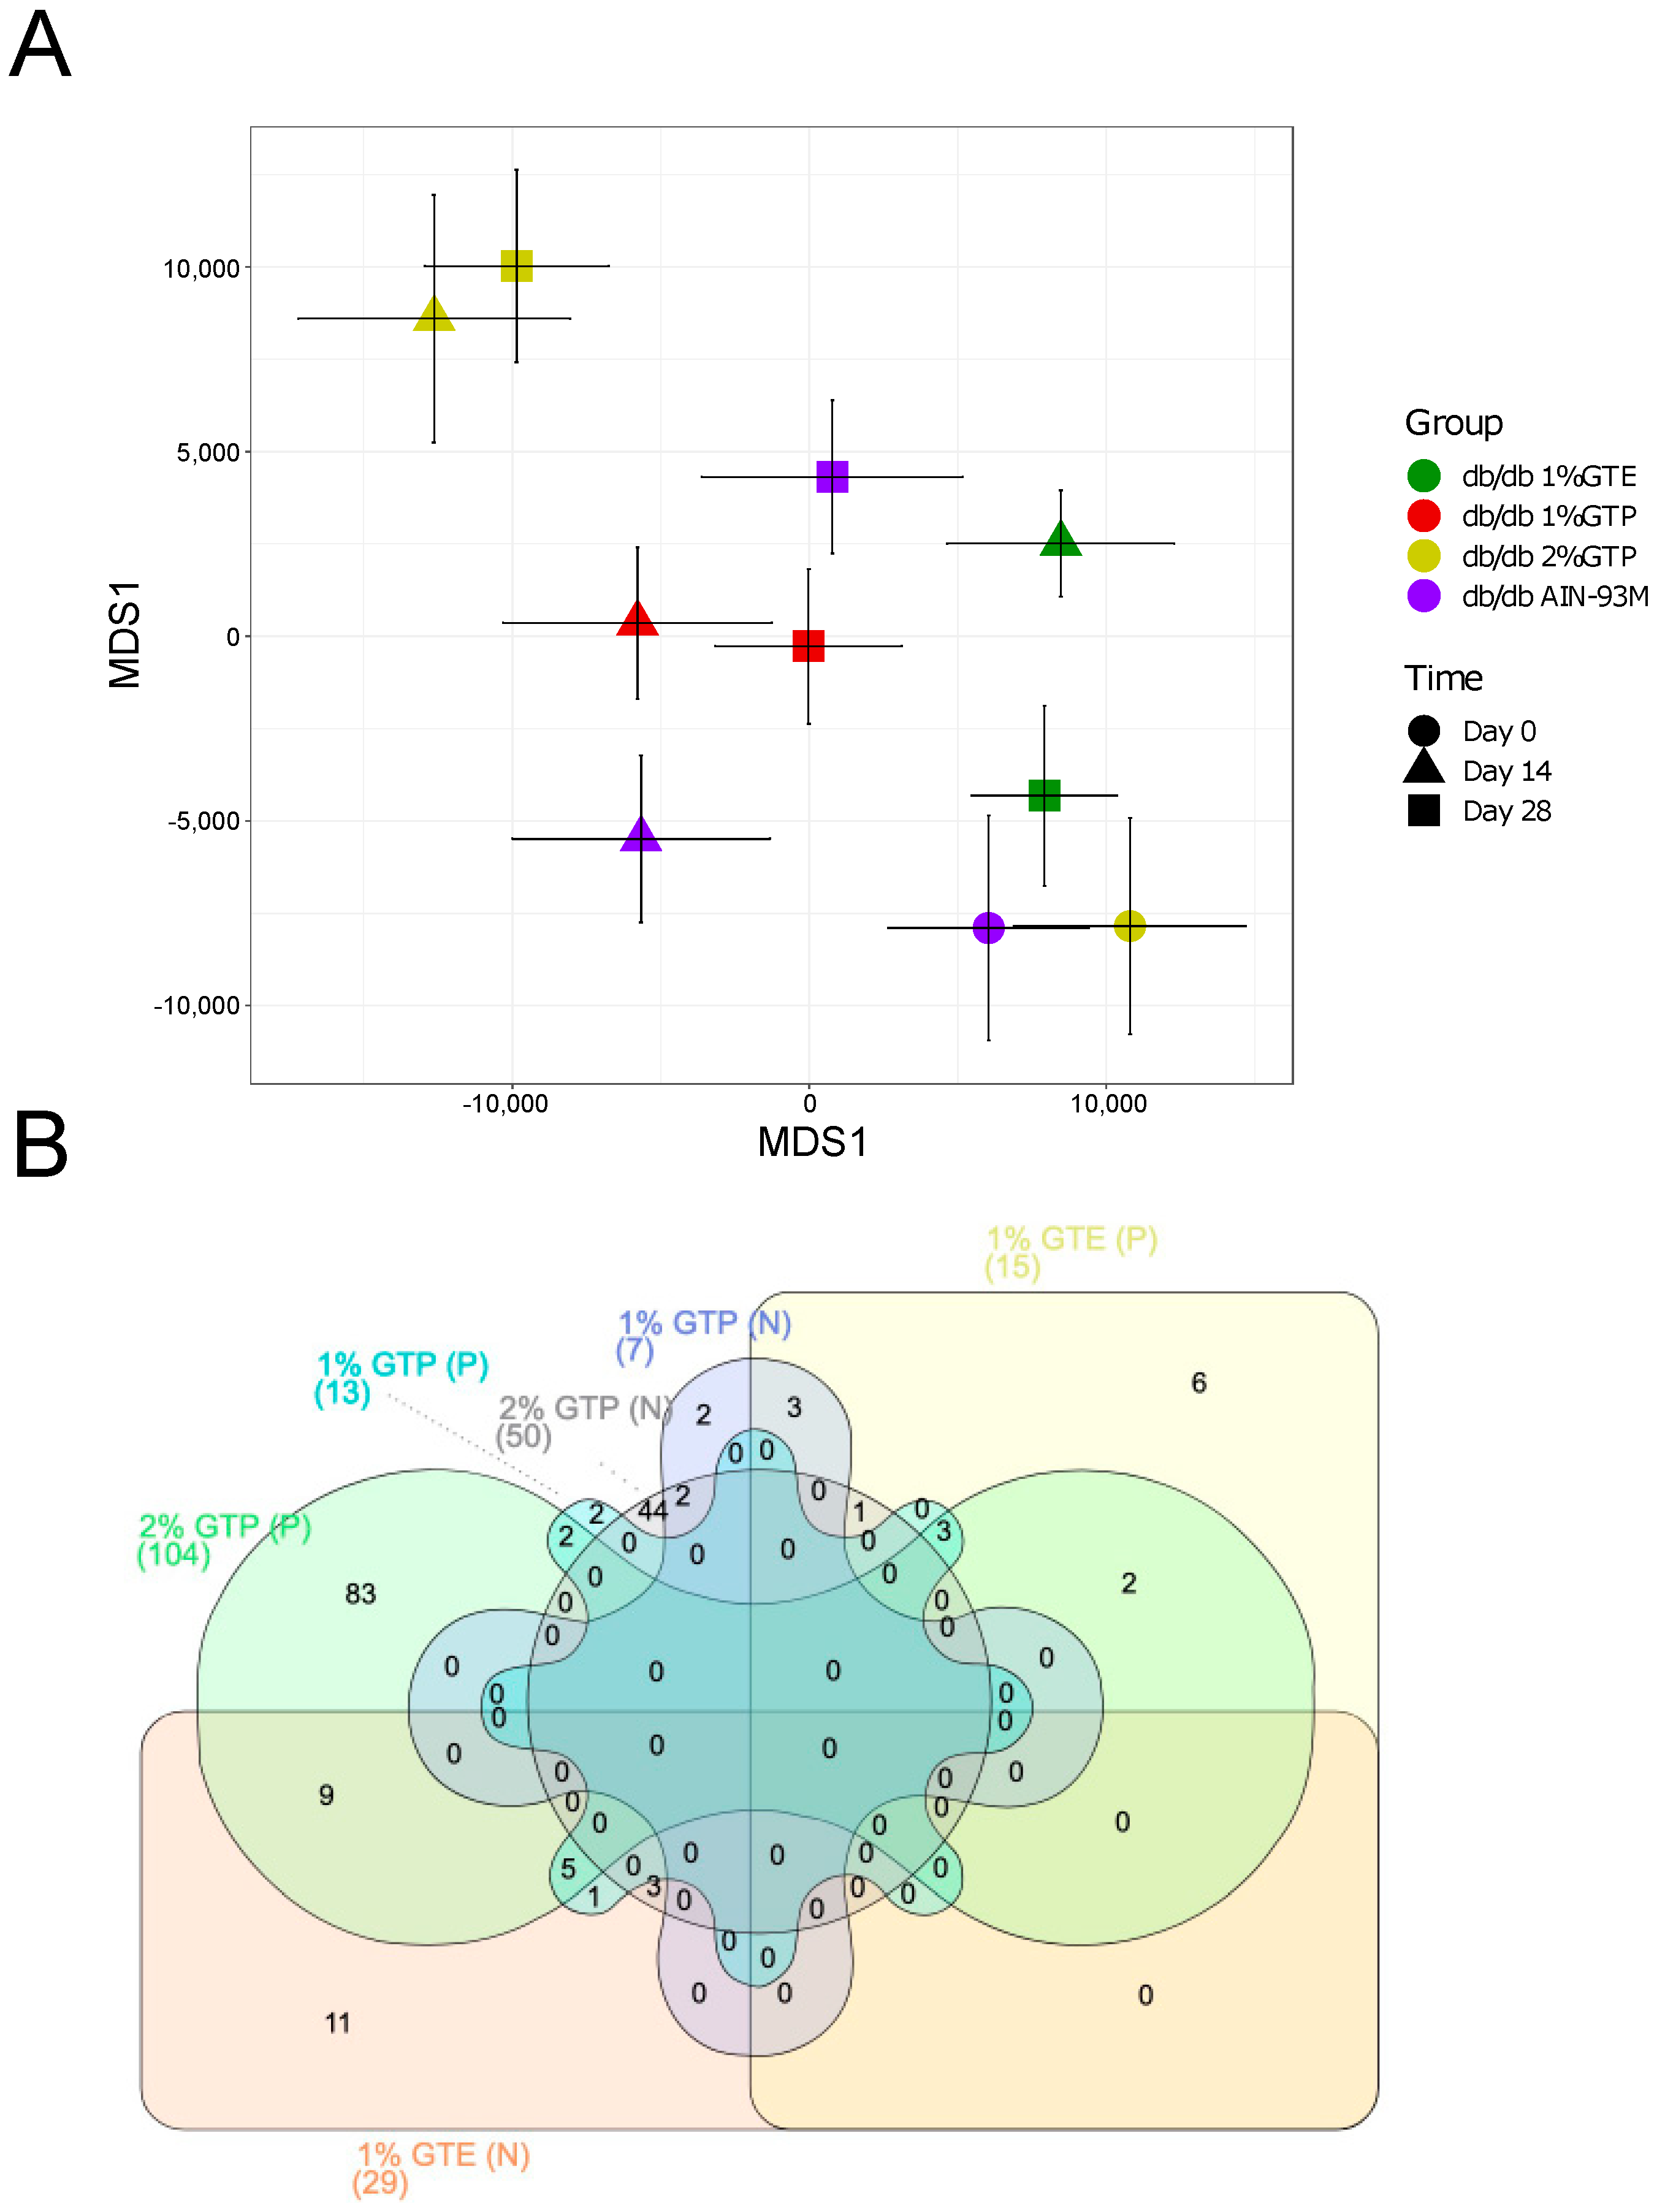
3.4. Overall Gut Microbiota Structure
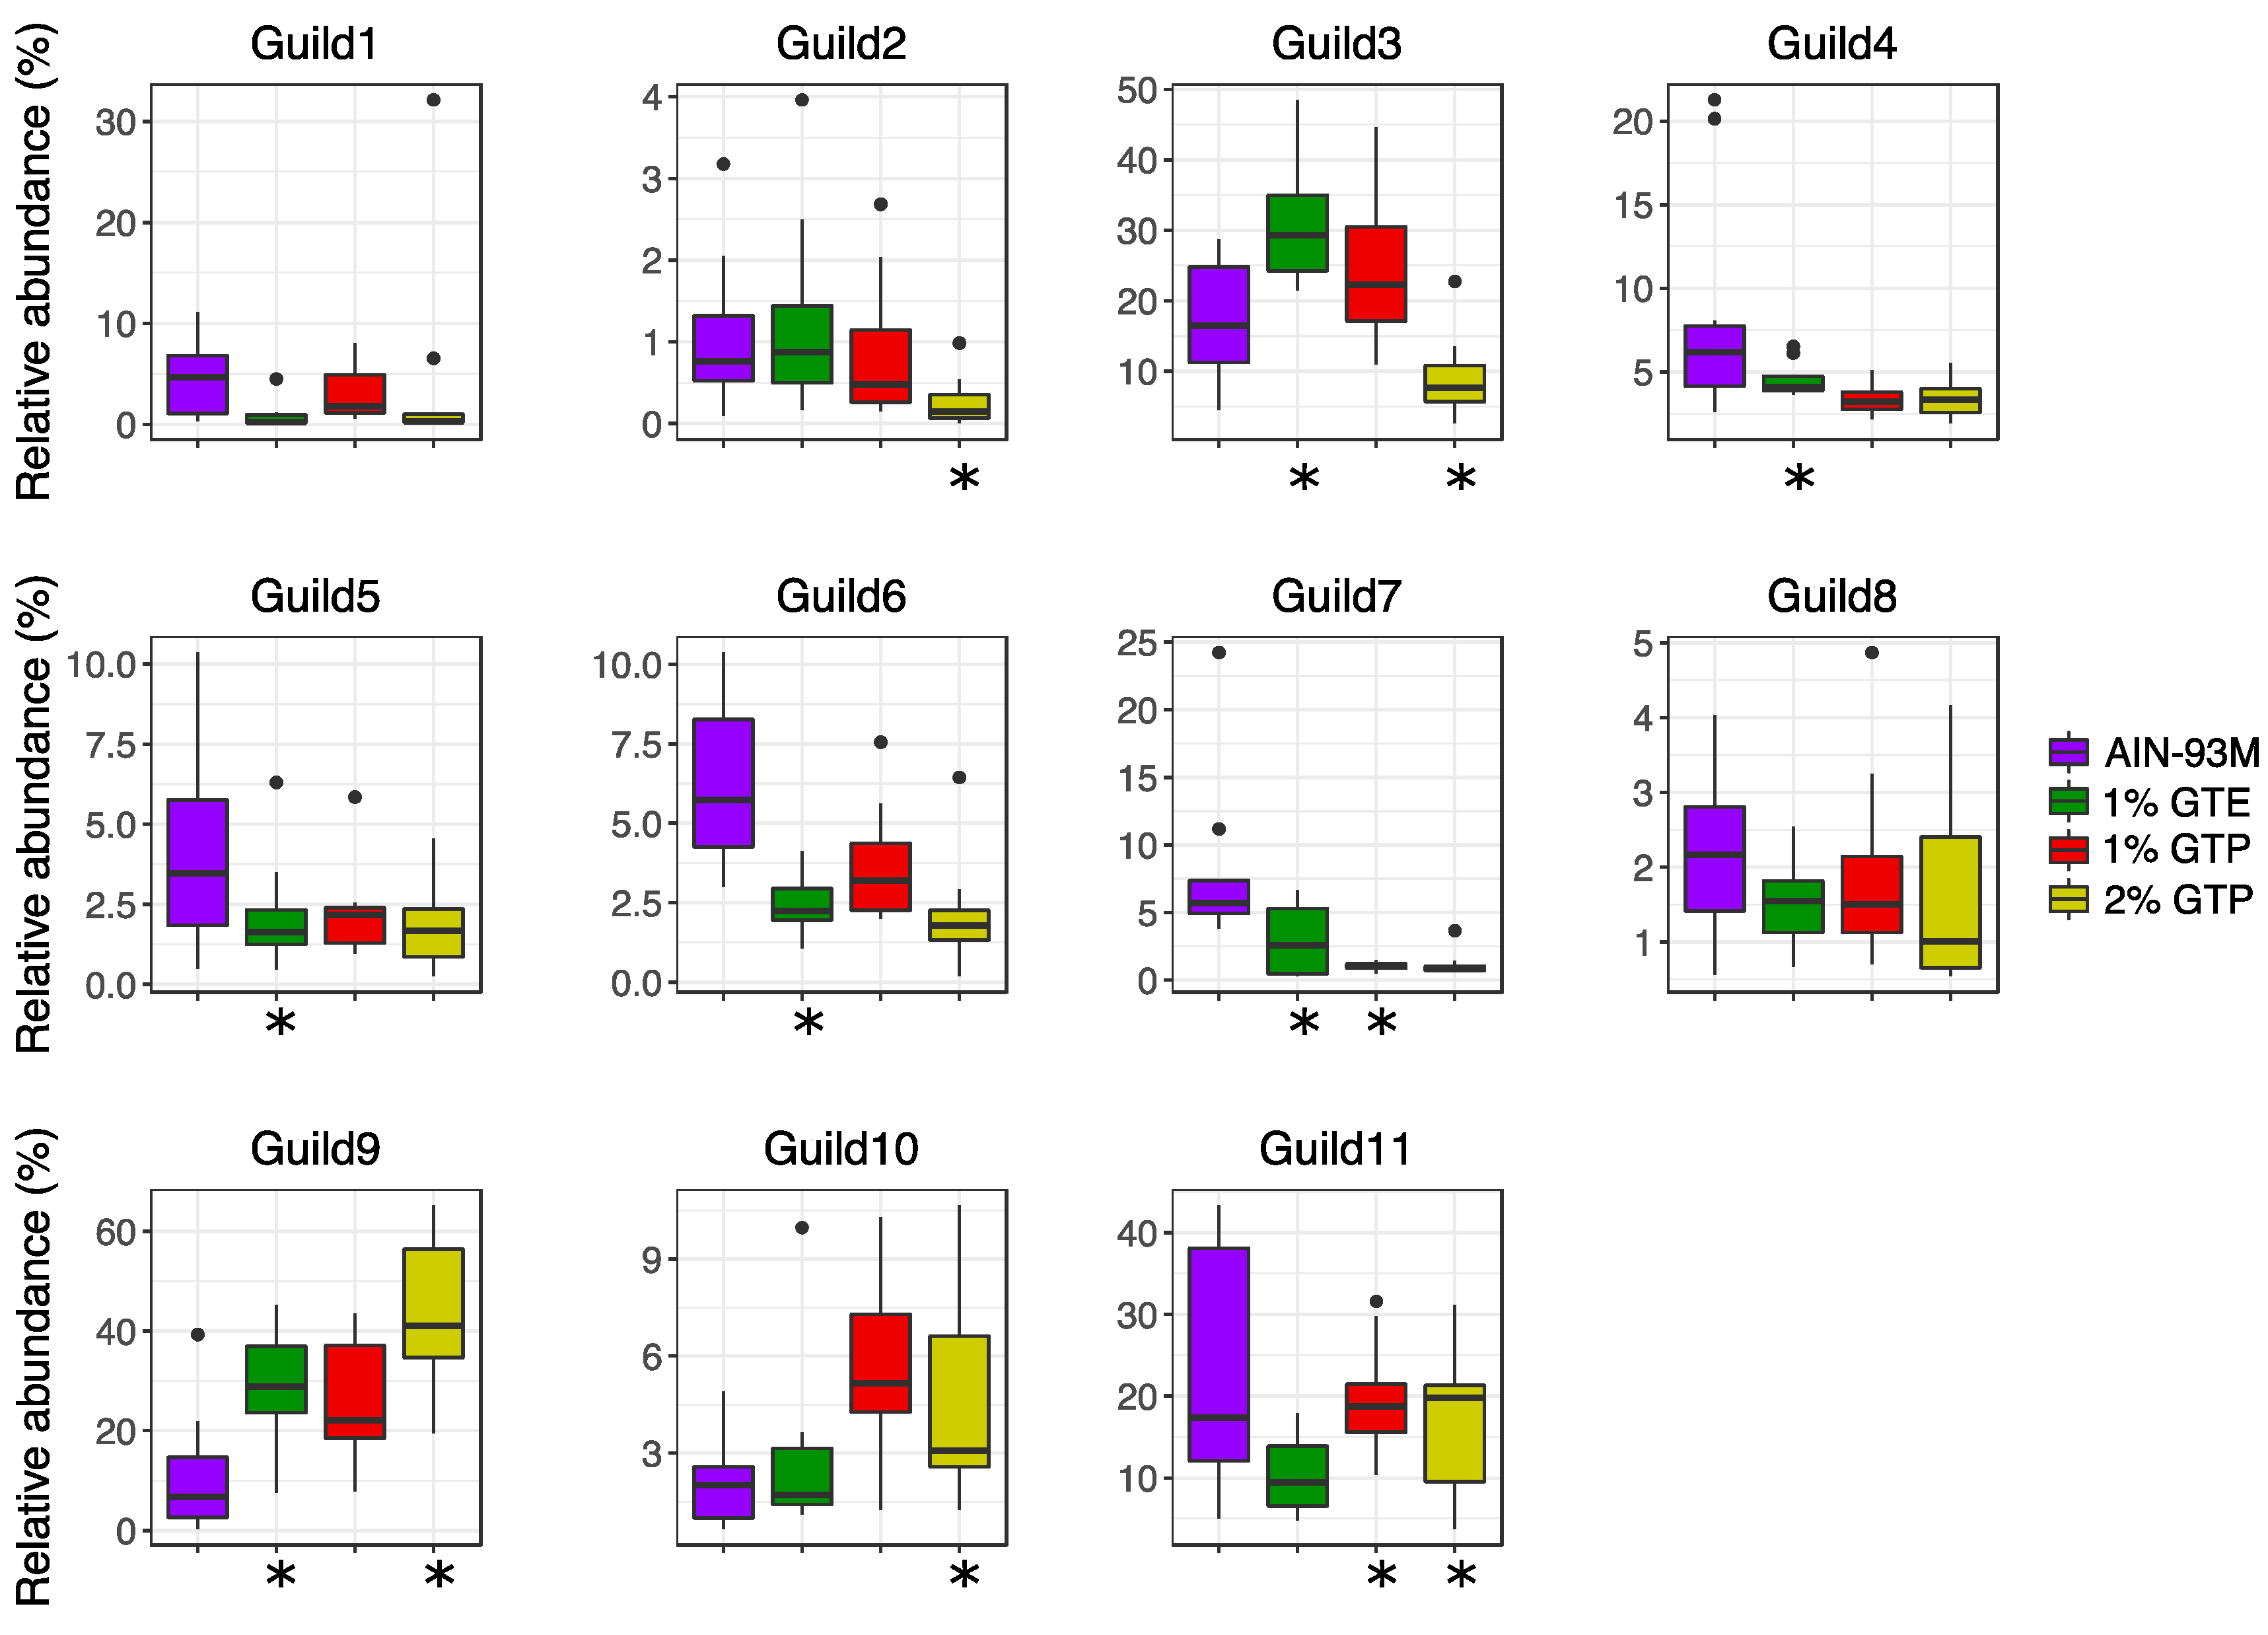
3.5. Guild Structure in the Gut Microbiota
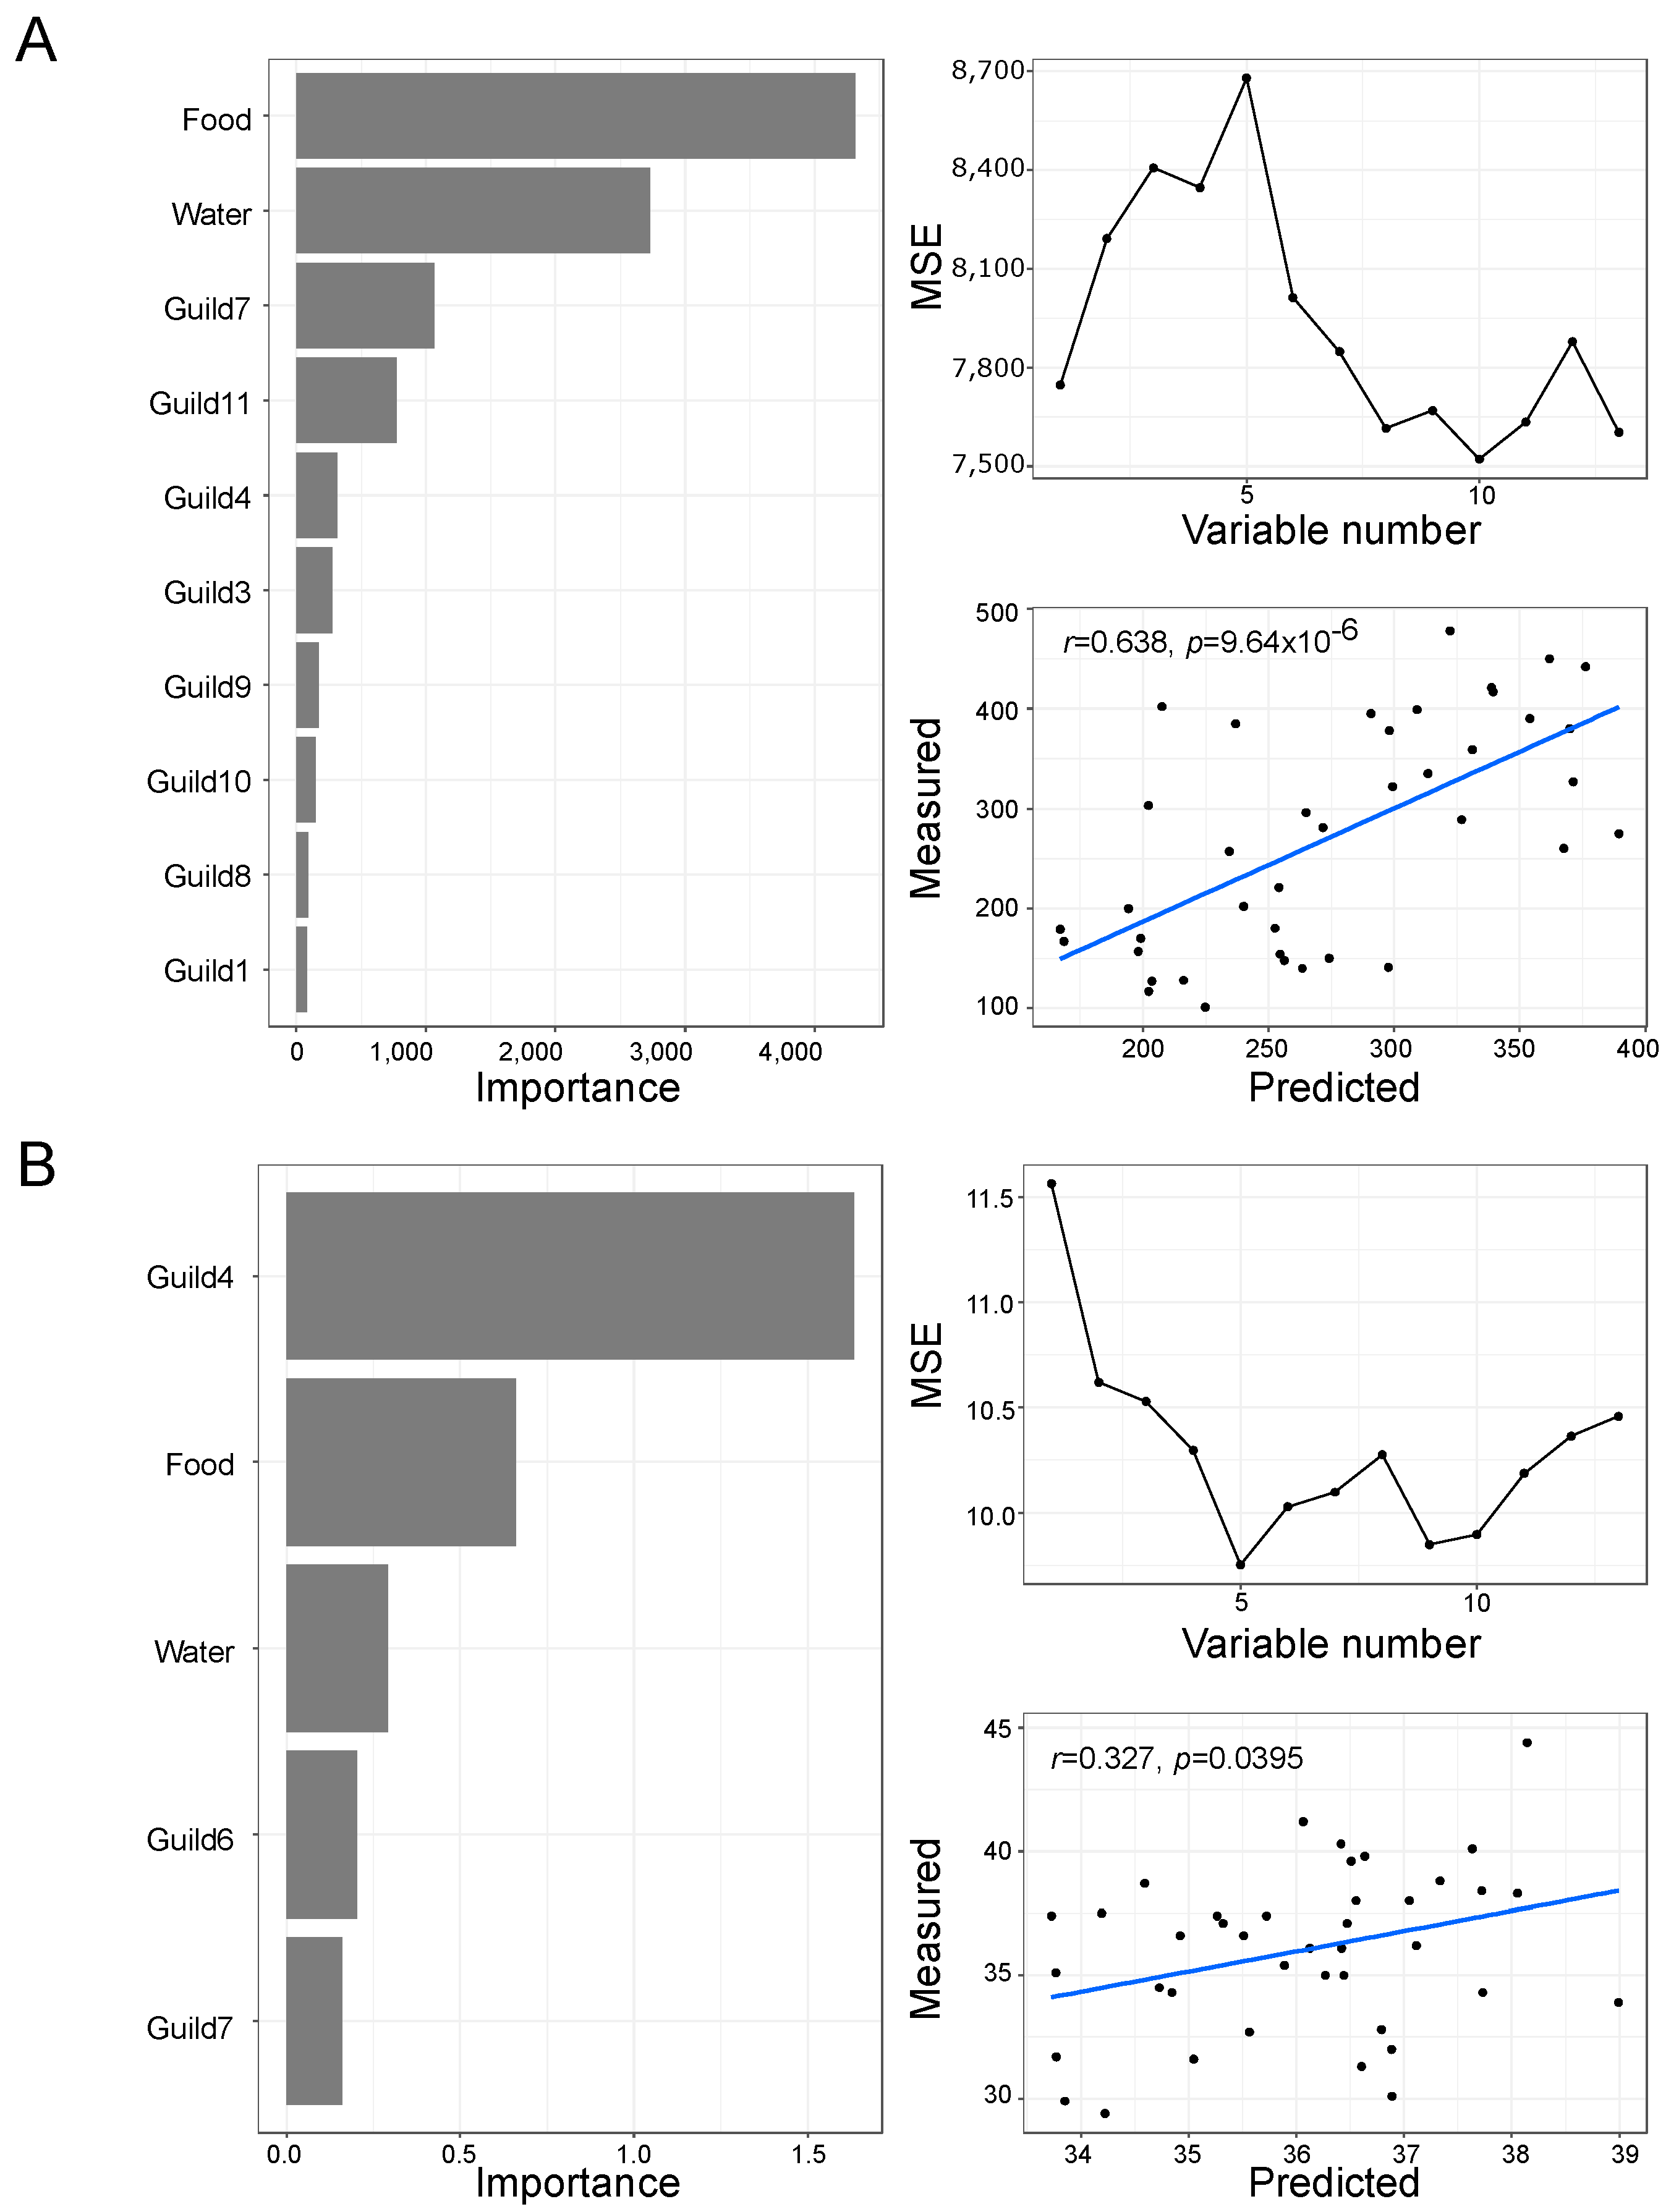
3.6. Functional Analysis of the Gut Microbiota
4. Discussion
5. Conclusions
Supplementary Materials
Author Contributions
Funding
Institutional Review Board Statement
Data Availability Statement
Acknowledgments
Conflicts of Interest
Abbreviations
References
- Yang, C.S.; Hong, J. Prevention of chronic diseases by tea: Possible mechanisms and human relevance. Annu. Rev. Nutr. 2013, 33, 161–181. [Google Scholar] [CrossRef] [PubMed]
- Yang, C.S.; Zhang, J. Studies on the Prevention of Cancer and Cardiometabolic Diseases by Tea: Issues on Mechanisms, Effective Doses, and Toxicities. J. Agric. Food Chem. 2019, 67, 5446–5456. [Google Scholar] [CrossRef] [PubMed]
- Bose, M.; Lambert, J.D.; Ju, J.; Reuhl, K.R.; Shapses, S.A.; Yang, C.S. The major green tea polyphenol, (-)-epigallocatechin-3-gallate, inhibits obesity, metabolic syndrome, and fatty liver disease in high-fat-fed mice. J. Nutr. 2008, 138, 1677–1683. [Google Scholar] [CrossRef] [PubMed]
- Huang, J.; Feng, S.; Liu, A.; Dai, Z.; Wang, H.; Reuhl, K.; Lu, W.; Yang, C.S. Green Tea Polyphenol EGCG Alleviates Metabolic Abnormality and Fatty Liver by Decreasing Bile Acid and Lipid Absorption in Mice. Mol. Nutr. Food Res. 2018, 62. [Google Scholar] [CrossRef] [PubMed]
- Chen, T.; Liu, A.B.; Sun, S.; Ajami, N.J.; Ross, M.C.; Wang, H.; Zhang, L.; Reuhl, K.; Kobayashi, K.; Onishi, J.C.; et al. Green Tea Polyphenols Modify the Gut Microbiome in db/db Mice as Co-Abundance Groups Correlating with the Blood Glucose Lowering Effect. Mol. Nutr. Food Res. 2019, 63, e1801064. [Google Scholar] [CrossRef] [PubMed]
- Ortsater, H.; Grankvist, N.; Wolfram, S.; Kuehn, N.; Sjoholm, A. Diet supplementation with green tea extract epigallocatechin gallate prevents progression to glucose intolerance in db/db mice. Nutr. Metab. 2012, 9, 11. [Google Scholar] [CrossRef] [Green Version]
- Wein, S.; Schrader, E.; Rimbach, G.; Wolffram, S. Oral green tea catechins transiently lower plasma glucose concentrations in female db/db mice. J. Med. Food 2013, 16, 312–317. [Google Scholar] [CrossRef]
- Yang, C.S.; Zhang, J.; Zhang, L.; Huang, J.; Wang, Y. Mechanisms of body weight reduction and metabolic syndrome alleviation by tea. Mol. Nutr. Food Res. 2016, 60, 160–174. [Google Scholar] [CrossRef]
- Li, Y.; Wang, C.; Huai, Q.; Guo, F.; Liu, L.; Feng, R.; Sun, C. Effects of tea or tea extract on metabolic profiles in patients with type 2 diabetes mellitus: A meta-analysis of ten randomized controlled trials. Diabetes Metab. Res. Rev. 2016, 32, 2–10. [Google Scholar] [CrossRef]
- Liu, X.; Xu, W.; Cai, H.; Gao, Y.T.; Li, H.; Ji, B.T.; Shu, X.; Wang, T.; Gerszten, R.E.; Zheng, W.; et al. Green tea consumption and risk of type 2 diabetes in Chinese adults: The Shanghai Women’s Health Study and the Shanghai Men’s Health Study. Int. J. Epidemiol. 2018, 47, 1887–1896. [Google Scholar] [CrossRef]
- Hardie, D.G. AMPK: Positive and negative regulation, and its role in whole-body energy homeostasis. Curr. Opin. Cell Biol. 2015, 33, 1–7. [Google Scholar] [CrossRef] [PubMed]
- Okla, M.; Kim, J.; Koehler, K.; Chung, S. Dietary Factors Promoting Brown and Beige Fat Development and Thermogenesis. Adv. Nutr. 2017, 8, 473–483. [Google Scholar] [CrossRef] [Green Version]
- Xu, N.; Chu, J.; Dong, R.; Lu, F.; Zhang, X.; Wang, M.; Shen, Y.; Xie, Z.; Ho, C.T.; Yang, C.S.; et al. Yellow Tea Stimulates Thermogenesis in Mice through Heterogeneous Browning of Adipose Tissues. Mol. Nutr. Food Res. 2021, 65, e2000864. [Google Scholar] [CrossRef]
- Zhao, G.; Wu, X.; Wang, W.; Yang, C.S.; Zhang, J. Tea Drinking Alleviates Diabetic Symptoms via Upregulating Renal Water Reabsorption Proteins and Downregulating Renal Gluconeogenic Enzymes in db/db Mice. Mol. Nutr. Food Res. 2020, 64, e2000505. [Google Scholar] [CrossRef]
- Chen, T.; Yang, C.S. Biological fates of tea polyphenols and their interactions with microbiota in the gastrointestinal tract: Implications on health effects. Crit. Rev. Food Sci. Nutr. 2020, 60, 2691–2709. [Google Scholar] [CrossRef]
- Zhao, L.; Zhang, F.; Ding, X.; Wu, G.; Lam, Y.Y.; Wang, X.; Fu, H.; Xue, X.; Lu, C.; Ma, J.; et al. Gut bacteria selectively promoted by dietary fibers alleviate type 2 diabetes. Science 2018, 359, 1151–1156. [Google Scholar] [CrossRef] [Green Version]
- Holscher, H.D. Dietary fiber and prebiotics and the gastrointestinal microbiota. Gut Microbes 2017, 8, 172–184. [Google Scholar] [CrossRef]
- Capuano, E. The behavior of dietary fiber in the gastrointestinal tract determines its physiological effect. Crit. Rev. Food Sci. Nutr. 2017, 57, 3543–3564. [Google Scholar] [CrossRef] [PubMed] [Green Version]
- Lee, M.J.; Prabhu, S.; Meng, X.; Li, C.; Yang, C.S. An improved method for the determination of green and black tea polyphenols in biomatrices by high-performance liquid chromatography with coulometric array detection. Anal. Biochem. 2000, 279, 164–169. [Google Scholar] [CrossRef] [PubMed]
- Parada, A.E.; Needham, D.M.; Fuhrman, J.A. Every base matters: Assessing small subunit rRNA primers for marine microbiomes with mock communities, time series and global field samples. Environ. Microbiol. 2016, 18, 1403–1414. [Google Scholar] [CrossRef]
- Apprill, A.; McNally, S.; Parsons, R.; Weber, L. Minor revision to V4 region SSU rRNA 806R gene primer greatly increases detection of SAR11 bacterioplankton. Aquat. Microb. Ecol. 2015, 75, 129–137. [Google Scholar] [CrossRef] [Green Version]
- Bolyen, E.; Rideout, J.R.; Dillon, M.R.; Bokulich, N.A.; Abnet, C.C.; Al-Ghalith, G.A.; Alexander, H.; Alm, E.J.; Arumugam, M.; Asnicar, F.; et al. Reproducible, interactive, scalable and extensible microbiome data science using QIIME 2. Nat. Biotechnol. 2019, 37, 852–857. [Google Scholar] [CrossRef] [PubMed]
- Martin, M. Cutadapt removes adapter sequences from high-throughput sequencing reads. EMBnet J. 2011, 17, 3. [Google Scholar] [CrossRef]
- Wang, J.; Zhang, Q.; Wu, G.; Zhang, C.; Zhang, M.; Zhao, L. Minimizing Spurious Features in 16S rRNA Gene Amplicon Sequencing. PeerJ Preprints 2018. [Google Scholar] [CrossRef]
- Bokulich, N.A.; Kaehler, B.D.; Rideout, J.R.; Dillon, M.; Bolyen, E.; Knight, R.; Huttley, G.A.; Caporaso, J.G. Optimizing taxonomic classification of marker-gene amplicon sequences with QIIME 2‘s q2-feature-classifier plugin. Microbiome 2018, 6, 90. [Google Scholar] [CrossRef]
- Quast, C.; Pruesse, E.; Yilmaz, P.; Gerken, J.; Schweer, T.; Yarza, P.; Peplies, J.; Glockner, F.O. The SILVA ribosomal RNA gene database project: Improved data processing and web-based tools. Nucleic Acids Res. 2013, 41, D590–D596. [Google Scholar] [CrossRef]
- Paradis, E.; Claude, J.; Strimmer, K. APE: Analyses of Phylogenetics and Evolution in R language. Bioinformatics 2004, 20, 289–290. [Google Scholar] [CrossRef] [Green Version]
- Liaw, A.; Wiener, M. Classification and regression by randomForest. R News 2002, 2, 18–22. [Google Scholar]
- Wickham, H. Ggplot2: Elegant Graphics for Data Analysis; Springer: New York, NY, USA, 2016. [Google Scholar]
- Bland, J.M.; Altman, D.G. Calculating correlation coefficients with repeated observations: Part 1—Correlation within subjects. BMJ 1995, 310, 446. [Google Scholar] [CrossRef] [Green Version]
- Wu, G.; Zhao, N.; Zhang, C.; Lam, Y.Y.; Zhao, L. Guild-based analysis for understanding gut microbiome in human health and diseases. Genome Med. 2021, 13, 1–12. [Google Scholar] [CrossRef]
- Douglas, G.M.; Maffei, V.J.; Zaneveld, J.R.; Yurgel, S.N.; Brown, J.R.; Taylor, C.M.; Huttenhower, C.; Langille, M.G.I. PICRUSt2 for prediction of metagenome functions. Nat. Biotechnol. 2020, 38, 685–688. [Google Scholar] [CrossRef] [PubMed]
- Pietta, P.G.; Simonetti, P.; Gardana, C.; Brusamolino, A.; Morazzoni, P.; Bombardelli, E. Catechin metabolites after intake of green tea infusions. Biofactors 1998, 8, 111–118. [Google Scholar] [CrossRef]
- Cani, P.D.; Amar, J.; Iglesias, M.A.; Poggi, M.; Knauf, C.; Bastelica, D.; Neyrinck, A.M.; Fava, F.; Tuohy, K.M.; Chabo, C.; et al. Metabolic endotoxemia initiates obesity and insulin resistance. Diabetes 2007, 56, 1761–1772. [Google Scholar] [CrossRef] [PubMed] [Green Version]
- Wang, Y.; Dilidaxi, D.; Wu, Y.; Sailike, J.; Sun, X.; Nabi, X.H. Composite probiotics alleviate type 2 diabetes by regulating intestinal microbiota and inducing GLP-1 secretion in db/db mice. Biomed. Pharmacother. 2020, 125, 109914. [Google Scholar] [CrossRef] [PubMed]
- Hsieh, P.S.; Ho, H.H.; Hsieh, S.H.; Kuo, Y.W.; Tseng, H.Y.; Kao, H.F.; Wang, J.Y. Lactobacillus salivarius AP-32 and Lactobacillus reuteri GL-104 decrease glycemic levels and attenuate diabetes-mediated liver and kidney injury in db/db mice. BMJ Open Diabetes Res. Care 2020, 8, e001028. [Google Scholar] [CrossRef] [Green Version]
- Kong, H.; Yu, L.; Gu, Z.; Li, C.; Ban, X.; Cheng, L.; Hong, Y.; Li, Z. Novel Short-Clustered Maltodextrin as a Dietary Starch Substitute Attenuates Metabolic Dysregulation and Restructures Gut Microbiota in db/db Mice. J. Agric. Food Chem. 2020, 68, 12400–12412. [Google Scholar] [CrossRef]
- Zhou, L.; Ni, Z.X.; Yu, J.; Cheng, W.; Cai, Z.L.; Yu, C.Q. Correlation between Fecal Metabolomics and Gut Microbiota in Obesity and Polycystic Ovary Syndrome. Front. Endocrinol. 2020, 11, 628. [Google Scholar] [CrossRef]
- Chen, L.W.; Xu, J.; Soh, S.E.; Aris, I.M.; Tint, M.T.; Gluckman, P.D.; Tan, K.H.; Shek, L.P.C.; Chong, Y.S.; Yap, F.; et al. Implication of gut microbiota in the association between infant antibiotic exposure and childhood obesity and adiposity accumulation. Int. J. Obes. 2020, 44, 1508–1520. [Google Scholar] [CrossRef]
- Warda, A.K.; de Almeida Bettio, P.H.; Hueston, C.M.; Di Benedetto, G.; Clooney, A.G.; Hill, C. Oral Administration of Heat-Treated Lactobacilli Modifies the Murine Microbiome and Reduces Citrobacter Induced Colitis. Front. Microbiol. 2020, 11, 69. [Google Scholar] [CrossRef] [Green Version]
- Cani, P.D.; Osto, M.; Geurts, L.; Everard, A. Involvement of gut microbiota in the development of low-grade inflammation and type 2 diabetes associated with obesity. Gut Microbes 2012, 3, 279–288. [Google Scholar] [CrossRef] [Green Version]
- Maifeld, A.; Bartolomaeus, H.; Lober, U.; Avery, E.G.; Steckhan, N.; Marko, L.; Wilck, N.; Hamad, I.; Susnjar, U.; Mahler, A.; et al. Fasting alters the gut microbiome reducing blood pressure and body weight in metabolic syndrome patients. Nat. Commun. 2021, 12, 1970. [Google Scholar] [CrossRef] [PubMed]
- Zhang, L.; Xue, X.; Zhai, R.; Yang, X.; Li, H.; Zhao, L.; Zhang, C. Timing of Calorie Restriction in Mice Impacts Host Metabolic Phenotype with Correlative Changes in Gut Microbiota. Msystems 2019, 4, e00348-19. [Google Scholar] [CrossRef] [PubMed] [Green Version]
- Peng, Y.; Tan, Q.; Afhami, S.; Deehan, E.C.; Liang, S.; Gantz, M.; Triador, L.; Madsen, K.L.; Walter, J.; Tun, H.M.; et al. The Gut Microbiota Profile in Children with Prader-Willi Syndrome. Genes 2020, 11, 904. [Google Scholar] [CrossRef] [PubMed]
- Yu, K.B.; Hsiao, E.Y. Roles for the gut microbiota in regulating neuronal feeding circuits. J. Clin. Investig. 2021, 131, e143772. [Google Scholar] [CrossRef] [PubMed]


Publisher’s Note: MDPI stays neutral with regard to jurisdictional claims in published maps and institutional affiliations. |
© 2021 by the authors. Licensee MDPI, Basel, Switzerland. This article is an open access article distributed under the terms and conditions of the Creative Commons Attribution (CC BY) license (https://creativecommons.org/licenses/by/4.0/).
Share and Cite
Wu, G.; Liu, A.B.; Xu, Y.; Wang, Y.; Zhao, L.; Hara, Y.; Lam, Y.Y.; Yang, C.S. The Effects of Green Tea on Diabetes and Gut Microbiome in db/db Mice: Studies with Tea Extracts vs. Tea Powder. Nutrients 2021, 13, 3155. https://doi.org/10.3390/nu13093155
Wu G, Liu AB, Xu Y, Wang Y, Zhao L, Hara Y, Lam YY, Yang CS. The Effects of Green Tea on Diabetes and Gut Microbiome in db/db Mice: Studies with Tea Extracts vs. Tea Powder. Nutrients. 2021; 13(9):3155. https://doi.org/10.3390/nu13093155
Chicago/Turabian StyleWu, Guojun, Anna B. Liu, Yang Xu, Ying Wang, Liping Zhao, Yukihiko Hara, Yan Y. Lam, and Chung S. Yang. 2021. "The Effects of Green Tea on Diabetes and Gut Microbiome in db/db Mice: Studies with Tea Extracts vs. Tea Powder" Nutrients 13, no. 9: 3155. https://doi.org/10.3390/nu13093155