
Influence of Synthesis Conditions on Gadolinium-Substituted Tricalcium Phosphate Ceramics and Its Physicochemical, Biological, and Antibacterial Properties

 , , , , ,
Abstract
:1. Introduction
2. Materials and Methods
3. Results
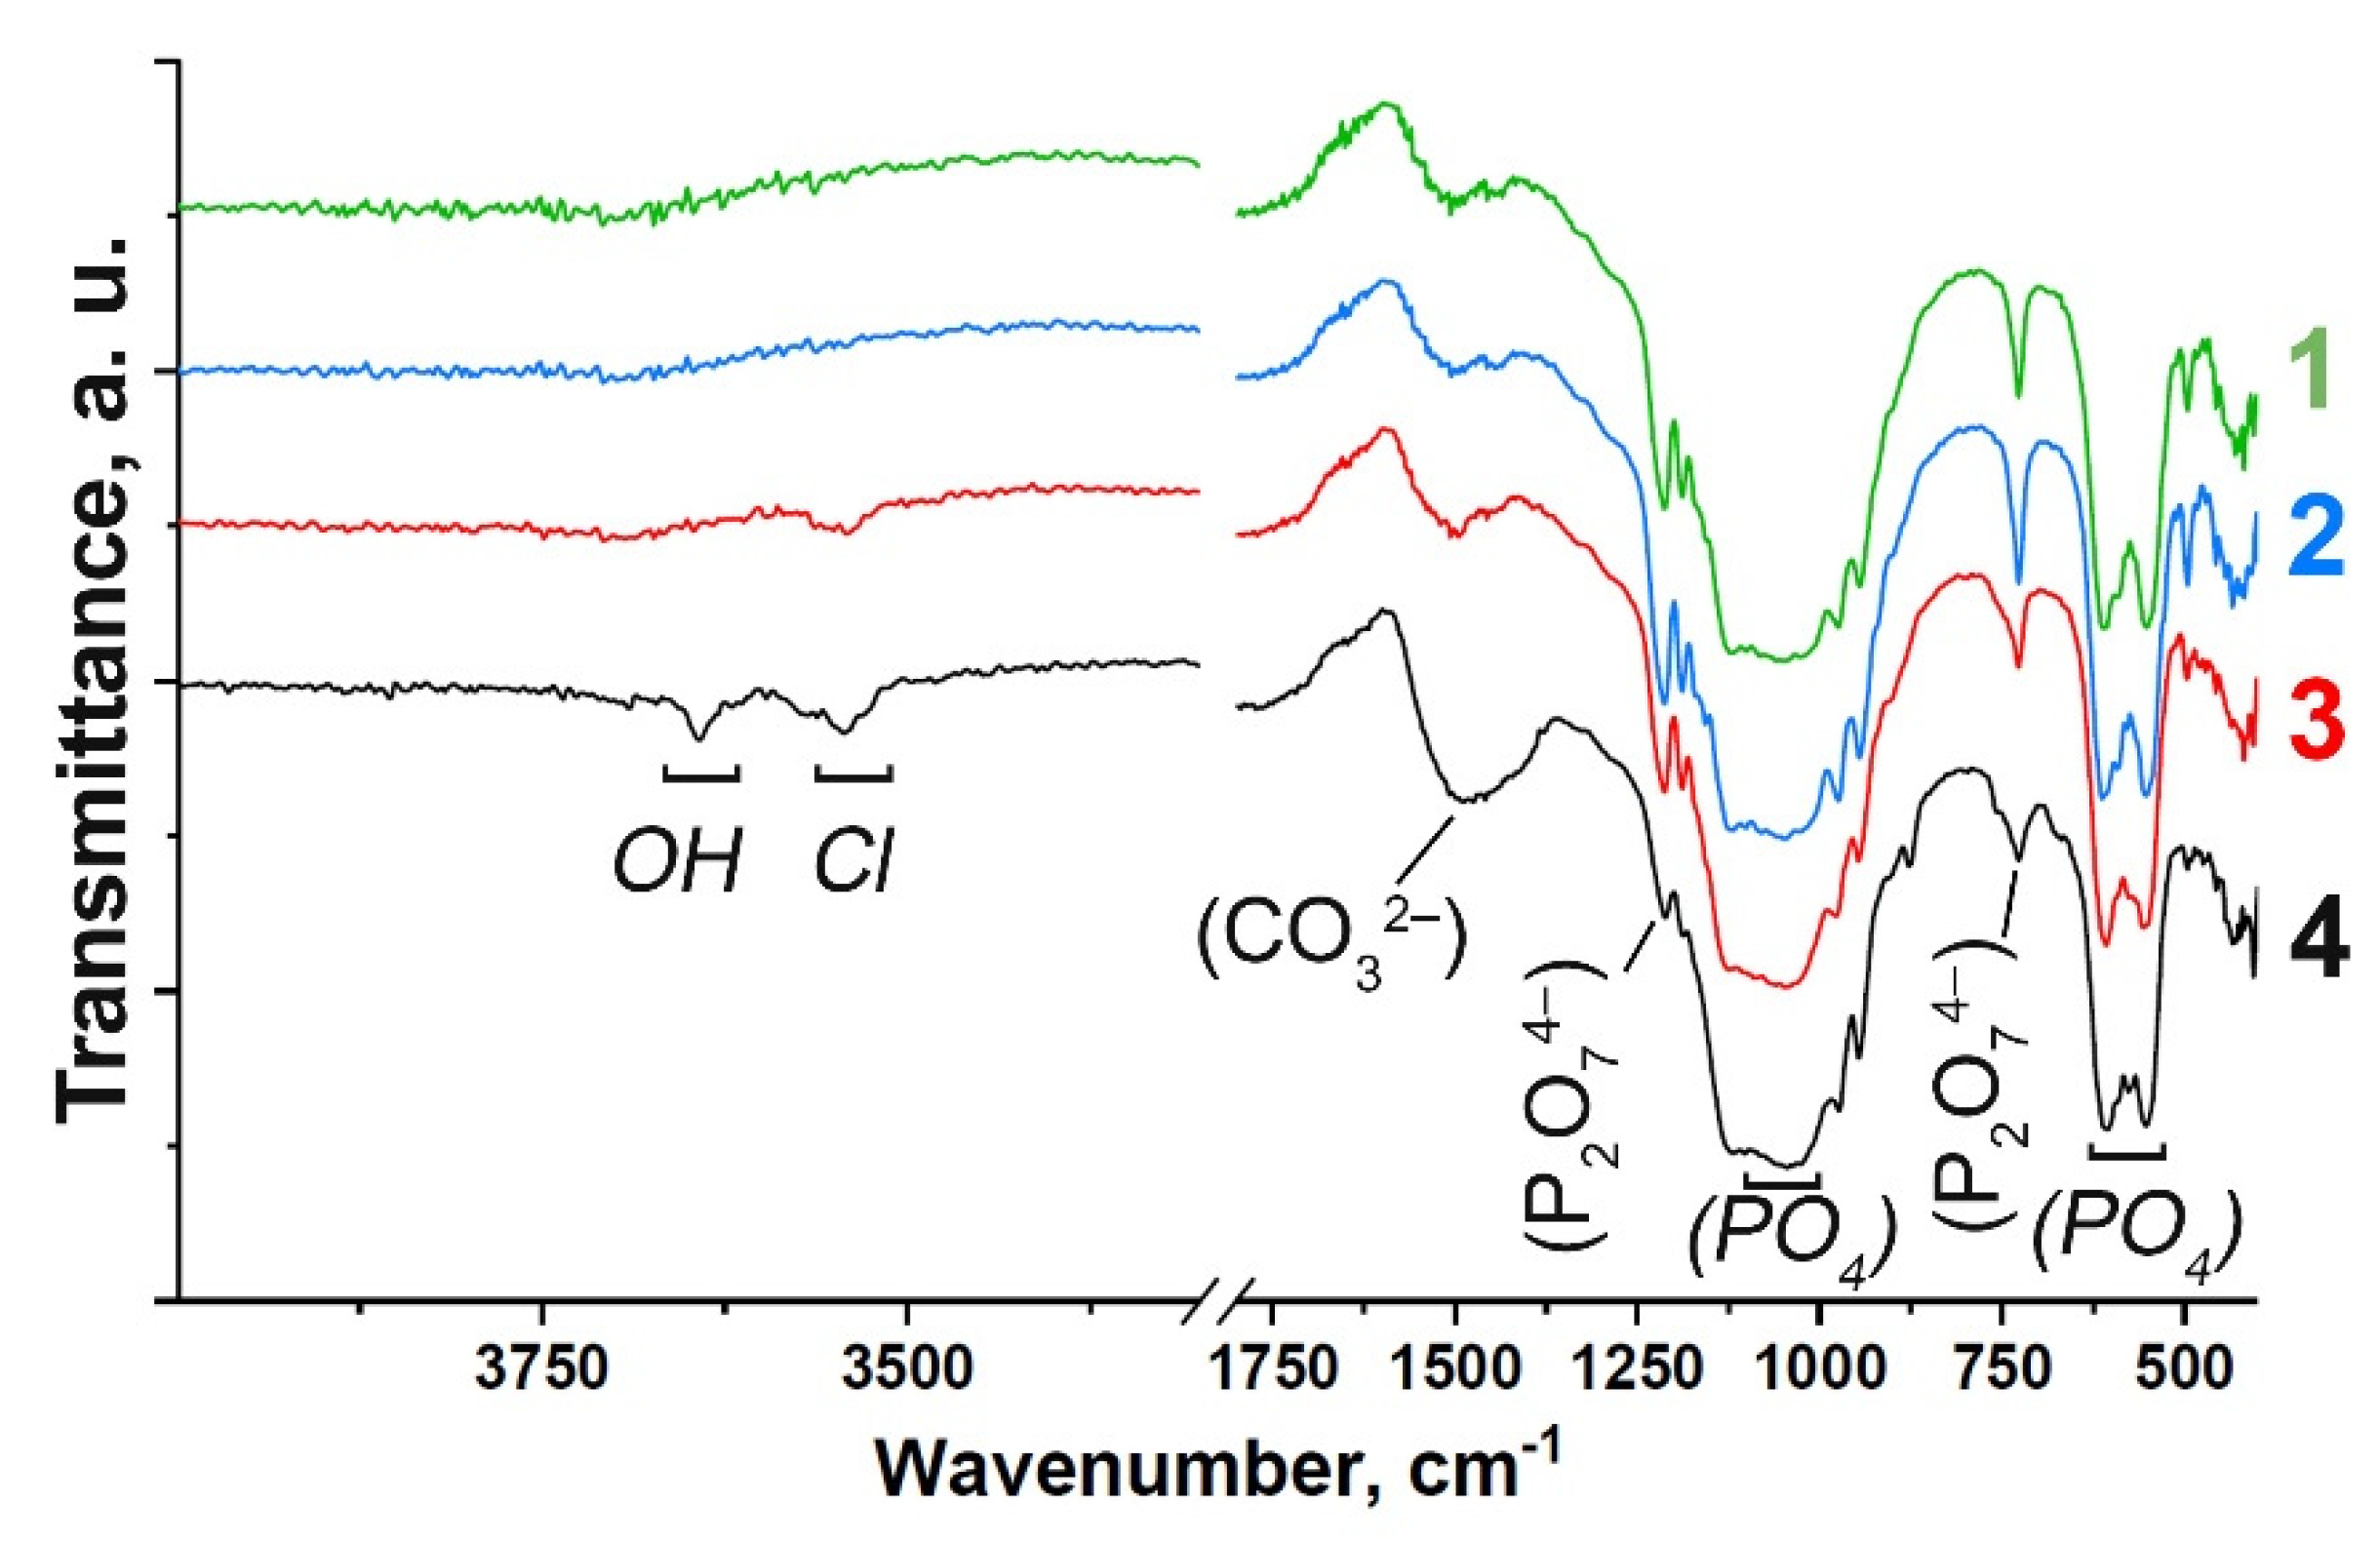
3.1. FT-IR Study
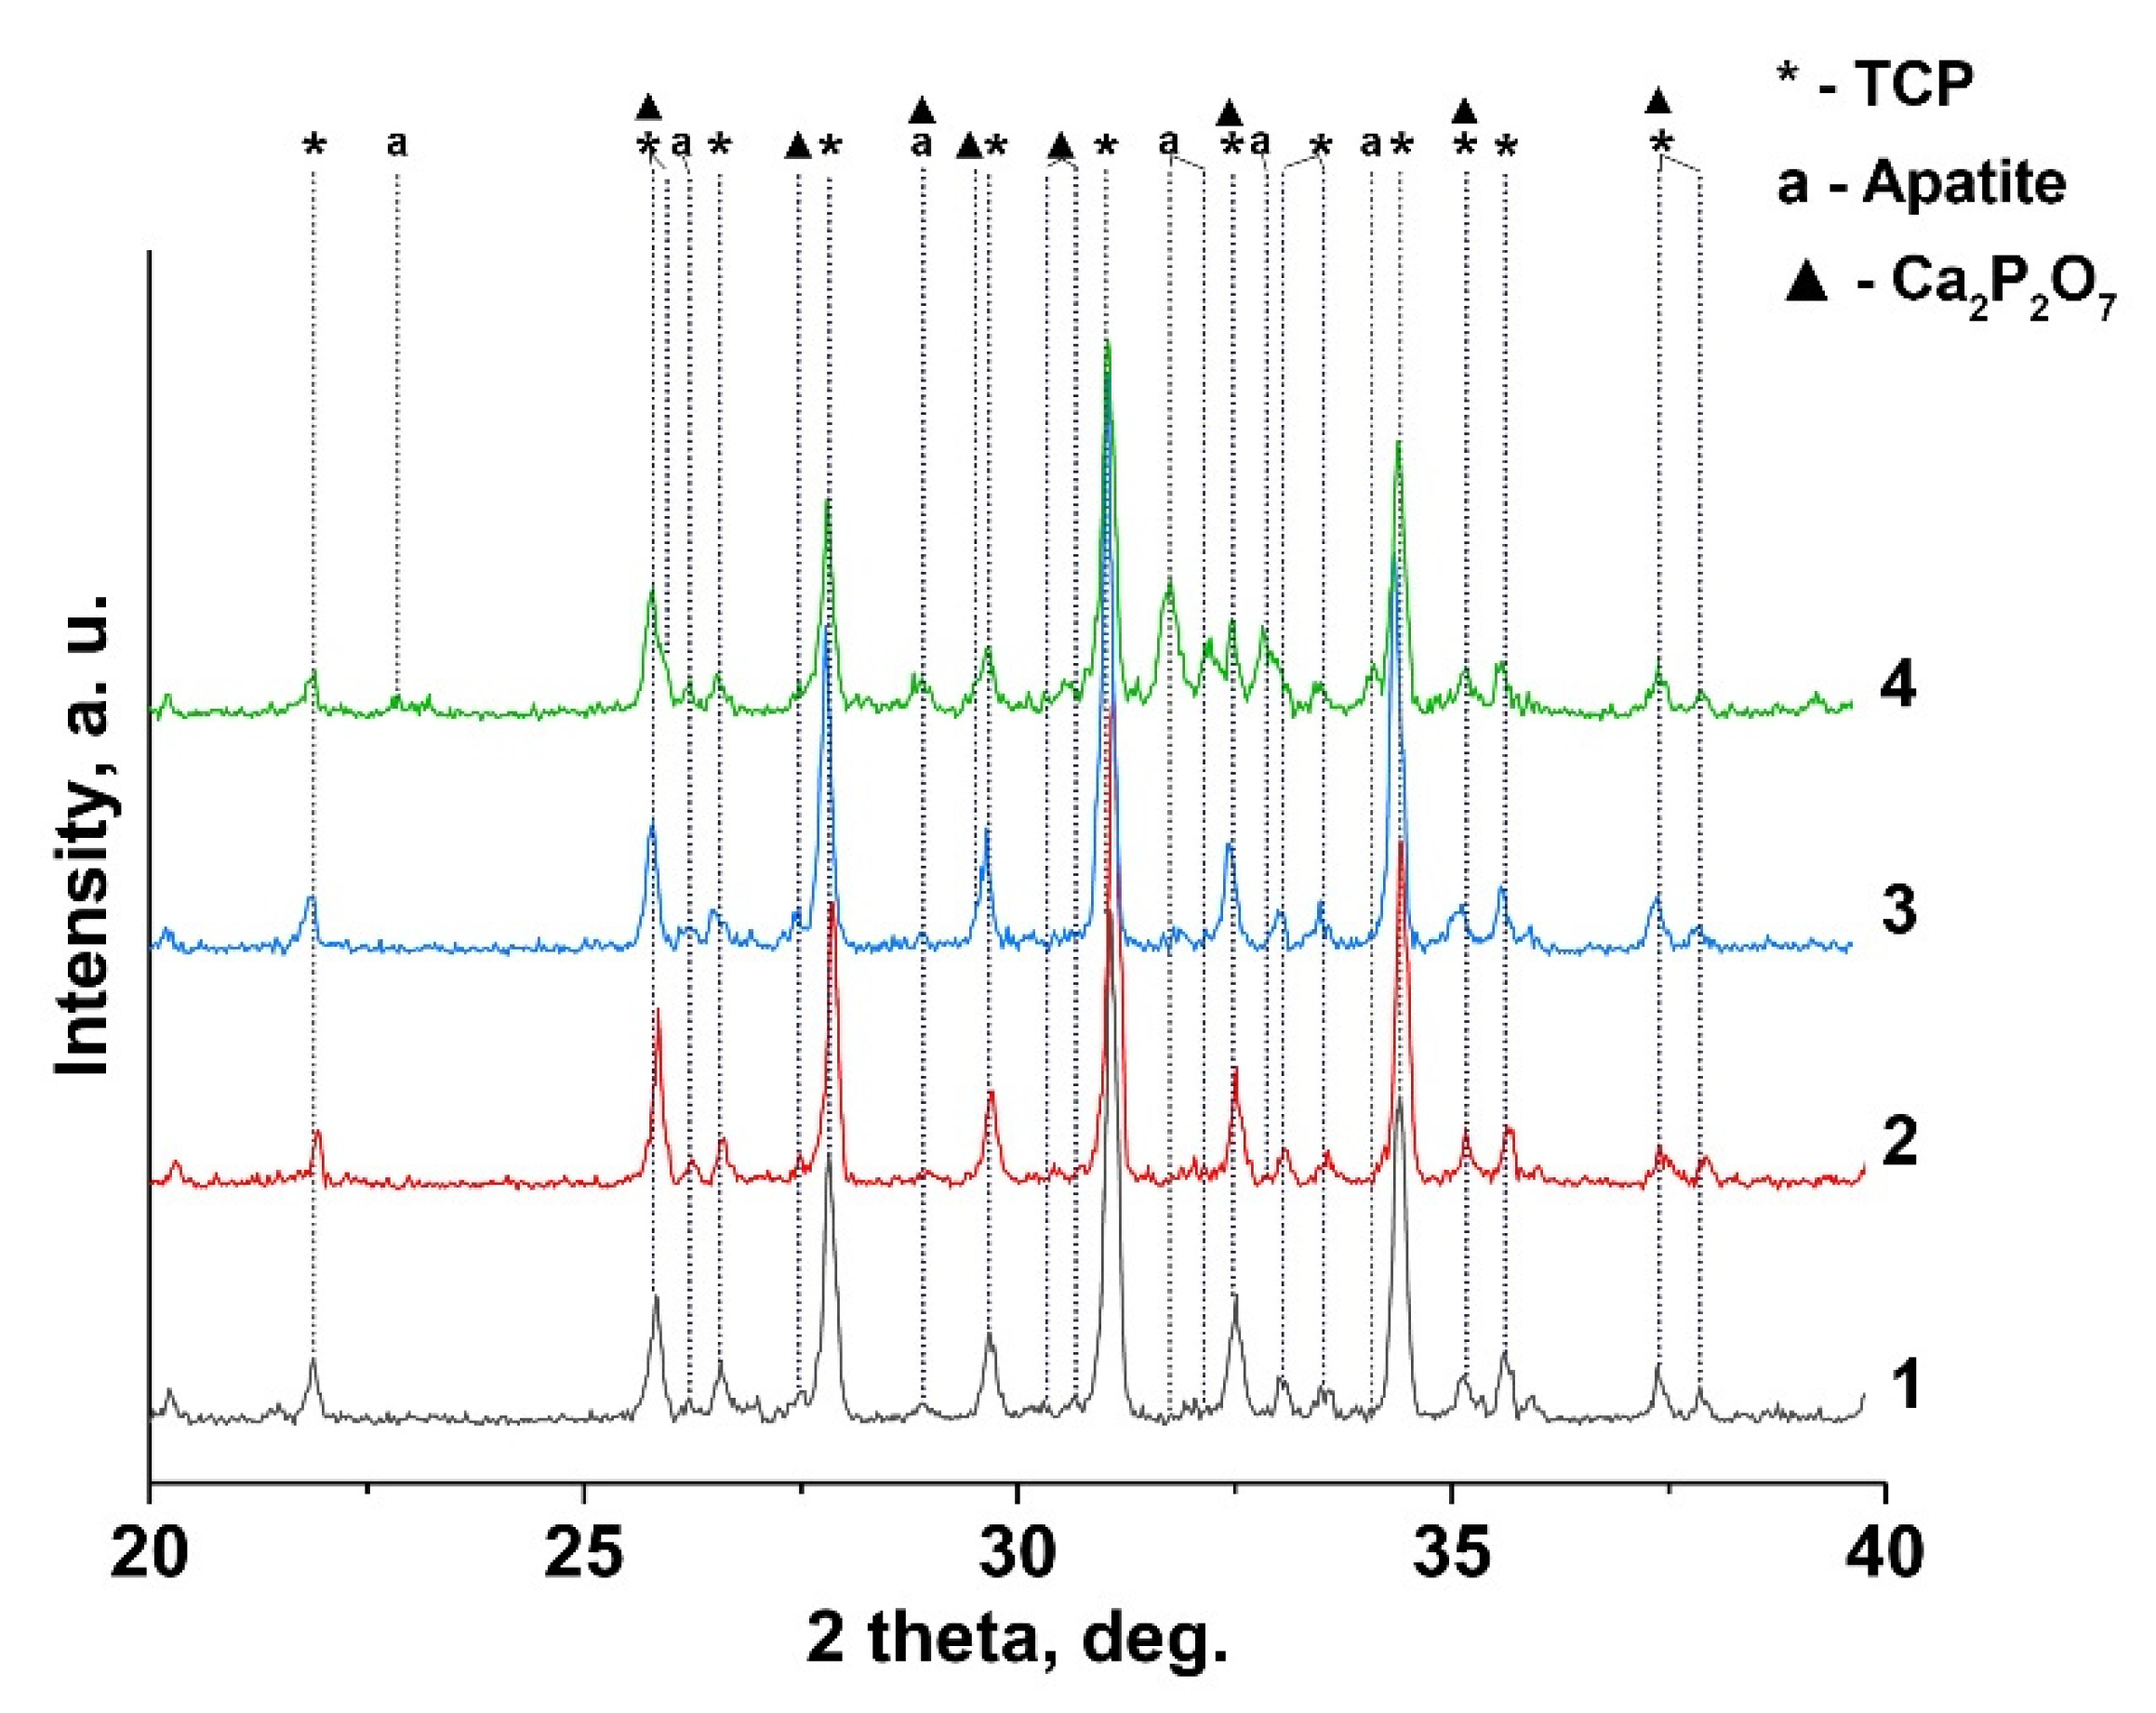
3.2. X-Ray Diffraction Study

| Phase, SG | wt% (JANA 2006) | a, Å | c, Å | V, Å3 | |
|---|---|---|---|---|---|
| 0.1Gd-TCP-ma | β-TCP, R3c | 73 | 10.423(6) | 37.391(3) | 3518.3(8) |
| Ca2.9Gd0.067(PO4)2 | Cl-AP, P63/m | 20 | 9.435(8) | 6.867(4) | 529.5(8) |
| Ca2P2O7, P41 | 7 | 6.686(5) | 24.148(6) | 1081.0(4) | |
| 0.1Gd-TCP-pc | β-TCP, R3c | 96 | 10.443(5) | 37.438(9) | 3536.3(8) |
| Ca2.9Gd0.067(PO4)2 | Cl-AP, P63/m | 2 | 9.339(7) | 6.918(6) | 522.7(8) |
| Ca2P2O7, P41 | 2 | 6.684(2) | 24.149(4) | 1080.5(4) | |
| 0.01Gd-TCP-ma | β-TCP, R3c | 87 | 10.437(4) | 37.403(2) | 3529.1(9) |
| Ca2.9Gd0.0067(PO4)2 | Cl-AP, P63/m | 7 | |||
| Ca2P2O7, P41 | 6 | 6.685(9) | 24.148(4) | 1082.1(6) | |
| 0.01Gd-TCP-pc | β-TCP, R3c | 96 | 10.438(1) | 37.406(2) | 3526.4(8) |
| Ca2.9Gd0.0067(PO4)2 | Cl-AP, P63/m | 0 | - | - | - |
| Ca2P2O7, P41 | 4 | ||||
| β-Ca3(PO4)2 [32] | R3c (Z = 21) | 10.435(2) | 37.402(9) | 3527.2(6) | |
| Ca2.928Eu0.048(PO4)2 [39] | R3c (Z = 21) | 10.440(1) | 37.380(1) | 3528.0(9) | |
| Ca2.858Eu0.095(PO4)2 [39] | R3c (Z = 21) | 10.440(1) | 37.39(1) | 3529 | |
| Ca10(PO4)6Cl2 [41] | P63/m (Z = 1) | 9.590(2) | 6.766(6) | 538.96 | |
| Ca10(PO4)6(OH)2 [42] | P63/m (Z = 1) | 9.4207(1) | 6.8817(1) | 528.92 | |
| (Ca4.87Gd0.11)2(PO4)6(OH)2 [43] | P63/m (Z = 1) | 9.41284(6) | 6.8815(1) | 528.03(9) | |
| Ca2P2O7 [34] | P41 (Z = 8) | 6.6858(8) | 24.147(5) | 1081.1(3) |
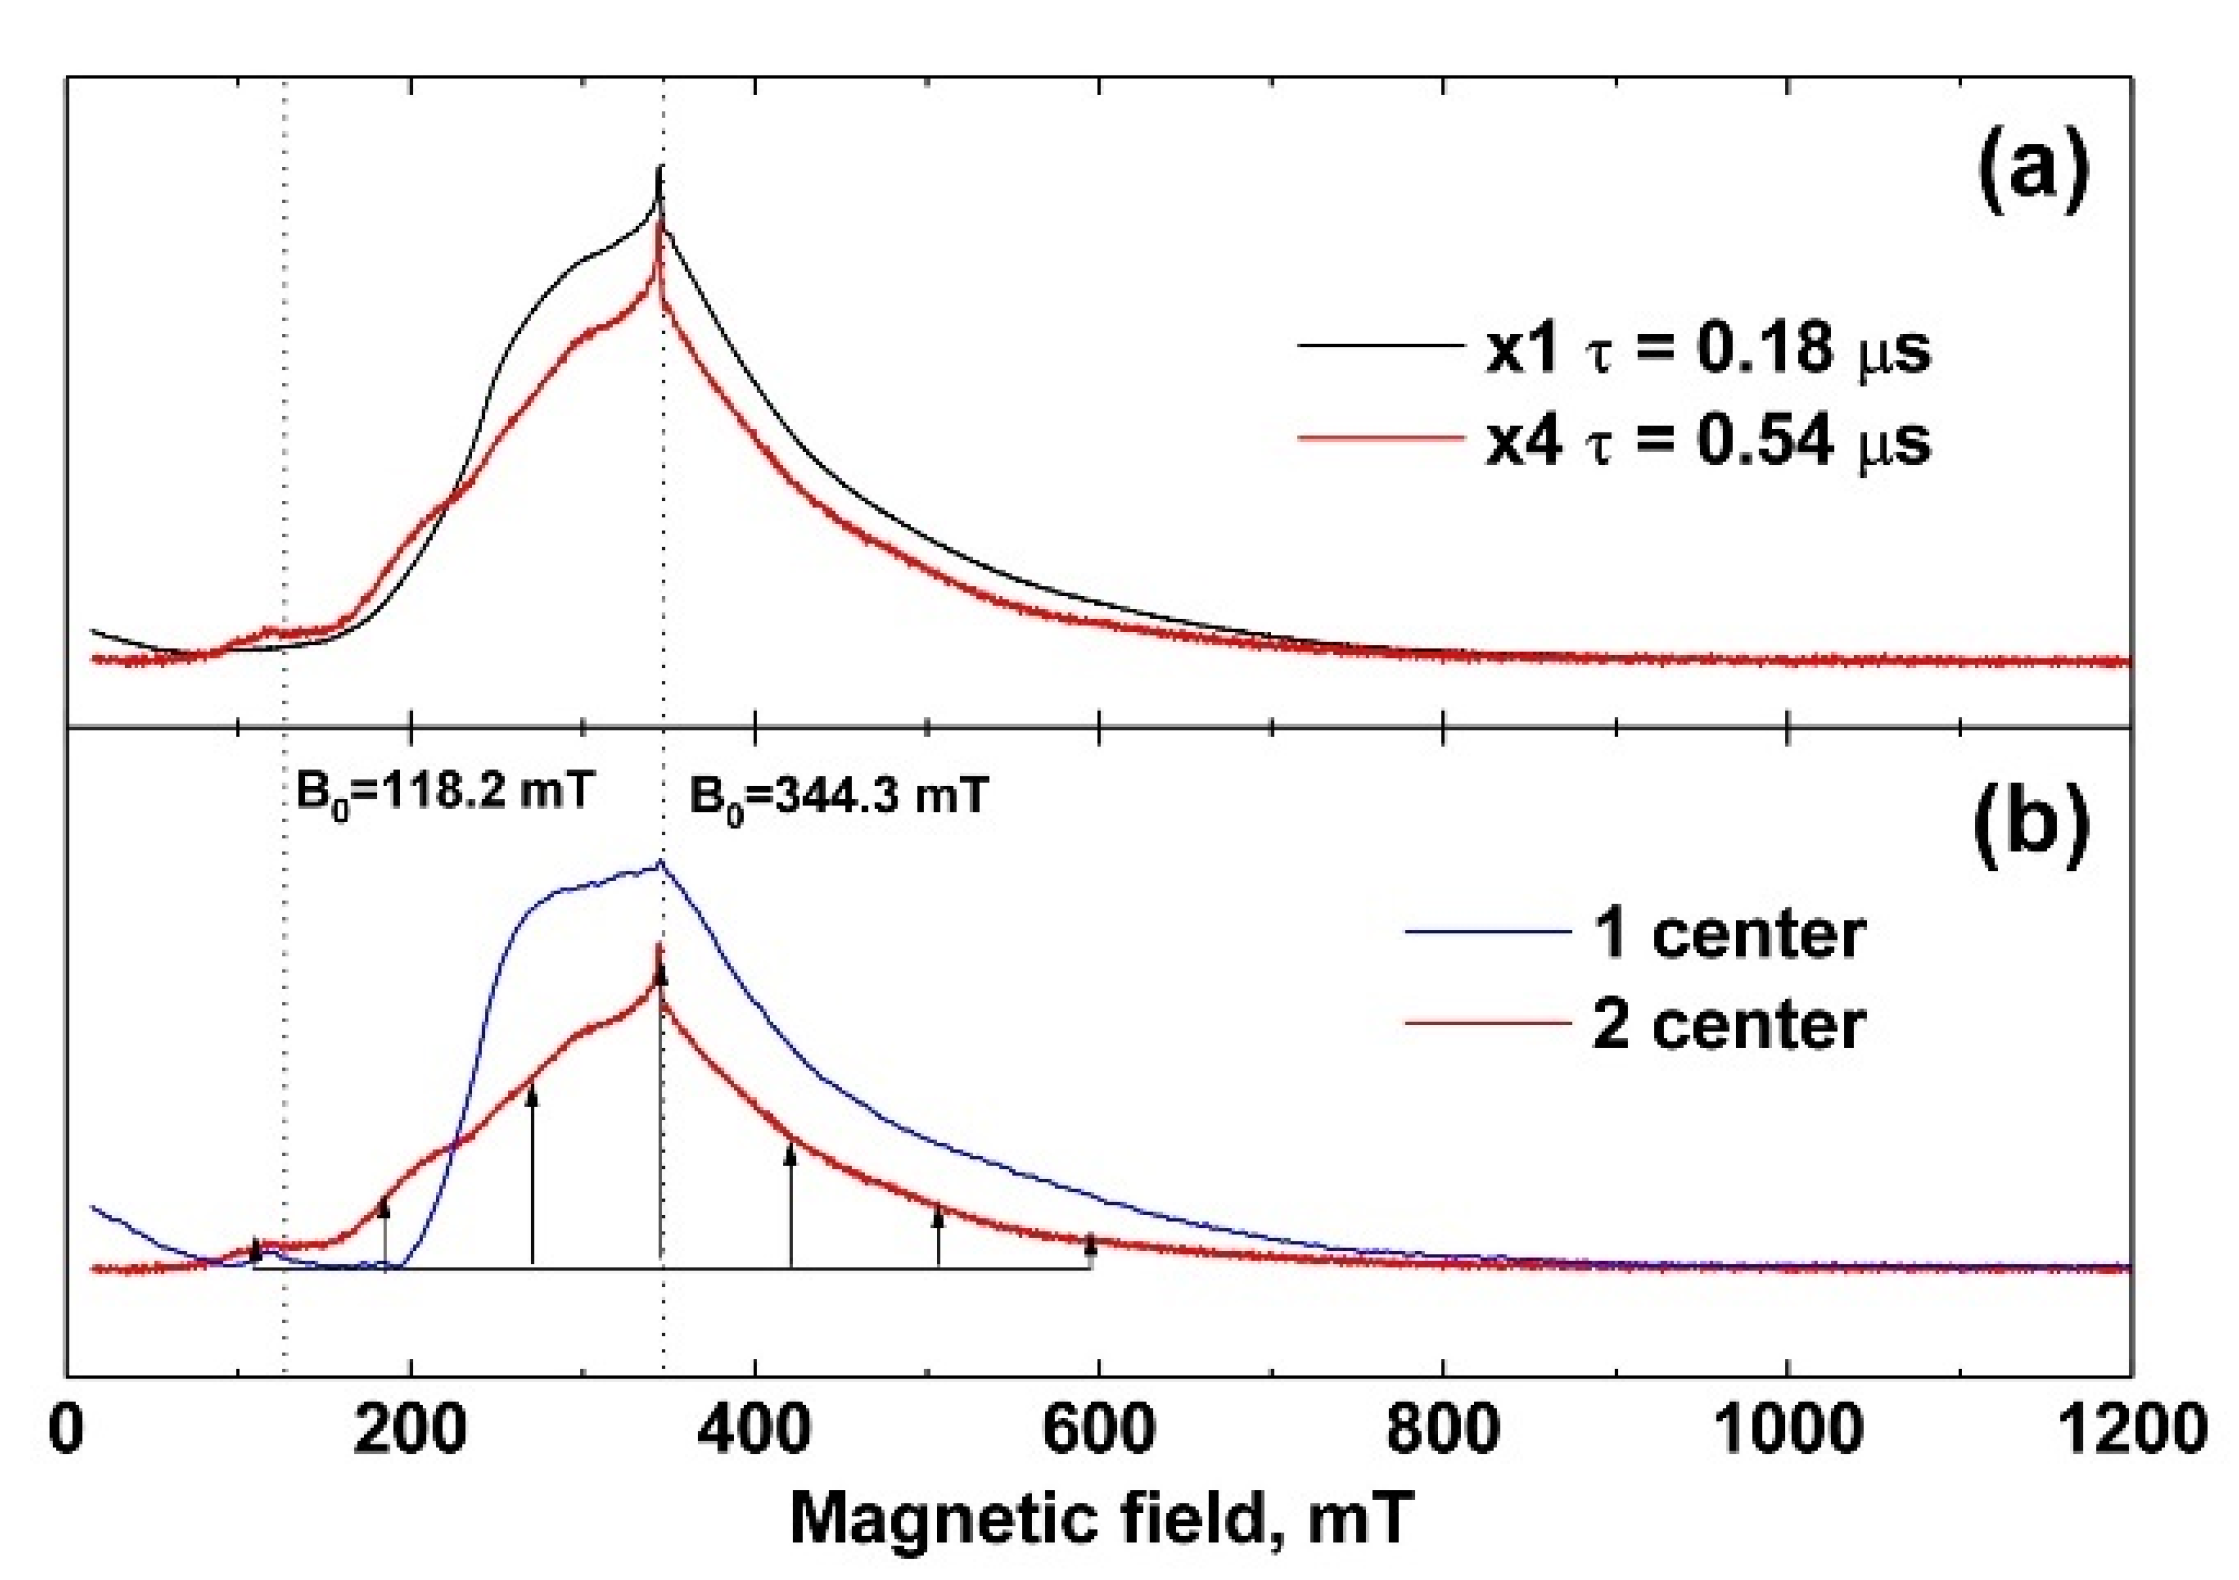
3.3. EPR Study
3.4. Thermogravimetric Analysis
3.5. Specific Surface Area of Powders
3.6. TEM Studies of Powders
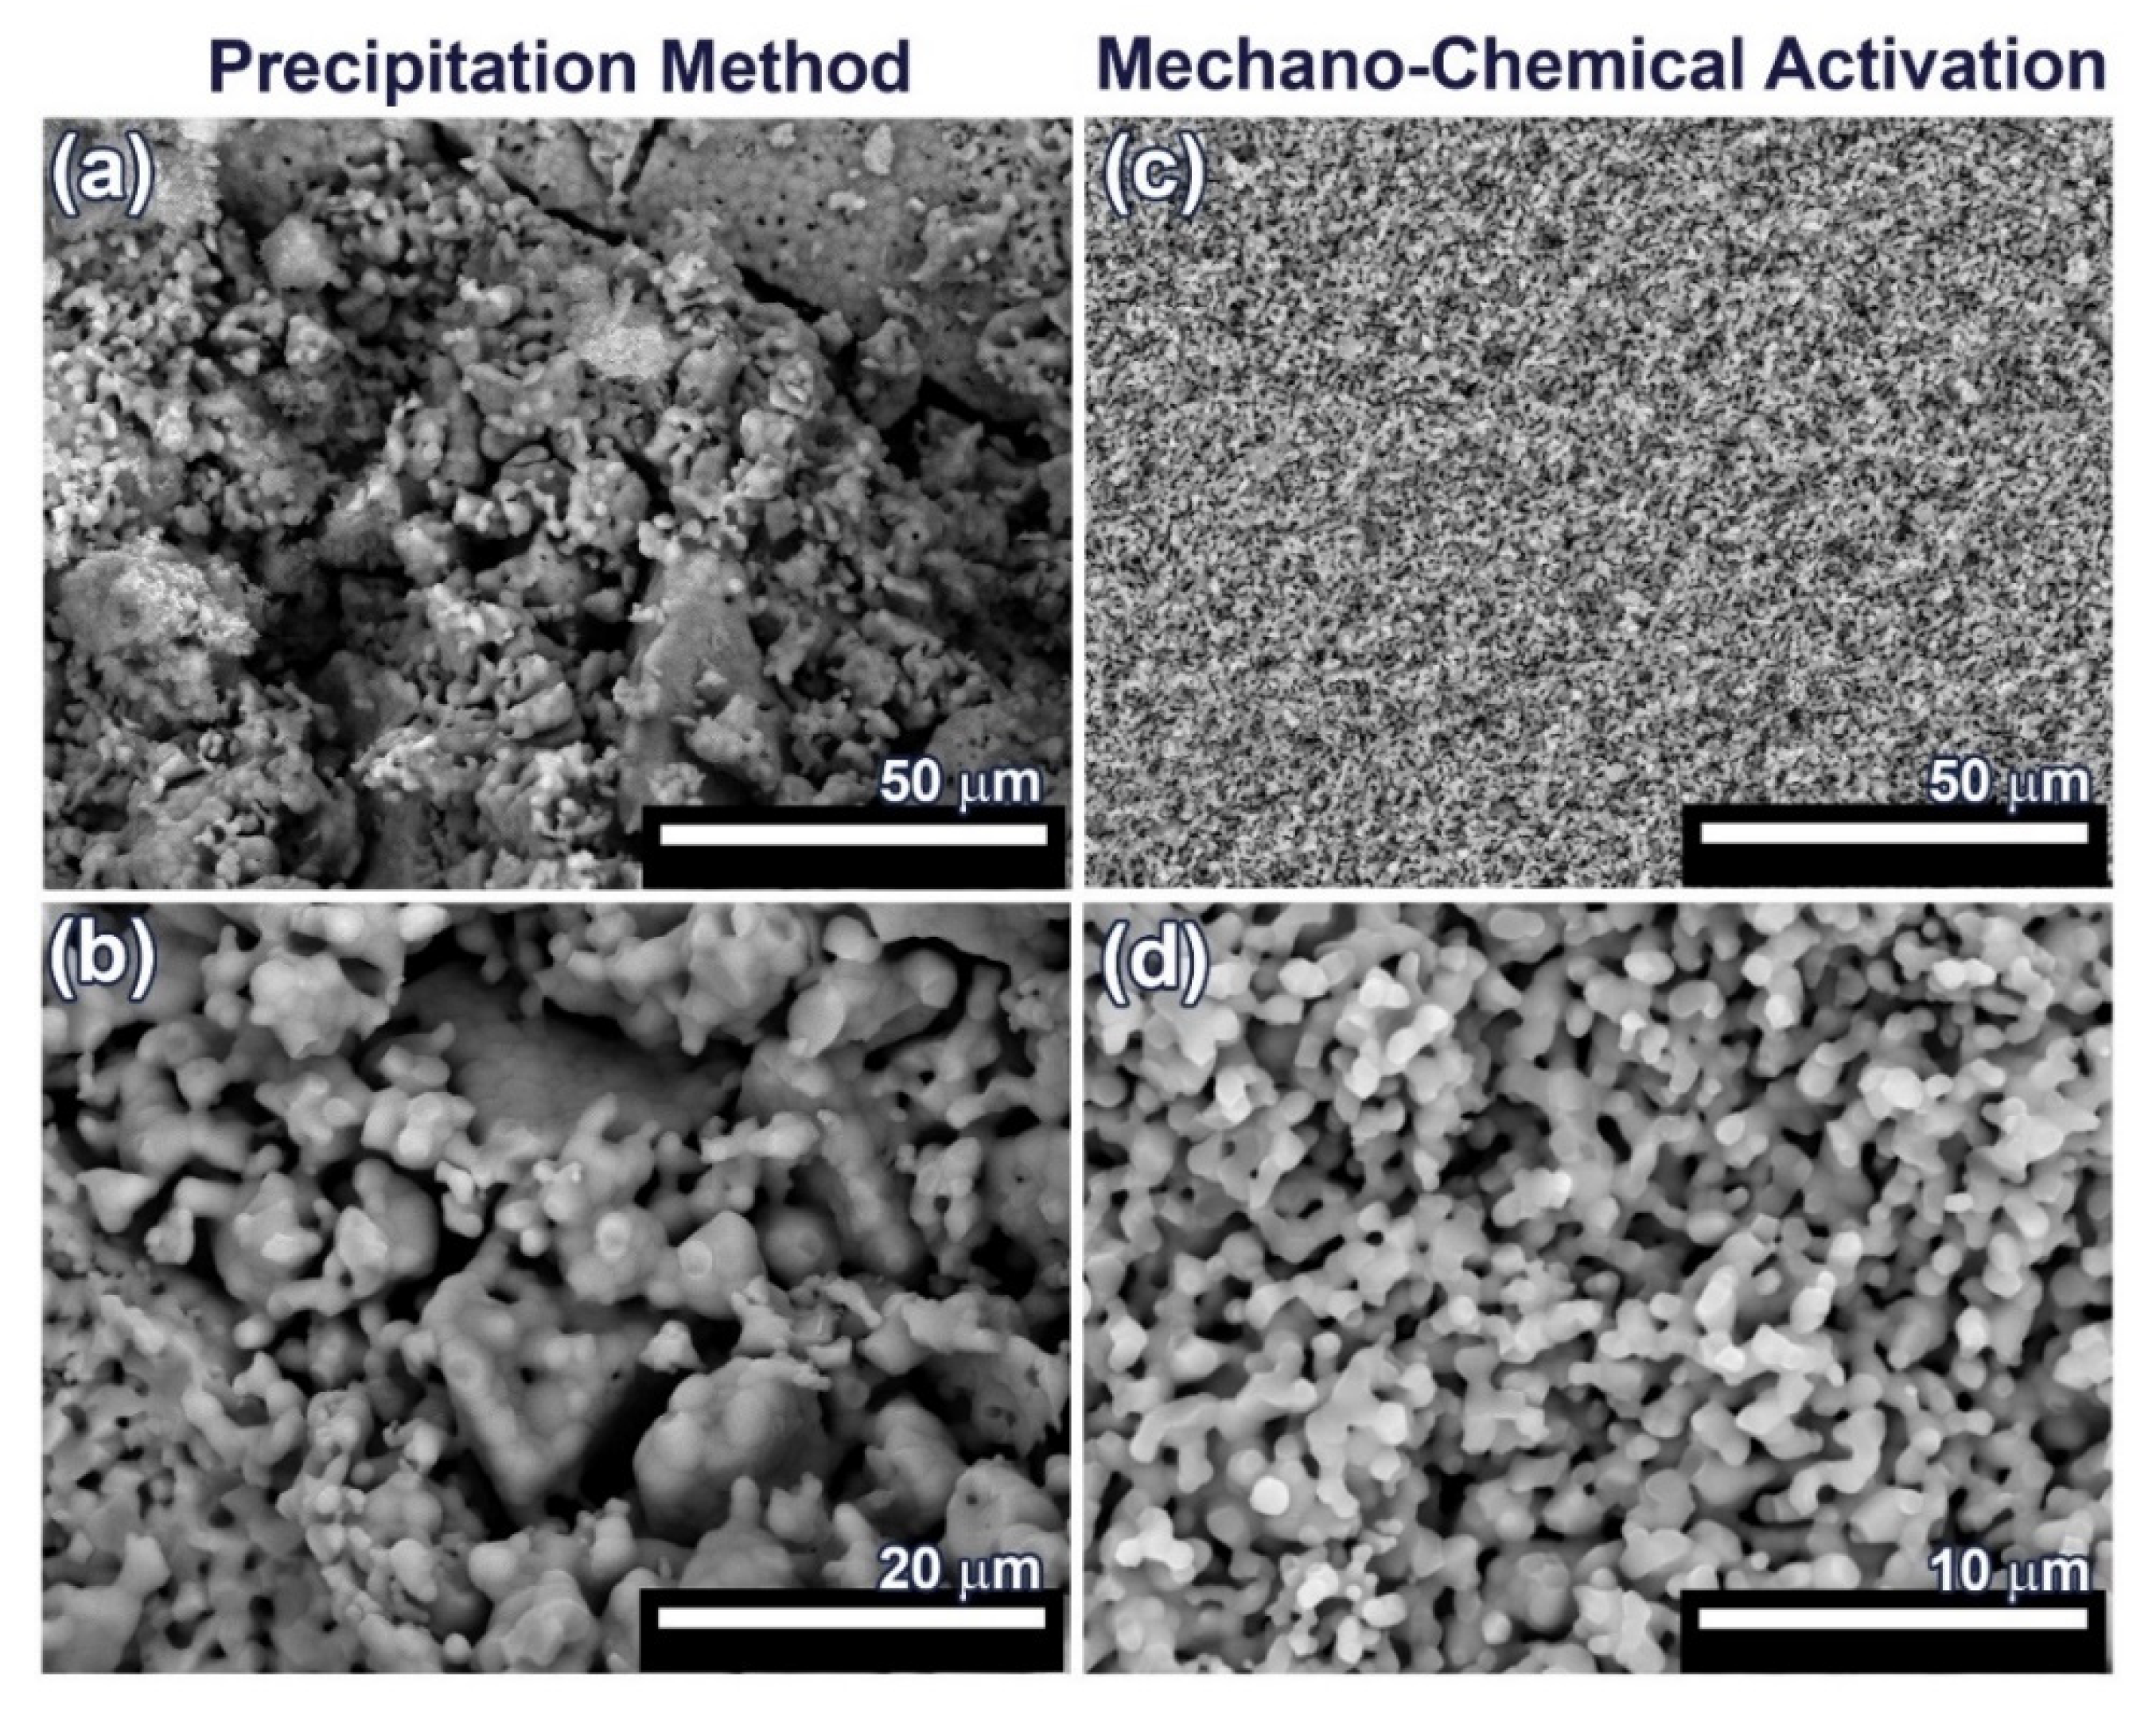
3.7. SEM Observations of Ceramics
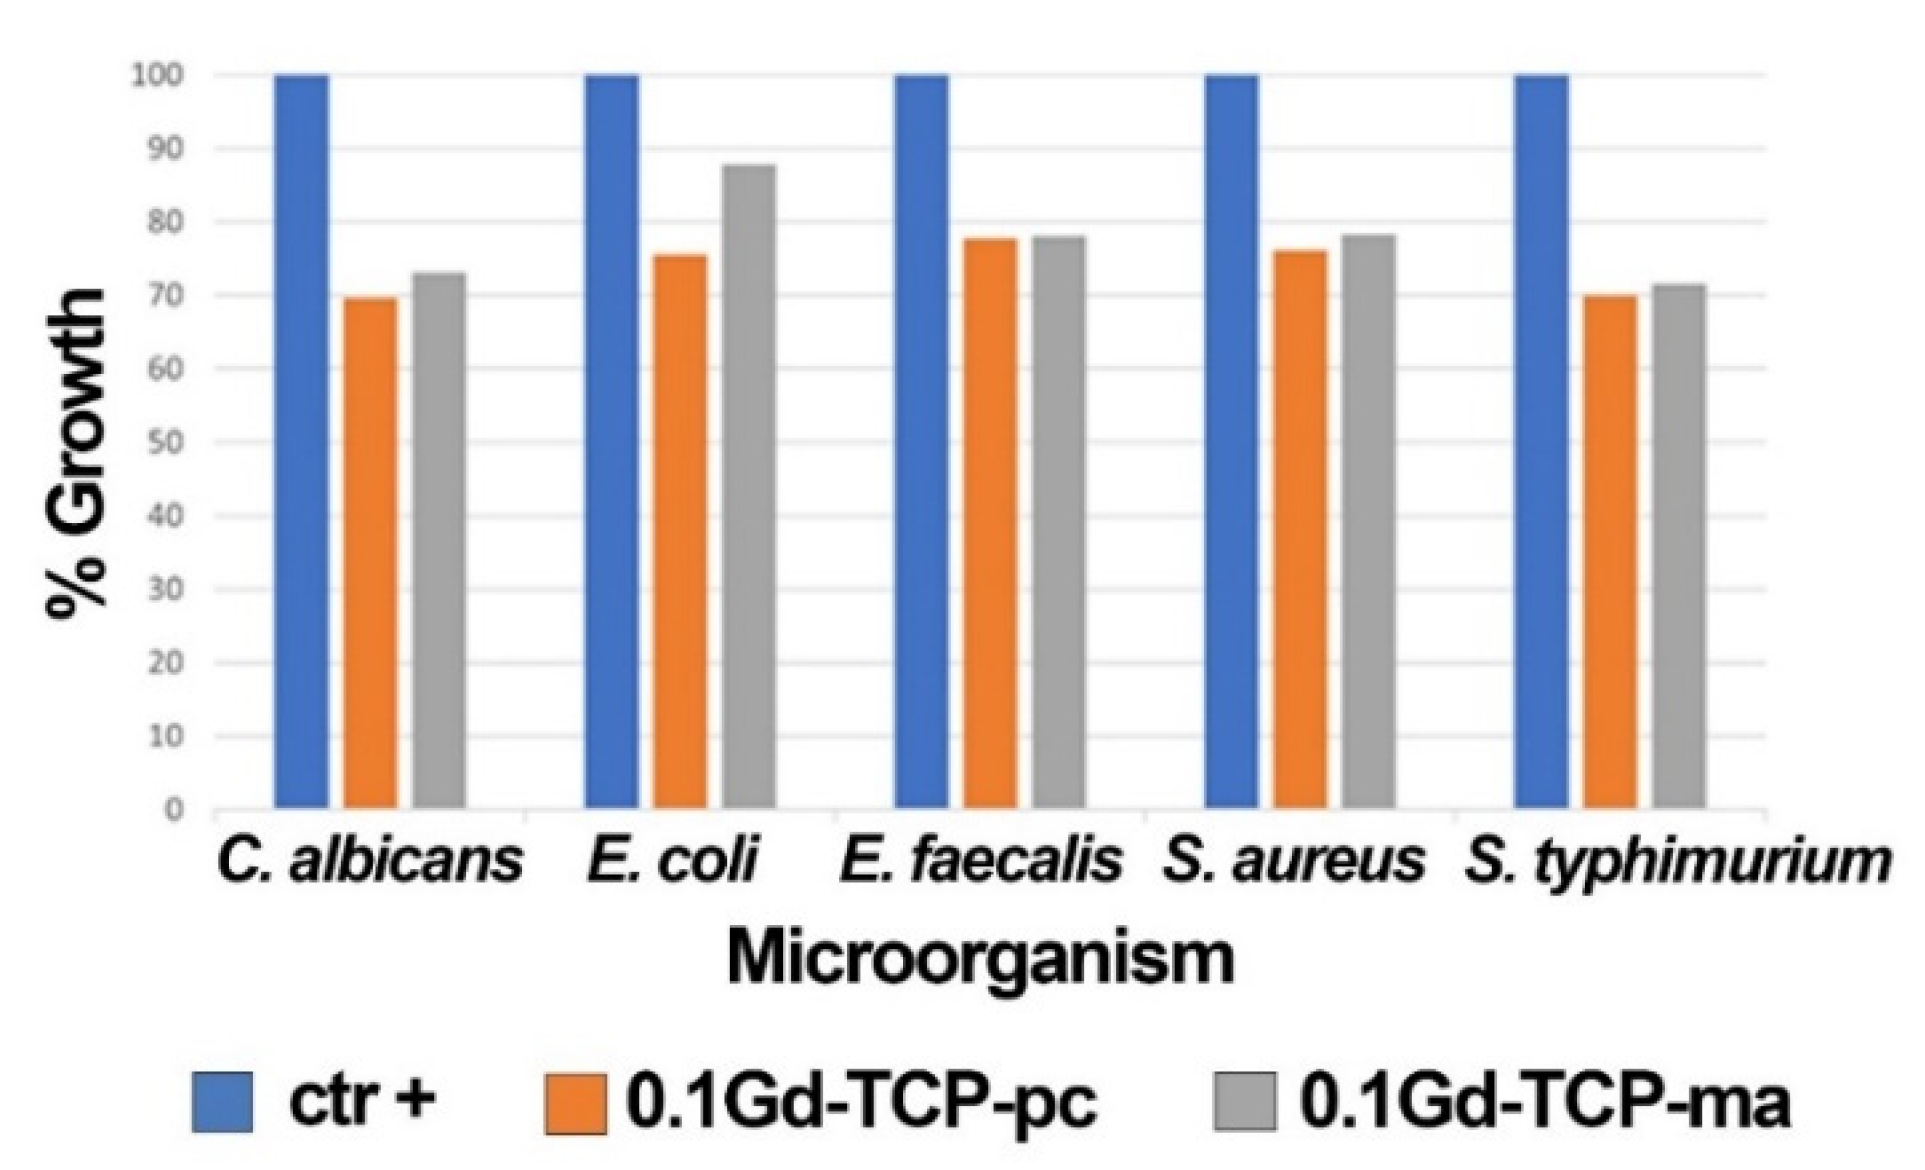
3.8. Antibacterial Activity Study
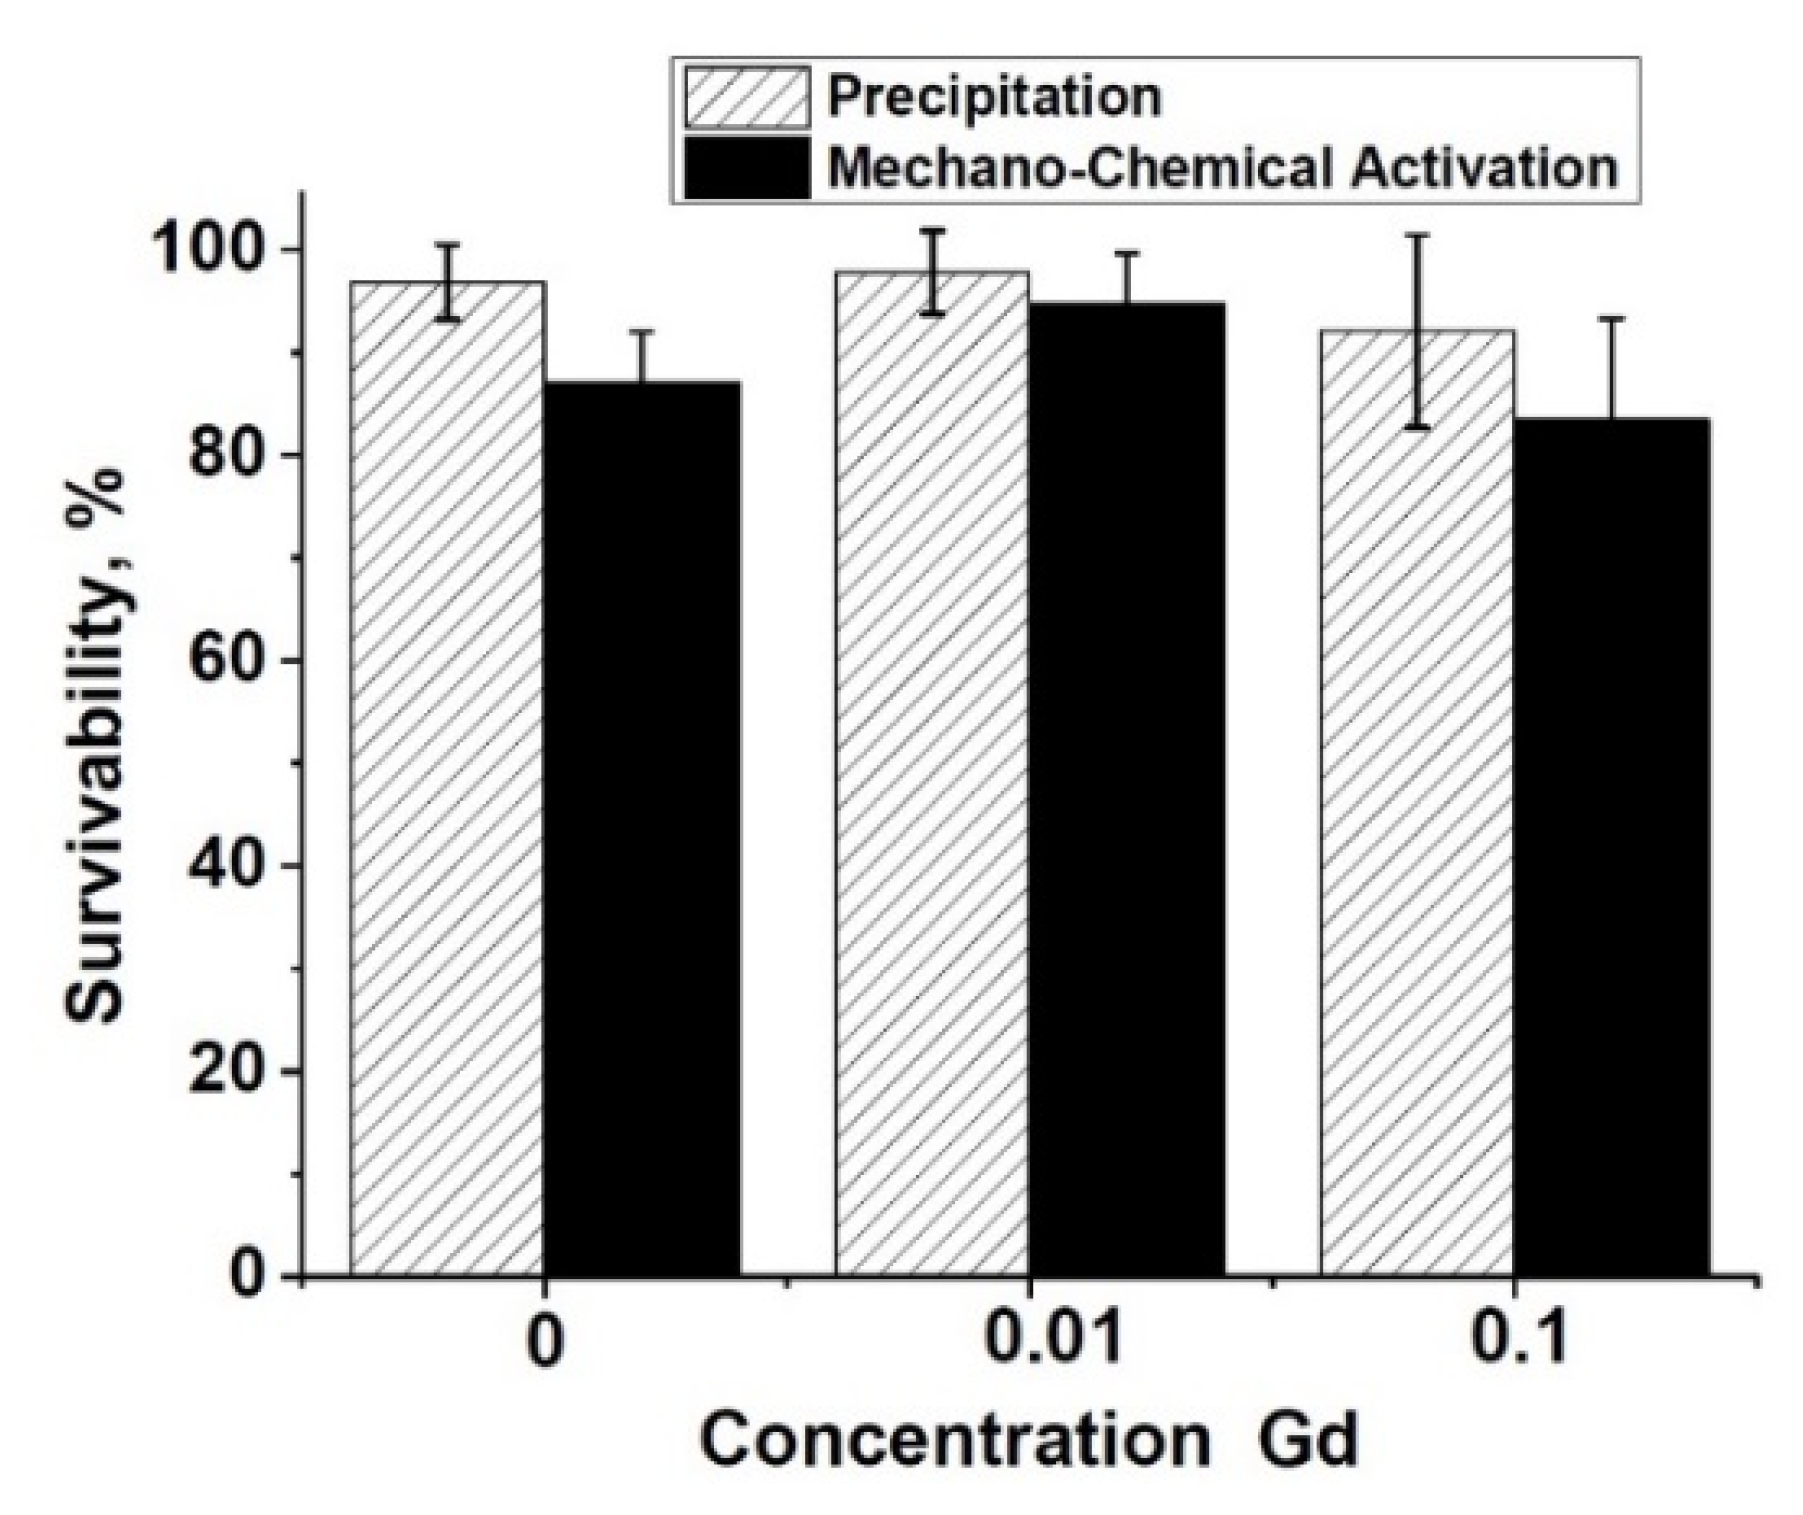
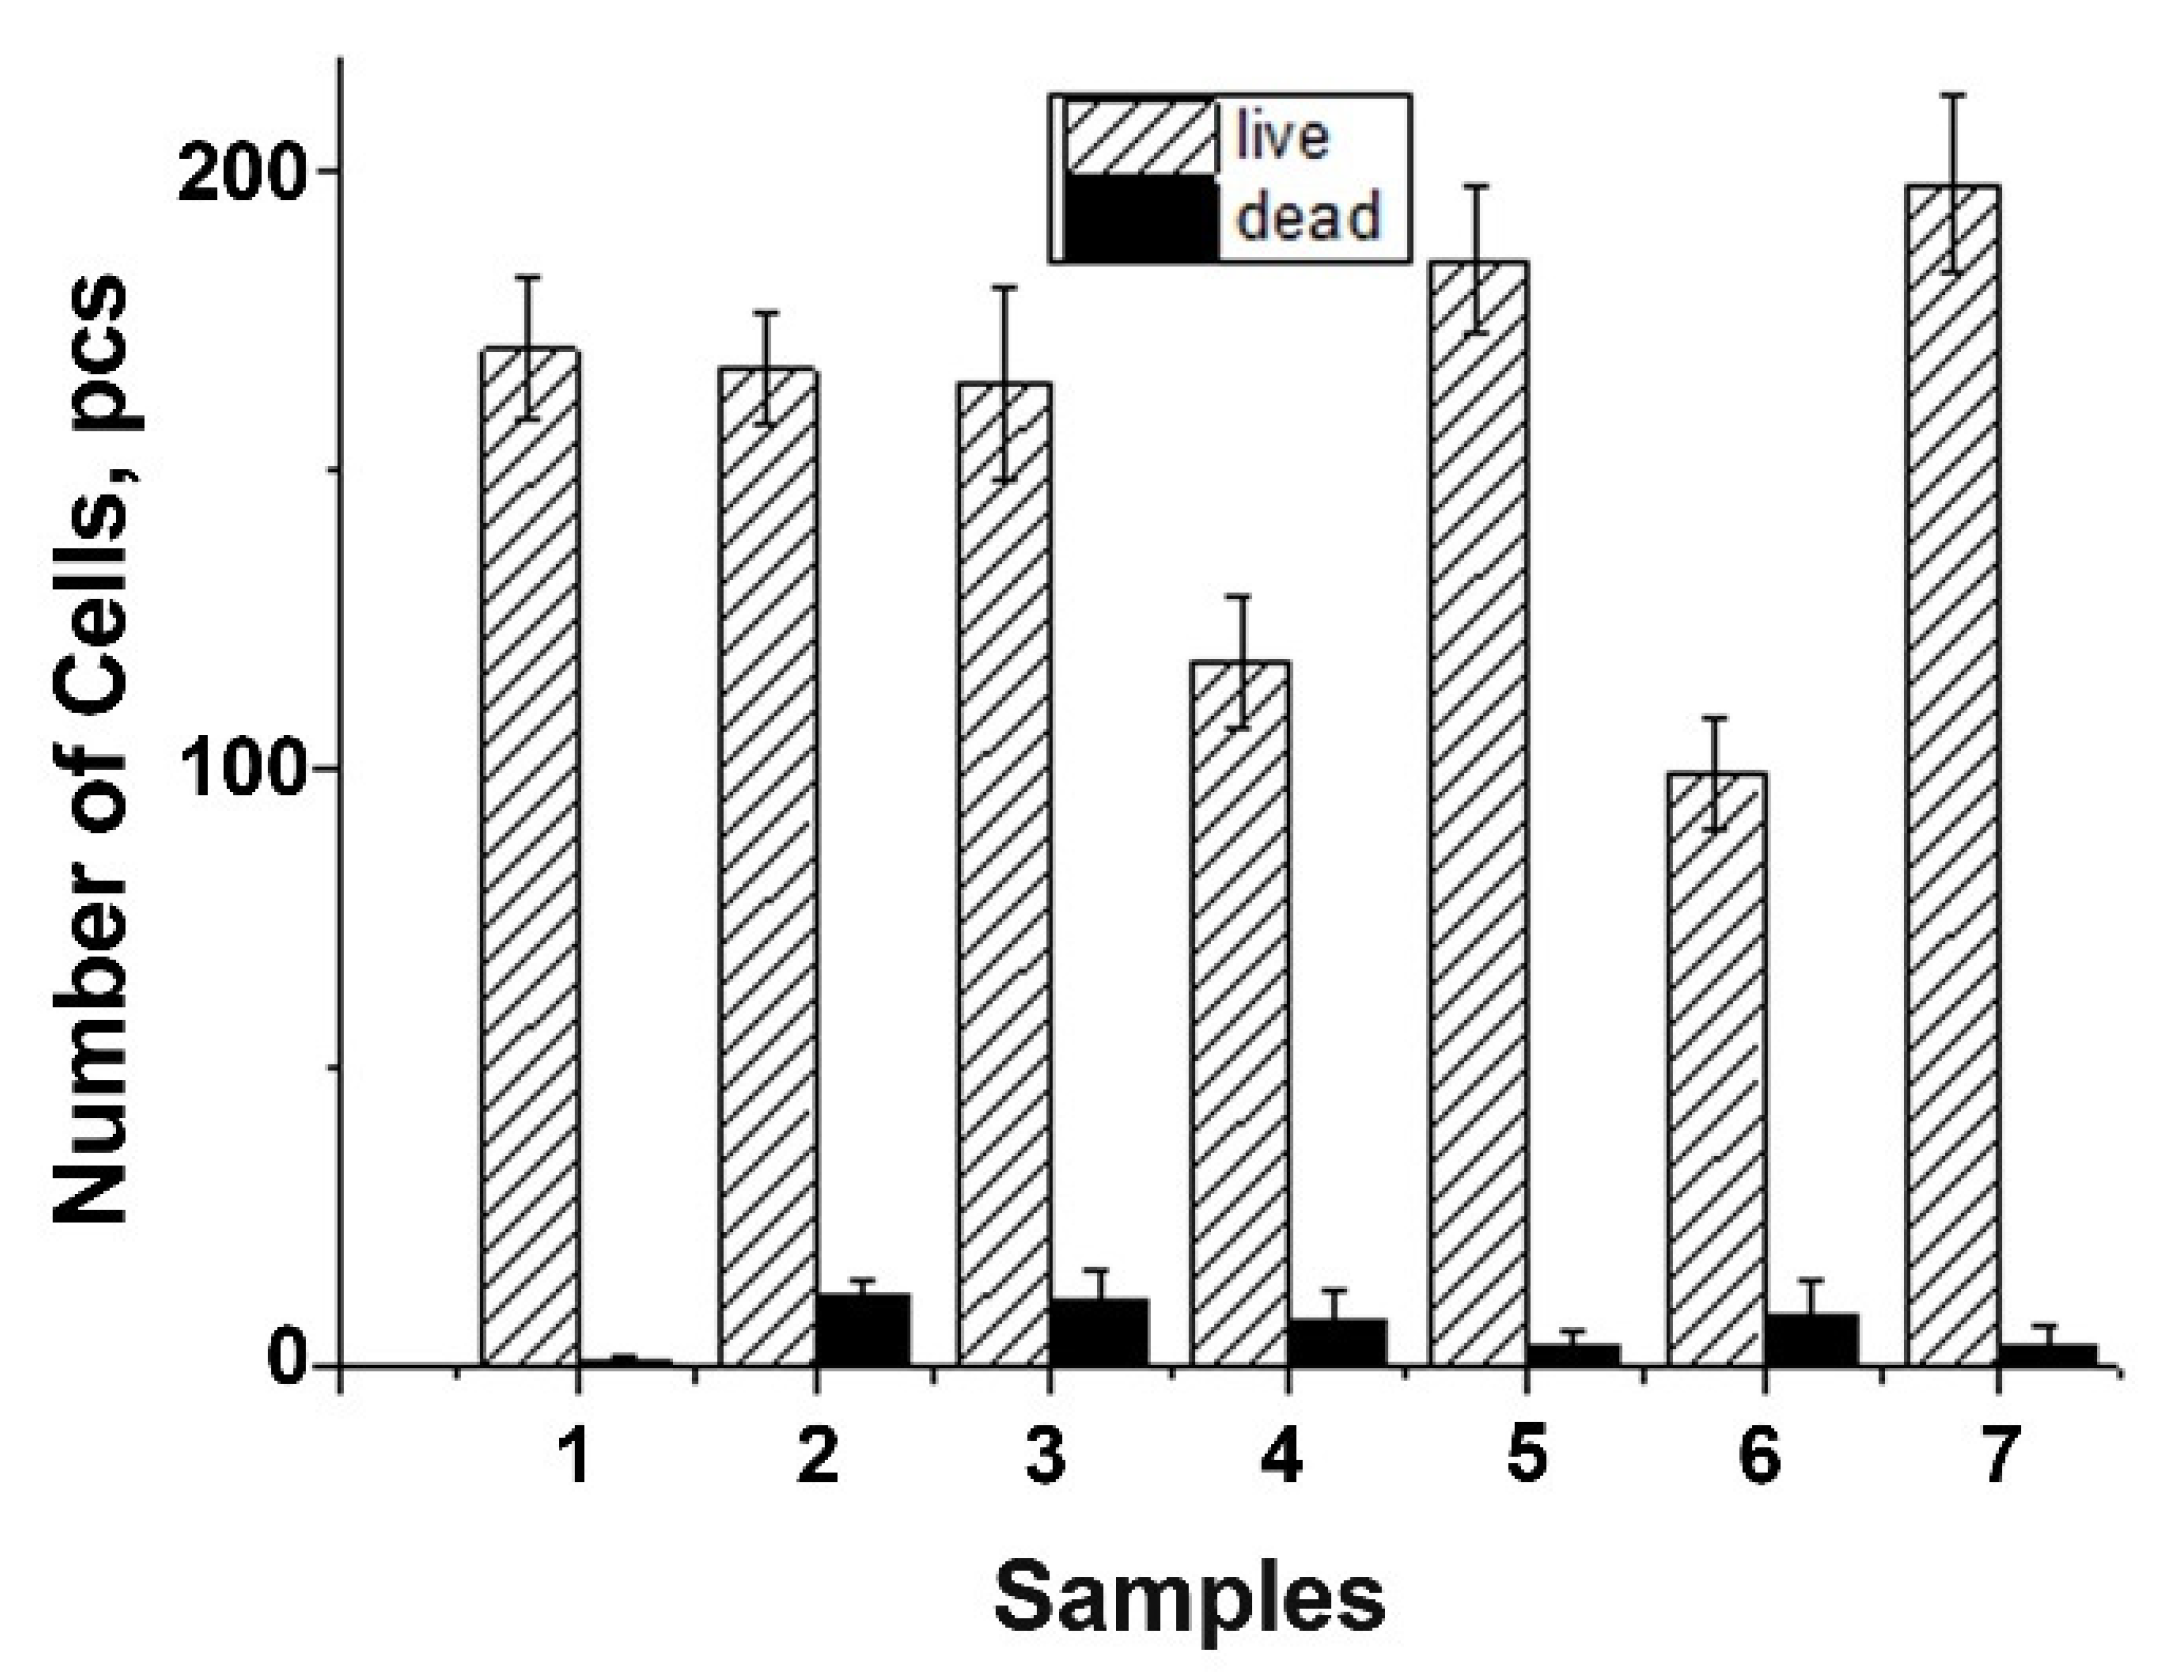
3.9. Metabolic Activity Study
4. Conclusions
Author Contributions
Funding
Institutional Review Board Statement
Informed Consent Statement
Data Availability Statement
Acknowledgments
Conflicts of Interest
Ethics Statement
References
- Ageing and Health. Available online: https://www.who.int/news-room/fact-sheets/detail/ageing-and-health (accessed on 4 October 2021).
- Woolf, A.D.; Pfleger, B. Burden of major musculoskeletal conditions. Bull. World Health Organ. 2003, 81, 646–656. [Google Scholar]
- Ratnayake, J.T.B.; Mucalo, M.; Dias, G.J. Substituted hydroxyapatites for bone regeneration: A review of current trends. J. Biomed. Mater. Res. Part B Appl. Biomater. 2017, 105, 1285–1299. [Google Scholar] [CrossRef] [PubMed]
- Bohner, M.; Santoni, B.L.G.; Döbelin, N. β-tricalcium phosphate for bone substitution: Synthesis and properties. Acta Biomater. 2020, 113, 23–41. [Google Scholar] [CrossRef] [PubMed]
- Wang, W.; Yeung, K.W.K. Bone grafts and biomaterials substitutes for bone defect repair: A review. Bioact. Mater. 2017, 2, 224–247. [Google Scholar] [CrossRef]
- Sohn, H.-S.; Oh, J.-K. Review of bone graft and bone substitutes with an emphasis on fracture surgeries. Biomater. Res. 2019, 23, 9. [Google Scholar] [CrossRef] [PubMed] [Green Version]
- Zyman, Z.; Glushko, V.; Dedukh, N.; Malyshkina, S.; Ashukina, N. Porous calcium phosphate ceramic granules and their behaviour in differently loaded areas of skeleton. J. Mater. Sci. Mater. Med. 2008, 19, 2197–2205. [Google Scholar] [CrossRef]
- Bohner, M. Physical and chemical aspects of calcium phosphates used in spinal surgery. Eur. Spine J. 2001, 10, S114–S121. [Google Scholar] [CrossRef] [Green Version]
- Fadeeva, I.V.; Gafurov, M.R.; Kiiaeva, I.A.; Orlinskii, S.B.; Kuznetsova, L.M.; Filippov, Y.Y.; Fomin, A.S.; Davydova, G.A.; Selezneva, I.I.; Barinov, S.M. Tricalcium Phosphate Ceramics Doped with Silver, Copper, Zinc, and Iron (III) Ions in Concentrations of Less Than 0.5 wt.% for Bone Tissue Regeneration. Bionanoscience 2017, 7, 434–438. [Google Scholar] [CrossRef]
- Laskus, A.; Kolmas, J. Ionic Substitutions in Non-Apatitic Calcium Phosphates. Int. J. Mol. Sci. 2017, 18, 2542. [Google Scholar] [CrossRef] [Green Version]
- Lu, H.; Zhou, Y.; Ma, Y.; Xiao, L.; Ji, W.; Zhang, Y.; Wang, X. Current Application of Beta-Tricalcium Phosphate in Bone Repair and Its Mechanism to Regulate Osteogenesis. Front. Mater. 2021, 8, 277. [Google Scholar] [CrossRef]
- Fadeeva, I.V.; Lazoryak, B.I.; Davidova, G.A.; Murzakhanov, F.F.; Gabbasov, B.F.; Petrakova, N.V.; Fosca, M.; Barinov, S.M.; Vadalà, G.; Uskoković, V.; et al. Antibacterial and cell-friendly copper-substituted tricalcium phosphate ceramics for biomedical implant applications. Mater. Sci. Eng. C 2021, 129, 112410. [Google Scholar] [CrossRef] [PubMed]
- Rau, J.V.; Fadeeva, I.V.; Fomin, A.S.; Barbaro, K.; Galvano, E.; Ryzhov, A.P.; Murzakhanov, F.; Gafurov, M.; Orlinskii, S.; Antoniac, I.; et al. Sic Parvis Magna: Manganese-Substituted Tricalcium Phosphate and Its Biophysical Properties. ACS Biomater. Sci. Eng. 2019, 5, 6632–6644. [Google Scholar] [CrossRef] [PubMed]
- Uskoković, V.; Graziani, V.; Wu, V.M.; Fadeeva, I.V.; Fomin, A.S.; Presniakov, I.A.; Fosca, M.; Ortenzi, M.; Caminiti, R.; Rau, J.V. Gold is for the mistress, silver for the maid: Enhanced mechanical properties, osteoinduction and antibacterial activity due to iron doping of tricalcium phosphate bone cements. Mater. Sci. Eng. C 2019, 94, 798–810. [Google Scholar] [CrossRef]
- Fadeeva, I.V.; Goldberg, M.A.; Preobrazhensky, I.I.; Mamin, G.V.; Davidova, G.A.; Agafonova, N.V.; Fosca, M.; Russo, F.; Barinov, S.M.; Cavalu, S.; et al. Improved cytocompatibility and antibacterial properties of zinc-substituted brushite bone cement based on β-tricalcium phosphate. J. Mater. Sci. Mater. Med. 2021, 32, 99. [Google Scholar] [CrossRef] [PubMed]
- Graziani, G.; Barbaro, K.; Fadeeva, I.V.; Ghezzi, D.; Fosca, M.; Sassoni, E.; Vadalà, G.; Cappelletti, M.; Valle, F.; Baldini, N.; et al. Ionized jet deposition of antimicrobial and stem cell friendly silver-substituted tricalcium phosphate nanocoatings on titanium alloy. Bioact. Mater. 2021, 6, 2629–2642. [Google Scholar] [CrossRef]
- Kannan, S.; Pina, S.; Ferreira, J.M.F. Formation of Strontium-Stabilized β-Tricalcium Phosphate from Calcium-Deficient Apatite. J. Am. Ceram. Soc. 2006, 89, 3277–3280. [Google Scholar] [CrossRef]
- Singh, R.K.; Srivastava, M.; Prasad, N.K.; Awasthi, S.; Dhayalan, A.; Kannan, S. Iron doped β-Tricalcium phosphate: Synthesis, characterization, hyperthermia effect, biocompatibility and mechanical evaluation. Mater. Sci. Eng. C 2017, 78, 715–726. [Google Scholar] [CrossRef]
- De Bonis, A.; Uskoković, V.; Barbaro, K.; Fadeeva, I.; Curcio, M.; Imperatori, L.; Teghil, R.; Rau, J.V. Pulsed laser deposition temperature effects on strontium-substituted hydroxyapatite thin films for biomedical implants. Cell Biol. Toxicol. 2020, 36, 537–551. [Google Scholar] [CrossRef]
- Gu, Y.; Zhang, J.; Zhang, X.; Liang, G.; Xu, T.; Niu, W. Three-dimensional Printed Mg-Doped β-TCP Bone Tissue Engineering Scaffolds: Effects of Magnesium Ion Concentration on Osteogenesis and Angiogenesis In Vitro. Tissue Eng. Regen. Med. 2019, 16, 415–429. [Google Scholar] [CrossRef] [PubMed]
- Wang, Z.; Liu, Q.; Liu, C.; Tan, W.; Tang, M.; Zhou, X.; Sun, T.; Deng, Y. Mg2+ in β-TCP/Mg–Zn composite enhances the differentiation of human bone marrow stromal cells into osteoblasts through MAPK-regulated Runx2/Osx. J. Cell. Physiol. 2020, 235, 5182–5191. [Google Scholar] [CrossRef]
- Kalidoss, M.; Yunus Basha, R.; Doble, M.; Sampath Kumar, T.S. Theranostic Calcium Phosphate Nanoparticles With Potential for Multimodal Imaging and Drug Delivery. Front. Bioeng. Biotechnol. 2019, 7, 7. [Google Scholar] [CrossRef]
- Qi, C.; Lin, J.; Fu, L.-H.; Huang, P. Calcium-based biomaterials for diagnosis, treatment, and theranostics. Chem. Soc. Rev. 2018, 47, 357–403. [Google Scholar] [CrossRef]
- Ashokan, A.; Gowd, G.S.; Somasundaram, V.H.; Bhupathi, A.; Peethambaran, R.; Unni, A.K.K.; Palaniswamy, S.; Nair, S.V.; Koyakutty, M. Multifunctional calcium phosphate nano-contrast agent for combined nuclear, magnetic and near-infrared in vivo imaging. Biomaterials 2013, 34, 7143–7157. [Google Scholar] [CrossRef]
- Liu, Y.; Sun, Y.; Cao, C.; Yang, Y.; Wu, Y.; Ju, D.; Li, F. Long-term biodistribution in vivo and toxicity of radioactive/magnetic hydroxyapatite nanorods. Biomaterials 2014, 35, 3348–3355. [Google Scholar] [CrossRef]
- Wang, P.; Hao, L.; Wang, Z.; Wang, Y.; Guo, M.; Zhang, P. Gadolinium-Doped BTO-Functionalized Nanocomposites with Enhanced MRI and X-ray Dual Imaging to Simulate the Electrical Properties of Bone. ACS Appl. Mater. Interfaces 2020, 12, 49464–49479. [Google Scholar] [CrossRef]
- Meenambal, R.; Poojar, P.; Geethanath, S.; Kannan, S. Substitutional limit of gadolinium in β-tricalcium phosphate and its magnetic resonance imaging characteristics. J. Biomed. Mater. Res. Part B Appl. Biomater. 2017, 105, 2545–2552. [Google Scholar] [CrossRef]
- Zhu, G.; Zhao, R.; Li, Y.; Tang, R. Multifunctional Gd,Ce,Tb co-doped β-tricalcium phosphate porous nanospheres for sustained drug release and bioimaging. J. Mater. Chem. B 2016, 4, 3903–3910. [Google Scholar] [CrossRef]
- Bulina, N.V.; Chaikina, M.V.; Prosanov, I.Y.; Dudina, D.V. Strontium and silicate co-substituted hydroxyapatite: Mechanochemical synthesis and structural characterization. Mater. Sci. Eng. B 2020, 262, 114719. [Google Scholar] [CrossRef]
- Le Bail, A.; Duroy, H.; Fourquet, J.L. Ab-initio structure determination of LiSbWO6 by X-ray powder diffraction. Mater. Res. Bull. 1988, 23, 447–452. [Google Scholar] [CrossRef]
- Petricek, V.; Dusek, M.; Palatinus, L.; Petrícek, V.; Dušek, M.; Palatinus, L. Crystallographic computing system JANA2006: General features. Z. Für Krist. 2014, 229, 345–352. [Google Scholar] [CrossRef]
- Yashima, M.; Sakai, A.; Kamiyama, T.; Hoshikawa, A. Crystal structure analysis of β-tricalcium phosphate Ca3(PO4)2 by neutron powder diffraction. J. Solid State Chem. 2003, 175, 272–277. [Google Scholar] [CrossRef]
- Ruszala, F.; Kostiner, E. Preparation and characterization of single crystals in the apatite system Ca10(PO4)6(Cl,OH)2. J. Cryst. Growth 1975, 30, 93–95. [Google Scholar] [CrossRef]
- Boudin, S.; Grandin, A.; Borel, M.M.; Leclaire, A.; Raveau, B. Redetermination of the β-Ca2P2O7 structure. Acta Crystallogr. Sect. C Cryst. Struct. Commun. 1993, 49, 2062–2064. [Google Scholar] [CrossRef]
- Poltavtseva, R.A.; Nikonova, Y.A.; Selezneva, I.I.; Yaroslavtseva, A.K.; Stepanenko, V.N.; Esipov, R.S.; Pavlovich, S.V.; Klimantsev, I.V.; Tyutyunnik, N.V.; Grebennik, T.K.; et al. Mesenchymal Stem Cells from Human Dental Pulp: Isolation, Characteristics, and Potencies of Targeted Differentiation. Bull. Exp. Biol. Med. 2014, 158, 164–169. [Google Scholar] [CrossRef]
- Savchyn, P.; Karbovnyk, I.; Vistovskyy, V.; Voloshinovskii, A.; Pankratov, V.; Cestelli Guidi, M.; Mirri, C.; Myahkota, O.; Riabtseva, A.; Mitina, N.; et al. Vibrational properties of LaPO4 nanoparticles in mid- and far-infrared domain. J. Appl. Phys. 2012, 112, 124309. [Google Scholar] [CrossRef]
- Shannon, R.D. Revised effective ionic radii and systematic studies of interatomic distances in halides and chalcogenides. Acta Crystallogr. Sect. A 1976, 32, 751–767. [Google Scholar] [CrossRef]
- Bessière, A.; Aı¨t, R.; Benhamou, A.; Wallez, G.; Lecointre, A.; Viana, B. Site occupancy and mechanisms of thermally stimulated luminescence in Ca9Ln(PO4)7 (Ln = lanthanide). Acta Mater. 2012, 60, 6641–6649. [Google Scholar] [CrossRef]
- Lazoriak, B.I.; Golubev, V.N.; Salmon, R.; Parent, C.; Hagenmuller, P. Distribution of Eu3+ ions in whitlockite-type Ca3-xEu2x/3(PO4)2 orthophosphates. Eur. J. Solid State Inorg. Chem. 1989, 26, 455–463. [Google Scholar]
- Demirel, B.; Saban, E.; Yaras, A.; Akkurt, F. Synthesis of Gd+3 doped hydroxyapatite ceramics: Optical, thermal and electrical properties. J. Asian Ceram. Soc. 2021, 9, 865–873. [Google Scholar] [CrossRef]
- Kim, J.Y.; Fenton, R.R.; Hunter, B.A.; Kennedy, B.J. Powder diffraction studies of synthetic calcium and lead apatites. Aust. J. Chem. 2000, 53, 679–686. [Google Scholar] [CrossRef]
- Gomes, S.; Nedelec, J.-M.; Jallot, E.; Sheptyakov, D.; Renaudin, G. Unexpected Mechanism of Zn2+ Insertion in Calcium Phosphate Bioceramics. Chem. Mater. 2011, 23, 3072–3085. [Google Scholar] [CrossRef]
- Paterlini, V.; Bettinelli, M.; Rizzi, R.; El Khouri, A.; Rossi, M.; Della Ventura, G.; Capitelli, F. Characterization and Luminescence of Eu3+- and Gd3+-Doped Hydroxyapatite Ca10(PO4)6(OH)2. Crystals 2020, 10, 806. [Google Scholar] [CrossRef]
- Ignjatović, N.L.; Mančić, L.; Vuković, M.; Stojanović, Z.; Nikolić, M.G.; Škapin, S.; Jovanović, S.; Veselinović, L.; Uskoković, V.; Lazić, S.; et al. Rare-earth (Gd3+,Yb3+/Tm3+, Eu3+) co-doped hydroxyapatite as magnetic, up-conversion and down-conversion materials for multimodal imaging. Sci. Rep. 2019, 9, 16305. [Google Scholar] [CrossRef]
- Clayton, J.A.; Keller, K.; Qi, M.; Wegner, J.; Koch, V.; Hintz, H.; Godt, A.; Han, S.; Jeschke, G.; Sherwin, M.S.; et al. Quantitative analysis of zero-field splitting parameter distributions in Gd(III) complexes. Phys. Chem. Chem. Phys. 2018, 20, 10470–10492. [Google Scholar] [CrossRef] [PubMed]
- Nakashima, K.; Yamauchi, J. Magnetic properties of gadolinium-doped β-tricalcium phosphate. J. Alloy. Compd. 2006, 408–412, 761–765. [Google Scholar] [CrossRef]
- Maron, S.; Dantelle, G.; Gacoin, T.; Devreux, F. NMR and ESR relaxation in Nd- and Gd-doped LaPO4: Towards the accurate determination of the doping concentration. Phys. Chem. Chem. Phys. 2014, 16, 18788–18798. [Google Scholar] [CrossRef]
- Barinov, S.M. Calcium phosphate-based ceramic and composite materials for medicine. Russ. Chem. Rev. 2010, 79, 13–29. [Google Scholar] [CrossRef]


| Assignment | Wavenumber, cm–1 | Vibration Mode | Sample |
|---|---|---|---|
| OH–(Cl−) | 3644, 3544 | Valence | (4); weak: (3) |
| PO43– | 973 | ν1 | (1), (2), (3), (4) |
| PO43– | 493, 432 | ν2 | (1), (2); weak: (3) (4) |
| PO43– | 1123, 1044 | ν3 | (1), (2), (3), (4) |
| PO43– | 607, 574, 556 | ν4 | (1), (2), (3), (4) |
| P2O74– | 1212, 727 | Valence P-O-P | (1), (2); weak: (3), (4) |
| CO32– | 1490 | ν3 | (1), (2), (3), (4) |
| CO32– | 875 | ν2 | (1), (2), (3), (4) |
| Sample | Temperature, °C | Thermal Effect Type | Mass Loss, wt% | Mass Loss Corresponds to |
|---|---|---|---|---|
| 0.1Gd-TCP-pc | 80 | endothermic | 5 | physically adsorbed H2O |
| 250 | endothermic | 45 | chemically coordinated H2O | |
| 0.1Gd-TCP-ma | 110–250 | endothermic | 20 | two-stage H2O elimination |
| N | Sample | Surface Area, m2/g |
|---|---|---|
| 1 | TCP-pc | 77.07 ± 0.09 |
| 2 | 0.01Gd-TCP-pc | 72.49 ± 0.07 |
| 3 | 0.1Gd-TCP-pc | 66.41 ± 0.13 |
| 4 | TCP-ma | 30.09 ± 0.01 |
| 5 | 0.01Gd-TCP-ma | 35.88 ± 0.04 |
| 6 | 0.1Gd-TCP-ma | 32.73 ± 0.03 |
| Grain Size, μm | 0.1Gd-TCP-pc | 0.1Gd-TCP-ma |
|---|---|---|
| minimal | 1.2 | 0.4 |
| maximal | 49.1 | 1.4 |
| median | 2.2 | 0.8 |
| C. albicans | ||||
| OD600 | SD | % Growth | % Inhibition | |
| ctr + (control sample) | 0.711 | 0.008 | 100 | 0 |
| 0.1Gd-TCP-pc | 0.495 | 0.020 | 69.7 | 30.3 |
| 0.1Gd-TCP-ma | 0.519 | 0.007 | 73.1 | 26.9 |
| E. coli | ||||
| OD600 | SD | % Growth | % Inhibition | |
| ctr + (control sample) | 0.845 | 0.025 | 100 | 0 |
| 0.1Gd-TCP-pc | 0.638 | 0.054 | 75.5 | 24.5 |
| 0.1Gd-TCP-ma | 0.741 | 0.015 | 87.8 | 12.2 |
| E. faecalis | ||||
| OD600 | SD | % Growth | % Inhibition | |
| ctr + (control sample) | 0.570 | 0.021 | 100 | 0 |
| 0.1Gd-TCP-pc | 0.443 | 0.011 | 77.8 | 22.2 |
| 0.1Gd-TCP-ma | 0.445 | 0.032 | 78.1 | 21.9 |
| S. aureus | ||||
| OD600 | SD | % Growth | % Inhibition | |
| ctr + (control sample) | 0.951 | 0.021 | 100 | 0. |
| 0.1Gd-TCP-pc | 0.723 | 0.072 | 76.1 | 23.9 |
| 0.1Gd-TCP-ma | 0.744 | 0.016 | 78.3 | 21.7 |
| S. typhimurium | ||||
| OD600 | SD | % Growth | % Inhibition | |
| ctr + (control sample) | 0.906 | 0.076 | 100 | 0 |
| 0.1Gd-TCP-pc | 0.634 | 0.040 | 70.0 | 30.0 |
| 0.1Gd-TCP-ma | 0.648 | 0.043 | 71.6 | 28.4 |
Publisher’s Note: MDPI stays neutral with regard to jurisdictional claims in published maps and institutional affiliations. |
© 2022 by the authors. Licensee MDPI, Basel, Switzerland. This article is an open access article distributed under the terms and conditions of the Creative Commons Attribution (CC BY) license (https://creativecommons.org/licenses/by/4.0/).
Share and Cite
Fadeeva, I.V.; Deyneko, D.V.; Barbaro, K.; Davydova, G.A.; Sadovnikova, M.A.; Murzakhanov, F.F.; Fomin, A.S.; Yankova, V.G.; Antoniac, I.V.; Barinov, S.M.; et al. Influence of Synthesis Conditions on Gadolinium-Substituted Tricalcium Phosphate Ceramics and Its Physicochemical, Biological, and Antibacterial Properties. Nanomaterials 2022, 12, 852. https://doi.org/10.3390/nano12050852
Fadeeva IV, Deyneko DV, Barbaro K, Davydova GA, Sadovnikova MA, Murzakhanov FF, Fomin AS, Yankova VG, Antoniac IV, Barinov SM, et al. Influence of Synthesis Conditions on Gadolinium-Substituted Tricalcium Phosphate Ceramics and Its Physicochemical, Biological, and Antibacterial Properties. Nanomaterials. 2022; 12(5):852. https://doi.org/10.3390/nano12050852
Chicago/Turabian StyleFadeeva, Inna V., Dina V. Deyneko, Katia Barbaro, Galina A. Davydova, Margarita A. Sadovnikova, Fadis F. Murzakhanov, Alexander S. Fomin, Viktoriya G. Yankova, Iulian V. Antoniac, Sergey M. Barinov, and et al. 2022. "Influence of Synthesis Conditions on Gadolinium-Substituted Tricalcium Phosphate Ceramics and Its Physicochemical, Biological, and Antibacterial Properties" Nanomaterials 12, no. 5: 852. https://doi.org/10.3390/nano12050852