Article

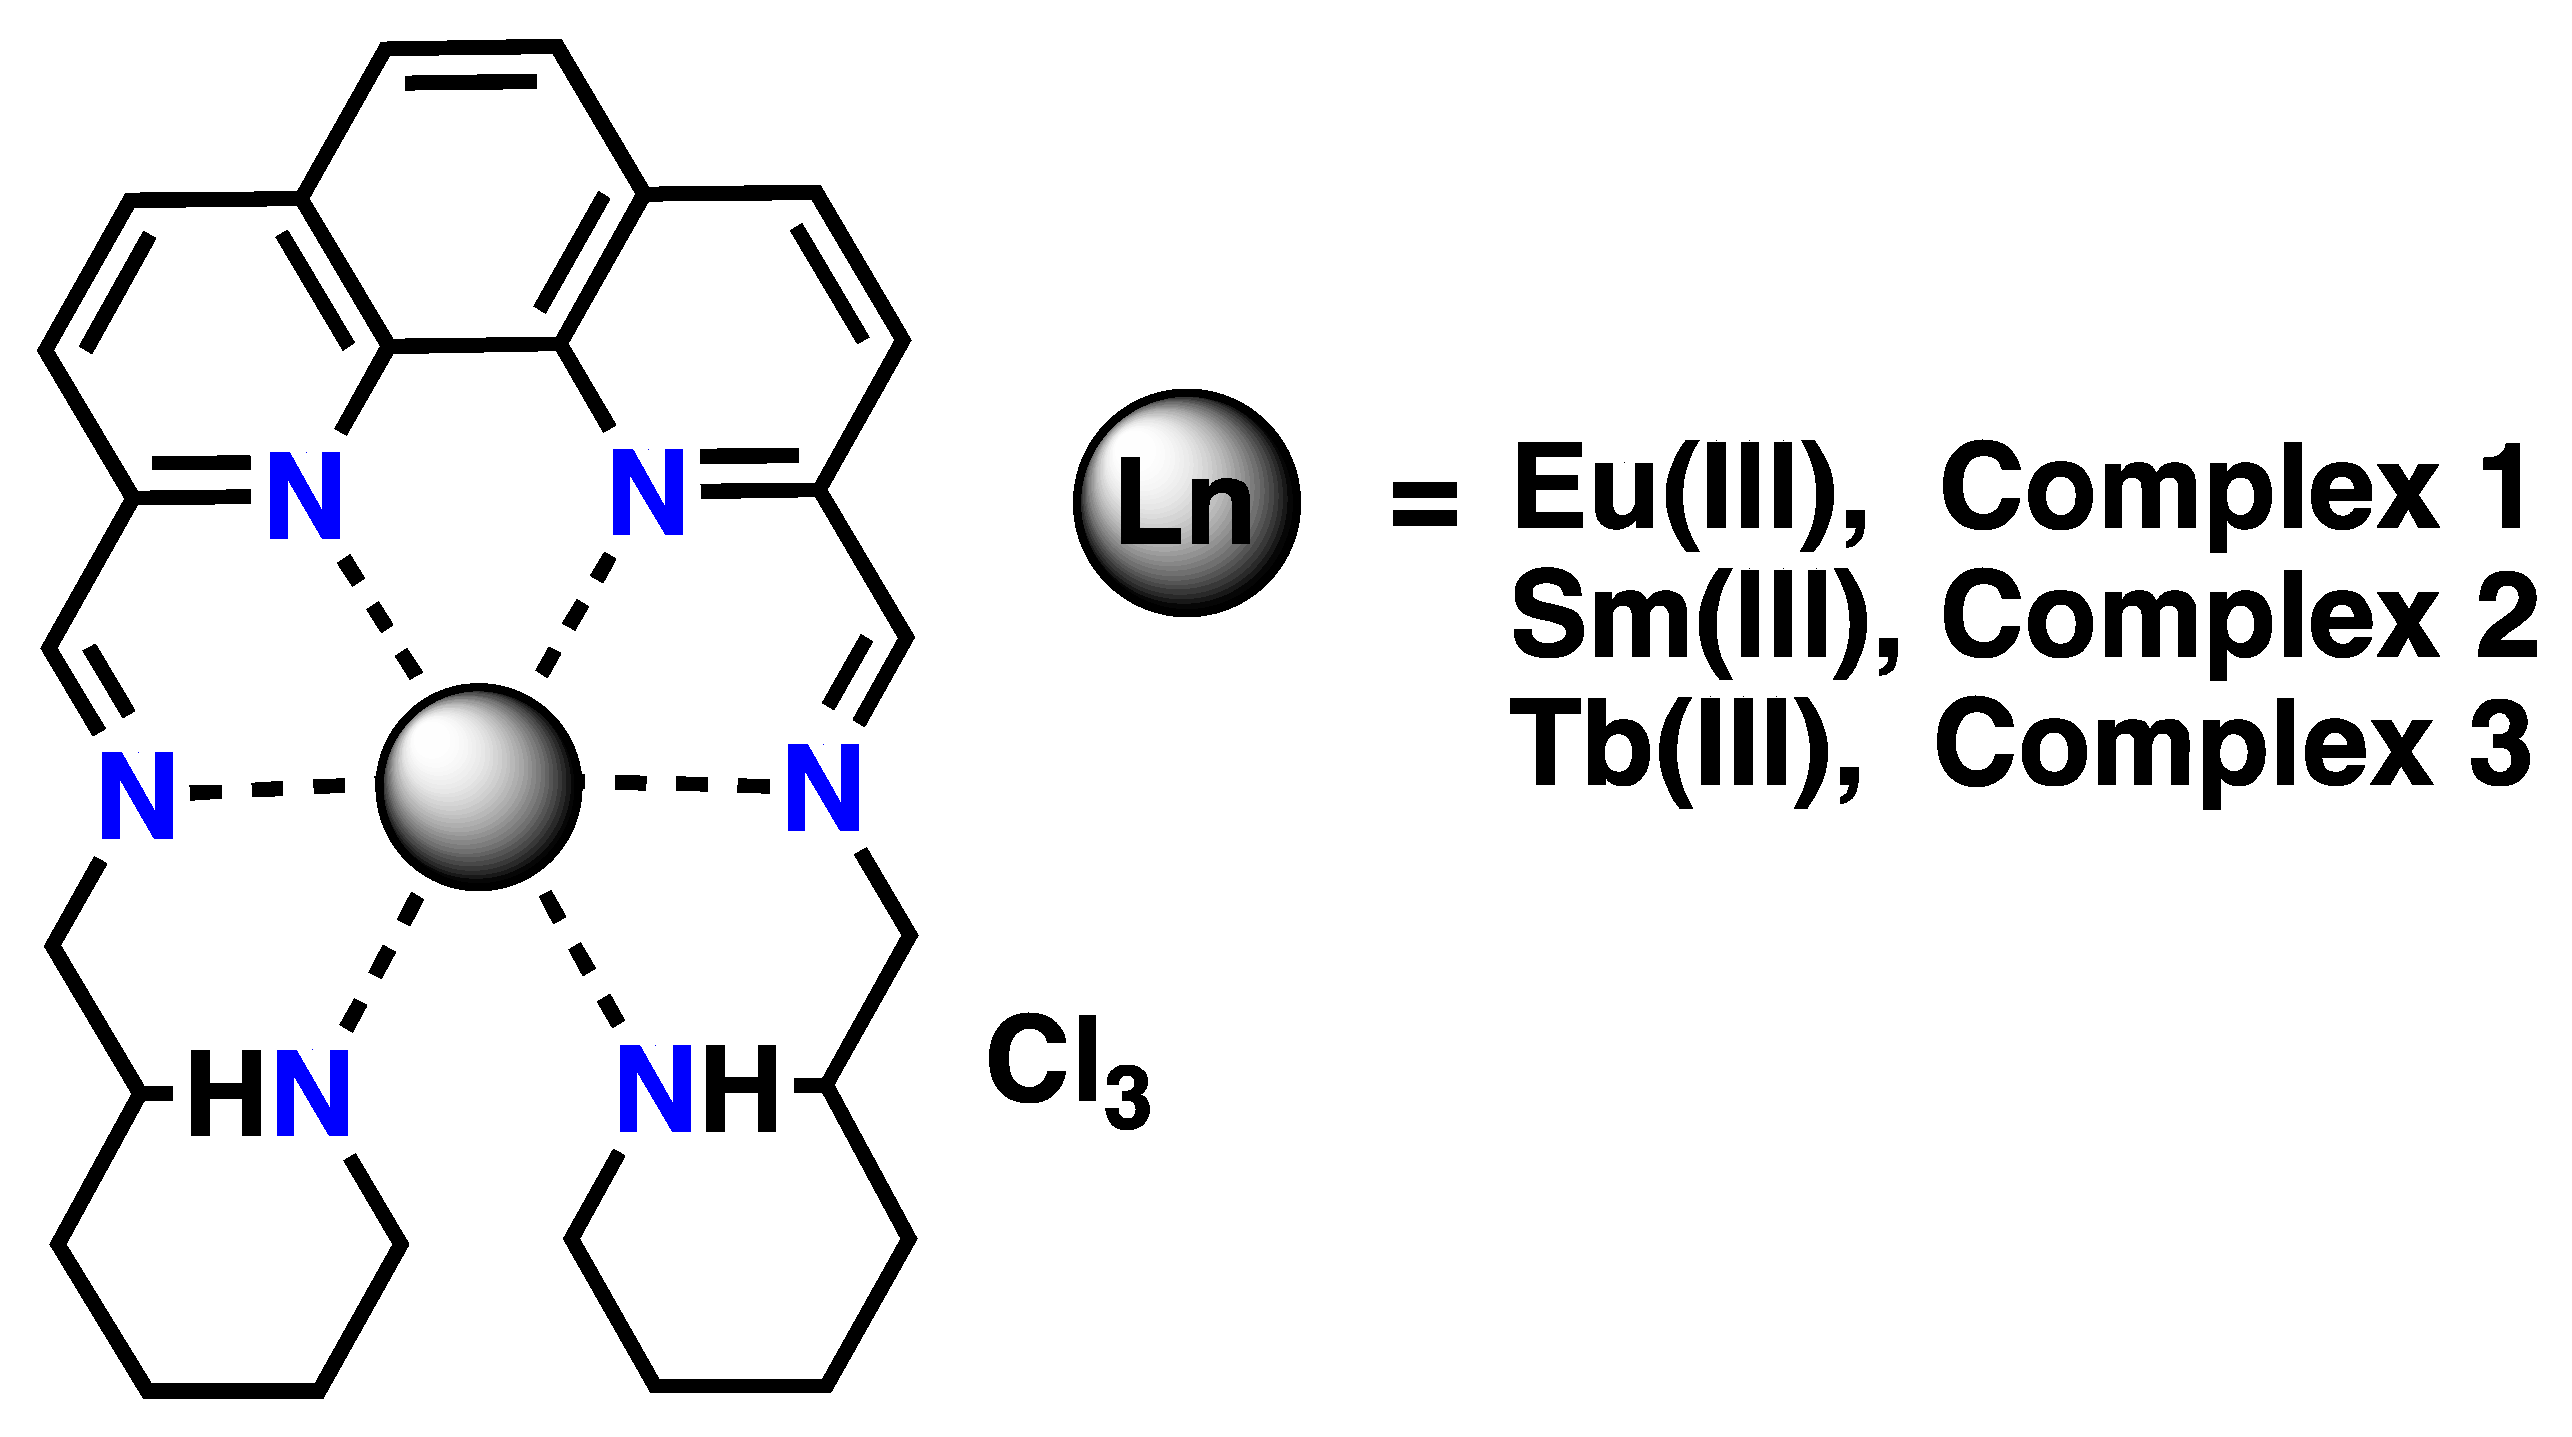
Mechanistic Insight of Sensing Hydrogen Phosphate in Aqueous Medium by Using Lanthanide(III)-Based Luminescent Probes

by
Jashobanta Sahoo
1,2,3,
Santlal Jaiswar
4,
Pabitra B. Chatterjee
2,5,
Palani S. Subramanian
1,2,* and
Himanshu Sekhar Jena
6,*
1
Inorganic Materials and Catalysis Division, Central Salt and Marine Chemicals Research Institute (CSIR-CSMCRI), Bhavnagar, Gujarat 364 002, India
2
Academy of Scientific and Innovative Research (AcSIR), CSIR-CSMCRI, Bhavnagar, Gujarat 364 002, India
3
Department of Chemistry, Hindol College, Khajuriakata, Higher Education Department, State Government of Odisha, Bhubaneswar, Odisha 751001, India
4
Discipline of Marine Biotechnology and Ecology, CSIR-CSMCRI, Bhavnagar, Gujarat 364 002, India
5
Analytical Discipline and Centralized Instrument Facility, CSIR-CSMCRI, Bhavnagar, Gujarat 364 002, India
6
Department of Chemistry, Ghent University, Krijgslaan 281-S3 B, 9000 Ghent, Belgium
*
Authors to whom correspondence should be addressed.
Nanomaterials 2021, 11(1), 53; https://doi.org/10.3390/nano11010053
Submission received: 26 October 2020 / Revised: 17 December 2020 / Accepted: 23 December 2020 / Published: 28 December 2020

Abstract

:
The development of synthetic lanthanide luminescent probes for selective sensing or binding anions in aqueous medium requires an understanding of how these anions interact with synthetic lanthanide probes. Synthetic lanthanide probes designed to differentiate anions in aqueous medium could underpin exciting new sensing tools for biomedical research and drug discovery. In this direction, we present three mononuclear lanthanide-based complexes, EuLCl3 (1), SmLCl3 (2), and TbLCl3 (3), incorporating a hexadentate aminomethylpiperidine-based nitrogen-rich heterocyclic ligand L for sensing anion and establishing mechanistic insight on their binding activities in aqueous medium. All these complexes are meticulously studied for their preferential selectivities towards different anions such as HPO42−, SO42−, CH3COO, I, Br, Cl, F, NO3, CO32−/HCO3, and HSO4 at pH 7.4 in aqueous HEPES (2-[4-(2-hydroxyethyl)piperazin-1-yl]ethanesulfonic acid) buffer. Among the anions scanned, HPO42− showed an excellent luminescence change with all three complexes. Job’s plot and ESI-MS support the 1:2 association between the receptors and HPO42−. Systematic spectrophotometric titrations of 13 against HPO42− demonstrates that the emission intensities of 1 and 2 were enhanced slightly upon the addition of HPO42− in the range 0.01–1 equiv and 0.01–2 equiv., respectively. Among the three complexes, complex 3 showed a steady quenching of luminescence throughout the titration of hydrogen phosphate. The lower and higher detection limits of HPO42− by complexes 1 and 2 were determined as 0.1–4 mM and 0.4–3.2 mM, respectively, while complex 3 covered 0.2–100 μM. This concludes that all complexes demonstrated a high degree of sensitivity and selectivity towards HPO42−.

1. Introduction

Inorganic phosphates, the charged anions of phosphoric acid such as [H2PO4], [HPO4]2−, and [PO4]3−, are essential components during the synthesis of DNA/RNA and phospholipid membrane [1]. Further, their influence in the metabolic process in human, plant, and animal cells are inevitable. Sensing of phosphate draws special attention [2,3,4,5,6,7,8,9,10,11,12,13] due to its biological role as polyphosphate, and hyper- and hypophosphatemia in Chronic Kidney Disease (CKD) patients [14]; energy source through dephosphorylation [15] of ATP, ADP, AMP, and PPi; and reverse polycondensation to form polyphosphates. Various methods were developed for the determination of phosphates in fertilizers, plants, natural waters, and other environmental samples [16,17,18]. Generally, serum phosphates are measured based on a photometric approach using ammonium phosphate, which forms a chromogenic complex with inorganic phosphates (Pi) [19]. However, the search for new receptors with selective response to phosphates remains active behind many challenges. Moreover, with phosphates being important bioanlytes [20,21,22,23,24,25,26,27,28,29], varieties of colorimetric sensors [30,31,32,33,34,35] and fluorosensors [36,37,38] were reported for their detection. Among these, luminescent lanthanide [20] complexes gained significant attention due to their potential applications in clinical diagnosis, biomarkers [39,40], MRI contrast agents [41,42,43,44,45,46,47], screening of drugs, etc. Parker et al. reported Eu(III) and Tb(III) tetra-azaphenylene complexes for the detection of phosphates in live cells [48,49]. It is important to note that the concentrations of phosphate vary significantly in inter- and intracellular environments of human cells, ranging from 0.15 to 1.3 mM [50,51,52]. Among the various lanthanide complexes reported so far in the literature, Eu-Tc [53,54] was recognized as an efficient probe for phosphates due to its lower detection limit (LOD = 3 μmolL−1). Moreover, there are many intracellular processes, where the concentrations of phosphate vary among different subcellular compartments present therein [55]. Therefore, a highly sensitive and selective probe which can detect phosphate at a considerably low concentration is very much required to investigate such intracellular processes. In this context, recently, we have reported a set of europium(III) and terbium(III) complexes, incorporating different hexadentate ligands which showed highly selective and efficient recognition of inorganic phosphates and nucleoside phosphates [56,57]. In this direction and as a part of our ongoing research, herein, we report a series of relatively simple, cheap, and water-soluble Ln(III) complexes 1, 2, and 3 (Scheme 1) (Ln = Eu, Sm, and Tb, respectively) using an aminomethylpiperidine-functionalized 1,10-phenanthrolene-based nitrogenous heterocyclic ligand L as the metal chelator. The anion-sensing ability of these hydrophilic rare-earth complexes (13) was explored and found high selectivity and sensitivity for hydrogen phosphate ions in HEPES (2-[4-(2-hydroxyethyl)piperazin-1-yl]ethanesulfonic acid) buffer at pH 7.4. Moreover, a mechanistic insight into the anion binding behavior of complex 1 was also explored in this work.

2. Results and Discussion

Schiff base ligand L was obtained by condensing 2,9-dialdehyde 1,10-phenanthroline and 2-(aminomethyl) piperidine. The characteristic azomethine peak at 8.25δ in 1H NMR (Figure S1) and 13C (Figure S2), DEPT 135° NMR (Figure S3) in combination with MS spectrum (Figure S4), CD spectrum (Figure S5) and IR spectra (Figure S6), confirms the formation of L. Treating L with the respective LnCl3 salt, the corresponding complexes EuLCl3(1), TbLCl3(2), and SmLCl3(3) were isolated as per the procedure. The formulation of each complex was confirmed from the ESI-MS analysis (Figure S7–S9). The emission spectra of these complexes were studied at 25 °C in aqueous HEPES buffer at pH 7.4 (Figure S10). All the complexes showed a significant red-shift of the emission spectra with respect to the emission profile of the free ligand L. Being luminescent in nature, we sought to investigate the excited state photophysical properties of 13 in the presence of various important anions. Complexes 1 and 3 showed characteristic luminescent bands at 614 nm and 545 nm, respectively, while complex 2 displayed two sensitive bands at 595 and 644 nm attributable for their metal centered emission. Although water functions as a luminescence quencher [58], all these complexes showed an intense luminescence in aqueous HEPES buffer at physiological pH at 25 °C. The effects of the addition of a range of anions such as hydrogen phosphate, sulfate, acetate, iodide, bromide, chloride, fluoride, nitrate, carbonate/bicarbonate, and bisulfate on the emission spectra of 13 is showed in Figure 1a–c. The bar diagrams, as insets in Figure 1a,c, show the changes in emission intensities of the hypersensitive peaks at 614 and 545 nm of complexes 1 and 3, while Figure 1b depicts the changes in the ratio of the 644/595 nm hypersensitive peaks of complex 2 with the addition of various anions.
Among the anions scanned, complex 1 illustrated a significant emission change with hydrogen phosphate and bicarbonate ions. While the addition of HCO3 showed 14.7% luminescence enhancement, phosphate in contrast leads to luminescence quenching by 29% of the emission intensity of 1 (Figure 1a). In Figure S11, the emission spectra of 1 against varying concentrations of phosphates (0–400 equiv.) are shown. The emission intensity was found to increase (2.6-fold) initially in the range 0.01–1 equiv. of HPO42− (Figure 2a).
Upon further addition of HPO42− to the reaction mixture, a gradual decrease in the luminescence, at 614 nm, of receptor 1 was observed (Figure 2a). The changes in the luminescence intensities, as displayed in Figure 2a, can be attributed to the two distinct behaviours of 1 against HPO42−. Therefore, the spectrometric titration (Figure S11) has offered two association constants. Figure 2a also displayed that the luminescence intensity of the emission maximum decreased to a constant level after the addition of 4 mM of phosphate. Therefore, it is evident from Figure 2a that 1 can be used to sense a wide range of phosphate concentrations. The analytical limit of detection (LOD) [59,60,61,62] of 1 for phosphate was calculated as 0.1 μM. Since the sensing of hydrogen phosphate showed nonlinear fitting in Figure 2b,c with one enhanced and the other quenching the luminescence intensity, we applied the nonlinear fit data point results by following Equations (1) and (2), [63,64,65,66] respectively, providing the binding constants K1 = 2.0 × 10⁴ M−1 (R = 0.9869), 1st part, attributable to luminescence enhancement and K2 = 0.94 × 10⁴ M−1 (R = 0.9875), 2nd part, associated to luminescence quenching.
F = F 0 + F m a x F 0 2 + { ( 1 + [ M ] C L + 1 C L K ) ( 1 + [ M ] C L + 1 C L K ) 2 4 [ M ] C L } }
F = F m a x + F 0 F m a x 2 + { ( 1 + [ M ] C L + 1 C L K ) ( 1 + [ M ] C L + 1 C L K ) 2 4 [ M ] C L } }
where F0 is the luminescence intensity in the absence of hydrogen phosphate and Fmax is the luminescent intensity in the presence of HPO42−, and CL and K are the concentration and binding constant of the complex, respectively. To find the association stoichiometry between complex 1 and HPO42−, Job’s plot was performed (Figure 2d), which established 1:2 binding stoichiometry, i.e., [1:HPO42− = 1:2]. Further, a final confirmation regarding the abovementioned 1:2 stoichiometry was provided by ESI-MS (Figure S12), where a peak at m/z = 855.23 with 100% abundance was attributed to [EuL(HPO4)2(H2O) + 2Na+]·H2O (calcd. m/z = 855.11).
Unlike hydrogen phosphate, HCO3 showed little enhancement in the emission of 1 (Figure 1a). The binding constant (K) was determined to be 1.2 × 10³ M−1 from the spectrometric titrations of 1 against increasing concentrations of HCO3 (10 to 600 equiv.), as shown in Figure S13. Luminescence enhancement of 1, observed in the addition of HCO3, may occur due to chelate formation between the bicarbonate ion and europium (III) center by replacing the weakly bound inner sphere water molecules [67]. In Figure 1b, the luminescence response of 2 towards different anions is displayed. Among the four emission bands observed for 2, the peaks at 595 nm (5G5/26H7/2) and 644 nm (5G5/26H9/2) were found to be hypersensitive [68,69,70].
Spectrophotometric titrations of 2 (Figure S14 and Figure 3a) against varying amounts of HPO42− ranging from 0.01 to 800 equiv. illustrated similar patterns as observed earlier in case of 1. Interestingly, the initial luminescent enhancement of 2 was found up to 18 equiv. of phosphate addition and further increases in phosphate concentrations quench the luminescence of the resulting solution. Applying nonlinear fitting of the data points (Figure 3b,c), the respective binding constants (K1 and K2) were calculated to be 2.1 × 10⁴ M−1 (R = 0.9828), 1st part of luminescence enhancement and 2.9 × 10³ M−1 (R = 0.9858), 2nd part of luminescence quenching. The LOD was calculated to be 0.4 μM, a little higher than that observed for 1. To derive the complex 2 to phosphate ratio, Job’s plot was performed, which clearly indicated 1:2 stoichiometry (Figure 3d). The respective positive ion ESI-MS (Figure S15) also confirmed the proposed 1:2 composition by depicting a molecular ion peak at m/z = 862.27 attributable to the formation of [Sm(L-2H)(HPO4)2 + 4Na+] (calcd. m/z = 862.05).
Screening complex 3 towards various anions (10 equiv.), shown in Figure 1c, illustrates again an excellent luminescent probe for HPO42− with superior selectivity and sensitivity. Upon the addition of HPO42−, the emission intensity of 3 was reduced to 8%. Systematic spectrophotometric titration with an increasing concentration of hydrogen phosphate ions in the range 0.01–5 equiv. was performed (Figure 4a and Figure S16). Unlike, 1 and 2, the luminescence intensity of 3 demonstrated a steady quenching process. The luminescence intensity was quenched continuously from the very beginning of HPO42− addition and at the 100 μM HPO42− concentration; the emission quenched completely and remained constant thereafter (Figure 4a). The LOD for complex 3 was derived as 0.2 μM. The binding constant was determined from nonlinear data fitting using the Equation (2), and the respective association constant (K) was found to be 7.0 × 10⁴ M−1 (R = 0.9870) (Figure 4b). A molecular ion peak at m/z = 803.56 (Figure S17) can be attributed to the generation of [TbL(HPO4)2 + Na+ + H+] (calcd. m/z = 803.45) in solution. Thus, all three complexes are established to bind phosphates in 1:2 stoichiometries.
Ligand L with its hexadentate nature fulfils six coordination sites of Eu(III), Sm(III), and Tb(III) in their respective complexes 1, 2, and 3. The remaining sites at the metal centers were calculated by measuring the hydration states [11,71] (denoted hereafter by “q”) of 13, adapting Equation (3). Based on the experimental results, the respective inner-sphere hydration numbers calculated for 13 are compiled in Table 1. Accordingly, complexes 1 and 2 are found to possess four coordinated water molecules while complex 3 accommodates only three water molecules, presumably due to the smaller ionic radius of Tb(III).
qcorr = A’Δkcorr [where Δkcorr = (kH2OkD2O)]
whereas kH2O and kD2O are radiative rate constants in H2O and D2O solvent, A’ is a proportionality constant signifying the sensitivity of the lanthanide ion to vibronic quenching by OH oscillators, and qcorr is the hydration state, i.e., number of solvent molecules attached to a metal center.
To understand the underlying mechanism behind the titration profiles of 1 and 2 against the hydrogen phosphate ions (Figure 2a and Figure 3a), we performed time-resolved luminescence decay studies (Figures S18–S21) and also calculated the quantum yield of each complexes (Table S1). As a representative example lifetime was determined for 1 in the absence and presence of phosphate ions at different stoichiometry and compared with lifetime of the complex 1, a laser excitation source of 276 nm was used, and the decay luminescence pattern was monitored at 614 nm. Aqueous (H2O as well as D2O) HEPES buffer solutions of 1 were used for these studies. In the absence of HPO42−, luminescence profiles for 1 could be best fitted to single exponential decay traces with lifetime values τ = 0.22 ms (H2O) and 1.56 ms (D2O) (κ2 = 1.16, 1.18) (Figure S19, Table 1). Upon the addition of one equivalent HPO42− to these two solutions, the luminescence decay profiles could be best fitted to τ = 0.41 ms (H2O) and 1.72 ms (D2O) (κ2 = 1.17, 1.13) (Table 2). Thus, the decrease in the hydration state of 1 from q = 4 to q = 2 upon the addition of 1 equivalent of HPO42− (i.e., upon 1:1 association) was obvious to understand. After the addition of another equivalent of HPO42− to this mixture, the lifetime values were found to be 0.60 ms (H2O) and 1.89 ms (D2O) (κ2 = 1.20, 1.18) (Table 2), therefore revealing that hydration state q = 1, i.e., one coordinated water molecules present at 1:2 binding ratio between 1 and HPO42−. The gradual addition of excess HPO42− did not change the hydration state of the resulting species in solution further, i.e., q = 1 (Table 2). Based on the results summarized in Table 2, a plausible mechanism of phosphate’s interaction with complex 1 is schematically represented in Figure 5. The initial little luminescence enhancement of 1 upon one equivalent HPO42− addition possibly arose due to the replacement of two coordinated water molecules by the incoming phosphate group, which normally functions as a strong chelating species [24]. It is noteworthy to mention that such an effect has already been observed in the case of bicarbonate [72]. The addition of a second equivalent of HPO42− to this 1:1 mixture resulted in the displacement of one more coordinated water molecule from the metal center (also supported by Figure S12) and shows quenching of luminescence. Possibly, steric crowding played an important role here by forcing the phosphate group to form a hydrogen bond with the piperidine NH moiety of ligand L, causing an energy mismatch between the lowest triplet state (T1) of L and the excited state of the Eu(III). Therefore, the energy transfer process from the ligand L to europium(III) terminated and hence resulted in quenching of the luminescence process. However, at higher concentrations, the emission intensity reduces completely, which can be ascribed to the leaching of lanthanides from the complexes in the presence of more strongly coordinating phosphates ions.
Although a significant number of luminescent complexes are applied in bio-imaging with excitation range below 300 nm [73,74], the presented complexes with excitation at 276 nm (i.e., in the UV region) limit their usage in in vivo bio-imaging. However, for in vitro conditions, the complexes are expected to be significant.

3. Conclusions

A series of mononuclear Ln(III) complexes (13) based on aminomethylpiperidine functionalized 1,10-phenanthrolene-based nitrogen-rich hexadentate heterocyclic ligand L has been reported. All these rare-earth complexes showed red-shifted metal-centered luminescence. The excited state photophysical properties of these complexes were explored to find their specific recognition affinity towards various important anions. The selective sensing of 13 for hydrogen phosphates over other anions is remarkable. Systematic spectrophotometric analysis demonstrates that, in the case of 1 and 2, the emission intensities were increased slightly at the very beginning of phosphate addition (up to 1 and 2 equivalents, respectively) and finally decreased to a plateau at high phosphate concentrations (at mM level). The limits of detection (LOD) fall in the range 0.1–0.4 μM. Luminescence decay studies revealed that successive replacement of weakly bound coordinated water molecules from Eu(III) and Sm(III) probably caused the initial emission enhancement of these two complexes upon hydrogen phosphate addition. However, the addition of excess hydrogen phosphate causing steric crowding at the metal site and possible hydrogen bond formation between the piperidine NH group and phosphate might have created an energy mismatch between the lowest triplet state (T1) of L and the excited state of the Eu(III), which in turn resulted in termination of the energy transfer between the o-phenanthrolene moiety and Ln(III).

4. Experimental Section

4.1. Materials and Methods

All chemicals were purchased from Aldrich. Sodium salts of all anions were used in this study. Elemental analyses of the complexes were carried out by using a vario Micro cube from Elementar. IR spectra were recorded from KBr pellets (1% w/w) on a Perkin–Elmer spectrum GX FTIR spectrophotometer. Electronic spectra were recorded on a Shimadzu UV 3600 spectrophotometer and scanned in the range 200–800 nm. The mass-spectrometric analysis was performed by using the positive ESI technique on a Waters Q-ToF Micromass spectrometer in CH3OH. NMR spectra were recorded on a Bruker Avance 500 MHz FT-NMR spectrometer. The chemical shifts (δ) for proton resonances are reported in ppm relative to the internal standard TMS (Tetramethylsilane). The CD spectra were recorded by using a JASCO 815 spectrometer. Milli-Q water was used as a solvent. pH measurements were carried out using an ORION VERSA STAR pH meter. Emission spectra were recorded using an Edinburgh Instruments model Xe-900, and all the spectra recorded are reported hereafter applying emission correction. The slit sizes for emission and excitation were adjusted as 3.0/3.0 nm. For Job plot analysis (continuous variations method), a series of samples were prepared with a constant sum of concentrations at 1.0 μM but with varying concentrations of complex and hydrogen phosphate. The luminescence spectra were recorded for each sample with λex = 276 nm for all these complexes. The maximum luminescence intensity was plotted versus the mole fraction of the corresponding hydrogen phosphate. For determination of the maximum, the ascending and descending segments of the curve were fitted to linear lines, respectively, and the intercept of both lines denotes the maximum and thus the stoichiometry of the complex.
Synthesis of ligand L. 4(H2O): 1,9-Diformyl-1,10-phenanthroline (0.001 mmol, 0.200 g) (17) was dissolved in 50 mL of CH3OH. To this methanolic solution, 2-(aminomethyl)piperidine (0.002 mmol, 0.184 g) was added drop by drop. This reaction mixture was stirred continuously for 48 h at 50 °C. During this, the color of the reaction mixture changed to red-brown, indicating the formation of a Schiff base. The solvent was removed under vacuum, and the resultant orange-red powder was isolated. Yield. 70%. -1H NMR (CDCl3, 500 MHz): δ = 8.26, 8.24 (dd, J = 3 Hz, 2H), 7.86, 784, 7.82(t, J = 10 Hz, 4H), 7.77(s, 2H), 3.55(brs, 2H), 3.27(m, 2H), 3.09, 3.07, 3.05, 3.03 (q, J = 10 Hz,2H), 2.83, 2.81, 2.79 (t, J = 12 Hz, 2H), 2.50 (m, 2H), 2.24, 2.22, 2.20 (t, J = 11 Hz, 2H), 1.93–1.83(dd, J = 12 Hz, 4H), 1.60–1.50(m, 6H), 1.34–1.31 (m, 2H). 13C NMR, (CDCl3, 125. MHz) δ = 160.22, 145.27, 136.89, 128.66, 126.30, 122.75, 122.64, 83.14, 83.06, 64.20, 50.66, 48.99, 28.64, 24.91, 23.95. DEPT-135°. 131.59, 121.00, 117.44, 117.34, 77.85, 58.93 (CH, UP), 45.40, 43.72, 23.37, 19.64, 18.68 (CH2, DOWN). IR (KBr): υ cm−1 = 3418 (br), 1616 (s), 1598 (s), 1370 (s). UV vis (CH3OH, nm (ε, M−1 cm−1)): λ = 275 (32170), 234(31530); ESI[MS]+ in methanol: m/z (calcd (found)) 429.28 (429.69 for L+H+; 100% abundance); 451.26 (451.69 for L+Na+; 90% abundance). Elemental data: Calc (found) for C26H32N6.4H2O: C 62.38 (62.44), H 8.05 (7.74), N 16.79 (16.22)%.

4.2. Synthesis of Complexes

General synthetic procedure for compounds 13. The methanolic solution of the ligand L (0.001 mmol) and LnCl3 salt (0.001 mmol) was mixed together and allowed for constant stirring at room temperature for 4 h. After completion of the reaction, the solution was evaporated by rotary and the solid was further dried under vacuum.
Complex 1. Yield: 75%. IR (KBr): υ cm−1 = 3398 (br), 1623 (s), 1458 (m), 1432 (m) 1400 (s), UV vis (HEPES Buffer, pH 7.4, nm (ε, M−1 cm−1)): λ = 237 (21,392), 285 (20,212); ESI-[MS]+ in methanol: m/z calcd(found) 687.10 (687.12) for ([EuL(Cl)3+H+]; 65% abundance), 651.13(651.15) for ([EuL(Cl)2]+; 100% abundance). Elemental data: Calc (found) for C26H70Cl3EuN6O19, C 30.34(30.54), H 6.86 (6.51), N 8.17 (8.24)%.
Complex 2. Yield: 68%. IR (KBr): υ cm−1 = 3436 (br), 1629 (s), 1459 (m), 1431 (m) 1386 (s), -UV vis (HEPES Buffer, pH 7.4, nm (ε, M−1 cm−1)): λ = 236 (16,825), 287 (14,175); ESI-[MS]+ in methanol: m/z calcd(found) 706.27 (706.21) for ([Sm(L-2H).4(CH3OH)]+; 100% abundance); 770.33 (770.27) for ([SmL-2H).6(CH3OH)]+; 100% abundance). Elemental data: Calc (found) for C26H66Cl3N6O17Sm: C 31.49(31.11), H 6.71(6.65), N 8.48(8.54)%.
Complex 3. Yield 65%. IR (KBr): υ cm−1 = 3432 (br), 1627(s), 1459 (m), 1432 (m) 1390 (s). -UV vis (HEPES Buffer, pH 7.4, nm (ε, M−1 cm−1)): λ = 236 (215,725), 285 (13,917); ESI-[MS]+ in methanol: m/z calcd(found) 693.11.(693.09) for ([TbL(Cl)3+H+]; 90% abundance); 657.13 (657.12) for ([TbL(Cl)2]+; 100% abundance). Elemental data: Calc (found) for C26H70Cl3N6O19Tb: C 30.14(29.68), H 6.81(7.05), N 8.11(8.34)%.
Detection limit (DL) calculation:
DL = CL × ET
where DL = detection limit, CL = Concentration of complex, and ET = Equivalent of Titrant at which change was observed. Here, the titrant is phosphate.

Supplementary Materials

The following are available online at https://www.mdpi.com/2079-4991/11/1/53/s1, Figure S1: 1H NMR of L in CDCl3, Figure S2: 13C NMR of L in CDCl3, Figure S3: DEPT-135° NMR of L in CDCl3, Figure S4: ESI-MS Spectrum of L, Figure S5:CD spectra of Ligand L in CHCl3, Figure S6: IR-Spectra of L, 1, 2, and 3, Figure S7: ESI-MS Spectrum of 1, Figure S8: ESI-MS Spectrum of 2, Figure S9: ESI-MS Spectrum of 3, Figure S10: Normalization Spectra, Figure S11: Emission Curve of 1 against HPO42, Figure S12: ESI-MS spectrum of [1]:2[HPO42], Figure S13: Non-linear fit curve of 1 against HCO3, Figure S14: Emission curve of 2 against HPO42, Figure S15: ESI-MS spectrum of [2]:2[HPO42], Figure S16: Emission curve of 3 against HPO42, Figure S17: ESI-MS spectra of [3]:2[HPO42], Figure S18: (a) UV-vis spectra of ligand L and its complexes 1, 2 and 3 and (b) possible energy transfer, Figure S19: Excited state lifetime of complex 1 with HPO42 with 1:1 ratio, Figure S20: Excited state lifetime of complex 1 with HPO42 with 1:2 ratio, Figure S21: Excited state lifetime of complex 1 with HPO42 with 1:10 ratio, Table S1: Quantum yield calculation for complex 1, 2 and 3.

Author Contributions

Concept, J.S., P.S.S.; methodology, J.S., P.S.S.; experiments and data collections, J.S., S.J., P.B.C.; validation, J.S., P.S.S., H.S.J.; writing—original draft, J.S., P.S.S., H.S.J.; formatting, H.S.J.; funding acquisition, H.S.J. All authors have read and agreed to the published version of the manuscript.

Funding

This research received no external funding.

Institutional Review Board Statement

Not applicable.

Informed Consent Statement

Not applicable.

Data Availability Statement

Data used to support the findings of this study are included within the article and supporting material.

Acknowledgments

The manuscript has been assigned CSMCRI communication number CSIR-CSMCRI 193/2015. J.S. acknowledges CSIR, Govt. of India, New Delhi for the CSIR-SRF award. The members of Analytical Division and Centralized Instrument Facility (AD&CIF) of CSIR-CSMCRI are gratefully acknowledged for their analytical supports. H.S.J. thanks FWO [PEGASUS]2 Marie Sklodowska-Curie grant agreement No. 665501 for the incoming Post-doctoral Fellowship.

Conflicts of Interest

The authors declare no conflict of interest.

References

  1. Saenger, W. Principles of Nucleic Acid Structure; Springer: New York, NY, USA, 1984; ISBN 0-387-90762-9. [Google Scholar]
  2. Massue, J.; Quinn, S.J.; Gunnlaugsson, T. Lanthanide Luminescent Displacement Assays: The Sensing of Phosphate Anions Using Eu(III)−Cyclen-Conjugated Gold Nanoparticles in Aqueous Solution. J. Am. Chem. Soc. 2008, 130, 6900–6901. [Google Scholar] [CrossRef]
  3. Bowler, M.W.; Cliff, M.J.; Waltho, J.P.; Blackburn, G.M. Why did Nature select phosphate for its dominant roles in biology? New. J. Chem. 2010, 34, 784–794. [Google Scholar] [CrossRef]
  4. Vullev, V.I.; Jones, G. Photoinduced charge transfer in helical polypeptides. Res. Chem. Intermed. 2002, 28, 795–815. [Google Scholar] [CrossRef]
  5. Barela, T.D.; Sherry, A.D. A simple, one-step fluorometric method for determination of nanomolar concentrations of terbium. Anal. Biochem. 1976, 71, 351–352. [Google Scholar] [CrossRef]
  6. Cable, M.L.; Kirby, J.P.; Levine, D.J.; Manary, M.J.; Gray, H.B.; Ponce, A. Detection of Bacterial Spores with Lanthanide−Macrocycle Binary Complexes. J. Am. Chem. Soc. 2009, 131, 9562–9570. [Google Scholar] [CrossRef] [PubMed] [Green Version]
  7. Caffrey, D.F.; Gunnlaugsson, T. Displacement assay detection by a dimeric lanthanide luminescent ternary Tb(iii)–cyclen complex: High selectivity for phosphate and nitrate anions. Dalton Trans. 2014, 43, 17964–17970. [Google Scholar] [CrossRef] [PubMed] [Green Version]
  8. Li, S.-H.; Yuan, W.-T.; Zhu, C.-Q.; Xu, J.-G. Species-differentiable sensing of phosphate-containing anions in neutral aqueous solution based on coordinatively unsaturated lanthanide complex probes. Anal. Biochem. 2004, 331, 235–242. [Google Scholar] [CrossRef] [PubMed]
  9. Coates, J.; Gay, E.; Sammes, P.G. Anion effects on the luminescence of europium complexes. Dyes Pigm. 1997, 34, 195–205. [Google Scholar] [CrossRef]
  10. Zyryanov, G.V.; Palacios, M.A.; Anzenbacher, P., Jr. Rational design of a fluorescence-turn-on sensor array for phosphates in blood serum. Angew. Chem. Int. Ed. 2007, 46, 7849–7852. [Google Scholar] [CrossRef]
  11. Xu, W.; Zhou, Y.; Huang, D.; Su, M.; Wang, K.; Xiang, M.; Hong, M. Luminescent sensing profiles based on anion-responsive lanthanide(iii) quinolinecarboxylate materials: Solid-state structures, photophysical properties, and anionic species recognition. J. Mater. Chem. C 2015, 3, 2003–2015. [Google Scholar] [CrossRef]
  12. Wang, Y.-W.; Liu, S.-B.; Yang, Y.-L.; Wang, P.-Z.; Zhang, A.-J.; Peng, Y. A Terbium(III)-Complex-Based On–Off Fluorescent Chemosensor for Phosphate Anions in Aqueous Solution and Its Application in Molecular Logic Gates. ACS Appl. Mater. Interfaces 2015, 7, 4415–4422. [Google Scholar] [CrossRef] [PubMed]
  13. Xu, H.; Cao, C.-S.; Zhao, B. A water-stable lanthanide-organic framework as a recyclable luminescent probe for detecting pollutant phosphorus anions. Chem.Commun. 2015, 51, 10280–10283. [Google Scholar] [CrossRef] [PubMed]
  14. Toussaint, N.D.; Pedagogos, E.; Tan, S.-J.; Badve, S.V.; Hawley, C.M.; Perkovic, V.; Elder, G.J. Phosphate in early chronic kidney disease: Associations with clinical outcomes and a target to reduce cardiovascular risk. Nephrology 2012, 17, 433–444. [Google Scholar] [CrossRef] [PubMed]
  15. Chana, T.O.; Zhang, J.; Rodeck, U.; Pascal, J.M.; Armen, R.S.; Spring, M.; Dumitru, C.D.; Myers, V.; Li, X.; Cheung, J.Y.; et al. Resistance of Akt kinases to dephosphorylation through ATP-dependent conformational plasticity. Proc. Natl. Acad. Sci. USA 2011, 108, E1120–E1127. [Google Scholar] [CrossRef] [PubMed] [Green Version]
  16. Pradhan, S.M.; Pokhrel, R. Spectrophotometric determination of phosphate in sugarcane juice, fertilizer, detergent and water samples by molybdenum blue method. Sci. World 2013, 11, 58–62. [Google Scholar] [CrossRef] [Green Version]
  17. Kipngetich, T.E.; Hillary, M.; Swamy, T.A. Determination of levels of phosphates and sulphates in domestic water from three selected springs in Nandi County, Kenya. Int. J. Pharm. Life Sci. 2013, 4, 2828–2833. [Google Scholar]
  18. Sahu, S.K.; Ajmal, P.Y.; Bhangare, R.C.; Tiwari, M.; Pandit, G.G. Natural radioactivity assessment of a phosphate fertilizer plant area. J. Radiat. Res. Appl. Sci. 2014, 7, 123–128. [Google Scholar] [CrossRef]
  19. Gaddaum, J.H. The Estimation of Phosphorus in Blood. Biochem. J. 1926, 20, 1204–1207. [Google Scholar] [CrossRef] [Green Version]
  20. Bünzli, J.-C.G. Lanthanide Luminescence for Biomedical Analyses and Imaging. Chem. Rev. 2010, 110, 2729–2755. [Google Scholar] [CrossRef]
  21. McCleskey, S.C.; Griffin, M.J.; Schneider, S.E.; McDevitt, J.T.; Anslyn, E.V. Differential Receptors Create Patterns Diagnostic for ATP and GTP. J. Am. Chem. Soc. 2003, 125, 1114–1115. [Google Scholar] [CrossRef]
  22. Wang, X.; Chang, H.; Xie, J.; Zhao, B.; Liu, B.; Xu, S.; Pei, W.; Ren, N.; Huang, L.; Huang, W. Recent developments in lanthanide-based luminescent probes. Coord. Chem. Rev. 2014, 273–274, 201–212. [Google Scholar] [CrossRef]
  23. Hong, J.; Pei, D.; Guo, X. Quantum dot-Eu3+ conjugate as a luminescence turn-on sensor for ultrasensitive detection of nucleoside triphosphates. Talanta 2012, 99, 939–943. [Google Scholar] [CrossRef] [PubMed]
  24. Weitz, E.A.; Chang, J.Y.; Rosenfield, A.H.; Morrow, E.A.; Pierre, V.C. The basis for the molecular recognition and the selective time-gated luminescence detection of ATP and GTP by a lanthanide complex. Chem. Sci. 2013, 4, 4052–4060. [Google Scholar] [CrossRef]
  25. Mizukami, S.; Agano, T.; Urano, Y.; Odani, A.; Kikuchi, K. A Fluorescent Anion Sensor That Works in Neutral Aqueous Solution for Bioanalytical Application. J. Am. Chem. Soc. 2002, 124, 3920–3925. [Google Scholar] [CrossRef] [PubMed]
  26. Schneider, S.E.; O’Neil, S.N.; Anslyn, E.V. Coupling Rational Design with Libraries Leads to the Production of an ATP Selective Chemosensor. J. Am. Chem. Soc. 2000, 122, 542–543. [Google Scholar] [CrossRef]
  27. Epstein, D.M.; Chappell, L.L.; Khalili, H.; Supkowski, R.M. Eu(III) Macrocyclic Complexes Promote Cleavage of and Bind to Models for the 5‘-Cap of mRNA. Effect of Pendent Group and a Second Metal Ion. Inorg. Chem. 2000, 39, 2130–2134. [Google Scholar] [CrossRef]
  28. Shao, N.; Jin, J.; Wang, G.; Zhang, Y.; Yang, R.; Yuan, J. Europium(iii) complex-based luminescent sensing probes for multi-phosphate anions: Modulating selectivity by ligand choice. Chem. Commun. 2008, 1127–1129. [Google Scholar] [CrossRef]
  29. Butler, S.J. Ratiometric Detection of Adenosine Triphosphate (ATP) in Water and Real-Time Monitoring of Apyrase Activity with a Tripodal Zinc Complex. Chem. Eur. J. 2014, 20, 15768–15774. [Google Scholar] [CrossRef]
  30. Rao, A.S.; Kim, D.; Nam, H.; Jo, H.; Kim, K.H.; Ban, C.; Ahn, K.H. A turn-on two-photonfluorescent probe for ATP and ADP. Chem. Commun. 2012, 48, 3206–3208. [Google Scholar]
  31. Kaur, J.; Singh, P. ATP selective acridone based fluorescent probes for monitoring of metabolic events. Chem. Commun. 2011, 47, 4472–4474. [Google Scholar] [CrossRef]
  32. Moro, A.J.; Cywinski, P.J.; Korsten, S.; Mohr, G.J. An ATP fluorescent chemosensor based on a Zn(ii)-complexed dipicolylaminereceptor coupled with a naphthalimidechromophore. Chem. Commun. 2010, 46, 1085–1087. [Google Scholar] [CrossRef] [PubMed]
  33. Mahato, P.; Ghosh, A.; Mishra, S.K.; Shrivastav, A.; Mishra, S.; Das, A. Zn(II) based colorimetric sensor for ATP and its use as a viable staining agent in pure aqueous media of pH 7.2. Chem. Commun. 2010, 46, 9134–9136. [Google Scholar] [CrossRef] [PubMed]
  34. Ngo, H.T.; Liu, X.; Jolliffe, K.A. Anion recognition and sensing with Zn(ii)–dipicolylamine complexes. Chem. Soc. Rev. 2012, 41, 4928–4965. [Google Scholar] [CrossRef] [PubMed]
  35. Ojida, A.; Takashima, I.; Kohira, T.; Nonaka, H.; Hamachi, I. Turn-On Fluorescence Sensing of Nucleoside Polyphosphates Using a Xanthene-Based Zn(II) Complex Chemosensor. J. Am. Chem. Soc. 2008, 130, 12095–12101. [Google Scholar] [CrossRef] [PubMed]
  36. Zhou, Y.; Xu, Z.; Yoon, J. Fluorescent and colorimetric chemosensors for detection of nucleotides, FAD and NADH: Highlighted research during 2004–2010. Chem. Soc. Rev. 2011, 40, 2222–2235. [Google Scholar] [CrossRef]
  37. Santos-Figueroa, E.L.; Moragues, M.E.; Climent, E.; Agostini, A.; Martınez-Manez, R.; Sancenon, F. Chromogenic and fluorogenic chemosensors and reagents for anions. A comprehensive review of the years 2010–2011. Chem. Soc. Rev. 2013, 42, 3489–3613. [Google Scholar] [CrossRef]
  38. Xu, Z.; Singh, N.J.; Lim, J.; Pan, J.; Kim, H.N.; Park, S.; Kim, K.S.; Yoon, J. Unique Sandwich Stacking of Pyrene-Adenine-Pyrene for Selective and Ratiometric Fluorescent Sensing of ATP at Physiological pH. J. Am. Chem. Soc. 2009, 131, 15528–15533. [Google Scholar] [CrossRef]
  39. Montgomery, C.P.; Murray, B.S.; New, E.J.; Pal, R.; Parker, D. Cell-Penetrating Metal Complex Optical Probes: Targeted and Responsive Systems Based on Lanthanide Luminescence. Acc. Chem. Res. 2009, 42, 925–937. [Google Scholar] [CrossRef]
  40. Bünzli, J.-C.G.; Comby, S.; Chauvin, A.-S.; Vandevyver, C.D.B. New opportunities for lanthanide luminescence. J. Rare. Earths. 2007, 25, 257–274. [Google Scholar]
  41. Comby, S.; Surender, E.M.; Kotova, O.; Truman, L.K.; Molloy, J.K.; Gunnalaugsson, T. Lanthanide-Functionalized Nanoparticles as MRI and Luminescent Probes for Sensing and/or Imaging Applications. Inorg. Chem. 2014, 53, 1867–1879. [Google Scholar] [CrossRef]
  42. Major, J.L.; Meade, T.J. Bioresponsive, Cell-Penetrating, and Multimeric MR Contrast Agents. Acc. Chem. Res. 2009, 42, 893–903. [Google Scholar] [CrossRef] [PubMed] [Green Version]
  43. Werner, E.J.; Datta, A.; Jocher, C.J.; Raymond, K.N. High-relaxivity MRI contrast agents: Where coordination chemistry meets medical imaging. Angew. Chem. Int. Ed. 2008, 47, 8568–8580. [Google Scholar] [CrossRef] [PubMed] [Green Version]
  44. Caravan, P.; Ellison, J.J.; McMurry, T.J.; Lauffer, R.B. Gadolinium(III) Chelates as MRI Contrast Agents:  Structure, Dynamics, and Applications. Chem. Rev. 1999, 99, 2293–2352. [Google Scholar] [CrossRef] [PubMed]
  45. Caravan, P. Protein-Targeted Gadolinium-Based Magnetic Resonance Imaging (MRI) Contrast Agents: Design and Mechanism of Action. Acc. Chem. Res. 2009, 42, 851–862. [Google Scholar] [CrossRef]
  46. Bottrill, M.; Kwok, L.; Long, N.J. Lanthanides in magnetic resonance imaging. Chem. Soc. Rev. 2006, 35, 557–571. [Google Scholar] [CrossRef]
  47. Doble, D.M.J.; Melchior, M.; O’Sullivan, B.; Siering, C.; Xu, J.; Pierre, V.C.; Raymond, K.N. Toward Optimized High-Relaxivity MRI Agents:  The Effect of Ligand Basicity on the Thermodynamic Stability of Hexadentate Hydroxypyridonate/Catecholate Gadolinium(III) Complexes. Inorg. Chem. 2003, 42, 4930–4937. [Google Scholar] [CrossRef]
  48. New, E.J.; Parker, D.; Peacock, R.D. Spin state tuning of non-heme iron-catalyzed hydrocarbon oxidations: Participation of FeIII–OOH and FeV[double bond, length as m-dash]O intermediates. Dalton Trans. 2009, 38, 672–679. [Google Scholar] [CrossRef]
  49. Smith, D.G.; Mcmahon, B.K.; Pal, R.; Parker, D. Live cell imaging of lysosomal pH changes with pH responsive ratiometric lanthanide probes. Chem. Commun. 2012, 48, 8520–8522. [Google Scholar] [CrossRef]
  50. Katz, L.A.; Swain, J.A.; Portman, M.A.; Balaban, R.S. Intracellular pH and inorganic phosphate content of heart in vivo: A 31P-NMR study. Am. J. Physiol. Heart Circ. Physiol. 1988, 255, H189–H196. [Google Scholar] [CrossRef]
  51. Heipertz, R.; Eickhoff, K.; Karstens, K.H. Cerebrospinal fluid concentrations of magnesium and inorganic phophate in epilepsy. J. Neurol. Sci. 1979, 41, 55–60. [Google Scholar] [CrossRef]
  52. Butler, S.J.; Parker, D. Anion binding in water at lanthanide centres: From structure and selectivity to signalling and sensing. Chem. Soc. Rev. 2015, 42, 1652–1666. [Google Scholar] [CrossRef] [PubMed]
  53. Schferling, M.; Wolfbeis, O.S. Europium Tetracycline as a Luminescent Probe for Nucleoside Phosphates and Its Application to the Determination of Kinase Activity. Chem. Eur. J. 2007, 13, 4342–4349. [Google Scholar] [CrossRef]
  54. Duerkop, A.; Turel, M.; Lobnik, A.; Wolfbeis, O.S. Microtiter plate assay for phosphate using a europium–tetracycline complex as a sensitive luminescent probe. Anal. Chim. Acta. 2006, 555, 292–298. [Google Scholar] [CrossRef]
  55. Bergwitz, C.; Jüppner, H. Phosphate sensing. Adv. Chronic Kidney Dis. 2011, 18, 132–144. [Google Scholar] [CrossRef] [PubMed]
  56. Nadella, S.; Selvakumar, P.M.; Suresh, E.; Subramanian, P.S.; Albrecht, M.; Giese, M.; Fröhlich, R. Lanthanide(III) Complexes of Bis-semicarbazone and Bis-imine-Substituted Phenanthroline Ligands: Solid-State Structures, Photophysical Properties, and Anion Sensing. Chem. Eur. J. 2012, 18, 16784–16792. [Google Scholar] [CrossRef]
  57. Nadella, S.; Sahoo, J.; Subramanian, P.S.; Sahu, A.; Mishra, S.; Albrecht, M. Sensing of Phosphates by Using Luminescent EuIII and TbIII Complexes: Application to the Microalgal Cell Chlorella vulgaris. Chem. Eur. J. 2014, 20, 6047–6053. [Google Scholar] [CrossRef] [PubMed]
  58. Shavaleev, N.M.; Scopelliti, R.; Gumy, F.; Bunzli, J.-C.G. Benzothiazole- and Benzoxazole-Substituted Pyridine-2-Carboxylates as Efficient Sensitizers of Europium Luminescence. Inorg. Chem. 2009, 48, 6178–6191. [Google Scholar] [CrossRef] [PubMed]
  59. Kumar, M.; Kumar, N.; Bhalla, V. Highly selective fluorescent probe for detection and visualization of palladium ions in mixed aqueous media. RSC Adv. 2013, 3, 1097–1102. [Google Scholar] [CrossRef]
  60. Long, G.L.; Winefordner, J.D. Limit of Detection A Closer Look at the IUPAC Definition. Anal. Chem. 1983, 55, 712A–724A. [Google Scholar]
  61. Gole, B.; Bar, A.K.; Mukherjee, P.S. Modification of Extended Open Frameworks with Fluorescent Tags for Sensing Explosives: Competition between Size Selectivity and Electron Deficiency. Chem. Eur. J. 2014, 20, 2276–2291. [Google Scholar] [CrossRef]
  62. Gole, B.; Bar, A.K.; Mukherjee, P.S. Multicomponent Assembly of Fluorescent-Tag Functionalized Ligands in Metal–Organic Frameworks for Sensing Explosives. Chem. Eur. J. 2014, 20, 13321–13336. [Google Scholar] [CrossRef]
  63. Thordarson, P. Determining association constants from titration experiments in supramolecular chemistry. Chem. Soc. Rev. 2011, 40, 1305–1323. [Google Scholar] [CrossRef] [PubMed]
  64. Raju, M.; Patel, T.J.; Nair, R.R.; Chatterjee, P.B. Xanthurenic acid: A natural ionophore with high selectivity and sensitivity for potassium ions in an aqueous solution. New J. Chem. 2016, 40, 1930–1934. [Google Scholar] [CrossRef]
  65. Raju, M.; Nair, R.R.; Raval, I.H.; Haldar, S.; Chatterjee, P.B. Reporting a new siderophore based Ca2+ selective chemosensor that works as a staining agent in the live organism Artemia. Analyst 2015, 140, 7799–7809. [Google Scholar] [CrossRef] [PubMed]
  66. Li, P.; Zhou, X.; Huang, R.; Yang, L.X.; Tang, X.; Dou, W.; Zhao, Q.; Liu, W. A highly fluorescent chemosensor for Zn2+ and the recognition research on distinguishing Zn2+ from Cd2+. Dalton Trans. 2014, 43, 706–713. [Google Scholar] [CrossRef] [PubMed]
  67. Gusev, A.N.; Hasegawa, M.; Nishchymenko, G.A.F.; Shul’gin, V.B.; Meshkova, S.; Doga, P.; Linert, W. Ln(iii) complexes of a bis(5-(pyridine-2-yl)-1,2,4-triazol-3-yl)methaneligand: Synthesis, structure and fluorescent properties. Dalton Trans. 2013, 42, 6936–6943. [Google Scholar] [CrossRef] [PubMed]
  68. Horrocks, W.D., Jr.; Sudnick, D.R. Lanthanide ion probes of structure in biology. Laser-induced luminescence decay constants provide a direct measure of the number of metal-coordinated water molecules. J. Am. Chem. Soc. 1979, 101, 334–340. [Google Scholar]
  69. Beeby, A.; Clarkson, I.M.; Dickins, R.S.; Faulkner, S.; Parker, D.; Royle, L.; de Sousa, A.S.; Williams, J.A.G.; Woods, M. Non-radiative deactivation of the excited states of europium, terbium and ytterbium complexes by proximate energy-matched OH, NH and CH oscillators: An improved luminescence method for establishing solution hydration states. J. Chem. Soc. Perkin Trans. 1999, 2, 493–503. [Google Scholar] [CrossRef]
  70. Zhang, P.; Kimura, T.; Yoshida, Z. Luminescence Study on the Inner-Sphere Hydration Number of Lanthanide(III) Ions in Neutral Organo-Phosphorus Complexes. Solvent Extr. Ion. Exch. 2004, 22, 933–945. [Google Scholar] [CrossRef]
  71. Dos Santos, C.M.G.; Gunnlaugsson, T. Exploring the luminescent sensing of anions by the use of an urea functionalised 1,10-phenanthroline (phen)-based (3:1) Eu(III) complex. Supramol. Chem. 2009, 21, 173–180. [Google Scholar] [CrossRef]
  72. Bridou, L.; Nielsen, L.G.; Sørensen, T.J. Using europium(III) complex of 1,4,7,10-tetraazacyclododecane-1,4,7-triacedic acid Eu.DO3A as a luminescent sensor for bicarbonate. J. Rare Earths 2020, 38, 498–505. [Google Scholar] [CrossRef]
  73. McMahon, B.; Mauer, P.; McCoy, C.P.; Lee, T.C.; Gunnlaugsson, T. Selective Imaging of Damaged Bone Structure (Microcracks) Using a Targeting Supramolecular Eu(III) Complex As a Lanthanide Luminescent Contrast Agent. J. Am. Chem. Soc. 2009, 131, 17542–17543. [Google Scholar] [CrossRef] [PubMed]
  74. Law, G.-L.; Man, C.; Parker, D.; Walton, J.W. Observation of the selective staining of chromosomal DNA in dividing cells using a luminescent terbium(iii) complex. Chem. Commun. 2010, 46, 2391–2393. [Google Scholar] [CrossRef] [PubMed]
Scheme 1. 2,9-Bis(aminomethylpiperidine)-1,10-phenanthrolene (L) and its Ln(III) complexes 1, 2, and 3.
Nanomaterials 11 00053 sch001
Figure 1. Emission spectra of (a) 1 (1 × 10⁻⁵ M), (b) 2 (2 × 10⁻⁵ M), and (c) 3 (4 × 10⁻⁵ M) upon the addition of various anions (100 equiv. for 1 and 10 equiv. for 3 in aqueous HEPES (2-[4-(2-hydroxyethyl)piperazin-1-yl]ethanesulfonic acid) buffer at pH = 7.4, λexi = 276 nm): in the case of 2, spectra obtained after the addition of both 100 (cyano) and 500 equiv. (light brown) of HPO42− are overlaid. Insets: luminescence intensities of 1 and 3 at 614 and 545 nm, respectively, in the presence of different anions, while in the case of 2, relative intensity ratios (644/595 nm) are plotted along the y-axis.
Nanomaterials 11 00053 g001
Figure 2. (a) Changes in emission maxima of 1 (1 × 10⁻⁵ M) upon gradual addition of HPO42− in aqueous HEPES buffer at pH = 7.4; (b) nonlinear curve fitting of the titration data as a function of HPO42− concentrations in the range 0.01–1 equiv. (luminescence enhancement part); (c) nonlinear curve fitting of the titration data as a function of HPO42− concentrations in the range 1–400 equiv. (luminescence quenching part), in which a factor of 10 was multiplied with enhancement to maintain the same intesnsity for both quenching and enhancement; and (d) Job’s plot analysis of mixtures of complex 1 with HPO42−(Ccomplex 1 + CHPO42− = 1.0 μM) in aqueous HEPES buffer pH 7.0, indicating 1:2 complex formation (λemi = 614 nm).
Nanomaterials 11 00053 g002
Figure 3. (a) Changes in emission maxima of 2 (4 × 10⁻⁵ M) upon gradual addition of HPO42− in aqueous HEPES buffer at pH = 7.4; (b) nonlinear curve fitting of the titration data as a function of HPO42− concentrations in the range 0.01–18 equiv. (luminescence enhancement part); (c) nonlinear curve fitting of the titration data as a function of HPO42− concentrations in the range 20–800 equiv. (luminescence quenching part); and (d) Job’s plot of complex 2 with HPO42−(Ccomplex 2 + CHPO42− = 1.0 μM) in aqueous HEPES buffer pH 7.0 showing 1:2 complex formation (λemi = 644 nm).
Nanomaterials 11 00053 g003
Figure 4. (a) Change in the emission spectra of 3 (2 × 10⁻⁵ M) upon the addition of HPO42− in aqueous HEPES buffer at pH = 7.4: the inset shows the Job’s plot of mixtures of complex 3 with HPO42−(Ccomplex 3 + CHPO42− = 1.0 μM) in aqueous HEPES buffer pH 7.4 showing 1:2 complex formation. (b) Nonlinear curve fitting of luminescence intensities of 3 (2 × 10⁻⁵ M) as a function of HPO42− concentrations (λemi = 545 nm).
Nanomaterials 11 00053 g004
Figure 5. Proposed mechanistic pathway for successive HPO42− binding with 1 in aqueous medium.
Nanomaterials 11 00053 g005
Table 1. Excited state lifetime measurements of 13 in H2O and D2O at pH 7.4 (HEPES buffer).
ComplexτH2O (ms)τD2O(ms)qcorraCoordination Number
10.221.564.3810
20.151.113.70 *10
30.470.733.509
a qcorr values were determined by adapting A’ = 1.2 ms (Eu3+) and 5 ms (Tb3+) and Δkcorr = −0.25 ms−1 (Eu3+) and −0.06 ms−1 (Tb3+). * For Sm(III), since Δkcorr values are not available in the literature, the qcorr value for complex 2 is calculated without applying the correction.
Table 2. Summary of the changes in the lifetimes of complex 1 in the presence of different equivalent HPO42− in aqueous media (H2O as well as D2O).
Species1 + HPO42 (1:1)1 + HPO42 (1:2)1 + HPO42 (1:10)
τ(H2O) (ms)0.410.600.62
τ(D2O) (ms)1.721.901.91
qcorr1.981.121.06
Publisher’s Note: MDPI stays neutral with regard to jurisdictional claims in published maps and institutional affiliations.

