Moringin Pretreatment Inhibits the Expression of Genes Involved in Mitophagy in the Stem Cell of the Human Periodontal Ligament

 , , ,
, , ,  ,
,
Abstract
:1. Introduction
2. Results
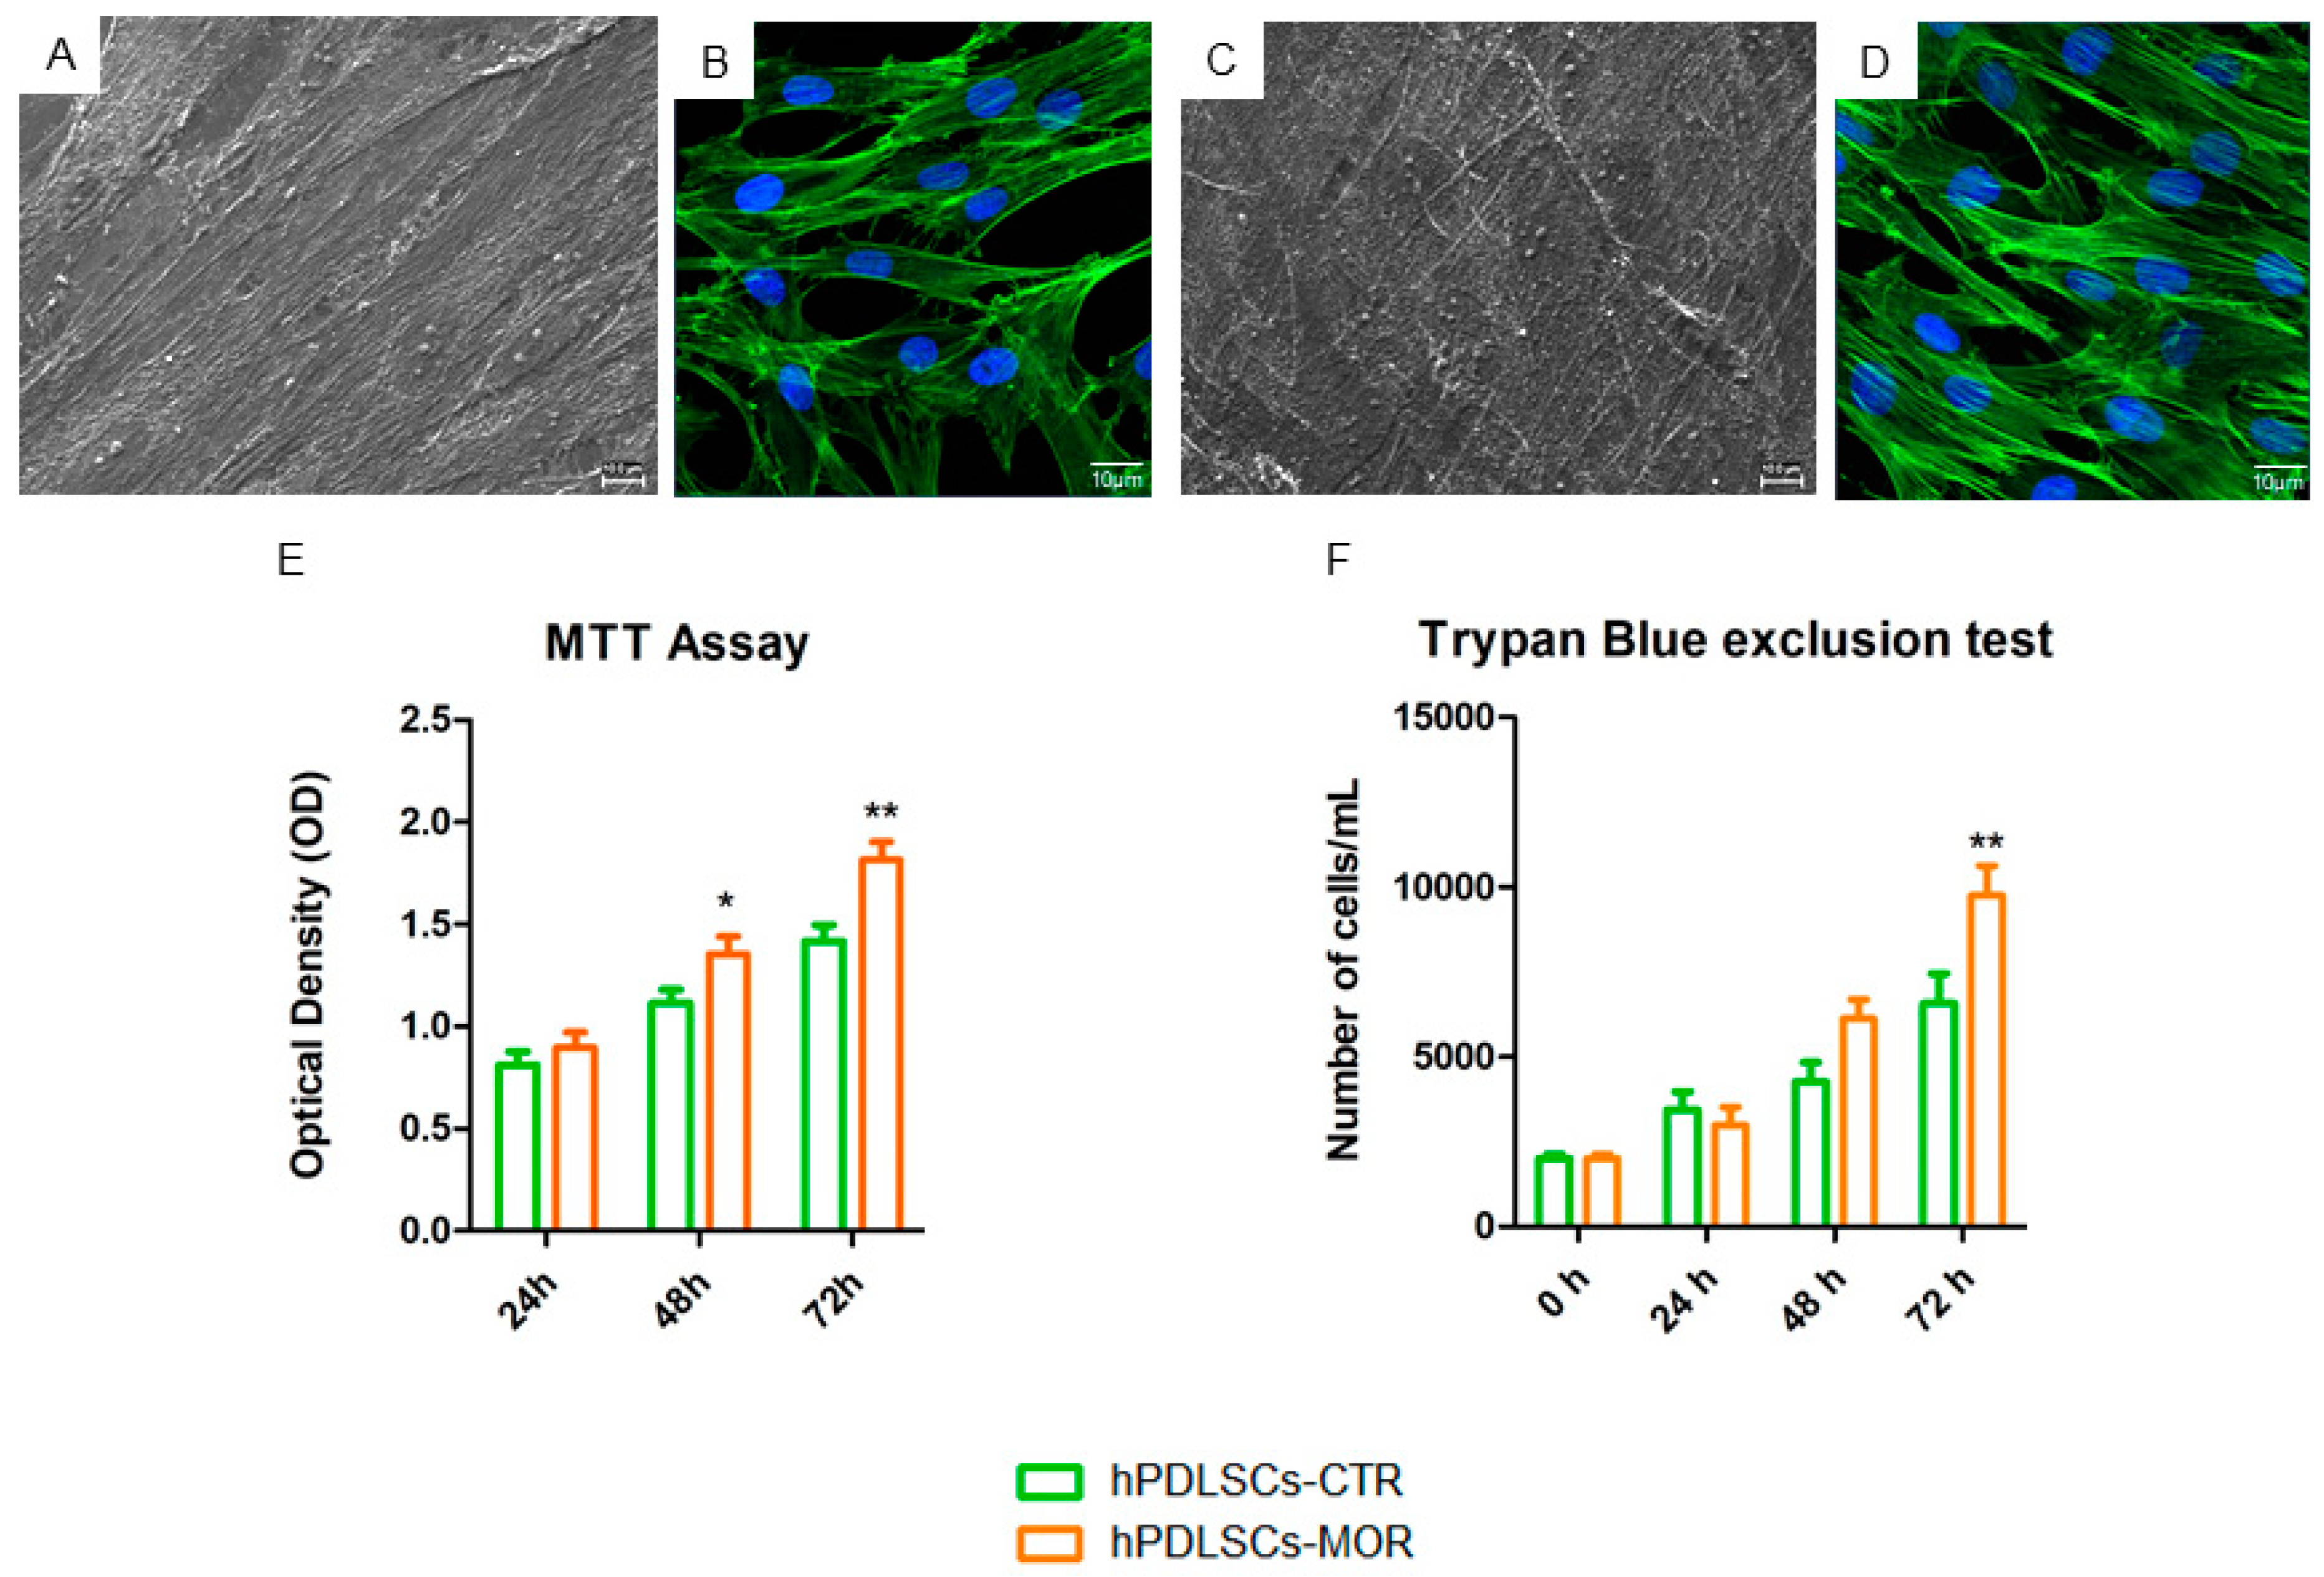
2.1. Morphological Analysis and Proliferation Rate of hPDLSCs-MOR and hPDLSCs-CTR
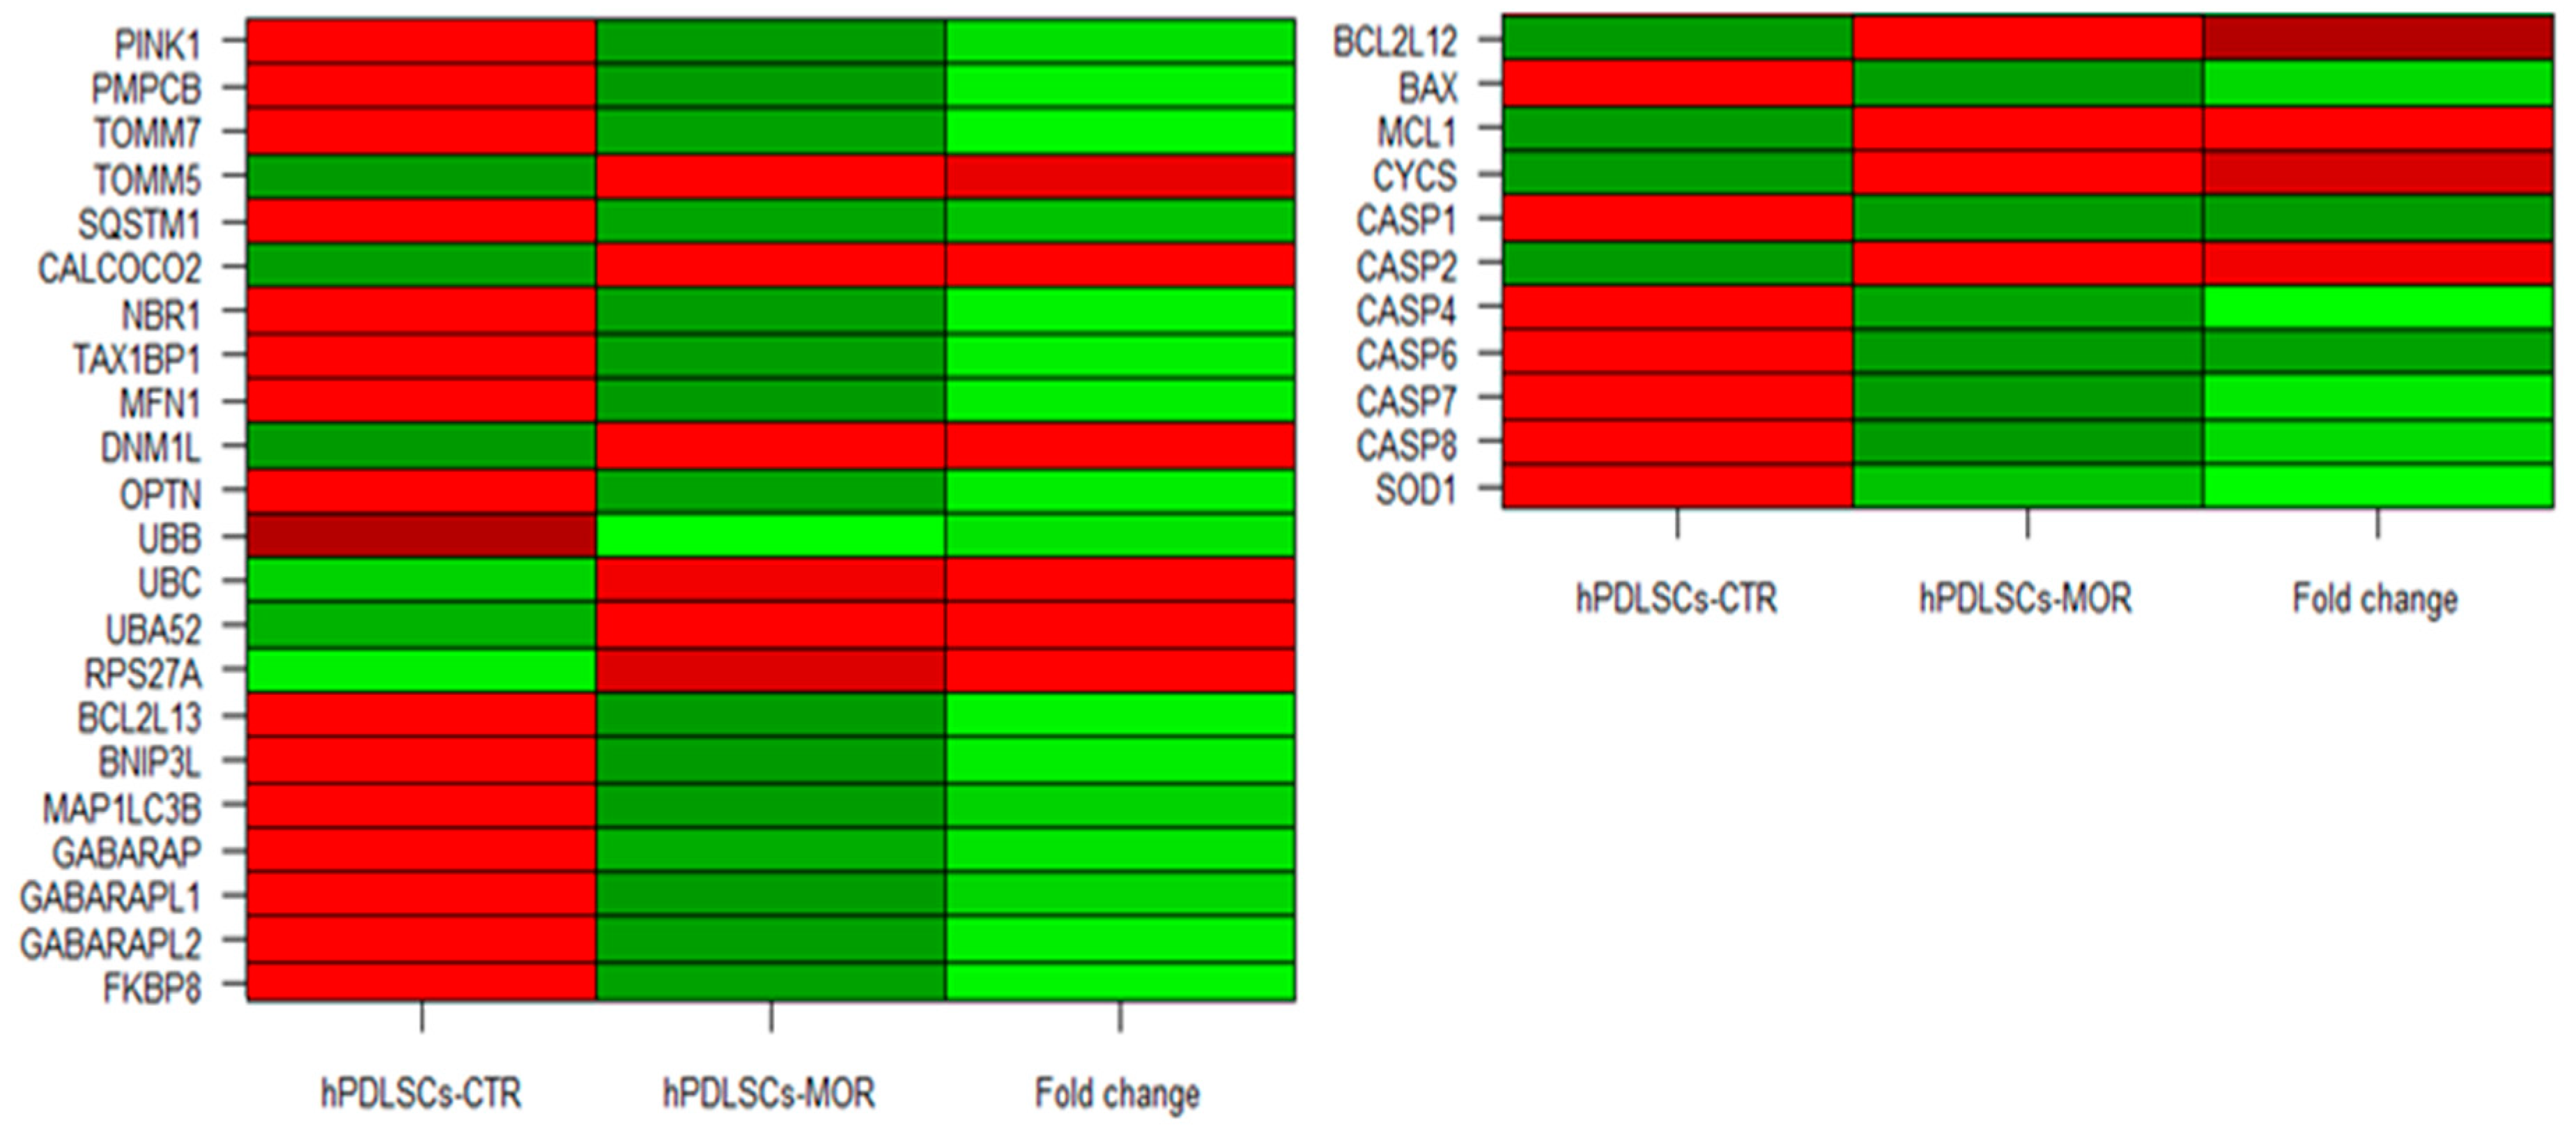
2.2. Transcriptome Investigation of hPDLSCs-MOR and hPDLSCs-CTR
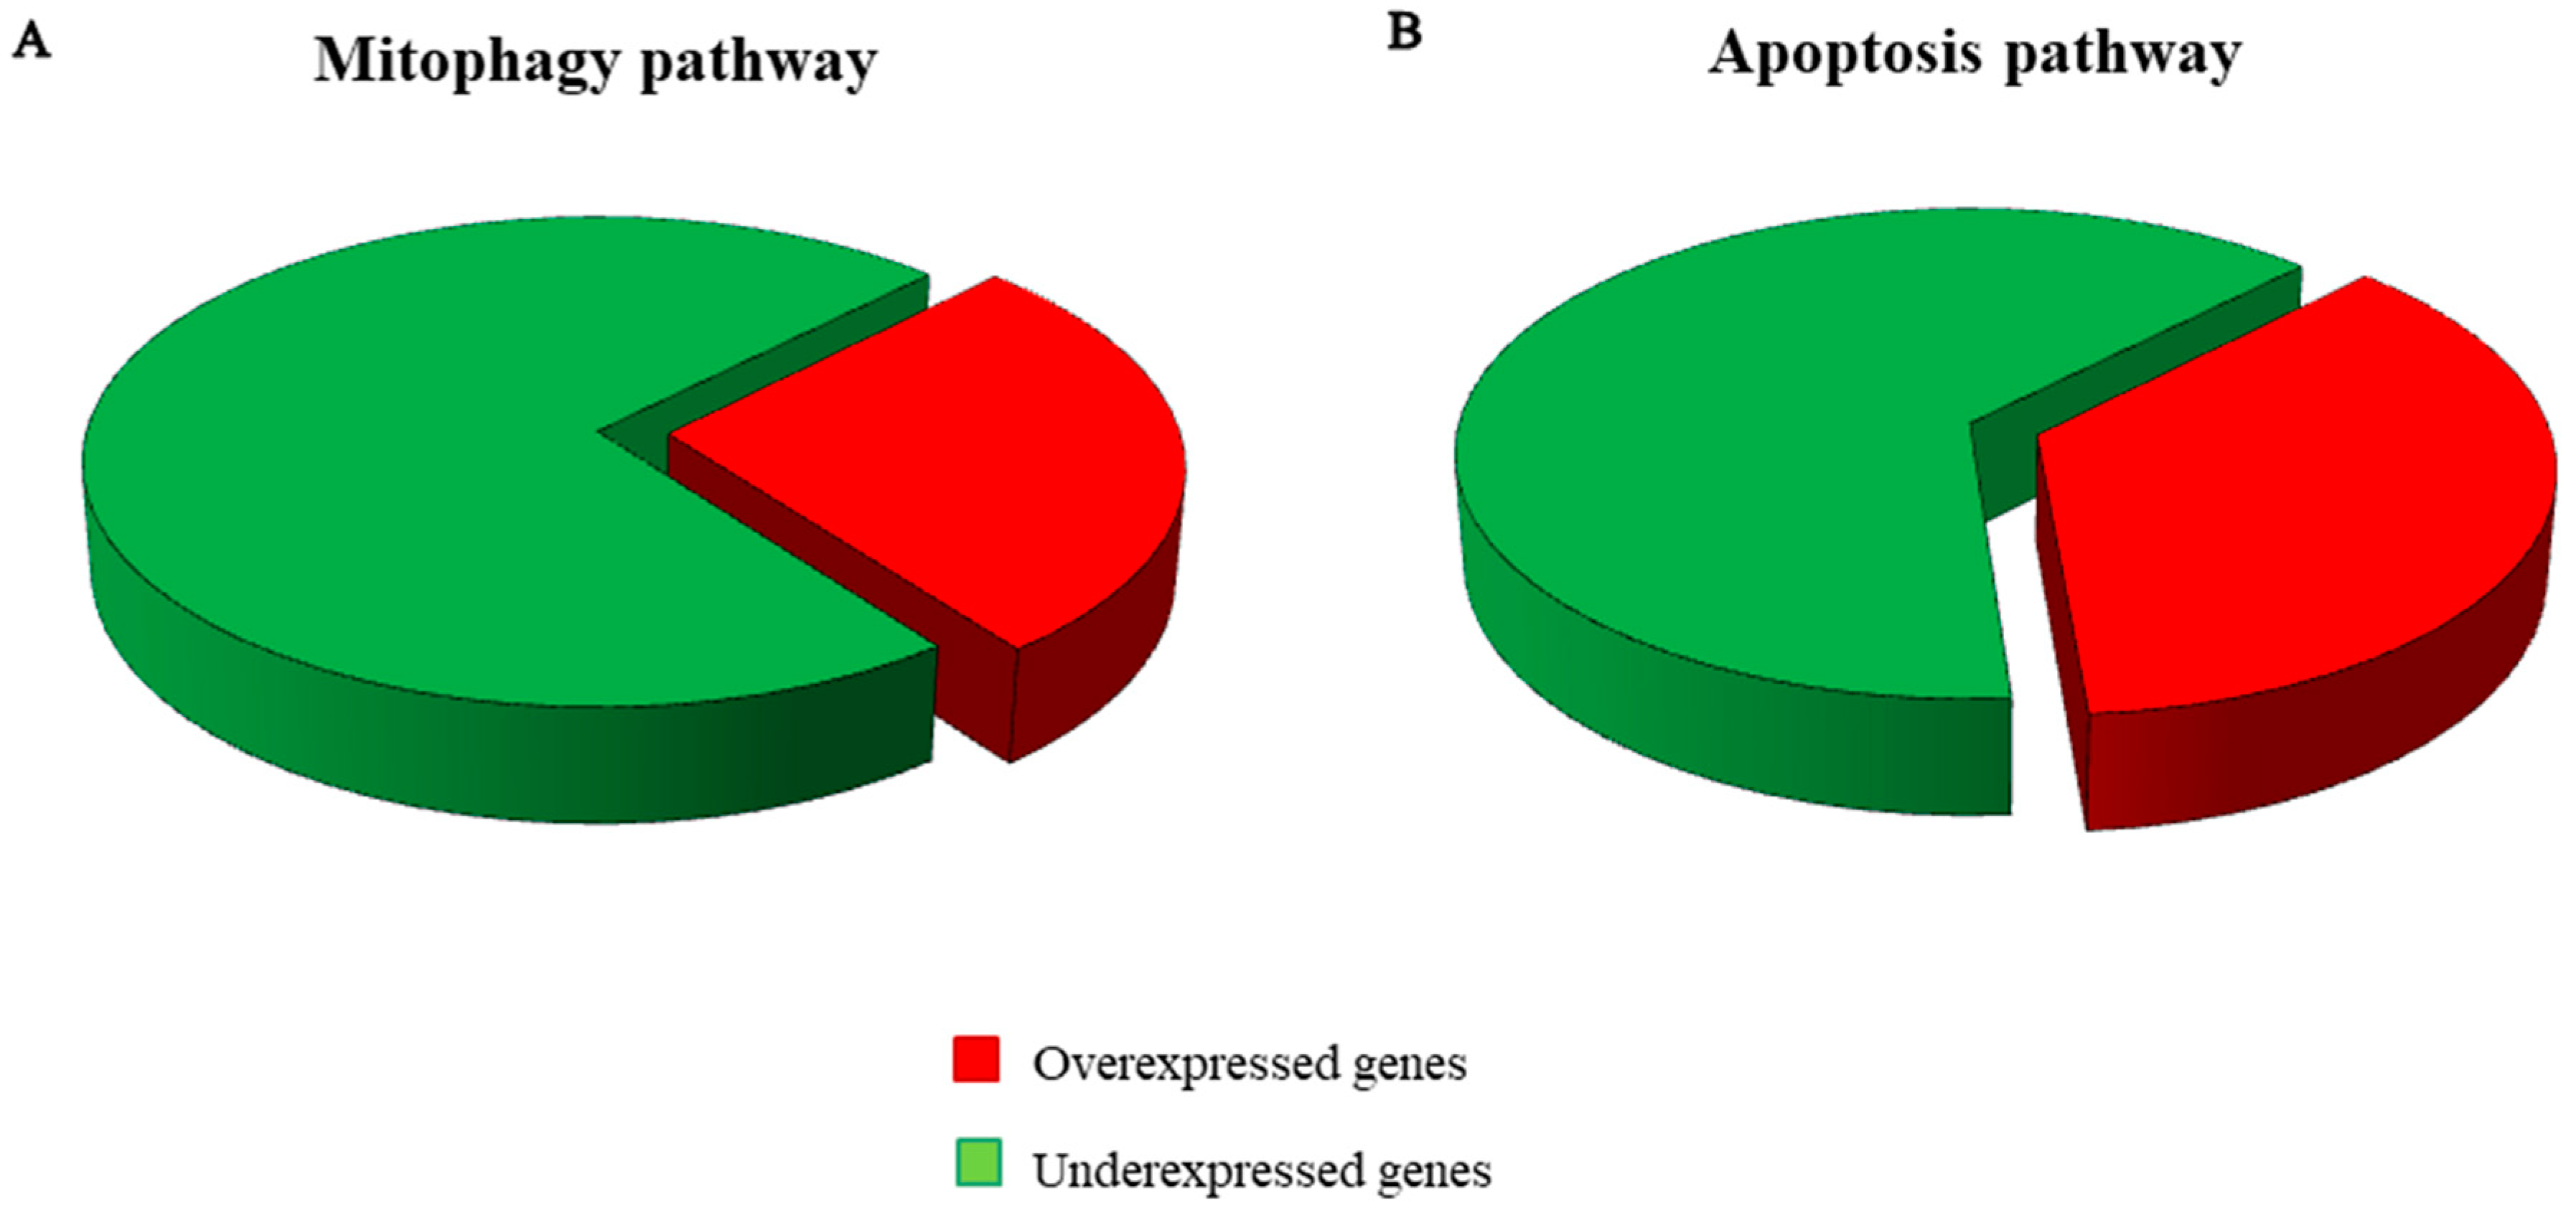
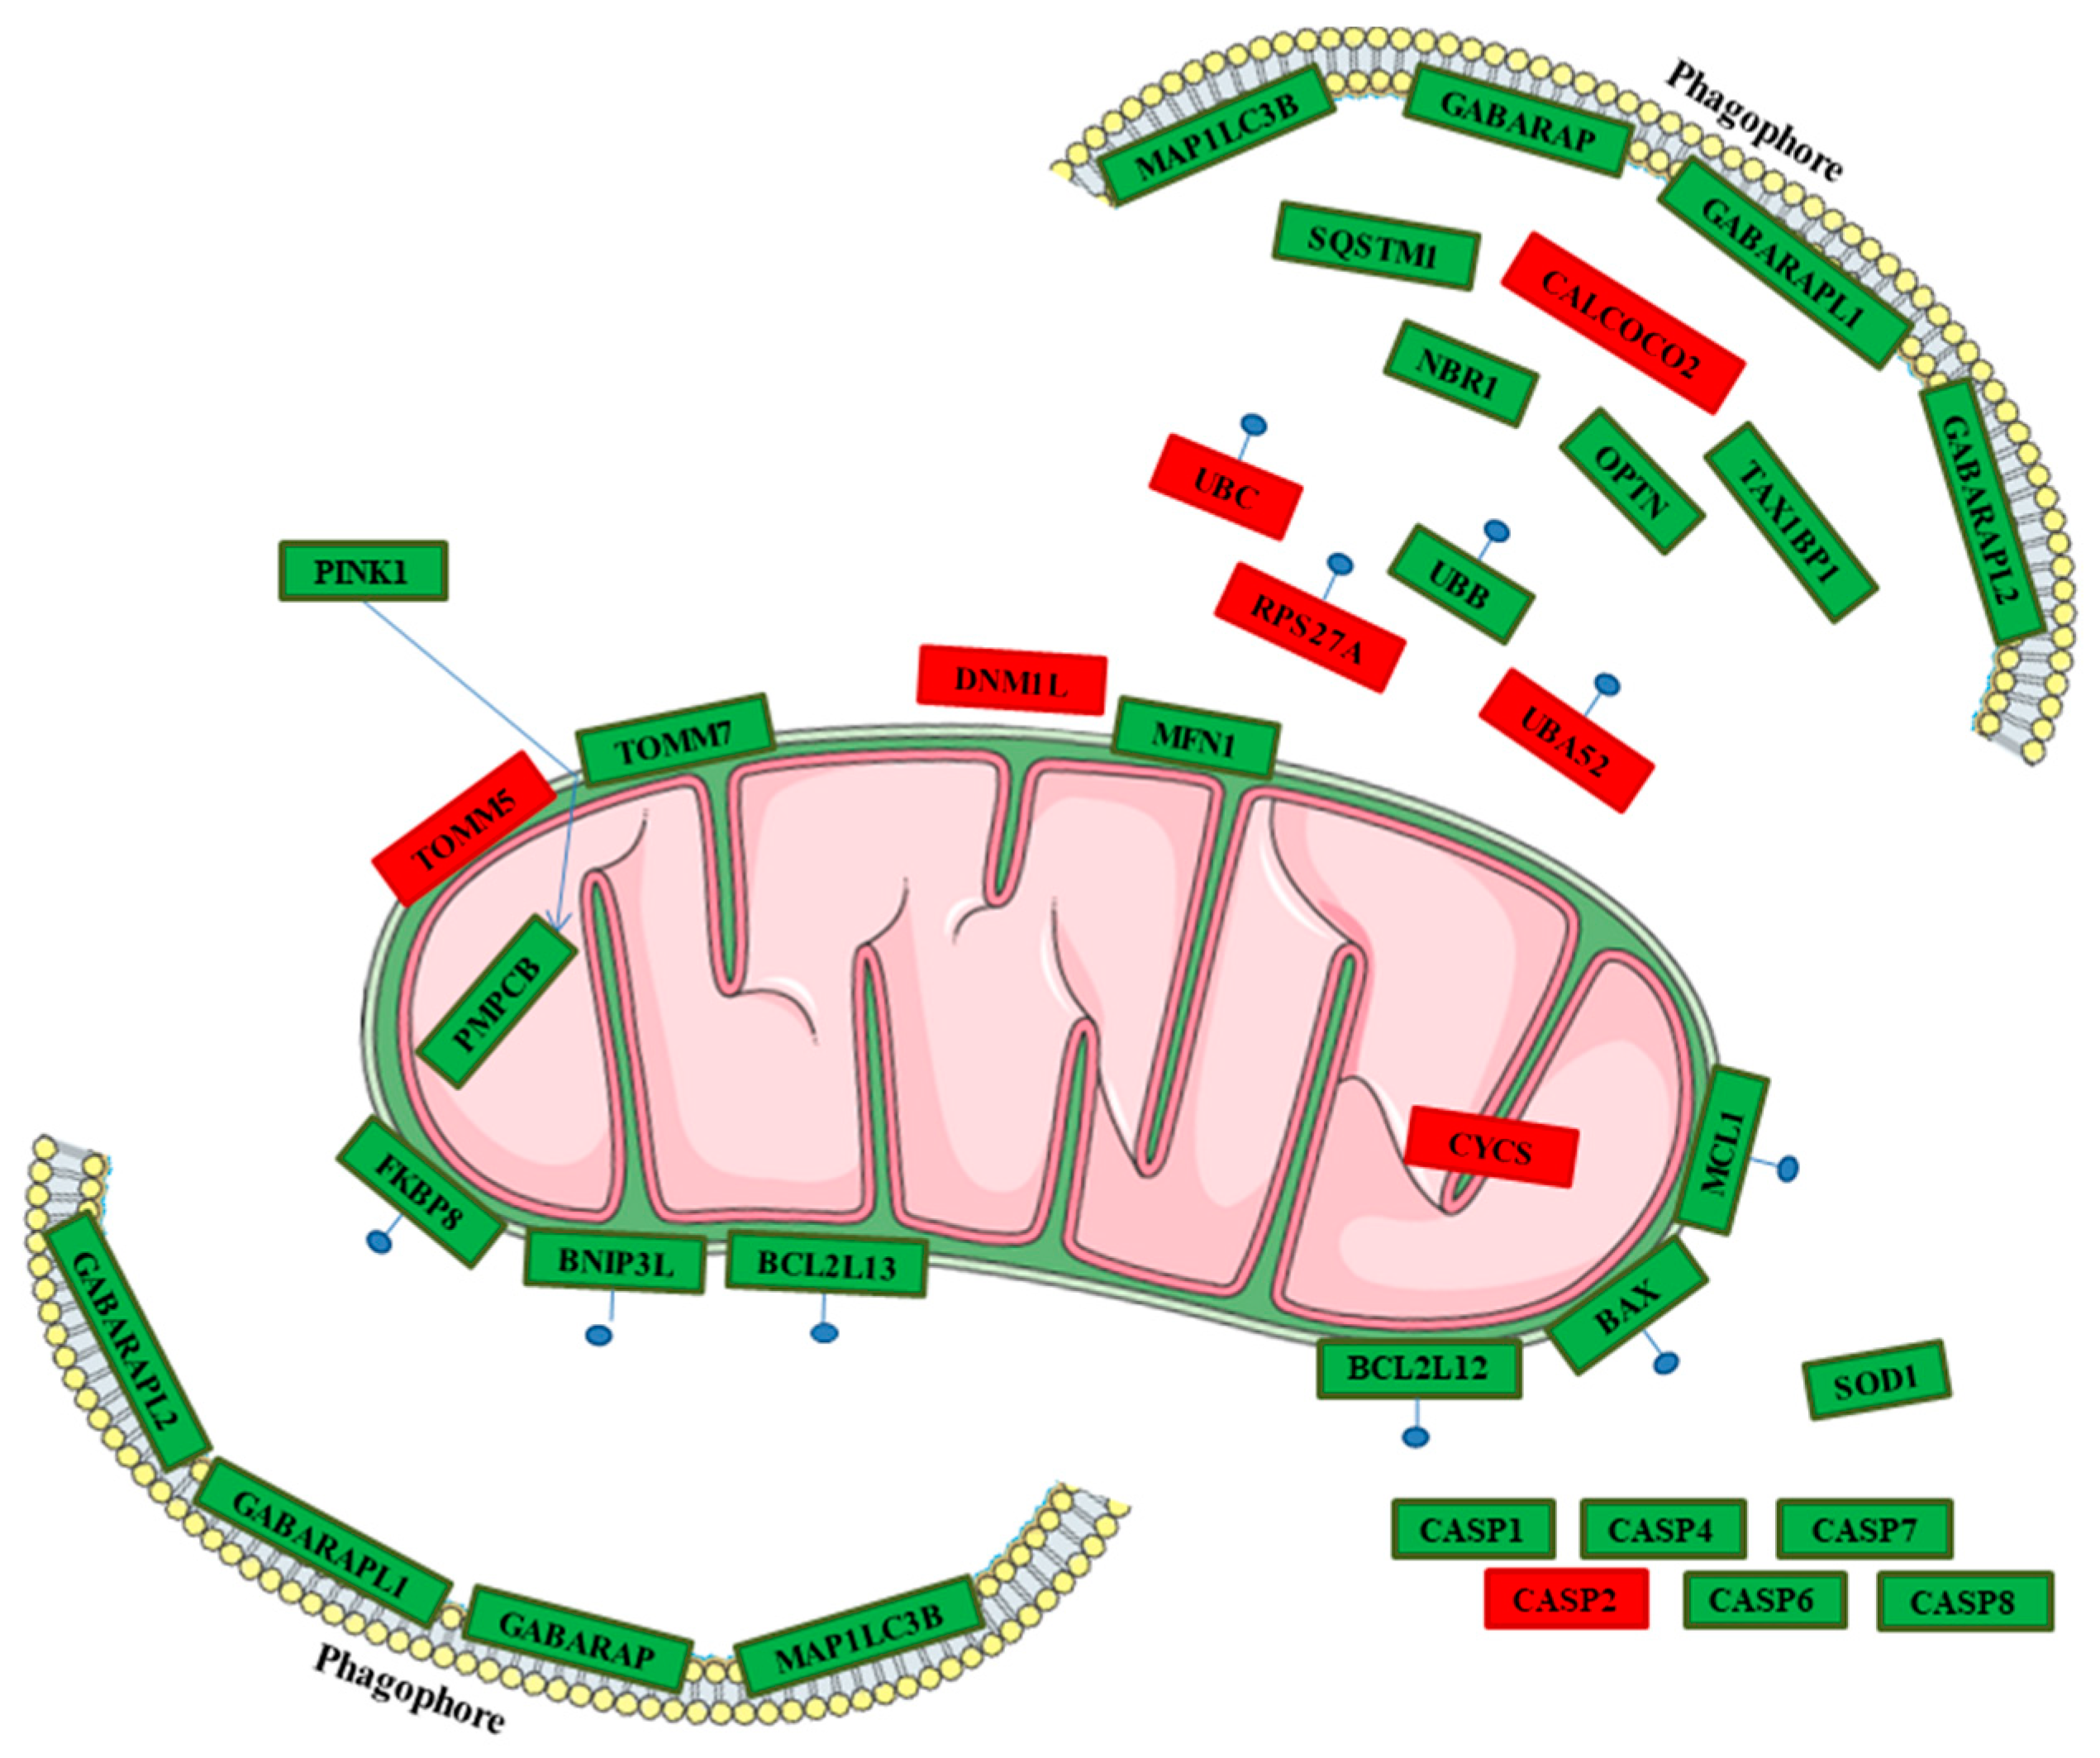
2.3. Genes Pathway Distribution
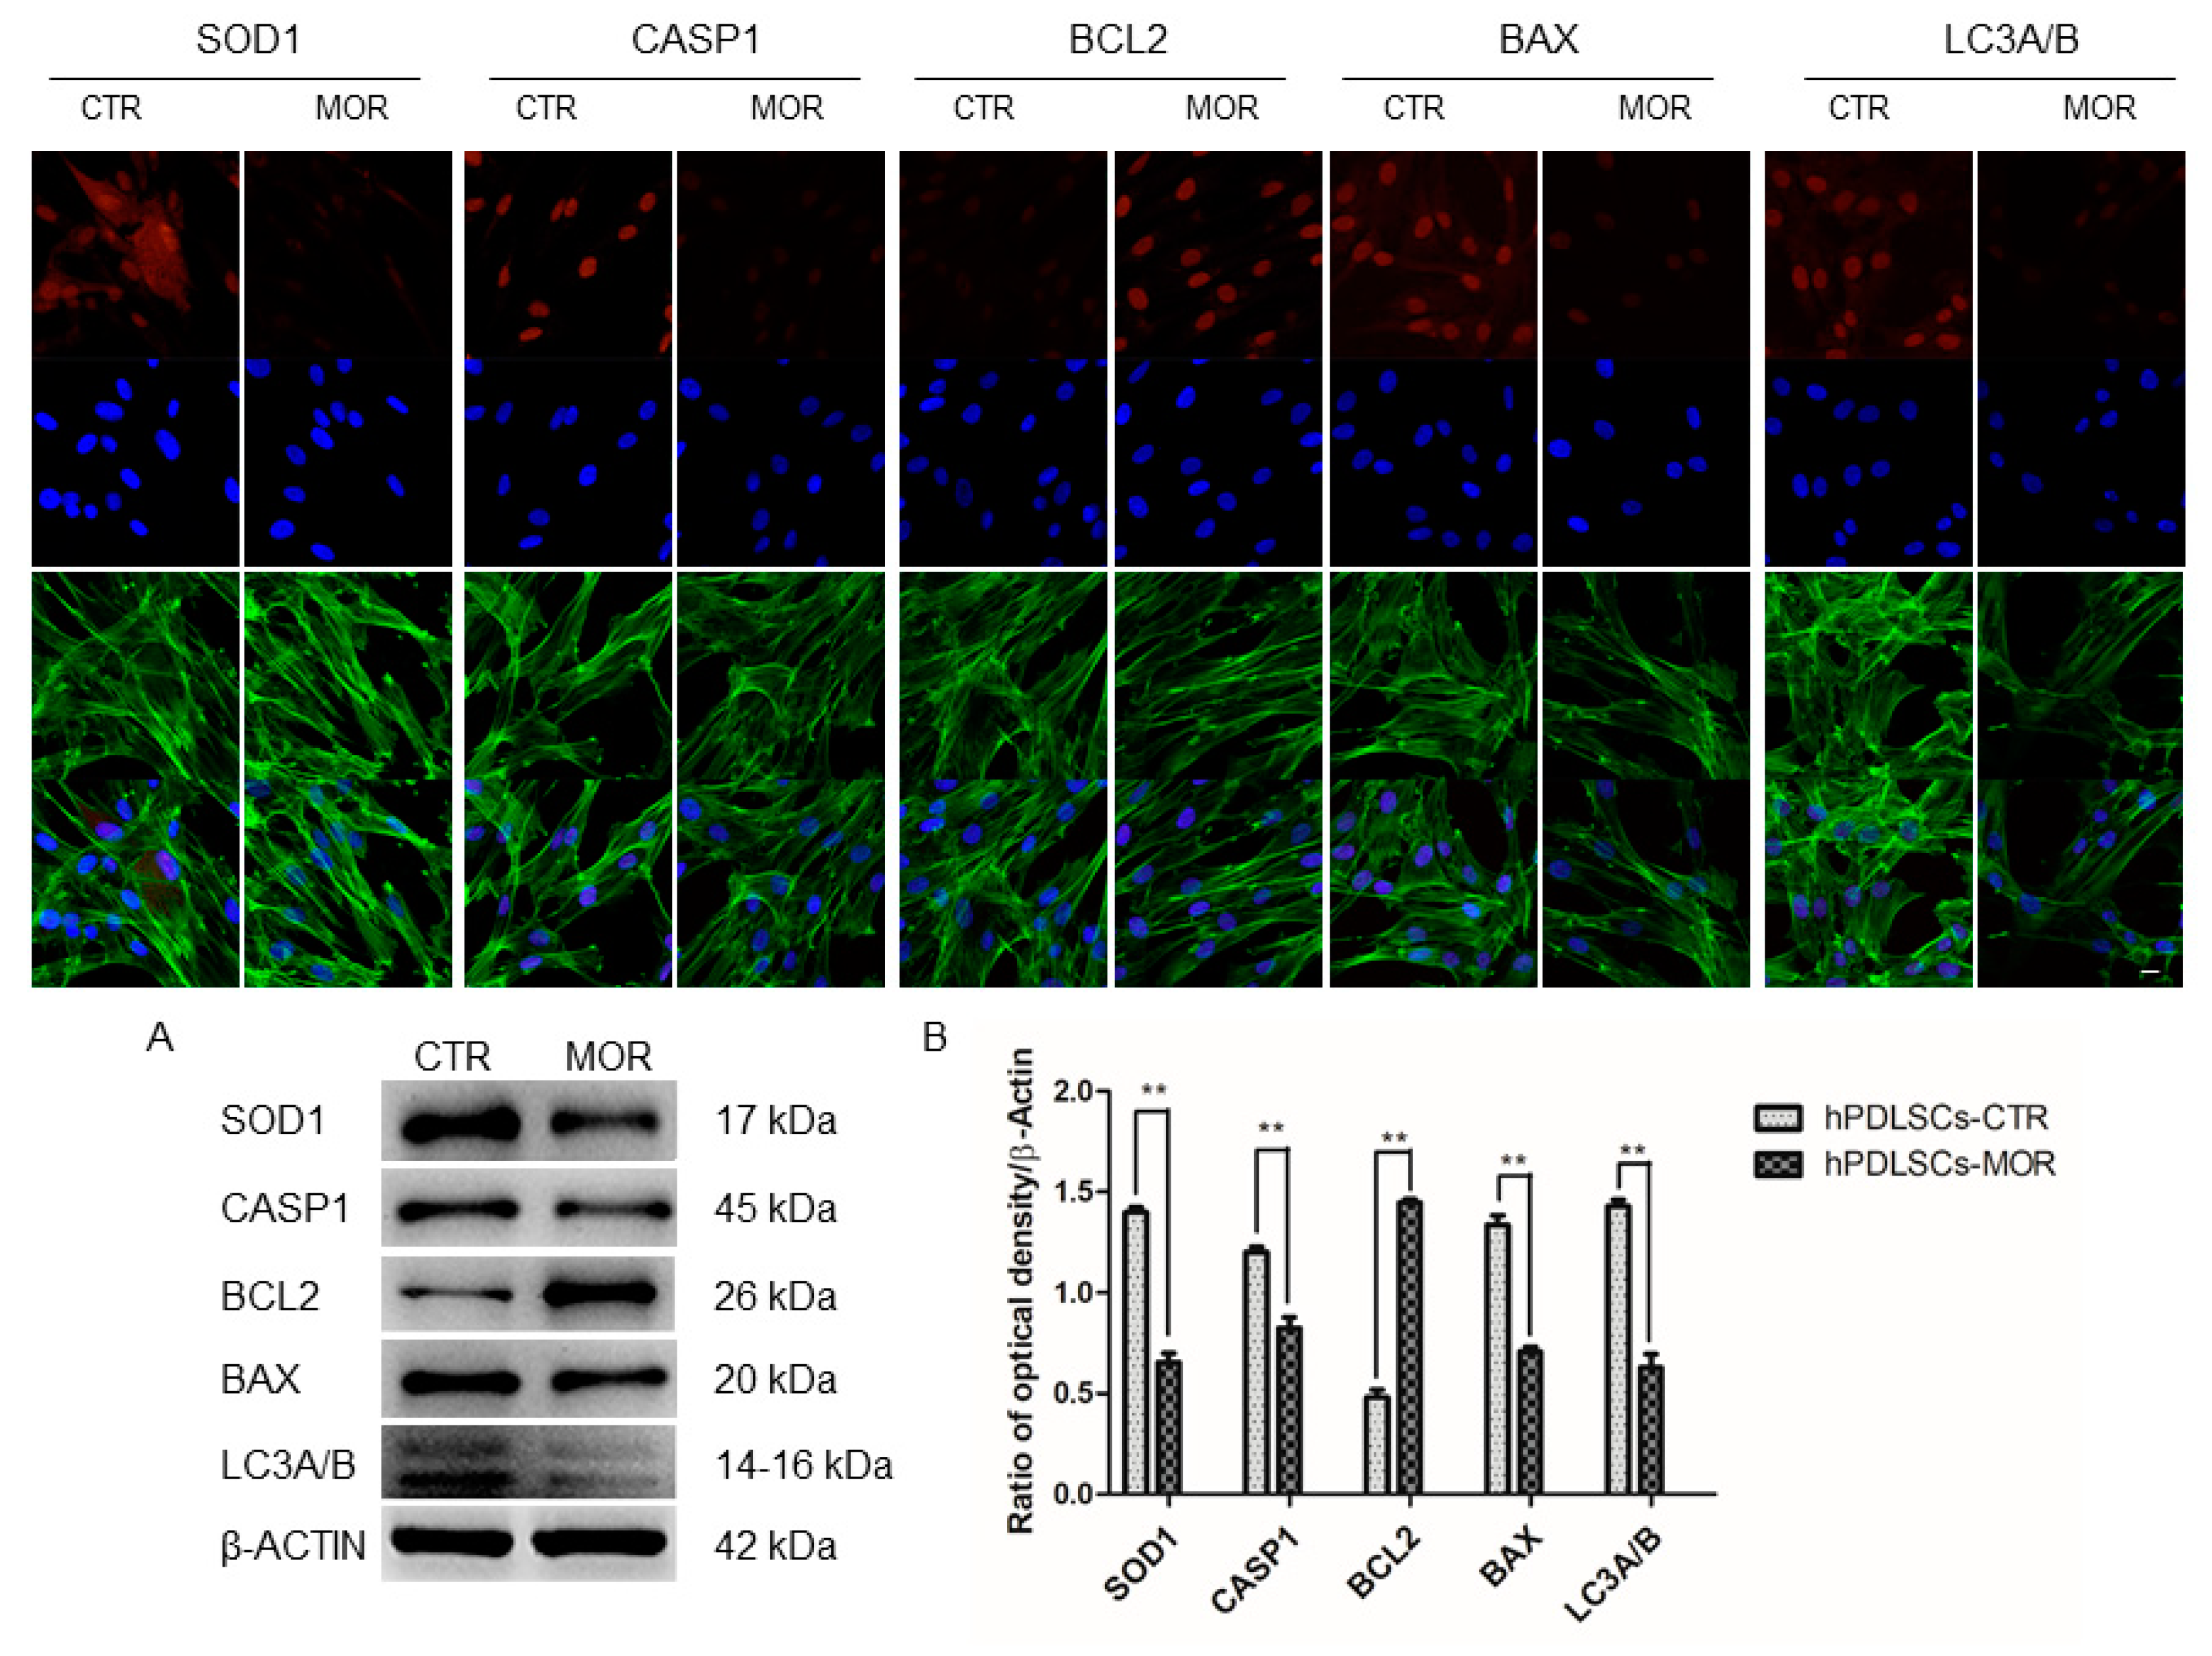
2.4. Moringin Treatment Modulated the Expression of SOD1, CASP1, Bax, Bcl2 and LC3A/B
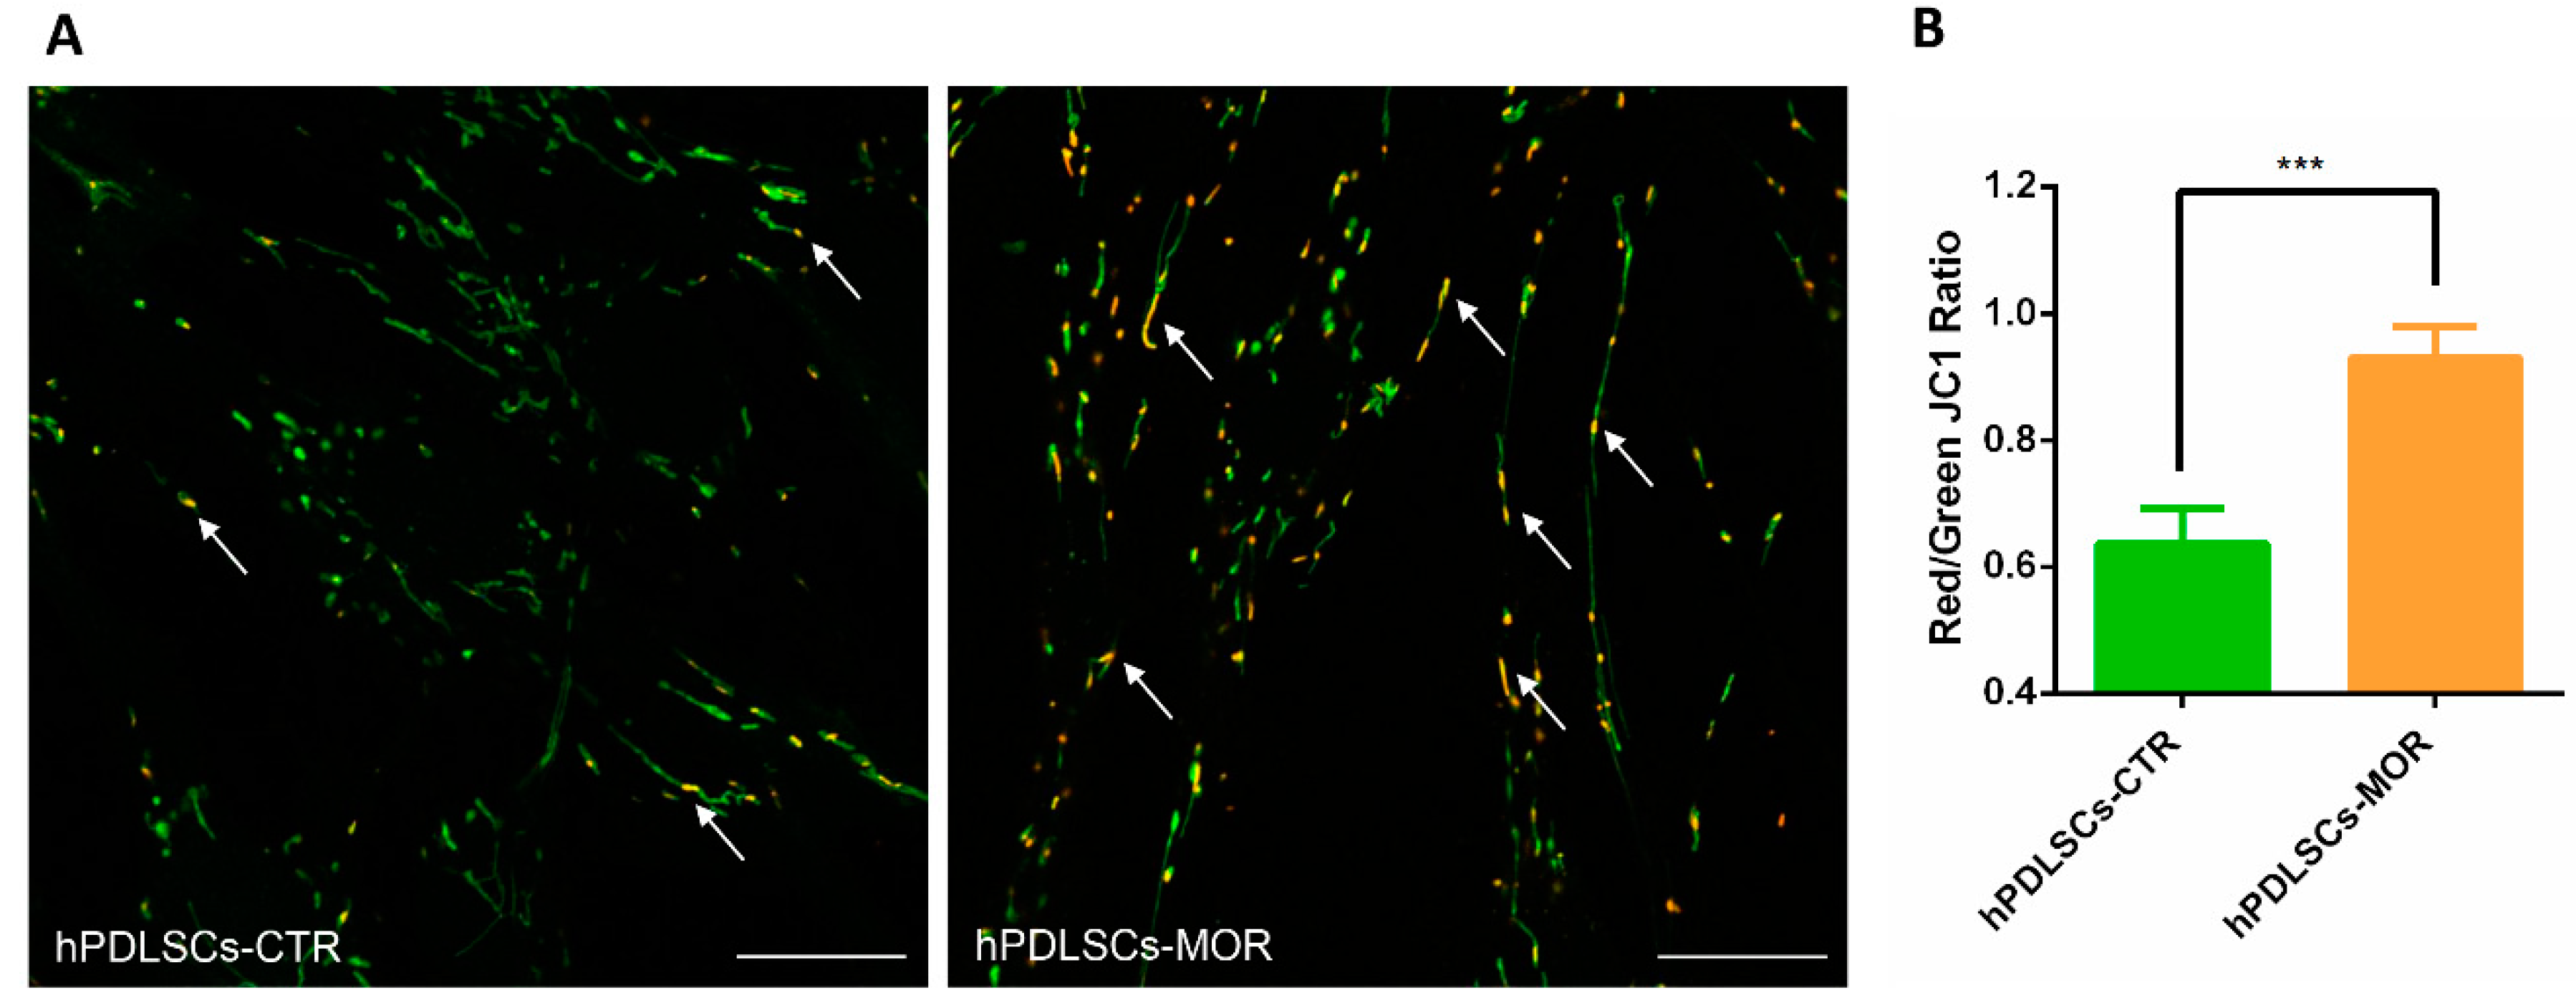
2.5. Mitochondrial Membrane Potential Evaluation
3. Discussion
4. Materials and Methods
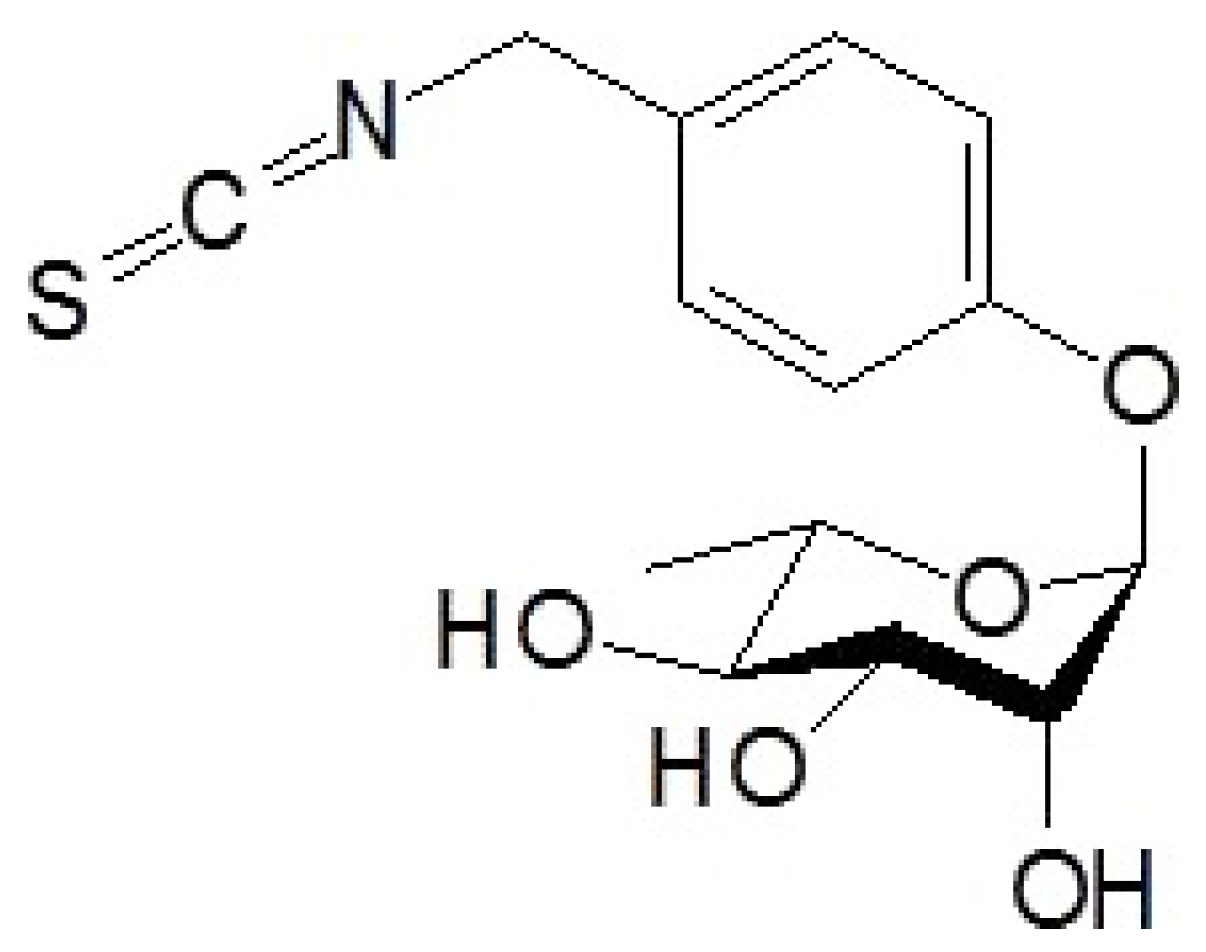
4.1. Purification of Moringin
4.2. Ethic Statement
4.3. Cell Culture and Moringin Pretreatment
4.4. Statistical Analysis
4.5. Total RNA Extraction and cDNA Library Preparation
4.6. Data Processing
4.7. Immunofluorescence Analysis
4.8. Western Blot Analysis
4.9. Measurement of Mitochondrial Membrane Potential
5. Conclusions
Supplementary Materials
Author Contributions
Funding
Acknowledgments
Conflicts of Interest
References
- Fuentes, F.; Paredes-Gonzalez, X.; Kong, A.N. Dietary Glucosinolates Sulforaphane, Phenethyl Isothiocyanate, Indole-3-Carbinol/3,3′-Diindolylmethane: Anti-Oxidative Stress/Inflammation, Nrf2, Epigenetics/Epigenomics and In Vivo Cancer Chemopreventive Efficacy. Curr. Pharmacol. Rep. 2015, 1, 179–196. [Google Scholar] [CrossRef] [PubMed]
- Giacoppo, S.; Galuppo, M.; Montaut, S.; Iori, R.; Rollin, P.; Bramanti, P.; Mazzon, E. An overview on neuroprotective effects of isothiocyanates for the treatment of neurodegenerative diseases. Fitoterapia 2015, 106, 12–21. [Google Scholar] [CrossRef] [PubMed]
- Olson, M.E.; Sankaran, R.P.; Fahey, J.W.; Grusak, M.A.; Odee, D.; Nouman, W. Leaf Protein and Mineral Concentrations across the “Miracle Tree” Genus Moringa. PLoS ONE 2016, 11, e0159782. [Google Scholar] [CrossRef] [PubMed]
- Abdull Razis, A.F.; Ibrahim, M.D.; Kntayya, S.B. Health benefits of Moringa oleifera. Asian Pac. J. Cancer Prev. 2014, 15, 8571–8576. [Google Scholar] [CrossRef] [PubMed]
- Jaafaru, M.S.; Nordin, N.; Shaari, K.; Rosli, R.; Abdull Razis, A.F. Isothiocyanate from Moringa oleifera seeds mitigates hydrogen peroxide-induced cytotoxicity and preserved morphological features of human neuronal cells. PLoS ONE 2018, 13, e0196403. [Google Scholar] [CrossRef]
- Giacoppo, S.; Soundara Rajan, T.; De Nicola, G.R.; Iori, R.; Bramanti, P.; Mazzon, E. Moringin activates Wnt canonical pathway by inhibiting GSK3beta in a mouse model of experimental autoimmune encephalomyelitis. Drug Des. Dev. Ther. 2016, 10, 3291–3304. [Google Scholar] [CrossRef] [PubMed]
- Mammana, S.; Gugliandolo, A.; Cavalli, E.; Diomede, F.; Iori, R.; Zappacosta, R.; Bramanti, P.; Conti, P.; Fontana, A.; Pizzicannella, J.; et al. Human gingival mesenchymal stem cells pretreated with vesicular moringin nanostructures as a new therapeutic approach in a mouse model of spinal cord injury. J. Tissue Eng. Regen. Med. 2019, 13, 1109–1121. [Google Scholar] [CrossRef] [Green Version]
- Romeo, L.; Diomede, F.; Gugliandolo, A.; Scionti, D.; Lo Giudice, F.; Lanza Cariccio, V.; Iori, R.; Bramanti, P.; Trubiani, O.; Mazzon, E. Moringin Induces Neural Differentiation in the Stem Cell of the Human Periodontal Ligament. Sci. Rep. 2018, 8, 9153. [Google Scholar] [CrossRef]
- De Miguel, M.P.; Fuentes-Julian, S.; Blazquez-Martinez, A.; Pascual, C.Y.; Aller, M.A.; Arias, J.; Arnalich-Montiel, F. Immunosuppressive properties of mesenchymal stem cells: Advances and applications. Curr. Mol. Med. 2012, 12, 574–591. [Google Scholar] [CrossRef]
- Pizzicannella, J.; Gugliandolo, A.; Orsini, T.; Fontana, A.; Ventrella, A.; Mazzon, E.; Bramanti, P.; Diomede, F.; Trubiani, O. Engineered Extracellular Vesicles from Human Periodontal-Ligament Stem Cells Increase VEGF/VEGFR2 Expression During Bone Regeneration. Front. Physiol. 2019, 10, 512. [Google Scholar] [CrossRef]
- Huang, G.T.; Gronthos, S.; Shi, S. Mesenchymal stem cells derived from dental tissues vs. those from other sources: Their biology and role in regenerative medicine. J. Dent. Res. 2009, 88, 792–806. [Google Scholar] [CrossRef] [PubMed]
- Dupin, E.; Sommer, L. Neural crest progenitors and stem cells: From early development to adulthood. Dev. Biol. 2012, 366, 83–95. [Google Scholar] [CrossRef] [PubMed] [Green Version]
- Coura, G.S.; Garcez, R.C.; de Aguiar, C.B.; Alvarez-Silva, M.; Magini, R.S.; Trentin, A.G. Human periodontal ligament: A niche of neural crest stem cells. J. Periodontal Res. 2008, 43, 531–536. [Google Scholar] [CrossRef] [PubMed]
- Martens, W.; Bronckaers, A.; Politis, C.; Jacobs, R.; Lambrichts, I. Dental stem cells and their promising role in neural regeneration: An update. Clin. Oral Investig. 2013, 17, 1969–1983. [Google Scholar] [CrossRef] [PubMed]
- Xu, X.; Chen, C.; Akiyama, K.; Chai, Y.; Le, A.D.; Wang, Z.; Shi, S. Gingivae contain neural-crest- and mesoderm-derived mesenchymal stem cells. J. Dent. Res. 2013, 92, 825–832. [Google Scholar] [CrossRef] [PubMed]
- Sakthiswary, R.; Raymond, A.A. Stem cell therapy in neurodegenerative diseases: From principles to practice. Neural Regen. Res. 2012, 7, 1822–1831. [Google Scholar] [CrossRef] [PubMed]
- Trubiani, O.; Giacoppo, S.; Ballerini, P.; Diomede, F.; Piattelli, A.; Bramanti, P.; Mazzon, E. Alternative source of stem cells derived from human periodontal ligament: A new treatment for experimental autoimmune encephalomyelitis. Stem Cell Res. Ther. 2016, 7, 1. [Google Scholar] [CrossRef] [PubMed]
- Moreira, P.I.; Carvalho, C.; Zhu, X.; Smith, M.A.; Perry, G. Mitochondrial dysfunction is a trigger of Alzheimer’s disease pathophysiology. Biochim. Biophys. Acta 2010, 1802, 2–10. [Google Scholar] [CrossRef]
- Cai, Q.; Tammineni, P. Alterations in Mitochondrial Quality Control in Alzheimer’s Disease. Front. Cell. Neurosci. 2016, 10, 24. [Google Scholar] [CrossRef]
- Jenner, P. Oxidative stress as a cause of Parkinson’s disease. Acta Neurol. Scand. Suppl. 1991, 136, 6–15. [Google Scholar] [CrossRef]
- Youle, R.J.; van der Bliek, A.M. Mitochondrial fission, fusion, and stress. Science 2012, 337, 1062–1065. [Google Scholar] [CrossRef] [PubMed]
- Youle, R.J.; Narendra, D.P. Mechanisms of mitophagy. Nat. Rev. Mol. Cell Biol. 2011, 12, 9–14. [Google Scholar] [CrossRef] [PubMed]
- Martinez-Vicente, M. Neuronal Mitophagy in Neurodegenerative Diseases. Front. Mol. Neurosci. 2017, 10, 64. [Google Scholar] [CrossRef] [PubMed] [Green Version]
- Chu, C.T. Mechanisms of selective autophagy and mitophagy: Implications for neurodegenerative diseases. Neurobiol. Dis. 2019, 122, 23–34. [Google Scholar] [CrossRef] [PubMed]
- Matsumine, H.; Saito, M.; Shimoda-Matsubayashi, S.; Tanaka, H.; Ishikawa, A.; Nakagawa-Hattori, Y.; Yokochi, M.; Kobayashi, T.; Igarashi, S.; Takano, H.; et al. Localization of a gene for an autosomal recessive form of juvenile Parkinsonism to chromosome 6q25.2-27. Am. J. Hum. Genet. 1997, 60, 588–596. [Google Scholar] [PubMed]
- Valente, E.M.; Abou-Sleiman, P.M.; Caputo, V.; Muqit, M.M.; Harvey, K.; Gispert, S.; Ali, Z.; Del Turco, D.; Bentivoglio, A.R.; Healy, D.G.; et al. Hereditary early-onset Parkinson’s disease caused by mutations in PINK1. Science 2004, 304, 1158–1160. [Google Scholar] [CrossRef] [PubMed]
- Kitada, T.; Asakawa, S.; Hattori, N.; Matsumine, H.; Yamamura, Y.; Minoshima, S.; Yokochi, M.; Mizuno, Y.; Shimizu, N. Mutations in the parkin gene cause autosomal recessive juvenile parkinsonism. Nature 1998, 392, 605–608. [Google Scholar] [CrossRef]
- Jin, S.M.; Youle, R.J. PINK1- and Parkin-mediated mitophagy at a glance. J. Cell Sci. 2012, 125, 795–799. [Google Scholar] [CrossRef] [Green Version]
- Yamano, K.; Matsuda, N.; Tanaka, K. The ubiquitin signal and autophagy: An orchestrated dance leading to mitochondrial degradation. EMBO Rep. 2016, 17, 300–316. [Google Scholar] [CrossRef]
- Roberts, R.F.; Tang, M.Y.; Fon, E.A.; Durcan, T.M. Defending the mitochondria: The pathways of mitophagy and mitochondrial-derived vesicles. Int. J. Biochem. Cell Biol. 2016, 79, 427–436. [Google Scholar] [CrossRef]
- Riley, J.S.; Tait, S.W. Mechanisms of mitophagy: Putting the powerhouse into the doghouse. Biol. Chem. 2016, 397, 617–635. [Google Scholar] [CrossRef] [PubMed]
- Herhaus, L.; Dikic, I. Expanding the ubiquitin code through post-translational modification. EMBO Rep. 2015, 16, 1071–1083. [Google Scholar] [CrossRef] [PubMed]
- Villa, E.; Marchetti, S.; Ricci, J.E. No Parkin Zone: Mitophagy without Parkin. Trends Cell Biol. 2018, 28, 882–895. [Google Scholar] [CrossRef] [PubMed]
- Bernardini, J.P.; Lazarou, M.; Dewson, G. Parkin and mitophagy in cancer. Oncogene 2017, 36, 1315–1327. [Google Scholar] [CrossRef] [PubMed]
- Durcan, T.M.; Fon, E.A. The three ‘P’s of mitophagy: PARKIN, PINK1, and post-translational modifications. Genes Dev. 2015, 29, 989–999. [Google Scholar] [CrossRef] [PubMed]
- Wei, H.; Liu, L.; Chen, Q. Selective removal of mitochondria via mitophagy: Distinct pathways for different mitochondrial stresses. Biochim. Biophys. Acta 2015, 1853, 2784–2790. [Google Scholar] [CrossRef] [PubMed]
- Williams, J.A.; Ding, W.X. A Mechanistic Review of Mitophagy and Its Role in Protection against Alcoholic Liver Disease. Biomolecules 2015, 5, 2619–2642. [Google Scholar] [CrossRef] [PubMed] [Green Version]
- Cowan, K.; Anichtchik, O.; Luo, S. Mitochondrial integrity in neurodegeneration. CNS Neurosci. Ther. 2019, 25, 825–836. [Google Scholar] [CrossRef] [PubMed] [Green Version]
- Arun, S.; Liu, L.; Donmez, G. Mitochondrial Biology and Neurological Diseases. Curr. Neuropharmacol. 2016, 14, 143–154. [Google Scholar] [CrossRef]
- Bertholet, A.M.; Delerue, T.; Millet, A.M.; Moulis, M.F.; David, C.; Daloyau, M.; Arnaune-Pelloquin, L.; Davezac, N.; Mils, V.; Miquel, M.C.; et al. Mitochondrial fusion/fission dynamics in neurodegeneration and neuronal plasticity. Neurobiol. Dis. 2016, 90, 3–19. [Google Scholar] [CrossRef]
- Wang, D.B.; Kinoshita, C.; Kinoshita, Y.; Morrison, R.S. p53 and mitochondrial function in neurons. Biochim. Biophys. Acta 2014, 1842, 1186–1197. [Google Scholar] [CrossRef] [PubMed] [Green Version]
- Pacini, N.; Borziani, F. Oncostatic-Cytoprotective Effect of Melatonin and Other Bioactive Molecules: A Common Target in Mitochondrial Respiration. Int. J. Mol. Sci. 2016, 17, 341. [Google Scholar] [CrossRef] [PubMed]
- Franco-Iborra, S.; Vila, M.; Perier, C. The Parkinson Disease Mitochondrial Hypothesis: Where Are We at? Neuroscientist 2016, 22, 266–277. [Google Scholar] [CrossRef] [PubMed]
- Joshi, A.U.; Kornfeld, O.S.; Mochly-Rosen, D. The entangled ER-mitochondrial axis as a potential therapeutic strategy in neurodegeneration: A tangled duo unchained. Cell Calcium 2016, 60, 218–234. [Google Scholar] [CrossRef] [PubMed] [Green Version]
- Diomede, F.; Zini, N.; Pizzicannella, J.; Merciaro, I.; Pizzicannella, G.; D’Orazio, M.; Piattelli, A.; Trubiani, O. 5-Aza Exposure Improves Reprogramming Process Through Embryoid Body Formation in Human Gingival Stem Cells. Front. Genet. 2018, 9, 419. [Google Scholar] [CrossRef] [PubMed] [Green Version]
- Pizzicannella, J.; Cavalcanti, M.; Trubiani, O.; Diomede, F. MicroRNA 210 Mediates VEGF Upregulation in Human Periodontal Ligament Stem Cells Cultured on 3DHydroxyapatite Ceramic Scaffold. Int. J. Mol. Sci. 2018, 19, 3916. [Google Scholar] [CrossRef] [PubMed]
- Diomede, F.; Merciaro, I.; Martinotti, S.; Cavalcanti, M.F.; Caputi, S.; Mazzon, E.; Trubiani, O. miR-2861 is involved in osteogenic commitment of human periodontal ligament stem cells grown onto 3D scaffold. J. Biol. Regul. Homeost. Ag. 2016, 30, 1009–1018. [Google Scholar]
- Lanza Cariccio, V.; Scionti, D.; Raffa, A.; Iori, R.; Pollastro, F.; Diomede, F.; Bramanti, P.; Trubiani, O.; Mazzon, E. Treatment of Periodontal Ligament Stem Cells with MOR and CBD Promotes Cell Survival and Neuronal Differentiation via the PI3K/Akt/mTOR Pathway. Int. J. Mol. Sci. 2018, 19, 2341. [Google Scholar] [CrossRef]
- Mishra, P.; Chan, D.C. Mitochondrial dynamics and inheritance during cell division, development and disease. Nat. Rev. Mol. Cell Biol. 2014, 15, 634–646. [Google Scholar] [CrossRef] [Green Version]
- Chen, H.; Detmer, S.A.; Ewald, A.J.; Griffin, E.E.; Fraser, S.E.; Chan, D.C. Mitofusins Mfn1 and Mfn2 coordinately regulate mitochondrial fusion and are essential for embryonic development. J. Cell Biol. 2003, 160, 189–200. [Google Scholar] [CrossRef]
- Wiemerslage, L.; Lee, D. Quantification of mitochondrial morphology in neurites of dopaminergic neurons using multiple parameters. J. Neurosci. Methods 2016, 262, 56–65. [Google Scholar] [CrossRef] [PubMed] [Green Version]
- Arduino, D.M.; Esteves, A.R.; Cardoso, S.M. Mitochondrial fusion/fission, transport and autophagy in Parkinson’s disease: When mitochondria get nasty. Parkinson’s Dis. 2011, 2011, 767230. [Google Scholar] [CrossRef] [PubMed]
- Greene, A.W.; Grenier, K.; Aguileta, M.A.; Muise, S.; Farazifard, R.; Haque, M.E.; McBride, H.M.; Park, D.S.; Fon, E.A. Mitochondrial processing peptidase regulates PINK1 processing, import and Parkin recruitment. EMBO Rep. 2012, 13, 378–385. [Google Scholar] [CrossRef] [PubMed]
- Yamano, K.; Youle, R.J. PINK1 is degraded through the N-end rule pathway. Autophagy 2013, 9, 1758–1769. [Google Scholar] [CrossRef] [PubMed] [Green Version]
- Luciano, P.; Geli, V. The mitochondrial processing peptidase: Function and specificity. Experientia 1996, 52, 1077–1082. [Google Scholar] [CrossRef] [PubMed]
- Pickrell, A.M.; Youle, R.J. The roles of PINK1, parkin, and mitochondrial fidelity in Parkinson’s disease. Neuron 2015, 85, 257–273. [Google Scholar] [CrossRef] [PubMed]
- Deas, E.; Wood, N.W.; Plun-Favreau, H. Mitophagy and Parkinson’s disease: The PINK1-parkin link. Biochim. Biophys. Acta 2011, 1813, 623–633. [Google Scholar] [CrossRef] [PubMed]
- Paschen, S.A.; Neupert, W. Protein import into mitochondria. IUBMB Life 2001, 52, 101–112. [Google Scholar] [CrossRef] [PubMed]
- Hasson, S.A.; Kane, L.A.; Yamano, K.; Huang, C.H.; Sliter, D.A.; Buehler, E.; Wang, C.; Heman-Ackah, S.M.; Hessa, T.; Guha, R.; et al. High-content genome-wide RNAi screens identify regulators of parkin upstream of mitophagy. Nature 2013, 504, 291–295. [Google Scholar] [CrossRef] [PubMed]
- Kang, Y.; Fielden, L.F.; Stojanovski, D. Mitochondrial protein transport in health and disease. Semin. Cell Dev. Biol. 2018, 76, 142–153. [Google Scholar] [CrossRef]
- Feng, J.; Lu, C.; Dai, Q.; Sheng, J.; Xu, M. SIRT3 Facilitates Amniotic Fluid Stem Cells to Repair Diabetic Nephropathy through Protecting Mitochondrial Homeostasis by Modulation of Mitophagy. Cell. Physiol. Biochem. 2018, 46, 1508–1524. [Google Scholar] [CrossRef] [PubMed]
- McKinnon, C.; Tabrizi, S.J. The ubiquitin-proteasome system in neurodegeneration. Antioxid. Redox Signal. 2014, 21, 2302–2321. [Google Scholar] [CrossRef] [PubMed]
- Suresh, B.; Lee, J.; Kim, K.S.; Ramakrishna, S. The Importance of Ubiquitination and Deubiquitination in Cellular Reprogramming. Stem Cells Int. 2016, 2016, 6705927. [Google Scholar] [CrossRef]
- Koyano, F.; Okatsu, K.; Kosako, H.; Tamura, Y.; Go, E.; Kimura, M.; Kimura, Y.; Tsuchiya, H.; Yoshihara, H.; Hirokawa, T.; et al. Ubiquitin is phosphorylated by PINK1 to activate parkin. Nature 2014, 510, 162–166. [Google Scholar] [CrossRef]
- Wild, P.; McEwan, D.G.; Dikic, I. The LC3 interactome at a glance. J. Cell Sci. 2014, 127, 3–9. [Google Scholar] [CrossRef] [Green Version]
- Deng, Z.; Purtell, K.; Lachance, V.; Wold, M.S.; Chen, S.; Yue, Z. Autophagy Receptors and Neurodegenerative Diseases. Trends Cell Biol. 2017, 27, 491–504. [Google Scholar] [CrossRef] [Green Version]
- Ito, Y.; Ofengeim, D.; Najafov, A.; Das, S.; Saberi, S.; Li, Y.; Hitomi, J.; Zhu, H.; Chen, H.; Mayo, L.; et al. RIPK1 mediates axonal degeneration by promoting inflammation and necroptosis in ALS. Science 2016, 353, 603–608. [Google Scholar] [CrossRef] [PubMed] [Green Version]
- Birgisdottir, A.B.; Lamark, T.; Johansen, T. The LIR motif—Crucial for selective autophagy. J. Cell Sci. 2013, 126, 3237–3247. [Google Scholar] [CrossRef]
- Yamaguchi, O.; Murakawa, T.; Nishida, K.; Otsu, K. Receptor-mediated mitophagy. J. Mol. Cell. Cardiol. 2016, 95, 50–56. [Google Scholar] [CrossRef] [Green Version]
- Vigie, P.; Camougrand, N. Role of mitophagy in the mitochondrial quality control. Med. Sci. 2017, 33, 231–237. [Google Scholar] [CrossRef]
- Yoo, S.M.; Jung, Y.K. A Molecular Approach to Mitophagy and Mitochondrial Dynamics. Mol. Cells 2018, 41, 18–26. [Google Scholar] [CrossRef] [PubMed]
- Schaaf, M.B.; Keulers, T.G.; Vooijs, M.A.; Rouschop, K.M. LC3/GABARAP family proteins: Autophagy-(un)related functions. FASEB J. 2016, 30, 3961–3978. [Google Scholar] [CrossRef] [PubMed]
- Wang, C.H.; Wu, S.B.; Wu, Y.T.; Wei, Y.H. Oxidative stress response elicited by mitochondrial dysfunction: Implication in the pathophysiology of aging. Exp. Biol. Med. 2013, 238, 450–460. [Google Scholar] [CrossRef] [PubMed]
- Scherz-Shouval, R.; Elazar, Z. Regulation of autophagy by ROS: Physiology and pathology. Trends Biochem. Sci. 2011, 36, 30–38. [Google Scholar] [CrossRef] [PubMed]
- Goodsell, D.S. The molecular perspective: Caspases. Oncologist 2000, 5, 435–436. [Google Scholar] [CrossRef] [PubMed]
- Edlich, F. BCL-2 proteins and apoptosis: Recent insights and unknowns. Biochem. Biophys. Res. Commun. 2018, 500, 26–34. [Google Scholar] [CrossRef] [PubMed]
- Pena-Blanco, A.; Garcia-Saez, A.J. Bax, Bak and beyond—Mitochondrial performance in apoptosis. FEBS J. 2018, 285, 416–431. [Google Scholar] [CrossRef]
- Fan, P.; Xie, X.H.; Chen, C.H.; Peng, X.; Zhang, P.; Yang, C.; Wang, Y.T. Molecular Regulation Mechanisms and Interactions Between Reactive Oxygen Species and Mitophagy. DNA Cell Biol. 2019, 38, 10–22. [Google Scholar] [CrossRef]
- An, H.J.; Shin, H.; Jo, S.G.; Kim, Y.J.; Lee, J.O.; Paik, S.G.; Lee, H. The survival effect of mitochondrial Higd-1a is associated with suppression of cytochrome C release and prevention of caspase activation. Biochim. Biophys. Acta 2011, 1813, 2088–2098. [Google Scholar] [CrossRef] [Green Version]
- Zandian, A.; Wingard, L.; Nilsson, H.; Sjostedt, E.; Johansson, D.X.; Just, D.; Hellstrom, C.; Uhlen, M.; Schwenk, J.M.; Haggmark-Manberg, A.; et al. Untargeted screening for novel autoantibodies with prognostic value in first-episode psychosis. Transl. Psychiatry 2017, 7, e1177. [Google Scholar] [CrossRef]
- Stepanov, G.A.; Filippova, J.A.; Komissarov, A.B.; Kuligina, E.V.; Richter, V.A.; Semenov, D.V. Regulatory role of small nucleolar RNAs in human diseases. BioMed Res. Int. 2015, 2015, 206849. [Google Scholar] [CrossRef] [PubMed]
- Ebadi, M.; Sharma, S. Metallothioneins 1 and 2 attenuate peroxynitrite-induced oxidative stress in Parkinson disease. Exp. Biol. Med. 2006, 231, 1576–1583. [Google Scholar] [CrossRef] [PubMed]
- Muller, C.; van Loon, J.; Ruschioni, S.; De Nicola, G.R.; Olsen, C.E.; Iori, R.; Agerbirk, N. Taste detection of the non-volatile isothiocyanate moringin results in deterrence to glucosinolate-adapted insect larvae. Phytochemistry 2015, 118, 139–148. [Google Scholar] [CrossRef] [PubMed]
- Brunelli, D.; Tavecchio, M.; Falcioni, C.; Frapolli, R.; Erba, E.; Iori, R.; Rollin, P.; Barillari, J.; Manzotti, C.; Morazzoni, P.; et al. The isothiocyanate produced from glucomoringin inhibits NF-kB and reduces myeloma growth in nude mice in vivo. Biochem. Pharmacol. 2010, 79, 1141–1148. [Google Scholar] [CrossRef] [PubMed] [Green Version]
- Pizzicannella, J.; Diomede, F.; Merciaro, I.; Caputi, S.; Tartaro, A.; Guarnieri, S.; Trubiani, O. Endothelial committed oral stem cells as modelling in the relationship between periodontal and cardiovascular disease. J. Cell. Physiol. 2018, 233, 6734–6747. [Google Scholar] [CrossRef] [PubMed]
- Rajan, T.S.; Scionti, D.; Diomede, F.; Grassi, G.; Pollastro, F.; Piattelli, A.; Cocco, L.; Bramanti, P.; Mazzon, E.; Trubiani, O. Gingival Stromal Cells as an In Vitro Model: Cannabidiol Modulates Genes Linked With Amyotrophic Lateral Sclerosis. J. Cell. Biochem. 2017, 118, 819–828. [Google Scholar] [CrossRef] [PubMed]
- Gugliandolo, A.; Diomede, F.; Cardelli, P.; Bramanti, A.; Scionti, D.; Bramanti, P.; Trubiani, O.; Mazzon, E. Transcriptomic analysis of gingival mesenchymal stem cells cultured on 3D bioprinted scaffold: A promising strategy for neuroregeneration. J. Biomed. Mater. Res. Part A 2018, 106, 126–137. [Google Scholar] [CrossRef] [PubMed]
- Trubiani, O.; Ballerini, P.; Murmura, G.; Pizzicannella, J.; Giuliani, P.; Buccella, S.; Caputi, S. Toll-Like Receptor 4 Expression, Interleukin-6,-8 and Ccl-20 Release, and Nf-Kb Translocation in Human Periodontal Ligament Mesenchymal Stem Cells Stimulated with Lps-P-Gingivalis. Eur. J. Inflamm. 2012, 10, 81–89. [Google Scholar] [CrossRef]
- Diomede, F.; Gugliandolo, A.; Scionti, D.; Merciaro, I.; Cavalcanti, M.F.; Mazzon, E.; Trubiani, O. Biotherapeutic Effect of Gingival Stem Cells Conditioned Medium in Bone Tissue Restoration. Int. J. Mol. Sci. 2018, 19, 329. [Google Scholar] [CrossRef]
- Cavalcanti, M.F.; Maria, D.A.; de Isla, N.; Leal-Junior, E.C.; Joensen, J.; Bjordal, J.M.; Lopes-Martins, R.A.; Diomede, F.; Trubiani, O.; Frigo, L. Evaluation of the Proliferative Effects Induced by Low-Level Laser Therapy in Bone Marrow Stem Cell Culture. Photomed. Laser Surg. 2015, 33, 610–616. [Google Scholar] [CrossRef]
- Trubiani, O.; Toniato, E.; Di Iorio, D.; Diomede, F.; Merciaro, I.; C, D.A.; Caputi, S. Morphological analysis and interleukin release in human gingival fibroblasts seeded on different denture base acrylic resins. International journal of immunopathology and pharmacology 2012, 25, 637–643. [Google Scholar] [CrossRef] [PubMed]
- Giacoppo, S.; Thangavelu, S.R.; Diomede, F.; Bramanti, P.; Conti, P.; Trubiani, O.; Mazzon, E. Anti-inflammatory effects of hypoxia-preconditioned human periodontal ligament cell secretome in an experimental model of multiple sclerosis: A key role of IL-37. FASEB J. 2017, 31, 5592–5608. [Google Scholar] [CrossRef] [PubMed]
- Perelman, A.; Wachtel, C.; Cohen, M.; Haupt, S.; Shapiro, H.; Tzur, A. JC-1: Alternative excitation wavelengths facilitate mitochondrial membrane potential cytometry. Cell Death Dis. 2012, 3, e430. [Google Scholar] [CrossRef] [PubMed]
- Schindelin, J.; Arganda-Carreras, I.; Frise, E.; Kaynig, V.; Longair, M.; Pietzsch, T.; Preibisch, S.; Rueden, C.; Saalfeld, S.; Schmid, B.; et al. Fiji: An open-source platform for biological-image analysis. Nat. Methods 2012, 9, 676–682. [Google Scholar] [CrossRef] [PubMed]
Sample Availability: Samples of the compounds are not available from the authors. |


| Genes | hPDLSCs-CTR | hPDLSCs-MOR | Fold Change | Q-Value | Protein | Source |
|---|---|---|---|---|---|---|
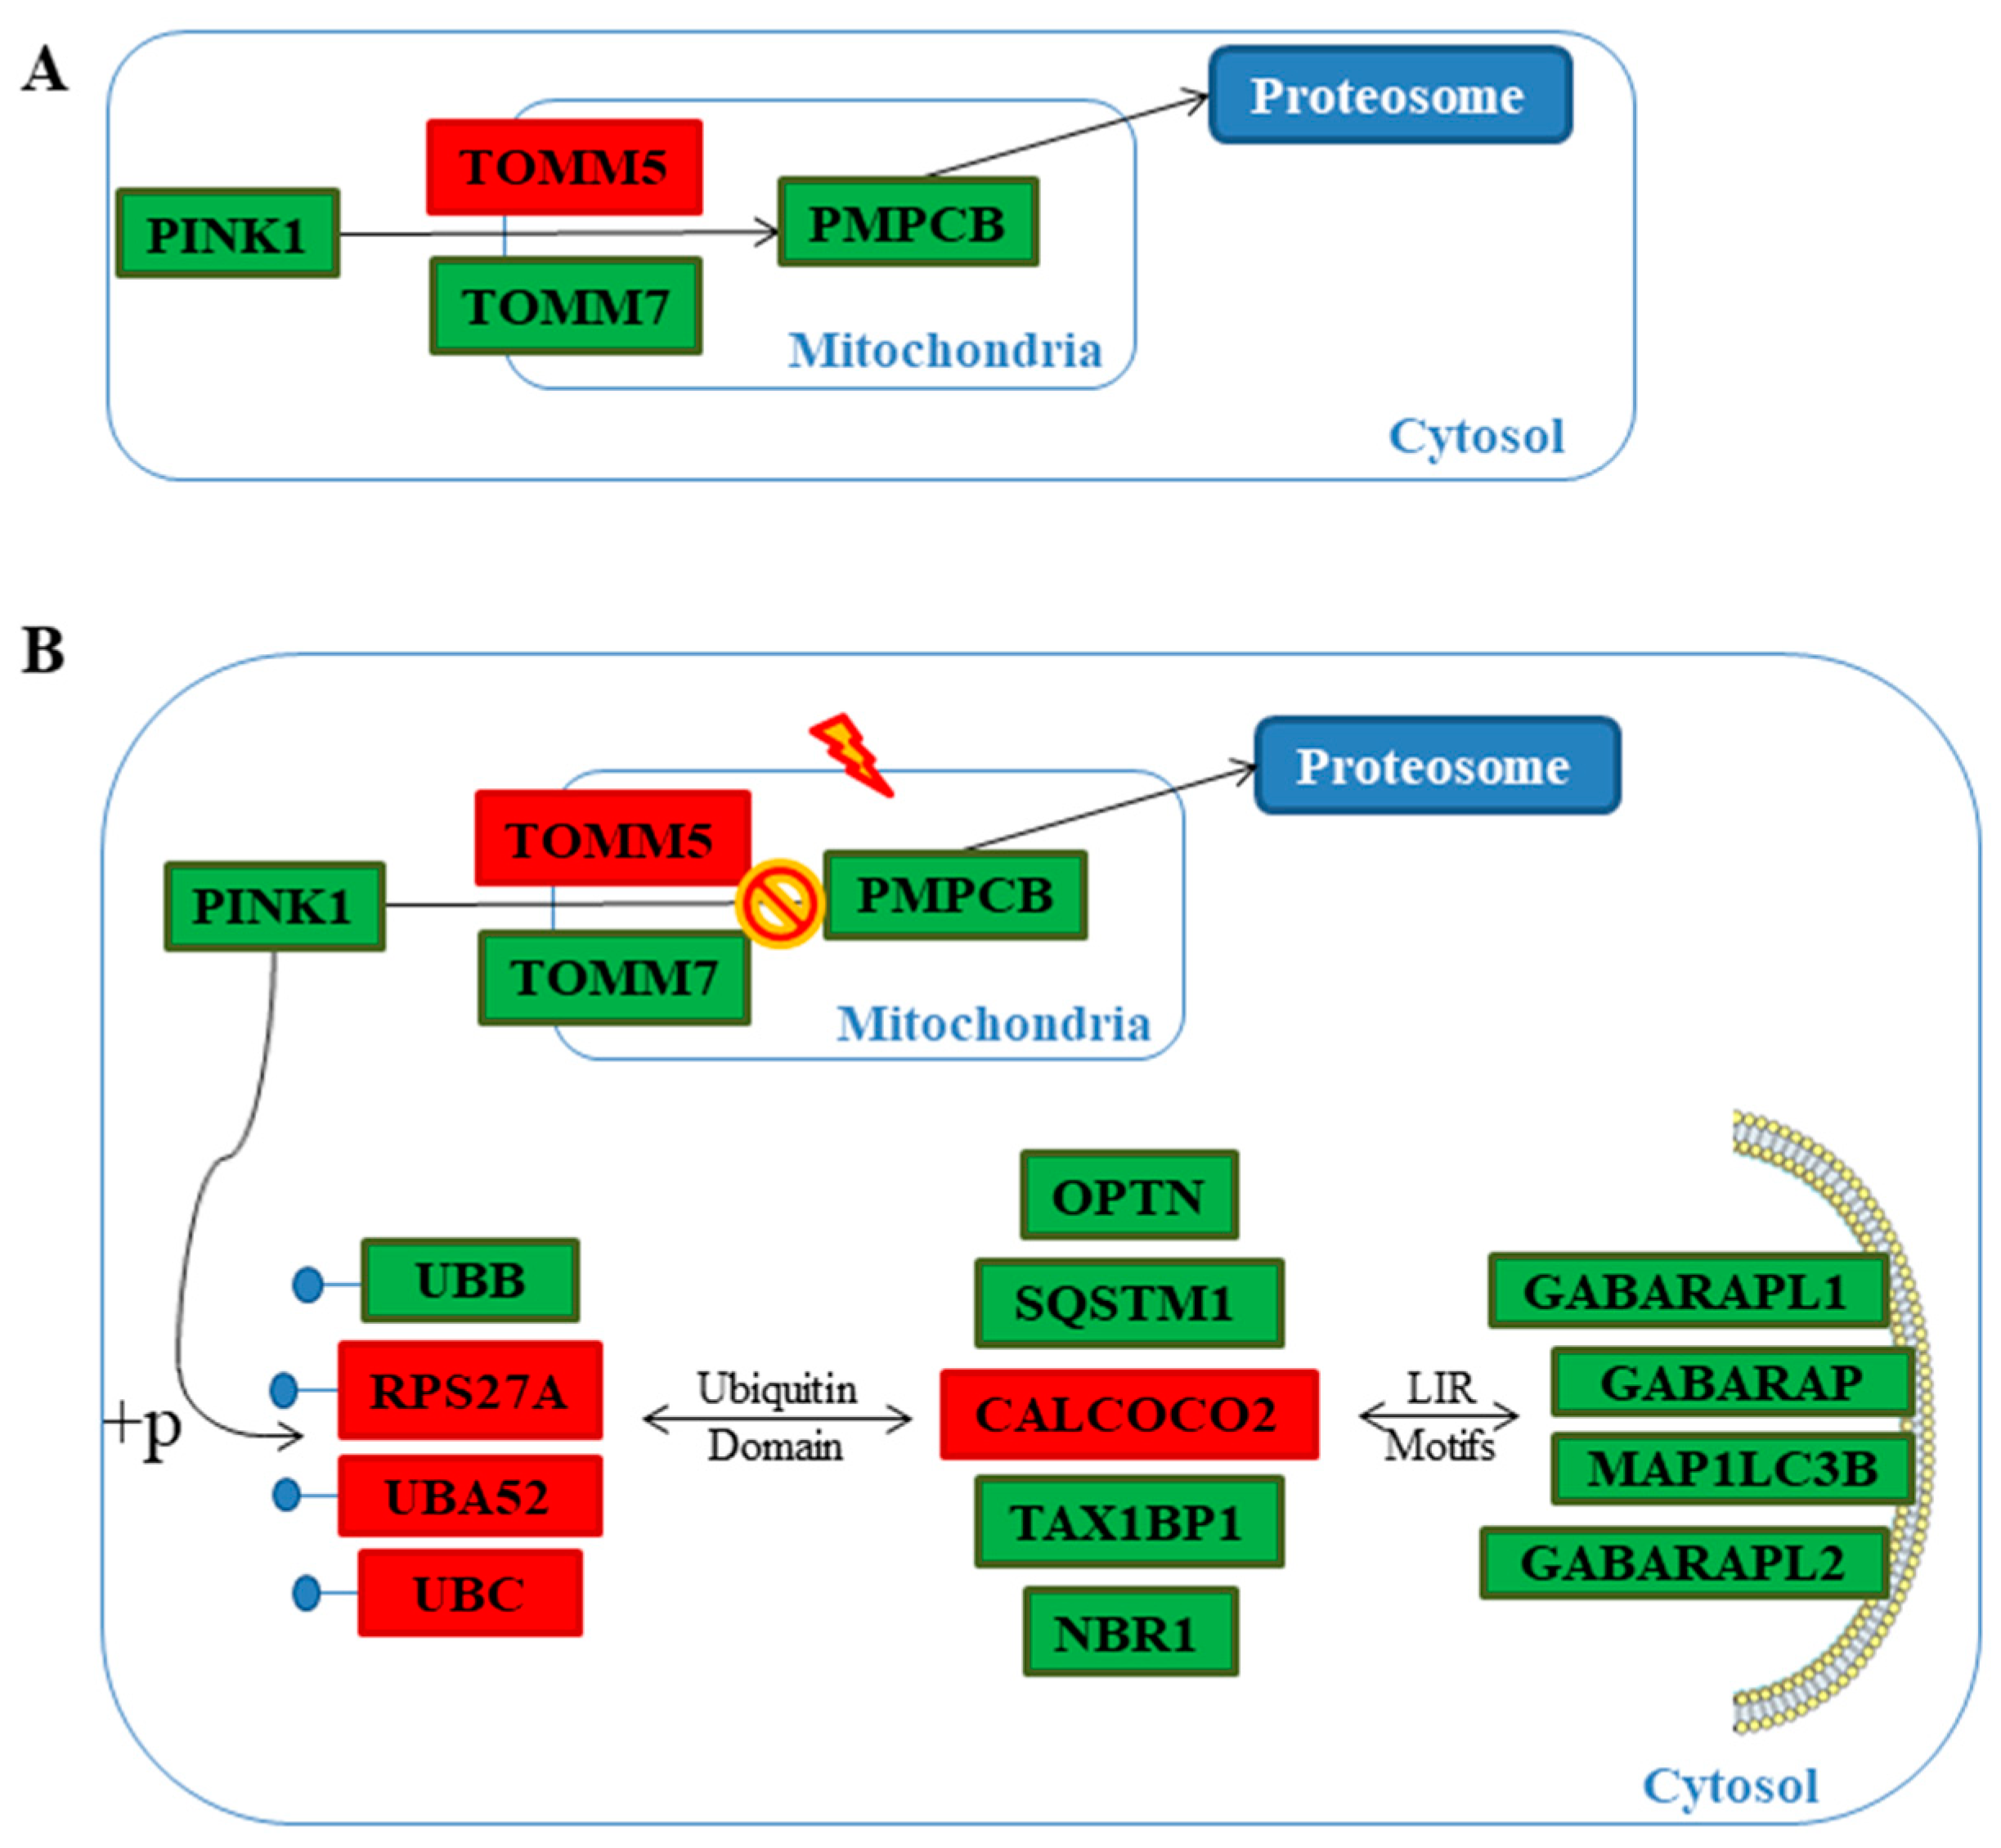
| PINK1 | 37.36 | 25.27 | −0.56 | <0.01 | Serine/threonine-protein kinase PINK1 | Reactome |
| PMPCB | 10.45 | 8.24 | −0.34 | 0.01 | Mitochondrial-processing peptidase subunit beta | [29,30] |
| TOMM7 | 84.53 | 70.94 | −0.25 | 0.04 | Mitochondrial import receptor subunit TOM7 homolog | Reactome |
| TOMM5 | 11.09 | 19.32 | 0.80 | 0.01 | Mitochondrial import receptor subunit TOM5 homolog | Reactome |
| SQSTM1 | 197.31 | 102.56 | −0.94 | <0.01 | Sequestosome-1 | Reactome |
| CALCOCO2 | 36.71 | 48.12 | 0.39 | <0.01 | Calcium-binding and coiled-coil domain-containing protein 2 | [29,30,31,32,33,34] |
| NBR1 | 42.99 | 34.24 | −0.33 | <0.01 | Next to BRCA gene 1 protein | [29,30,31,33,35,36,37] |
| TAX1BP1 | 35.90 | 27.99 | −0.36 | <0.01 | Tax1-binding protein 1 | [29,30,31,33,34] |
| MFN1 | 10.97 | 8.36 | −0.39 | 0.01 | Mitofusin-1 | Reactome |
| DNM1L | 12.24 | 18.06 | 0.56 | <0.01 | Dynamin-1-like protein | [30,31,33,34,36] |
| OPTN | 88.81 | 67.17 | −0.40 | <0.01 | Optineurin | [30,31,32,33,34,35,36] |
| UBB | 1415.11 | 986.86 | −0.52 | <0.01 | Polyubiquitin-B | Reactome |
| UBC | 554.15 | 681.83 | 0.30 | <0.01 | Polyubiquitin-C | Reactome |
| UBA52 | 237.50 | 261.25 | 0.14 | <0.01 | Ubiquituin-60S ribosomial protein L40 | Reactome |
| RPS27A | 837.70 | 933.41 | 0.16 | <0.01 | Ubiquitin-40S ribosomial protein S27a | Reactome |
| BCL2L13 | 11.03 | 8.83 | −0.32 | 0.01 | Bcl-2-like protein 13 | [30,31,33,34] |
| BNIP3L | 15.53 | 11.81 | −0.40 | <0.01 | BCL2/adenovirus E1B 19 kDa protein-interacting protein 3-like | [30,31,33,34,36,37] |
| MAP1LC3B | 26.95 | 16.28 | −0.73 | <0.01 | Microtubule-associated proteins 1A/1B light chain 3B | Reactome |
| GABARAP | 252.95 | 175.99 | −0.52 | <0.01 | γ-Aminobutyric acid receptor-associated protein | [29,30,31,33,34] |
| GABARAPL1 | 18.22 | 11.21 | −0.70 | <0.01 | γ-Aminobutyric acid receptor-associated protein-like 1 | [29] |
| GABARAPL2 | 50.42 | 38.38 | −0.39 | 0.01 | γ-Aminobutyric acid receptor-associated protein-like 2 | [29] |
| FKBP8 | 84.95 | 69.58 | −0.29 | <0.01 | Peptidyl–prolyl cis-trans isomerase FKBP8 | [33] |
| Genes | hPDLSCs-CTR | hPDLSCs-MOR | Fold Change | Q-Value | Protein | Source |
|---|---|---|---|---|---|---|
| BCL2L12 | 1.42 | 3.63 | 1.35 | <0.01 | Bcl-2-like protein 12 | [38,39,40,41] |
| BAX | 62.22 | 39.37 | −0.66 | <0.01 | Apoptosis regulator BAX | [38,39,40,41,42,43] |
| MCL1 | 13.39 | 17.22 | 0.36 | <0.01 | Induced myeloid leukemia cell differentiation protein Mcl-1 | [38,39,40,41] |
| CYCS | 3.82 | 7.64 | 1.00 | <0.01 | Cytochrome c | [38,39,40,41,42,43,44] |
| CASP1 | 17.76 | 6.60 | −1.43 | <0.01 | Caspase-1 | [38] |
| CASP2 | 5.72 | 9.34 | 0.71 | <0.01 | Caspase-2 | [44] |
| CASP4 | 104.74 | 92.25 | −0.18 | 0.01 | Caspase-4 | [44] |
| CASP6 | 4.66 | 1.85 | −1.34 | 0.01 | Caspase-6 | [39] |
| CASP7 | 9.81 | 7.15 | −0.46 | 0.01 | Caspase-7 | [38] |
| CASP8 | 12.86 | 8.18 | −0.65 | <0.01 | Caspase-8 | [38] |
| SOD1 | 470.72 | 404.41 | −0.22 | <0.01 | Superoxide dismutase [Cu-Zn] | [44] |
© 2019 by the authors. Licensee MDPI, Basel, Switzerland. This article is an open access article distributed under the terms and conditions of the Creative Commons Attribution (CC BY) license (http://creativecommons.org/licenses/by/4.0/).
Share and Cite
Chiricosta, L.; Gugliandolo, A.; Diomede, F.; Pizzicannella, J.; Trubiani, O.; Iori, R.; Tardiolo, G.; Guarnieri, S.; Bramanti, P.; Mazzon, E. Moringin Pretreatment Inhibits the Expression of Genes Involved in Mitophagy in the Stem Cell of the Human Periodontal Ligament. Molecules 2019, 24, 3217. https://doi.org/10.3390/molecules24183217
Chiricosta L, Gugliandolo A, Diomede F, Pizzicannella J, Trubiani O, Iori R, Tardiolo G, Guarnieri S, Bramanti P, Mazzon E. Moringin Pretreatment Inhibits the Expression of Genes Involved in Mitophagy in the Stem Cell of the Human Periodontal Ligament. Molecules. 2019; 24(18):3217. https://doi.org/10.3390/molecules24183217
Chicago/Turabian StyleChiricosta, Luigi, Agnese Gugliandolo, Francesca Diomede, Jacopo Pizzicannella, Oriana Trubiani, Renato Iori, Giuseppe Tardiolo, Simone Guarnieri, Placido Bramanti, and Emanuela Mazzon. 2019. "Moringin Pretreatment Inhibits the Expression of Genes Involved in Mitophagy in the Stem Cell of the Human Periodontal Ligament" Molecules 24, no. 18: 3217. https://doi.org/10.3390/molecules24183217