Rapid Detection of Adulterants in Whey Protein Supplement by Raman Spectroscopy Combined with Multivariate Analysis

Abstract
:1. Introduction
2. Results and Discussion
2.1. Raman Spectra
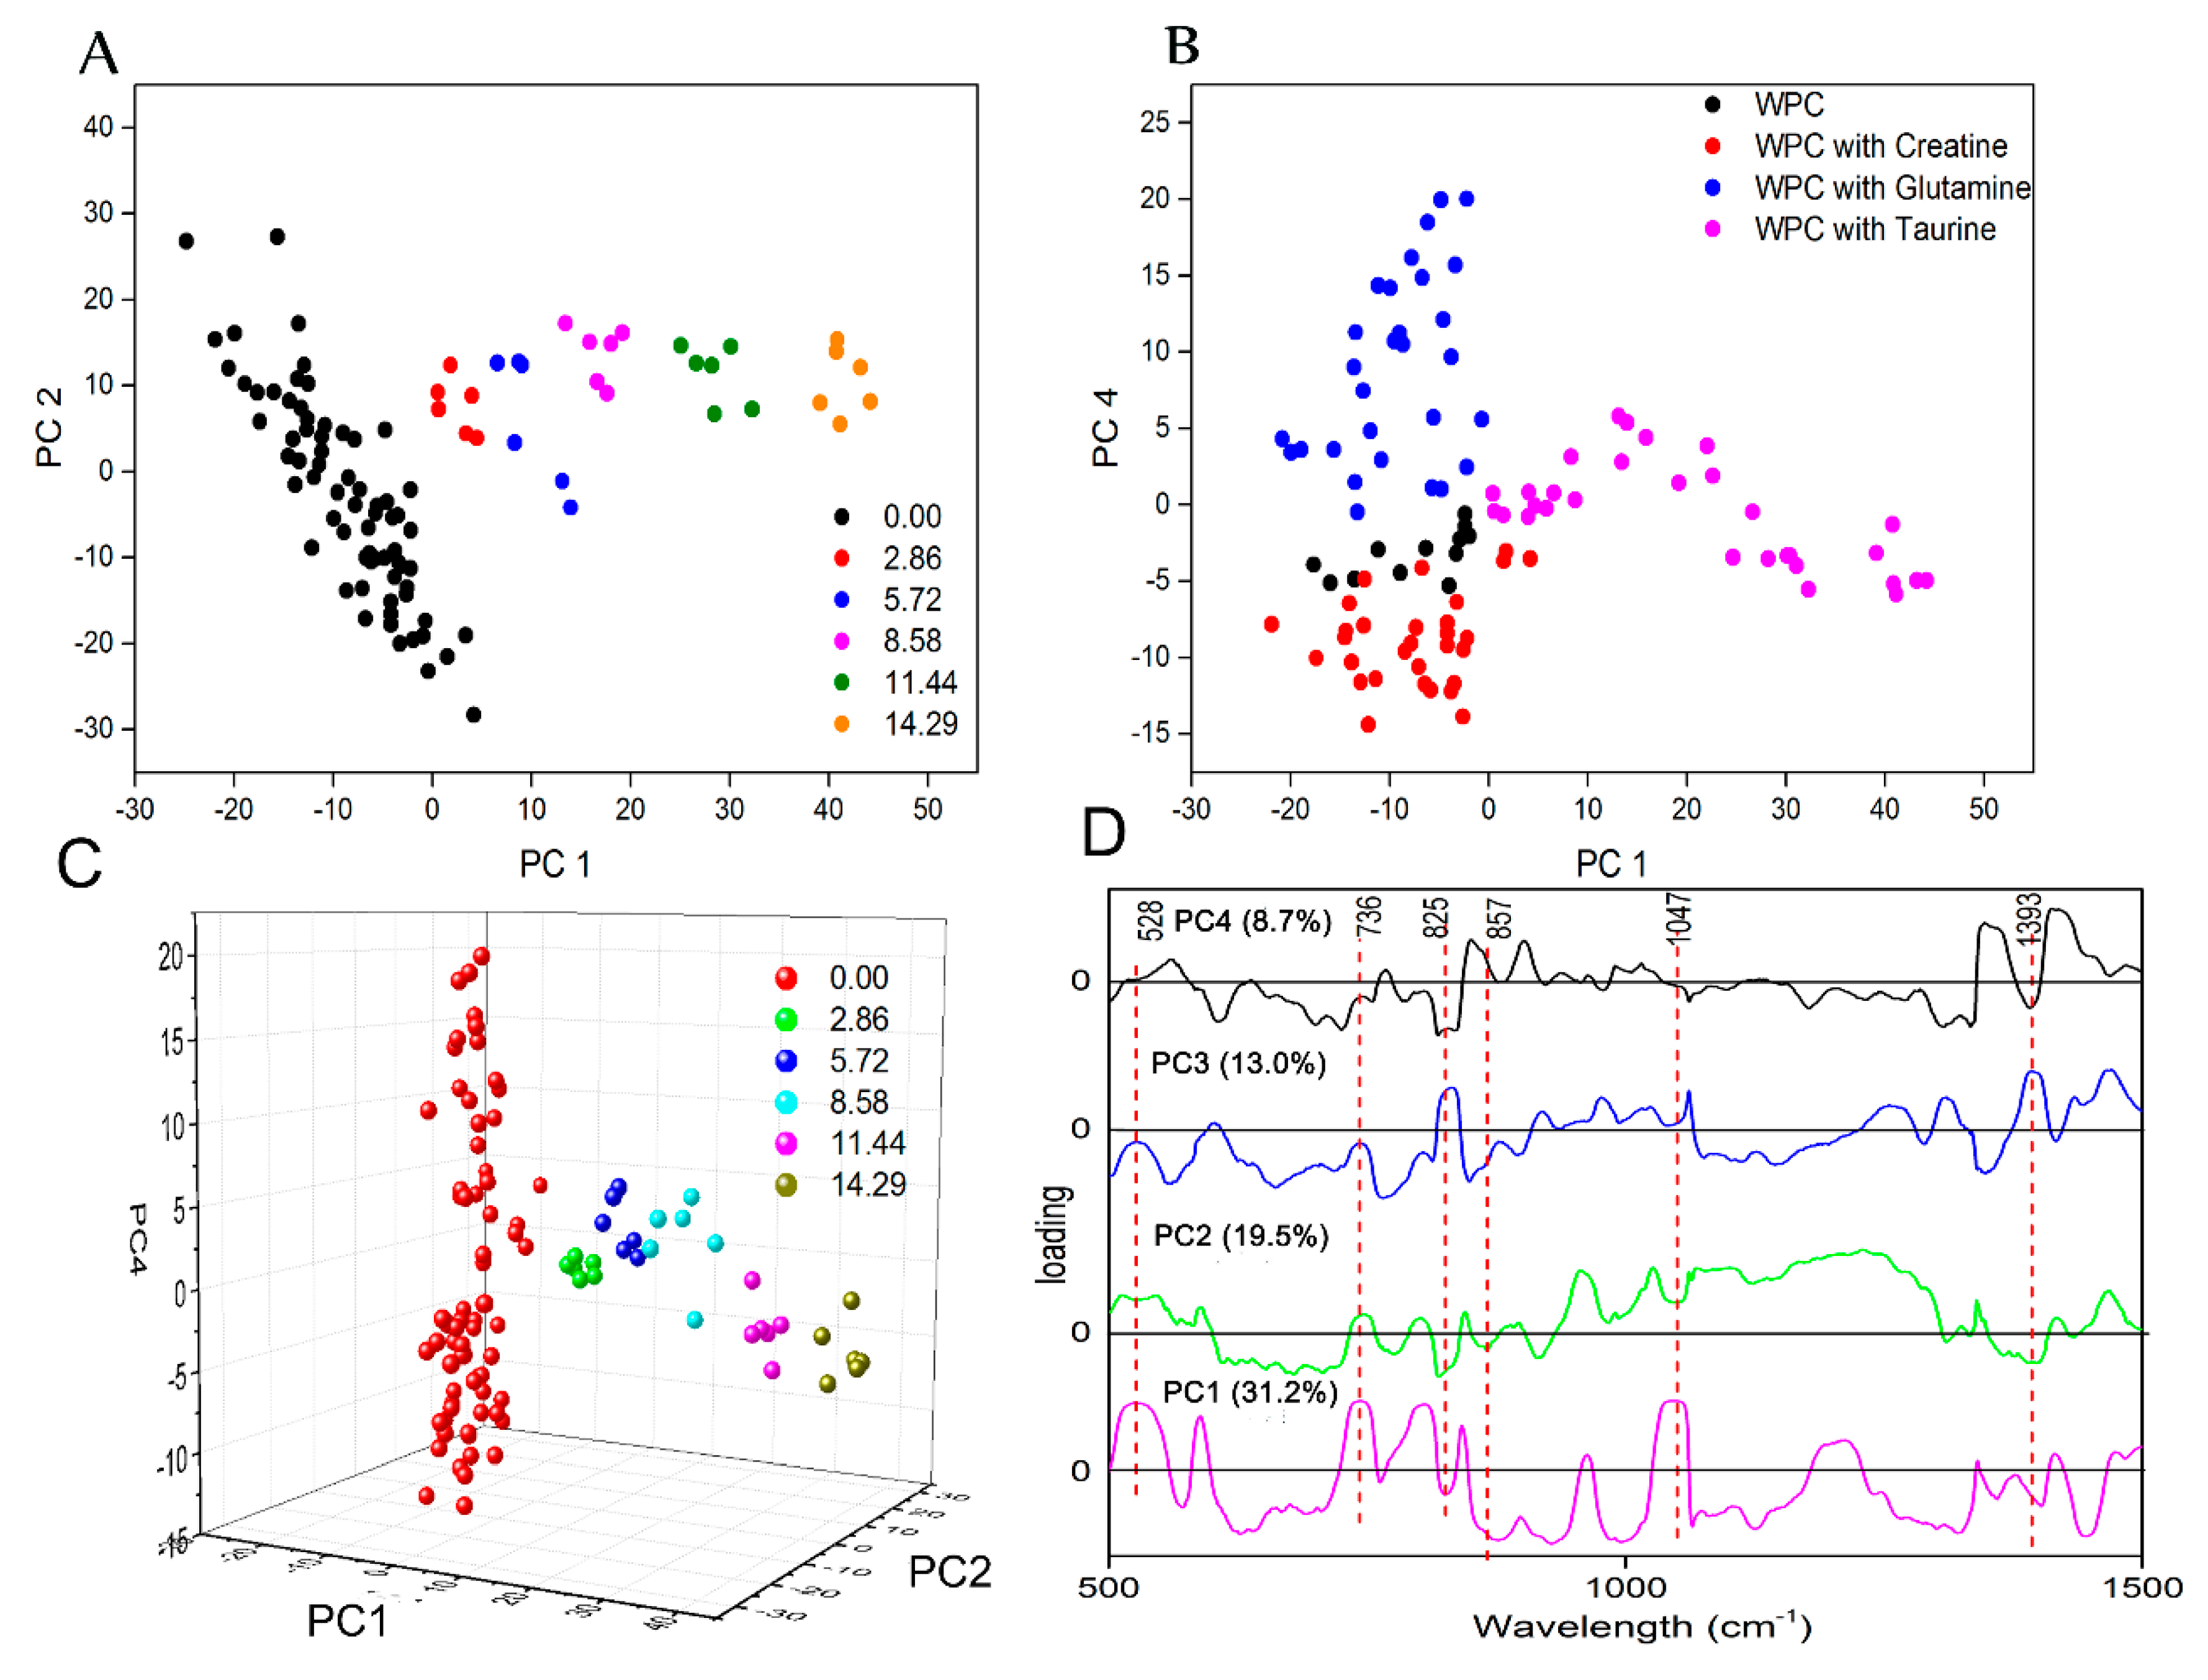
2.2. PCA Analysis
2.3. PLS-DA and SIMCA Classification Analysis
2.4. PLSR Analysis
3. Material and Methods
3.1. Preparation of the Samples
3.2. Raman Spectroscopy
3.3. Chemometric Analysis
4. Conclusions
Supplementary Materials
Author Contributions
Funding
Conflicts of Interest
References
- Braekevelt, E.; Lau, B.P.Y.; Feng, S.; Ménard, C.; Tittlemier, S.A. Determination of melamine, ammeline, ammelide and cyanuric acid in infant formula purchased in Canada by liquid chromatography-tandem mass spectrometry. Food Addit. Contam. Part A 2011, 28, 698–704. [Google Scholar] [CrossRef]
- Gossner, C.M.; Schlundt, J.; Embarek, P.B.; Hird, S.; Lo-Fo-Wong, D.; Jose, J.O.B.; Teoh, K.N.; Tritscher, A. The melamine incident: Implications for international food and feed safety. Environ. Health Perspect. 2009, 117, 1803–1808. [Google Scholar] [CrossRef]
- Champagne, A.B.; Emmel, K.V. Rapid screening test for adulteration in raw materials of dietary supplements. Vib. Spectrosc. 2011, 55, 216–223. [Google Scholar] [CrossRef]
- Andrade, J.; Pereira, C.G.; Almeida, J.C.D., Jr.; Viana, C.C.R.; Neves, L.N.D.O.; Silva, P.H.F.D.; Bell, M.J.V.; Anjos, V.D.C.D. FTIR-ATR determination of protein content to evaluate whey protein concentrate adulteration. LWT 2019, 99, 166–172. [Google Scholar] [CrossRef]
- Wang, T.; Tan, S.Y.; Mutilangi, W.; Aykas, D.P.; Rodriguez-Saona, L.E. Authentication of whey protein powders by portable mid-infrared spectrometers combined with pattern recognition analysis. J. Food Sci. 2015, 80, C2111–C2116. [Google Scholar] [CrossRef] [PubMed]
- Ingle, P.D.; Christian, R.; Purohit, P.; Zarraga, V.; Handley, E.; Freel, K.; Abdo, S. Determination of protein content by NIR spectroscopy in protein powder mix products. J. AOAC Int. 2016, 99, 360–363. [Google Scholar] [CrossRef]
- Moore, J.C.; DeVries, J.W.; Lipp, M.; Griffiths, J.C.; Abernethy, D.R. Total protein methods and their potential utility to reduce the risk of food protein adulteration. Compr. Rev. Food Sci. Food Saf. 2010, 9, 330–357. [Google Scholar] [CrossRef]
- Hall, N.G.; Schönfeldt, H.C. Total nitrogen vs. amino-acid profile as indicator of protein content of beef. Food. Chem. 2013, 140, 608–612. [Google Scholar] [CrossRef]
- Shen, G.; Fan, X.; Yang, Z.; Han, L. A feasibility study of non-targeted adulterant screening based on NIRM spectral library of soybean meal to guarantee quality: The example of non-protein nitrogen. Food. Chem. 2016, 210, 35–42. [Google Scholar] [CrossRef]
- Draher, J.; Ehling, S.; Cellar, N.; Reddy, T.; Henion, J.; Sousou, N. Determination of emerging nitrogenous economic adulterants in milk proteins by high-performance liquid chromatography/compact mass spectrometry. Rapid Commun. Mass Spectrom. 2016, 30, 1265–1272. [Google Scholar] [CrossRef]
- Garrido, B.C.; Souza, G.H.M.F.; Lourenço, D.C.; Fasciotti, M. Proteomics in quality control: Whey protein-based supplements. J. Proteom. 2016, 147, 48–55. [Google Scholar] [CrossRef] [PubMed]
- Khan, K.M.; Krishna, H.; Majumder, S.K.; Gupta, P.K. Detection of urea adulteration in milk using near-infrared raman spectroscopy. Food Anal. Method 2015, 8, 93–102. [Google Scholar] [CrossRef]
- Nascimento, C.F.; Rocha, D.L.; Rocha, F.R.P. A fast and environmental friendly analytical procedure for determination of melamine in milk exploiting fluorescence quenching. Food. Chem. 2015, 169, 314–319. [Google Scholar] [CrossRef] [PubMed]
- Pereira, C.G.; Andrade, J.; Ranquine, T.; de Moura, I.N.; Da Rocha, R.A.; Furtado, M.A.M.; Bell, M.J.V.; Anjos, V. Characterization and detection of adulterated whey protein supplements using stationary and time-resolved fluorescence spectroscopy. LWT 2018, 97, 180–186. [Google Scholar] [CrossRef]
- Choi, J.; Min, K.; Hengoju, S.; Kim, G.; Chang, S.; DeMello, A.J.; Choo, J.; Kim, H.Y. A droplet-based microfluidic immunosensor for high efficiency melamine analysis. Biosens. Bioelectron. 2016, 80, 182–186. [Google Scholar] [CrossRef]
- Gao, N.; Huang, P.; Wu, F. Colorimetric detection of melamine in milk based on Triton X-100 modified gold nanoparticles and its paper-based application. Spectrochim. Acta Part A Mol. Biomol. Spectrosc. 2018, 192, 174–180. [Google Scholar] [CrossRef]
- Kumar, N.; Kumar, H.; Mann, B.; Seth, R. Colorimetric determination of melamine in milk using unmodified silver nanoparticles. Spectrochim. Acta Part A Mol. Biomol. Spectrosc. 2016, 156, 89–97. [Google Scholar] [CrossRef] [PubMed]
- Li, J.; Chen, Z.; Li, Y. A strategy for constructing sensitive and renewable molecularly imprinted electrochemical sensors for melamine detection. Anal. Chim. Acta 2011, 706, 255–260. [Google Scholar] [CrossRef]
- Clément, Y.; Gaubert, A.; Bonhommé, A.; Marote, P.; Mungroo, A.; Paillard, M.; Lantéri, P.; Morell, C. Raman spectroscopy combined with advanced chemometric methods: A new approach for detergent deformulation. Talanta 2019, 195, 441–446. [Google Scholar] [CrossRef]
- Mazurek, S.; Szostak, R.; Czaja, T.; Zachwieja, A. Analysis of milk by FT-Raman spectroscopy. Talanta 2015, 138, 285–289. [Google Scholar] [CrossRef]
- Qin, J.; Kim, M.S.; Chao, K.; Gonzalez, M.; Cho, B. Quantitative detection of benzoyl peroxide in wheat flour using line-scan macroscale raman chemical imaging. Appl. Spectrosc. 2017, 71, 2469–2476. [Google Scholar] [CrossRef]
- Richardson, P.I.C.; Muhamadali, H.; Ellis, D.I.; Goodacre, R. Rapid quantification of the adulteration of fresh coconut water by dilution and sugars using Raman spectroscopy and chemometrics. Food. Chem. 2019, 272, 157–164. [Google Scholar] [CrossRef]
- Rodríguez, S.D.; Rolandelli, G.; Buera, M.P. Detection of quinoa flour adulteration by means of FT-MIR spectroscopy combined with chemometric methods. Food. Chem. 2019, 274, 392–401. [Google Scholar] [CrossRef]
- Moreira, R.L.; Lobo, R.P.S.M.; Dias, A. Infrared dispersion analysis and Raman scattering spectra of taurine single crystals. Spectrochim. Acta Part A Mol. Biomol. Spectrosc. 2018, 188, 276–284. [Google Scholar] [CrossRef] [PubMed]
- Gangopadhyay, D.; Sharma, P.; Singh, R.K. Temperature dependent Raman and DFT study of creatine. Spectrochim. Acta Part A Mol. Biomol. Spectrosc. 2015, 150, 9–14. [Google Scholar] [CrossRef]
- Holanda, R.O.; Silva, C.B.; Silva Filho, J.G.; Lima, C.L.; Lima, J.A.; Freire, P.T.C. Raman spectroscopy under high pressures and DFT calculations of the amino acid l-glutamine. Vib. Spectrosc. 2018, 98, 69–76. [Google Scholar] [CrossRef]
- Lukacs, M.; Bazar, G.; Pollner, B.; Henn, R.; Kirchler, C.G.; Huck, C.W.; Kovacs, Z. Near infrared spectroscopy as an alternative quick method for simultaneous detection of multiple adulterants in whey protein-based sports supplement. Food Control 2018, 94, 331–340. [Google Scholar] [CrossRef]
- Saha, P.; Roy, N.; Mukherjee, D.; Sarkar, A.K. Application of principal component analysis for outlier detection in heterogeneous traffic data. Procedia Comput. Sci. 2016, 83, 107–114. [Google Scholar] [CrossRef]
- Gallart-Mateu, D.; Largo-Arango, C.D.; Larkman, T.; Garrigues, S.; de la Guardia, M. Fast authentication of tea tree oil through spectroscopy. Talanta 2018, 189, 404–410. [Google Scholar] [CrossRef]
- de Oliveira Mendes, T.; Porto, B.L.S.; Almeida, M.R.; Fantini, C.; Sena, M.M. Discrimination between conventional and omega-3 fatty acids enriched eggs by FT-Raman spectroscopy and chemometric tools. Food Chem. 2019, 273, 144–150. [Google Scholar] [CrossRef]
- Botelho, B.G.; Reis, N.; Oliveira, L.S.; Sena, M.M. Development and analytical validation of a screening method for simultaneous detection of five adulterants in raw milk using mid-infrared spectroscopy and PLS-DA. Food Chem. 2015, 181, 31–37. [Google Scholar] [CrossRef] [PubMed]
- Ballabio, D.; Grisoni, F.; Todeschini, R. Multivariate comparison of classification performance measures. Chemometr. Intell. Lab. 2018, 174, 33–44. [Google Scholar] [CrossRef]
- Miaw, C.S.W.; Sena, M.M.; Souza, S.V.C.D.; Ruisanchez, I.; Callao, M.P. Variable selection for multivariate classification aiming to detect individual adulterants and their blends in grape nectars. Talanta 2018, 190, 55–61. [Google Scholar] [CrossRef] [PubMed]
- Sezer, B.; Bilge, G.; Berkkan, A.; Tamer, U.; Hakki Boyaci, I. A rapid tool for determination of titanium dioxide content in white chickpea samples. Food Chem. 2018, 240, 84–89. [Google Scholar] [CrossRef] [PubMed]
Sample Availability: Samples of the compounds are available from the authors. |


| Number of Components | Members | Correct | W | WC | WG | WT | WCG | WCT | WTG | No Class | |
|---|---|---|---|---|---|---|---|---|---|---|---|
| Training Set | |||||||||||
| W | 2 | 7 | 100% | 7 | 0 | 0 | 0 | 0 | 0 | 0 | 0 |
| WC | 5 | 20 | 100% | 0 | 20 | 0 | 0 | 0 | 0 | 0 | 0 |
| WG | 4 | 20 | 100% | 0 | 0 | 20 | 0 | 0 | 0 | 0 | 0 |
| WT | 5 | 20 | 100% | 0 | 0 | 0 | 20 | 0 | 0 | 0 | 0 |
| WCG | 5 | 20 | 95% | 0 | 0 | 0 | 0 | 19 | 1 | 0 | 0 |
| WCT | 4 | 20 | 100% | 0 | 0 | 0 | 0 | 0 | 20 | 0 | 0 |
| WTG | 4 | 20 | 90% | 0 | 0 | 0 | 2 | 0 | 0 | 18 | 0 |
| Total | 127 | 97.6% | 7 | 20 | 20 | 22 | 19 | 21 | 18 | 0 | |
| Test set | |||||||||||
| W | 4 | 75% | 3 | 1 | 0 | 0 | 0 | 0 | 0 | 0 | |
| WC | 10 | 100% | 0 | 10 | 0 | 0 | 0 | 0 | 0 | 0 | |
| WG | 10 | 90% | 1 | 0 | 9 | 0 | 0 | 0 | 0 | 0 | |
| WT | 10 | 100% | 0 | 0 | 0 | 10 | 0 | 0 | 0 | 0 | |
| WCG | 10 | 100% | 0 | 0 | 0 | 0 | 10 | 0 | 0 | 0 | |
| WCT | 10 | 100% | 0 | 0 | 0 | 0 | 0 | 10 | 0 | 0 | |
| WTG | 10 | 100% | 0 | 0 | 0 | 0 | 0 | 0 | 10 | 0 | |
| Total | 64 | 96.9% | 4 | 11 | 9 | 10 | 10 | 10 | 10 | 0 | |
| W | WC | WG | WT | WCG | WCT | WTG | |
|---|---|---|---|---|---|---|---|
| Sensitivity | 100%/75% | 100%/100% | 100%/90.0% | 100%/100% | 95%/100% | 100%/100% | 90%/100% |
| Specificity | 100%/98.3% | 100%/98.1% | 100%/100% | 98.1%/100% | 100%/100% | 99.1%/100% | 100%/100% |
| Precision | 100%/75% | 100%/90.9% | 100%/100% | 90.9%/100% | 100%/100% | 95.2%/100% | 100%/100% |
| Accuracy | 97.6%/96.9% | ||||||
| No-error rate | 97.9%/95.0% | ||||||
| Error rate | 2.1%/5.0% | ||||||
| Younden’s index | 100%/73.3% | 100%/98.1% | 100%/90.0% | 98.1%/100% | 95%/100% | 99.1%/100% | 90%/100% |
| AUC (training set) | 1.00 | 0.99 | 1.00 | 0.99 | 1.00 | 0.98 | 0.98 |
| Entire Region | 400–1800 cm−1 | ||
| Taurine | Glutamine | Creatine | |
| Pre-treat a | SG + SNV | SG + SNV | SG + 1st der. |
| LV j | 2 | 4 | 4 |
| R2cv b | 0.991 | 0.970 | 0.972 |
| R2p c | 0.992 | 0.963 | 0.967 |
| RMSEC d (%) | 0.37 | 0.39 | 0.22 |
| RMSECV e (%) | 0.41 | 0.48 | 0.25 |
| RMSEP f (%) | 0.35 | 0.43 | 0.23 |
| LOD g (%) | 0.83 | 1.17 | 0.66 |
| LOQ h (%) | 2.52 | 3.51 | 2.00 |
| Component-specific range | 500–1100 cm−1 | 800–1000 cm−1 and 1300–1500 cm−1 | 500–1100 cm−1 |
| Pre-treat a | SG + MSC | SG | SG + MSC |
| LV j | 6 | 8 | 6 |
| R2cv b | 0.991 | 0.966 | 0.984 |
| R2p c | 0.991 | 0.966 | 0.977 |
| RMSEC d (%) | 0.36 | 0.41 | 0.17 |
| RMSECV e (%) | 0.37 | 0.46 | 0.24 |
| RMSEP f (%) | 0.33 | 0.42 | 0.21 |
| LOD g (%) | 0.71 | 1.13 | 0.53 |
| LOQ h (%) | 2.15 | 3.40 | 1.52 |
© 2019 by the authors. Licensee MDPI, Basel, Switzerland. This article is an open access article distributed under the terms and conditions of the Creative Commons Attribution (CC BY) license (http://creativecommons.org/licenses/by/4.0/).
Share and Cite
Jiao, X.; Meng, Y.; Wang, K.; Huang, W.; Li, N.; Liu, T.C.-Y. Rapid Detection of Adulterants in Whey Protein Supplement by Raman Spectroscopy Combined with Multivariate Analysis. Molecules 2019, 24, 1889. https://doi.org/10.3390/molecules24101889
Jiao X, Meng Y, Wang K, Huang W, Li N, Liu TC-Y. Rapid Detection of Adulterants in Whey Protein Supplement by Raman Spectroscopy Combined with Multivariate Analysis. Molecules. 2019; 24(10):1889. https://doi.org/10.3390/molecules24101889
Chicago/Turabian StyleJiao, Xianzhi, Yaoyong Meng, Kangkang Wang, Wei Huang, Nan Li, and Timon Cheng-Yi Liu. 2019. "Rapid Detection of Adulterants in Whey Protein Supplement by Raman Spectroscopy Combined with Multivariate Analysis" Molecules 24, no. 10: 1889. https://doi.org/10.3390/molecules24101889