Article

Comparative Analysis of Theoretical, Observational, and Modeled Deformation of Ground Subsidence: The Case of the Alhada Pb-Zn Mine

1
School of Resources and Civil Engineering, Northeastern University, Shenyang 110819, China
2
Alhada Mining Co., Ltd., Shandong Gold Group Co., Ltd., Xilingol League 026099, China
*
Author to whom correspondence should be addressed.
Minerals 2022, 12(8), 977; https://doi.org/10.3390/min12080977
Submission received: 16 June 2022 / Revised: 27 July 2022 / Accepted: 28 July 2022 / Published: 31 July 2022

Abstract

:
In this study, the probability integral method, Synthetic Aperture Radar Interferometry (InSAR), and the Okada dislocation model were collaboratively used to analyze deformation in the Alhada Pb-Zn mine. The predicted deformation values of the subsidence centers in three subsidence areas were 107 mm, 120 mm, and 83 mm, respectively, as predicted using the probability integral method. The coherent scatterer InSAR technique was used to analyze the time-series deformation of the mining area, and the same subsidence center locations and similar deformation values were observed. The Okada dislocation model was used to invert the optimal parameters of the underground-mining ore body causing the surface subsidence, indicating that the surface subsidence is mainly caused by the mining of ore bodies in the 888 and 848 middle sections. We further simulated ground deformation using the multi-source Okada model. The results showed that the predicted and modeled deformations are highly correlated with the observed deformation. Through the analysis and comparison of the InSAR results, it was concluded that the three subsidence areas do not threaten the stability of the main buildings in the mining area. Using theoretical, observational, and modeling methods, the development and evolution of the subsidence area in mines can be established, which could provide basic data for subsidence control work and guarantee mine production safety.

1. Introduction

Geological hazards are one of the main factors that hinder the sustainable development of society and pose a severe threat to human and production safety [1]. Currently, underground mining is one of the main methods of mineral resource exploitation. The extensive and excessive mining of underground mines destroys the strength and integrity of underground rock masses. This can cause underground void areas to become larger; the upper strata and rock masses, then, have to support their own weight and that of the overlying rock and soil masses, resulting in changes in the original physical and mechanical properties of the underground rock masses. Stress imbalances occur, and the overlying strata and rock masses deform and collapse. The subsidence and collapse of the overlying strata and geotechnical bodies can cause surface subsidence, or even surface collapse, in the mine site and the surrounding area, which poses a serious threat to production safety and local property [2,3]. Nowadays, surface subsidence occurs in many mines during the mining process or after the closure of mines [4]. Mine drainage during underground mining can also cause surface subsidence [5]. Moreover, mining damages not only the mining area, but also the ecological environment, including agricultural land [6]. Therefore, it is essential to monitor surface subsidence in mining areas.
There are many traditional methods with which to monitor surface subsidence in mining areas, such as total station [7] and measuring robot monitoring, but these require a large number of measuring instruments and engineering personnel for field measurements; moreover, the measurement accuracy is subject to the proficiency of the engineers using the measurement technology, and the workload is enormous. In addition, it is very common to use the GNSS [8,9,10] to monitor the mine surface, which is capable of improved measurement accuracy and real-time monitoring results; however, the method requires a large number of costly GNSS instruments, and the monitoring results are always affected by the surroundings of the instruments. The occurrence of mine-surface subsidence is usually slow in the initial stage of subsidence, and the surface of the mine area changes to a lesser extent; this is not easily perceived, and the whole period of subsidence is generally relatively long. Therefore, the need for an all-weather, comprehensive monitoring technique for mine surfaces is urgent.
Interferometric Synthetic Aperture Radar (InSAR) technology meets the aforementioned requirements of mine monitoring, i.e., it is an all-weather/all-day technique, its monitoring coverage is large, its spatial resolution is high, its monitoring accuracy can reach millimeter level, and it is a low-cost and high-efficiency method [11,12]. Many InSAR methods have been developed, of which D-InSAR is widely used. It has been applied to the monitoring of deformation in mines [13,14,15], water resources [16], volcanoes [17], and earthquake scenarios [18]. However, the D-InSAR technology is limited due to the temporal and spatial decorrelation and atmospheric noise. To address these problems, the permanent scatterer InSAR (PS-InSAR) and small baseline subset InSAR (SBAS-InSAR) methods were proposed in 2001 and 2002 [19,20] to obtain time-series maps of surface deformation. In 2018, Jie Dong et al. proposed and applied the coherent scatterer InSAR (CS-InSAR) technique to successfully identify landslides in high-altitude mountainous areas [21,22]. Our study area is located in the East Wuzhu Muqin Banner, Inner Mongolia, China, at an altitude of approximately 1000 m. It is mainly hilly with a lot of vegetation cover and a large area of grassland around the mine. For areas with poor coherence, such as deserts and grasslands, coherent scatterers are needed to improve the monitoring results of surface deformation [23,24]. Therefore, in this study, coherent scatterers were extracted using the CSI method, and the deformation rate and time-series cumulative deformation of the study area were obtained based on 75 images of Sentinel-1 descending track data covering the mine area between 12 June 2015, and 28 December 2017.
In addition, the predicated deformation, obtained using the probability integral method and the modeled deformation from the Okada model, were used to conduct a comprehensive analysis of the surface deformation in the mining area. The probability integral method was first developed from the stochastic medium model proposed by Prof. J. Litwiniszyn [25]. In early studies, it was mainly applied to the research of rock-movement law. Since the method has been improved, it is now applied to the field of mine subsidence prediction [26,27]. The probabilistic integral method is mainly used in the field of coal mining, but it is also used in the field of predicting surface deformation in metal mines [28,29]. Furthermore, we used the Okada dislocation model to simulate the surface deformation of the mine area due to underground ore-body mining. This method was proposed by Okada in 1985 and has been widely used in volcano modeling [30], mine modeling [31], earthquake fault modeling [32], and other fields. In 2010, Hu et al. simulated 3D co-seismic surface displacement fields based on the Okada model and compared them with 3D co-seismic surface displacement of the Bam earthquake derived from SAR data [33]. In 2014, He et al. used Okada’s theory of linear elasticity to simulate surface and downhole deformation caused by hydraulic fracturing [34]. Based on the deformation results of the mine area obtained from InSAR observations, the geophysical nonlinear Bayesian inversion algorithm was used to obtain the parameters of the subsurface ore body, such as the depth of burial, strike, and morphology of the ore body.
Using the probabilistic integration method, the InSAR technique, and the Okada dislocation model, we compare and analyze the predicted deformation, the observed deformation, and the simulated deformation of the surface deformation in the mine area. Under the condition of lacking a large number of engineering measurements in the mine area, the theoretically predicted deformation is firstly compared and analyzed using the InSAR observed deformation, and the deformations derived from the two methods are verified with each other. Then, the InSAR observed deformation is compared with simulated deformation, which can verify the reliability of the inversion parameters using the Okada model. Finally, the deformations obtained using the three methods are compared and verified. The purpose of this paper is to combine these three methods for mine subsidence monitoring, which can avoid the limitations caused by a single method. We think the combination of the three methods can more accurately identify the mine subsidence area and invert the burial depth and morphology of the underground ore bodies that cause the surface subsidence in the mine area. Accordingly, the dynamic development characteristics of mining subsidence in the Alhada Pb-Zn mine can be analyzed to provide a reliable basis for the management of mining subsidence, which may involve filling the mining area [35] and to guarantee the efficient and safe development of the mine [36,37].

2. Study Area

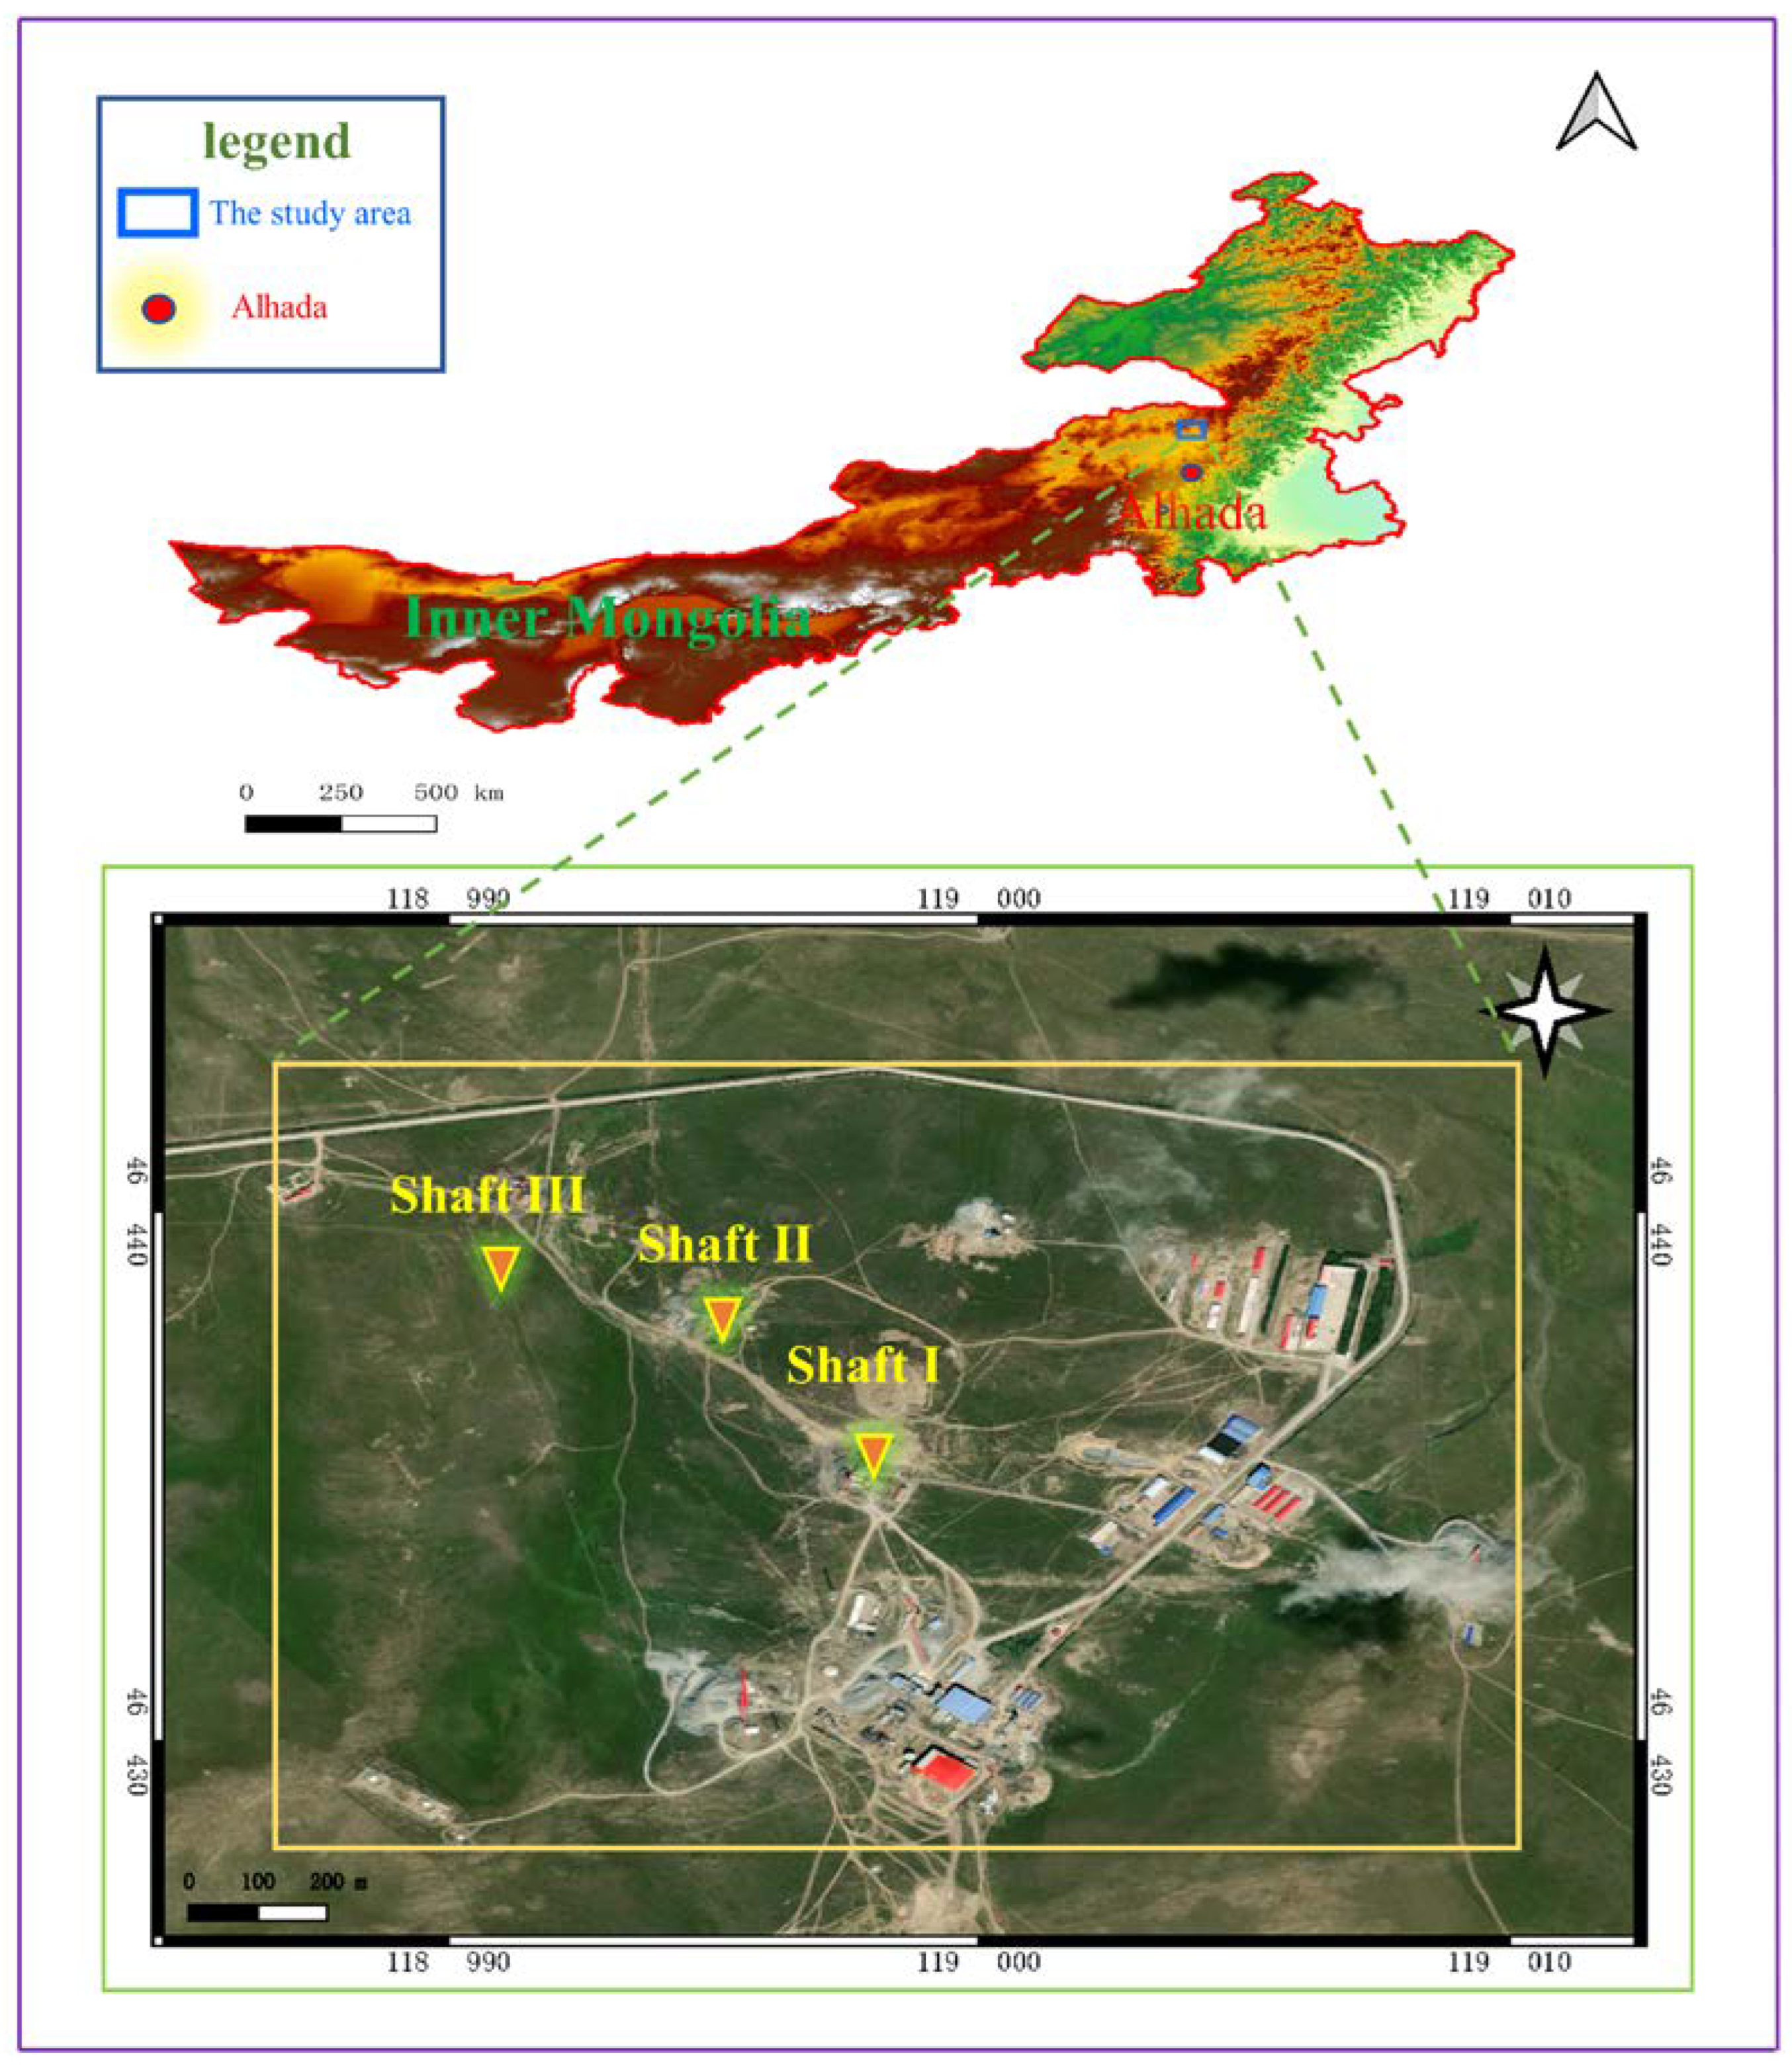
2.1. Study Area Location

The Alhada Pb-Zn mine is located in Mandu Town, Dongwuqi, Xilingol League, Inner Mongolia Autonomous Region, China. The mine area is approximately 24 km2 and the study area is surrounded by areas abundant in resources. The study area is located on the Inner Mongolia Plateau at an elevation of approximately 1000 m above sea level with hilly terrain. The rainfall is generally concentrated in August. The study area ranges from 118°57′56″ E to 119°01′00″ E and 46°24′18″ to 46°27′26″ N. Figure 1 shows the location of the mine.

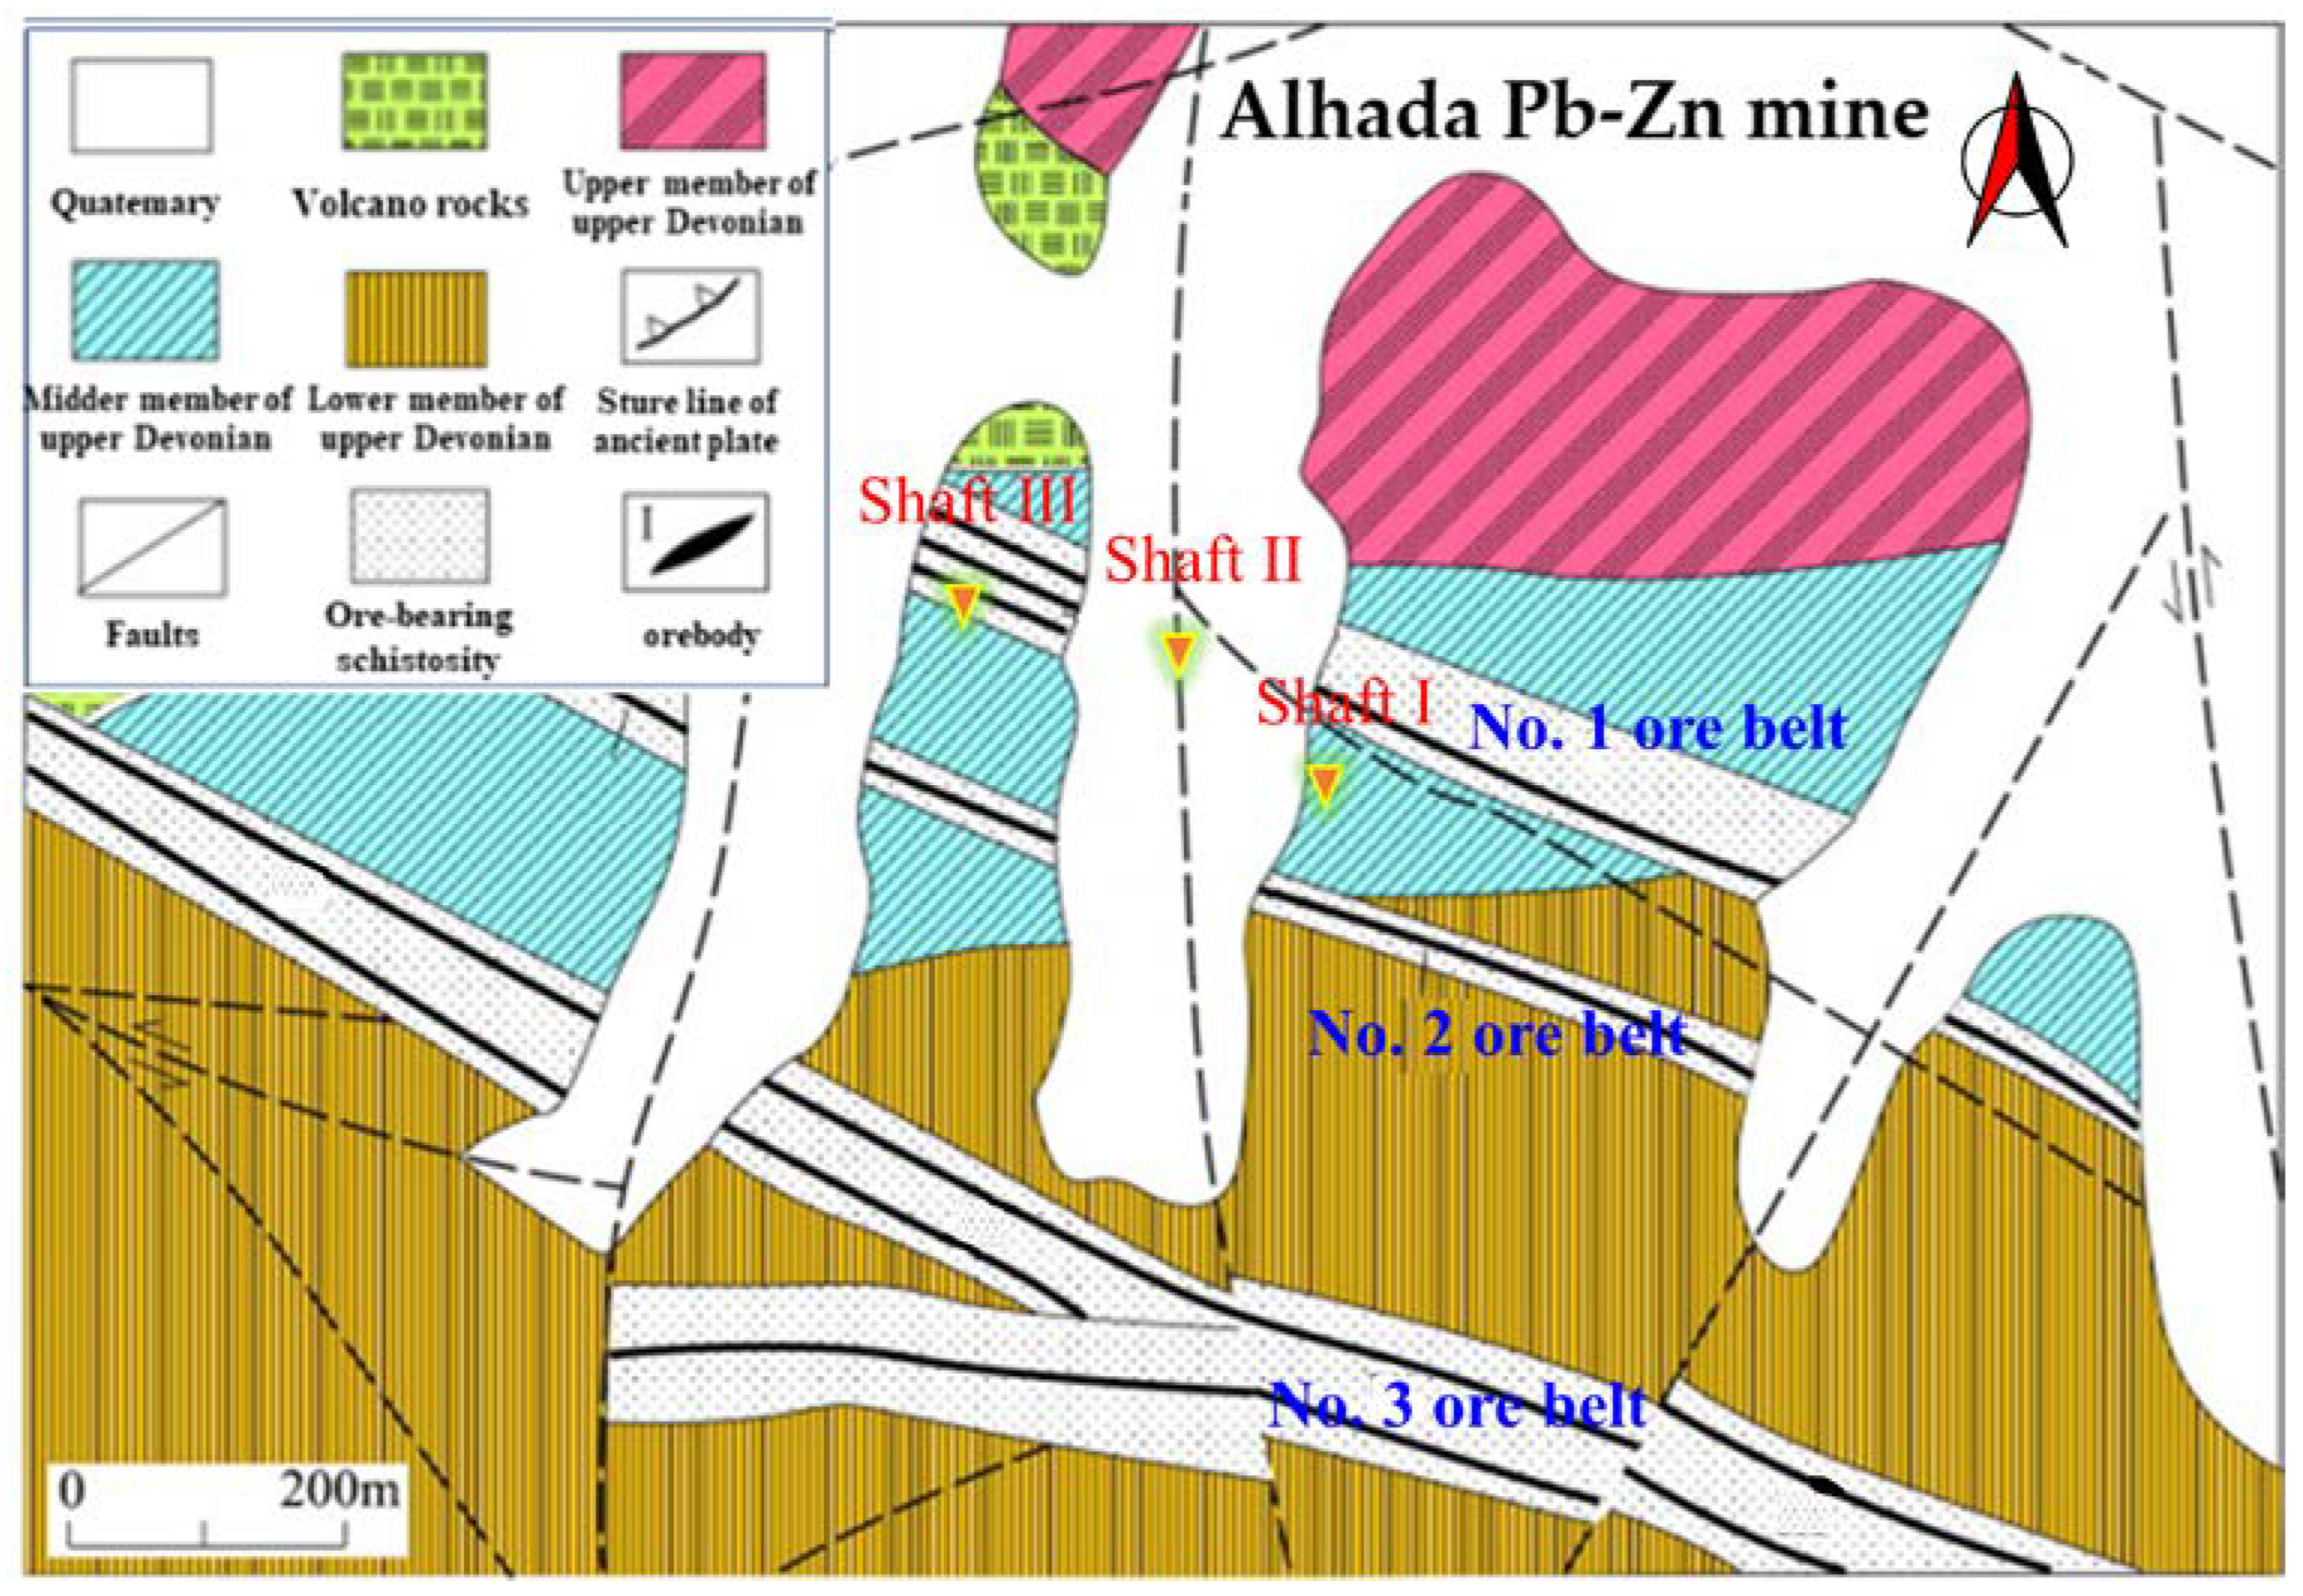
2.2. Geological Setting

The strata and outcrop in the mining area are not complicated, mainly consisting of Tertiary and Quaternary coverings, the Upper Jurassic Baiyin Gaolao Formation, and the Upper Devonian Angeryinwula Formation. The formation strikes approximately 65° NE and tends to the southeast with a dip angle of 60°. The stratum is thick and is the main outcrop layer in the mining area [38]. The main lithologies in the mine area are andesitic tuffs, sandstones, and slates, among which Pb-Zn ores are mainly found in the Angeryin Wula Formation. The Jurassic Upper Baiyin Gaolao Formation is mainly distributed in the northwestern part of the mine area, and the rock types are mostly conglomerate and rhyolite [39]. The main ore minerals are galena, sphalerite, and pyrite, and the gangue minerals are chlorite, quartz, and some clay minerals. A hypidiomorphic granular texture and metasomatic texture are the main ore structures. The ore structure mainly comprises massive, vein-like structures [40]. The ore body contains Pb, Zn, and Ag elements, and some Sn, Ga, and other metal elements. As shown in Figure 2, three ore belts are distributed in the mine area, namely, the No. 1, No. 2, and No. 3 ore belts, which are mainly concentrated in the north, middle, and south of the mine area, respectively [39,40].

3. Theoretical Deformation Prediction of Surface Movement

3.1. Prediction Theory of Surface Subsidence

The basis of the probability integral method of surface movement is the stochastic medium theory, which was first proposed by Prof. J. Litwiniszyn in the 1950s [25]. It assumed that the laws of surface movement caused by mining subsurface rocks are similar to those described by the granular-body model as a stochastic medium on a macroscopic scale. Baochen Liu and Guohua Liao et al. proposed the probability integral method based on the stochastic medium theory [25], which is a probabilistic method to represent the subsidence of the overlying strata caused by the underground mining area. The expression of the surface sinking basin is as follows [26,41,42,43]:
W ( m , n ) = W 0 D 1 r 2 e π ( x m ) 2 + ( y n ) 2 r 2 d x d y
where W(m, n) is the surface subsidence point with the coordinate of (m, n); (x, y) is the planner coordinate of the mining unit; and r is the main influence radius of the mining area.
r = H m t g β
where tgβ is the tangent of the main effect angle and Hm is the average burial depth of the ore body.
W 0 = M q cos α
where W0 is the maximum subsidence; M is the thickness of the ore body; q is the subsidence coefficient; and α is the dip angle.
W ( x , y ) = 1 W 0 W 0 ( x ) W 0 ( y )
W 0 ( x ) = W 0 [ A ( x r ) A ( x l 1 r ) ]
W 0 ( y ) = W 0 [ A ( y r ) A ( y l 2 r ) ]
where W0(x) is the subsidence value under finite extraction along the strike; W0(y) is the subsidence value under finite extraction along with dip profiles; l is the length of the main section along the strike or dip direction, l1 = ls − 2s, l 2= lE − 2s. ls is the length of ore body along the strike, lE is the length of ore body along the inclination, and s is the deviation of inflection point.

3.2. Calculation of the Maximum Surface Subsidence

We utilized the probability integral method to predict the maximum surface subsidence in the Alhada Pb-Zn mine. Due to scattered distribution of the metal ore deposit, the theoretical calculations using the probability integral method require the deletion and consolidation of the ore bodies. The Alhada Pb-Zn mine was created in 2005 and was mined without filling the voids during the early stage. The void extraction area has been gradually filled since April 2015. The two cases, i.e., mining the two middle sections together and mining them separately without filling, can be considered approximately equivalent. The mined ore bodies for the calculation of the predicted deformation values were considered fully mined. The ore body of this mine from the 848 middle section and 808 middle section along the strike length is ls = 1266 m, the inclination length is lE = 120 m, the thickness of the ore body is M = 4.5 m, the average dip angle is approximately α = 32°, the burial depth of the lower boundary of the ore body is H1 = 192 m, the upper-boundary burial depth is H2 = 118 m, and the average burial depth is Hm = 155 m.
As stated in Section 3.1, in order to calculate the deformation of any point on the surface, it is usually necessary to first establish a set of local coordinate systems. According to the literature [44], the predicted parameters of surface movement are selected, the deviation of the inflection point is s = 0.167 H, and the coordinates of the origin are chosen at point o, which is s meters from the actual boundary of the working face. The x-axis is parallel to the strike direction and the y-axis is orthogonal to the strike direction. The predicted coordinate points for the center of the subsidence area were selected based on previous subsidence information from the mine area and the mined ore-body information as follows: subsidence area A (775.7, 25.6); subsidence area B (1203, 25); and subsidence area C (83.71, 57). The mine has been filled with waste rocks several times since 2015, and the stability greatly improved after filling. It is not appropriate to select the subsidence coefficient according to the waste-rock filling, but it should be selected according to the more stable cementing filling with a subsidence coefficient of q = 0.1 and an inflection-point offset distance of 19.706 m. The radius of the main influence is 64.58 m, and the maximum subsidence value W0 is 191 mm. To calculate the displacement deformation value for the main section, the length of the main section towards the strike is 1226.6 m, W0 (x) = 191 mm, and the length of the main section towards the dip is 80.6 m, W0 (y) = 107 mm. According to Formula (4-6), the predicted subsidence in subsidence area A is 107 mm. Moreover, the predicted subsidence values for subsidence areas B and C are 120 mm and 83 mm, respectively, which were calculated using a similar method.

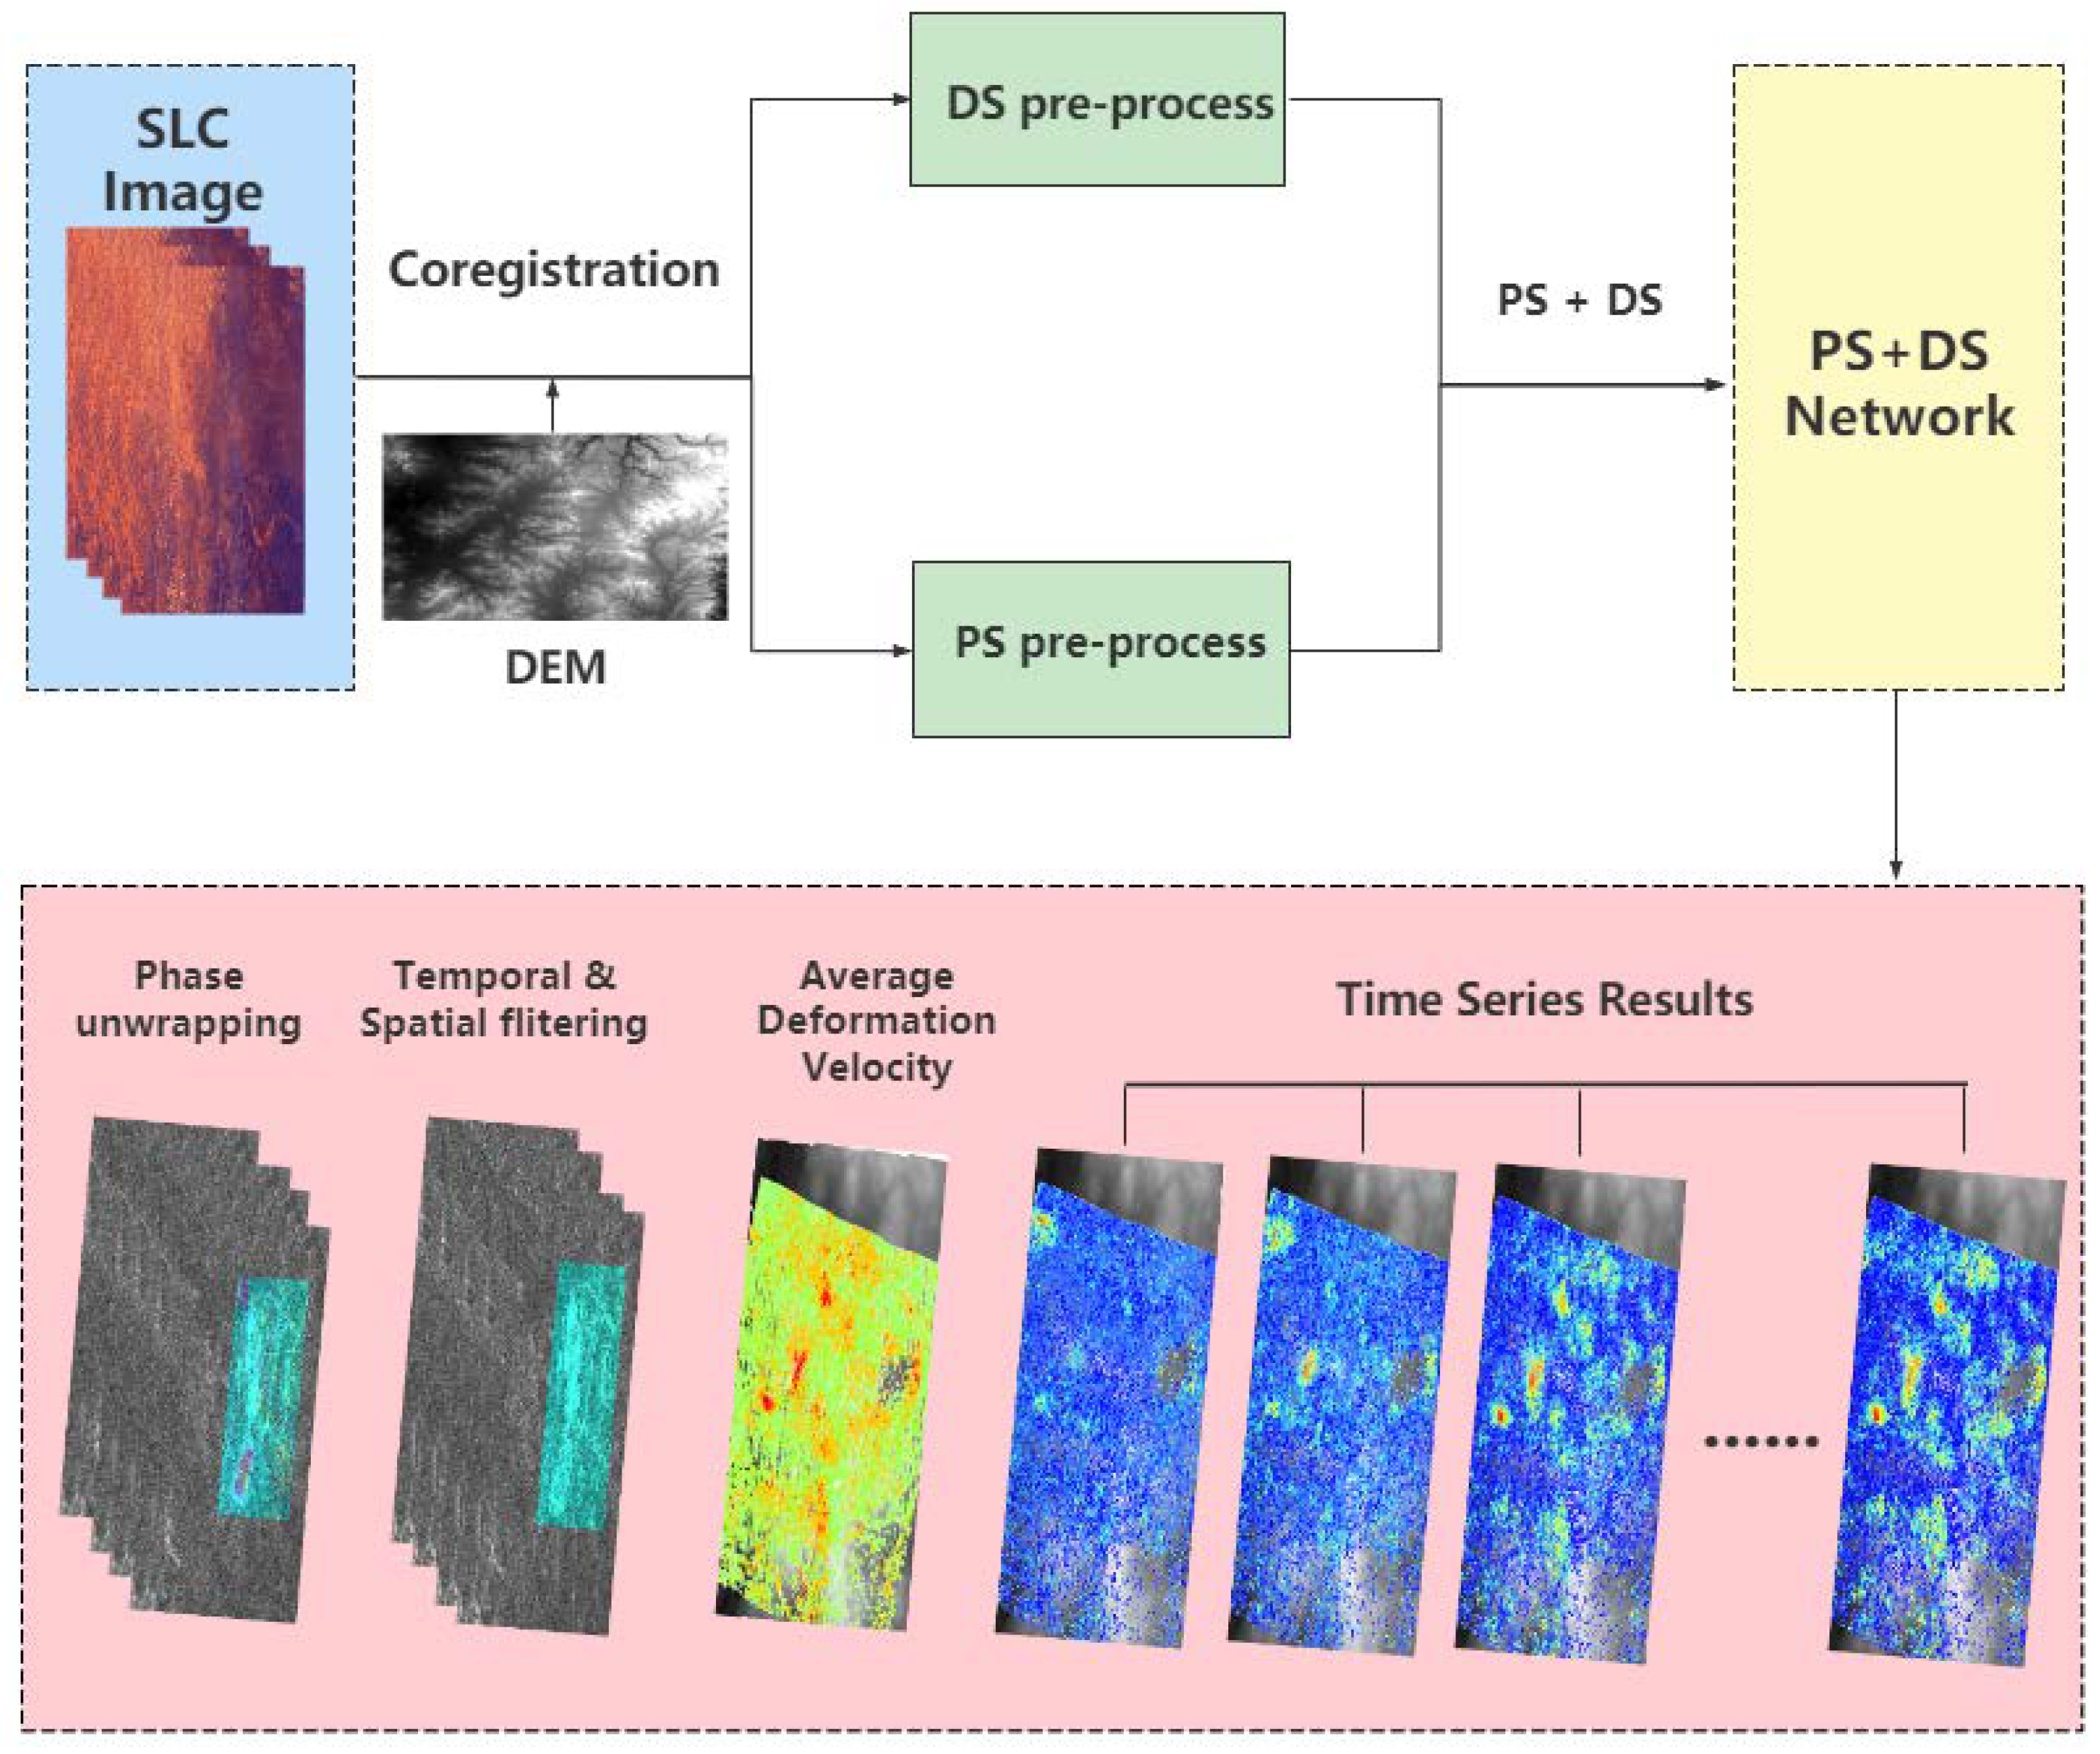
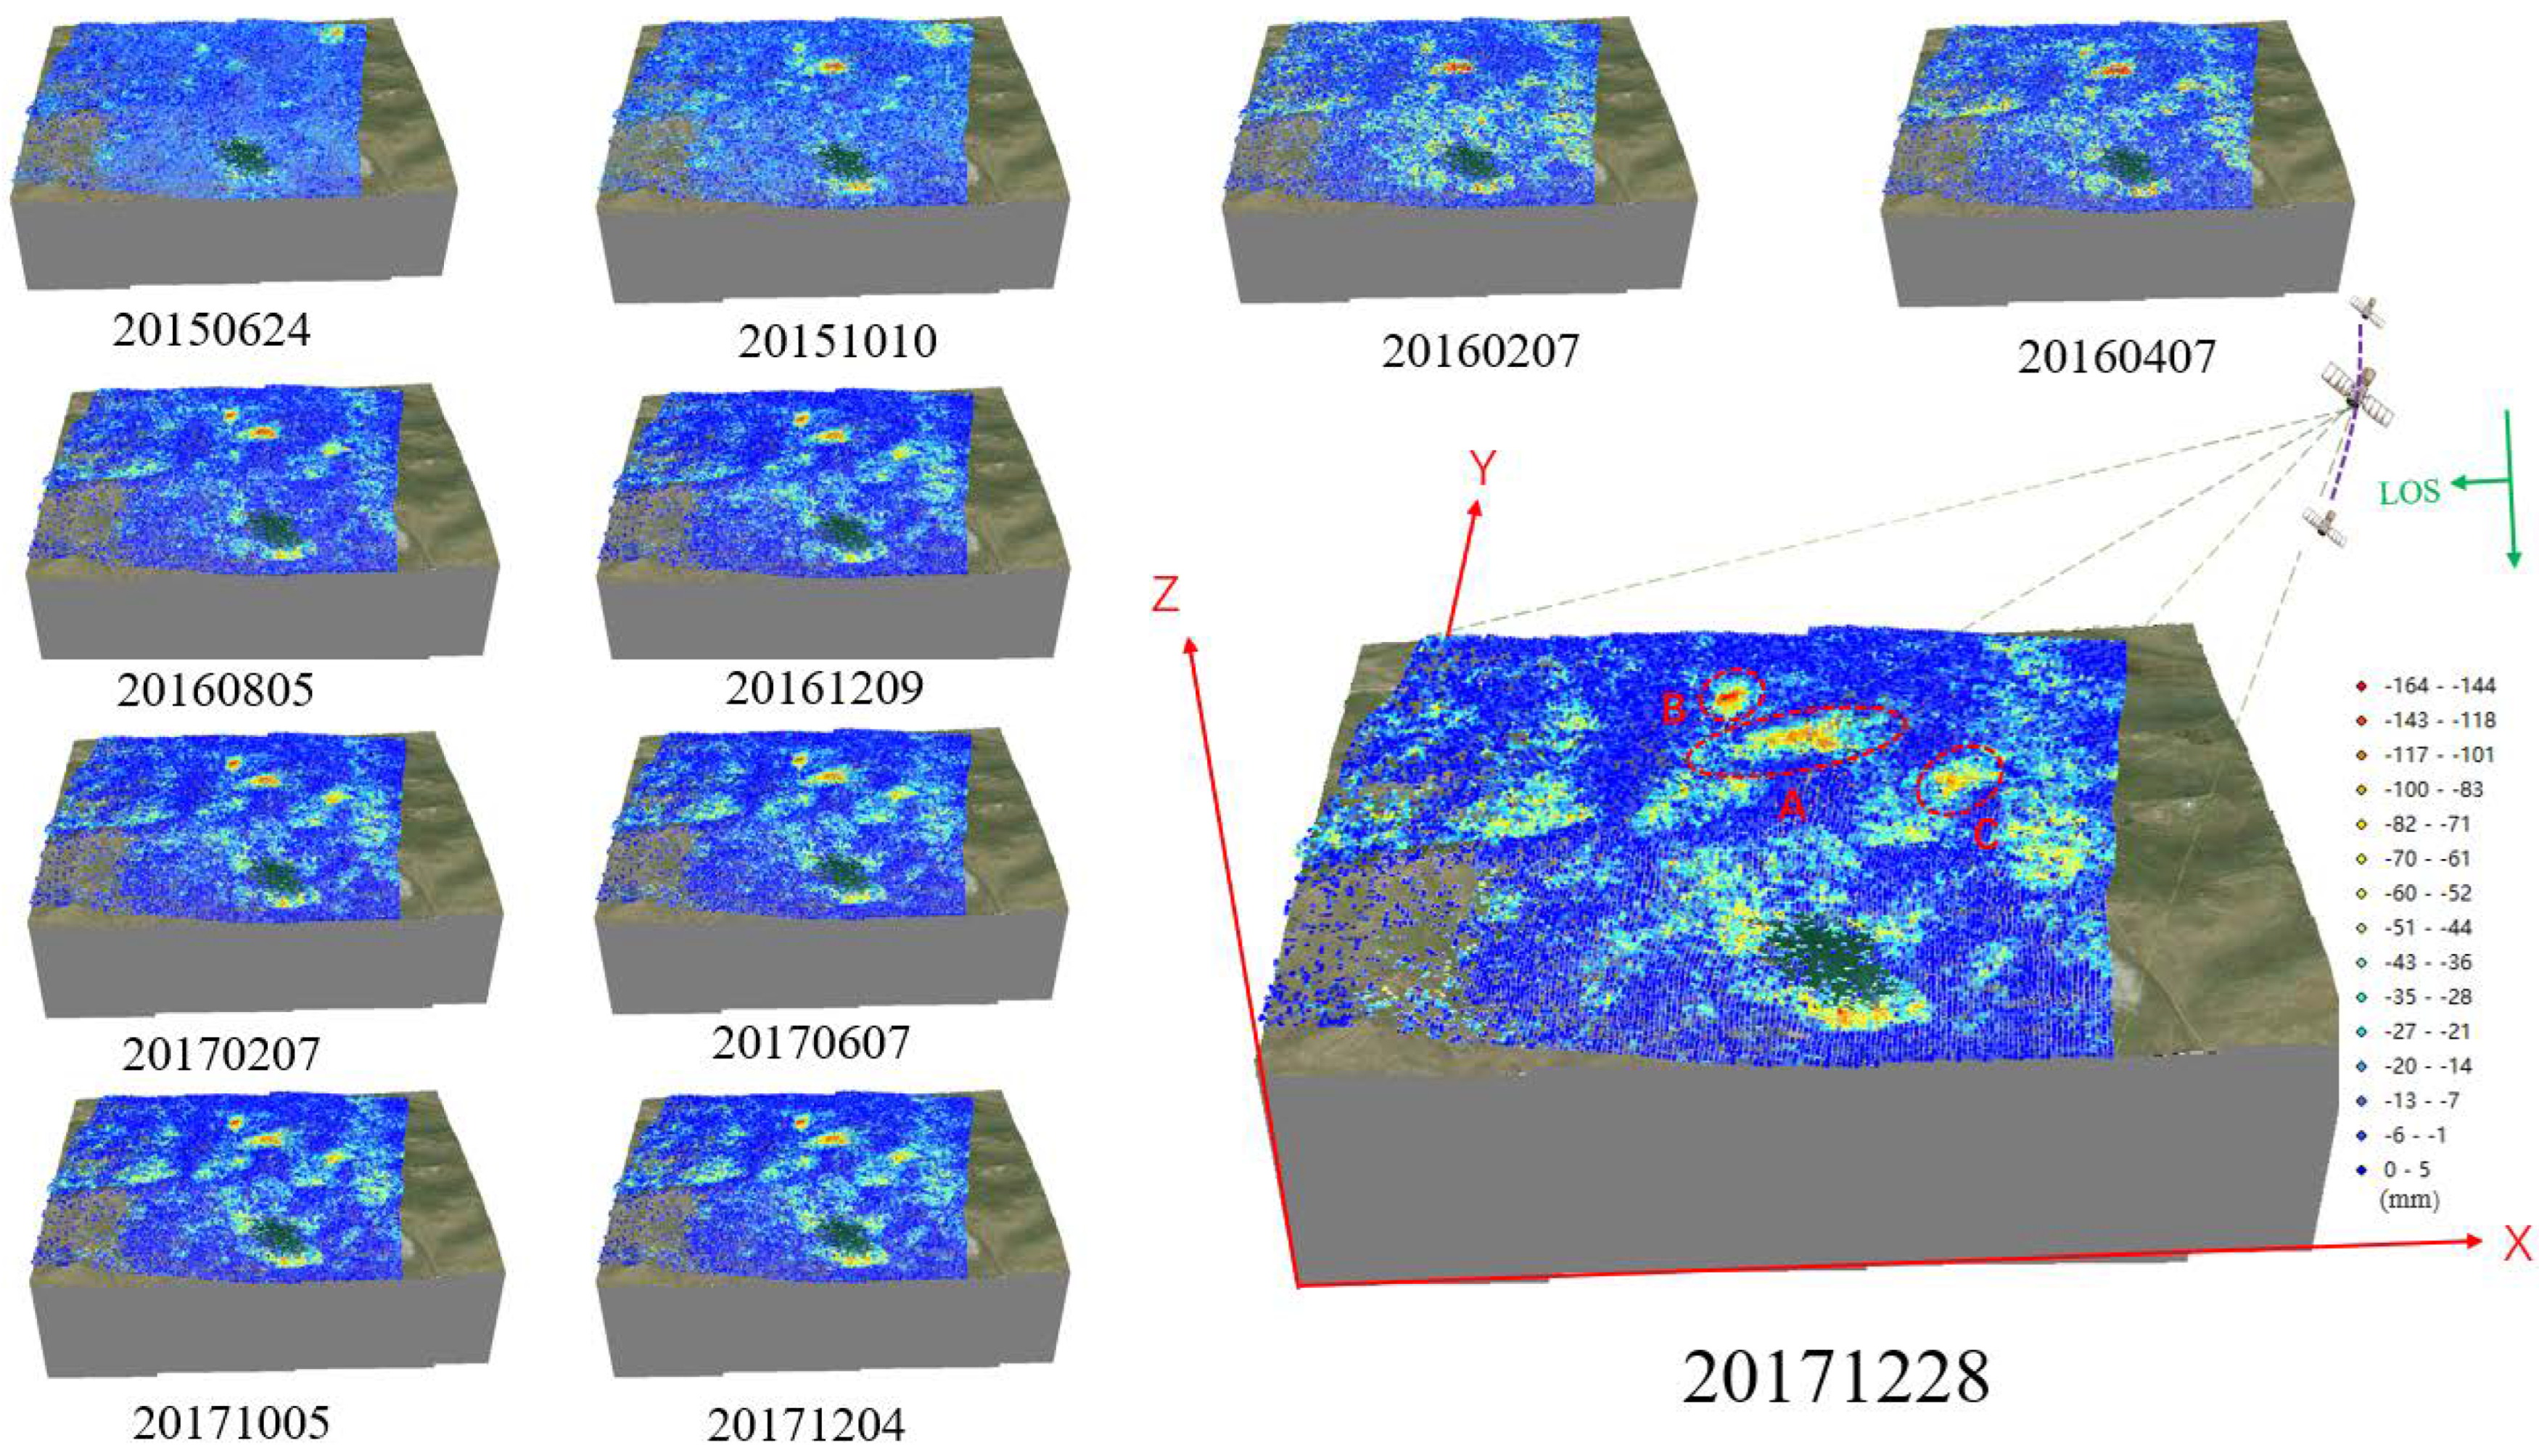
4. Time-Series InSAR Observation of Surface Deformation

The PS-InSAR (PSI) estimates the displacement of PS points over the whole period by searching for targets including large rock bodies, houses, and other similar scatterers through multiple images in the same region. However, areas with few PS points may lead to less accurate deformation results. The distributed-scatterers InSAR (DSI) technique significantly increased the selection of homogeneous points to enhance the accuracy of deformation monitoring in the non-urban area [45]. The CSI method utilized in this paper integrates and upgrades the PSI and DSI methods and is more suitable for monitoring low-coherence regions. It increases the number and density of monitoring points, greatly improving monitoring accuracy and reliability [21].
The processing flow of the CSI method is shown in Figure 3, and its basic principles and steps are as follows: firstly, according to the PSI algorithm proposed by Ferretti, the candidate PS points are selected from the time-series InSAR dataset using the judgment criteria, such as the amplitude dispersion index, and the candidate PS targets are optimally extracted based on the temporal coherence maximization criterion; then, statistically homogeneous pixels (SHPs) with highly similar scattering characteristics are identified from the spatial neighborhood of each image element in the time-series InSAR dataset using a generalized likelihood ratio test, and pixels with SHPs of no less than a preset threshold (typically >20) are selected as candidate distributed scatterers (DS). Finally, the baseline network is constructed by combining the two types of scatterers, i.e., PS and DS, and 3D phase-unwrapping and error-phase separation are performed to solve the time-series deformation [22].
The SAR data were acquired from the C-band Sentinel-1 satellites of the European Space Agency’s Copernicus program (GMES) for the period of 12 June 2015 to 28 December 2017. A total of 75 SAR images of Sentinel-1 descending track data were used to monitor the ground subsidence caused by mining in the Alhada Pb-Zn mine area. The DEM data were provided by the German Earth Observation satellite TanDEM-X.
The CS-InSAR technique was applied to monitor the surface deformation over a long time period and obtain the surface-deformation results in the line-of-sight direction. As shown in Figure 4, time-series cumulative subsidence maps were generated, and all the subsidence maps show cumulative deformation relative to the starting time of 12 June 2015. The warm colors in the figure represent the location with a high amount of subsidence, wherein red is the location with the highest amount of subsidence, and the cool colors represent the locations with no subsidence or a low amount of subsidence. With the increase in mining time, several subsidence areas of different scales have appeared in the mine area, and the subsidence areas are not uniform in spatial distribution. We can see that there are three main surface subsidence areas in the mine area: area A, area B, and area C. Among them, area A is located near Shaft I in the middle of the mine area, area B is located between Shaft II and Shaft III in the western part of the mine area, and area C is located near the drill-core store in the eastern part of the mine area. Throughout the monitoring period, surface subsidence persisted in areas A, B, and C, and the amount and extent of subsidence continually increased. Among them, the surface subsidence in area A developed earliest and was the widest, followed by area B and area C. Although the development of subsidence in area B was relatively late, the rate of subsidence was faster. The maximum accumulated subsidence in the mine area is −164 mm.
Figure 5 shows the subsidence-rate map of the mine area. There are three areas with large subsidence rates in the area, namely A, B, and C, which correspond to the areas with large subsidence on the cumulative subsidence map. The surface subsidence trend in the upper part of Figure 5 shows that the subsidence points located in the three subsidence centers of A, B, and C all exhibit a significant and continuous decline. The cumulative deformation of the selected point in subsidence area A is approximately −111 mm, and the average annual subsidence rate is −45 mm/a; the cumulative deformation of the selected point in subsidence area B is approximately −146 mm, and the average annual subsidence rate is −59 mm/a, and the cumulative deformation of the selected point in subsidence area C is approximately −92 mm, and the average annual subsidence rate is −37 mm/a. The maximum annual average rate of subsidence in the mine area is estimated to be −77 mm/a.

5. Simulated Surface Deformation Based on the Okada Model

The Okada dislocation model was proposed by integrating previous research on the dislocation theory of the elastic half-space model in 1985 [46]. The model was further improved in 1992 [47]. The structure of the Okada dislocation model is simple compared with other models, so the model is widely used in various inversion works, such as seismic-, volcanic-, and oil-field scenarios. In this study, the underground mined ore body was regarded as a fault in the Okada model. Then, a series of model parameters were compared with the parameters of the underground mined ore body to build the model, and the simulation of the mine subsidence deformation was carried out. The Bayesian algorithm is a classical mathematical and statistical method. The nonlinear Bayesian-inversion algorithm is mainly used to solve the problem of the relationship between two conditional probabilities and obtain the posterior probability by utilizing the prior probability and the adjustment factor. In the structural framework of this algorithm, the posterior-probability density distribution, generated based on the prior distribution of model parameters and InSAR observations, was optimally solved to obtain the optimal solution, and the uncertainty of the inversion results was interpreted [48,49].
In this study, seven main model parameters were used in conjunction with practical use, namely, the length of the dislocation surface along the strike (Length), the width along with the tendency (Width), the depth of the geometric center of the dislocation surface (Depth), the angle between the dislocation surface and the due-north direction (Strike), the dislocation tensor (Opening), and the projection coordinates of the geometric center point of the dislocated surface (X, Y). Table 1 and Table 2 show the original inversion parameters of the Okada model and the best-fit parameters of the Okada model, respectively. In the process of model inversion, an independent coordinate system was established for the InSAR observed deformation results, and the coordinates of the reference datum are (118.9983; 46.4356). In this study, the original InSAR deformation data volume in the inversion process was large, and the adaptive quadratic-tree downsampling method was used to improve the inversion efficiency. The data volume was reduced to 175 after downsampling. The overall Poisson’s ratio ν of Alhada Pb-Zn rocks is 0.21.
On the basis of the InSAR observations, the ore-body parameters leading to surface subsidence of Pb-Zn mining were inverted using the multi-source Okada model [31]. As shown in Table 1, the original inversion parameters of the model were set for the inversion and surface-subsidence simulation based on the mine information and InSAR results. According to Table 2, the optimal-model ore-body parameters for subsidence zones A, B, and C were obtained and established in the Cartesian coordinate system. The surface subsidence of subsidence zone A is mainly caused by the change in the finite rectangular source (i.e., the underground mined ore body) at the coordinate position (−83.37 m East, −101.67 m North) and at a depth of 94.51 m; the surface subsidence of subsidence zone B is mainly caused by the change in the finite rectangular source at the coordinate position (−331.89 m East, 336.53 m North) and at a depth of 106.69 m; the surface subsidence of subsidence zone C is mainly caused by the change in the finite rectangular source at the coordinate position (441.87 m East, −310.27 m North) and at a depth of 153.91 m. From Figure 6a,b, it can be seen that the morphology of subsidence zones A, B, and C obtained via InSAR observation is consistent with that simulated by the model. Figure 6c shows the residual plots, and it can be seen that the residual values are small, indicating that the modeled deformation is accurate. We further compare the InSAR observed deformation with the simulated deformation via three profiles, as shown in Figure 6d–f. The solid green lines represent the InSAR observation data, which correspond to the a1-a2, b1-b2, and c1-c2 profiles, respectively, while the purple dashed lines represent the simulation data, which correspond to the a1′-a2′, b1′-b2′, and c1′-c2′ profiles, respectively. The correlation analysis between the InSAR observations and the simulation results is shown in Figure 7, in which the solid red lines represent the linear fit of the model and the black dashed lines represent the 1:1 line. The calculated R2 = 0.81 for the subsidence zone B profile (b1-b2, b1′-b2′), R2 = 0.889 for the subsidence zone A profile (a1-a2, a1′-a2′), and R2 = 0.879 for the subsidence zone C profile (c1-c2, c1′-c2′). The high correlation indicates that the parameters of the model inversion are accurate.

6. Discussion

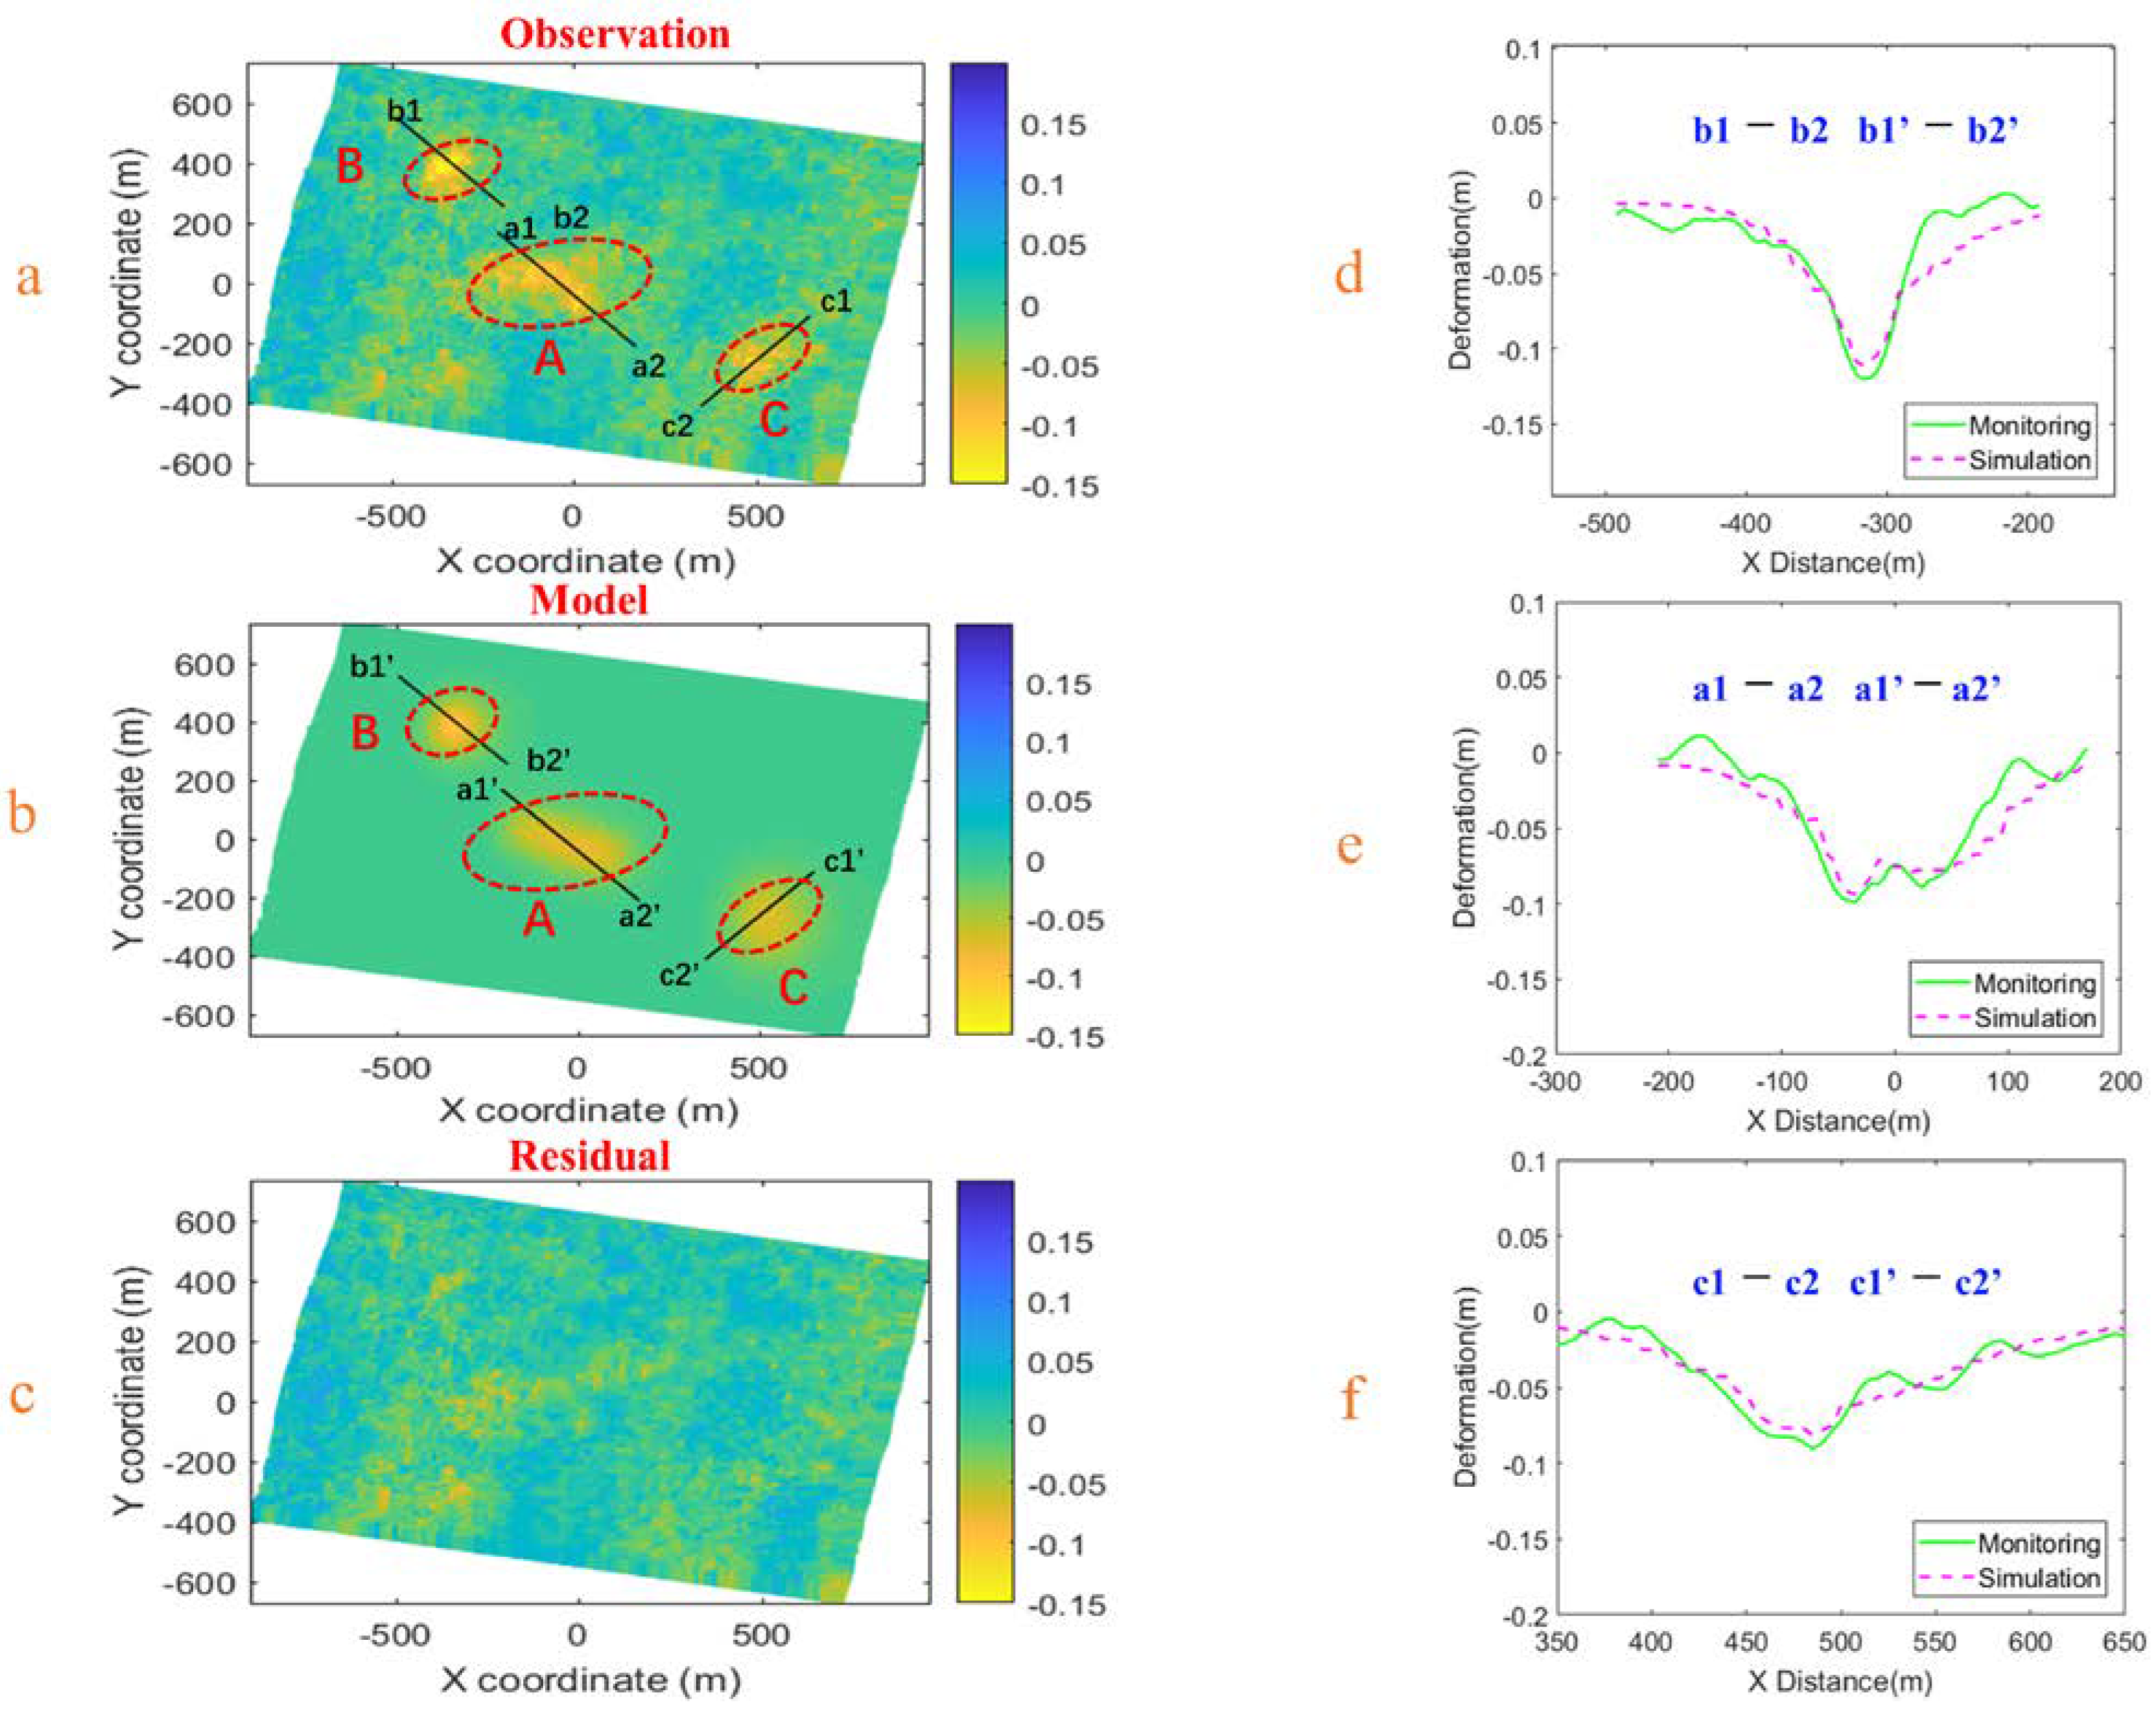
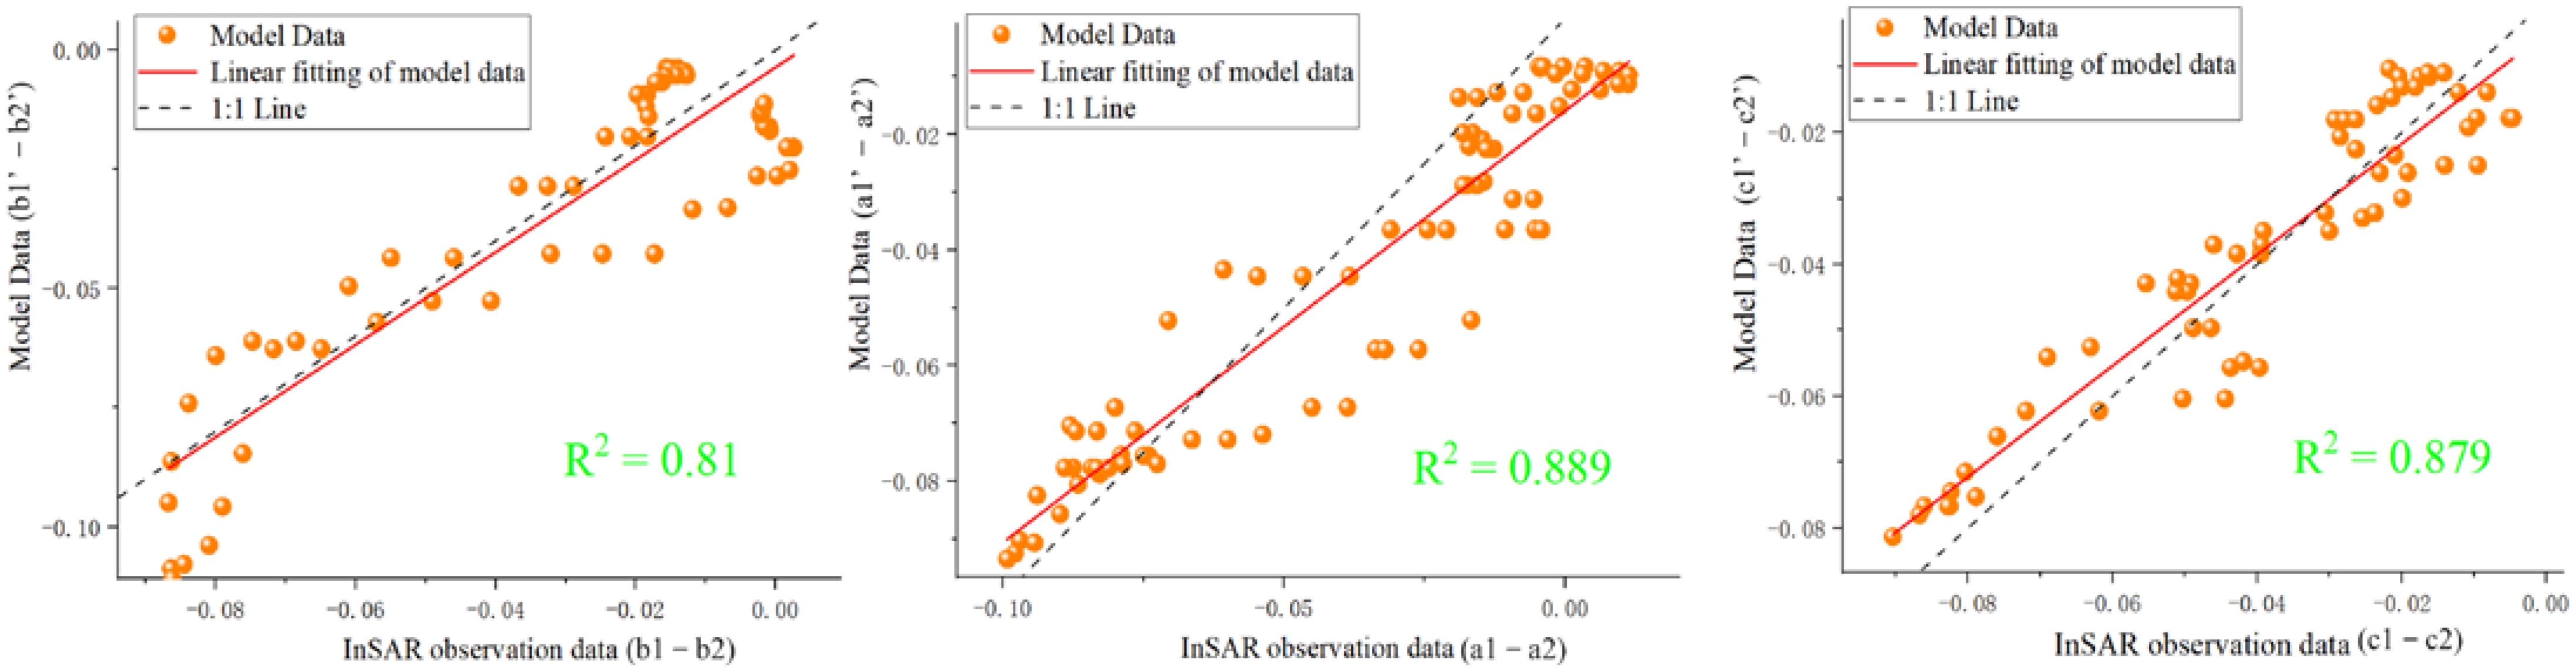
6.1. Comparison Analysis of Theoretically Predicted Deformation, Observed Deformation, and Simulated Deformation

In this study, the probabilistic integral method was used to predict the surface subsidence of the underground mining area formed by the mining of the 848 middle-section ore body and 808 middle-section ore body in the Alhada Pb-Zn mine. The predicted areas are the three main subsidence areas in the mine, namely, central subsidence area A, western subsidence area B, and eastern subsidence area C. The predicted subsidence values are 107 mm for subsidence area A, 120 mm for subsidence area B, and 83 mm for subsidence area C. The InSAR monitoring results show that the subsidence values of subsidence area A are concentrated between 90 and 130 mm, the subsidence values of subsidence area B are concentrated between 90 and 160 mm, and the subsidence values of subsidence area C are concentrated between 70 and 110 mm. The location of the mine subsidence area monitored by InSAR is consistent with the actual area, and the predicted results from the probability integral method exhibit some deviation from the InSAR monitoring results. However, the trend of the predicted results of the probability integral method is consistent with the InSAR monitoring results, that is, subsidence area B has the largest subsidence amplitude, followed by subsidence area A and subsidence area C. As we can see in Figure 6d–f, the green solid line represents the InSAR observed deformation, and the pink dashed line represents the simulated deformation from the Okada model. As can be seen in Figure 6d, the maximum value of observed subsidence (b1-b2) in subsidence zone B is about 122 mm. The maximum simulated subsidence value (b1′-b2′) differs from the maximum observed subsidence value by about 8 mm; similarly, as can be seen in Figure 6e, the maximum value of observed subsidence (a1-a2) in subsidence zone A is about 100 mm. The difference between the maximum simulated (a1′-a2′) and observed subsidence is about 5 mm; it can be seen from Figure 6f that the maximum value of the observed subsidence value (c1-c2) in subsidence area C is about 95 mm. The maximum simulated subsidence (c1′-c2′) differs from the maximum observed subsidence by about 9 mm. Overall, we can see that the observed deformation via InSAR and the simulated deformation via the Okada model have similar trends, but the maximum subsidences are slightly different. The main reason for this is that the simulated deformation is affected by the noise in the InSAR results, which results in the simulation results being marginally smaller than the observed subsidence; however, the correlation between the two is significant, and the optimal inversion parameters of the Okada model are consistent with the actual scenario. In addition, on the basis of the Okada model, we used the surface subsidence of the mine area to invert the main mining ore bodies that cause surface subsidence, including their approximate location in the subsurface, and the morphology of the ore bodies. As shown in Table 2, the burial depths of the ore bodies in subsidence areas A, B, and C are 94.51 m, 106.69 m, and 153.91 m, respectively. As shown in Figure 8, the middle section of the 888 ore body of the Alhada mine has a strike length of 1195 m, a tendency length of 58 m, an upper-boundary depth of 80 m, and a lower-boundary depth of 112 m; the middle section of the 848 ore body has a strike length of 1394 m, a tendency length of 61 m, an upper-boundary depth of 120 m, and a lower-boundary depth of 152 m; and the middle section of the 808 ore body has a strike length of 1113 m, a tendency length of 59 m, an upper-boundary depth of 160 m, and a lower-boundary depth of 192 m. This indicates that the main mining location of the ore body causing surface subsidence is concentrated near the ore body in the middle sections of 888–848. Therefore, the main underground mined ore body causing subsidence in subsidence areas A and B is the middle section of the 888 ore body, and the main underground mined ore body causing subsidence in subsidence area C is the middle section of the 848 ore body.

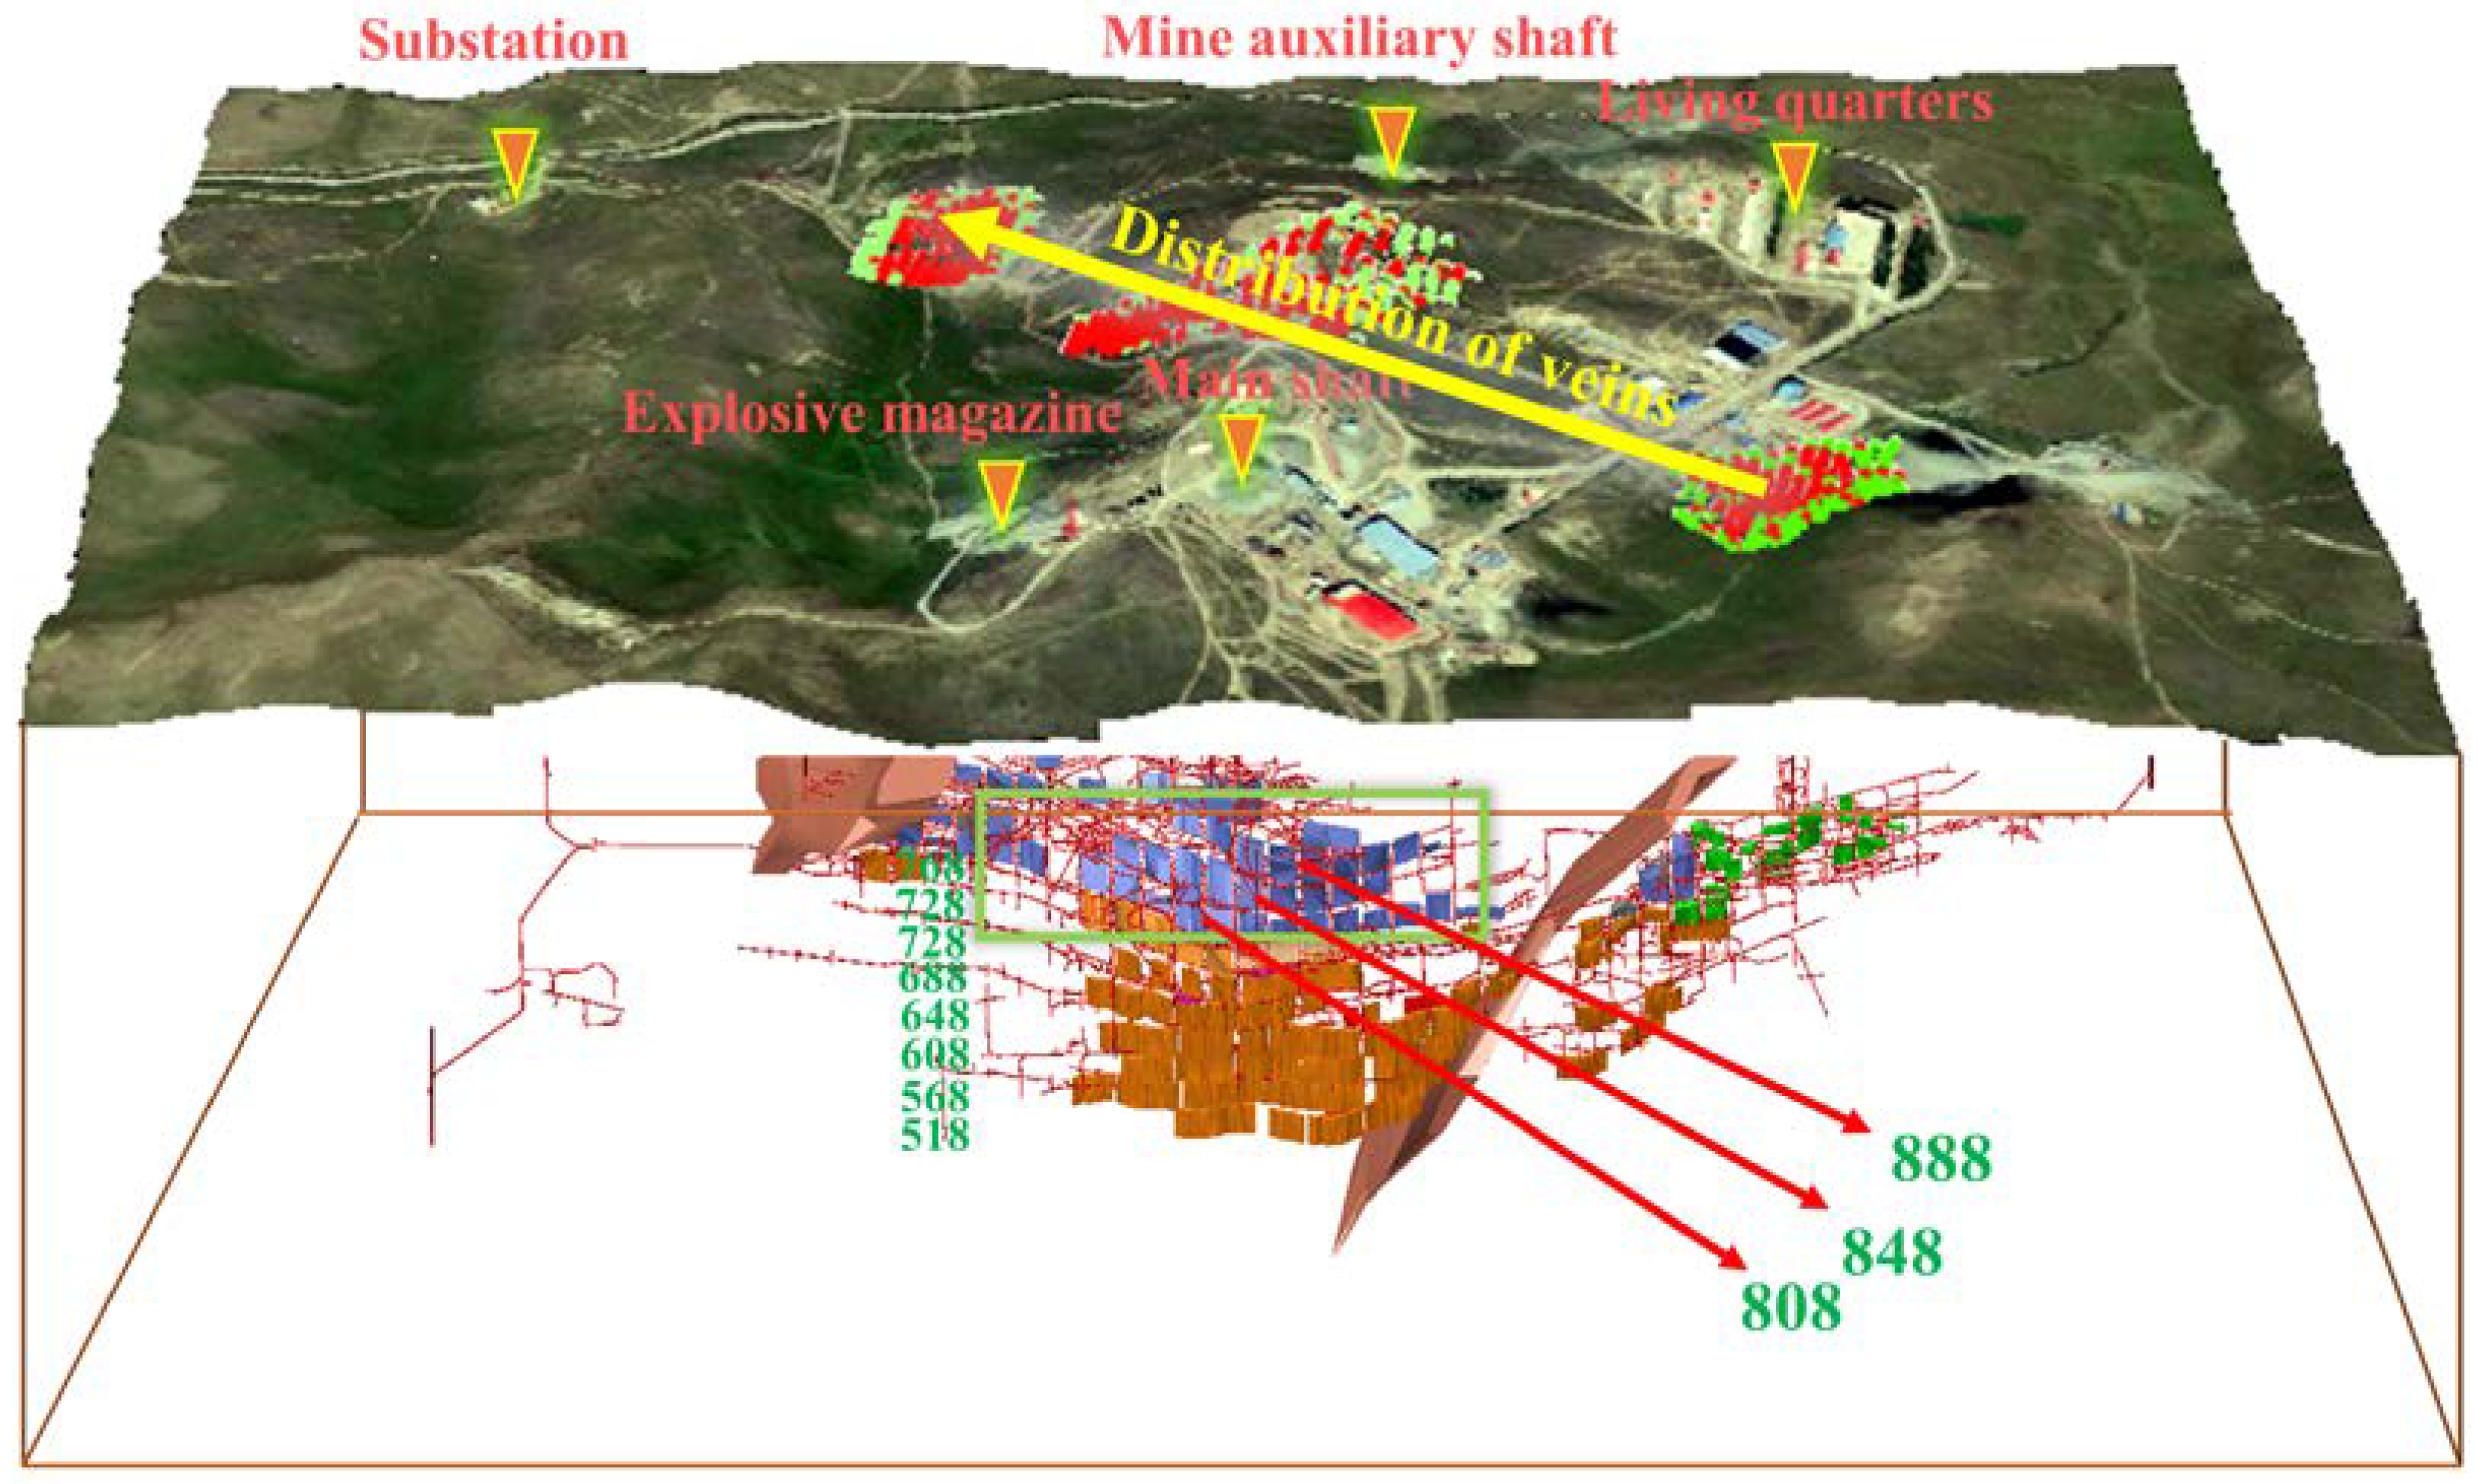
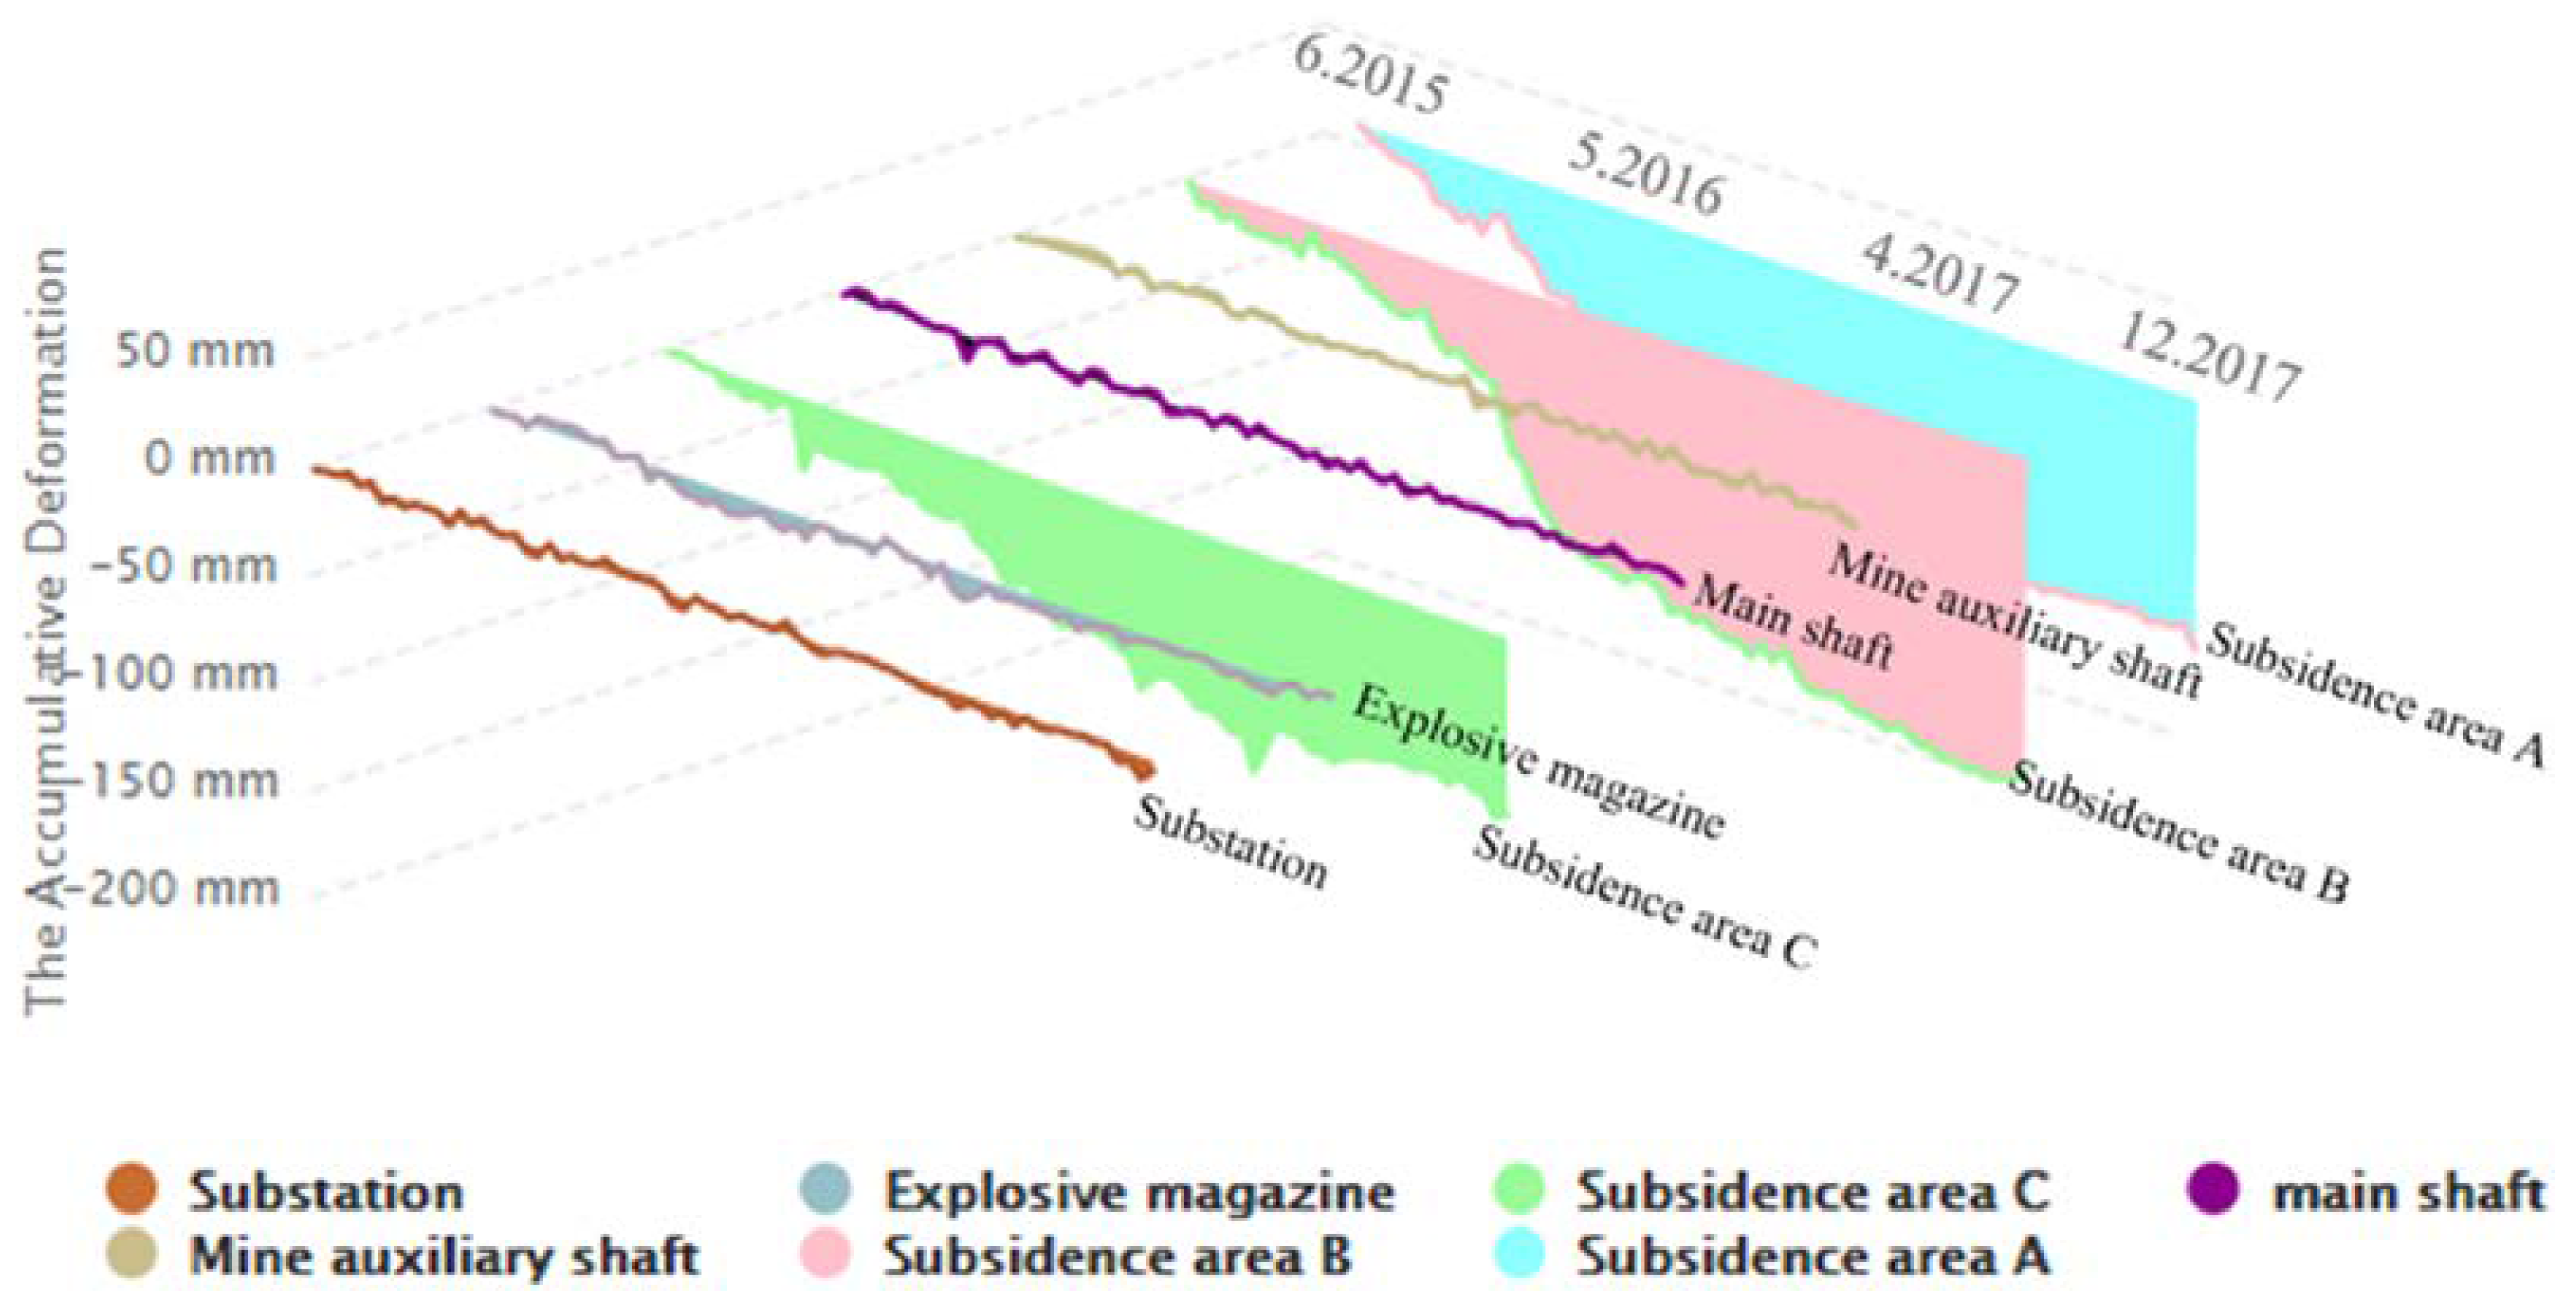
6.2. Surface Stability Analysis

Currently, mining and residual ore recovery are underway at the Alhada Pb-Zn mine, with a small portion of the 808 middle-section ore body undergoing residual ore recovery, and mining in the ore body above the 468 middle section having been stopped and the body filled. As shown in Figure 9, the subsidence in areas A, B, and C is relatively obvious, i.e., the deformation value of the mine substation is approximately −2 mm, the deformation value of the explosive magazine is approximately −3 mm, the deformation value of the main shaft is approximately −1 mm, and the deformation value of the mine auxiliary shaft is approximately −1 mm. The fluctuation of the time-series deformation of the main buildings in the mine area is mainly concentrated between −5 and 5 mm. Considering the InSAR observation noise, the deformation value of the main buildings in the mine area is essentially negligible, and it can be concluded that the main buildings in the mine area are not affected by surface subsidence, the surrounding ground surface is relatively stable, and the subsidence in the mine area will not damage the main buildings.
The Alhada Pb-Zn mine is a skarn ore deposit, with intrusive rocks and carbonate rocks representing the main rocks in the deposit. The majority of the surrounding rock is slate. Figure 10 shows the current situation concerning the surface-collapse pits in the mine area. Regarding the surface-collapse pits in the mine area and the filling effect of the goaf, the surface-collapse pits caused by the goaf have gradually disappeared, no obvious cracks were produced on the surface, and the filled mining area did not appear to be destabilized or collapsed. This indicates that the Alhada Pb-Zn mine has been filled well and the filling body played a positive role in supporting the overlying rock layer of the ore body. No destabilization collapse occurred in the filled mining area; the filling of the collapse pit and the goaf has led to better ground-pressure control and management. In the short term, it seems that no large-scale surface subsidence will occur in the mine area.

7. Conclusions

In this study, on the basis of three technical methods, i.e., the probabilistic integration method, the InSAR technique, and the Okada dislocation model, a comparative analysis of the predicted deformation, observed deformation, and simulated deformation of surface subsidence was conducted in the Alhada Pb-Zn mine area.
Firstly, the probabilistic integral method was utilized to predict the surface subsidence of the mine area in the absence or inability of geophysical exploration and engineering survey. Then, the time-series deformation map of the whole mine region was obtained based on the InSAR technique. Finally, the multi-source Okada model was used to invert the parameters of the ore body and simulate the surface deformation, serving as comparative analysis and mutual verification of the obtained deformations. The three methods were used to monitor surface subsidence in a synergistic manner, avoiding the limitations associated with a single method.
What needs to be pointed out is that the simulated deformation is very consistent with the InSAR observed deformation, but the maximum simulated subsidence is about 10 mm smaller than the InSAR observed subsidence; this is mainly due to the noise in the InSAR results caused by the complex geomorphology in the studied region, we will improve the InSAR algorithm and the inversion model in the future to obtain higher observation and simulation accuracy.
Our work showed that the three methods could be collaboratively used to analyze the surface deformation caused by underground mining. Using theoretical, observational, and modeling methods, the areal extent, magnitude, and dynamic evolution of the surface subsidence can be acquired, the underground ore bodies that result in surface deformation can be identified, and the stability of the main buildings on the surface can be analyzed; this could provide basic data for subsidence control work and guarantee mine production safety.

Author Contributions

Conceptualization, L.H.; methodology, L.H. and J.C.; software, J.C., W.C. and J.K.; validation, L.H. and J.C.; formal analysis, J.C. and Y.M.; investigation, H.L., K.G., P.P., Y.Z., X.W. and Y.W.; writing—original draft preparation, J.C.; writing—review and editing, L.H.; visualization, J.C.; supervision, L.H.; project administration, L.H.; funding acquisition, L.H. All authors have read and agreed to the published version of the manuscript.

Funding

This research was funded by the National Natural Science Foundation of China (grant number 41974028), and by the Fundamental Research Funds for the Central Universities (grant number N2201013).

Data Availability Statement

The data presented in this study are available on request from the corresponding author. The data are not publicly available due to privacy issues.

Acknowledgments

We downloaded the Sentinel-1 SAR data from ESA (https://www.esa.int, accessed on 8 May 2021). We downloaded the TanDEM data from DLR (https://download.geoservice.dlr.de/TDM90, accessed on 8 May 2021). We downloaded images of the mine’s surface from Google Maps.

Conflicts of Interest

The authors declare no conflict of interest.

References

  1. Botchway, F.N. Privatisation and State Control—The Case of Ashanti Goldfields Company. J. Energy Nat. Resour. Law 2004, 22, 201–217. [Google Scholar] [CrossRef]
  2. Yang, Y.-Y.; Xu, Y.-S.; Shen, S.-L.; Yuan, Y.; Yin, Z.-Y. Mining-induced geo-hazards with environmental protection measures in Yunnan, China: An overview. Bull. Eng. Geol. Environ. 2015, 74, 141–150. [Google Scholar] [CrossRef]
  3. Tajduś, K.; Sroka, A.; Misa, R.; Hager, S.; Rusek, J.; Dudek, M.; Wollnik, F. Analysis of Mining-Induced Delayed Surface Subsidence. Minerals 2021, 11, 1187. [Google Scholar] [CrossRef]
  4. Rošer, J.; Potočnik, D.; Vulić, M. Analysis of dynamic surface subsidence at the underground coal mining site in Velenje, Slovenia through modified sigmoidal function. Minerals 2018, 8, 74. [Google Scholar] [CrossRef] [Green Version]
  5. Guzy, A.; Malinowska, A.A. Assessment of the Impact of the Spatial Extent of Land Subsidence and Aquifer System Drainage Induced by Underground Mining. Sustainability 2020, 12, 7871. [Google Scholar] [CrossRef]
  6. Lechner, A.M.; Baumgartl, T.; Matthew, P.; Glenn, V. The impact of underground longwall mining on prime agricultural land: A review and research agenda. Land Degrad. Dev. 2016, 27, 1650–1663. [Google Scholar] [CrossRef]
  7. Manas, I. 3D modeling of surface quarries and deposits of mined materials and the MONITORING of slopes. Acta Montan. Slovaca 2007, 12, 437–453. [Google Scholar]
  8. Gili, J.; Lantada, N.; Concha, A.; Soler, X.; Puig, C.; Marturia, J. Comparing several GPS post-processing strategies for a potash basin monitoring network in northeast Spain: First results. IAHS-AISH Publ. 2010, 339, 371–373. [Google Scholar]
  9. Dardanelli, G.; La Loggia, G.; Perfetti, N.; Capodici, F.; Puccio, L.; Maltese, A. Monitoring displacements of an earthen dam using GNSS and remote sensing. In Proceedings of the Remote Sensing for Agriculture, Ecosystems, and Hydrology XVI, Amsterdam, The Netherlands, 23–25 September 2014; pp. 574–589. [Google Scholar]
  10. Lian, X.; Li, Z.; Yuan, H.; Hu, H.; Cai, Y.; Liu, X. Determination of the Stability of High-Steep Slopes by Global Navigation Satellite System (GNSS) Real-Time Monitoring in Long Wall Mining. Appl. Sci. 2020, 10, 1952. [Google Scholar] [CrossRef] [Green Version]
  11. Abdikan, S.; Arıkan, M.; Sanli, F.B.; Cakir, Z. Monitoring of coal mining subsidence in peri-urban area of Zonguldak city (NW Turkey) with persistent scatterer interferometry using ALOS-PALSAR. Environ. Earth Sci. 2014, 71, 4081–4089. [Google Scholar] [CrossRef]
  12. Yang, Z.; Li, Z.; Zhu, J.; Wang, Y.; Wu, L. Use of SAR/InSAR in mining deformation monitoring, parameter inversion, and forward predictions: A review. IEEE Geosci. Remote Sens. Mag. 2020, 8, 71–90. [Google Scholar] [CrossRef]
  13. Witkowski, W.T.; Łukosz, M.; Guzy, A.; Hejmanowski, R. Estimation of Mining-Induced Horizontal Strain Tensor of Land Surface Applying InSAR. Minerals 2021, 11, 788. [Google Scholar] [CrossRef]
  14. He, L.; Wu, L.; Liu, S.; Wang, Z.; Su, C.; Liu, S.-N. Mapping two-dimensional deformation field time-series of large slope by coupling DInSAR-SBAS with MAI-SBAS. Remote Sens. 2015, 7, 12440–12458. [Google Scholar] [CrossRef] [Green Version]
  15. Wang, L.; Teng, C.; Jiang, K.; Jiang, C.; Zhu, S. D-InSAR Monitoring Method of Mining Subsidence Based on Boltzmann and Its Application in Building Mining Damage Assessment. KSCE J. Civ. Eng. 2022, 26, 353–370. [Google Scholar] [CrossRef]
  16. Wang, G.; Xie, M.; Chai, X.; Wang, L.; Dong, C. D-InSAR-based landslide location and monitoring at Wudongde hydropower reservoir in China. Environ. Earth Sci. 2013, 69, 2763–2777. [Google Scholar] [CrossRef]
  17. Saepuloh, A.; Urai, M.; Aisyah, N.; Widiwijayanti, C.; Jousset, P. Interpretation of ground surface changes prior to the 2010 large eruption of Merapi volcano using ALOS/PALSAR, ASTER TIR and gas emission data. J. Volcanol. Geotherm. Res. 2013, 261, 130–143. [Google Scholar] [CrossRef]
  18. Wang, Z.; Zhang, J.; Huang, G. Monitoring Co-seismic Deformation Fields of Bam Earthquake Using D-InSAR Technique. In Proceedings of the 2009 International Conference on Environmental Science and Information Application Technology, Wuhan, China, 4–5 July 2009; pp. 487–490. [Google Scholar]
  19. Berardino, P.; Fornaro, G.; Lanari, R.; Sansosti, E. A new algorithm for surface deformation monitoring based on small baseline differential SAR interferograms. IEEE Transactions on geoscience and remote sensing 2002, 40, 2375–2383. [Google Scholar] [CrossRef] [Green Version]
  20. Ferretti, A.; Prati, C.; Rocca, F. Permanent scatterers in SAR interferometry. IEEE Trans. Geosci. Remote Sens. 2001, 39, 8–20. [Google Scholar] [CrossRef]
  21. Dong, J.; Zhang, L.; Tang, M.; Liao, M.; Xu, Q.; Gong, J.; Ao, M. Mapping landslide surface displacements with time series SAR interferometry by combining persistent and distributed scatterers: A case study of Jiaju landslide in Danba, China. Remote Sens. Environ. 2018, 205, 180–198. [Google Scholar] [CrossRef]
  22. Zhang, L.; Liao, M.; Dong, J.; Xu, Q.; Gong, J. Early Detection of Landslide Hazards in Mountainous Areas of West China Using Time Series SAR Interferometry-A Case Study of Danba, Sichuan. Geomat. Inf. Sci. Wuhan Univ. 2018, 43, 2039. [Google Scholar] [CrossRef]
  23. Wang, J.; Wang, C.; Xie, C.; Zhang, H.; Tang, Y.; Zhang, Z.; Shen, C. Monitoring of large-scale landslides in Zongling, Guizhou, China, with improved distributed scatterer interferometric SAR time series methods. Landslides 2020, 17, 1777–1795. [Google Scholar] [CrossRef]
  24. Fan, H.; Liu, Y.; Xu, Y.; Yang, H. Surface subsidence monitoring with an improved distributed scatterer interferometric SAR time series method in a filling mining area. Geocarto International 2021, 1–23. [Google Scholar] [CrossRef]
  25. Liu, B.; Liao, G. Basic Law of Surface Movement in Coal Mine; China Coal Industry Press: Beijing, China, 1965. [Google Scholar]
  26. Tan, X.; Song, B.; Bo, H.; Li, Y.; Wang, M.; Lu, G. Extraction of Irregularly Shaped Coal Mining Area Induced Ground Subsidence Prediction Based on Probability Integral Method. Appl. Sci. 2020, 10, 6623. [Google Scholar] [CrossRef]
  27. Guo, Q.; Chen, H.; Luo, J.; Wang, X.; Wang, L.; Lv, X.; Wang, L. Parameter inversion of probability integral method based on improved crow search algorithm. Arab. J. Geosci. 2022, 15, 1–15. [Google Scholar] [CrossRef]
  28. Li, C.; Xie, M.; Li, X. GIS and probability integral based approach for subsidence prediction and application to Beiminghe Iron Mine. Chin. J. Rock Mech. Eng. 2007, 26, 1244–1245. [Google Scholar]
  29. Liu, S.; L, C.; Ma, H. Calculation of Surface Influence Area for an Underground Expanding Iron Ore. Met. Mine 2015, 44, 42–45. [Google Scholar]
  30. DeGrandpre, K.; Wang, T.; Lu, Z.; Freymueller, J.T. Episodic inflation and complex surface deformation of Akutan volcano, Alaska revealed from GPS time-series. J. Volcanol. Geotherm. Res. 2017, 347, 337–359. [Google Scholar] [CrossRef]
  31. He, L.; Wang, X.; Liu, C.; Tang, Y.; Zhang, X.; Kang, J.; Guo, C.; He, R. Time series interferometric synthetic aperture radar-based modeling and analysis of complex land subsidence caused by multi-seam coal mining on the Liaohe Plain, China. J. Appl. Remote Sens. 2022, 16, 024512. [Google Scholar] [CrossRef]
  32. Chen, Y.; Wu, J.; Guo, L.; Wang, X.; Tan, H.; Shen, C. 3D coseismic deformation inversion of Wenchuan Ms8. 0 earthquake with D-InSAR and the fault movement model. In Proceedings of the Remote Sensing of the Environment: 19th National Symposium on Remote Sensing of China, Xi’an, China, 20 October 2015; pp. 161–168. [Google Scholar]
  33. Hu, J.; Li, Z.; Zhu, J.; Ren, X.; Ding, X. Inferring three-dimensional surface displacement field by combining SAR interferometric phase and amplitude information of ascending and descending orbits. Sci. China Earth Sci. 2010, 53, 550–560. [Google Scholar] [CrossRef]
  34. He, Y.-Y.; Zhang, B.-P.; Duan, Y.-T.; Xue, C.-J.; Yan, X.; He, C.; Hu, T.-Y. Numerical simulation of surface and downhole deformation induced by hydraulic fracturing. Appl. Geophys. 2014, 11, 63–72. [Google Scholar] [CrossRef]
  35. Du, X.; Feng, G.; Qi, T.; Guo, Y.; Zhang, Y.; Wang, Z. Failure characteristics of large unconfined cemented gangue backfill structure in partial backfill mining. Constr. Build. Mater. 2019, 194, 257–265. [Google Scholar] [CrossRef]
  36. Yu, H.; Li, S.; Wang, X. The Recent Progress China Has Made in the Backfill Mining Method, Part I: The Theory and Equipment of Backfill Pipeline Transportation. Minerals 2021, 11, 1274. [Google Scholar] [CrossRef]
  37. Horberry, T. The health and safety benefits of new technologies in mining: A review and strategy for designing and deploying effective user-centred systems. Minerals 2012, 2, 417–425. [Google Scholar] [CrossRef] [Green Version]
  38. Ruan Dawei, L.S.; Bi, Y.; Liu, X.; Chen, X.; Wang, X.; Wang, K. Ore-Controlling Structures and Deep Metallogenic Prediction of Aerhada Pb-Zn Deposit in Inner Mongolia. J. Jilin Univ. (Earth Sci. Ed.) 2017, 47, 1705–1716. [Google Scholar]
  39. Ke, L.; Zhang, H.; Liu, J.; Zhai, D.; Guo, D.; Yang, J.; Tan, Q.; Xu, Y.; Zhang, M.; Wang, S. Fluid inclusion, HO, S, Pb and noble gas isotope studies of the Aerhada Pb-Zn-Ag deposit, Inner Mongolia, NE China. Ore Geol. Rev. 2017, 88, 304–316. [Google Scholar] [CrossRef]
  40. Zhang, W.; Nie, F.; Liu, S.; Zuo, L.; Yao, X.; Jia, D.; Liu, J. Characteristics and genesis of mineral deposits in East Ujimqin Banner, western segment of the Great Xing’an Mountains, NE China. J. Asian Earth Sci. 2015, 97, 459–471. [Google Scholar] [CrossRef]
  41. Zhu, C.; Wang, Z.; Li, P.; Motagh, M.; Zhang, L.; Jiang, Z.; Long, S. Retrieval and prediction of three-dimensional displacements by combining the DInSAR and probability integral method in a mining area. IEEE J. Sel. Top. Appl. Earth Obs. Remote Sens. 2020, 13, 1206–1217. [Google Scholar] [CrossRef]
  42. Wang, L.; Shangjun, Z.; Chuang, J.; Jingyu, L.; Kegui, J.; Chaoqun, T.; Tao, W.; Qing-biao, G. Research on 3D Laser Scanning Monitoring Method for Mining Subsidence Based on the Auxiliary for Probability Integral Method. KSCE J. Civ. Eng. 2021, 25, 4403–4416. [Google Scholar] [CrossRef]
  43. Knothe, S. Observations of surface movements under influence of mining and their theoretical interpretation. In Proceedings of the European Congress on Ground Movement, Leeds, UK, 9–12 April 1957; pp. 9–12. [Google Scholar]
  44. Hu, D.; He, N.; Gao, D. Numerical Simulation of Surface Deformation in Goaf. IOP Conf. Ser. Earth Environ. Sci. 2020, 558, 022009. [Google Scholar] [CrossRef]
  45. Ferretti, A.; Fumagalli, A.; Novali, F.; Prati, C.; Rocca, F.; Rucci, A. A new algorithm for processing interferometric data-stacks: SqueeSAR. IEEE Trans. Geosci. Remote Sens. 2011, 49, 3460–3470. [Google Scholar] [CrossRef]
  46. Okada, Y. Surface deformation due to shear and tensile faults in a half-space. Bull. Seismol. Soc. Am. 1985, 75, 1135–1154. [Google Scholar] [CrossRef]
  47. Okada, Y. Internal deformation due to shear and tensile faults in a half-space. Bull. Seismol. Soc. Am. 1992, 82, 1018–1040. [Google Scholar] [CrossRef]
  48. Bagnardi, M.; Hooper, A. Inversion of surface deformation data for rapid estimates of source parameters and uncertainties: A Bayesian approach. Geochem. Geophys. Geosystems 2018, 19, 2194–2211. [Google Scholar] [CrossRef]
  49. Jiang, Y.; González, P.J. Bayesian inversion of wrapped satellite interferometric phase to estimate fault and volcano surface ground deformation models. J. Geophys. Res. Solid Earth 2020, 125, e2019JB018313. [Google Scholar] [CrossRef]
Figure 1. Location of the mining area. The upper portion represents the border of Inner Mongolia, China, and the background is the shaded DEM. The blue box indicates the study area. The lower portion is a satellite image of the mine area. The red triangles indicate the locations of shaft I, shaft II, and shaft III. (Satellite image is taken from Google Maps).
Minerals 12 00977 g001
Figure 2. Distribution map of the vein of Alhada Pb-Zn mine [40].
Minerals 12 00977 g002
Figure 3. CS-InSAR data processing flow.
Minerals 12 00977 g003
Figure 4. Cumulative subsidence.
Minerals 12 00977 g004
Figure 5. Subsidence-rate diagram of the mining area.
Minerals 12 00977 g005
Figure 6. (a) InSAR observed deformation; (b) simulated deformation from Okada model; (c) residual graph; (df) profile line of observed data and profile line of simulated data.
Minerals 12 00977 g006
Figure 7. Correlation analysis diagram of the InSAR observation deformation and simulation deformation on the profile line in the subsidence area.
Minerals 12 00977 g007
Figure 8. Schematic diagram of the ore body and surface subsidence in the mine area. (Image of the mine’s surface is taken from Google Maps).
Minerals 12 00977 g008
Figure 9. Subsidence point and the main surface building deformation in the mine area.
Minerals 12 00977 g009
Figure 10. Status of the Alhada surface-collapse pit.
Minerals 12 00977 g010
Table 1. Original inversion parameters of the Okada model.
Inversion
Parameters
Initial Model
(Subsidence Area A)
Initial Model
(Subsidence Area B)
Initial Model
(Subsidence Area C)
Length (m)60~600100~48050~500
Width (m)50~60050~30040~400
Depth (m)20~250050~250050~2500
Strike (°)1~3601~3601~360
X (m)−700~700−500~−200100~500
Y (m)−700~700200~400−500~−100
Opening (m)−2~2−2~2−2~2
Table 2. Optimal fitting parameters of the Okada model.
Inversion
Parameters
Optimal Valuation
(Subsidence Area A)
Optimal Valuation
(Subsidence Area B)
Optimal Valuation
(Subsidence Area C)
Length (m)332.12114.04209.6
Width (m)111.6168.3488.97
Depth(m)94.51106.69153.91
Strike (°)11312.63181.44
X (m)−83.37−331.89441.87
Y (m)−101.67336.53−310.27
Opening (m)−0.16−0.48−0.32
Publisher’s Note: MDPI stays neutral with regard to jurisdictional claims in published maps and institutional affiliations.

