Article

Uranium Retardation Capacity of Lithologies from the Negev Desert, Israel—Rock Characterization and Sorption Experiments

1
Earth and Environmental Science Division, Los Alamos National Laboratory (LANL), Los Alamos, NM 87545, USA
2
Departments of Stratigraphy and Subsurface Research, and Water and Natural Resources, Geological Survey Israel (GSI), Jerusalem 9692100, Israel
3
Department of Chemistry, Nuclear Research Center Negev (NRCN), Beer-Sheva 84105, Israel
*
Author to whom correspondence should be addressed.
Minerals 2022, 12(6), 728; https://doi.org/10.3390/min12060728
Submission received: 19 April 2022 / Revised: 27 May 2022 / Accepted: 31 May 2022 / Published: 6 June 2022
(This article belongs to the Special Issue Mineral-Specific Element Sorption onto Geological Repository Rocks)

Abstract

:
A series of batch experiments were performed to assess the uranium sorption capacity of four mineralogically distinct lithologies from the Negev Desert, Israel, to evaluate the suitability of a potential site for subsurface radioactive waste disposal. The rock specimens consisted of an organic-rich phosphorite, a bituminous marl, a chalk, and a sandstone. The sorption data for each lithology were fitted using a general composite surface complexation model (GC SCM) implemented in PHREEQC. Sorption data were also fitted by a non-mechanistic Langmuir sorption isotherm, which can be used as an alternative to the GC SCM to provide a more computationally efficient method for uranium sorption. This is because all the rocks tested have high pH/alkalinity/calcium buffering capacities that restrict groundwater chemistry variations, so that the use of a GC SCM is not advantageous. The mineralogy of the rocks points to several dominant sorption phases for uranyl (UO22+), including apatite, organic carbon, clays, and iron-bearing phases. The surface complexation parameters based on literature values for the minerals identified overestimate the uranium sorption capacities, so that for our application, an empirical approach that makes direct use of the experimental data to estimate mineral-specific sorption parameters appears to be more practical for predicting uranium sorption.

1. Introduction

This paper is the product of a joint US–Israeli collaboration to evaluate a potential site in the Negev Desert, Israel, for the subsurface disposal of spent nuclear fuel. This region provides a unique geologic setting because of its isolation, arid conditions, and a deep vadose zone comprised of a layered stratigraphic sequence of Late Cretaceous shallow marine phosphorites, bituminous marls, chalks, sandstones, limestones, and cherts. As part of this work scientists from Los Alamos National Laboratory (LANL), the Geological Survey of Israel (GSI), and the Nuclear Research Center Negev (NRCN) are building a 3-D subsurface radionuclide flow and transport model for the vadose zone of the northeastern Negev Desert of Israel [1]. This paper on uranium sorption represents preliminary findings, to help evaluate the region’s potential for the geologic isolation of actinides. This work also supports the potential development of either a subsurface repository or an intermediate depth borehole as disposal options for nuclear waste in the northeastern Negev Desert.
To this end, we conducted batch sorption and desorption experiments to investigate uranium sorption in four important and mineralogically distinct lithologies present in the Yamin Plain (YP) of the northeastern Negev Desert of Israel [1,2]. Although spent fuel contains many radionuclides of potential environmental concern, uranium was selected as the subject of this study because (1) it represents a very large inventory in spent fuel, (2) it is relatively mobile in groundwater (particularly under oxidizing conditions) compared with many other actinides, and (3) uranium isotopes have very long half-lives compared with most other radionuclides of concern. Owing to these factors, uranium isotopes are always addressed in risk assessments for spent fuel geologic repositories in unsaturated zones, particularly for radionuclide release scenarios involving transport to the accessible environment via groundwater pathways under oxidizing conditions [3,4,5]. Under these conditions, uranium sorption on mineral surfaces is the dominant natural retardation mechanism for uranium.
Partition coefficients or Kd values that assume a linear relationship between adsorbed and aqueous phase concentrations of a contaminant are commonly used in risk assessments to describe sorption of uranium to mineral phases. Kd values are computationally efficient to implement in transport models, although their applicability is generally limited to the range of geochemical conditions of the experiments conducted to determine them. The use of Kd values is prone to introducing large uncertainties in contaminant transport simulations when conditions are outside this range [6,7,8]. Improvements can be realized by describing sorption using non-linear sorption isotherms, such as Freundlich and Langmuir isotherms, which are also computationally efficient, but these are still limited to a narrow range of geochemical conditions. The reason for the uncertainty associated with non-mechanistic descriptions of uranium sorption (i.e., Kd or non-linear isotherms) stems in part from the pH and alkalinity dependencies of uranium speciation and sorption under typical oxidizing groundwater conditions. Uranium sorption usually increases with increases in pH from 4 to 7 [9,10]. This is because aqueous uranium speciation in this pH range favors positively charged uranyl (UO22+) species, and sorption is associated with negatively charged mineral surfaces (e.g., clays and iron oxides) that exhibit greater negative charge with increasing pH. However, uranium sorption decreases sharply at pH values higher than 7. This is driven by the tendency for the uranyl ions to form strong, neutral, or negatively charged uranyl-carbonates and/or ternary uranyl-calcium-carbonate species. The latter are highly stable and mobile in oxidizing waters with high alkalinities and calcium concentrations [11,12,13,14], and these neutral and negatively charged species do not interact favorably with negatively charged mineral surfaces [9,10,11,15]. It follows that when using Kd parameters or other non-mechanistic descriptions of uranium sorption, slight variations in the geochemical conditions can produce high uncertainties in the predictions of reactive transport models.
As an alternative to non-mechanistic descriptions of sorption, non-electrostatic surface complexation models (SCM) account for aqueous uranium speciation over a wide range of geochemical conditions in sorption models and allow the sorption to vary in a mechanistic manner as a function of groundwater chemistry [16,17,18,19,20]. However, while the SCM approach has provided good results on pure mineral phases under laboratory conditions, its application to field environments and different rock assemblages remains challenging. Estimating the sorption capacity of rocks can be complex, since sorption in natural systems does not occur on a single, well-defined mineral surface. In these cases, sorption processes are best represented by model parameters derived from sorption experiments that capture the effect of a variety of sorption sites, having variable binding strength, accessibility, and density.
In general, there are two approaches used to derive the parameters for a SCM in natural aquifer sediments [9,21,22]. The component additive approach (CA SCM) relies on complete sediment characterization, to determine the major adsorbing components. The development of a CA SCM is based on published sorption values for the pure mineral surfaces identified. Some studies have successfully applied CA SCM to aquifer sediments and rocks using an additive approach for clays, quartz, and organic matter [8,23,24,25]; while others have shown that a CA SCM can easily overestimate sorption, by as much as two orders of magnitude [9,26,27,28]. Part of the problem with CA SCM models is that not all identified mineral phases contribute to sorption, while certain non-identifiable or inadequately characterized trace minerals do. In addition, uncertainty can arise in CA SCMs when trying to scale laboratory-derived values for model compounds, to field applications with complex mineral compositions and rock properties [29,30,31].
The second method for deriving SCM parameters uses a semi-empirical approach, wherein data from sorption experiments on diverse geologic materials are used to fit sorption parameters to material components (GC SCM). While the semi-empirical approach produces more accurate predictions, it also has limitations. Fitted parameters are often not well constrained across a range of pH values and uranium concentrations, and they can produce non-unique solutions. In addition, there is a potential to “over-fit” parameters by arbitrarily adding multiple generic sorption phases into the SCM [22,27,28,32]. The resulting GC SCM may, therefore, capture uranium sorption values under laboratory conditions but may not be realistic or applicable to field environments with different or heterogeneous geochemical characteristics. In this case, the GC SCM method is as limited as the non-mechanistic descriptions of sorption.
The experiments for this study were performed over a range of uranium concentrations in synthetic water formulated to match the water chemistry from a shallow perched water aquifer within the Hazeva Group in the Negev Desert, Israel [2,33]. The results were then used to develop and fit a GC SCM to phases with potential uranium sorption capacities, using a minimal number of parameters to represent the sorption behavior of uranium specific to the Negev Desert lithologies. Non-mechanistic sorption isotherms were also fitted to the sorption and desorption data and compared to the GC SCM results. These efforts were supported by a detailed characterization of the mineralogy and geochemistry of the rocks, to identify potential adsorbing phases and compare their theoretical sorption capacities, determined by a CA SCM approach, to the fitted GC SCM sorption parameters. The advantages and limitations of non-mechanistic isotherm and GC SCM methods for uranium sorption are discussed below, in the context of a carbonate-rich subsurface environment.

2. Materials and Methods

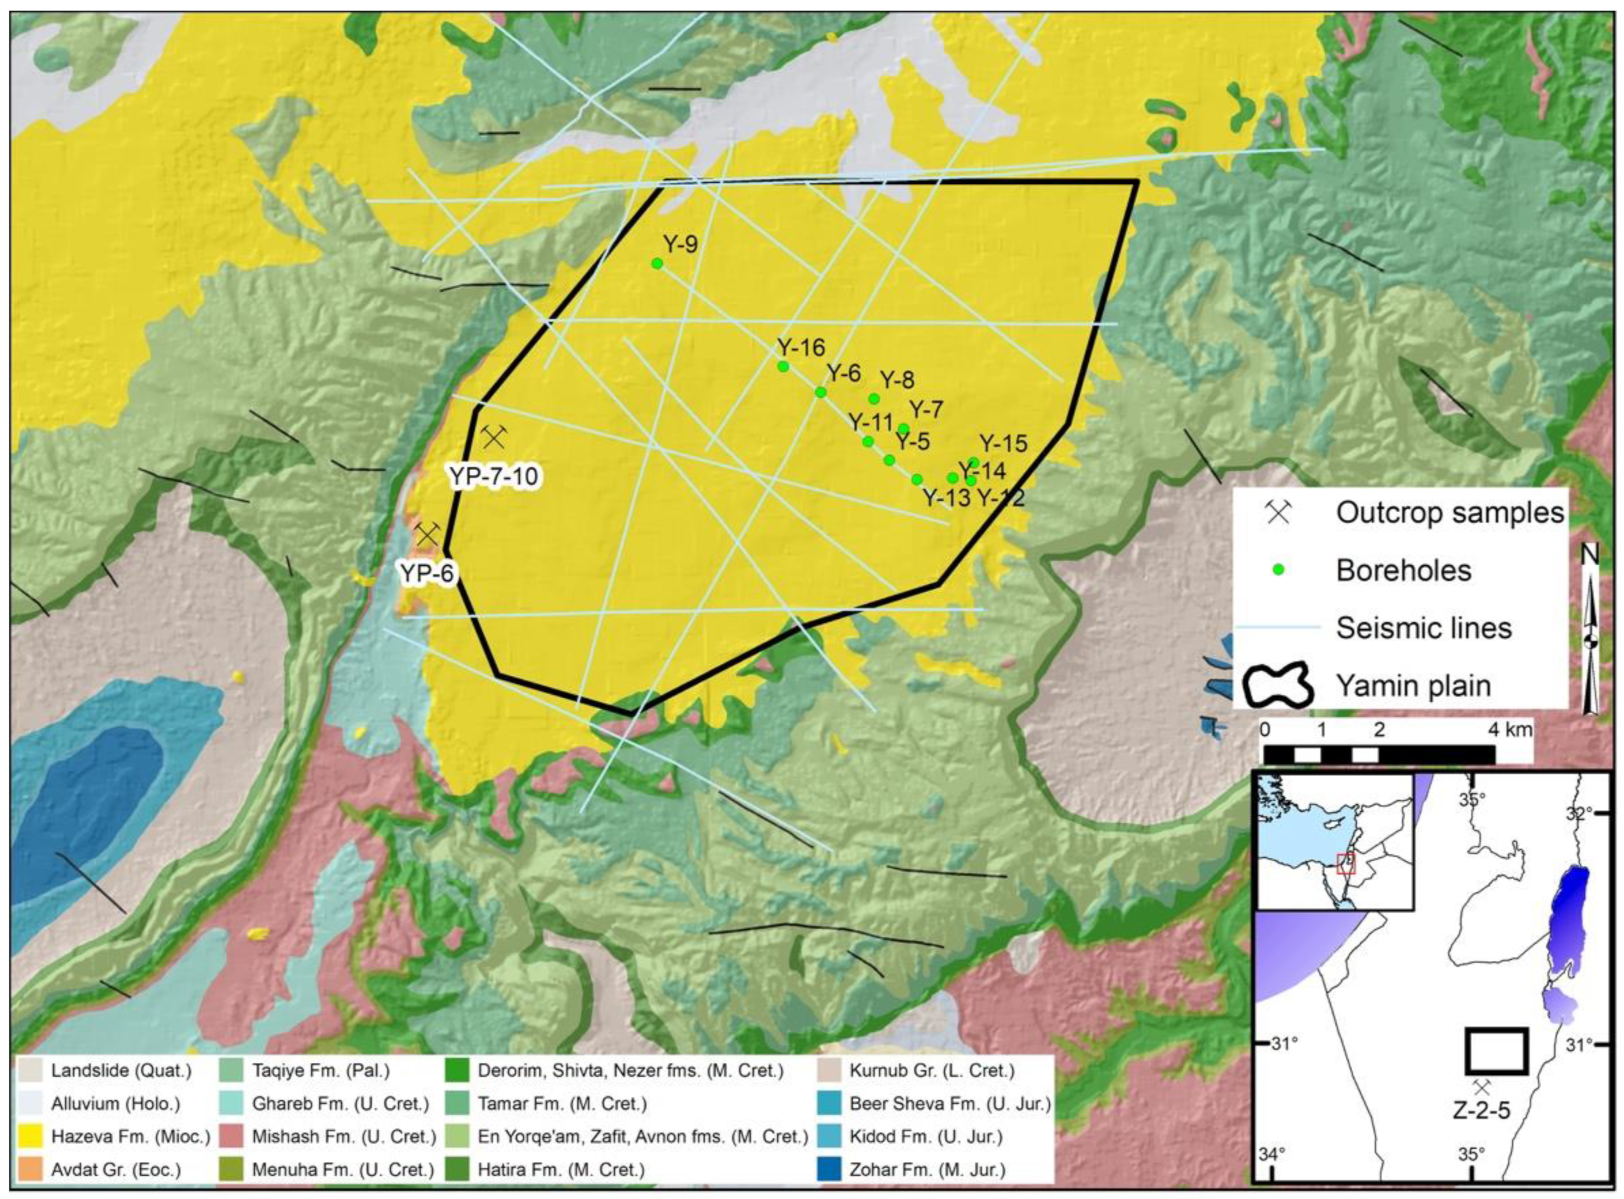
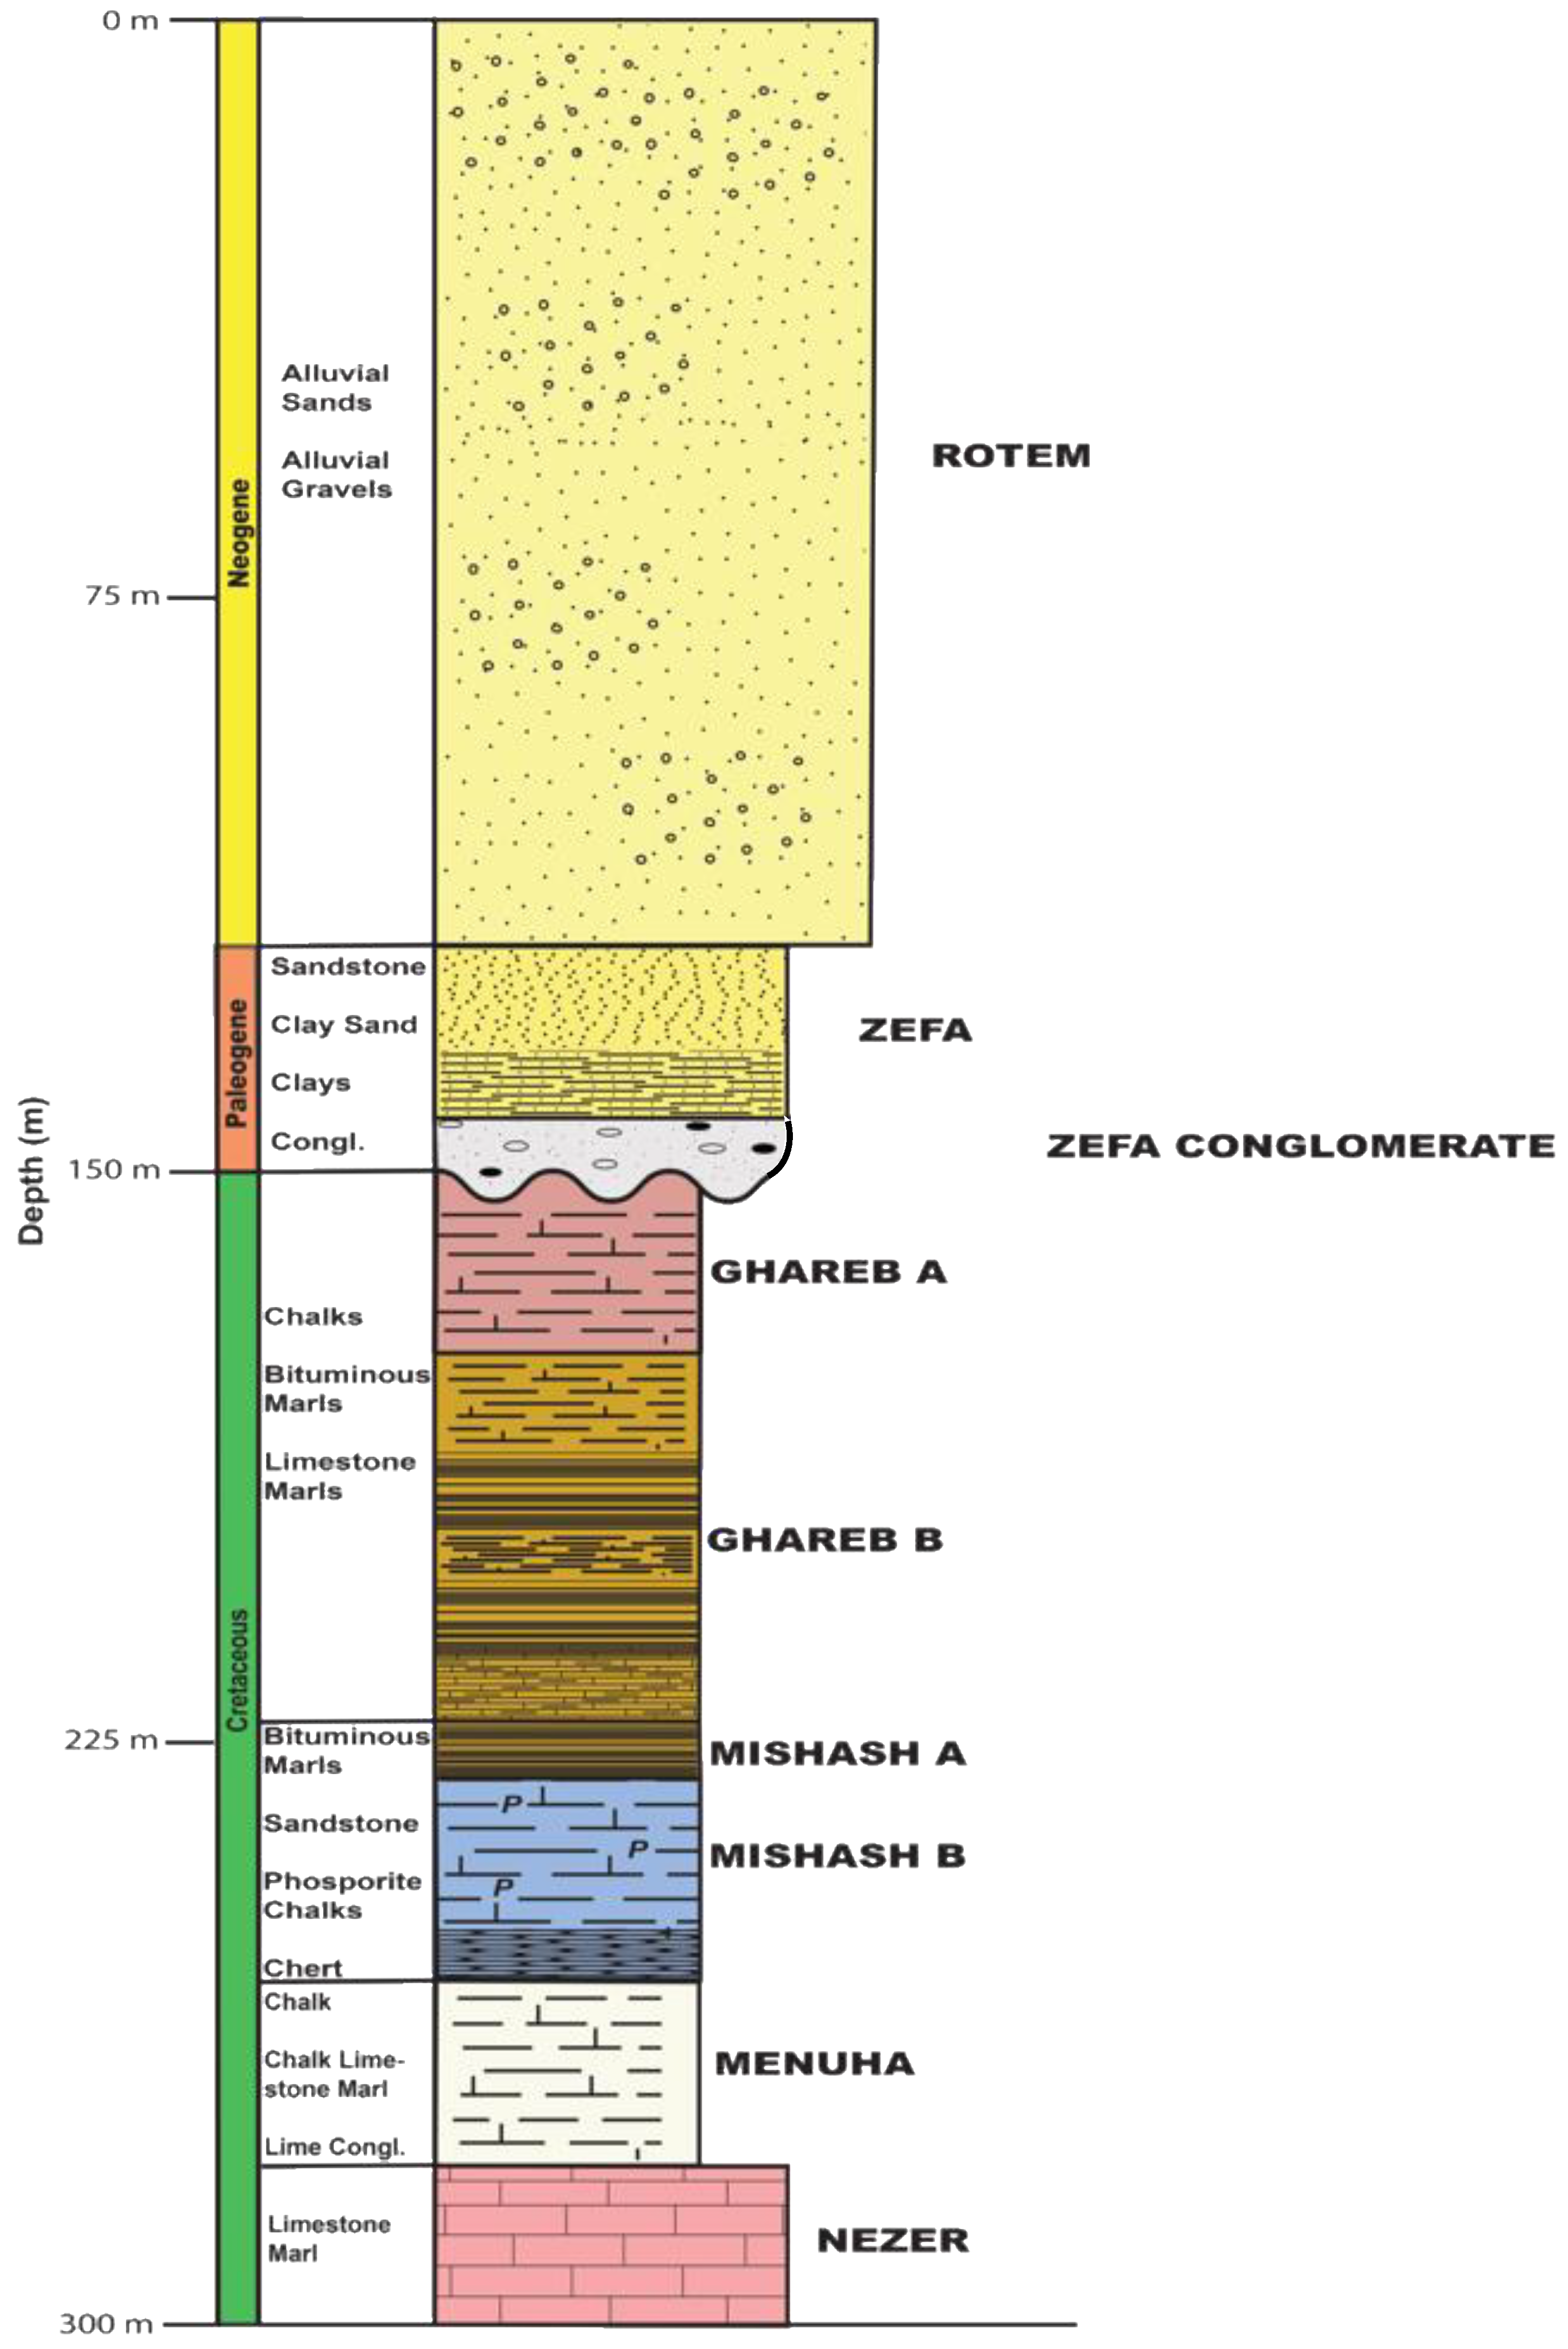
2.1. Rock Sample Collection and Characterization

Due to the paucity of borehole core samples and specimen size limitations, all rock specimens used in this study were collected from outcrops in the Yamin Plain (YP) and adjacent areas (e.g., Rotem Plain) of the Negev Desert, Israel. The geology of the YP has been extensively documented in the literature [1,33,34,35,36]. Sample locations are shown in Appendix A (Figure A1). The YP subsurface stratigraphy within the study area (Figure A2) includes a late Cretaceous shallow marine sedimentary sequence in the vadose zone (Ghareb and Mishash Formations), with chalk, chert, bituminous limestone marl, and organic-rich phosphorite lithologies [1,37]. This sequence is unconformably overlain by approximately 100 m of Miocene and younger interlayered alluvial sands, clays, and sandstone (Hazeva Group) [2].
The rock specimens were collected from outcrops that represent four major formations distributed to a depth of 300 m beneath the NE Negev Desert and where a potential waste disposal area is being evaluated for siting. The sampled rocks belong to the Late Cretaceous Mt. Scopus Group (Menuha, Mishash, and Ghareb Formations) and the overlying alluvial and littoral sediments from the Miocene Rotem and Zefa Formations (Hazeva Group) [1,2]. Rock samples were selected for their actinide sorption potential and geochemical characteristics, and for their prevalence in the host formations. The rock samples consist of a sandstone (SS-10) from the Rotem Member of the Hazeva Group, a chalk (CK-6) and a bituminous limestone marl (OS-3) from the Ghareb Formation, and an organic-rich phosphorite (HOP-5) from the underlying Mishash Formation.
The rock samples were shipped to LANL where they were crushed and wet-sieved into four distinct size fractions (<75 µm, 75–500 µm, 500–2000 µm, and >2 mm). Detailed petrographic, mineralogical, and geochemical characterizations were carried out using quantitative X-ray diffraction (qXRD), X-ray fluorescence (XRF), scanning electron microscopy with energy dispersive spectroscopy (SEM-EDS), and Brunnauer–Emmet–Teller surface analysis (BET). Details of the sample preparation and instrumental analyses are described in Appendix B. A series of uranium batch sorption experiments were conducted on these samples, to test the mineral dissolution and buffering capacities of each of the four lithologies (HOP-5, OS-3, SS-10, and CK-6) in the presence of a synthetic surface water (SSW) solution for a range of pH values. The ionic composition of SSW (used in all subsequent batch experiments) is presented in Table 1. Detailed experimental procedures are presented in Appendix C. The SSW ionic composition was based on the water chemistry from a Negev Desert perched water aquifer (well D-1/D-3) within the Hazeva Group [5]. Appendix C contains details of the methodology used in the equilibration of batch experiments.

2.2. Uranium Batch Sorption Experiments

A set of short and longer-term kinetic sorption experiments were conducted to evaluate the time scale over which aqueous uranium equilibrates with the rock samples from the different Negev Desert lithologies (HOP-5, OS-3, CK-6, and SS-10). This was done mainly to ensure that all subsequent experiments were conducted for sufficient time to establish equilibrium (or near-equilibrium), and to investigate any long-term uptake mechanisms, such as uranium mineral precipitation. Details on the kinetic batch sorption experiments are provided in Appendix C and longer-term experiments in Appendix G.
The preliminary kinetic sorption experiments showed that the HOP-5 samples had a significantly higher uptake capacity than the OS-3, CK-6, and SS-10 samples. Based on this observation, it was decided that the HOP-5 sorption experiments would be conducted at higher uranium-to-rock ratios than the other three rock samples.
In a second set of preliminary experiments, it was established that all the rock samples had high buffering capacities for pH and alkalinity, because of their high calcite contents (c.f., Section 3.2.1 and Appendix C for details). Thus, it was concluded that it would be impractical to vary pH or alkalinity in the sorption experiments, which would normally be done to optimally parameterize a surface complexation model. Such attempts would either dissolve some of the rocks or precipitate new phases that could potentially sorb or co-precipitate with uranium. However, it was also recognized that any natural groundwater in the Negev study area would likely be strongly buffered to a narrow range of pH and alkalinity values after contacting the native carbonate rocks, so that attempting to vary these parameters in the experiments beyond this range would have minimal practical value for predicting uranium sorption in the study area. After these preliminary studies, batch sorption experiments were performed to investigate the uranium sorption capacity of the Negev rock samples. To provide meaningful Kd values and create a data set that best constrained the surface complexation model, while lacking the ability to systematically vary pH and alkalinity, batch sorption experiments were conducted at different uranium-to-rock ratios. The smallest of these ratios was constrained by the fact that when sorption exceeds 90%, even small errors in aqueous uranium measurements can produce large variations in final Kd values, which result in non-uniqueness in the fitted surface complexation parameters [9,22,32]. In addition, experiments at multiple uranium-to-rock ratios should include high enough ratios to provide an estimate of the maximum sorption capacity (sorption sites per unit mass of rock), and relatively high ratios can also be used to help interrogate the abundance of sorption sites with different binding constants.
Batch sorption experiments on the phosphorite sample HOP-5 were carried out by equilibrating 20 mL of SSW with approximately 0.1 g of crushed HOP-5 (500–2000 µm size fraction) for 24 h before adding 0.5 mL of different uranium stock solutions to the vials. This produced initial uranium concentrations of 6.7 mg/L, 16.8 mg/L, and 32.0 mg/L (as measured in the uranium blanks with ICP-MS and Kinetic Phosphorescence Analysis), equivalent to uranium-to-solid ratios of approximately 1000, 3000, and 6000 mg-U/kg-rock, respectively. HOP-5 batch experiments were allowed to equilibrate in the presence of uranium for 3 days, before measurements were taken. Sorption experiments on bituminous limestone marl OS-3, oolitic chalk CK-6, and sandstone SS-10 were conducted in a similar fashion, except that the uranium-to-rock ratios used in these experiments were approximately 200, 40, and 10 mg-U/kg-rock, respectively.
For each of the OS-3, CK-6, and SS-10 samples, about 0.5 g of crushed rock (500–2000 µm size fraction) was equilibrated with 20 mL of SSW for 24 h, before adding varying amounts of a 1000 ppm uranium stock solution, leading to uranium concentrations of 5 ppm, 1 ppm, and 0.25 ppm, respectively. Vials with the OS-3, CK-6, and SS-10 solid fractions were allowed to equilibrate for approximately 5 days, before measurements were taken. All batch sorption experiments also contained a uranium blank (no crushed rock), a solid blank (no uranium), and a method blank (SSW only).
To investigate potentially irreversible uptake mechanisms (e.g., precipitation) in the powdered samples, desorption experiments were conducted after completion of the initial batch sorption experiments. For the desorption experiments, an 18 mL volume of supernatant was carefully removed with a 5 mL syringe, after allowing the suspended sediment to settle for four hours. The eighteen milliliters of uranium-free SSW solution were then added back into the batch experiments. The rock samples were subsequently allowed to equilibrate for approximately 48 h, prior to making new uranium measurements. This step was repeated twice thereafter, for a total of three desorption steps, equivalent to a total desorption time of 144 h. Four replicates were prepared for each uranium-to-rock ratio, for a total of 12 batch experiments for each rock type.
Alkalinity, determined by titration of bicarbonate ion (HCO3, mg/L) and pH, was measured periodically during each experiment. The measured values remained between 132 ± 6 mg/L and 7.7 ± 0.2 mg/L, respectively, which matches values from field measurements. PHREEQC speciation calculations (Table 2, and Figure A3, Appendix A) showed that for the Ca2+ concentrations and alkalinity of the SSW solution, over 95% of uranium would be in the form of ternary uranyl-calcium-carbonate complexes [15]. Furthermore, uranium speciation calculations showed that pH variations of less than 1 unit would have had little impact on the overall composition of uranium species in our experiments (Figure A3, Appendix A). This, in effect, stabilizes uranium in solution and prevents precipitation of uranyl hydroxide minerals. The calculated saturation indices for Schoepite and UO3 were less than −2.4 and −5.4, respectively, for all concentrations of uranium in SSW (Table 2).
All uranium measurements for the batch sorption and desorption experiments in this study were carried out using an ICP-MS NexION 300S instrument (PerkinElmer, Inc., Waltham, MA, USA), and some of these ICP-MS results were cross-checked using a Kinetic Phosphorescence Analyzer (KPA-11; Chemcheck Instruments, Richland, WA, USA). In addition, uranium measurements for the kinetic experiments were made using the KPA method only, due to sample volume constraints associated with the ICP-MS method. The KPA used a laser to induce phosphorescence from the uranyl ion after complexation with an organic ligand (Uraplex; Chemcheck Instruments, Richland, WA, USA). The resulting intensity from the experimental samples was then compared to known standards, to determine the uranium concentration. Concentrated nitric acid was added to the samples a day prior to analysis, to destroy organic matter that could interfere with measurements. Analyses of blanks indicated that there were no other KPA interferences. Further details on the KPA can be found in Hedaya et al. [38]. Select samples measured by KPA were also analyzed by ICP-MS to verify the accuracy of the KPA measurements, and the agreement was consistently found to be within 10%. The KPA method does not measure U(VI); however, the agreement between ICP-MS and KPA measurements suggests that essentially all the uranium in the samples was U(VI).
A broad suite of cation and anion concentrations were determined via ICP-MS (PerkinElmer NexION 300S) and ion-chromatography, respectively, for all batch experiments. All alkalinity measurements were determined using a modified Hach method (#8203) that involves sample titration by dilute HCl.

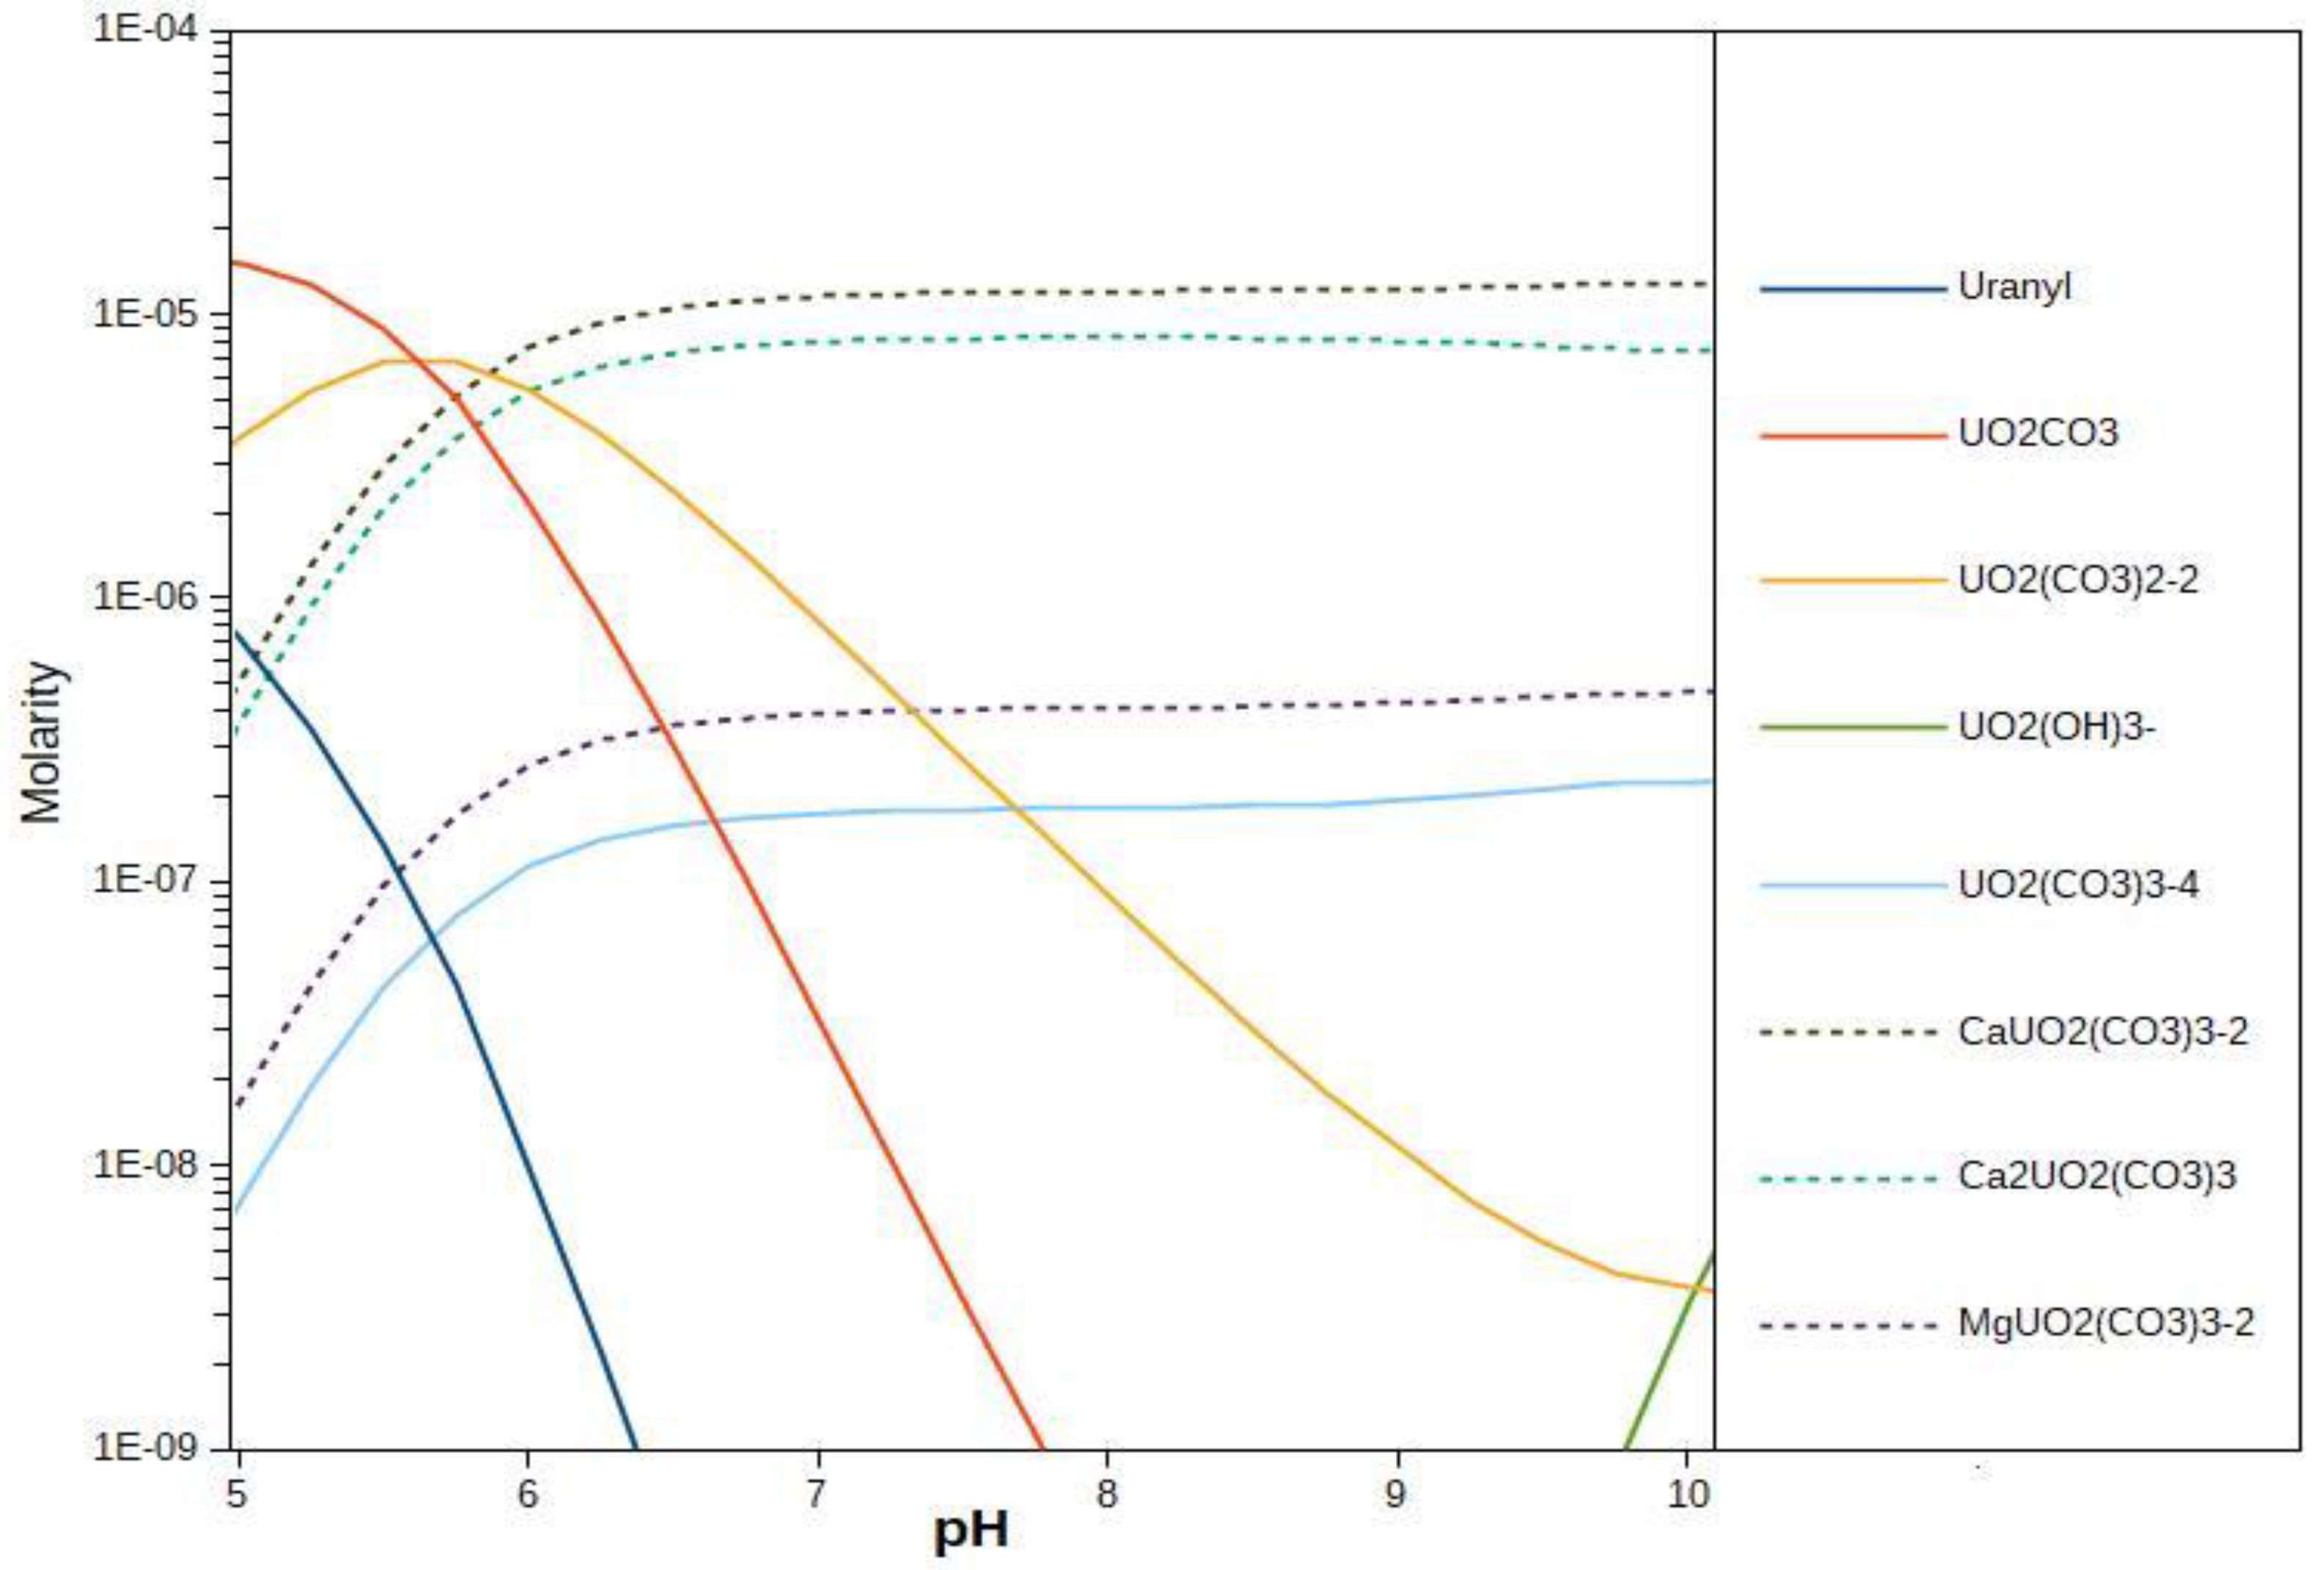
2.3. Surface Complexation Modeling

A non-electrostatic generic composite surface complexation model (GC SCM) was developed in PHREEQC to simulate uranium uptake by the four different rock types (HOP-5, OS-3, CK-6, and SS-10). Details of the mathematical underpinnings of PHREEQC can be found in Parkhurst and Appelo [39], while general information on the GC SCM approach can be found in Dzombak and Morel [21] and Davis et al. [17,28]. Briefly, a GC SCM simulates adsorption through mass action equations, wherein aqueous species form surface complexes with generic protonated sites on the surface of minerals (XOH), deprotonating the surface in the process. Equilibrium constants (log (β)) describe the formation of these surface species in a similar fashion to aqueous speciation reactions. It is important to note that the GC SCM is a semi-empirical approach to model sorption reactions, where many sorption and uptake processes are combined into the minimum required number of parameters allowed from batch experiment results [22,28].
Thermodynamic constants for aqueous speciation and mineral precipitation/dissolution reactions were provided by the default minteq.v4 database (21 April 2016). Additional reactions were added for aqueous uranium chemistry [40], U-phosphate minerals [41,42], and uranyl ternary complexes [15,43]. XRF and qXRD data informed the model with the dominant modal mineralogy of the rocks, while the carbonate system was assumed to be in equilibrium with ambient atmospheric conditions. A simple surface complexation process, wherein uranyl cation (UO22+) replaces H+ at surface hydroxyl sites, was assumed as the primary sorption mechanism (Equation (1)).
X O H + UO 2 2 +     XOUO 2 + + H + ,   with   equilibrium   constant   β = XOUO 2 + H + X O H UO 2 2 +
Equation (1) is a combination of the deprotonation reaction of XOH and the sorption of UO22+ to the negatively charged surface, resulting in a combined log (β), to which the data were fitted. We did not explicitly consider ionization of surface hydroxyl sites (e.g., XOH2+), because the uncharged XOH sites are expected to be the dominant surface hydroxyl species over a wide range of pH and ionic strength [44]. Furthermore, any surface ionization caused by excess buildup of positive charge when large amounts of UO22+ are sorbed will be effectively compensated for in the fitting process, by the adjustment of log (β) and maximum sorption site density (the two adjustable model parameters, see below) to match the sorption data. While several spectroscopic studies have suggested that uranium sorbs to ferrinol and aluminol sites via ternary uranyl-carbonate surface complexes [43,45,46], previous SCM fitting studies showed that uranyl replacement of H+ at surface hydroxyl sites provided the best fit to experimental sorption data, even for varying alkalinity [9,32]. Due to the buffering capacity and high carbonate content of the Negev subsurface, conducting sorption experiments at varying pH and alkalinity was not feasible (c.f., Section 2.2). As the data set was poorly constrained, it was not suited for interrogating other surface complexation mechanisms, such as those suggested in Bargar et al. [46], and Chisholm-Brause et al. [47].
The experimental sorption and desorption data were fitted by the model, using the parameter estimation software PEST [48] to derive “best-fit’” sorption parameters based on the lowest sum of residuals squared (SORS). PEST was allowed to fit the equilibrium constant for the uranyl-surface species (log (β)) and the amount of sorption sites available per unit mass of rock (XOH). Previous literature suggests using multiple sorption sites with different log (β) values to fit surface complexation data [9]. However, our initial fitting attempts using multiple sites produced significant non-uniqueness in the final solutions, which would introduce additional uncertainties when incorporated into a 3D subsurface reactive transport model. According to Payne et al. [22], the SCM approach should be conducted with the least number of possible fitting parameters. We, therefore, used a conservative approach, whereby sorption was always assumed to occur principally on one primary site with a single fitted log (β) for each rock type.

2.4. Non-Mechanistic Sorption Isotherm Modeling

Since the buffering capacity and high carbonate content of the samples resulted in a relatively narrow range of aqueous geochemical conditions in the experiments, as would presumably be the case in the field, it was decided that describing uranium sorption with a non-mechanistic sorption isotherm could be a viable alternative to a GC SCM and would offer computational advantages in the transport models. Thus, the experimental sorption and desorption data for each lithology were also fitted by 3 different non-mechanistic sorption isotherms: (1) a linear (Kd) isotherm, (2) a Freundlich isotherm, and (3) a Langmuir isotherm [49]. For all lithologies, a Langmuir isotherm is given by the expression:
S = K L S m a x C K L C + 1
where S = amount adsorbed by sample in mg U/kg rock, C = solution concentration in mg U/L, KL = Langmuir sorption parameter in L/mg U, and Smax = maximum sorption capacity in mg U/kg rock. This method provided the best fit to the data, so that only the Langmuir results are presented here. The Langmuir isotherm is also the only one of the 3 non-mechanistic isotherms for which sorption is predicted to level off at some maximum capacity as aqueous concentrations increase (the others predict no upper limit to sorption capacity as concentrations increase). Thus, the Langmuir isotherm is more compatible with a GC SCM that also predicts an upper limit to sorption capacity, with Smax in the Langmuir isotherm being comparable to the GC SCM [XOH] parameter.

3. Results

3.1. Rock Sample Characterization

The spectroscopic qXRD, XRF, and BET analyses summarized in Table 3 (qXRD diffractograms) and EDS analyses are provided in Appendix D and Appendix F respectively. In addition, detailed petrographic descriptions of rock thin sections under plain and polarized light are provided in Appendix E, along with SEM images and EDS analyses of select points. Mineralogical characterization of the Negev lithologies studied indicate that the samples span a range of compositions that include significant fractions of carbonates, silicates, phosphates, and organic matter [1].
For the SS-10 sandstone, quartz is the dominant mineral phase (75 wt.%), followed by calcite (16.2 wt.%), minor feldspar, and a trace amount of pyrite (0.2 wt.%). The mineral assemblage is consistent with the petrographic and SEM results, except for pyrite, which was not observed in any of the SEM-EDS analyses. BET results (Table 3) show an average surface area of 4.1 m2/g rock.
In the CK-6 chalk, organic calcite from abundant oolite shells and foraminifera fragments is the dominant mineral phase (83%), associated with abundant oolite shells and foraminifera fragments (Appendix E; Figure A10 and Figure A11). A significant clay fraction (14.7%) was also noted in the qXRD analyses, as were trace amounts of iron (as wt% Fe2O3) and organic carbon (<0.1 wt%). The SEM-EDX analyses of the matrix did not show elements that are commonly noted in illite-rich clays such as potassium. The BET results (Table 3) indicate that the average surface area for the CK-6 samples was 5.5 m2/g rock.
The OS-3 bituminous limestone marl exhibited the most diverse mineralogy of the four rock types studied. Calcite was the dominant carbonate phase for the OS-3 samples (44%), followed by dolomite (3.3%). Other significant mineral and organic carbon fractions consisted of clays (17%), apatite (7.4%), and organic carbon (11%). Both the qXRD and SEM-EDS analyses agreed with each other on the dominant mineral compositions of the OS-3 rocks, and the TOC values measured by elemental mass spectrometry (EL-MS) were similar (TOC = 11.0 wt.%).
The mineral phases of the HOP-5 phosphorite identified during the SEM examination are consistent with the mineral assemblage determined by qXRD (Table 3), including apatite (76.8%), carbonates (20.2%), and TOC (2.0%). Moreover, Cl, F, and N were commonly noted in the SEM-EDS analyses, which was likely due to the presence of halite and fluorapatite (±chloro-apatite) phases, as well as amorphous organic matter. The HOP-5 samples exhibited the highest surface area and porosity (Ø = 35 vol%) of the four rock types [1], with a minimum BET of 18 m2/g for the coarsest size fraction (500–2000 µm). More details on the petrographic characterization of the samples SS-10, CK6, OS-3, and HOP-5 are provided in Appendices.

3.2. Uranium Batch Sorption Results

3.2.1. Equilibration Results

Equilibration of rock samples SS-10, CK6, OS-3, and HOP-5 in the presence of synthetic groundwater (SSW) for 24 h resulted in significant increases in Cl, Na+, and SO42− (Table 1). The molar ratios of Cl and Na+ released from the sediments ranged from 0.7 Cl/Na to 2 Cl/Na, suggesting that some halite dissolution may be responsible for the increase in those elements. No significant release of Ca2+ was detected in the equilibration experiments, except for the OS-3 sample that showed a significant increase in both Ca2+ and SO42− relative to the SSW and aqueous solutions equilibrated with other lithologies. This suggests a possible dissolution of a CaSO4 phase, even though no such phase was reported in the qXRD measurements (possibly because it was amorphous and/or disseminated). In addition, trace amounts of minor elements (Zn, Ba, Br, F) were detected post-equilibration. These elements were not detected by SEM-EDS for any of the predominant mineral phases, which suggests that their origin may derive from either the desorption of bound ions in organic matter or from the dissolution of trace minerals. No detectable amount of uranium was released from the HOP-5, CK-6, and SS-10 samples. Only the OS-3 blanks showed a release of approximately 0.03 ppm uranium. Equilibration experiments did not detect any aqueous phosphate in either the HOP-5 or OS-3 batch experiments, despite the presence of calcium-phosphate minerals. Aqueous TOC dissolution was not measured in the batch sorption tests. However, a light oily film did form on the surface of the bituminous limestone-marl (OS-3) batch experiments, together with a petroliferous smell that was noticeable in both the OS-3 and HOP-5 rocks when equilibrated with SSW at pH < 6.
The kinetic sorption experiments showed that uranium sorption equilibrium was reached in less than 4 h for the HOP-5 samples. Fast uranium sorption kinetics for apatite minerals, on the order of hours, was also observed in Liu et al. [50]. In contrast, it took 48 to 72 h for the OS-3, CK-6, and SS-10 rocks to reach sorption equilibrium with aqueous uranium.
The equilibration experiments at different pH indicated that the buffering capacity of the samples was very high, even for initially acidic aqueous solutions (pH < 6) that re-equilibrated quickly (within 24 h) due to the dissolution of carbonate phases. For an initial pH less than 9, pH values equilibrated to values of 7.6 to 8.3, due to dissolution of calcite. Solutions with an initial pH above 9 stabilized to pH values between 8 and 9, related to CO2 equilibration with the atmosphere and calcite precipitation after several days (a significant loss of solution Ca2+ was noted at pH > 9). The high buffering capacity was not unexpected, due to the large amounts of carbonate phases (Table 3) present in all four rock types (i.e., 14–60 wt.% calcite in the samples).
As mentioned in Section 2.2, it was concluded that the high buffering capacity of the rock samples would make it impractical to vary pH or alkalinity in the sorption experiments, which would normally be done to optimally parameterize a surface complexation model. However, the extreme buffering capacity of the rocks also makes a GC SCM model less important and a non-mechanistic sorption isotherm more defensible for predicting uranium sorption, because it should result in a relatively narrow range of aqueous geochemical conditions for each lithology in field settings.

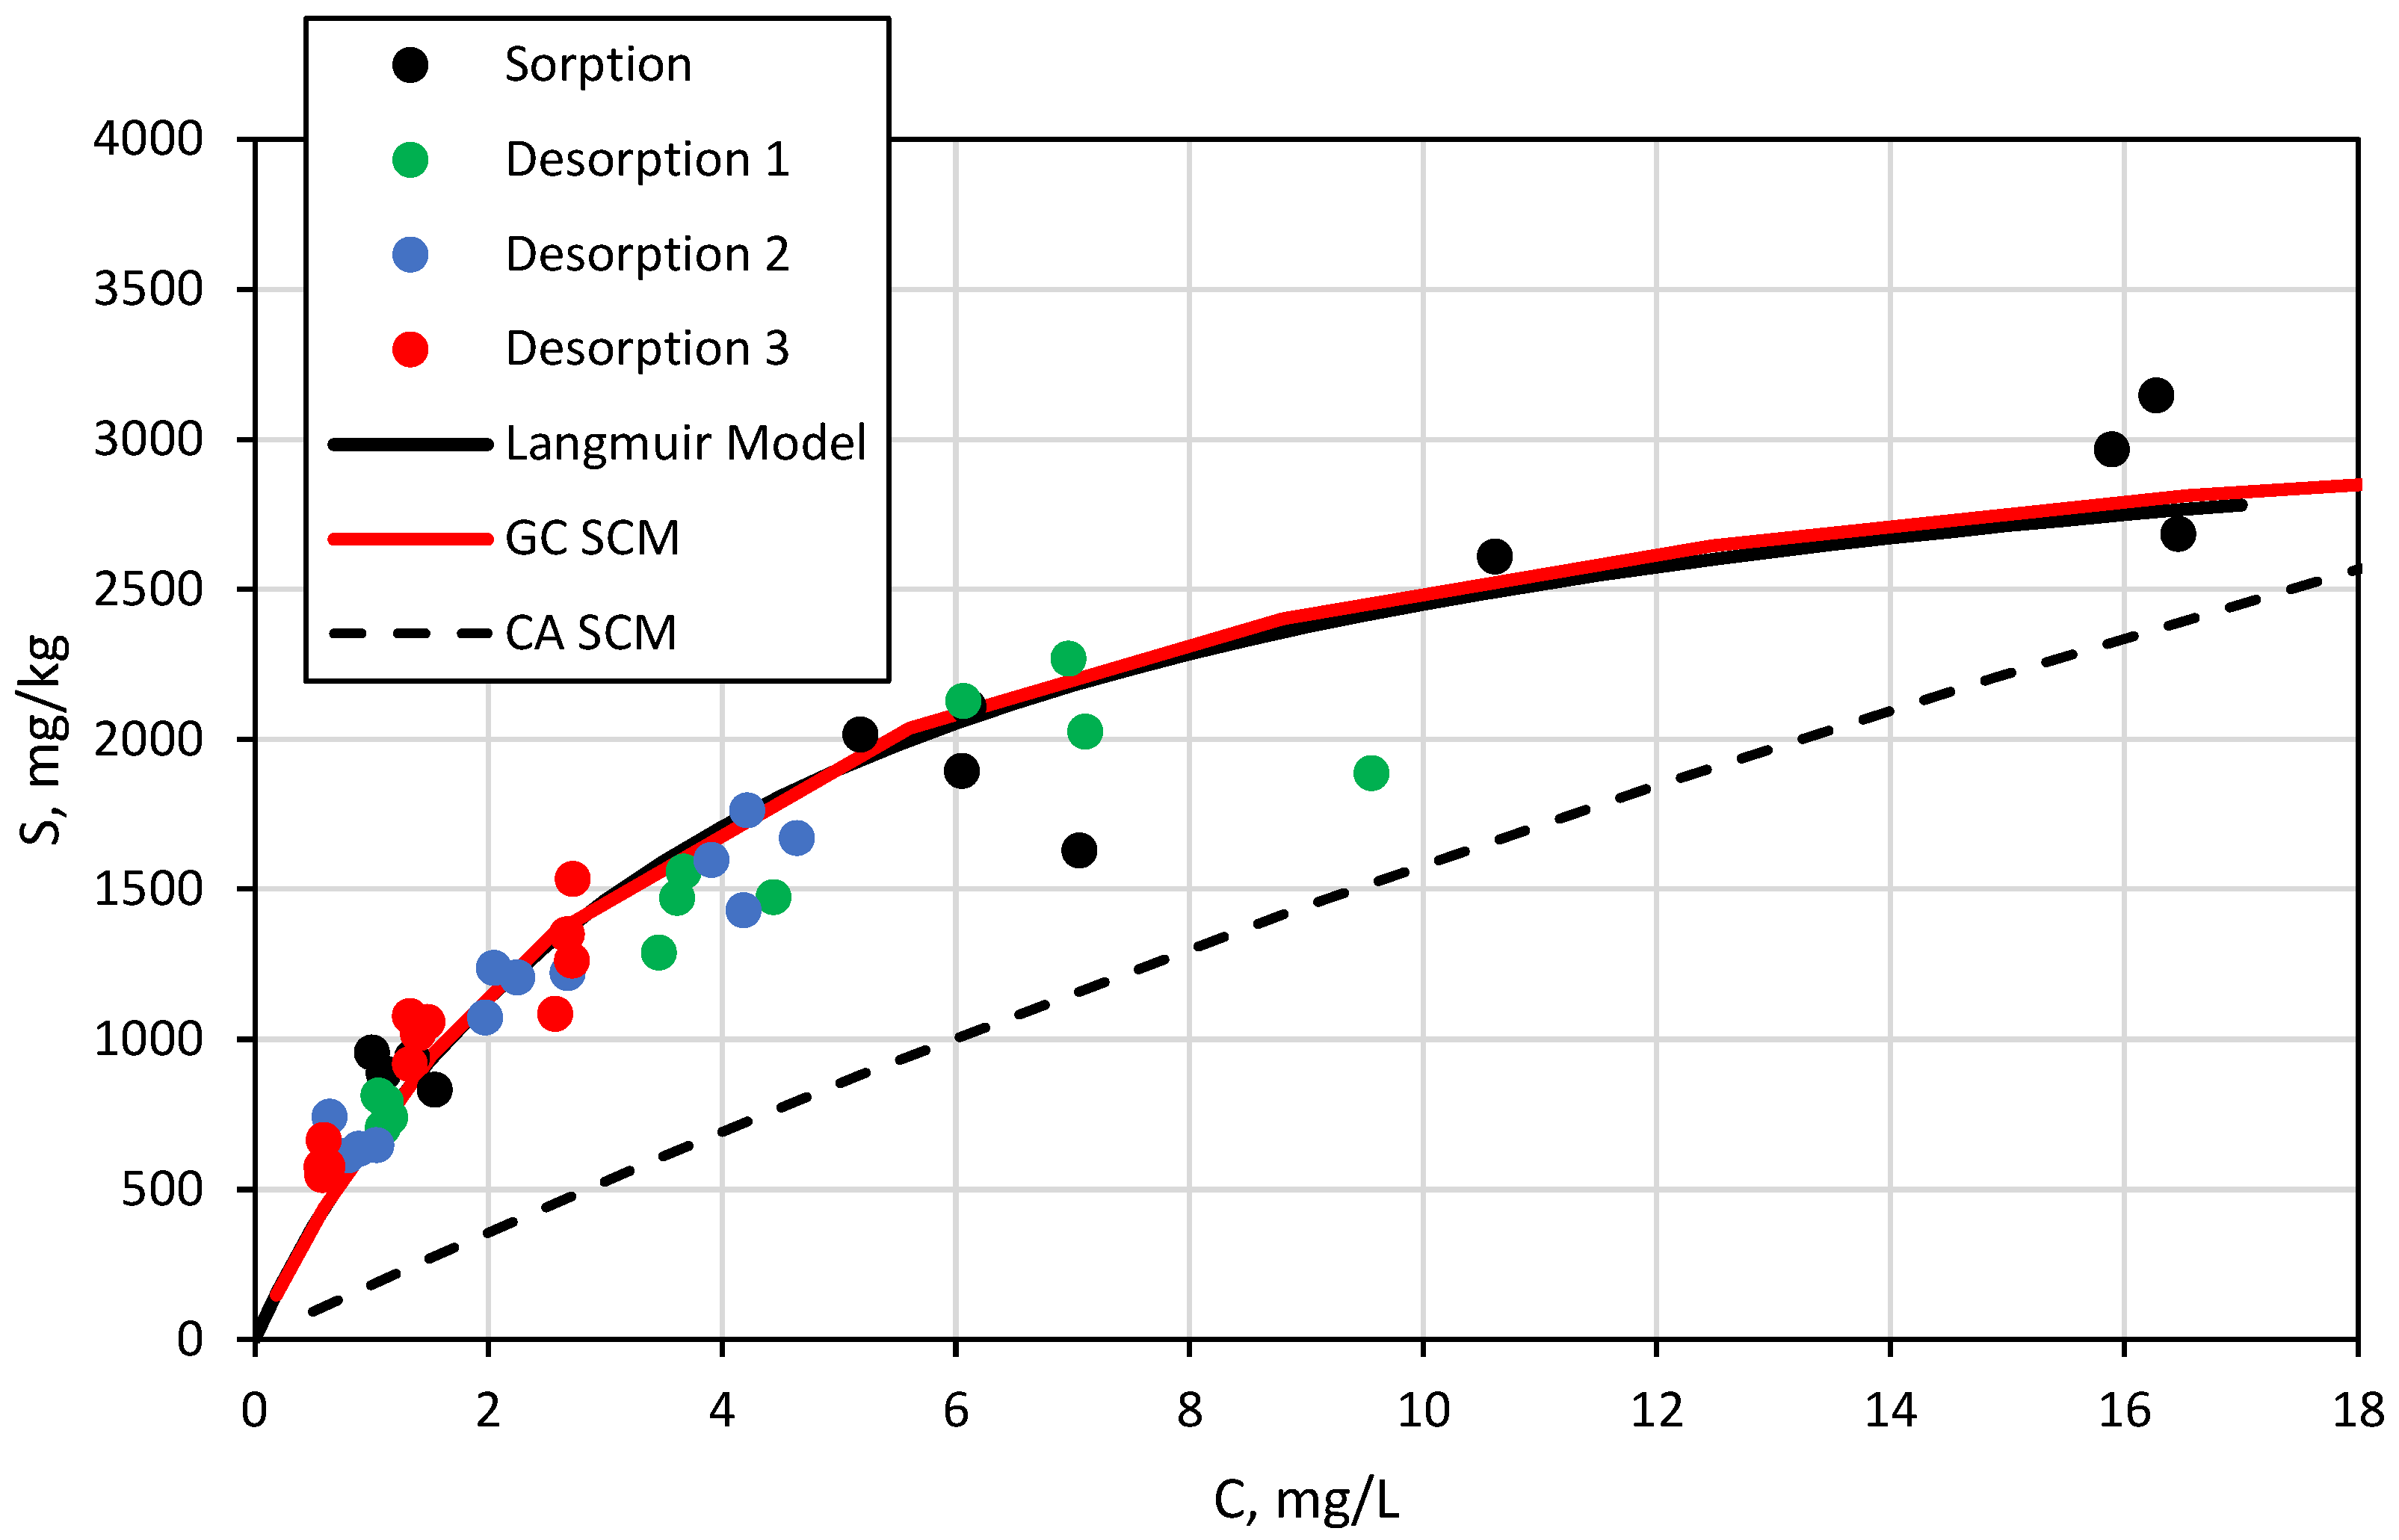
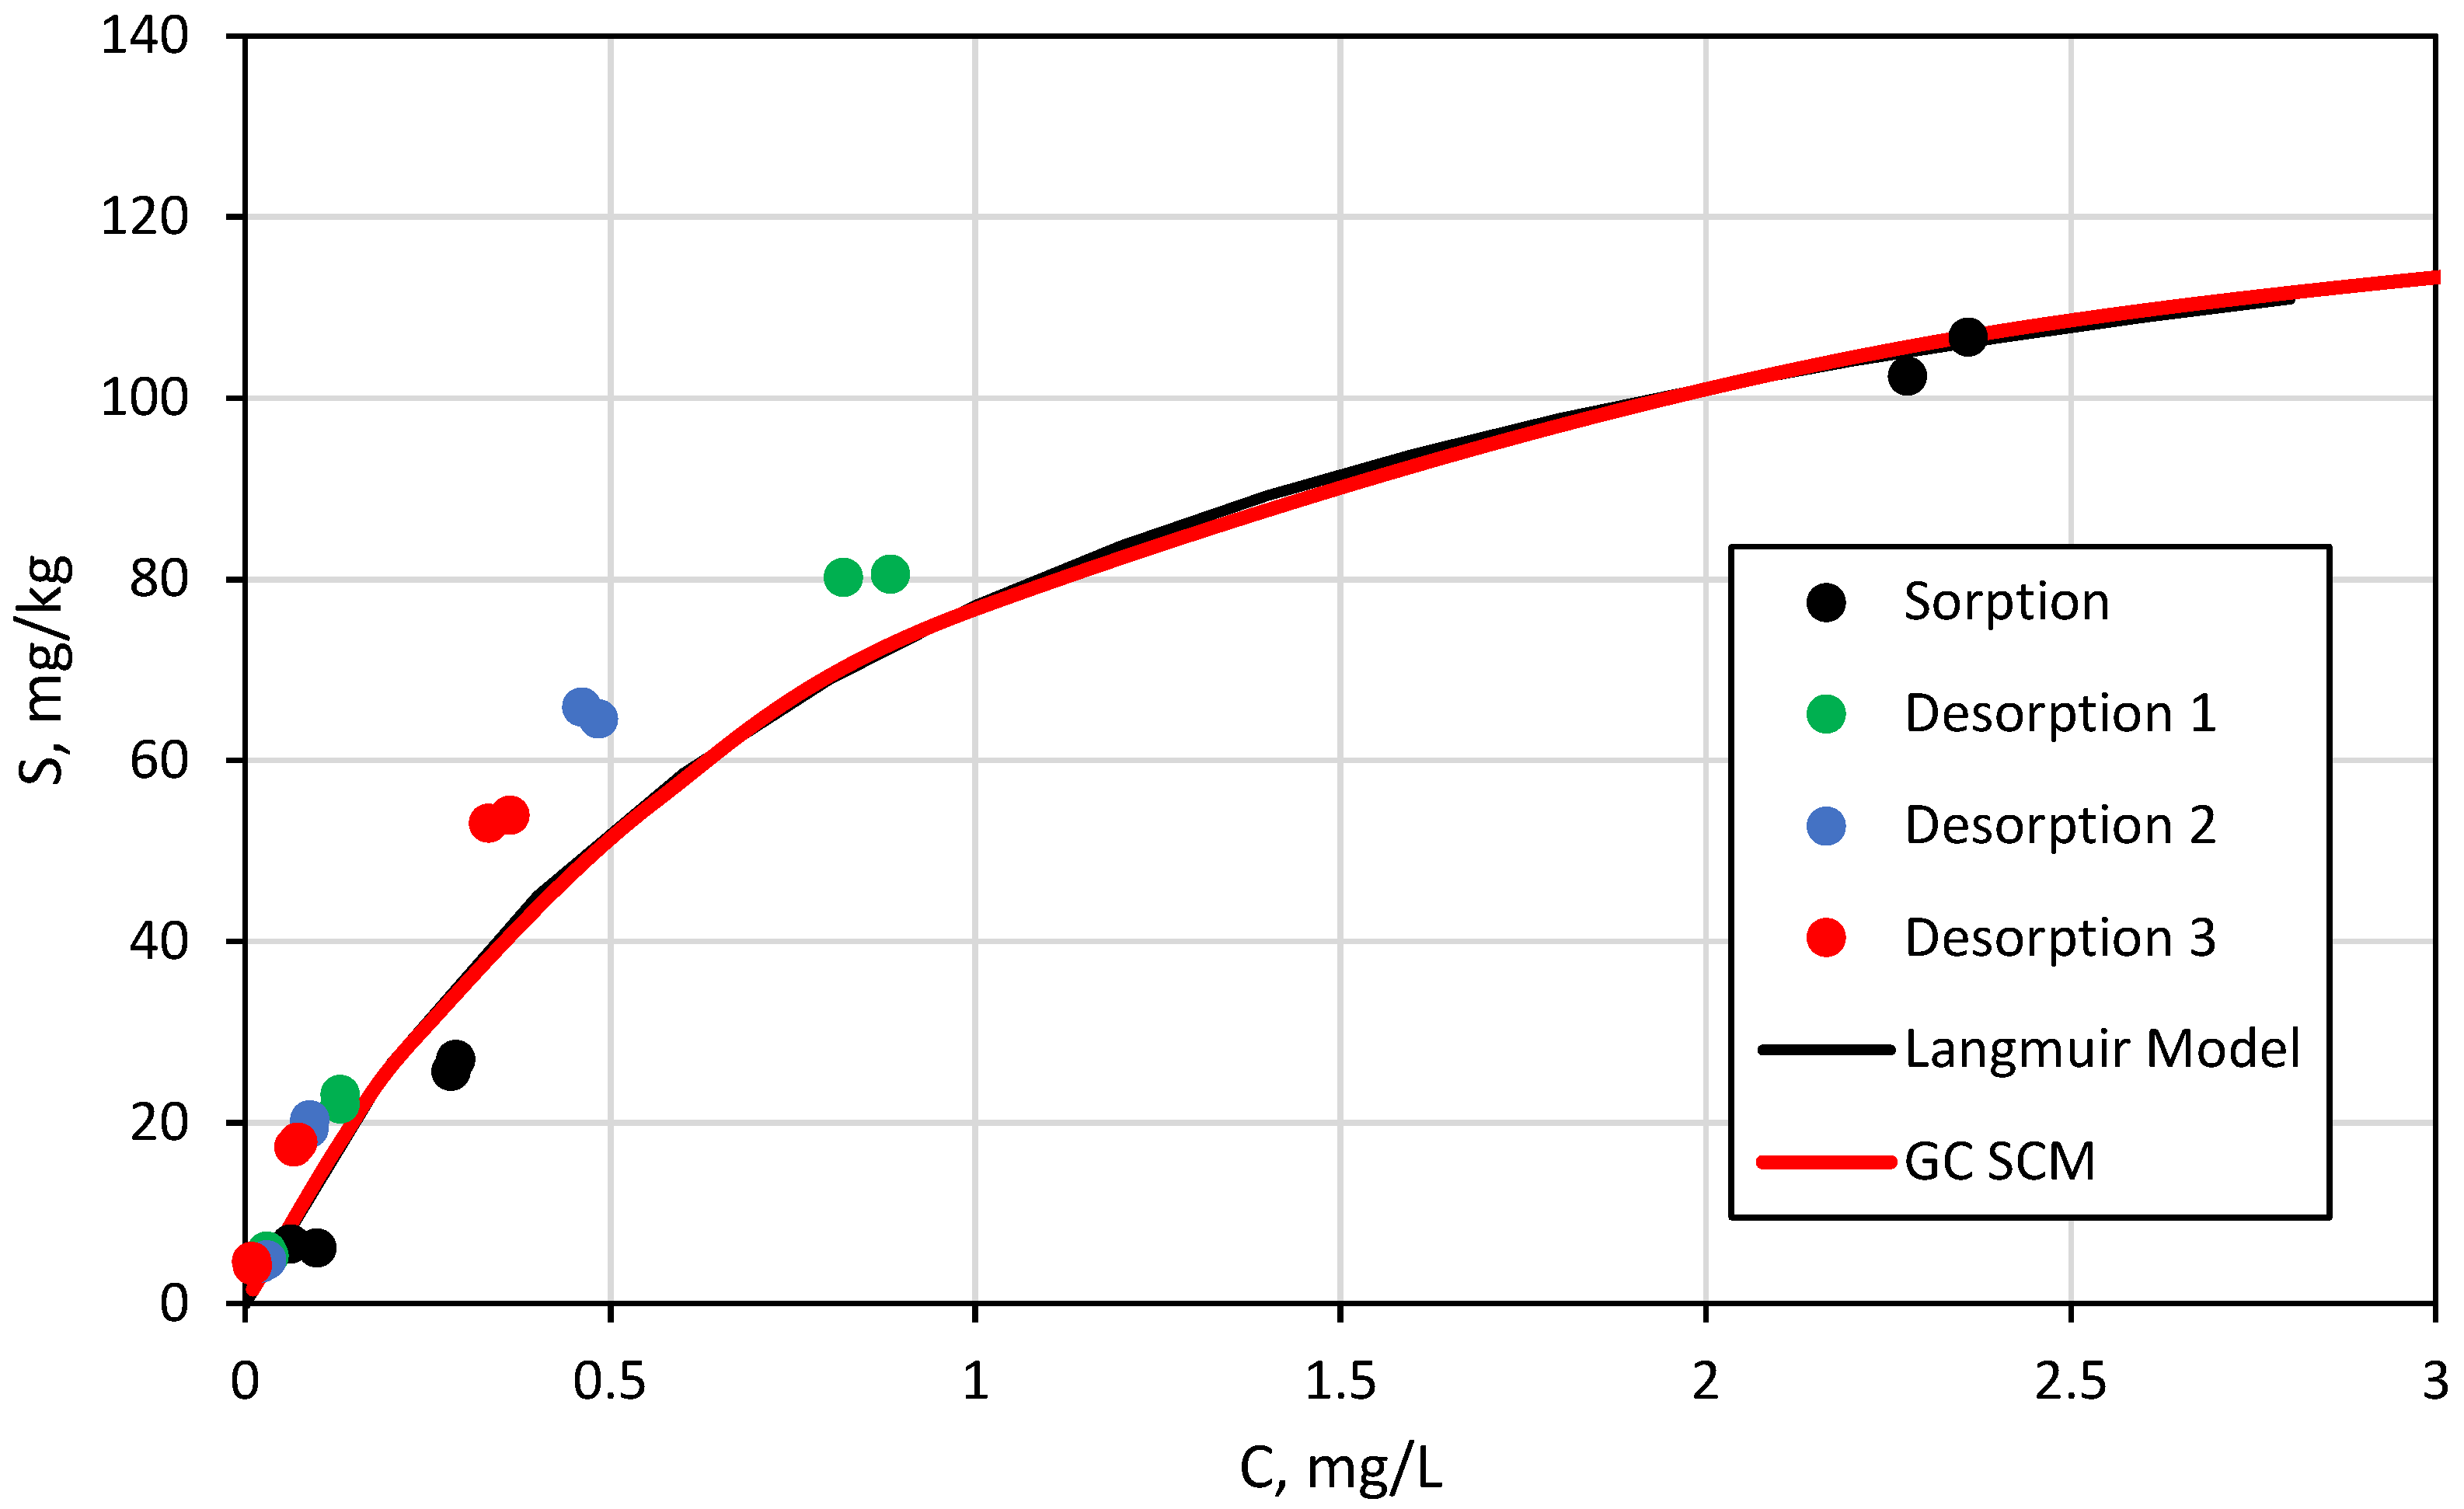
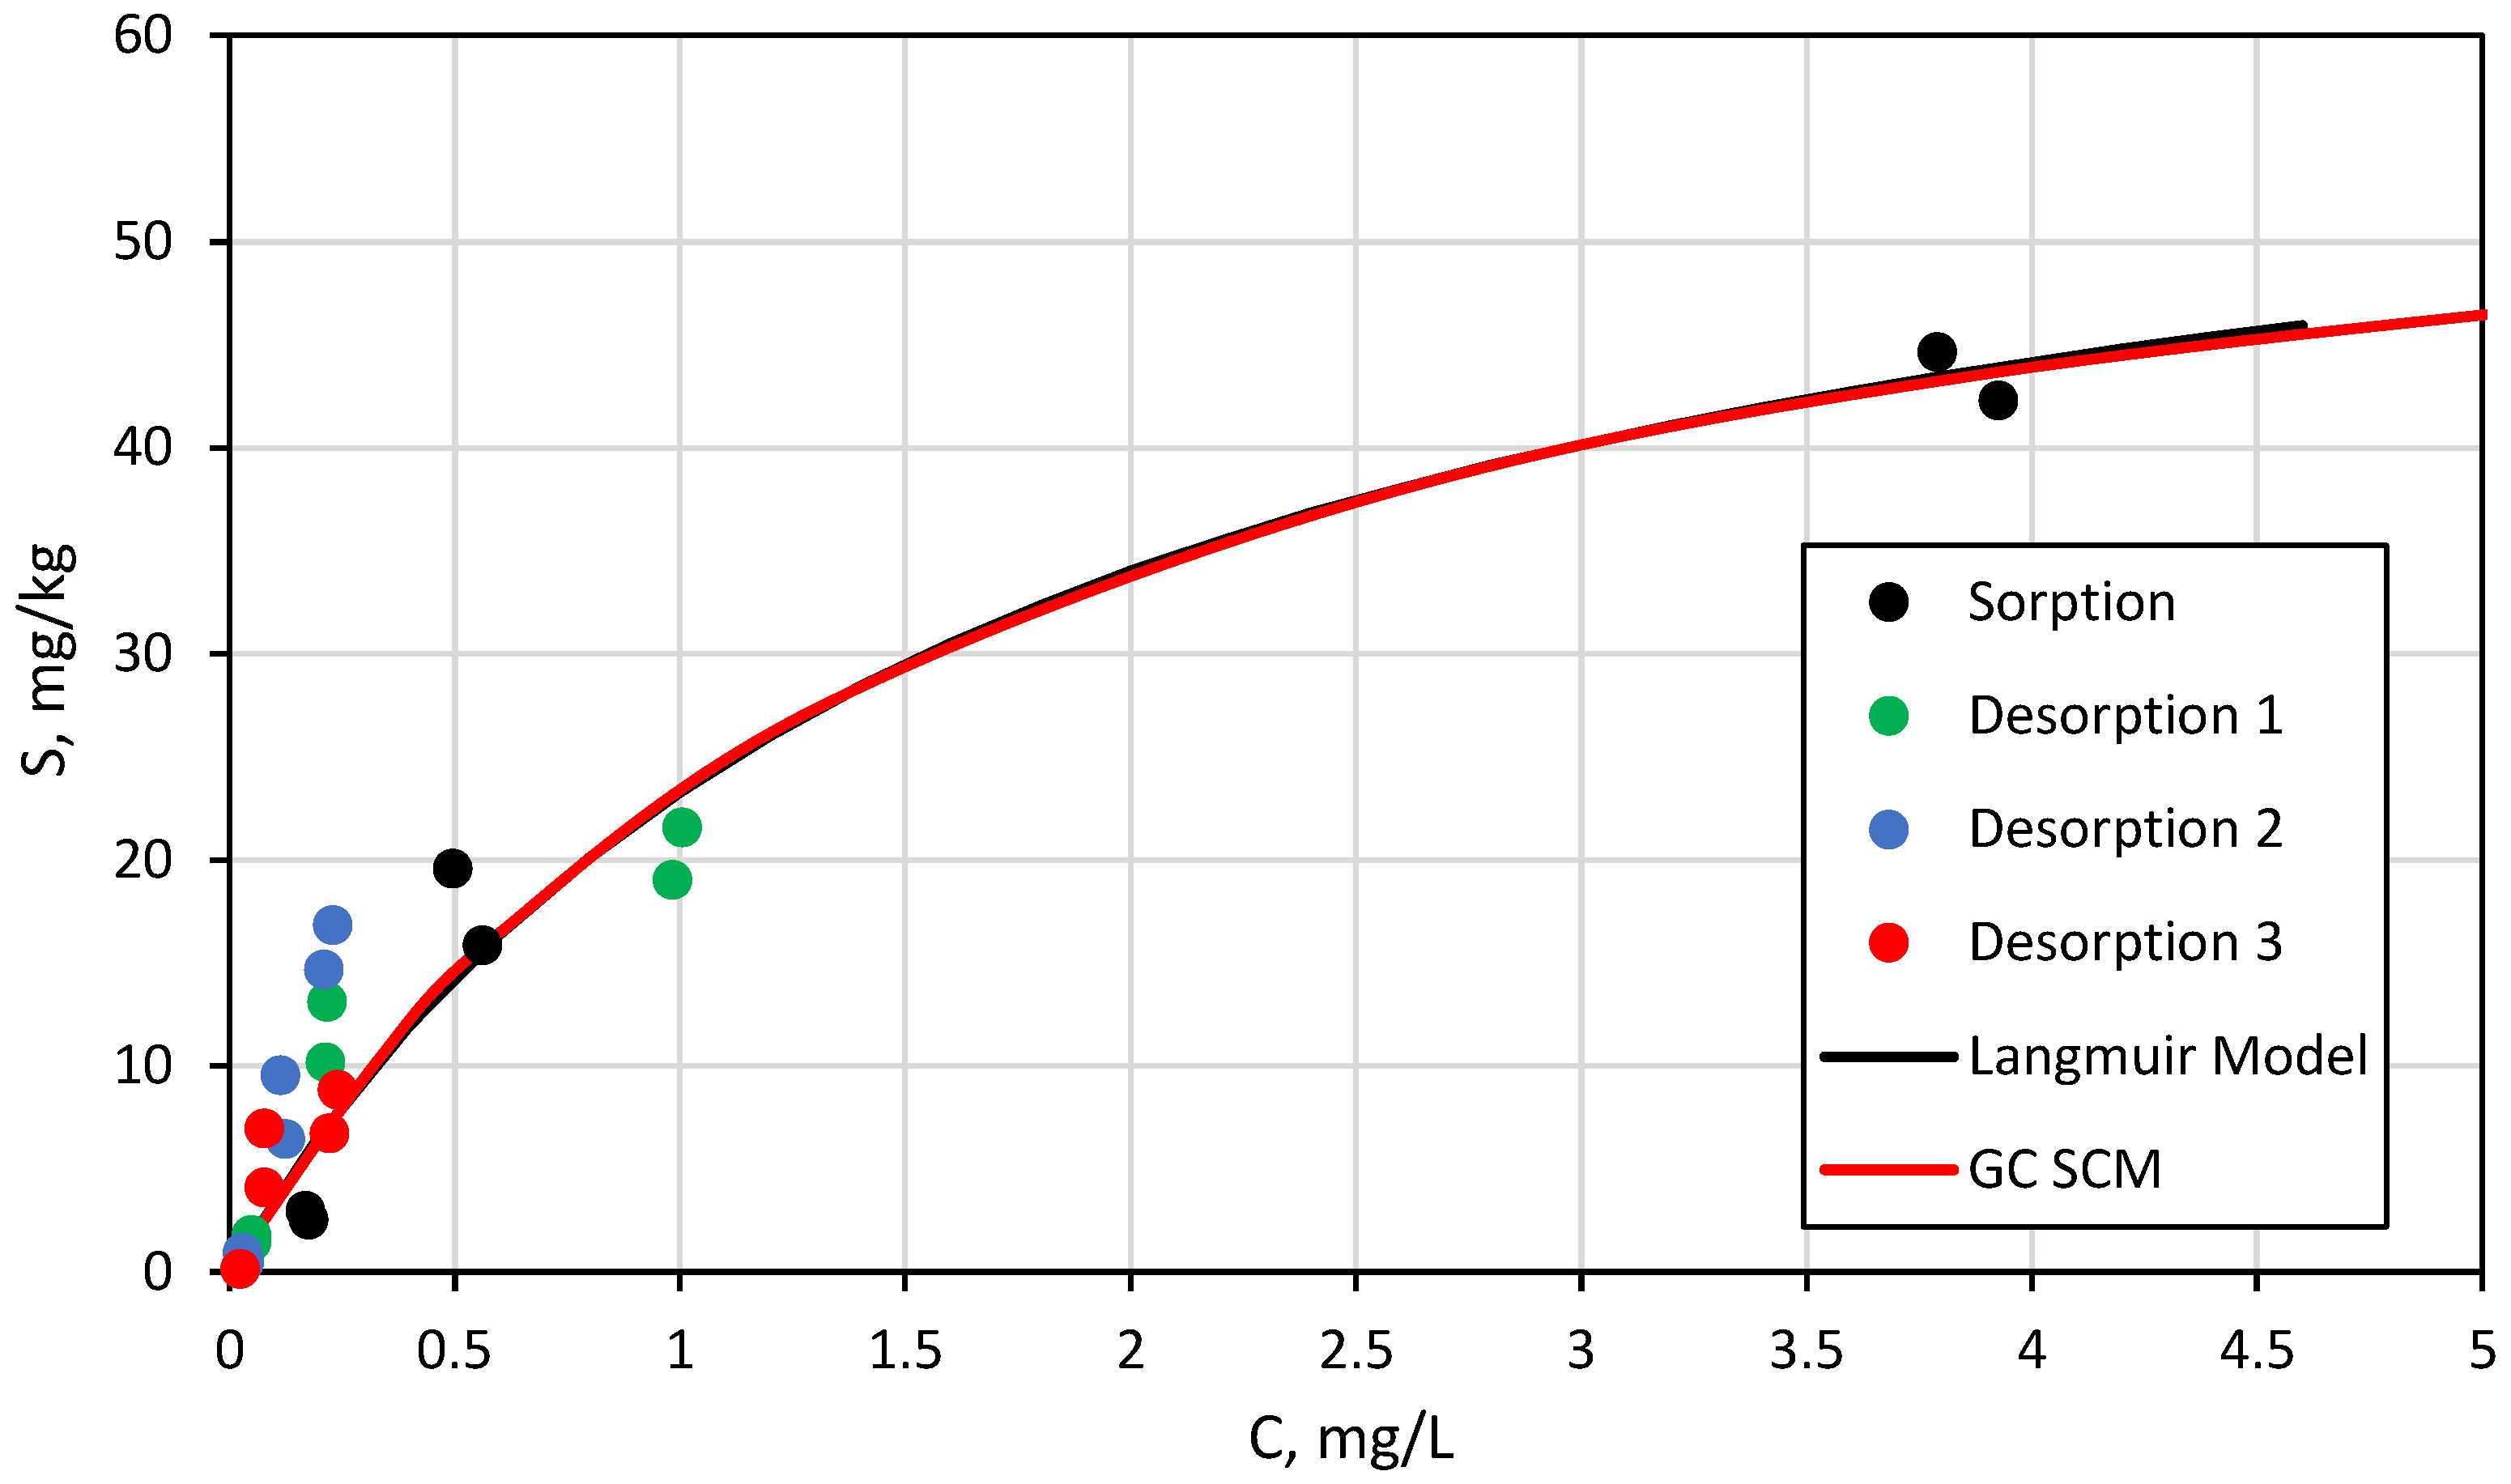
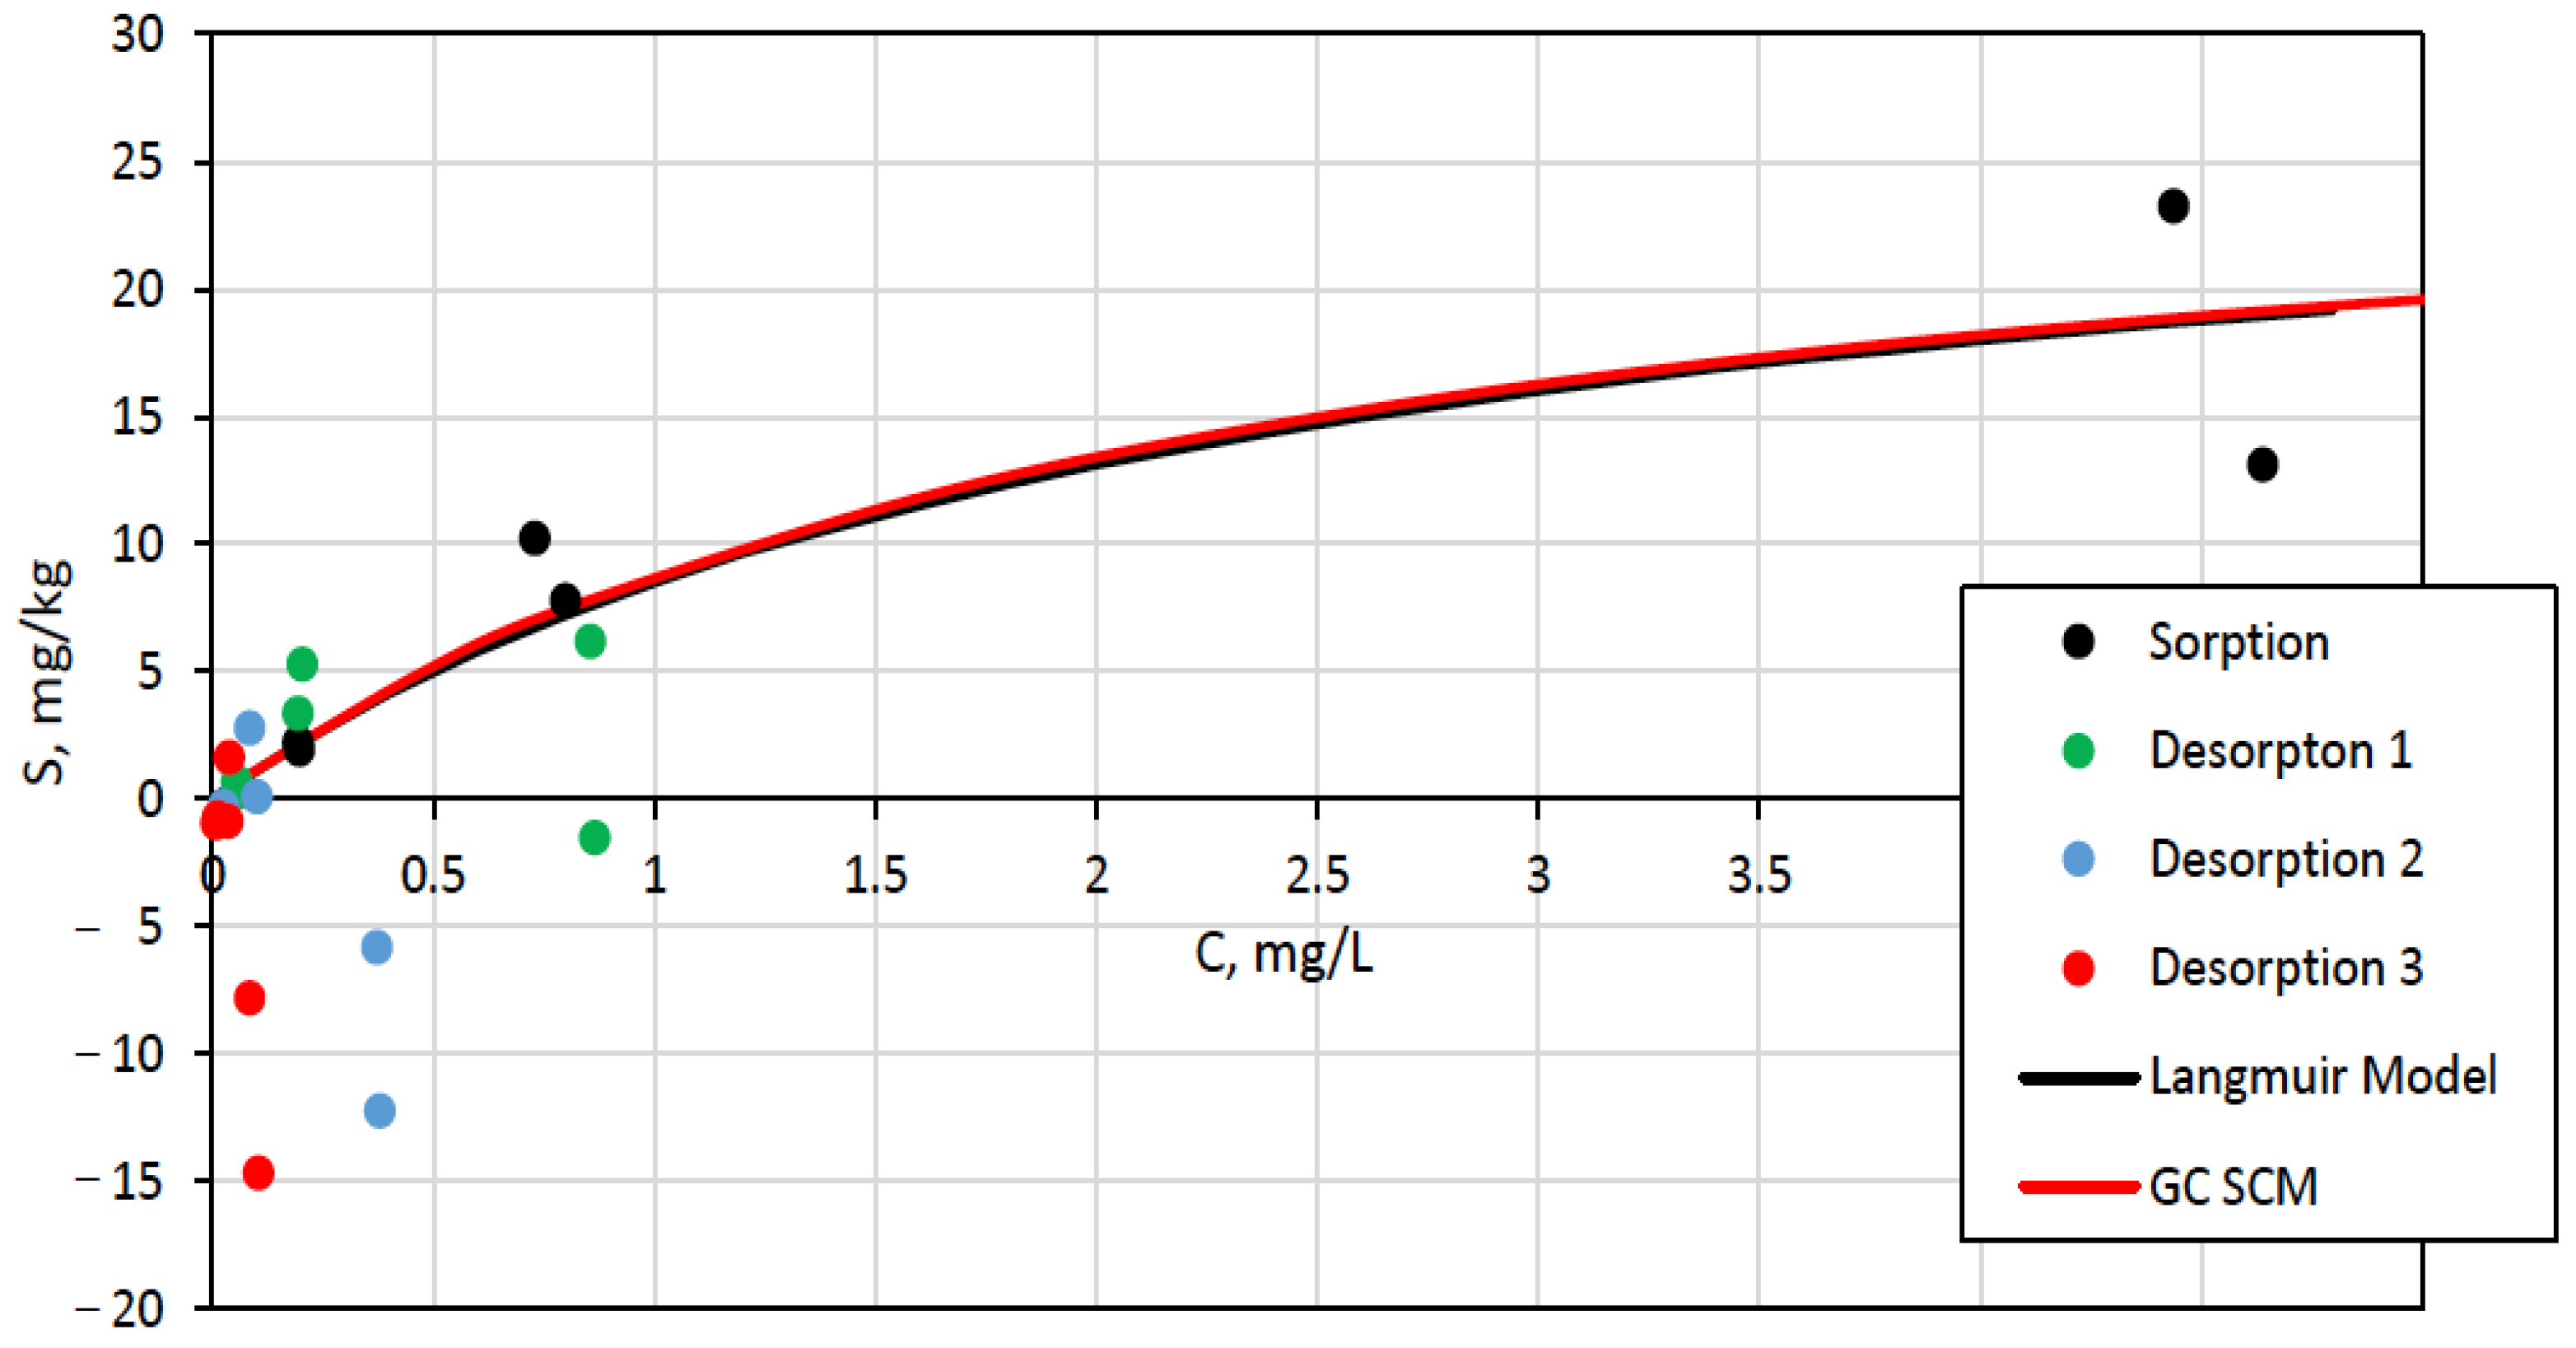
3.2.2. Batch Sorption and Desorption Experiments

Figure 1, Figure 2, Figure 3 and Figure 4 show the equilibrium uranium mass loading values on the solid phases vs. equilibrium aqueous uranium concentrations for the batch experiments on each of the four different lithologies. These are presented in order, from the greatest to least uranium uptake per unit mass of solid. Each plot includes the sorption data, as well as the data from each of the three desorption steps, which are distinguished by different symbols. In addition, shown in each plot is the Langmuir isotherm fit to the data, and a match of the GC SCM model to the data. The model curves will be discussed in the next section.
Several points are worth mentioning about the data in Figure 1, Figure 2, Figure 3 and Figure 4. First, it is apparent that for each rock type there is curvature in the plotted data, which is most evident for the sorption data with the ratio of adsorbed uranium to aqueous uranium decreasing as dissolved uranium concentrations increase. This is typical of sorption capacity limitations at higher aqueous concentrations, and it qualitatively supports the use of a sorption site density [XOH], as an adjustable parameter in a GC SCM. It also supports the use of a non-linear Langmuir isotherm with a maximum sorption site capacity (Smax) for a non-mechanistic sorption model, as opposed to a Kd approach (linear isotherm).
Second, uncertainty bars are not shown for the data points in Figure 1, Figure 2, Figure 3 and Figure 4, but the uncertainties can be inferred from the scatter associated with the four replicates at each starting uranium concentration for the HOP-5 samples (Figure 1), and with two replicates at each starting uranium concentration for the other lithologies (Figure 2, Figure 3 and Figure 4). The scatter observed for clustered data points reflects a combination of uncertainties associated with sample heterogeneity, slight differences in solid sample sizes, and random experimental and analytical errors, including dilution errors in the desorption steps; although no attempt was made to distinguish between these different uncertainty contributions.
In Figure 1, Figure 2, Figure 3 and Figure 4, the desorption data tend to show more scatter than the sorption data. In the case of the SS-10 sandstone (Figure 4), the uranium adsorbed on the solids drops below zero during the desorption steps for some of the samples, which is not physically realistic. Uranium leaching from the sandstone could cause this result, but this was ruled out by the non-detection of uranium in the SSW leaching experiments that were conducted on the sandstone (i.e., blanks). Instead, we believe that this result was the consequence of: (1) the relatively small uranium mass adsorbed to the sandstone relative to the mass in solution after sorption, (2) the fact that that uranium on the solids is calculated from differences in aqueous uranium concentrations with each step, and (3) the fact that errors in aqueous concentration measurements and dilution factors (when the equilibrated solution was replaced with SSW) were propagated with each successive desorption step. All of these factors could easily result in apparent negative masses of adsorbed uranium. In hindsight, better adsorption and desorption data could have been obtained for the sandstone SS-10 if lower total uranium to solid mass ratios (ideally achieved with higher solid masses) had been used in the experiments. This would have resulted in a greater fraction of uranium mass being adsorbed and, thus, smaller errors in the calculations of uranium mass remaining on the sandstone with each desorption step.
Despite the greater scatter in the desorption data, it seems apparent that there are no significant differences between the sorption and desorption data (often referred to as sorption-desorption hysteresis) for the CK-6 and SS-10 samples (Figure 3 and Figure 4). For the phosphorite HOP-5 samples (Figure 1), it appears that the U remaining adsorbed after the desorption steps tended to be slightly lower than the U adsorbed after sorption for the same aqueous uranium concentrations. This is difficult to explain, given the relative constancy of the water chemistry between the sorption and desorption steps (compare the equilibrated HOP-5 water chemistry with SSW in Table 1) and the fact that no uranium evolution from the HOP-5 samples was observed in the SSW leaching experiments (i.e., blanks). It is much more common to observe a greater mass being adsorbed during desorption than sorption, which has many potential explanations, including partial sorption irreversibility, slow desorption, diffusion-limited desorption, or even partial precipitation or chemical transformation of the uranium adsorbing species. In fact, precipitation of uranium as a uranyl phosphate phase would not have been surprising in the HOP-5 experiments [51], and it was expected that it might be necessary to include irreversible uptake reactions to model the HOP-5 desorption steps. The fact that this was not necessary and that a greater fraction of uranium appeared to be in the solution phase during desorption than during sorption suggests that uranium precipitation reactions did not occur in the batch experiments. The results may instead indicate a tendency for the errors in aqueous uranium concentration measurements and/or in experimental dilution factors to have been biased in the direction of underestimating the uranium remaining adsorbed on the solids during the desorption steps.
For the OS-3 samples, it is apparent that there was greater mass adsorbed during desorption than during sorption, which is more commonly observed than the opposite situation noted for the HOP-5 sample. Although the equilibration experiments showed a slightly greater change in water chemistry for the OS-3 rock than for the other lithologies (Table 1), with the main difference being an increase in Ca2+ and SO42− after equilibration, it seems unlikely that the relatively small differences before and after equilibration could explain the observations. Furthermore, the rock:water mass ratio was approximately four times lower in the sorption experiments than in the equilibration experiments, which would exaggerate the water chemistry differences in the equilibration experiments relative to the sorption experiments. One possible explanation is that the high organic content of the OS-3 may have induced some partial reduction of U(VI) to U(IV), which would have resulted in stronger sorption or possibly precipitation of some of the uranium prior to the desorption steps. It is also possible that desorption of U(VI) from the organics was much slower than from the inorganic phases in the rocks, and the desorption equilibration times for the OS-3 samples were just not long enough to observe the full equilibrium extent of desorption.

3.3. Surface Complexation and Non-Mechanistic Sorption Modeling

Figure 1, Figure 2, Figure 3 and Figure 4 show the fits of both the GC SCM model, and the non-mechanistic Langmuir sorption isotherm model, to the sorption/desorption data sets for each lithology. It is apparent that the two fits are nearly identical for each lithology, which is not surprising, given that both fitting procedures involved minimizing the sum of residuals squared (SORS) differences between the model and data. As mentioned in Section 2.4, linear (Kd) and non-linear Freundlich isotherms were also fitted to each data set, but in all cases, the Langmuir isotherm provided the best non-mechanistic model fit to the data. Both the GC SCM and Langmuir isotherm models were fitted, with the sorption data being weighted twice as much as the desorption data for each lithology, because the sorption data tended to have less scatter and less error propagation than the desorption data. Moreover, the sorption data spanned a wider range of uranium concentrations than the desorption data, such that giving them more weight should provide better estimates of the maximum sorption capacity parameters, Smax and [XOH].
Table 4 shows the fitted GC SCM parameters of log (β) and [XOH] and the Langmuir parameters KL and Smax for all four rock types. For each rock lithology, the GCM [XOH] parameter and the Langmuir Smax parameter are in very good agreement. Both parameters effectively describe a maximum uranium sorption capacity of the dominant mineral phase surfaces.
In general, the fitted parameters for both the SCM and the Langmuir isotherm reproduced the batch results quite well, for both the sorption and three desorption steps. In the case of the OS-3 sample, it is apparent that the best fits split the difference between the sorption and desorption behavior that was observed for this lithology, which is to be expected when both sorption and desorption data are fitted simultaneously. For the SCM, the lack of sorption data at different pH values for each lithology meant the data were not well constrained and could not be used to elucidate the effect of alkalinity and pH on surface speciation. However, the high buffering capacity of the samples (>14 wt.% CaCO3) for all four different rock types, and the possibility of mineral dissolution at lower pH, would have introduced uncertainty into the fitting process as well. The high calcium carbonate buffering capacity of all lithologies studied should force infiltrating groundwater chemistry in the natural Negev Desert environment to converge to a relatively narrow range of pH, alkalinity, and calcium concentrations after equilibration with the rocks. This is significant, as these are the three water chemistry parameters that are of greatest importance for determining uranium aqueous speciation and, hence, uranium sorption [14].
Thus, while the properties of the rocks made it challenging to parameterize the SCM beyond a relatively narrow range of geochemical conditions, they also emphasize that, because of the buffering capacity of the Negev carbonates, it is not likely that subsurface conditions would require the use the SCM to predict subsurface transport behavior beyond the narrow range investigated. The buffering capacity of the rocks and the consequent unlikelihood of significant water chemistry variations in the natural environment also support the use of a non-mechanistic sorption model, such as the Langmuir isotherm, to describe uranium sorption to the different lithologies in a predictive transport model.

4. Discussion

The four lithologies collected from the Negev Desert, Israel, represent a variety of mineralogic assemblages, which allowed us to assess the ability of both a GC SCM and a non-mechanistic Langmuir isotherm to model uranium sorption and test their respective capabilities to differentiate uranium sorption for different solid phase mixtures. The ability to predict uranium sorption as a function of mineralogical composition is useful in subsurface nuclear waste disposal risk assessments. This is because there can be significant mineralogical heterogeneity within the flow pathways that cross several geologic formations or travel laterally for relatively short distances within the same geologic unit. A predictive mineralogical-based capability reduces the need to conduct sorption experiments for every subtle variation in mineral chemistries encountered along a flow pathway.
SEM-EDS, qXRD, and optical microscopy helped identify several mineral phases such as apatite, organic matter, clays, and iron oxides (expressed as Fe2O3) that likely constitute the principal candidates for uranium sorption in the Negev Desert specimens. Armed with this mineralogical information, discussed in Section 3.1 and in Appendix A, Appendix B, Appendix C, Appendix D, Appendix E, Appendix F and Appendix G we investigated several approaches, from which two were chosen to establish a predictive link between mineralogic composition and the observed uranium sorption. The first method is the component additive surface complexation model (CA SCM) introduced in Section 1, which uses literature surface complexation data and site densities from pure mineral phases to predict sorption, and that we used to compare our laboratory results on uranium sorption. The second method was more empirical, whereby the individual phase contributions from each rock type, to the Smax and KL values for the Langmuir isotherms, and the log (β) and [XOH] values for the GC SCM, were estimated from the experimental uranium sorption data. Mathematically, this was done by solving four linear equations with four unknowns for the Smax or [XOH] contributions, and another four equations with four unknowns for KL or log (β) contributions. The equations were as follows (one for each lithology, with only the equations for the ith lithology shown here):
For the Langmuir isotherm:
A w i + B x i + C y i + D z i = S m a x , i
E w i + F x i + G y i + H z i = K L , i w i + x i + y i + z i
and, for the GC SCM:
A w i + B x i + C y i + D z i = X O H i
E w i + F x i + G y i + H z i = log β i w i + x i + y i + z i
where (i) wi, xi, yi, and zi are the mass fractions for each of the adsorbing mineral phases (iron oxides, clays, organics, apatite/phosphate, respectively) in lithology ‘i’; (ii) A, B, C, and D are the Smax or [XOH] values per unit mass fraction for each individual phase; (iii) E, F, G, and H are the respective KL or log (β) values per unit mass fraction for each rock, and (iv) Smax,i, KL,i, [XOH]i, and log (β)i are the fitted Langmuir and GC SCM parameters for lithology ‘i’. Given that there were four rock types, each with different w, x, y, z values, a unique solution exists for A, B, C, and D when solving Equations (3) or (5), and a unique solution also exists for E, F, G, and H, solving Equations (4) or (6). Once A through H are known, the same equations can be used to predict the sorption model parameters for a rock, with a different mineral composition if the mass fractions (w, x, y, z) of the reactive minerals are known. Note that Equations (3) and (5) assume a strict additive contribution from each phase to the overall site density parameters, whereas Equations (4) and (6) assume a weighted average contribution from each phase for the overall KL or log (β) parameters. This result is readily understandable, since if the mass fraction of a given phase doubles, its contribution to the total site density should also double, but its contribution to either KL or log (β) should only affect the weighted average. If there is only one reactive phase present, KL or log (β) should not change at all when the mass fraction of the phase changes.
In the following two sections, we present results from the two different approaches and provide some discussion regarding the results.

4.1. Component Additive Surface Complexation Modeling

In the HOP-5 experiments, the high uranium uptake capacity was likely driven by apatite and other Ca-PO4 mineral phases [52,53,54,55,56]. The uranium sorption in apatite-rich rocks is complex, due to the potential for forming uranium–phosphate precipitates [50]. In addition, differentiating between sorption and uranium–phosphate precipitation can prove experimentally difficult [57]. However, if precipitation had been significant in the HOP-5 experiments, it would have caused more apparent partitioning to the solids during desorption than during sorption. This was not observed.
A CA SCM for the HOP-5 lithology was developed using log(β) and a [XOH] of 4.92 and 1.23 sites/nm2 (≈6200 mg U/kg for the HOP-5 BET surface area) respectively, based on the work of Brendler et al. [54] for pure apatite. The mass fraction of apatite in the HOP-5 samples was 0.768, based on qXRD results, and no other phases were assumed to contribute to sorption. If other phases had contributed significantly to sorption, the apatite-only CA SCM would significantly under-predict uranium sorption, which it does not. Figure 1 includes a model curve showing the predicted uranium sorption behavior using the apatite parameters of Brendler et al. [54] along with the experimental data and the other model curves already discussed for the HOP-5 phosphorite. The theoretical CA SCM under-predicts uranium sorption at low uranium concentrations and over-predicts sorption at higher uranium concentrations, with the crossover point being near the upper end of the experimental concentration range of uranium. Overall, this is a reasonable result for the HOP-5 lithology, although the GC SCM and Langmuir isotherm are clearly superior in matching the experimental data. Qualitatively, these results suggest that uranium sorption is predominantly driven by apatite, despite measurable amounts of organic matter in the HOP-5 rocks (TOC ~ 2.0 wt.%). Both apatite and the complex organic matter carried a negative charge under the pH conditions of our experiments [58].
The absence of observable uranium–phosphate precipitation in the HOP-5 rocks was initially unexpected. However, no aqueous phosphate was measured in the HOP-5 samples after the 24-h equilibration period prior to adding uranium to the experiments. Solubility calculations in PHREEQC also suggested limited apatite/fluorapatite dissolution under our experimental conditions (<1 × 10⁸ M of PO43). The concentrations of both uranium and aqueous phosphate were too low to precipitate uranium–phosphate bearing minerals, as indicated by the consistently negative saturation indices (SI) across all uranium concentrations. The SI for Autunite and Chernikovite, respectively, remained below −7.5 and −9 for all simulations. Previous studies showed that high uranium concentrations are required for uranium–phosphate mineral formation [52,56,57]. In addition, the high concentrations of Ca2+ and HCO3 relative to the phosphate phase in solution may have inhibited the formation of uranium–phosphate phases [59]. If uranium–phosphate phases were formed, it is likely that this only occurred via substitution into the crystal matrix after uranium sorption, rather than crystallization from the solution phase [58,60]. This process, however, would not be captured by standard thermodynamic models, and it is unlikely that this uptake mechanism played a significant role in the sorption experiments, as evidenced by the lower sorption values for the desorption steps than for sorption.
The log (β) values for the OS-3, CK-6, and SS-10 samples all converged to values ranging from 6.2 to 6.4 in the GC SCM. The difference in sorption capacity for the three rock types mainly stemmed from differences in the fitted [XOH] values. The similarity of the fitted log (β) values might suggest that the same solid phase (albeit in varying abundance) controlled uranium sorption in the three lithologies. However, the composition and mineral characterization of the samples did not suggest a suitable candidate for such a common and dominant adsorbing phase in the three different rock types. The BET surface areas for the SS-10, CK-6, and OS-3 lithologic assemblages (Table 3) had 1:1.34:2.39 ratios, whereas the sorption site density parameters (Table 4) had 1:2.1:5.1 ratios. This argues against a surface area dependent sorption mechanism, which one might expect if a single phase common to all three lithologies controlled uranium sorption.
Of the four lithologies studied, the bituminous marl OS-3 exhibited the most complex mineralogy, consisting of clays (17 wt.%), abundant organic matter (11 wt.%), apatite (7.6 wt.%), and aluminosilicates (26.9 wt.%) (Table 3). The presence of apatite may have significantly increased the sorption capacity of the OS-3 sample; however, using the same theoretical model for apatite-controlled sorption as for the HOP-5 samples (adjusted for the lower apatite content of the OS-3 sample) significantly underestimated the uranium sorption by a factor of more than 2.
Total organic carbon in the OS-3 samples (TOC ≈ 11 wt.%) is likely to have contributed to uranium sorption. To this end, an attempt was made to assess the applicability of literature values for uranium binding to pure humic acids, to estimate the sorption capacities in the Negev lithologies. Uranium sorption to soil organic matter remains difficult to determine in natural systems, since the sorption properties of organic matter are strongly dependent on pH and ionic strength, as well as the compositional and maturity characteristics of the organic phase(s), which can vary widely under different geologic settings. Humic acids with many available carboxylic and phenolic acid functional groups might be expected to sorb uranium more strongly than the “hydrocarbon” organic phase(s) in the Negev bituminous rocks. It is generally accepted that uranyl binds to carboxylic and phenolic functional groups in humic acids in either 1:1 or 1:2 ratios, by replacing bound hydrogen ions [57,58,59,60,61]. Binding constants log (β) for the uranyl-humic acid complex vary in the literature, though they generally fall between 4.7 and 6.7 [61,62,63,64] depending on pH, ionic strength, the calcium carbonate composition, and the complexation reaction used in the fitting process [61,62,64]. Differences in the binding constants often arise from the origin of the humic acids used in experiments, with synthetic humic acids exhibiting higher log (β) values (6.1–6.5) than those derived from natural sources (5.8–6.1) [62,65]. Site densities for carboxylic binding sites (4.36 meq/g carbon) were obtained from Pompe et al. [65], together with a log (β) value of 5.88 for the humic acid-uranyl complex. Using the TOC wt.% values from Table 3 we obtain a sorption site density of 0.432 mol/kg-rock for the OS-3 samples. As expected, using the entire fraction of organic matter as an adsorbing phase significantly overestimates uranium sorption by two orders of magnitude. If the fitted [XOH] (145.5 mg/kg or 6.11 × 10⁻⁴ mol/kg) is representative of the available binding sites within the organic matter, and assuming that humic acids are reasonable surrogates for the organic matter in the OS-3 samples, then only ≈0.15% of the total organic matter is accessible to aqueous uranium in these samples.
The CK-6 and SS-10 rocks contained relatively similar trace amounts of organic carbon (TOC < 0.1 wt.%) and were primarily differentiated by their clay content (14.7 wt.% in CK-6 versus non-detect in SS-10), and Fe2O3 content (0.67 wt.% in CK-6 vs 1.82 wt.% in SS-10) [1]. Some clays have been shown to play a minor role in uranium sorption at pH >7.5 in carbonate-rich rocks [25,66], presumably because the presence of calcium-carbonate-uranyl ternary complexes inhibits sorption to them [67]. Conversely ferric oxide phases often control uranium sorption in sediments [9,10]. Previous sorption studies derived log (β) values (of 6.3 to 6.8) for the very strong sorption sites of ferric oxides using a fitting method comparable to the one used here [9,10]. While the log (β) value is similar to the log (β) values derived in this study, the SS-10 experiments should have shown a higher sorption capacity than the CK-6 samples, assuming Fe2O3 was present and controlling uranium sorption. Moreover, the CA SCM obtained using the generic site densities from Waite et al. [10] (i.e., 1.8 mmol/mol-Fe) would have significantly overestimated sorption in both rock types, as the estimated site densities are two orders of magnitude higher than those fitted from the batch experiments (i.e., 2.2 × 10⁻² mol/kg for SS-10, and 8.4 × 10⁻³ mol/kg for CK-6) versus the fitted site densities (i.e., 1.1 × 10⁻⁴ mol/kg for SS-10, and 2.5 × 10⁻⁴ mol/kg for CK-6). Since XRF analyses only estimate bulk Fe content, it is possible the apparent values for Fe2O3 in Table 3 are inaccurate (the bulk Fe may be present as other Fe (III) phases or could reflect the presence of pyrite and/or iron substituted into aluminosilicate minerals). Additional detailed Fe extraction procedures [68] could provide more insight into the fraction of Fe bearing minerals that are available for uranium sorption, and will be investigated in future studies, if possible.
Both CK-6 and SS-10 also contain trace amounts of organic matter (TOC < 0.1 wt.%). Based on the OS-3 results and using the same estimate for the number of carboxylic binding sites, the site densities range between 3.1 × 10⁻³ and 4.8 × 10⁻³ mol/kg-rock. These values are significantly higher than our fitted parameters of 1.1 × 10⁻⁴ and 2.5 × 10⁻⁴ mol/kg-rock for SS-10 and CK-6, respectively. If the fitted site densities are representative of the available sorption sites in the organic matter, then only approximately 4.7% and 4.4% of the organic matter in the CK-6 and SS-10 rocks participated in uranium uptake. This analysis suggests that further solid-phase characterization is needed to elucidate the uranium sorption mechanisms for these rocks.
In summary, a CA SCM appears to predict uranium sorption to the HOP-5 lithology reasonably well, providing predictions less than an order of magnitude different than experimental observations. This is probably due to the dominant role of phosphates in uranium sorption mechanisms, and the fact that the phosphates and apatite in this rock apparently have properties that are comparable to those found in the pure mineral experiments reported in the literature [54]. However, the CA SCM approach drastically overpredicts uranium sorption in the other three Negev lithologies. The reasons for these discrepancies are not entirely clear, but it is likely that they stem from differences in mineral surface availability, and the morphological or other characteristics of the reactive phases in the Negev rocks relative to the minerals used in the experiments cited in the literature. In the case of the OS-3 lithology, the overprediction may also be the result of the organic phase present in this rock (e.g., bitumen or kerogen) being much less reactive with respect to uranium sorption than humic acids, which have been the most studied organic compounds in the literature for uranium sorption.

4.2. Empirical Contributions from Adsorbing Phases Determined from Linear Combinations

For this approach, it was assumed that all observed uranium sorption could be attributed to the four phases (three mineral and one organic) present in the Negev lithologies: iron oxides (expressed as Fe2O3), clays, apatite, and organic carbon. It was also implicitly assumed that the sorptive properties of the mineral phases do not vary significantly across the different lithologies. The application of a linear combined methodology that simultaneously solves four equations (i.e., Equations (3) and (6)), resulted in positive contributions from each sorptive mineral phase identified to the total sorption site density, using either Langmuir Smax or GC SCM [XOH]. Mathematically, however, the organic matter had a negative contribution, because of the large effect of apatite on uranium sorption in the HOP-5 lithology, and the non-trivial mass fraction of apatite in the OS-3 lithology. In the latter case, a higher uranium sorption capacity is predicted for the OS-3 bituminous marl than was observed. Negative sorption site density contributions are obviously not physically realistic. This problem appears to originate from the outlier characteristics of the OS-3 sample; therefore, as an alternative, it was assumed that all the uranium sorption observed in experiments on the OS-3 lithology could be attributed to the organic carbon phase(s) and not the mineral phases in this sample. This is equivalent to assuming that the large mass fraction of organic carbon in the bituminous oil-producing OS-3 sample is effectively limited by the accessibility of aqueous solutions to mineral surfaces, which negates their contribution to uranium sorption. This is consistent with the known tendency for hydrophobic hydrocarbon oils to expand, adhere to, and coat the mineral and pore surfaces in oil shales [69]. Conversely, it was assumed that organic carbon did not effectively contribute to sorption or the model parameters derived for the HOP-5, CK-6, and SS-10 lithologies. In fact, this assumption made little difference in the estimated contributions of the inorganic phases to uranium sorption, as the mass fractions of organic carbon in these lithologies were small compared to OS-3. These observations and assumptions permit realistic solutions for phase contributions to the sorption model parameters, avoiding negative contributions from any of the phases. The resulting contributions from each phase are listed in Table 5.
From a practical perspective, the sorption parameters per unit mass fraction values in Table 5 could be used to predict these parameters from mass fractions determined by mineralogical characterization in any Negev lithology, other than a highly bituminous one. For highly bituminous Negev lithologies (i.e., organic-rich limestone marls), one should revert to using only the organic mass fraction as a predictor of the parameters, to avoid overpredicting uranium sorption, especially if a significant mass fraction of apatite is present. A key shortcoming with this approach is that our experiments did not reveal the organic content above which one should use only the organic mass fraction to predict sorption parameters. This is because the amorphous hydrocarbon phases in the different rocks are likely to be compositionally and structurally different with different degrees of maturity. Alternatively, there is an intermediate organic mass fraction range over which a hybrid approach might work best. We suggest, however, that using all the individual component contributions to the sorption parameters seems to work if the organic mass fraction is 2% or less (i.e., HOP-5, CK-6 and SS-10). However, if the organic mass fraction is higher than approximately 10% (i.e., OS-3) and/or the sample contains mature hydrocarbon oils that can wet mineral and pore surfaces, only the organic contribution should be used. We recommend caution when applying this approach to any lithology with an organic mass fraction between 2.0% and 10%, and we further recommend conducting additional uranium sorption experiments for such lithologies. Furthermore, this finding is restricted to Late Cretaceous shallow marine bituminous lithologies from the NE Negev Desert area and is not necessarily applicable to oil shales or oil and gas reservoir rocks from other provenances, where the hydrocarbon phase compositions and kerogen maturity may be different.
While the empirical phase contribution approach clearly has limitations, it offers an option for estimating uranium sorption to rocks of varying mineralogical composition, with less risk of drastically overpredicting sorption, as in the case of the CA SCM approach. The empirical approach benefits from being constrained by experimental observations, whereas the CA SCM uses literature sorption data for pure mineral phases that may have significantly different characteristics than the phases in natural rock assemblages. It follows that one should be cautious in extrapolating the empirical phase contributions determined in this study beyond the Negev lithologies, as mineral characteristics can differ significantly in different depositional environments, including intercalated depositional settings. The empirical phase contribution approach will probably work best when applied to variations in mineralogy within the lithologies studied, as one would not expect the sorptive phase properties (per unit mass) within these lithologies to vary significantly as a function of abundance. Conversely, highly bituminous, hydrocarbon bearing rock is clearly an exception, as discussed above. The approach should be validated by conducting additional experiments on Negev rocks with different mineral compositions than the ones studied here, to further test its predictive capability.

4.3. Examination of Discrepancies Caused by Organic Carbon

The influence of organic carbon complicated attempts to describe uranium sorption as a function of mineralogy in both approaches described in the previous two sections. This influence was most apparent when trying to explain the mineralogical dependencies of sorption in the bituminous limestone marl OS-3 and the organic-rich phosphorite HOP-5. Additional insights can be obtained by considering the SEM-EDS and petrographic analyses of these rocks presented below and in Appendix D, Appendix E and Appendix F.
The SEM-EDS and petrographic analyses of the OS-3 and HOP-5 rocks (Figure 5 and Appendix E and Appendix F) bring out distinct differences in the accessibility of apatite crystals to solution phase uranium, and details of the location of the solid organic carbon phase for both bituminous marl OS-3 and the organic phosphorite HOP-5. In the HOP-5 sample the apatite phase is a fine-grained, porous surface layer (Figure 5A), coating larger calcite crystals; while in the OS-3 samples, apatite occurs in the form of platy aggregates with lower surface areas (Figure 5B). It is likely that apatite (as well as possibly some organic matter) was simply not as easily available to the solution phase uranium in the OS-3 experiments, due to smaller apatite crystals being cemented into the calcite matrix and possibly mantled with, or enclosed in, hydrophobic organic matter. Apatite in the HOP-5 rocks is deposited over larger calcite crystals and exhibits a much larger surface area, within a highly porous matrix. Organic matter is ubiquitously distributed in the matrix of the OS-3 samples (and to a lesser extent in the HOP-5 rocks), as shown in the petrographic images and SEM-EDS Analyses (Appendix E, Figure A8, Figure A9, Figure A10, Figure A11, Figure A12, Figure A13, Figure A14 and Figure A15; Appendix F, Figure A16 and Figure A17).
Overall, these observations qualitatively support the assumption made in the empirical phase contribution approach (Section 4.2) that inorganic phases, and in particular apatite-rich phosphates, were suppressed in their contributions to uranium sorption in the OS-3 samples because of partial blockage of their surface areas by organic carbon and/or clay in these samples. However, the observations also suggest other possible explanations for the outlier behavior of the OS-3 samples. The takeaway message is that differences in morphology and mineral characteristics within samples should be carefully considered when developing and applying a predictive model for uranium sorption as a function of mineralogy.

5. Conclusions

All the Negev rock specimens evaluated in this study showed an appreciable uptake capacity for uranium. GC SCM models involving a single type of sorption site were successfully fitted to the sorption data for each rock type, but these models are poorly constrained for application over a wide range of aqueous geochemical conditions, because the buffering capacity of the calcite-rich rocks severely limited our ability to vary key parameters in the experiments that influence uranium sorption, such as pH, alkalinity, and calcium concentrations. However, by varying the uranium to rock mass ratio in the experiments, we were able to obtain good constraints on the fitted sorption site densities [XOH], which were the dominant model parameters controlling uranium sorption to each rock from the Negev Desert area.
Aqueous solutions used in sorption experiments were strongly buffered and quickly re-equilibrated to a narrow range of compositions and pH. The same conditions are expected within the Late Cretaceous shallow marine stratigraphic sequence in the northeastern Negev Desert subsurface between 100 m and 300 m depth, due to the preponderance of these carbonate lithologies. For our application, this justifies the use of non-mechanistic isotherm models to fit sorption/desorption data to derive the model parameters used in our preliminary Negev subsurface flow and transport models. The non-mechanistic isotherm models have inherent advantages in computational efficiency over mechanistic SCM models when implemented in performance assessment transport models. We found that a Langmuir isotherm model matched the data set for each rock type just as well as the GC SCM, with the maximum sorption capacity parameter (Smax) being in good agreement with the GC SCM [XOH] parameter for all rock types. Although the GC SCM parameterization was poorly constrained because of the narrow range of aqueous chemistries accessible to us experimentally, within the range of plausible pH values, it maintains the ability to predict a sorption dependence on water chemistry and has distinct advantages over a non-mechanistic isotherm model if groundwater chemistry is ever expected to deviate significantly from the narrow experimental range.
We also evaluated the ability to predict uranium sorption based on mineralogical composition, which would prove useful for extrapolating the uranium sorption models beyond the specific mineralogical compositions of the four rock types investigated. This was done using both a mechanistic CA SCM approach and a more empirical phase contribution approach. In both cases, it was observed that essentially all the uranium sorption results could be described in terms of the iron oxides, clays, organic carbon, and apatite identified as the dominant phases with strong uranium sorption capacities in the Negev lithologies. Both approaches have limitations, but the empirical phase contribution approach does not drastically overpredict sorption, as does the CA SCM method for Negev lithologies. The phosphorite HOP-5 is an exception, as its bulk composition, apatite-rich modal content (≈70%), and porous texture were best suited to a mechanistic CA SCM approach. However, rocks with high organic carbon content, such as the bituminous limestone marl lithology (OS-3), do not conform to the general empirical mineral phase contribution approach and must be treated as exceptions, because of an apparent decreased accessibility of aqueous solutions to mineral surfaces in the presence of a surface wetting, hydrophobic hydrocarbon phase. Additional experimental work is recommended to further develop and validate a capability to predict uranium sorption based on mineralogical composition in subsurface rocks from the Negev Desert, particularly for lithologies containing significant amounts of organic carbon.
For completeness, it is important to mention some additional limitations to predicting field-scale sorption behavior from the laboratory sorption experiments that we have not already discussed. First, the preparation of samples for lab experiments (e.g., crushing, sieving) can inherently alter important properties, such as the surface accessibility of reactive phases relative to their properties in the natural environment. Crushing can also create fresh mineral surfaces that have not been exposed to weathering, and these surfaces may have a significantly different reactivity than naturally weathered surfaces. Fractured clay-rich bituminous rocks also pose a significant challenge, as they are hydrophobic and can have very small, wetted surface areas, restricting aqueous flow. In addition, conductive fracture surfaces may have mineral coatings that represent a tiny fraction of the bulk mass yet have an exaggerated influence on sorption in the natural environment. None of these complications negate the value of the laboratory experimental and modeling studies presented, but they need to be carefully considered when applying the results to subsurface radionuclide transport process models in performance risk assessments. Alternative approaches to those employed in this study should certainly be considered, and multiple approaches, if feasible, would yield additional insights into sorption behavior under field conditions and over a wider range of scales. At a minimum, laboratory results such as those of this study should always be carefully normalized by the surface area to solution volume ratios when they are applied to field-scale predictions.
From a practical standpoint, we believe that a computationally efficient, non-mechanistic Langmuir isotherm sorption model for uranium sorption should be adequate for the initial Negev Desert subsurface flow and transport simulations applied to a nuclear waste repository site model, because of the unlikelihood of significant aqueous geochemical variations along flow pathways over long distances. This is due to the combined high pH, alkalinity, and strong carbonate buffering capacity of the subsurface shallow marine assemblages present within the site. The GC SCM would be more appropriate if significant aqueous geochemical variations were expected along the flow pathways in the nearfield waste package environment, due for example to a breach of waste canisters. A linear Kd model is not advised, because uranium sorption to the Negev Desert rocks is clearly dependent on uranium solution concentrations (i.e., it is nonlinear). However, if uranium concentrations remain very low, which would be expected in many repository release scenarios, other than very close to source locations, then a Kd model with Kd equal to KLSmax from the Langmuir isotherm would be appropriate and could offer some computational advantages over the Langmuir model.

Author Contributions

Conceptualization, M.A.D., G.Y.B., P.W.R., R.R., P.H.S., H.B. and O.K.-B.; Methodology, M.A.D., G.Y.B., P.W.R., R.J.H. and G.W.; Software, M.A.D. and P.W.R.; Investigation, M.A.D., G.Y.B. and P.W.R.; Resources, G.Y.B. and H.B.; Data processing, M.A.D., P.W.R., R.J.H. and G.W.; Writing original draft preparation, M.A.D., P.W.R. and G.Y.B.; Writing review and editing, G.Y.B., P.W.R., M.A.D., R.C., G.W., P.H.S., H.B., O.K.-B., N.B. and R.R.; Supervision, G.Y.B., H.B. and P.W.R.; Project administration, G.Y.B.; Funding acquisition, G.Y.B. All authors have read and agreed to the published version of the manuscript.

Funding

This research was internally supported and generated by Los Alamos National Laboratory as part of an MOU between the U.S. Department of Energy National Security Administration (NNSA) and the Israel Atomic Energy Commission (IAEC), Science Area V research program investigating nuclear waste disposal in Israel.

Acknowledgments

This research was supported by the NNSA/IAEC corporative agreement. The authors acknowledge the contribution of the two anonymous reviewers and the important technical discussions with scientists from IAEC, SNL, and LLNL that helped improve the quality of this manuscript. The authors thank Doug S. Ware and Oana Marina for some of the initial analytical work, Xu Hongwu for the quantitative analysis of the qXRD data, and George Perkins for the triplicate elemental mass spectrometry measurements for TOC and CTOT. We also acknowledge our SPO-CNP LANL Program Manager Paul Dixon for his support and commitment to this work. Los Alamos National Laboratory, an affirmative action/equal opportunity employer, is operated by Triad National Security, LLC, for the National Nuclear Security Administration of the U.S. Department of Energy (Contract No. CNA). By approving this article, the publisher recognizes that the U.S. Government retains nonexclusive, royalty-free license to publish or reproduce the published form of this contribution, or to allow others to do so, for U.S. Government purposes. Los Alamos National Laboratory requests that the publisher identify this article as work performed under the auspices of the U.S. Department of Energy. Los Alamos National Laboratory strongly supports academic freedom and a researcher’s right to publish; as an institution, however, the Laboratory does not endorse the viewpoint of a publication or guarantee its technical correctness.

Conflicts of Interest

The authors declare no conflict of interest. The funders had no role in the design of the study; in the collection, analyses, or interpretation of data; in the writing of the manuscript, or in the decision to publish the results.

Appendix A

Figure A1. A geologic map of the Yamin Plain, northeastern Negev Desert, Israel. Boreholes (Y-5 through Y-16), seismic lines, and sample locations are indicated. Locations YP-6 and YP-7-10 refer to outcrop locations for samples CK-6 and SS-10, respectively. Sample location Z-2-5 (insert) refers to the location of the Zin Quarry to the south of the Yamin Plain where samples OS-3, and HOP-5 were collected. Geologic units are identified by color (insert).
Minerals 12 00728 g0a1
Figure A2. Sketch of an idealized columnar stratigraphic section of the Yamin Plain subsurface geology, NE Negev Desert, Israel. Based on core sample descriptions and cuttings from borehole YP-16 (c.f., Figure A1). Samples studied are Campanian (Mishash Fm.) to Miocene (Hazeva Group) in age. Modified from Bussod et al. [1].
Minerals 12 00728 g0a2
Figure A3. Distribution of uranium species, as a function of pH for the synthetic surface water (SSW) solution used in the batch sorption experiments.
Minerals 12 00728 g0a3

Appendix B

Sample Preparation and Methodology for XRF, qXRD, BET, and TOC

Representative rock sections from the HOP-5, CK-6, OS-3, and SS-10 samples were broken up using an Enerpac hydraulic press. The crushed rocks were then sieved into the following four size fractions using a RoTap sieve shaker: >2 mm, 500 µm to 2 mm, 75 µm to 500 µm, and <75 µm. To remove fine particles stuck to the larger particles, all the size fractions were further “wet sieved”. The synthesized surface water (SSW) composition is based on the aqueous chemistry of representative shallow well samples in the Negev Desert. The SSW solution was poured through the >2 mm sample powder size fractions until the water ran clear. The collected water was then sieved sequentially through 500 µm to 2 mm, and 75 µm to 500 µm sieves, and the fine fraction retained was then collected and added to the respective size fractions of the dry sieved samples. The remaining water was allowed to settle gravitationally for 24 h, after adding and mixing the dry sieved <75 µm fraction. After 24 h, the water was decanted and the remaining settled fine fraction was dried and weighed. A subsample of the 75 µm to 500 µm and <75 µm size fractions was pulverized using a ball mill, to be used for subsequent TOC, qXRD, and XRF analyses.
Major elements were analyzed using the Rigaku Primus II wavelength-dispersive X-ray fluorescence (XRF) spectrometer. Samples were first crushed and homogenized in 5−10 g portions in a tungsten-carbide ball mill. Sample splits were heated to 110 °C for 4 h, and then allowed to equilibrate at ambient laboratory conditions for 12 h, to minimize weighing errors from atmospheric water gain. Fusion discs were prepared for analyses of the samples, by mixing 1.25 g splits with 8.75 g of lithium metaborate-tetraborate flux and heated in a muffle furnace for 45 min at 1050 °C, and again for 60 min at 1100 °C. Additional one-gram splits were heated at 1000 °C, to obtain the loss-on-ignition (LOI) measurements reported in Table 3 and used in the data reduction program.
Quantitative Powder X-ray diffraction (qXRD) was used for quantitative mineral phase identification using a Siemens D500 X-ray diffractometer. Samples were first crushed and homogenized in 5 g to 10 g portions in a tungsten-carbide ball mill. Sample splits were heated to 110 °C for 4 h, and then allowed to equilibrate at ambient laboratory conditions for 24 h, to minimize weighing errors associated with atmospheric water gain. To obtain the aliquots for the sample mounts, 1.3 g splits were mixed with 0.325 g of corundum (used as an internal standard) and then ground in acetone using a Brinkmann Grinder. Back-pack sample mounts were then made and scanned with the D500s for 8 or 12 h from 2 to 70 degrees (2θ).
Powdered rock samples (<75 µm size fraction) were run for total organic carbon (TOC) and total carbon (CTOT) by elemental analysis (EL-MS), using a GV Instruments Isoprime isotope ratio mass spectrometer coupled to GV Instruments Eurovector Elemental Analyzer. Samples were analyzed in triplicate, with the amount of carbon in each sample based on a calibration using organic carbon standards NIST 1547 and NBS 2704. Prior to analysis, TOC samples were acidified to remove carbonate following the method of Larson et al. [70]. Brunauer–Emmet–Teller (BET) analysis of total surface was conducted on the 500–2000 µm size fractions for HOP-5, OS-3, SS-10, and CK-6 using a Tristar II plus (Particle Testing Authority, Norcross, GA).

Appendix C

Appendix C.1. Methodology for Equilibration Batch Experiments

For the equilibration experiments, one gram of the 500 µm to 2000 µm size fractions of the four different rock types (HOP-5, CK-6, OS-3, and SS-10) were added to 20 mL of SSW in 40-mL glass vials, which were continuously stirred at 100 rpm on a rotary table and allowed to equilibrate for 24 h. Equilibrated aliquots were measured for pH and alkalinity and sampled for cations and anions, to determine solution composition changes, including phosphate (PO43−) and calcium (Ca2+) dissolution from the rocks. Cations and anions were determined via ICP-MS (Perkin-Elmer NexION 300S) and ion-chromatography, respectively, for all batch experiments. All alkalinity measurements were determined by a modified Hach method (#8203). The chemical composition of post-equilibration batch experiments is provided in Table 1.
In addition to the equilibration experiments, a series of batch experiments were performed to investigate the buffering capacity of the rock types for different pH values. Two grams of rock (for each of the four rock types) were exposed to 20 mL of SSW with different pH values. The SSW were adjusted dropwise with either 0.04 M HCl or 0.1 M NaOH solutions to produce final pH values of 5.5, 6, 7, 9, and 10, before they were added to the rock samples. Equilibration experiments at different pH showed a very high buffering capacity of the sediments, bringing the pH to 7.8–8.3 within a day, even for an initial solution of pH < 6. Initial pH values equilibrated quickly (within 24 h) to ~7.6–8.3, due to the dissolution of calcite, while pH values above 9 stabilized to pH values between 8 and 9, due to CO2 equilibration with the atmosphere and calcite precipitation (a significant loss of solution Ca2+ was noted at pH > 9).

Appendix C.2. Methodology for Kinetic Batch Sorption Studies

One gram of the powdered HOP-5 rock sample (500–2000 µm size fraction) was added to 20 mL of synthetic surface water (SSW) in 40-mL glass vials, continuously stirred at 100 rpm on a rotary table and allowed to equilibrate for 24 h. After equilibration, 0.4 mL of a 1000 ppm U(VI) stock solution was added to the batch experiments (run in duplicates) producing a final [U] concentration of 20 ppm. Aliquots of 0.1 mL were taken at 15-min intervals for the first 60 min, then sampling continued hourly for another 4 h (total runtime of 5 h). The rock specimens were allowed to equilibrate an additional 3–8 days prior to the collection of the last sample point, to ensure that uranium concentrations reached equilibrium. Vials were continuously inverted on a Vari Mix shaker.
In addition to short-term kinetic experiments, a nine-month sorption study was conducted, to determine if any long-term uptake mechanisms such as uranium precipitation or intergranular diffusion were present, but not captured, in the kinetic studies. For the CK-6, OS-3, and SS-10 samples, 0.2 g of rock were added to 20 mL of SSW with 0.5 ppm uranium, while 0.1 g of the HOP-5 samples were exposed to 20 mL of SSW with 1 ppm of uranium added. The batch experiments were sampled after 15, 21, 29, 63, and 267 days, to measure uranium concentrations. Six replicates were performed for each rock type, and all vials were shaken on a rotary shaker at 100 rpm.

Appendix D

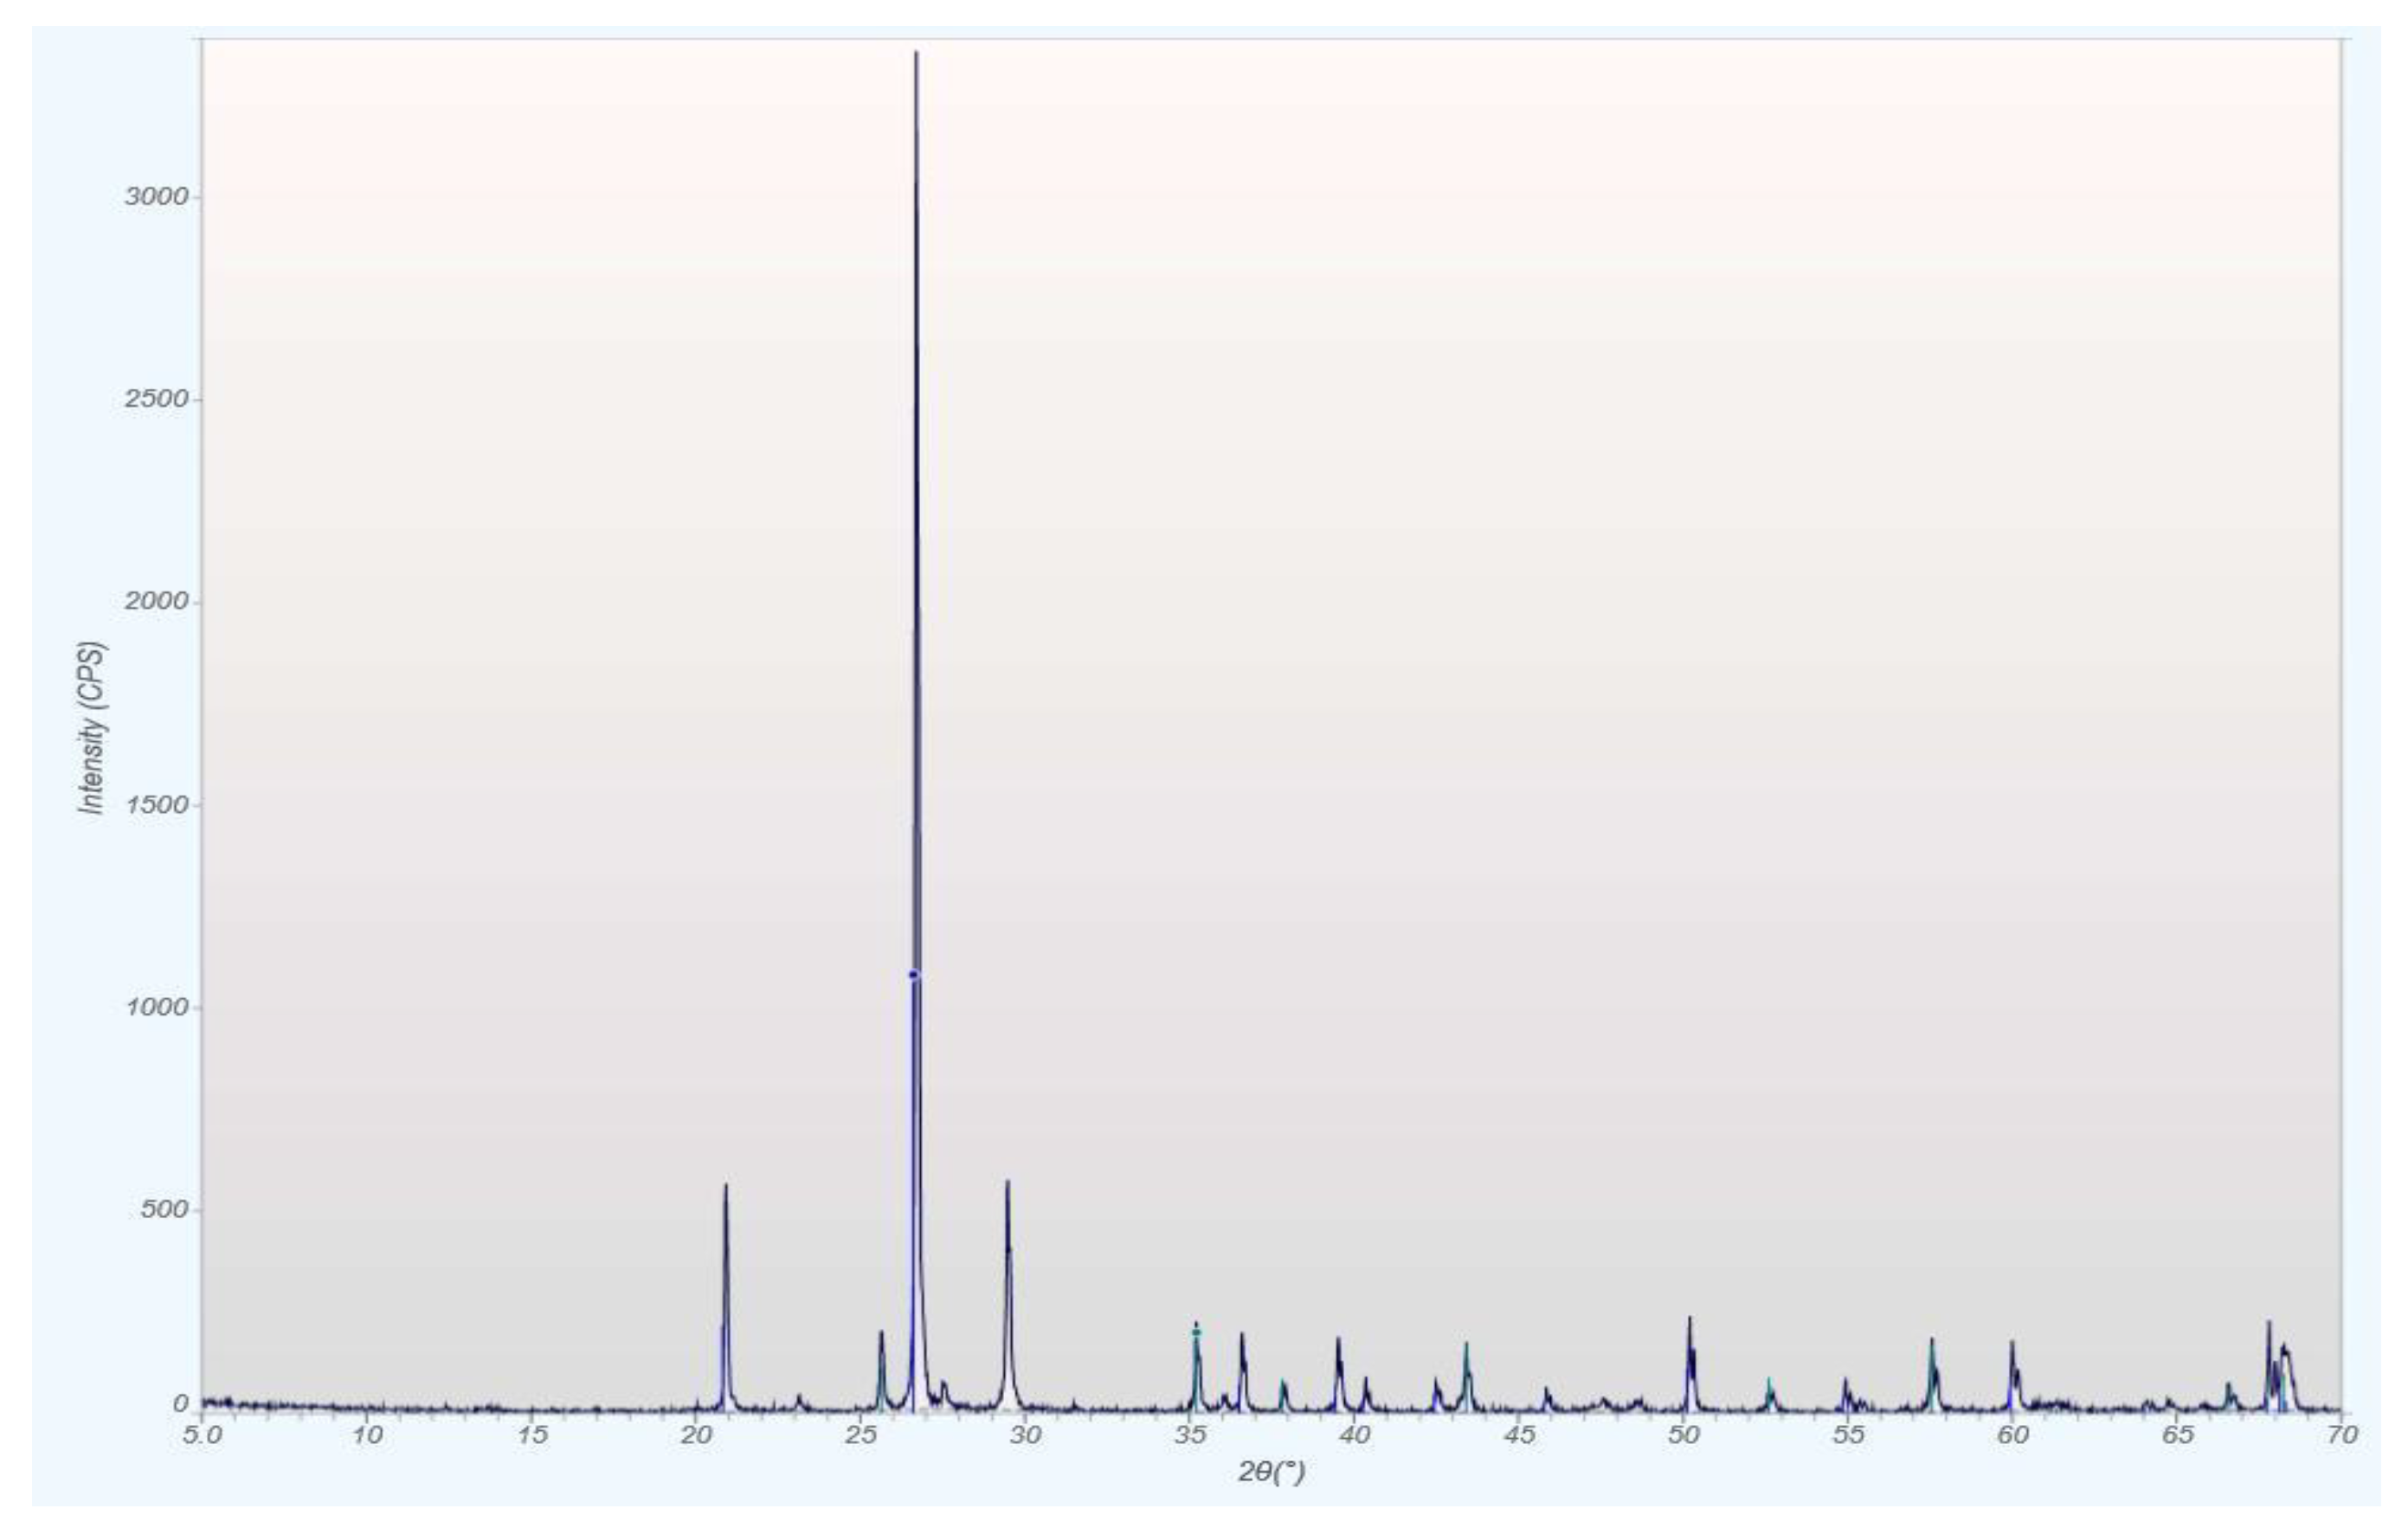
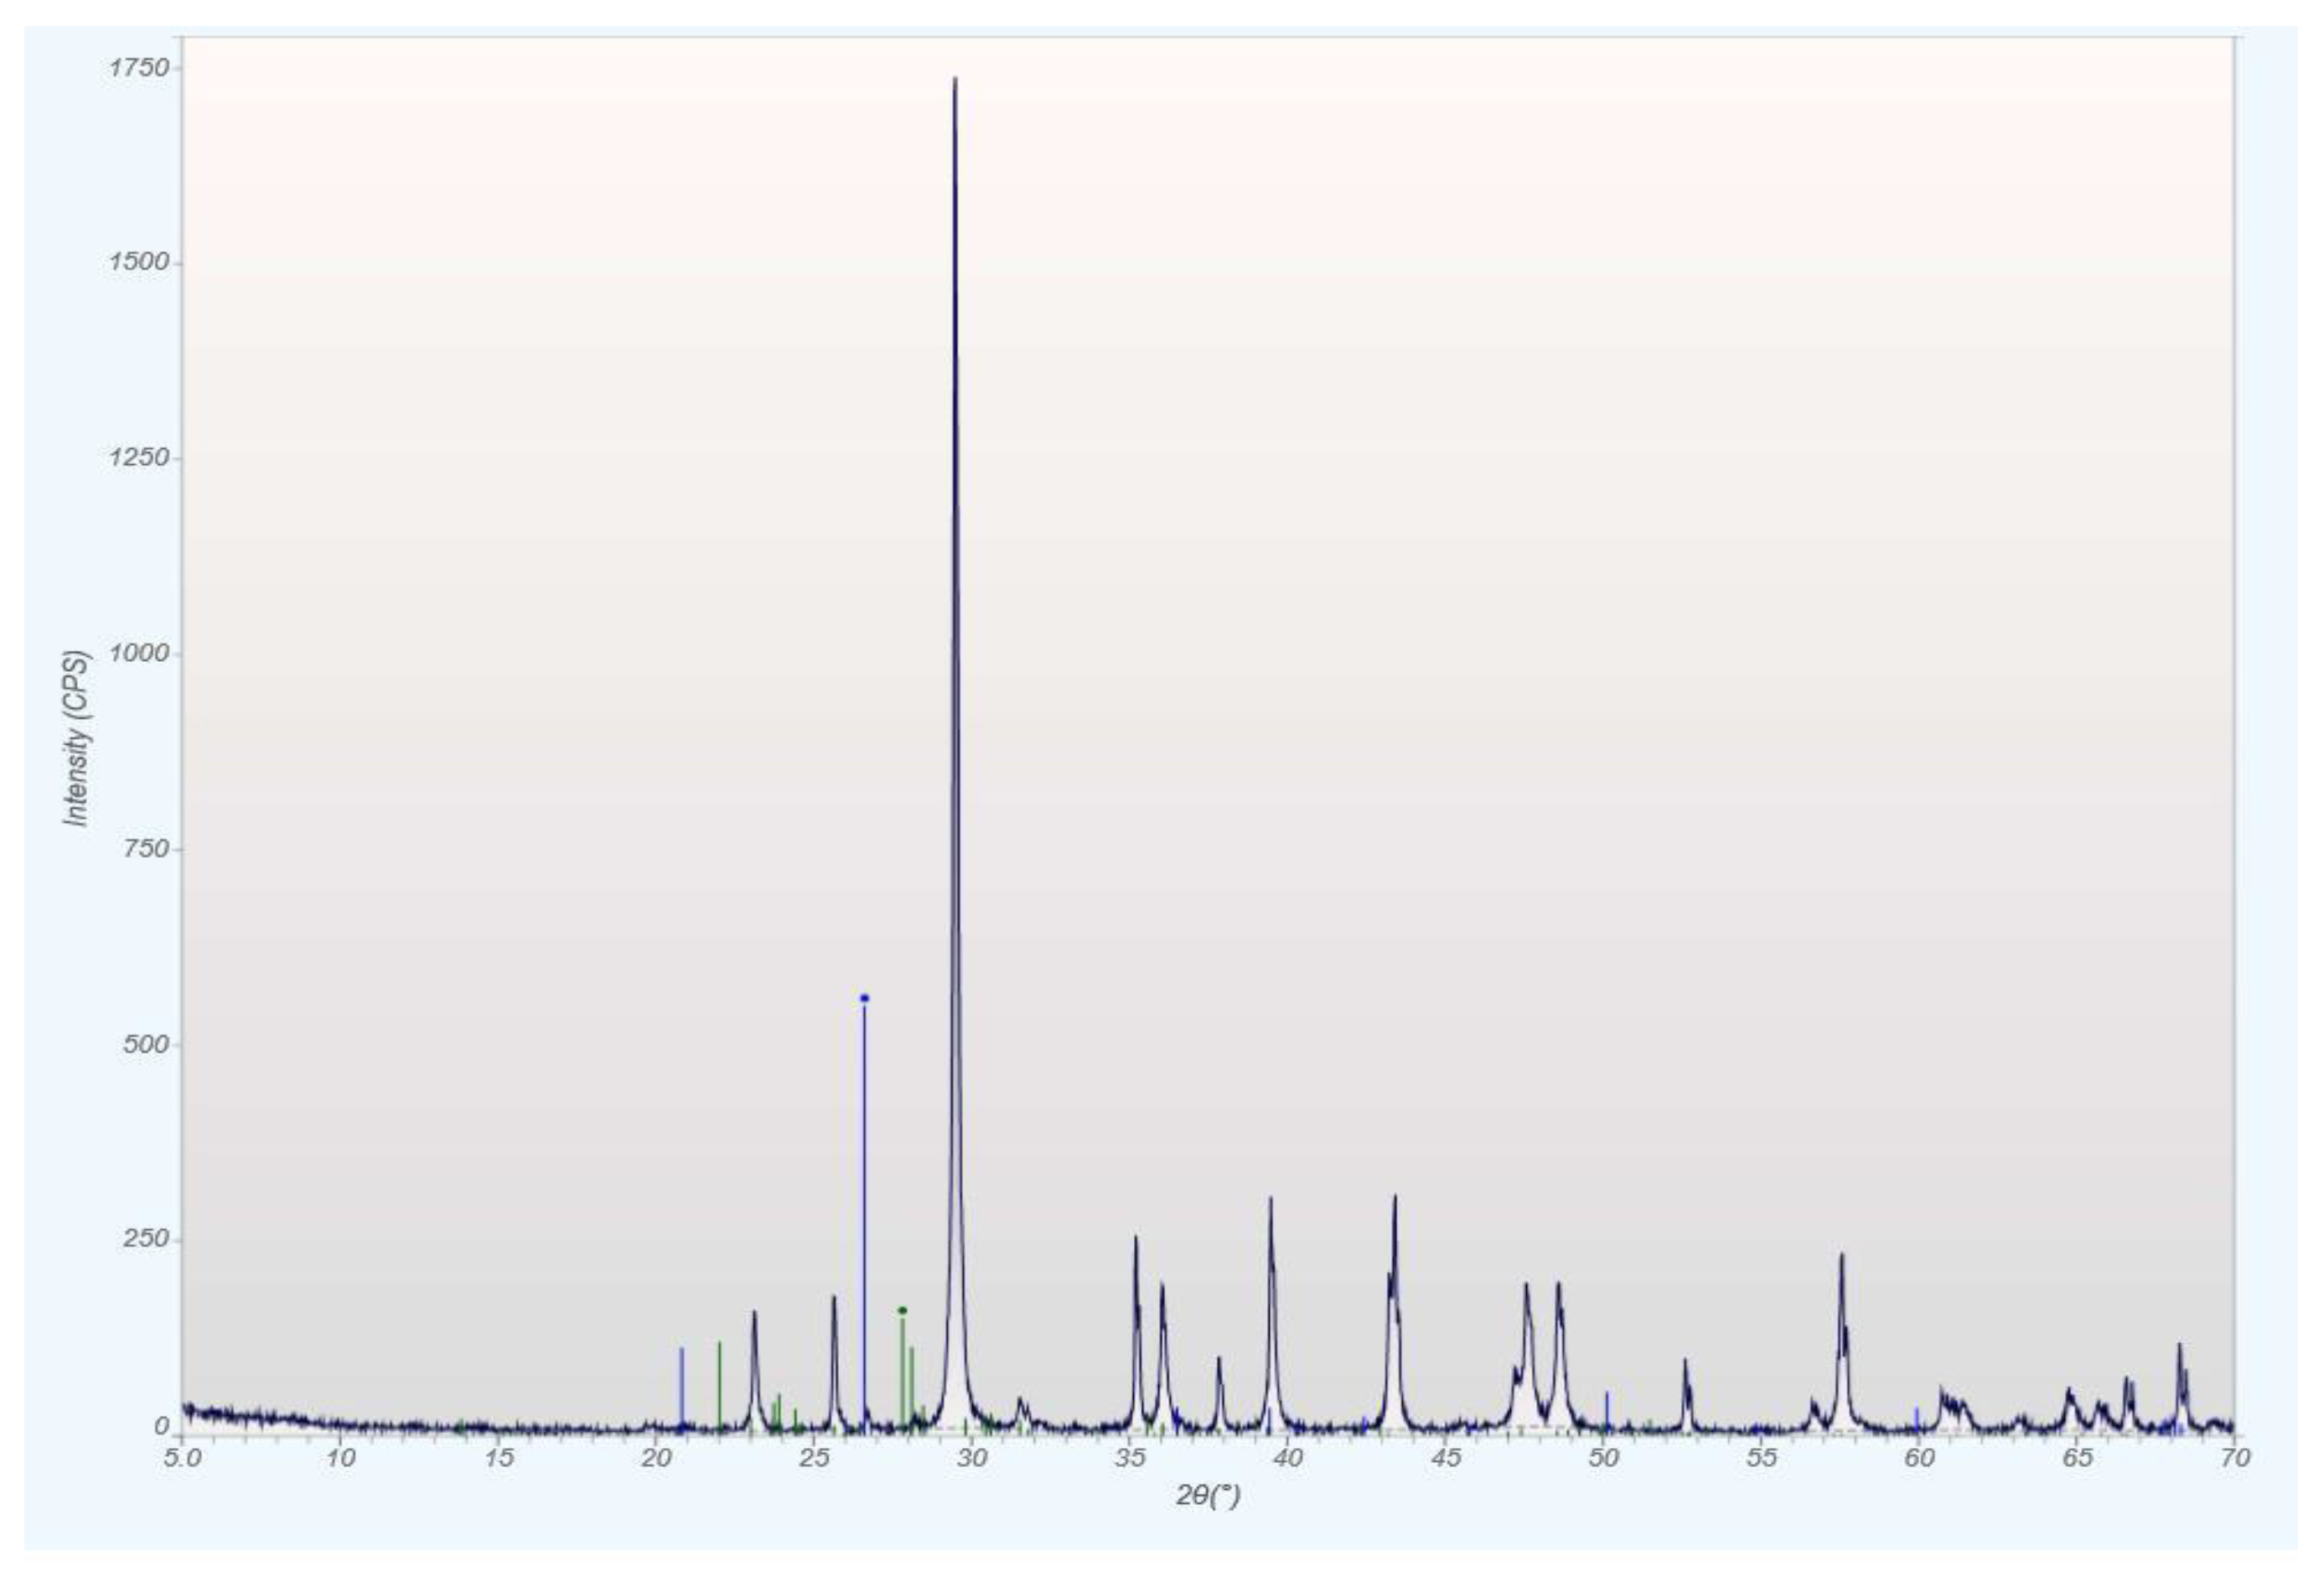
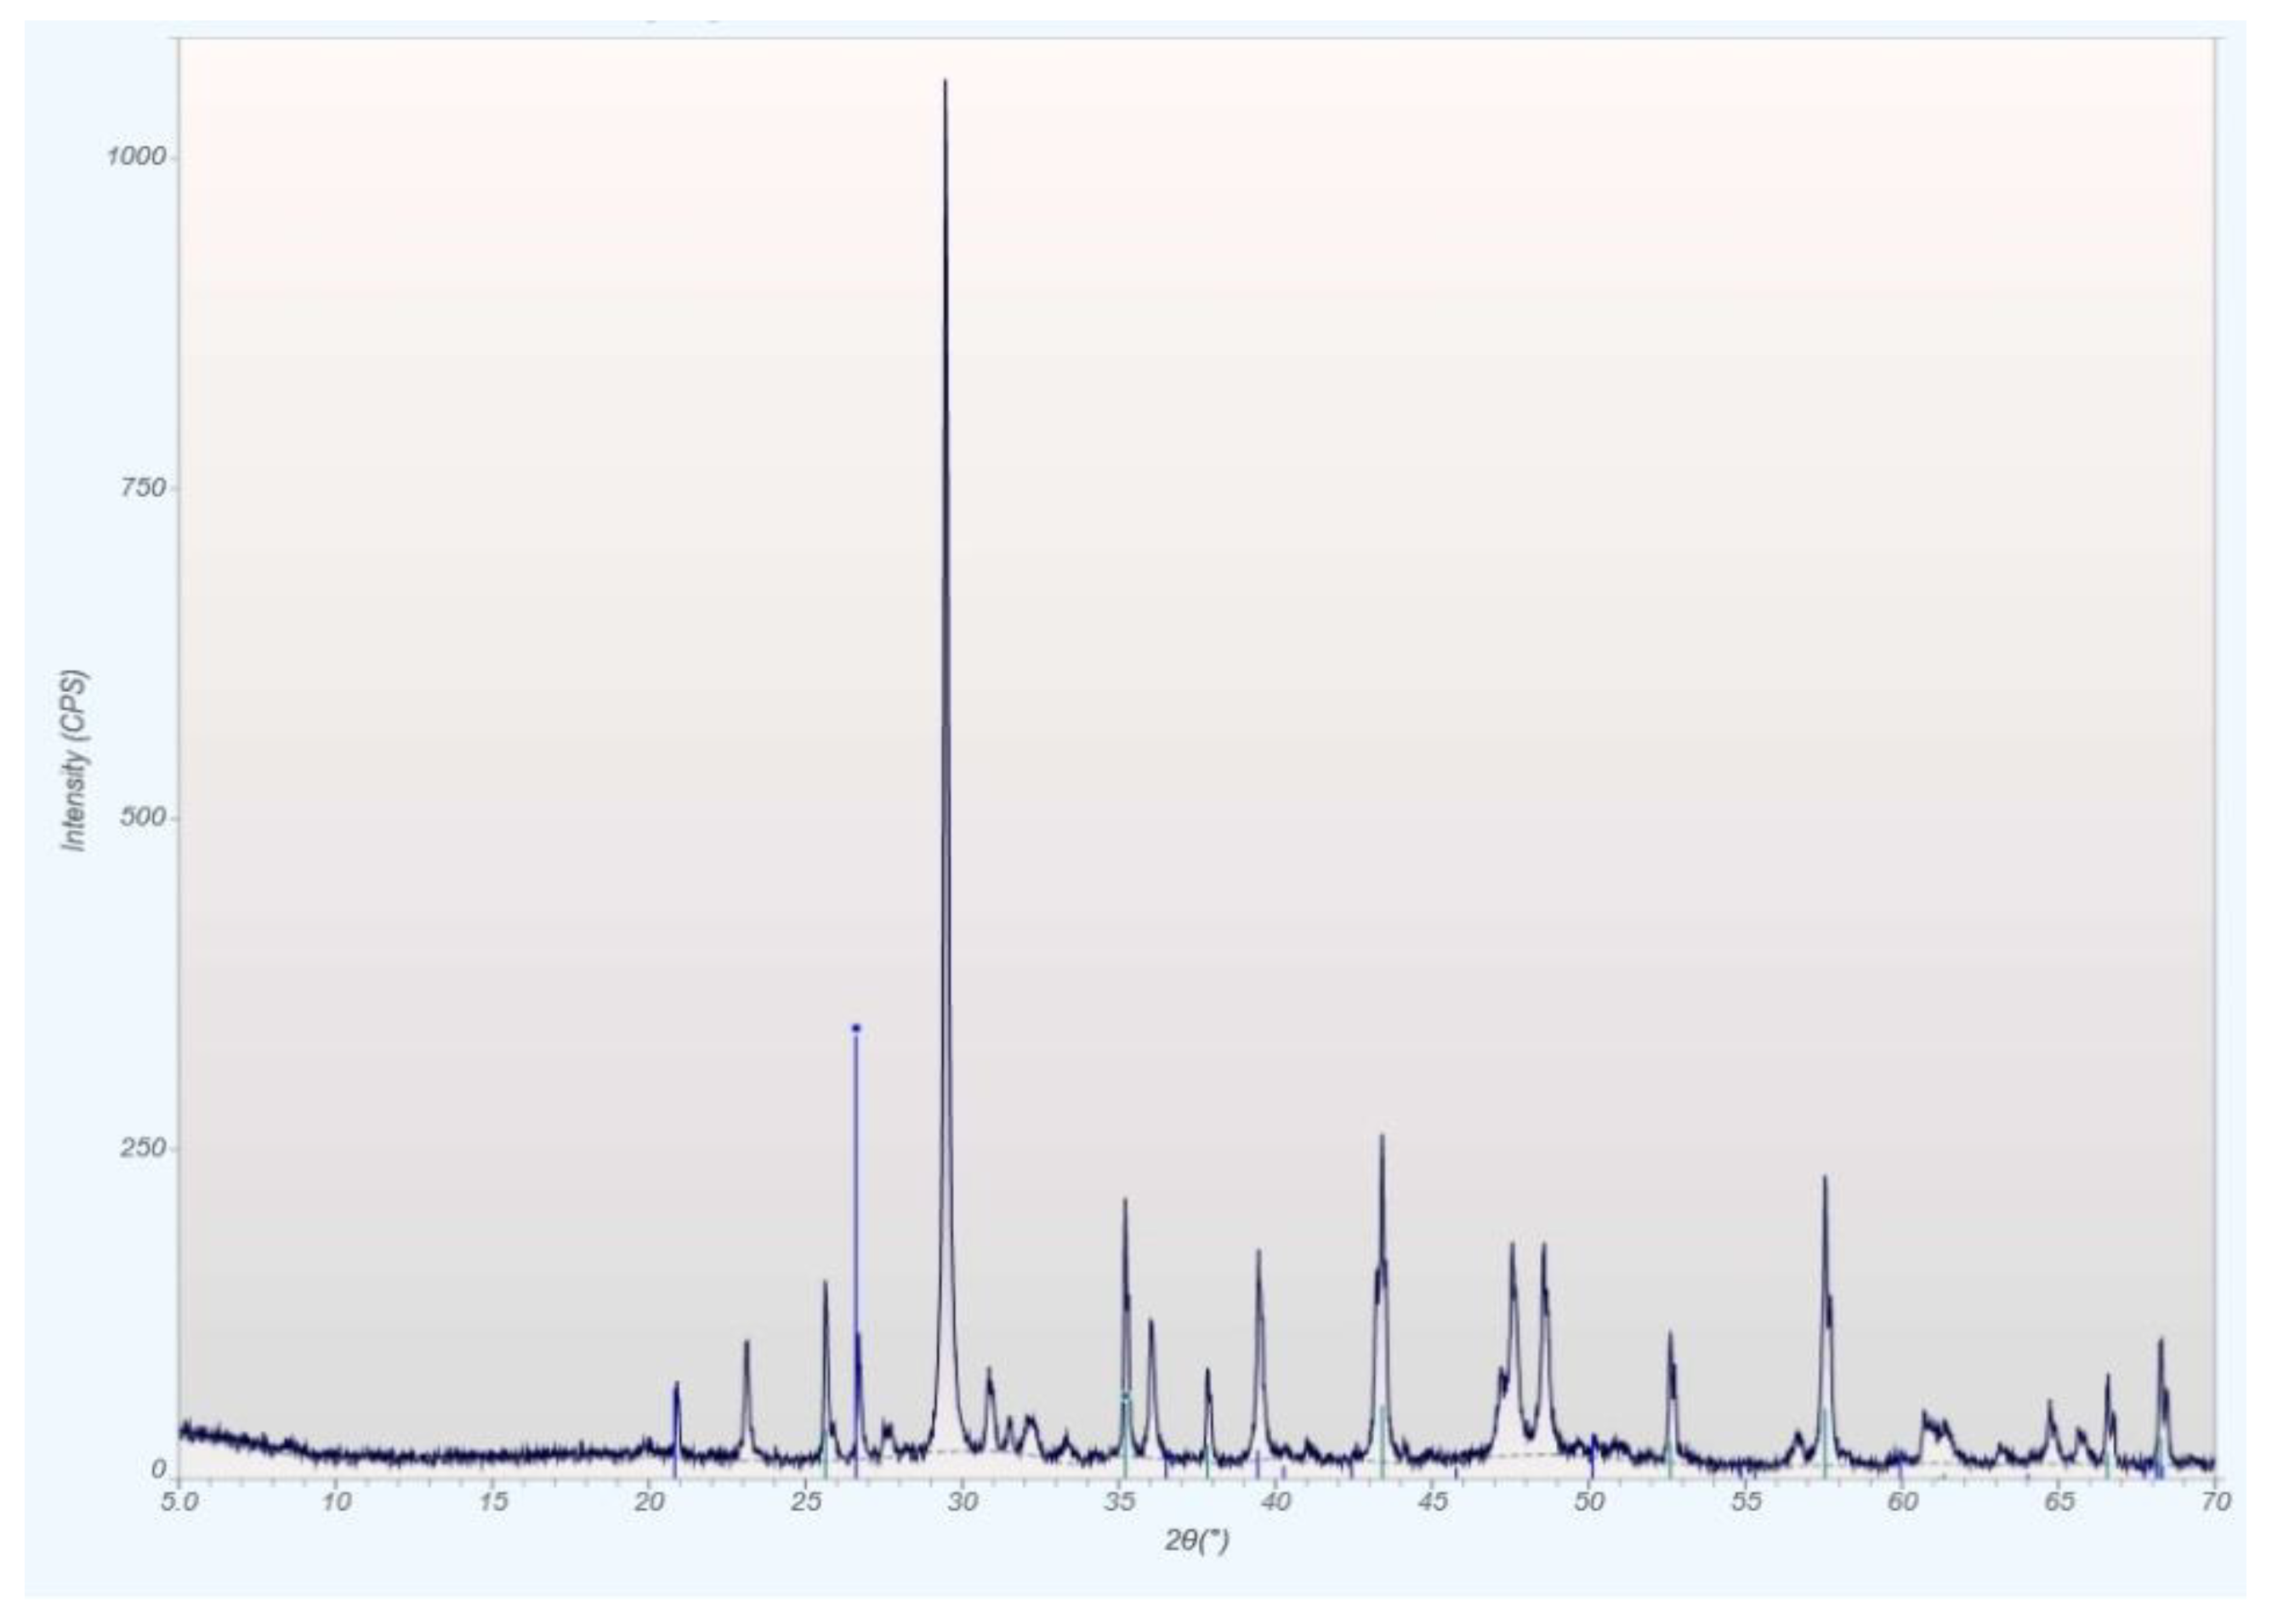
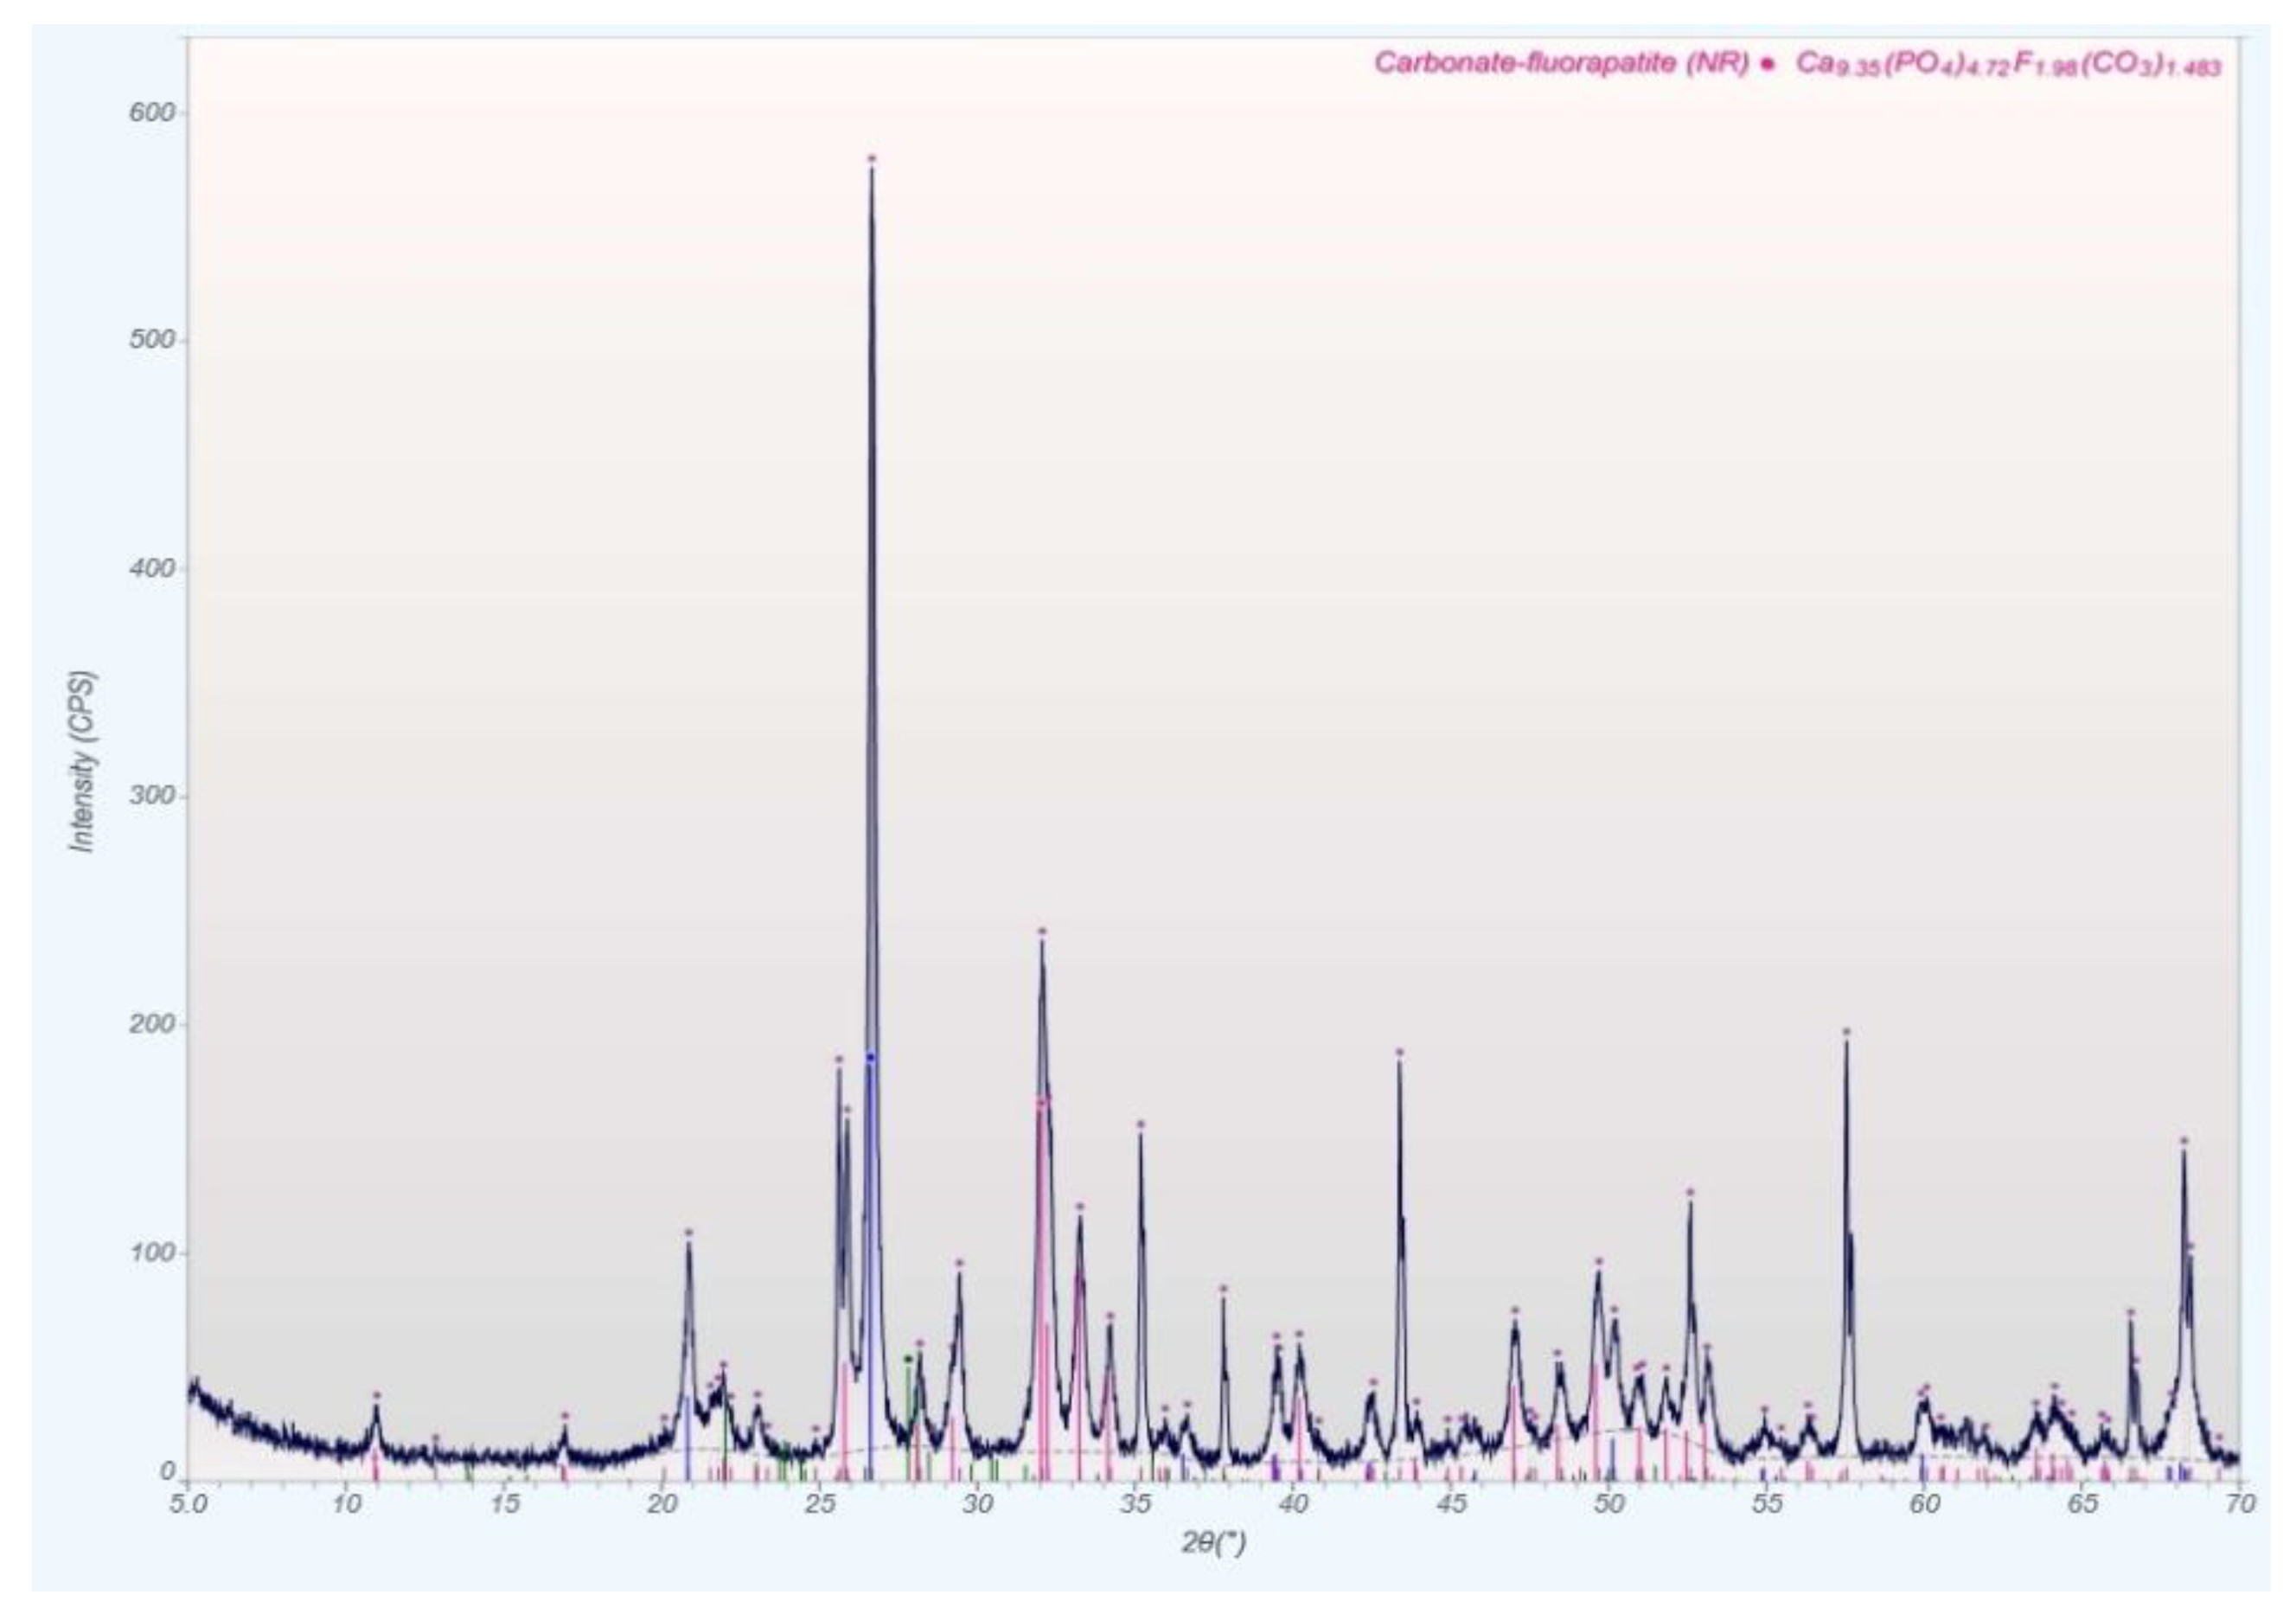
qXRD Diffractograms of the Four Different Rock Types

Figure A4. qXRD spectra for the sandstone sample SS-10.
Minerals 12 00728 g0a4
Figure A5. qXRD spectra for the oolitic chalk sample CK-6.
Minerals 12 00728 g0a5
Figure A6. qXRD spectra for the bituminous limestone marl sample OS-3.
Minerals 12 00728 g0a6
Figure A7. qXRD spectra for the organic-rich phosphorite sample HOP-5.
Minerals 12 00728 g0a7

Appendix E

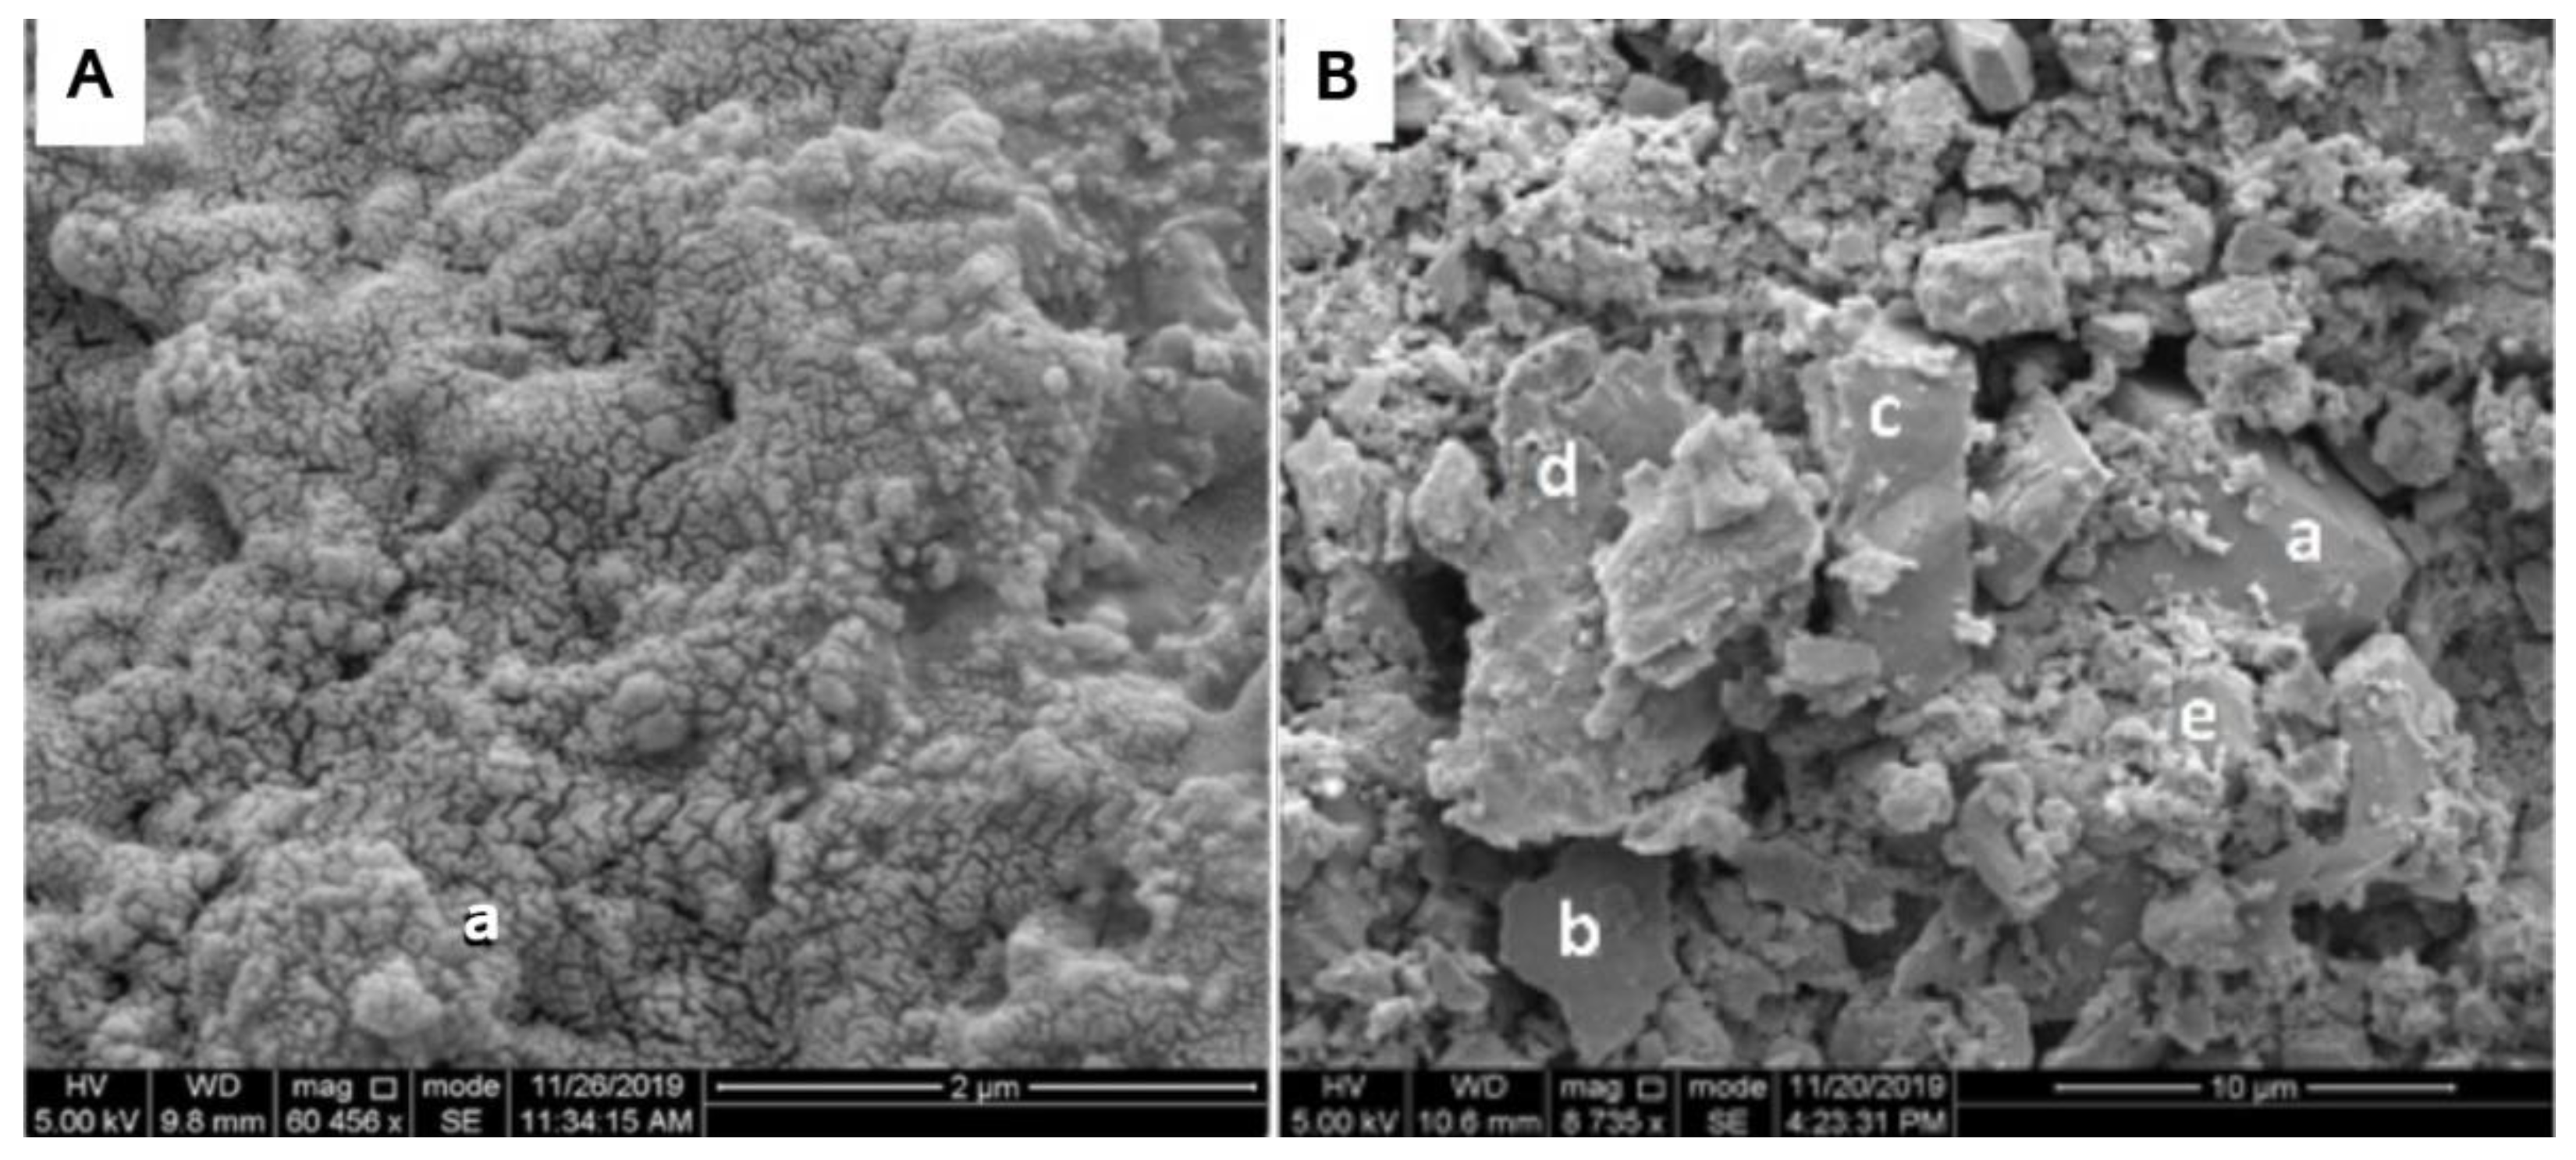
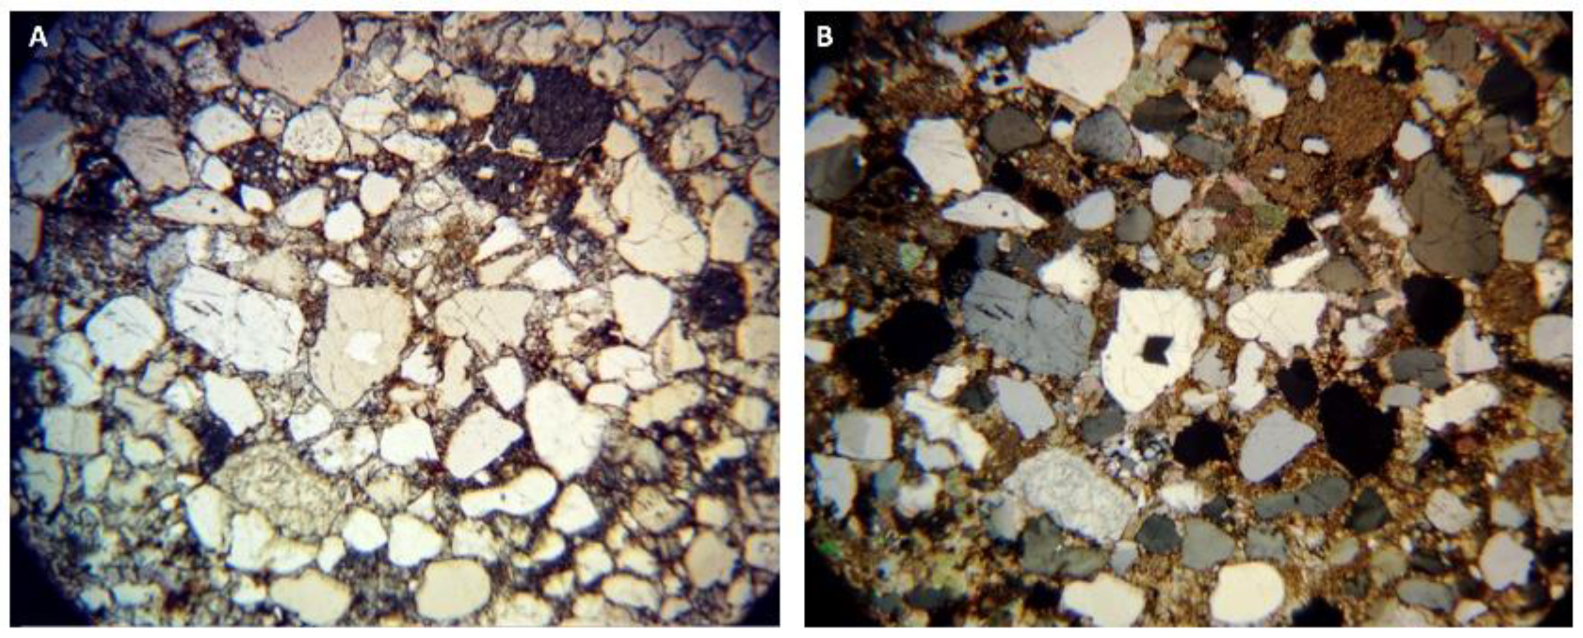
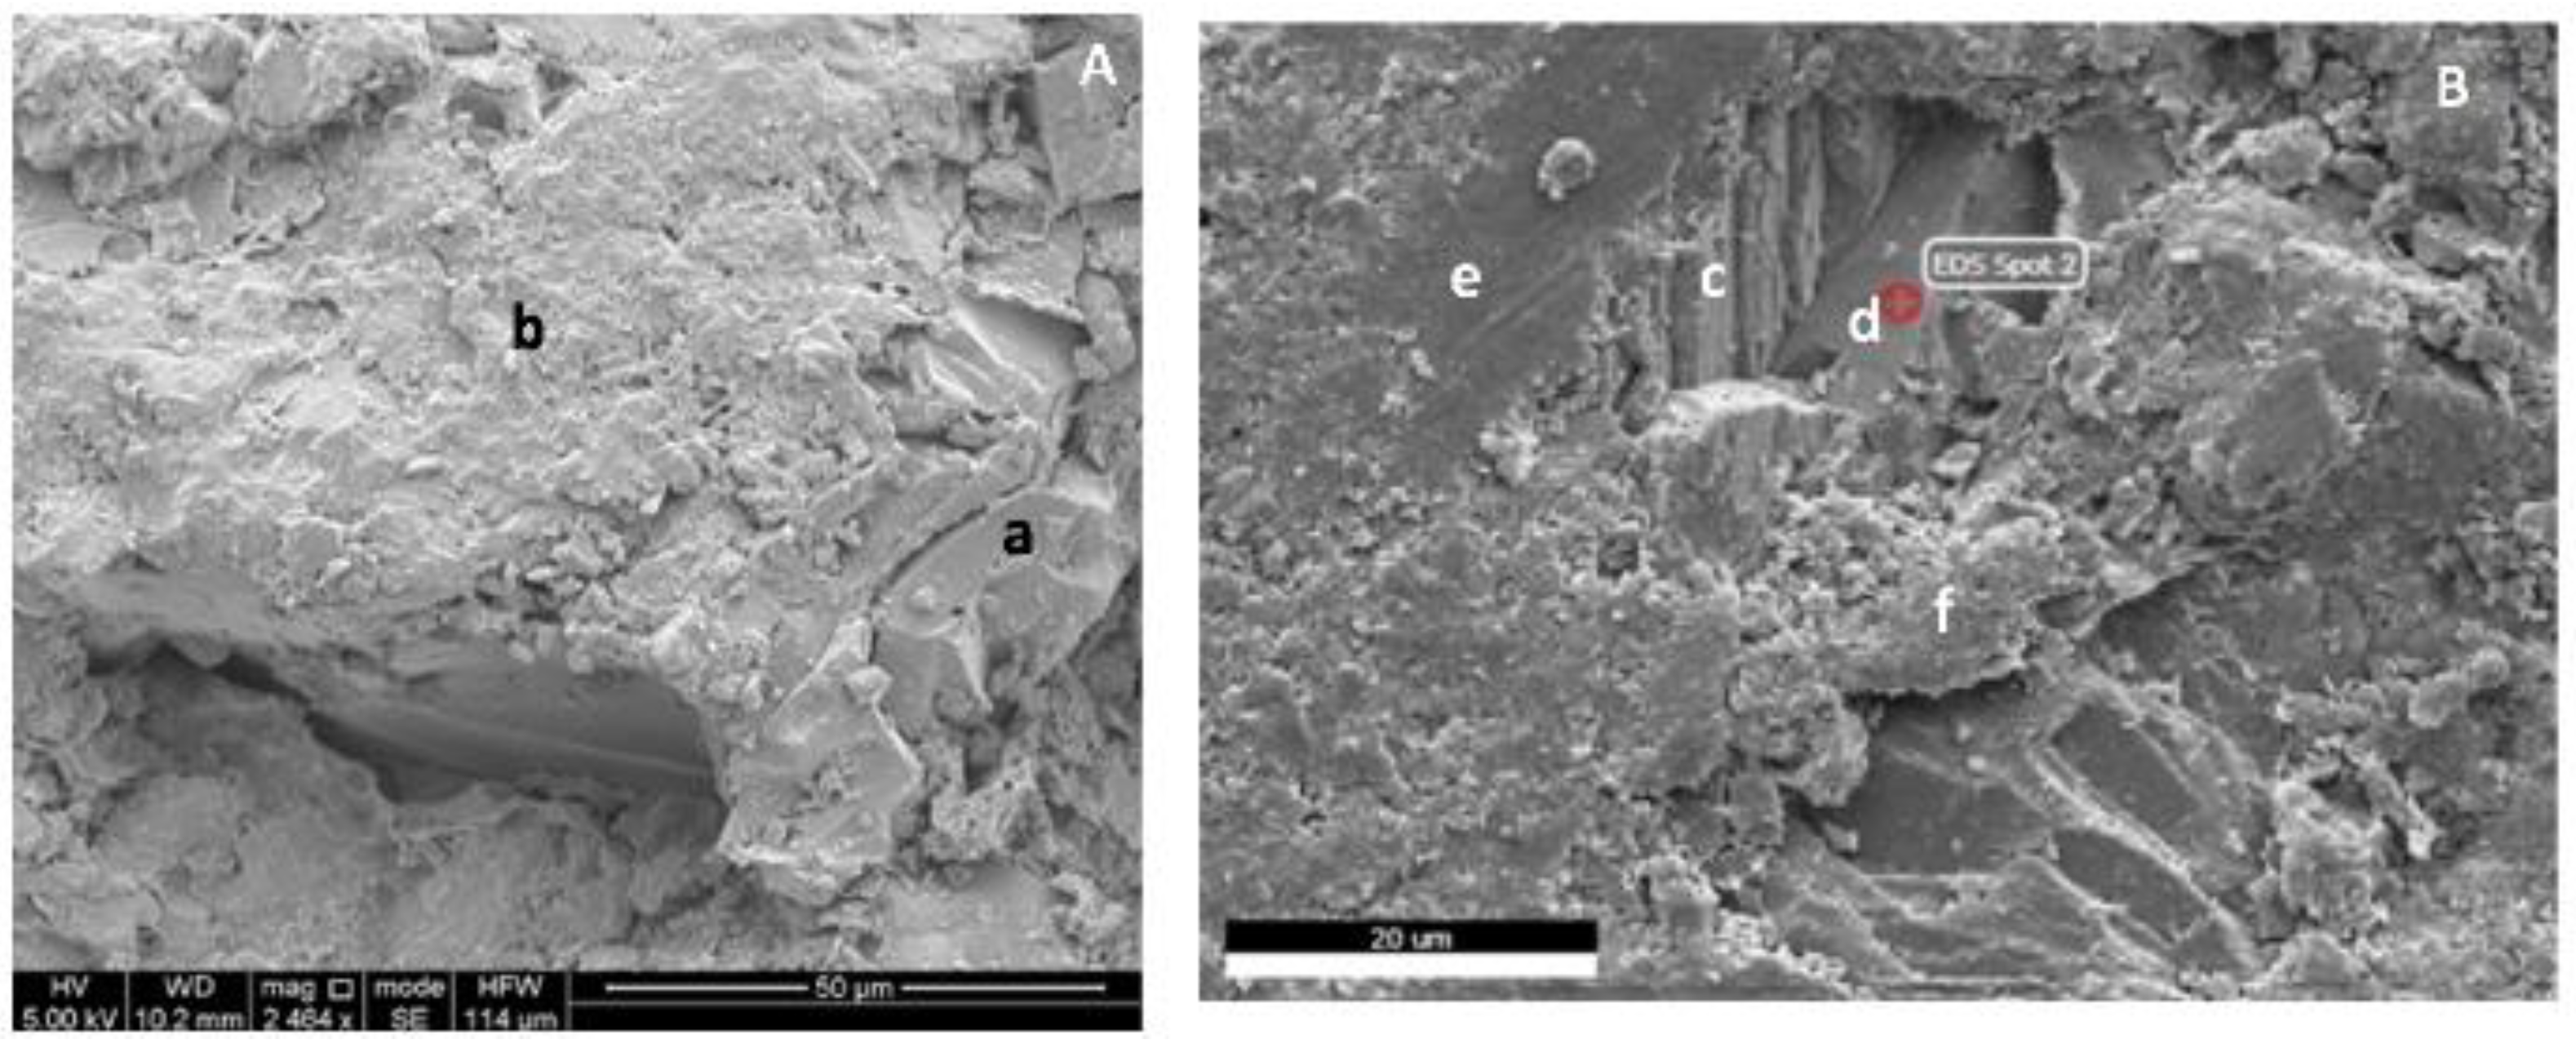
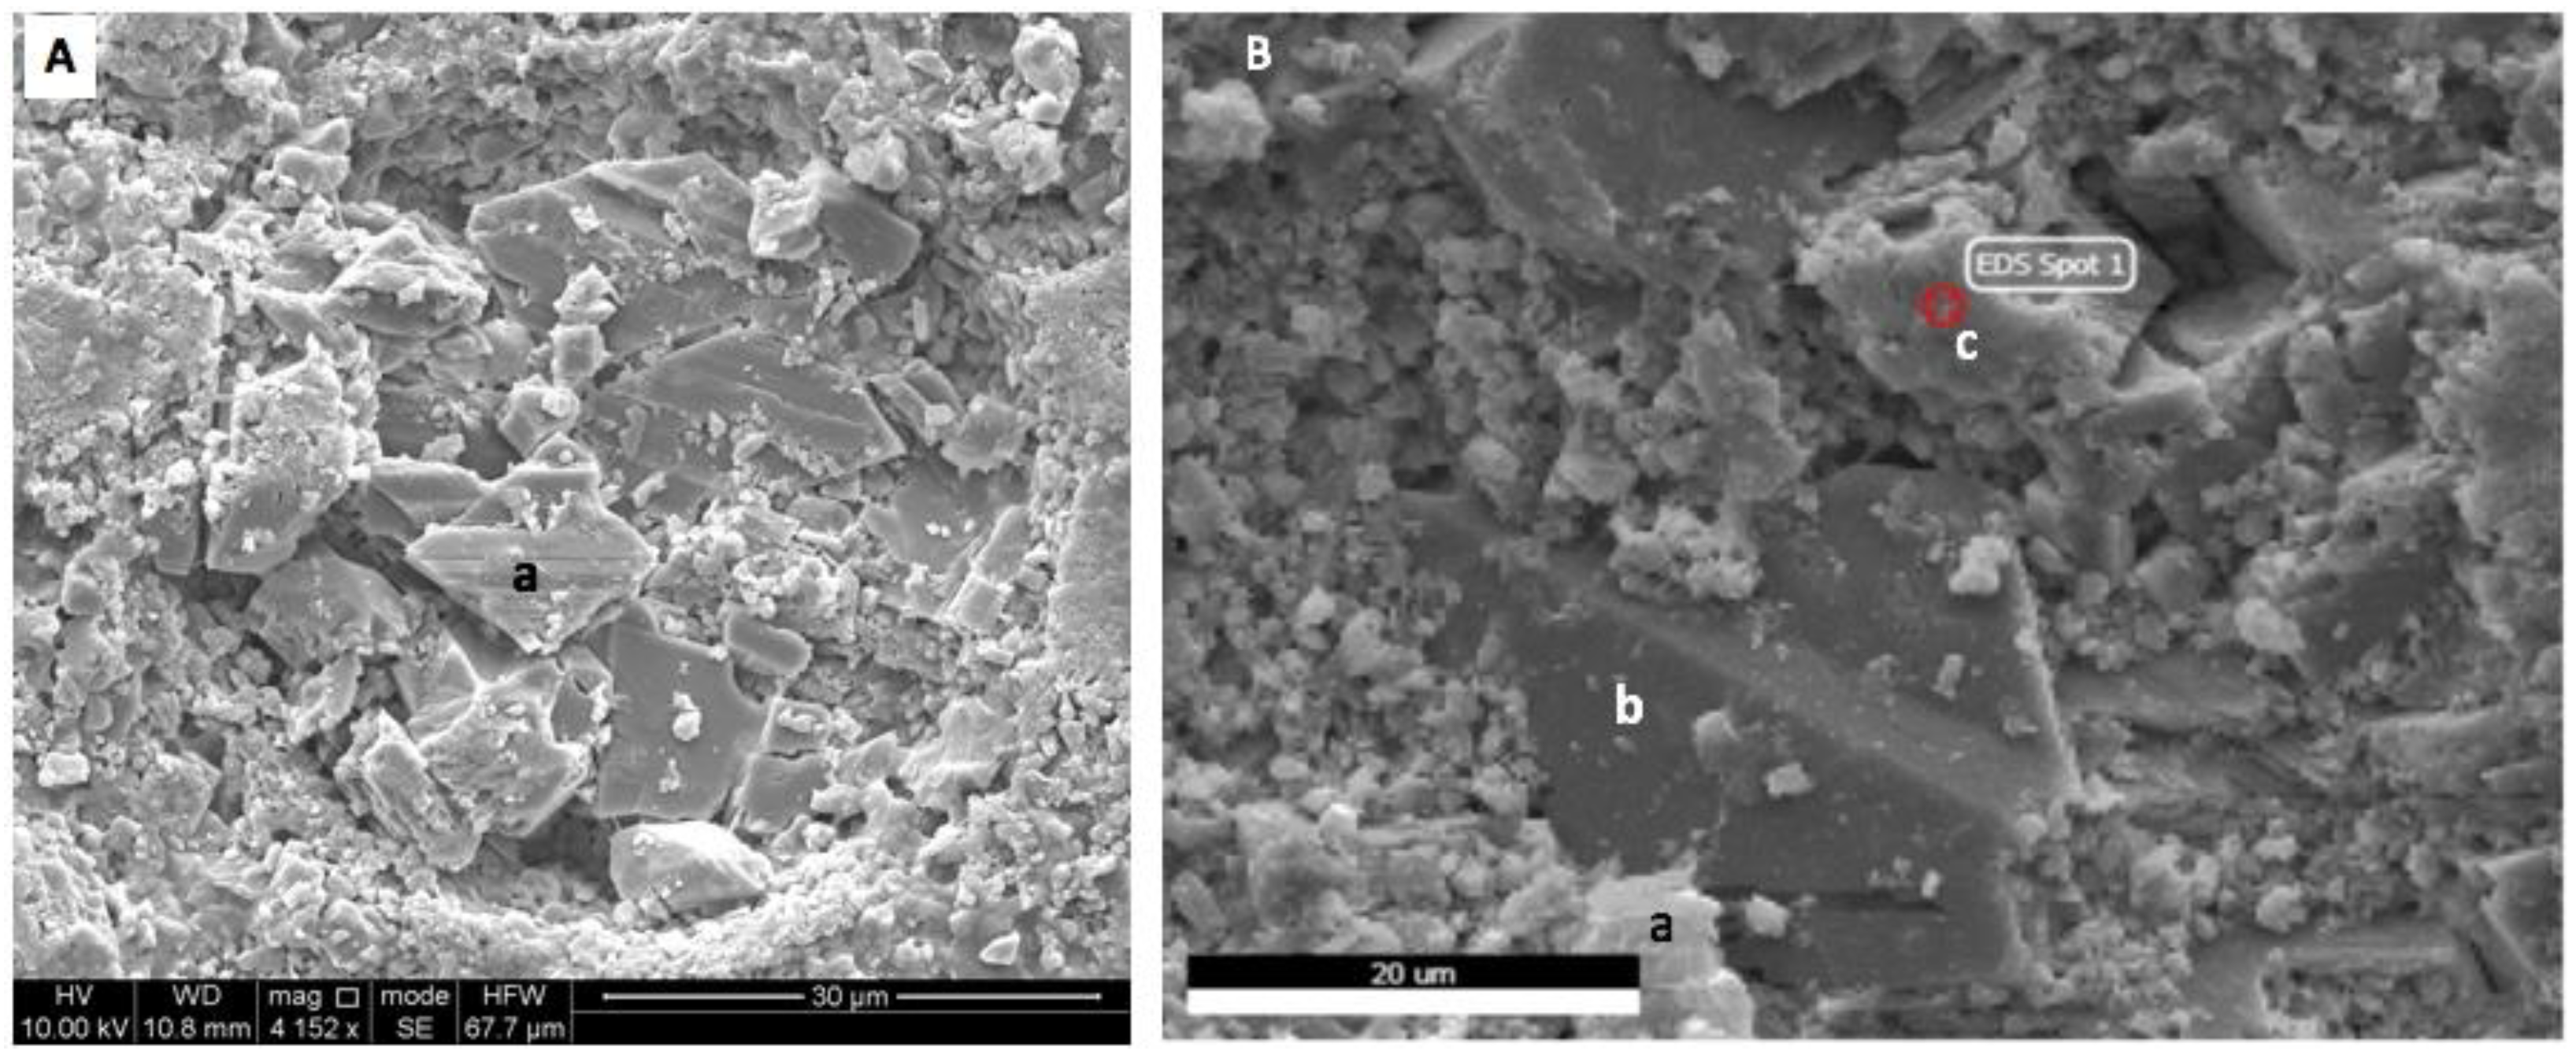
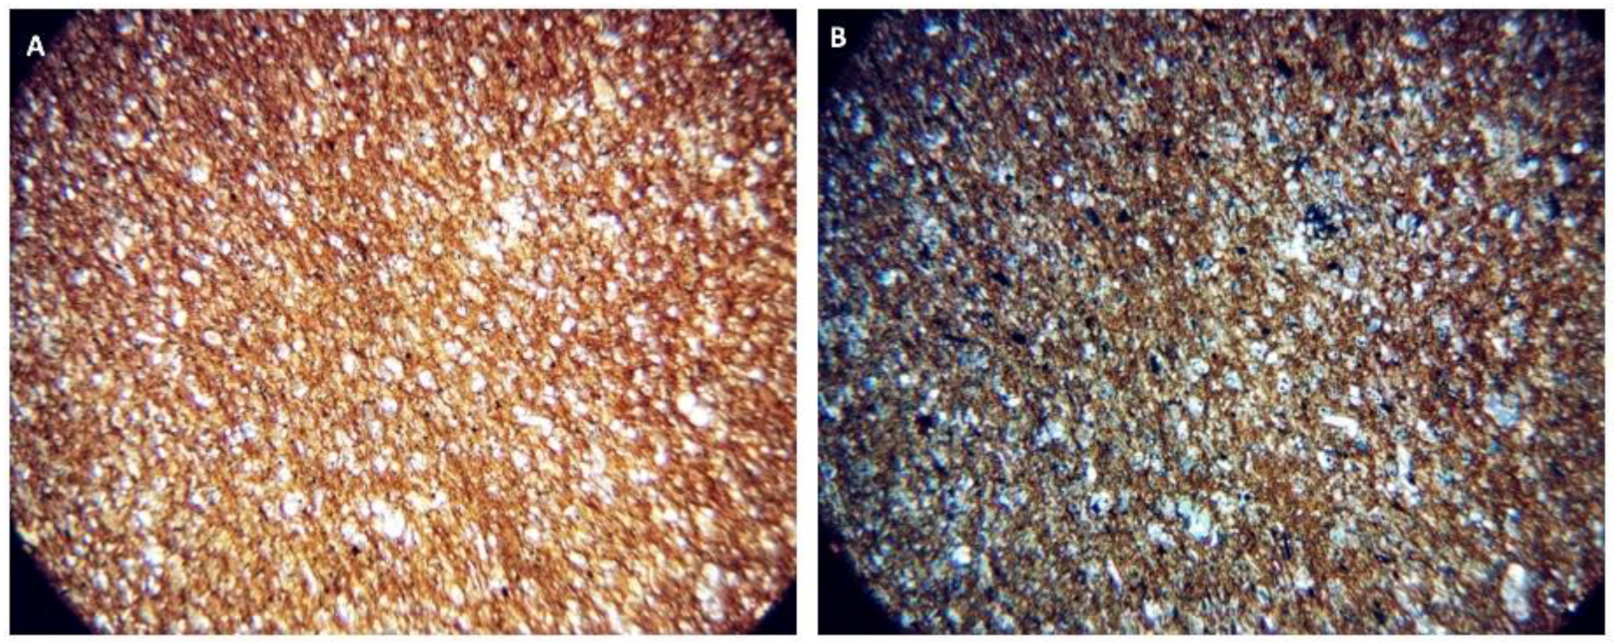
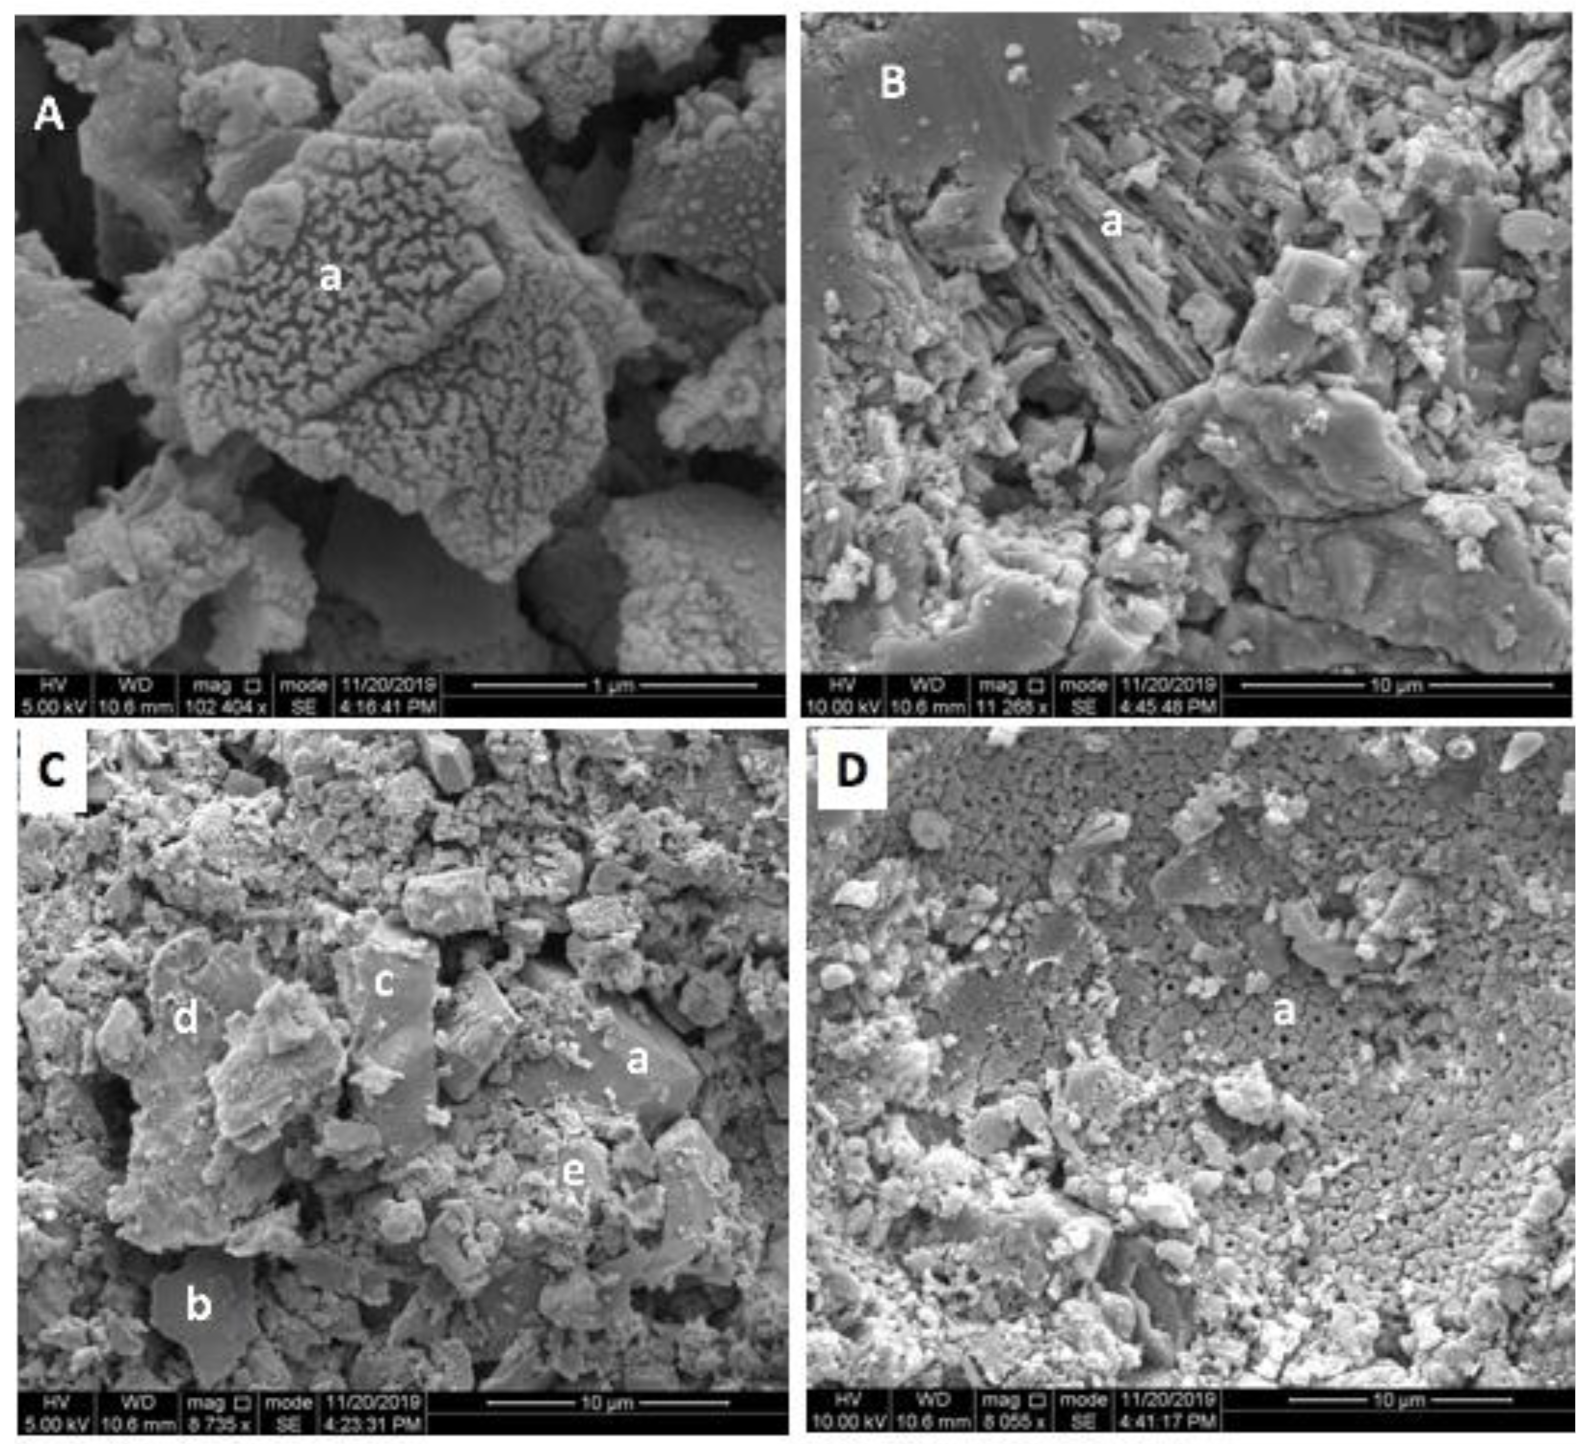
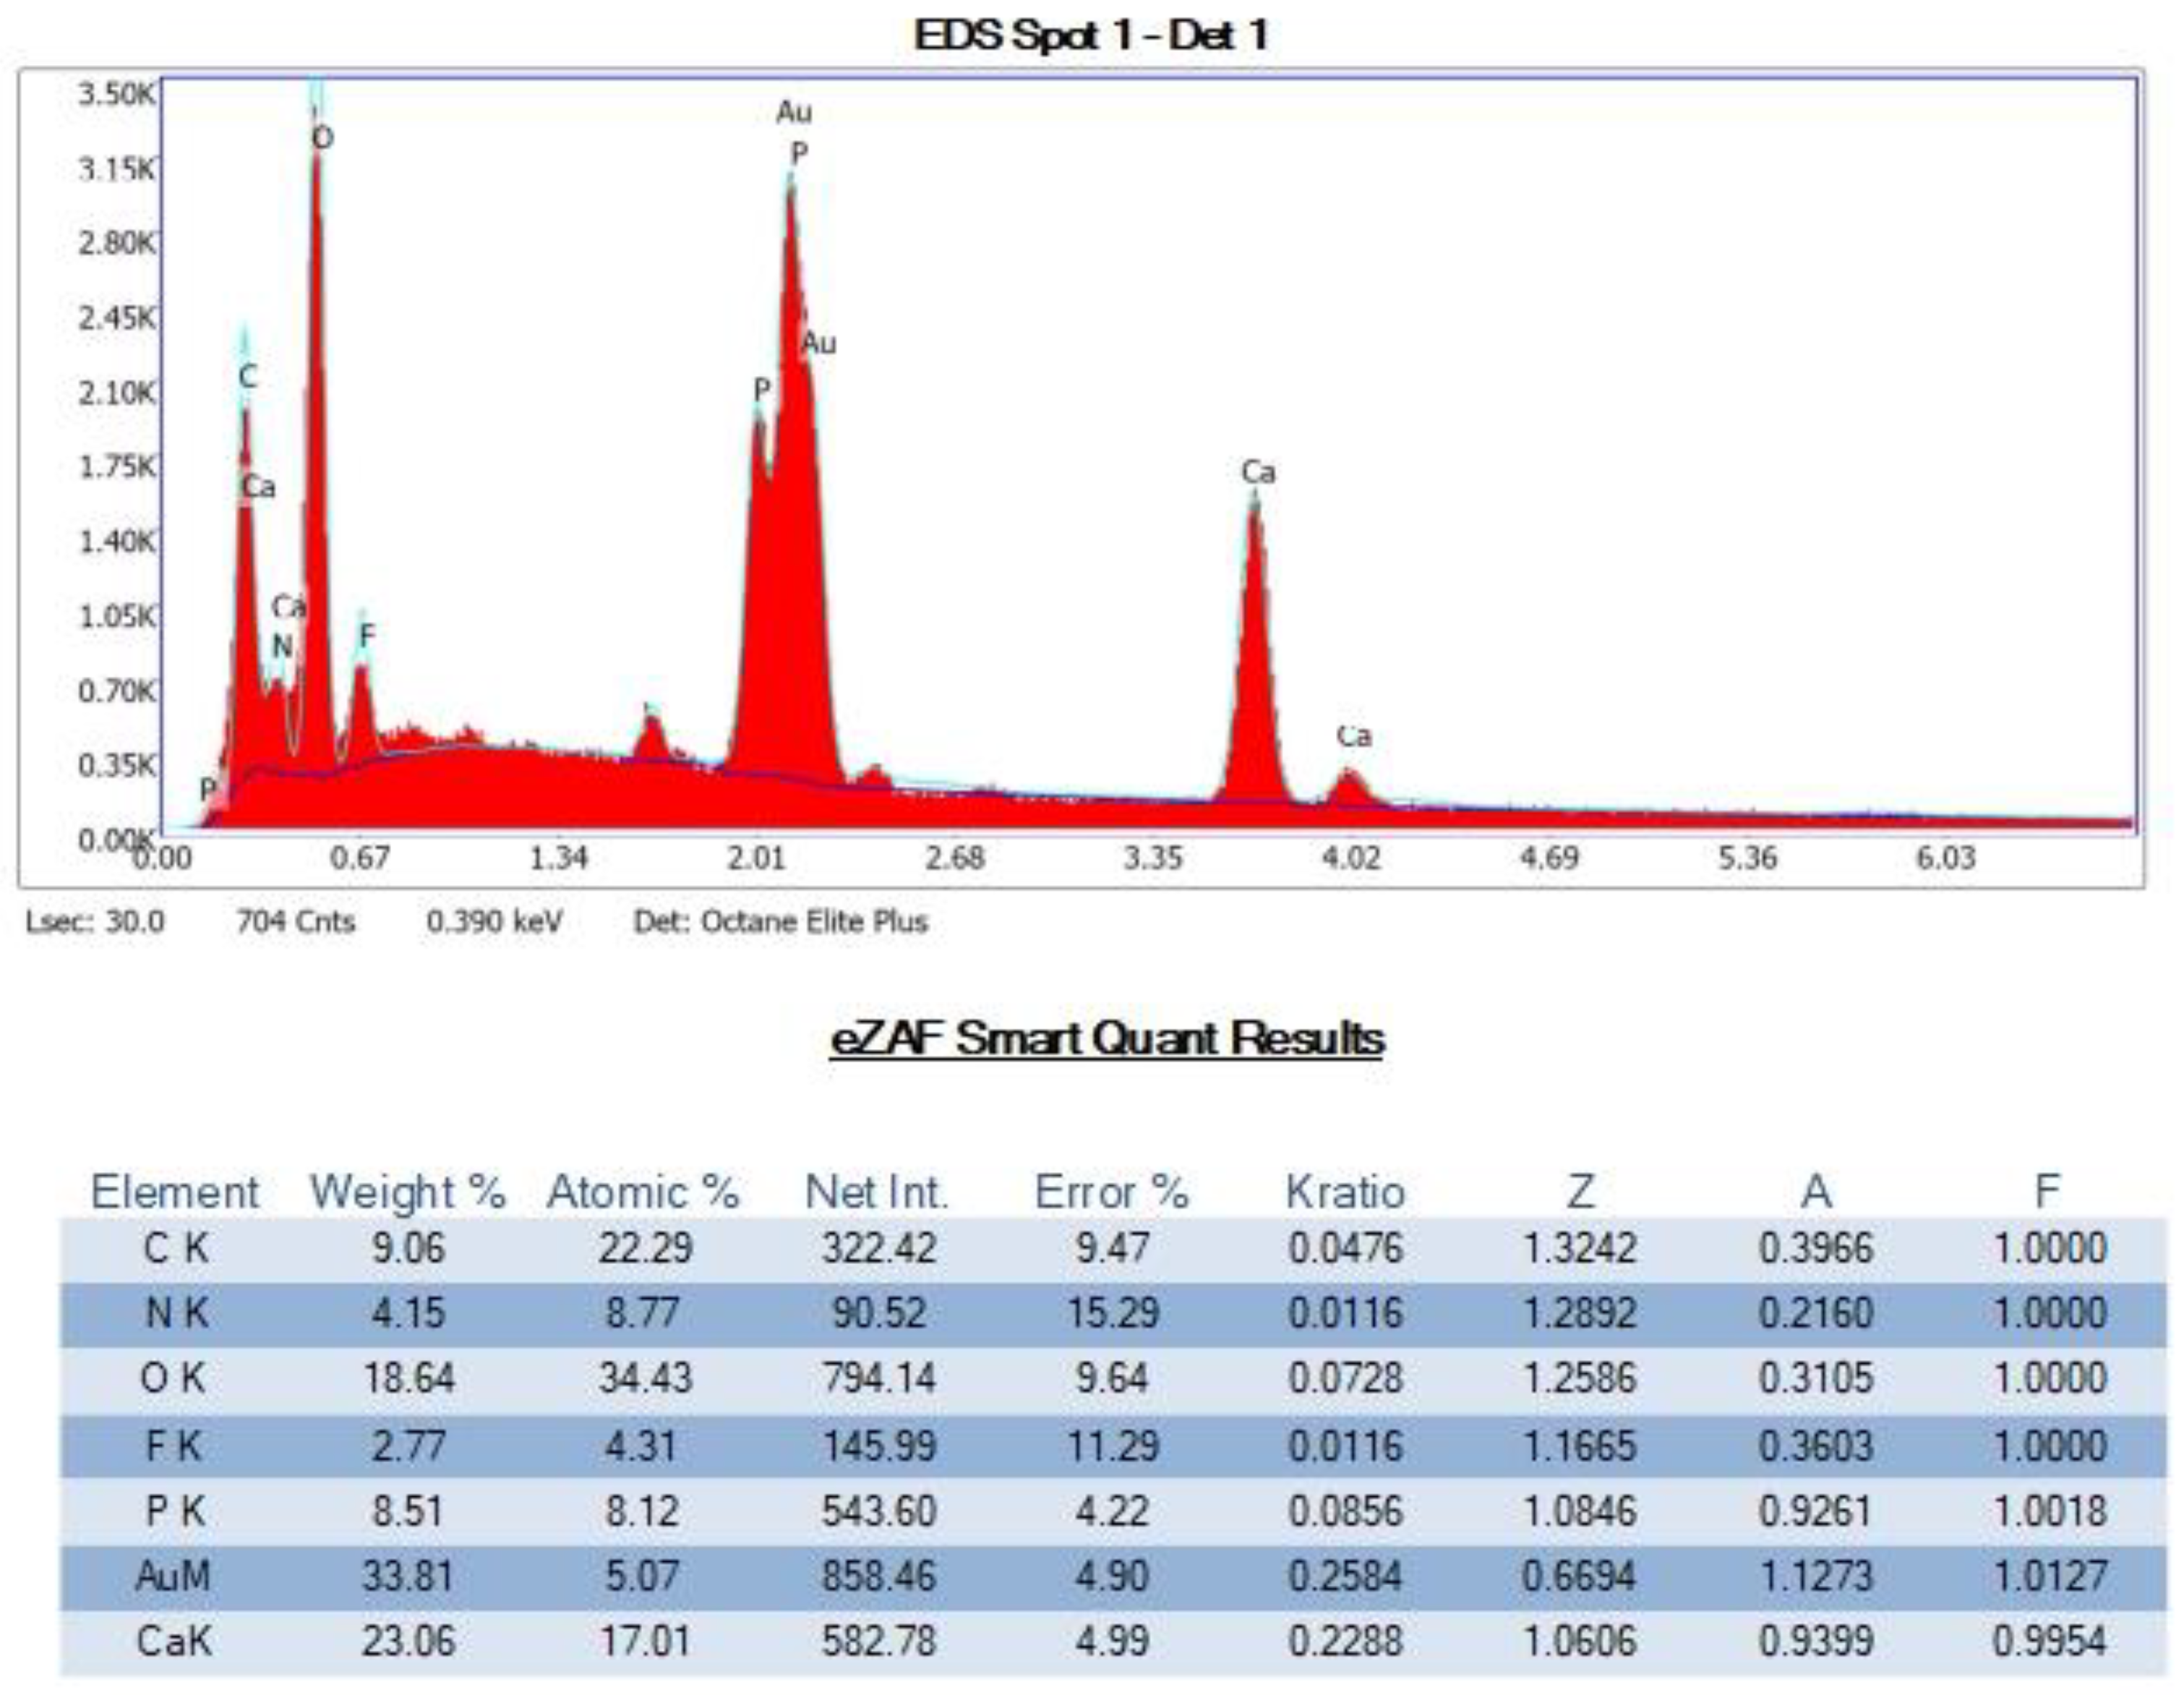
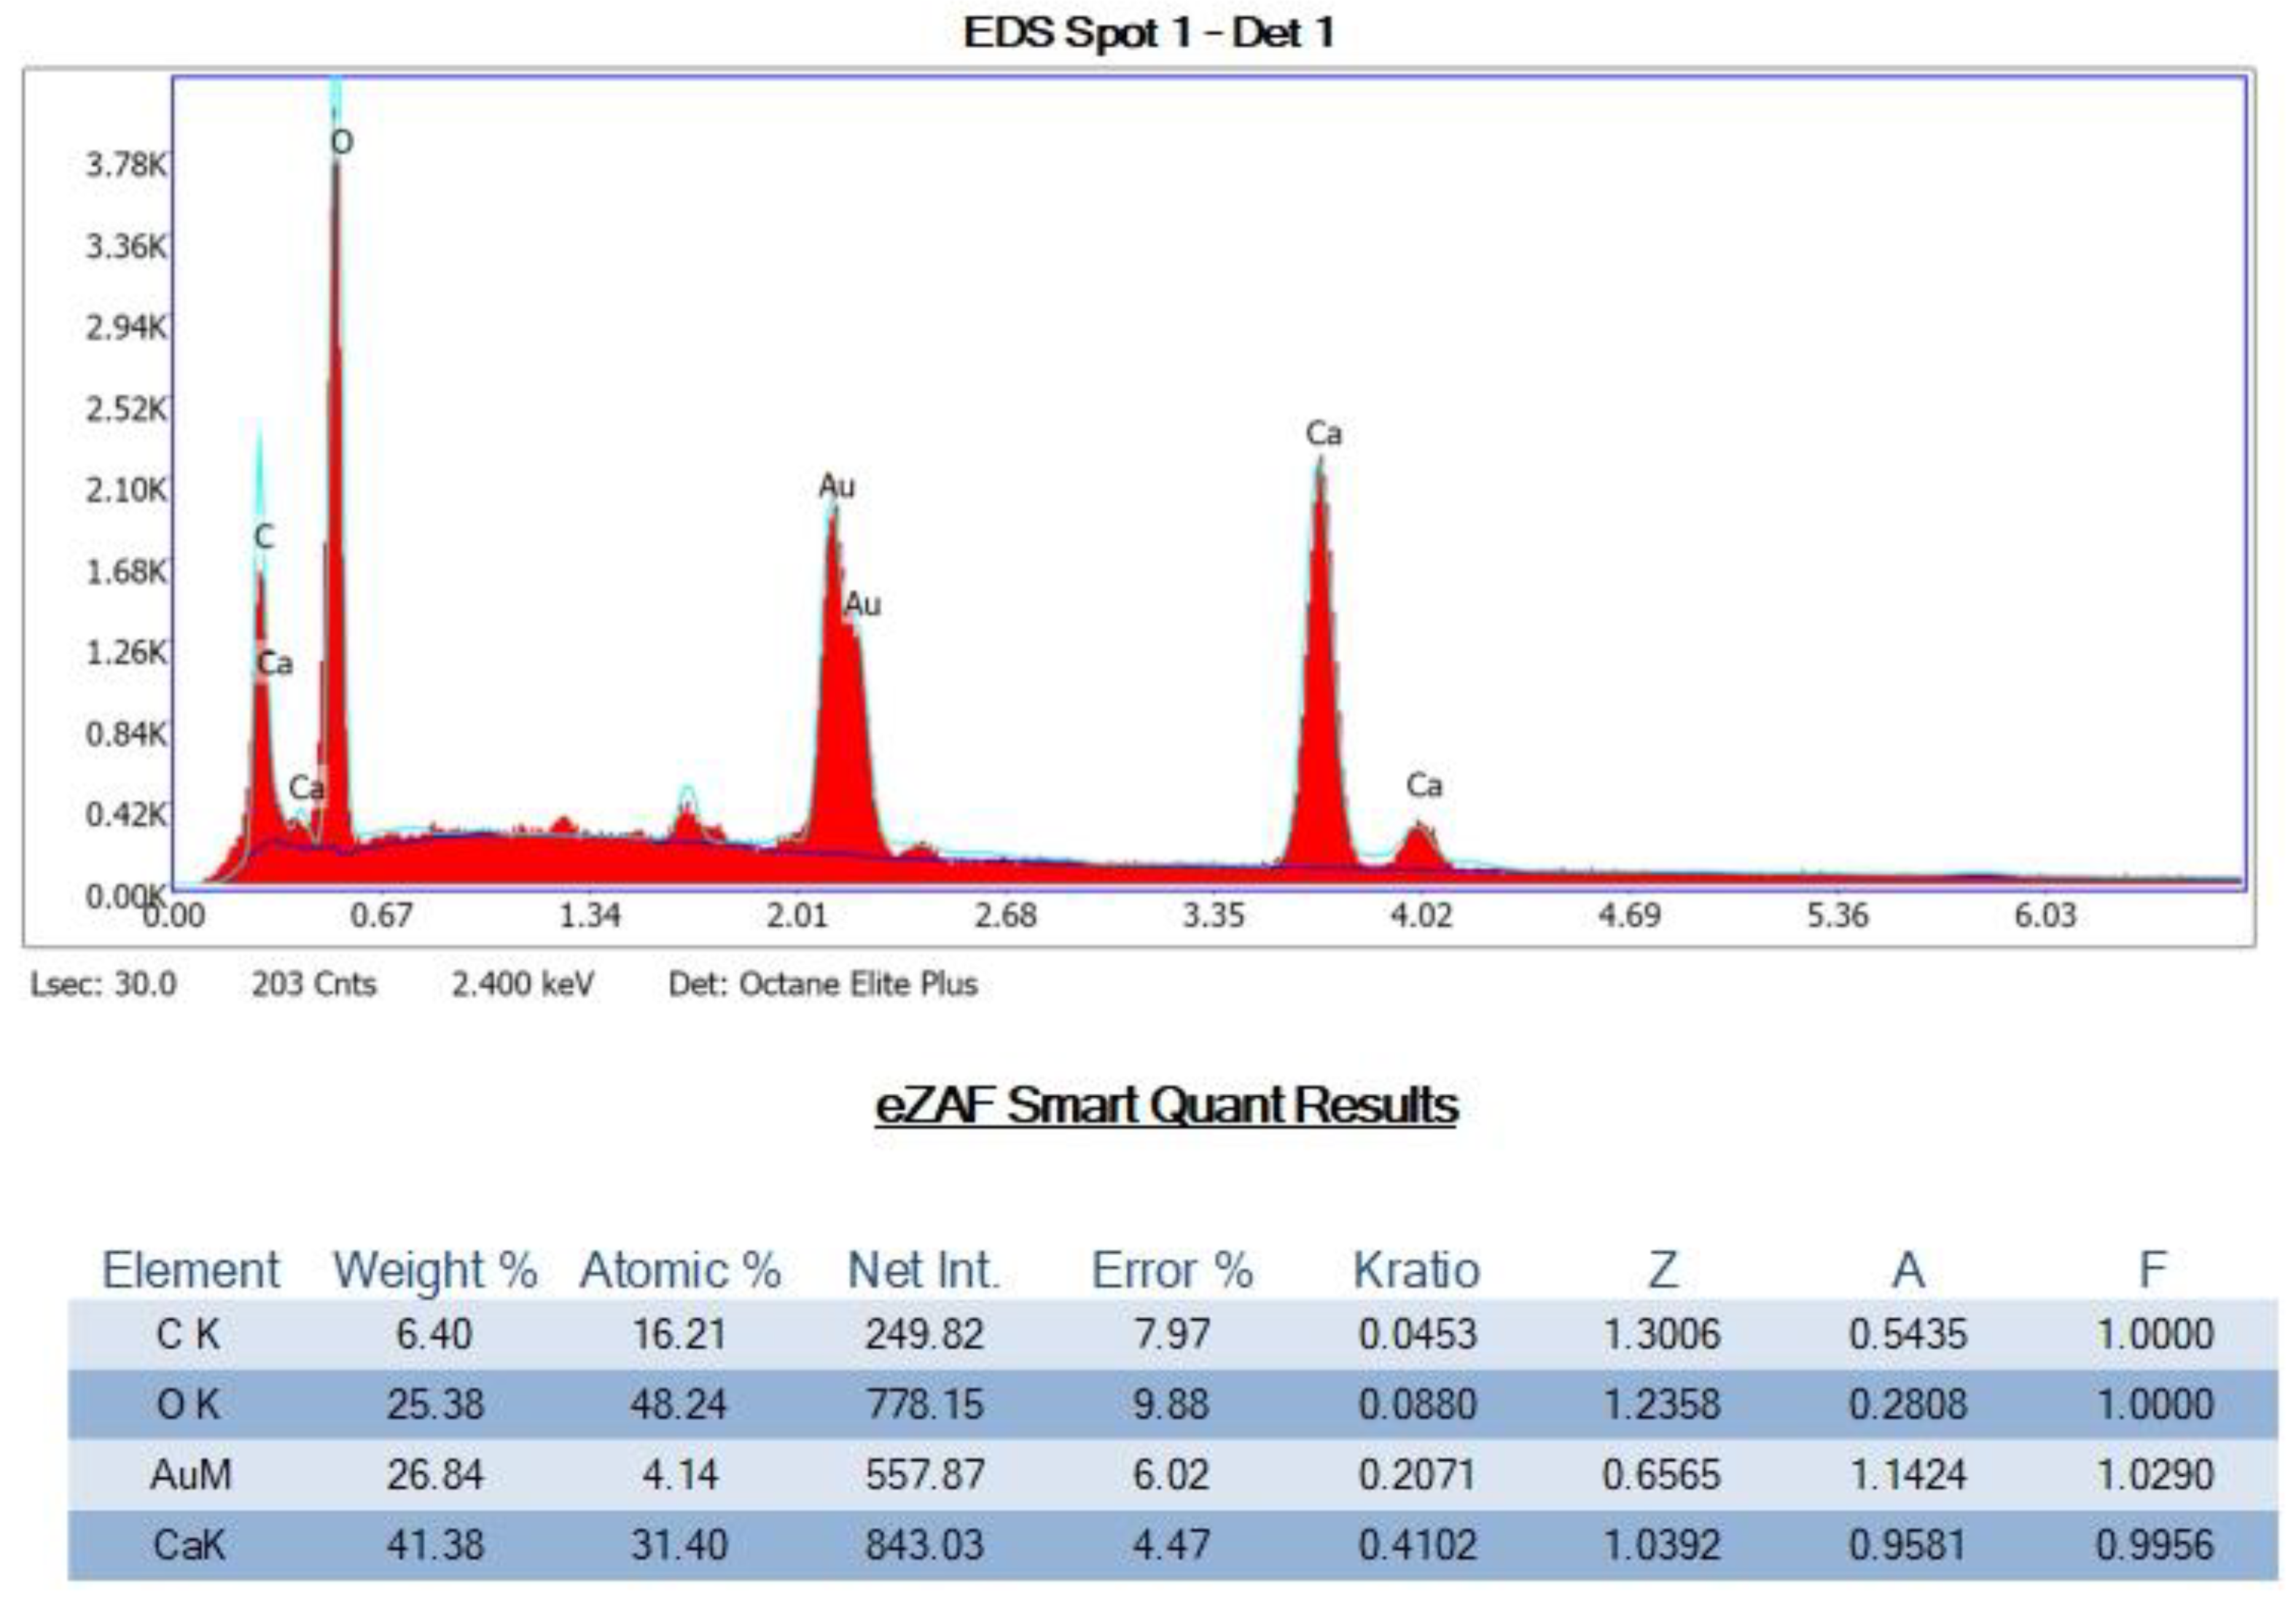
Petrographic Images and SEM-EDS Analysis of the Four Rock Specimens

Thin and thick sections were made from wet sieved rock samples of the HOP-5, SS-10, OS-3, and CK-6 rocks for detailed mineralogical and geochemical characterizations. These sections were analyzed under plain and polarized light, to identify structural features and mineralogy. Thick sections were placed on a carbon-taped mount, for scanning electron microscopy (SEM). SEM analysis was conducted on an FEITM Inspect F-SEM equipped with Energy dispersive X-ray spectroscopy (EDS) for elemental analysis.
The four samples represent distinct petrographic features and mineralogical assemblages dominated by silica and carbonates. For example, the sandstone (SS-10B) is densely compacted and appears massive at this scale, with no apparent bedding features. It is poorly sorted and matrix supported. It contains coarse grains of fractured sub-angular to sub-rounded quartz and minor calcite and feldspar grains (Figure A8).
Figure A8. Plate E1: Petrographic images of sandstone sample (SS-10) under plain (A) and polarized (B) lights.
Minerals 12 00728 g0a8
In contrast, the matrix consists of abundant fine-grained secondary mineral aggregates of calcite, quartz, and minor components of dolomite and organic matter. The sandstone is well cemented with calcite, and feldspar grains within the matrix are fractured and partially altered.
Scanning electron microscope (SEM) examination of sandstone SS-10 exhibits more detailed textural features, which include coarse fractured quartz grains and partially leached calcite crystals (Figure A9). The coarser crystals are embedded in a fine-grained matrix of silica and calcite with minor amounts of dolomite, organic matter, and trace amounts of other phases. Whereas the quartz grains are fractured, the matrix shows sparsely distributed cavernous features, possibly due to leaching and weathering. Minor disc-like calcified fossil fragments are present within the sandstone. Semi-quantitative major and trace element compositions from EDS analyses of the matrix and the coarser mineral grains confirm that the sandstone consists of coarse- to fine-grained quartz and calcite minerals. In Figure A9A, the quartz phase (spot a) is mostly covered by a densely packed matrix of silica and minor organic matter and other unidentified phase mixtures (spot b). Figure A9B shows partially altered calcite crystals (spots c and d) that are covered by a fine-grained matrix, containing calcite, quartz, and feldspar (spot e). The back scattered SEM images show that the sandstone is well cemented, except for sparsely distributed cavernous features within the coarser crystals.
Figure A9. Plate E2: SEM image of sandstone sample SS-10. (A) Showing fractured quartz grain (a) covered with a fine-grained matrix (b) (Scale bar is 50 µm). (B) Spots c and d represent cleavage faces of calcite crystal covered by a fine-grained matrix (f) and next to a feldspar crystal (e) (scale bar is 20 µm).
Minerals 12 00728 g0a9
As determined by qXRD analysis, the SS-10 sandstone is dominantly composed of quartz (75 wt.%), calcite (16.2 wt.%), feldspars (8.4 wt.%), and trace amounts of pyrite (0.2 wt.%). This attests to the terrestrial provenance of this shallow marine lithology. The mineral assemblage is consistent with the petrographic and SEM results, except for pyrite, which was not detected in the SEM sections.
The chalk sample (CK-6) is from the top of the upper Cretaceous shallow marine sequence. It is homogeneous, fine grained, white to grayish brown, and consists of well-preserved and broken foraminiferous and spherical oolitic fragments and other abundant fine calcareous shell fragments (Figure A10). The chalk is cemented, partially weathered, and discolored in places. SEM analysis shows detailed textural and structural features (Figure A11). The chalk is composed, in part of, larger platy calcite crystals. At least two generations of calcite, consisting of coarser euhedral crystals and fine-grained crystal aggregates are seen to replace a spherical 50-µm oolite shell (Figure A11A, spot a). Other minor carbonate minerals of dolomite and siderite, and minor organic matter and clay, are also detected. EDX analysis shows that the larger crystals are pure calcite (CaCO3). Though carbonate is the dominant fraction within the matrix, other carbonate minerals, silica, and trace elements are commonly noted. The platy fragments in Figure A11A,B, spots (a) and (b) respectively, are pure calcite, whereas the matrix fragments in Figure A11B, spots (a) and (c) represent mixed mineral phases containing trace elements. Quantitative X-ray diffraction analysis of the chalk sample identified similar secondary mineral phases, with calcite as the dominant mineral and smectite clay mixed with illite as the second most abundant fraction. However, the SEM and EDX analyses of the matrix did not detect elements such as potassium that are common in illite-rich clays.
Figure A10. Plate E3: Petrographic images of the CK-6 (chalk) sample under plain (A) and polarized (B) lights.
Minerals 12 00728 g0a10
Figure A11. Plate E4: SEM images of a CK-6 oolitic chalk sample. (A) Visible are platy and corrugated calcite fragments, spot a; scale bar 30 µm) at the center of a 50 µm oolite sphere. (B) Platy calcite (spot b; scale bar 20 µm) and altered matrix fragments (spots a and c). See text for detailed descriptions.
Minerals 12 00728 g0a11
The bituminous limestone marl OS-3 unit occurs in the lower half of the upper Cretaceous marine deposits, below another bituminous limestone marl and above a sandstone layer. Optical microscopy of the sample provided limited information about the textural features and mineral phases, because of the fine-grained nature of the marl. The sample appears sandy or granular, containing abundant crystal aggregates of secondary calcite that have significantly replaced the brownish matrix (Figure A12). The brownish matrix appears partially altered or oxidized, and even though the sample is a massive in hand sample, a fine lamination is visible at this scale (Figure A12A). Calcareous fossil shell fragments are abundant.
More detailed textural features and mineral phases are identified in the OS-3 sample using SEM analysis (Figure A13). The back-scattered images show distinct crystallization features of secondary minerals, creating a maze of open spaces.
Figure A12. Plate E5: Micrograph of the bituminous marl under plain (A) and polarized (B) lights.
Minerals 12 00728 g0a12
Figure A13. Plate E6: Representative back-scattered SEM images (AD) of the OS-3 bituminous limestone marl sample. Shown are the diverse textural, crystallization, alteration, and fracture features in this rock. See text for detailed descriptions.
Minerals 12 00728 g0a13
Figure A13A, spot a represents a weathered and partially leached crystal surface and recrystallized matrix. Figure A13B, spot (a) is an area of strong crystal fragmentation. Spots (a) through (e) in Figure A13C, represent disaggregated mineral fragments within a 40–50 µm diameter spherical oolite shell fragment (Figure A13D, spot a) with preserved cell-like features associated with an abundance of submicron sized pores at their center. Each of the textural features represent either primary or secondary mineral phases. For example, the maze-like features in Figure A13A(a) are associated with dolomite mineralization. The skeletal framework in Figure A13B(a) represents a partially leached calcite crystal; whereas in Figure A13C, the different fragments represent distinct mineral phases cemented by calcite, where spots (a, b, c, d, e) are identified as containing a mixture of calcite, dolomite, and silica, with minor amounts of apatite, feldspar, and clay. Figure A13D(a) is pure CaCO3 associated with an oolite shell. The elemental abundances and phases identified by SEM examination are very similar to the mineral phases determined by qXRD analysis. Calcite represents the dominant mineral fraction, followed by feldspar and illite-mica mixed with a smectite clay (that reacts to aqueous fluids and swells), and minor quantities of apatite, dolomite, and quartz, in decreasing abundance.
The phosphorite HOP-5 was collected at the Zin Quarry outcrop and is tentatively correlated stratigraphically to the lower half of the Y-16 borehole shallow marine sequence, located between overlying sandstone and underlying chert layers. A thin section from the phosphorite shows abundant altered skeletal fossil fragments embedded in a dark brown matrix with abundant fine-grained mineral aggregates of calcite and apatite (Figure A14). The sample is poorly sorted, coarse-grained, porous, and matrix supported. Most of the fossil fragments are replaced by fine-grained secondary minerals. The matrix is dark brown and interpreted as an alteration product of organic matter. The fossil fragments are angular and delicate, and show no signs of transport or reworking. Moreover, the fossil fragments are commonly replaced by secondary minerals, whereas the matrix appears to be dominated by organic matter, as shown by the dark background of the thin section under polarized light.
SEM examination of the organic-rich phosphorite indicates distinct textural features, consisting of fine-grained, rounded clusters of mineral phases and coarse-grained crystals associated with cavernous features (Figure A15). In Figure A15A the sample is covered by fine-grained aggregate clusters of mixed mineral phases of apatite, calcite, and amorphous organic matter. The textural features and mineral phases in Figure A15B represent coarse calcite (spot a), and fine-grained aggregate clusters of secondary minerals (spots b, c) of different elemental content. The mineralogical compositions, grain-size, and textural features suggest that secondary fine-grained mineral aggregates crystallized over the coarser calcite crystals. The cavernous features appear to be related to leaching. The mineral phases identified during the SEM examination are similar to the mineral assemblage determined by quantitative X-ray diffraction analysis, except for the absence of abundant organic matter noted during the SEM examination. Moreover, the elements Cl, F, and N were commonly noted.
Figure A14. Plate E7: Photomicrograph of the fossil-rich phosphorite sample (HOP-5) under plain (A) and polarized (B) lights.
Minerals 12 00728 g0a14
Figure A15. Plate E8: Representative back-scattered SEM images of HOP-5, showing distinct textural, crystallization, and alteration features. (A) Fine-grained aggregate clusters of mixed mineral phases of apatite, calcite, and amorphous organic matter (spot a) (scale bar is 2 µm). (B) Coarse calcite (spot a) with signs of dissolution, and fine-grained aggregate clusters of secondary minerals (spots b, c) (scale bar is 10 µm).
Minerals 12 00728 g0a15
The brief optical and SEM petrographic analyses of the four samples obtained from Negev desert outcrop samples represent a range of littoral and shallow marine depositional environments and rocks with diverse textural, mineralogical, and alteration features. The common denominator for the four samples is the ubiquitous presence of primary and secondary calcite and a range of organic carbon contents. Quartz and apatite are the dominant mineral phases in the sandstone and organic-rich phosphorite, respectively, but calcite is also present in significant amounts within the matrix of both lithologies. The organic-rich phosphorite contains more cavernous features and a lesser abundance of calcite compared to the sandstone, chalk, and bituminous limestone marls, possibly related to solution leaching of the carbonate during the crystallization of apatite and the formation of cavernous features. This is consistent with the measured high values for porosity (∅ = 0.35) and saturated conductivity (KSAT = 3.30 × 10⁻⁵ cm/s) of the phosphorite [1].

Appendix F

SEM-EDS Analyses of Select OS-3 and HOP-5 Sections

Figure A16. Phosphorite HOP-5. SEM-EDS Scan of spot (a) in Figure 5A (see description in main text).
Minerals 12 00728 g0a16
Figure A17. Bituminous Limestone Marl OS-3. SEM-EDS Scan of spot (a) in Figure 5B (see description in main text).
Minerals 12 00728 g0a17

Appendix G

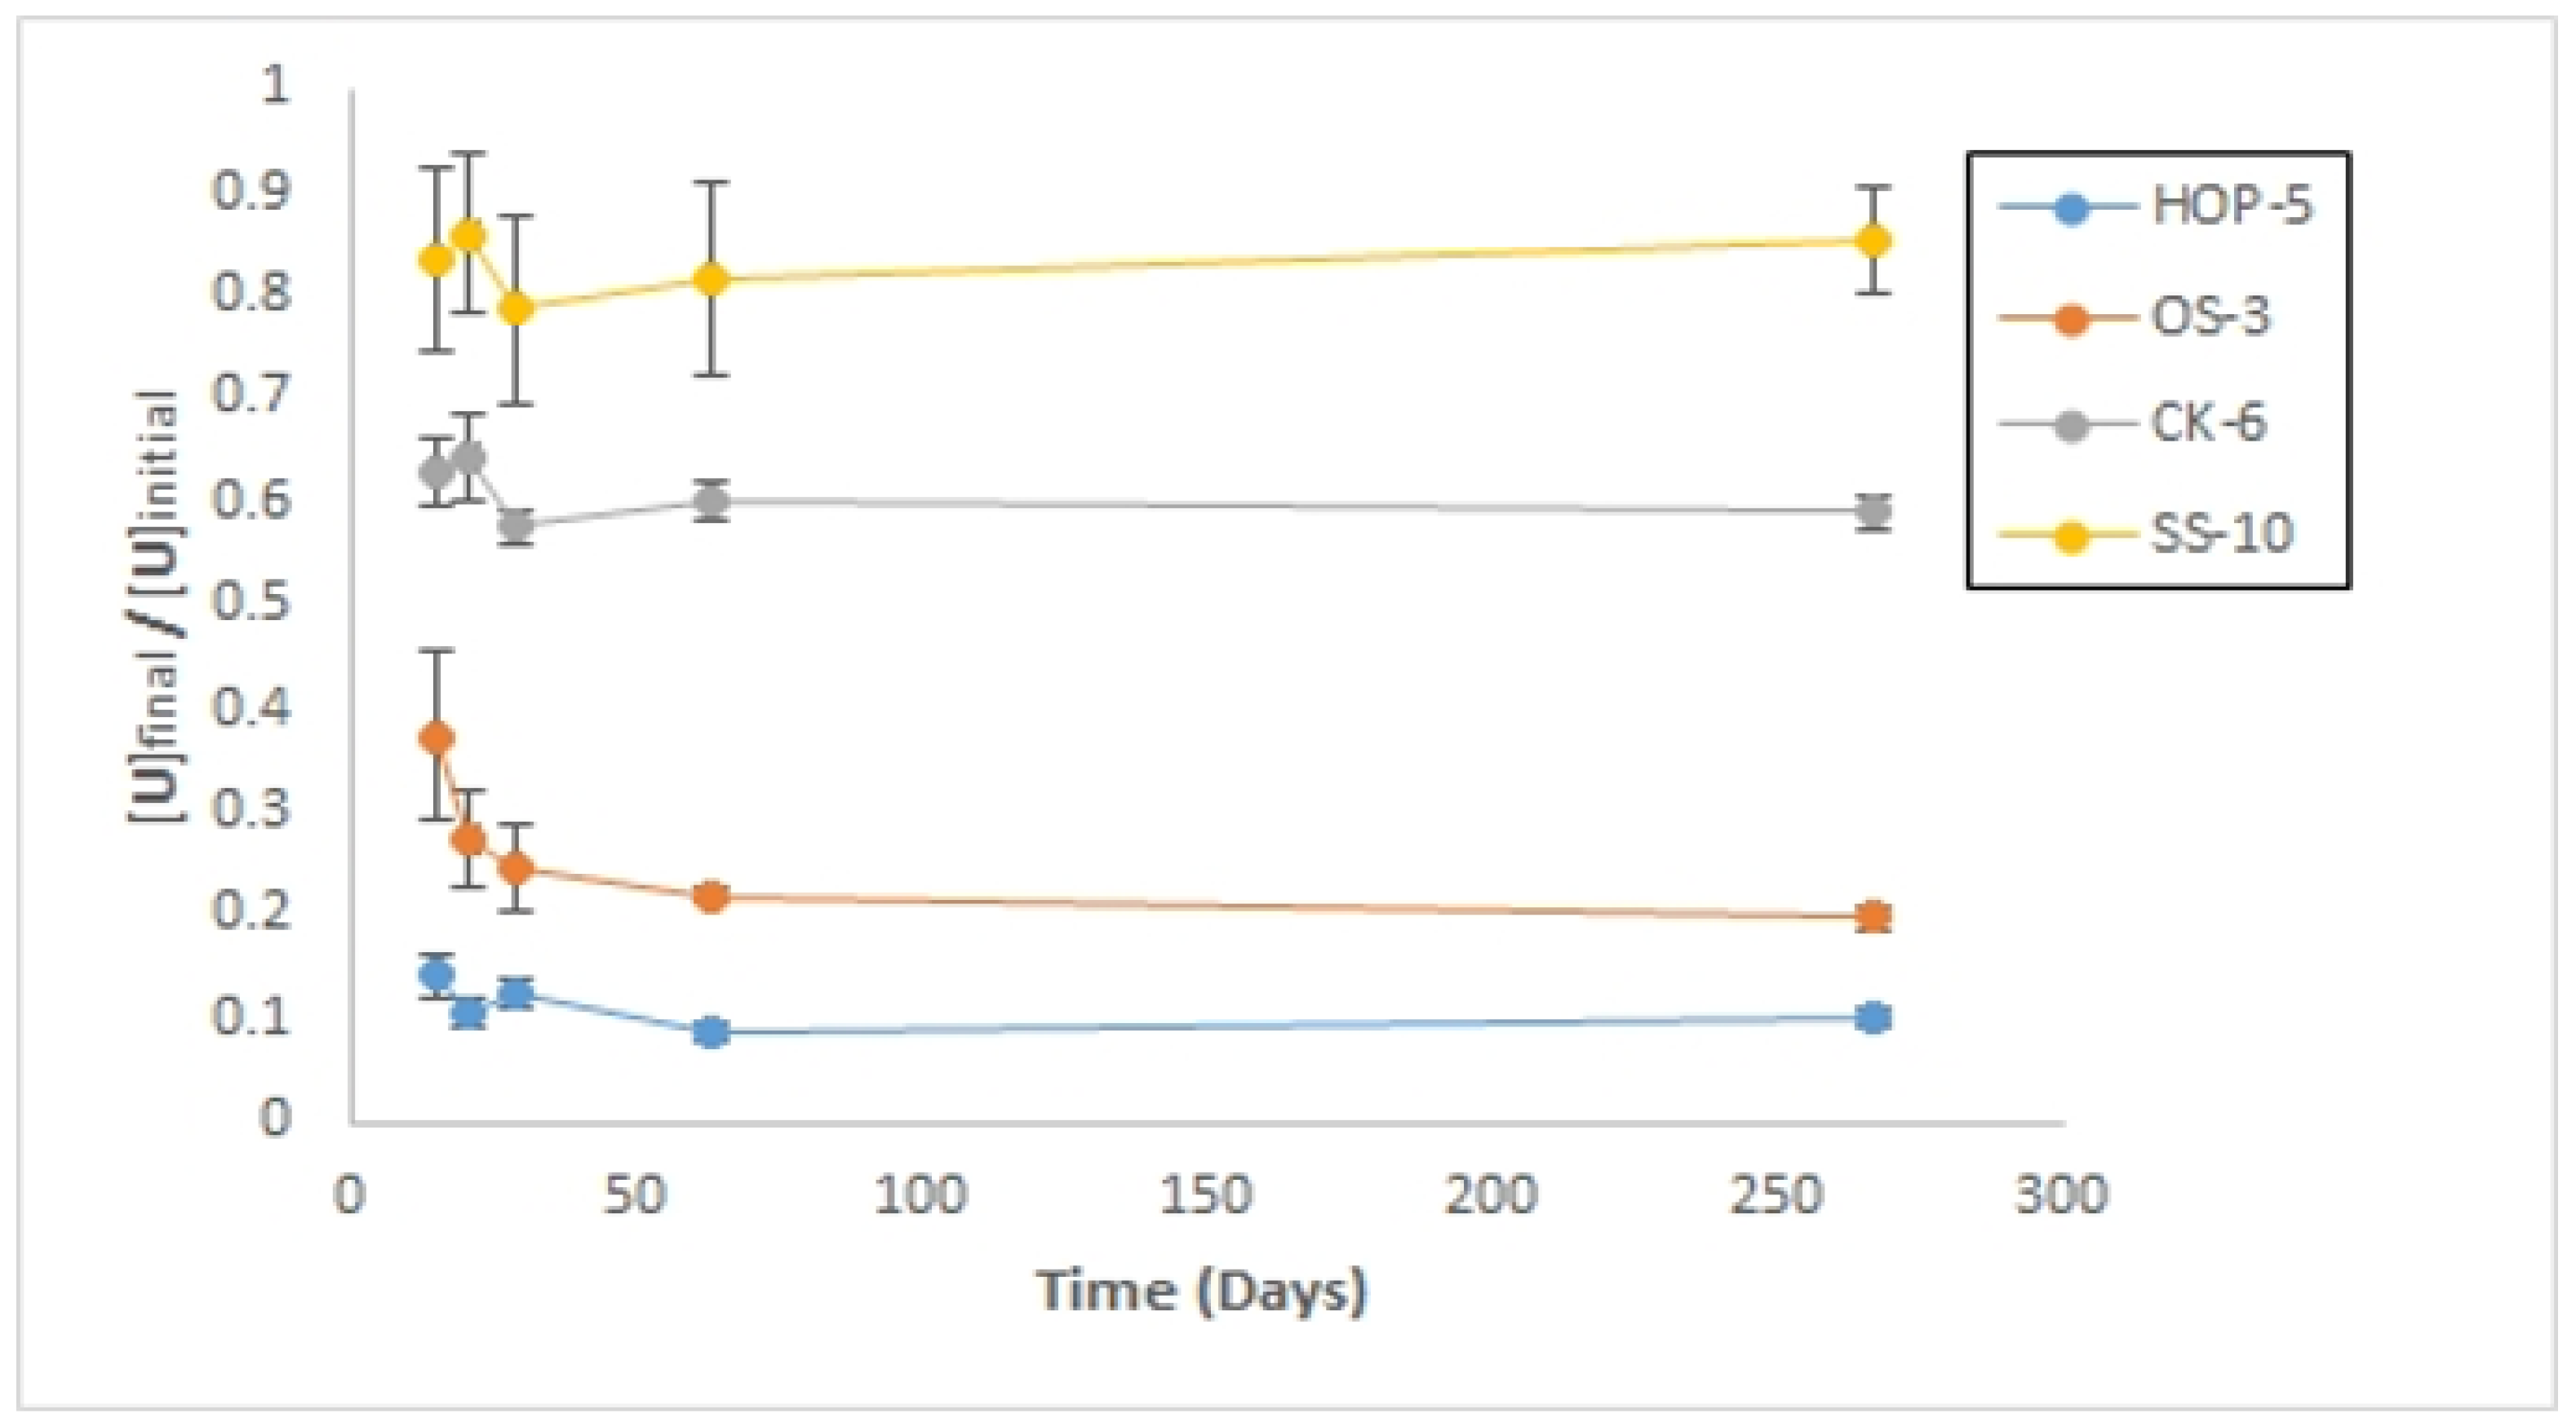
Long-Term Sorption Experiment

A nine-month sorption experiment was conducted, to determine whether any long-term uptake mechanisms such as uranium precipitation or intergranular diffusion were present that were not identified in the sorption test results. For the CK-6, OS-3, and SS-10 samples, 0.2 g of rock powder was added to 20 mL of SSW with 0.5 ppm uranium. For the HOP-5 lithology only 0.1 g of rock powder was added to the 20 mL of SSW, spiked with 1 ppm of uranium. All batch experiments were sampled after 15, 21, 29, 63, and 267 days, to measure uranium concentrations. Six replicates were performed for each rock type and all kinetic and long-term sorption studies included a uranium blank (no rock sample), rock sample blanks (no uranium), and method blanks with just SSW. The results for the long-term sorption experiment are shown in Figure A18.
Of the four rock types, only the bituminous marl (OS-3) showed a measurable decrease in uranium concentrations over the course of the first 67 days. The decrease was minor and in the absence of data over the following 200 days, this decrease may be or may not be due to sample variability and small measurement errors. Within error, it appears that after a short period of equilibration, none of the other samples exhibited any significant decrease or increase in uranium concentrations over the course of the final 230 days.
Figure A18. Results for the long-term, 9-month total duration sorption experiments on the HOP-5, CK-6, OS-3, and SS-10 rock samples. Concentrations are shown as a fraction of the initial uranium added to the batch experiments.
Minerals 12 00728 g0a18

References

  1. Bussod, G.Y.; Rosenzweig, R.; Reimus, P.W.; Stauffer, P.H.; Dangelmayr, M.A.; Calvo, R.; Hayes-Rich, N.G.; Klein-BenDavid, O.; Dody, A.; Balaban, N. Subsurface Radionuclide Transport: Northeastern Negev Desert Vadose Zone Model Development. In Scientific, Strategic and Conceptual Contributions to Deep Geological Repository Siting Process, Proceedings of the 45th Waste Management Conference, Phoenix, AZ, USA, 3–7 March 2019; WM Symposia: Phoenix, AZ, USA, 2020; pp. 1–14. [Google Scholar]
  2. Calvo, R.; Bartov, Y. Hazeva Group, southern Israel: New observations, and their implications for its stratigraphy, paleogeography, and tectono-sedimentary regime. Isr. J. Earth Sci. 2001, 50, 71–99. [Google Scholar] [CrossRef]
  3. Fabryka-Martin, J.T.; Flint, A.; Meijer, A.; Bussod, G.Y. Water and Radionuclide Transport in the Unsaturated Zone. In Uncertainties Underground: Yucca Mountain and the Nation’s Hugh-Level Nuclear Waste; MacFarlane, A., Ewing, R., Eds.; The MIT Press: Cambridge, MA, USA, 2006; pp. 179–197. [Google Scholar]
  4. Robinson, B.A.; Bussod, G.Y. Radionuclide Transport in the Unsaturated Zone at Yucca Mountain: Numerical Model and Preliminary Field Observations. In Dynamics of Fluids in Fractured Rocks, Witherspoon Volume; Geophysical Monograph Series 122; Faybishenko, B., Ed.; American Geophysical Union: Washington, DC, USA, 2000; pp. 323–336. [Google Scholar]
  5. Eckhardt, R.C.; Bish, D.L.; Bussod, G.Y.; Fabryka-Martin, J.T.; Levy, S.S.; Reimus, P.W.; Robinson, B.A.; Runde, W.H.; Triay, I.; Vaniman, D.T. Yucca Mountain: Looking ten thousand years into the future. In Challenges in Plutonium Science; Los Alamos Science: Los Alamos, NM, USA, 2000; Volume II, pp. 464–488. [Google Scholar]
  6. Bethke, C.M.; Brady, P.V. How the Kd approach undermines ground water cleanup. Groundwater 2000, 38, 435–443. [Google Scholar] [CrossRef] [Green Version]
  7. Zhu, C. A case against Kd-based transport models: Natural attenuation at a mill tailings site. Comput. Geosci. 2003, 29, 351–359. [Google Scholar] [CrossRef]
  8. Stoliker, D.L.; Kent, D.B.; Zachara, J.M. Quantifying Differences in the Impact of Variable Chemistry on Equilibrium Uranium (VI) Adsorption Properties of Aquifer Sediments. Environ. Sci. Technol. 2011, 45, 8733–8740. [Google Scholar] [CrossRef] [PubMed]
  9. Davis, J.A.; Meece, D.E.; Kohler, M.; Curtis, G.P. Approaches to surface complexation modeling of Uranium (VI) adsorption on aquifer sediments. Geochim. Cosmochim. Acta 2004, 68, 3621–3641. [Google Scholar] [CrossRef]
  10. Waite, T.D.; Davis, J.A.; Payne, T.E.; Waychunas, G.A.; Xu, N. Uranium (VI) adsorption to ferrihydrite: Application of a surface complexation model. Geochim. Cosmochim. Acta 1994, 58, 5465–5478. [Google Scholar] [CrossRef]
  11. Bernhard, G.; Geipel, G.; Reich, T.; Brendler, V.; Amayri, S.; Nitsche, H. Uranyl (VI) carbonate complex formation: Validation of the Ca2UO2 (CO3)3 (aq.) species. Radiochim. Acta 2001, 89, 511–518. [Google Scholar] [CrossRef]
  12. Davis, J.A.; Curtis, G.P.; Wilkins, M.J.; Kohler, M.; Fox, P.; Naftz, D.L.; Lloyd, J.R. Processes affecting transport of uranium in a suboxic aquifer. Phys. Chem. Earth Parts A/B/C 2006, 31, 548–555. [Google Scholar] [CrossRef]
  13. Kohler, M.; Curtis, G.P.; Meece, D.E.; Davis, J.A. Methods for Estimating Adadsorbed Uranium (VI) and Distribution Coefficients of Contaminated Sediments. Environ. Sci. Technol. 2004, 38, 240–247. [Google Scholar] [CrossRef]
  14. Stewart, B.D.; Mayes, M.A.; Fendorf, S. Impact of uranyl− calcium− carbonato complexes on uranium (VI) adsorption to synthetic and natural sediments. Environ. Sci. Technol. 2010, 44, 928–934. [Google Scholar] [CrossRef] [PubMed]
  15. Dong, W.; Brooks, S.C. Determination of the formation constants of ternary complexes of uranyl and carbonate with alkaline earth metals (Mg2+, Ca2+, Sr2+, and Ba2+) using anion exchange method. Environ. Sci. Technol. 2006, 40, 4689–4695. [Google Scholar] [CrossRef] [PubMed]
  16. Curtis, G.P.; Fox, P.; Kohler, M.; Davis, J.A. Comparison of in situ uranium KD values with a laboratory determined surface complexation model. Appl. Geochem. 2004, 19, 1643–1653. [Google Scholar] [CrossRef]
  17. Davis, J.A.; Ochs, M.; Olin, M.; Payne, T.E.; Tweed, C.J. Interpretation and Prediction of Radionuclide Sorption onto Substrates Relevant for Radioactive Waste Disposal Using Thermodynamic Sorption, Models; NEA Sorption Project, Phase II, NEA Report 5992; OECD: Paris, France, 2005. [Google Scholar]
  18. Johnson, R.H.; Tutu, H. Predictive Reactive Transport Modeling at a Proposed Uranium In Situ Recovery Site with a General Data Collection Guide. Mine Water Environ. 2016, 35, 369–380. [Google Scholar] [CrossRef]
  19. Dangelmayr, M.A.; Reimus, P.W.; Wasserman, N.L.; Punsal, J.J.; Johnson, R.H.; Clay, J.T.; Stone, J.J. Laboratory column experiments and transport modeling to evaluate retardation of uranium in an aquifer downgradient of a uranium in-situ recovery site. Appl. Geochem. 2017, 80, 1–13. [Google Scholar] [CrossRef]
  20. Reimus, P.W.; Dangelmayr, M.A.; Clay, J.T.; Chamberlain, K.R. Uranium Natural Attenuation Downgradient of an In-situ Recovery Mine Inferred from a Cross-Hole Field Test. Environ. Sci. Technol. 2019, 53, 7483–7493. [Google Scholar] [CrossRef]
  21. Dzombak, D.D.; Morel, F.M.M. Surface Complex Modeling: Hydrous Ferric Oxide; Wiley: New York, NY, USA, 1990. [Google Scholar]
  22. Payne, T.E.; Brendler, V.; Ochs, M.; Baeyens, B.; Brown, P.L.; Davis, J.A.; Ekberg, C.; Kulik, D.A.; Lutzenkirchen, J.; Missana, T. Guidelines for thermodynamic sorption modelling in the context of radioactive waste disposal. Environ. Model. Softw. 2013, 42, 143–156. [Google Scholar] [CrossRef]
  23. Stockdale, A.; Bryan, N.D.; Lofts, S.; Tipping, E. Investigating humic substances interactions with Th4+, UO22+, and NpO2+ at high pH: Relevance to cementitious disposal of radioactive wastes. Geochim. Cosmochim. Acta 2013, 121, 214–228. [Google Scholar] [CrossRef]
  24. Dong, W.; Wan, J. Additive surface complexation modeling of uranium (VI) adsorption onto quartz-sand dominated sediments. Environ. Sci. Technol. 2014, 48, 6569–6577. [Google Scholar] [CrossRef]
  25. Klein-BenDavid, O.; Harlavan, Y.; Levkov, I.; Teutsch, N.; Brown, K.G.; Gruber, C.; Ganor, J. Interaction between spent fuel components and carbonate rocks. Sci. Total Environ. 2019, 689, 469–480. [Google Scholar] [CrossRef] [PubMed]
  26. Payne, T.E.; Davis, J.A.; Ochs, M.; Olin, M.; Tweed, C.J. Uranium adsorption on weathered schist–intercomparison of modelling approaches. Radiochim. Acta 2004, 92, 651–661. [Google Scholar] [CrossRef]
  27. Payne, T.E.; Davis, J.A.; Ochs, M.; Olin, M.; Tweed, C.J.; Altmann, S.; Askarieh, M.M. Comparative evaluation of surface complexation models for radionuclide sorption by diverse geologic materials. Interface Sci. Technol. 2006, 11, 605–633. [Google Scholar]
  28. Davis, J.A. Application of Surface Complexation Modeling to Selected Radionuclides and Aquifer Sediments. US Nuclear Regulatory Commission, Office of Nuclear Regulatory Research: Rockville, MD, USA, 2008. [Google Scholar]
  29. Loganathan, V.A.; Barnett, M.O.; Clement, T.P.; Kanel, S.R. Scaling of adsorption reactions: U (VI) experiments and modeling. Appl. Geochem. 2009, 24, 2051–2060. [Google Scholar] [CrossRef]
  30. Johnson, R.H.; Tutu, H. Reactive transport modelling at uranium in situ recovery sites: Uncertainties in uranium sorption on iron hydroxides. In “Reliable Mine Water Technology”, Proceedings of the International Mine Water Association Conference, Golden, CO, USA, 6–9 August 2013; Brown, A., Ed.; International Mine Water Association: Wendelstein, Germany, 2013; Volume I. [Google Scholar]
  31. Beckingham, L.E.; Steefel, C.I.; Swift, A.M.; Voltolini, M.; Yang, L.; Anovitz, L.M.; Xue, Z. Evaluation of accessible mineral surface areas for improved prediction of mineral reaction rates in porous media. Geochim. Cosmochim. Acta 2017, 205, 31–49. [Google Scholar] [CrossRef] [Green Version]
  32. Dangelmayr, M.A.; Reimus, P.W.; Johnson, R.H.; Clay, J.T.; Stone, J.J. Uncertainty and variability in laboratory derived sorption parameters of sediments from a uranium in situ recovery site. J. Contam. Hydrol. 2018, 213, 28–39. [Google Scholar] [CrossRef] [PubMed]
  33. Dody, A.; Nahlieli, A.; Avni, Y.; Cohen, H.; Weiner, D.; Porat, N. Late Quaternary deposition and erosion processes along the margins of the Yamin Plain, northeast Negev, Israel. Isr. J. Earth Sci. 2008, 57, 199–211. [Google Scholar] [CrossRef]
  34. Weinberger, G.; Rosenthal, E.; Flexer, A. The subsurface geology of Central and Northern Negev with possible implications on the regional ground water flow pattern. J. Afr. Earth Sci. 1992, 14, 155–172. [Google Scholar] [CrossRef]
  35. Dody, A.; Weiner, D. Recharge processes of the Neogene aquifer at Yamin–Rotem Plateau, northeast Negev, Israel. Isr. J. Earth Sci. 2005, 54, 29–34. [Google Scholar] [CrossRef]
  36. Matmon, A.; Dody, A.; Finkel, R. A 300-ky history of sand erosion in the Yamin Plain, Negev Desert, Israel. Isr. J. Earth Sci. 2009, 58, 29–39. [Google Scholar] [CrossRef]
  37. Riley, R.G.; Zachara, J.M.; Wobber, F.J. Chemical Contaminants on DOE Lands and Selection of Contaminant Mixtures for Subsurface Science Research; DOE/ER-0547T; U.S. Department of Energy: Washington, DC, USA, 1992.
  38. Hedaya, M.A.; Birkenfeld, H.P.; Kathren, R.L. A sensitive method for the determination of uranium in biological samples utilizing kinetic phosphorescence analysis (KPA). J. Pharm. Biomed. Anal. 1997, 15, 1157–1165. [Google Scholar] [CrossRef]
  39. Parkhurst, D.L.; Appelo, C.A.J. Description of Input and Examples for PHREEQC Version 3: A Computer Program for Speciation, Batch-Reaction, One-Dimensional Transport, and Inverse Geochemical Calculations; U.S. Geological Survey: Denver, CO, USA, 2013; pp. 2328–7055.
  40. Guillaumont, R.; Mompean, F.J. Update on the Chemical Thermodynamics of Uranium, Neptunium, Plutonium, Americium and Technetium; Elsevier: Amsterdam, The Netherlands, 2003. [Google Scholar]
  41. Gorman-Lewis, D.; Burns, P.C.; Fein, J.B. Review of uranyl mineral solubility measurements. J. Chem. Thermodyn. 2008, 40, 335–352. [Google Scholar] [CrossRef]
  42. Gorman-Lewis, D.; Shvareva, T.; Kubatko, K.A.; Burns, P.C.; Wellman, D.M.; McNamara, B.; Szymanowski, J.E.S.; Navrotsky, A.; Fein, J.B. Thermodynamic Properties of Autunite, Uranyl Hydrogen Phosphate, and Uranyl Orthophosphate from Solubility and Calorimetric Measurements. Environ. Sci. Technol. 2009, 43, 7416–7422. [Google Scholar] [CrossRef]
  43. Dong, W.; Brooks, S.C. Formation of aqueous MgUO2 (CO3)32− complex and uranium anion exchange mechanism onto an exchange resin. Environ. Sci. Technol. 2008, 42, 1979–1983. [Google Scholar] [CrossRef]
  44. Davis, J.A.; Coston, J.A.; Kent, D.B.; Fuller, C.C. Application of the Surface Complexation Concept to Complex Mineral Assemblages. Environ. Sci. Technol. 1998, 32, 2820–2828. [Google Scholar] [CrossRef]
  45. Arai, Y.; McBeath, M.; Bargar, J.R.; Joye, J.; Davis, J.A. Uranyl adsorption and surface speciation at the imogolite–water interface: Self-consistent spectroscopic and surface complexation models. Geochim. Cosmochim. Acta 2006, 70, 2492–2509. [Google Scholar] [CrossRef]
  46. Bargar, J.R.; Reitmeyer, R.; Lenhart, J.J.; Davis, J.A. Characterization of U (VI)-carbonato ternary complexes on hematite: EXAFS and electrophoretic mobility measurements. Geochim. Cosmochim. Acta 2000, 64, 2737–2749. [Google Scholar] [CrossRef]
  47. Chisholm-Brause, C.J.; Berg, J.M.; Matzner, R.A.; Morris, D.E. Uranium (VI) sorption complexes on montmorillonite as a function of solution chemistry. J. Colloid Interface Sci. 2001, 233, 38–49. [Google Scholar] [CrossRef] [Green Version]
  48. Doherty, J.E.; Hunt, R.J. Approaches to Highly Parameterized Inversion—A Guide to Using Pest for Groundwater-Model Calibration; U.S. Geological Survey: Denver, CO, USA, 2010; pp. 1–58.
  49. Langmuir, D.L. Aqueous Environmental Geochemistry. Prentice Hall: Upper Saddle River, NJ, USA, 1997. [Google Scholar]
  50. Liu, J.; Zhao, C.; Zhang, Z.; Liao, J.; Liu, Y.; Cao, X.; Yang, J.; Yang, Y.; Liu, N. Fluorine effects on U(VI) sorption by hydroxyapatite. Chem. Eng. J. 2016, 288, 505–515. [Google Scholar] [CrossRef]
  51. Ohnuki, T.; Kozai, N.; Samadfam, M.; Yasuda, R.; Yamamoto, S.; Narumi, K.; Naramoto, H.; Murakami, T. The formation of autunite (Ca(UO2)2(PO4)2 nH2O) within the leached layer of dissolving apatite: Incorporation mechanism of uranium by apatite. Chem. Geol. 2004, 211, 1–14. [Google Scholar] [CrossRef]
  52. Fuller, C.C.; Bargar, J.R.; Davis, J.A.; Piana, M.J. Mechanisms of Uranium Interactions with Hydroxyapatite:  Implications for Groundwater Remediation. Environ. Sci. Technol. 2002, 36, 158–165. [Google Scholar] [CrossRef]
  53. Krestou, A.; Xenidis, A.; Panias, D. Mechanism of aqueous uranium (VI) uptake by hydroxyapatite. Miner. Eng. 2004, 17, 373–381. [Google Scholar] [CrossRef]
  54. Brendler, V.; Fuchs, L.; Baumann, N. Uranium (VI) Interactions with Hydroxylapatite; Forschungszentrum Rossendorf Annual Report 2005; Institute of Radiochemistry: Dresden, Germany, 2006; pp. 14–15. [Google Scholar]
  55. Abd El-Naby, H.H.; Dawood, Y.H. Natural attenuation of uranium and formation of autunite at the expense of apatite within an oxidizing environment, southeastern Desert of Egypt. Appl. Geochem. 2008, 23, 3741–3755. [Google Scholar] [CrossRef]
  56. Lammers, L.N.; Rasmussen, H.; Adilman, D.; deLemos, J.L.; Zeeb, P.; Larson, D.G.; Quicksall, A.N. Groundwater uranium stabilization by a metastable hydroxyapatite. Appl. Geochem. 2017, 84, 105–113. [Google Scholar] [CrossRef] [Green Version]
  57. Mehta, V.S.; Maillot, F.; Wang, Z.; Catalano, J.G.; Giammar, D.E. Effect of reaction pathway on the extent and mechanism of uranium (VI) immobilization with calcium and phosphate. Environ. Sci. Technol. 2016, 50, 3128–3136. [Google Scholar] [CrossRef]
  58. Chen, Y.; Feng, Q.; Zhang, G.; Liu, D.; Liu, R. Effect of sodium pyrophosphate on the reverse flotation of dolomite from apatite. Minerals 2018, 8, 278. [Google Scholar] [CrossRef] [Green Version]
  59. Wen, H.; Pan, Z.; Giammar, D.; Li, L. Enhanced Uranium Immobilization by Phosphate Amendment under Variable Geochemical and Flow Conditions: Insights from Reactive Transport Modeling. Environ. Sci. Technol. 2018, 52, 5841–5850. [Google Scholar] [CrossRef] [PubMed]
  60. Borovec, Z.; Kribek, B.; Tolar, V. Sorption of uranyl by humic acids. Chem. Geol. 1979, 27, 39–46. [Google Scholar] [CrossRef]
  61. Lenhart, J.J.; Cabaniss, S.E.; MacCarthy, P.; Honeyman, B.D. Uranium (VI) complexation with citric, humic and fulvic acids. Radiochim. Acta 2000, 88, 345–354. [Google Scholar] [CrossRef]
  62. Pompe, S.; Schmeide, K.; Bubner, M.; Geipel, G.; Heise, K.H.; Bernhard, G.; Nitsche, H. Investigation of humic acid complexation behavior with uranyl ions using modified synthetic and natural humic acids. Radiochim. Acta 2000, 88, 553–558. [Google Scholar] [CrossRef]
  63. Saito, T.; Nagasaki, S.; Tanaka, S. Evaluation of the complexation behavior between humic acid and UO22+ with fluorescence spectroscopy and its mixture analysis. Radiochim. Acta 2002, 90, 27–33. [Google Scholar] [CrossRef]
  64. Sachs, S.; Brendler, V.; Geipel, G. Uranium (VI) complexation by humic acid under neutral pH conditions studied by laser-induced fluorescence spectroscopy. Radiochim. Acta 2007, 95, 103–110. [Google Scholar] [CrossRef]
  65. Pompe, S.; Brachmann, A.; Bubner, Μ.; Geipel, G.; Heise, Κ.H.; Bernhard, G.; Nitsche, H. Determination and Comparison of Uranyl Complexation Constants with Natural and Model Humic Acids. Radiochim. Acta 1998, 89–96. [Google Scholar] [CrossRef]
  66. Tran, E.L.; Teutsch, N.; Klein-BenDavid, O.; Kersting, A.B.; Zavrin, M.; Weisbrod, N. Radionuclide transport in brackish water through chalk fractures. Water Res. 2019, 163, 114886. [Google Scholar] [CrossRef]
  67. Schmeide, K.; Fritsch, K.; Lippold, H. Retention of Radionuclides Relevant for Final Disposal in Natural Clay Rock and Saline Systems; Subproject 2. Geochemical Behavior and Transport of Radionuclides in Saline Systems in the Presence of Repository-Relevant Organics, Final Report; Institut für Kernchemie, Johannes Gutenberg-Universität Mainz: Mainz, Germany, 2016; pp. 1–169. [Google Scholar]
  68. Poulton, S.W.; Canfield, D.E. Development of a sequential extraction procedure for iron: Implications for iron partitioning in continentally derived particulates. Chem. Geol. 2005, 214, 209–221. [Google Scholar] [CrossRef]
  69. Roshan, H.; Al-Yaseri, A.Z.; Sarmadivaleh, M.; Iglauer, S. On Wettability of Shale Rocks. J. Colloid Interf. Sci. 2016, 475, 104–111. [Google Scholar] [CrossRef]
  70. Larson, T.E.; Heikoop, J.M.; Perkins, G.; Chipera, S.J.; Hess, M.A. Pretreatment technique for siderite removal for organic carbon isotope and C:N ratio analysis in geological samples. Rapid Commun. Mass Spectrom 2008, 22, 865–872. [Google Scholar] [CrossRef] [PubMed]
Figure 1. Sorption and desorption results for the HOP-5 phosphorite. Green, blue, and red colored full circles represent results for desorption steps 1, 2, and 3, respectively. Black full circles represent the sorption data. Solid curves show GC SCM (red) and Langmuir isotherm (black) fits to the data, and the dashed black curve is the CA SCM prediction discussed in Section 4.1.
Minerals 12 00728 g001
Figure 2. Sorption and desorption results for the OS-3 bituminous limestone marl. Green, blue, and red colored full circles represent results for desorption steps 1, 2, and 3, respectively. Black full circles represent the sorption data. Solid curves show GC SCM (red) and Langmuir isotherm (black) fits to the data.
Minerals 12 00728 g002
Figure 3. Sorption and desorption results for the CK-6 oolitic chalk. Symbols for desorption steps 1, 2, and 3 and the solid curves for GC SCM and Langmuir isotherm fits to the data are identical to those used in Figure 1 and Figure 2 above.
Minerals 12 00728 g003
Figure 4. Sorption and desorption results for the SS-10 sandstone. Figure axes and symbols for desorption steps 1, 2, and 3 and the solid curves for GC SCM and Langmuir isotherm fits to the data are identical to those used in Figure 1, Figure 2 and Figure 3 above. Note that the negative S values for desorption steps 2 and 3 are unrealistic and are attributed to additive experimental errors and uncertainties (see text).
Minerals 12 00728 g004
Figure 5. Back-scattered SEM images of (A) phosphorite sample HOP-5, and (B) bituminous limestone marl sample OS-3. Both show distinct textural, crystallization, and alteration features detailed in Appendix E and Appendix F. (A) HOP-5 sample with fine-grained aggregate clusters of mixed mineral phases of apatite, calcite, and amorphous organic matter (spot a; Figure A15) (scale bar is 2 µm). (B) OS-3 with coarser calcite crystal (spot a; Figure A13) with signs of dissolution, and fine-grained aggregate clusters of secondary minerals (spots b, c, d, and e) identified as containing a mixture of calcite, dolomite, and silica, with minor amounts of apatite, feldspar, and clay (scale bar is 10 µm).
Minerals 12 00728 g005
Table 1. Ionic components of the synthetic surface water (SSW) used in this study. The post-equilibration SSW chemistry is shown after equilibration of 20 mL of SSW with 2 g of crushed rock. HOP-5 is a phosphorite, OS-3 is a bituminous limestone marl, SS-10 is a sandstone, and CK-6 is an oolitic chalk. Alkalinity is represented as mg/L CaCO3. (ND = non-detected).
Ionic SpeciesSSWPost Equilibration
(mg/L)CompositionHOP-5OS-3SS-10CK-6
Ba0.010.120.0290.230.08
Ca36.035.159.034.126.5
CrND0.0020.0030.0030.003
Fe0.013NDNDNDND
K9.110.79.58.68.9
Mg12.012.417.211.012.2
MnNDNDNDNDND
Na73.090.790.291.5110.3
Si20.825.028.220.520.1
Sr0.01.230.882.690.24
ZnND0.0320.0360.0360.034
Br0.00.0130.0200.0150.011
Cl117.6172.5154.4141.5157.0
FND0.280.320.760.50
NO332.937.832.834.132.5
PO4NDNDNDNDND
SO42−52.8114.0164.975.089.9
Alkalinity149126–138136135131
pH7.6–8.17.7–7.97.67.97.7
Table 2. Percentage distribution of aqueous uranium species in equilibrium with SSW and mineralogy of the four different rock types, organic-rich phosphorite (HOP-5), bituminous limestone marl (OS-3), sandstone (SS-10), and chalk (CK-6), using 5 mg/L of uranium; also shown are saturation indices for uranyl oxide and hydroxide.
Uranium Species%HOP-5OS-3SS-10CK-6
CaUO2(CO3)3−260.150.059.062.9
Ca2UO2(CO3)335.247.637.932.3
MgUO2(CO3)3−22.41.21.72.5
UO2(CO3)3−41.20.50.91.3
UO2(CO3)2−21.00.30.60.9
Sum99.999.6100.199.9
Schoepite (S.I.)−2.44−4.15−3.90−3.68
UO3 (S.I.)−4.20−5.91−5.70−5.44
Table 3. Modal mineralogy and bulk major element chemistry of NE Negev lithologies, phosphorite, bituminous marl, sandstone, and chalk (500–2000 µm size fraction), as determined by qXRD and XRF. TOC and BET measurements are also shown. [LOI: loss on emission; tr: trace (measured by EL-MS)].
Modal Mineralogy qXRD, wt.% Phosphorite HOP-5Bit. Marl OS-3Sandstone SS-10Chalk CK-6
Quartz3.02.774.70.7
K-Feldspar--10.55.8--
Plagioclase--13.72.6--
Apatite76.87.6----
Pyrite----0.2--
Calcite13.944.616.283.2
Dolomite6.33.3--0.6
Clay Fraction--17.1--14.7
LOI1.6111.20.070.11
TOC (wt.%)2.011.0trtr
BET (m2/g)18.99.834.135.49
Select XRF Data
Fe2O3 %0.160.681.820.67
P2O5 %29.222.670.220.41
CaO %52.736.115.750.3
SiO2 %5.1111.863.84.3
Table 4. GC SCM and Langmuir isotherm parameters associated with the best fits to the data sets for each rock type (model curves shown in Figure 1, Figure 2, Figure 3 and Figure 4).
Rock TypeGC SCMLangmuir Isotherm
Log (β)[XOH] mg/kg RockKL L/kgSmax mg/kg Rock
HOP-55.8533320.1833610
OS-36.40145.51.106146.8
CK-66.3459.10.58962.9
SS-106.2128.50.42128.7
Table 5. Estimated phase contributions to Langmuir isotherm parameters Smax and KL and GC SCM parameters [XOH] and log (β) per unit mass fraction of phase abundance.
Adsorbing PhaseGC SCM [XOH] mg/kg/Mass FracGC SCM log (β) Mass FractionLangmuir Smax mg/kg/Mass FracLangmuir KL L/kg/Mass Frac
Apatite43355.8546970.183
Fe2O315666.2115740.421
Clay3316.353560.597
Org. Carbon14676.4014801.11
N.B.: For organic carbon contents of 2.0% or less, the mass fraction contributions for apatite, Fe2O3, and clays should be summed without the organic carbon contribution; for organic carbon mass fractions around 10% or more (bituminous rocks), only the organic carbon contribution should be used. Rocks between 2.0% and 10% organic carbon should be experimentally evaluated in more detail.
Publisher’s Note: MDPI stays neutral with regard to jurisdictional claims in published maps and institutional affiliations.

