Probing the Local Atomic Structure of In and Cu in Sphalerite by XAS Spectroscopy Enhanced by Reverse Monte Carlo Algorithm

 and
and
Abstract
:1. Introduction
2. Materials and Methods
2.1. Sample Preparation and Characterization
2.2. X-ray Absorption Spectroscopy (XAS) Measurements
2.3. Density Functional Theory (DFT) Calculations
2.4. Reverse Monte Carlo (RMC) EXAFS Spectra Fitting
2.5. XANES Spectra Calculation
3. Results
3.1. DFT Calculations
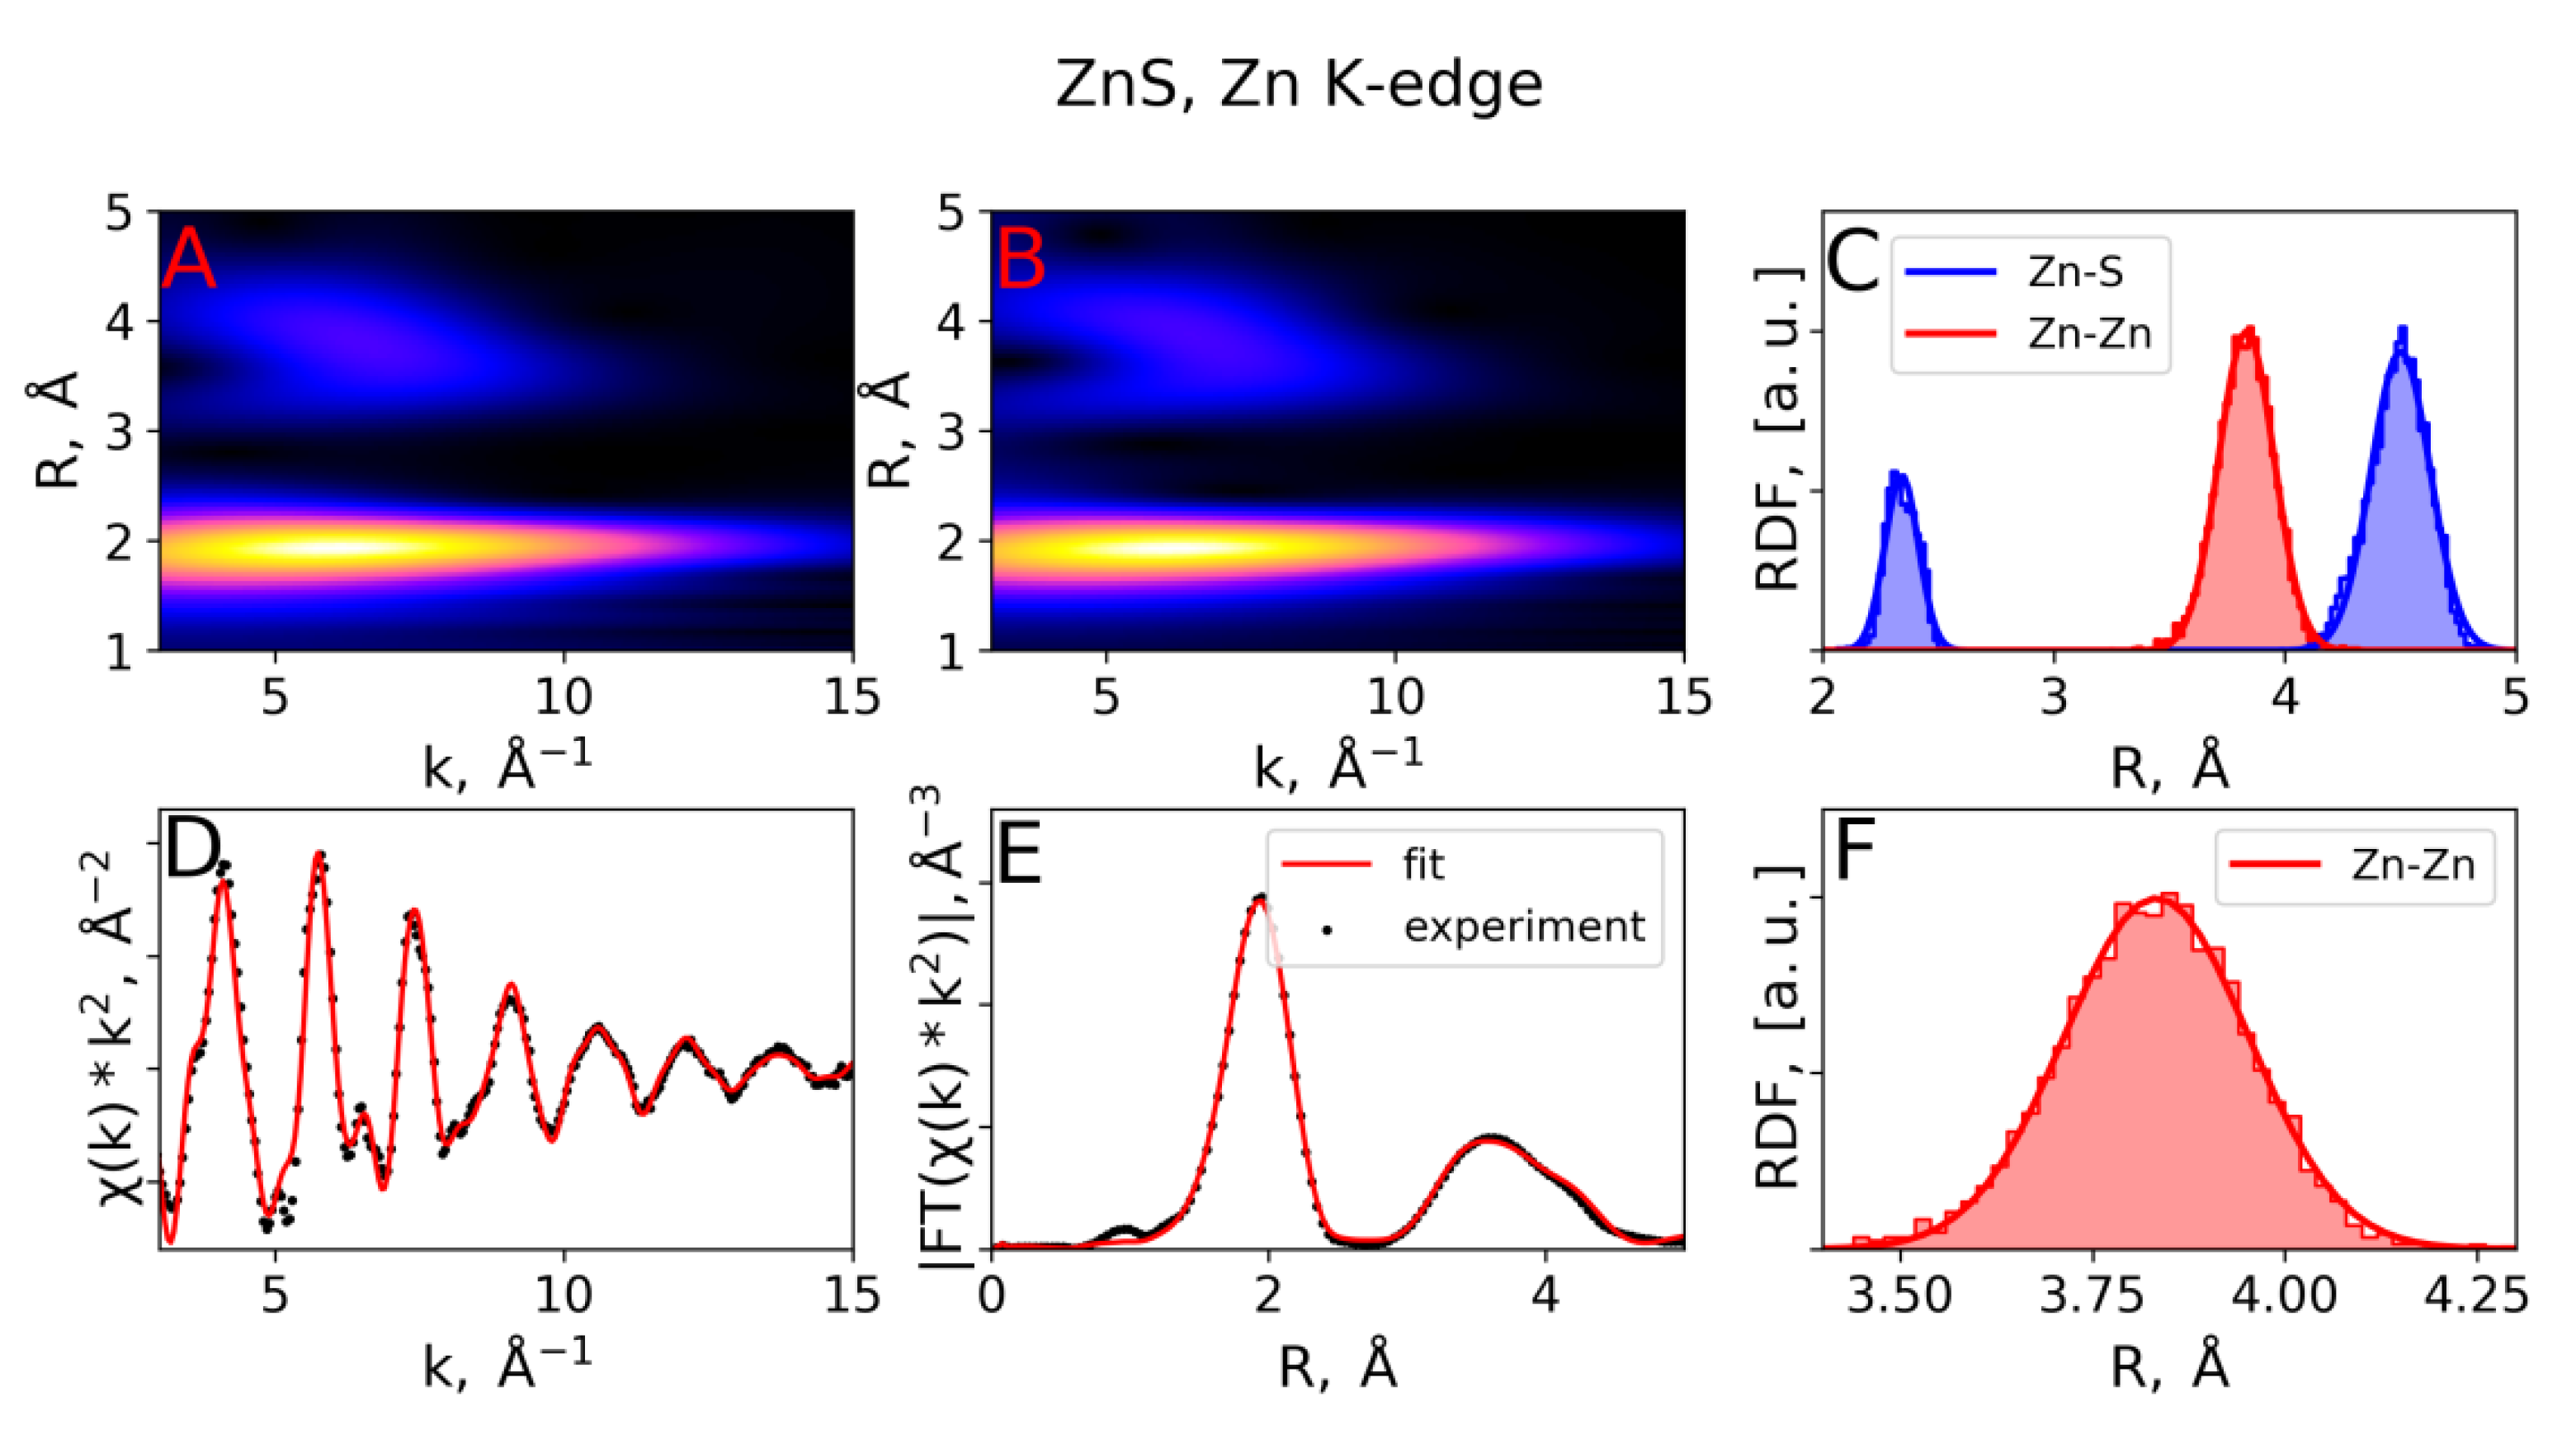
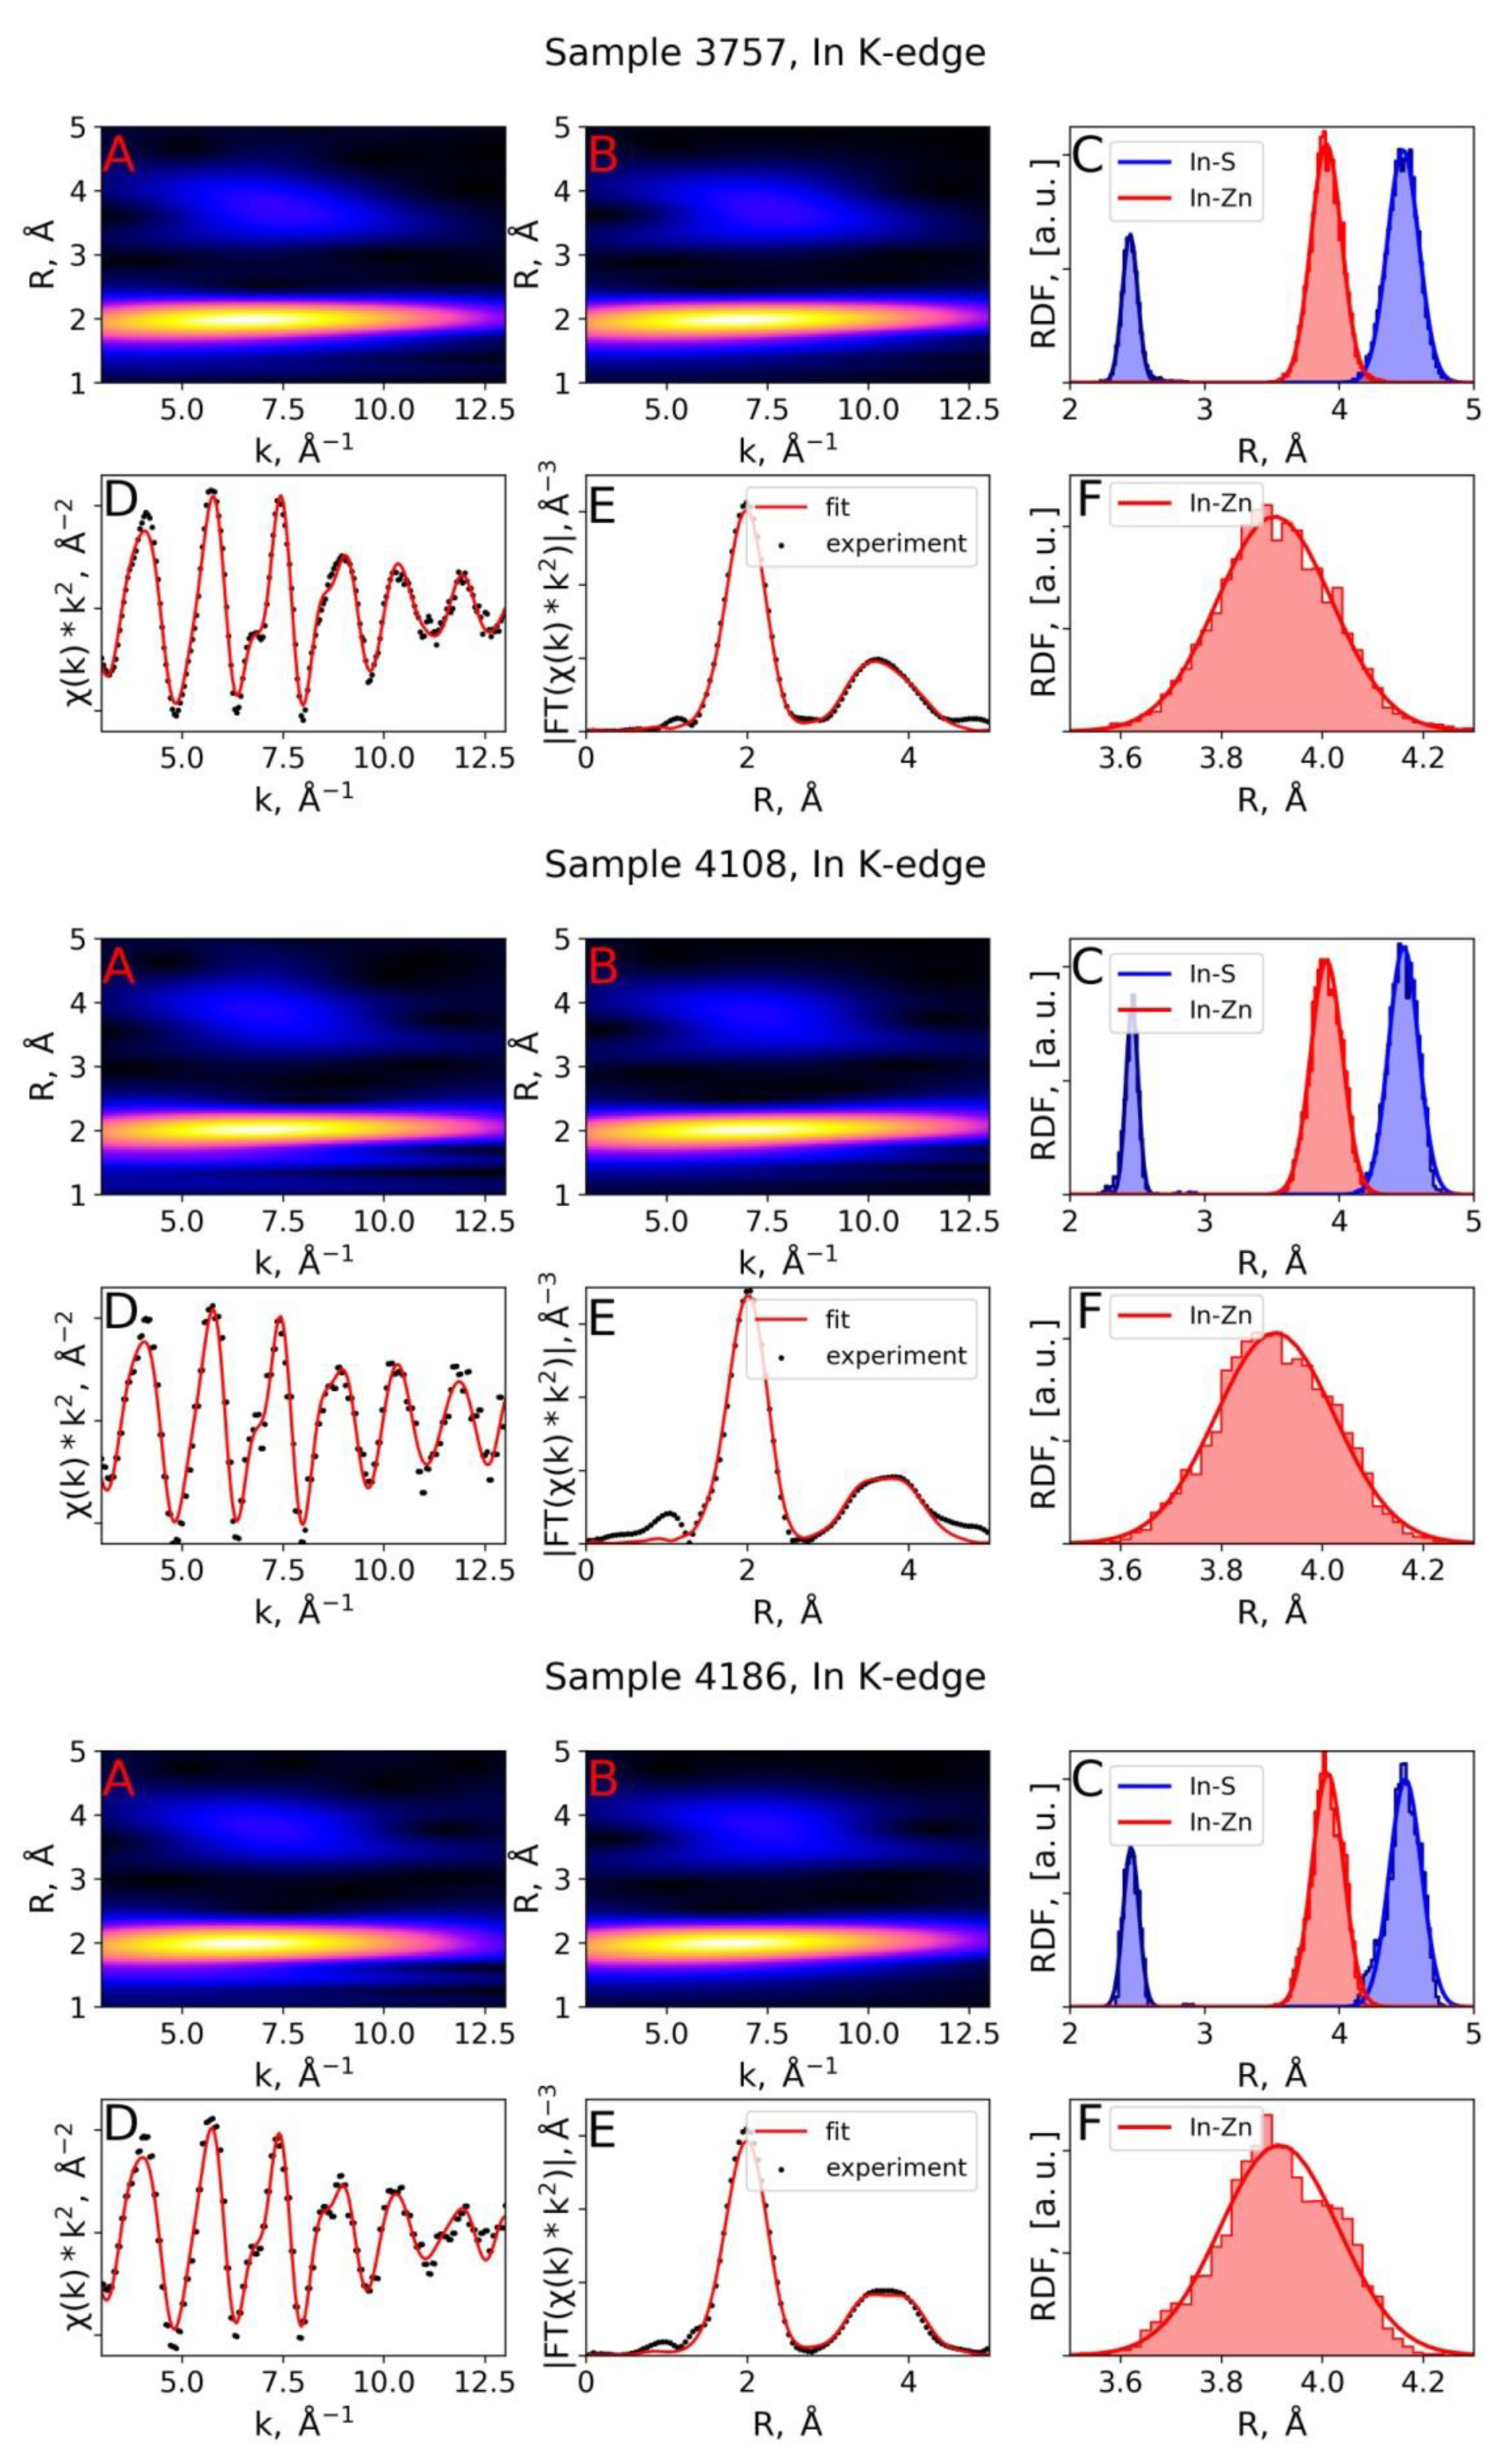
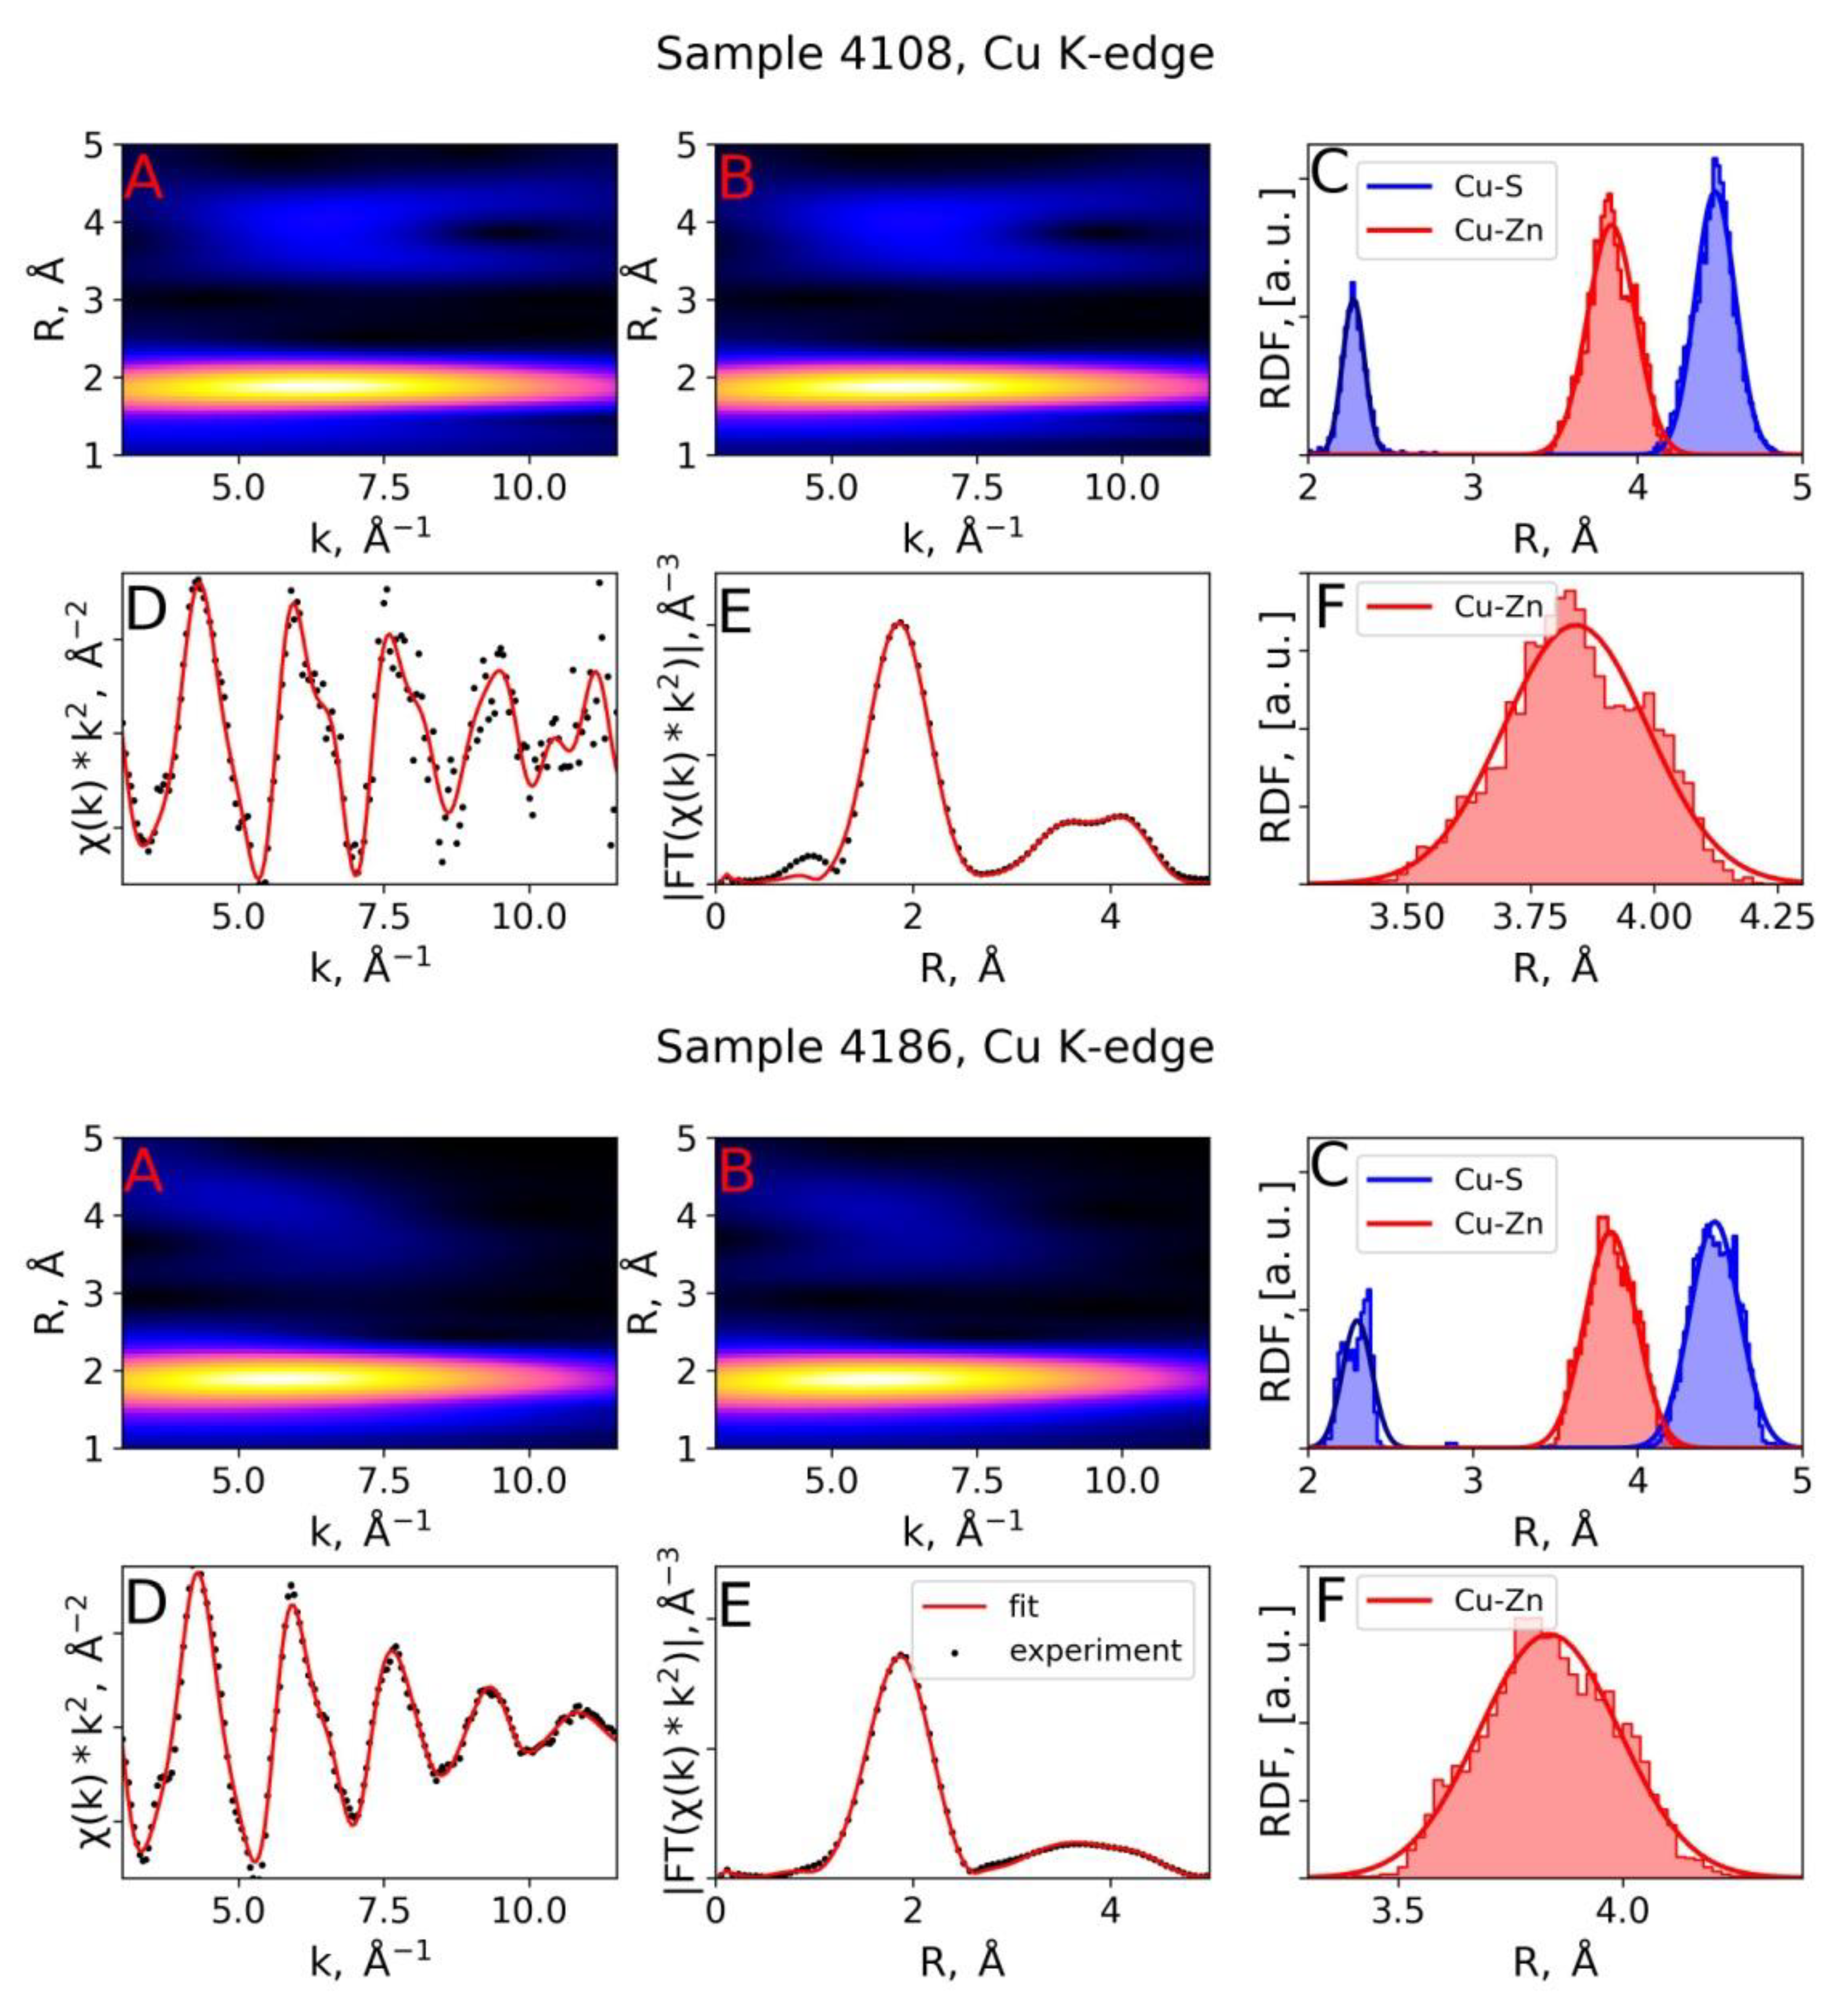
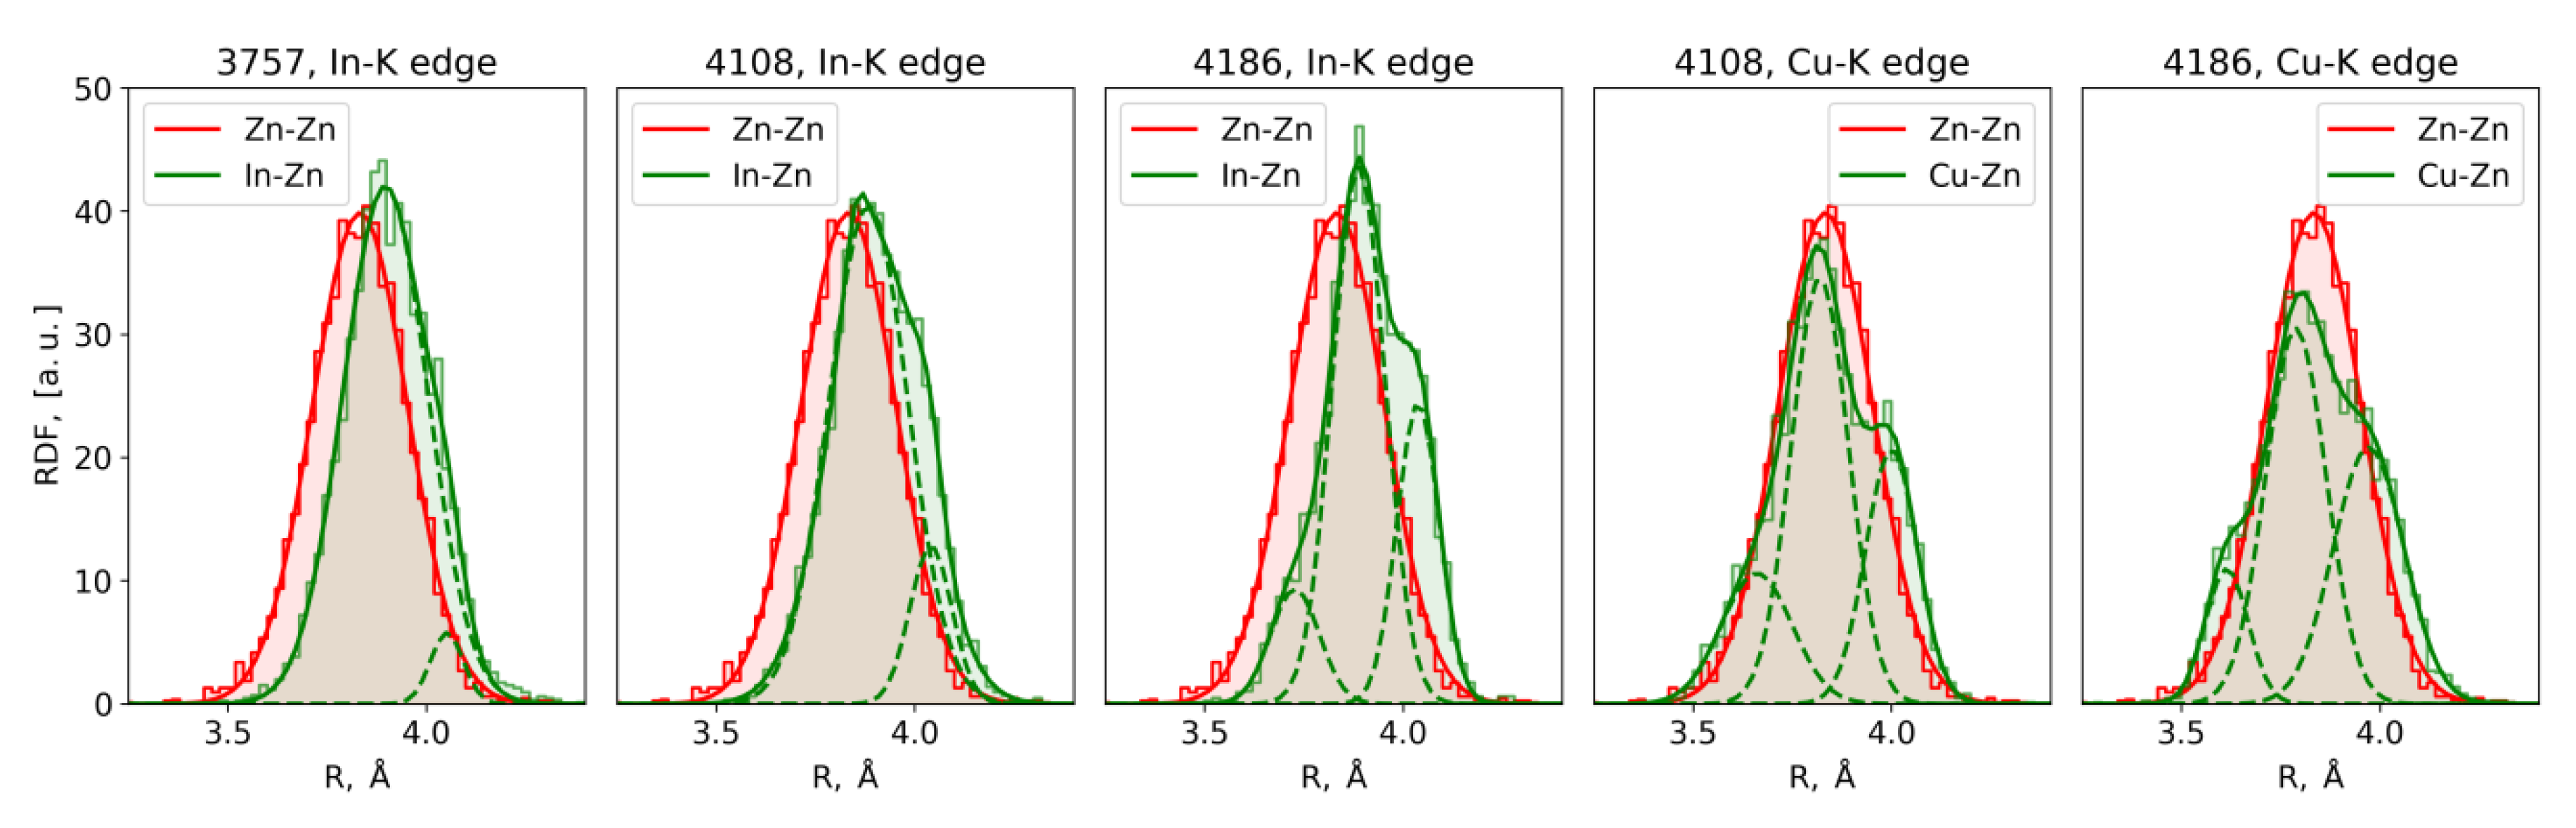
3.2. EXAFS Spectra Analysis (RMC-EXAFS)
3.3. XANES Spectra Simulation
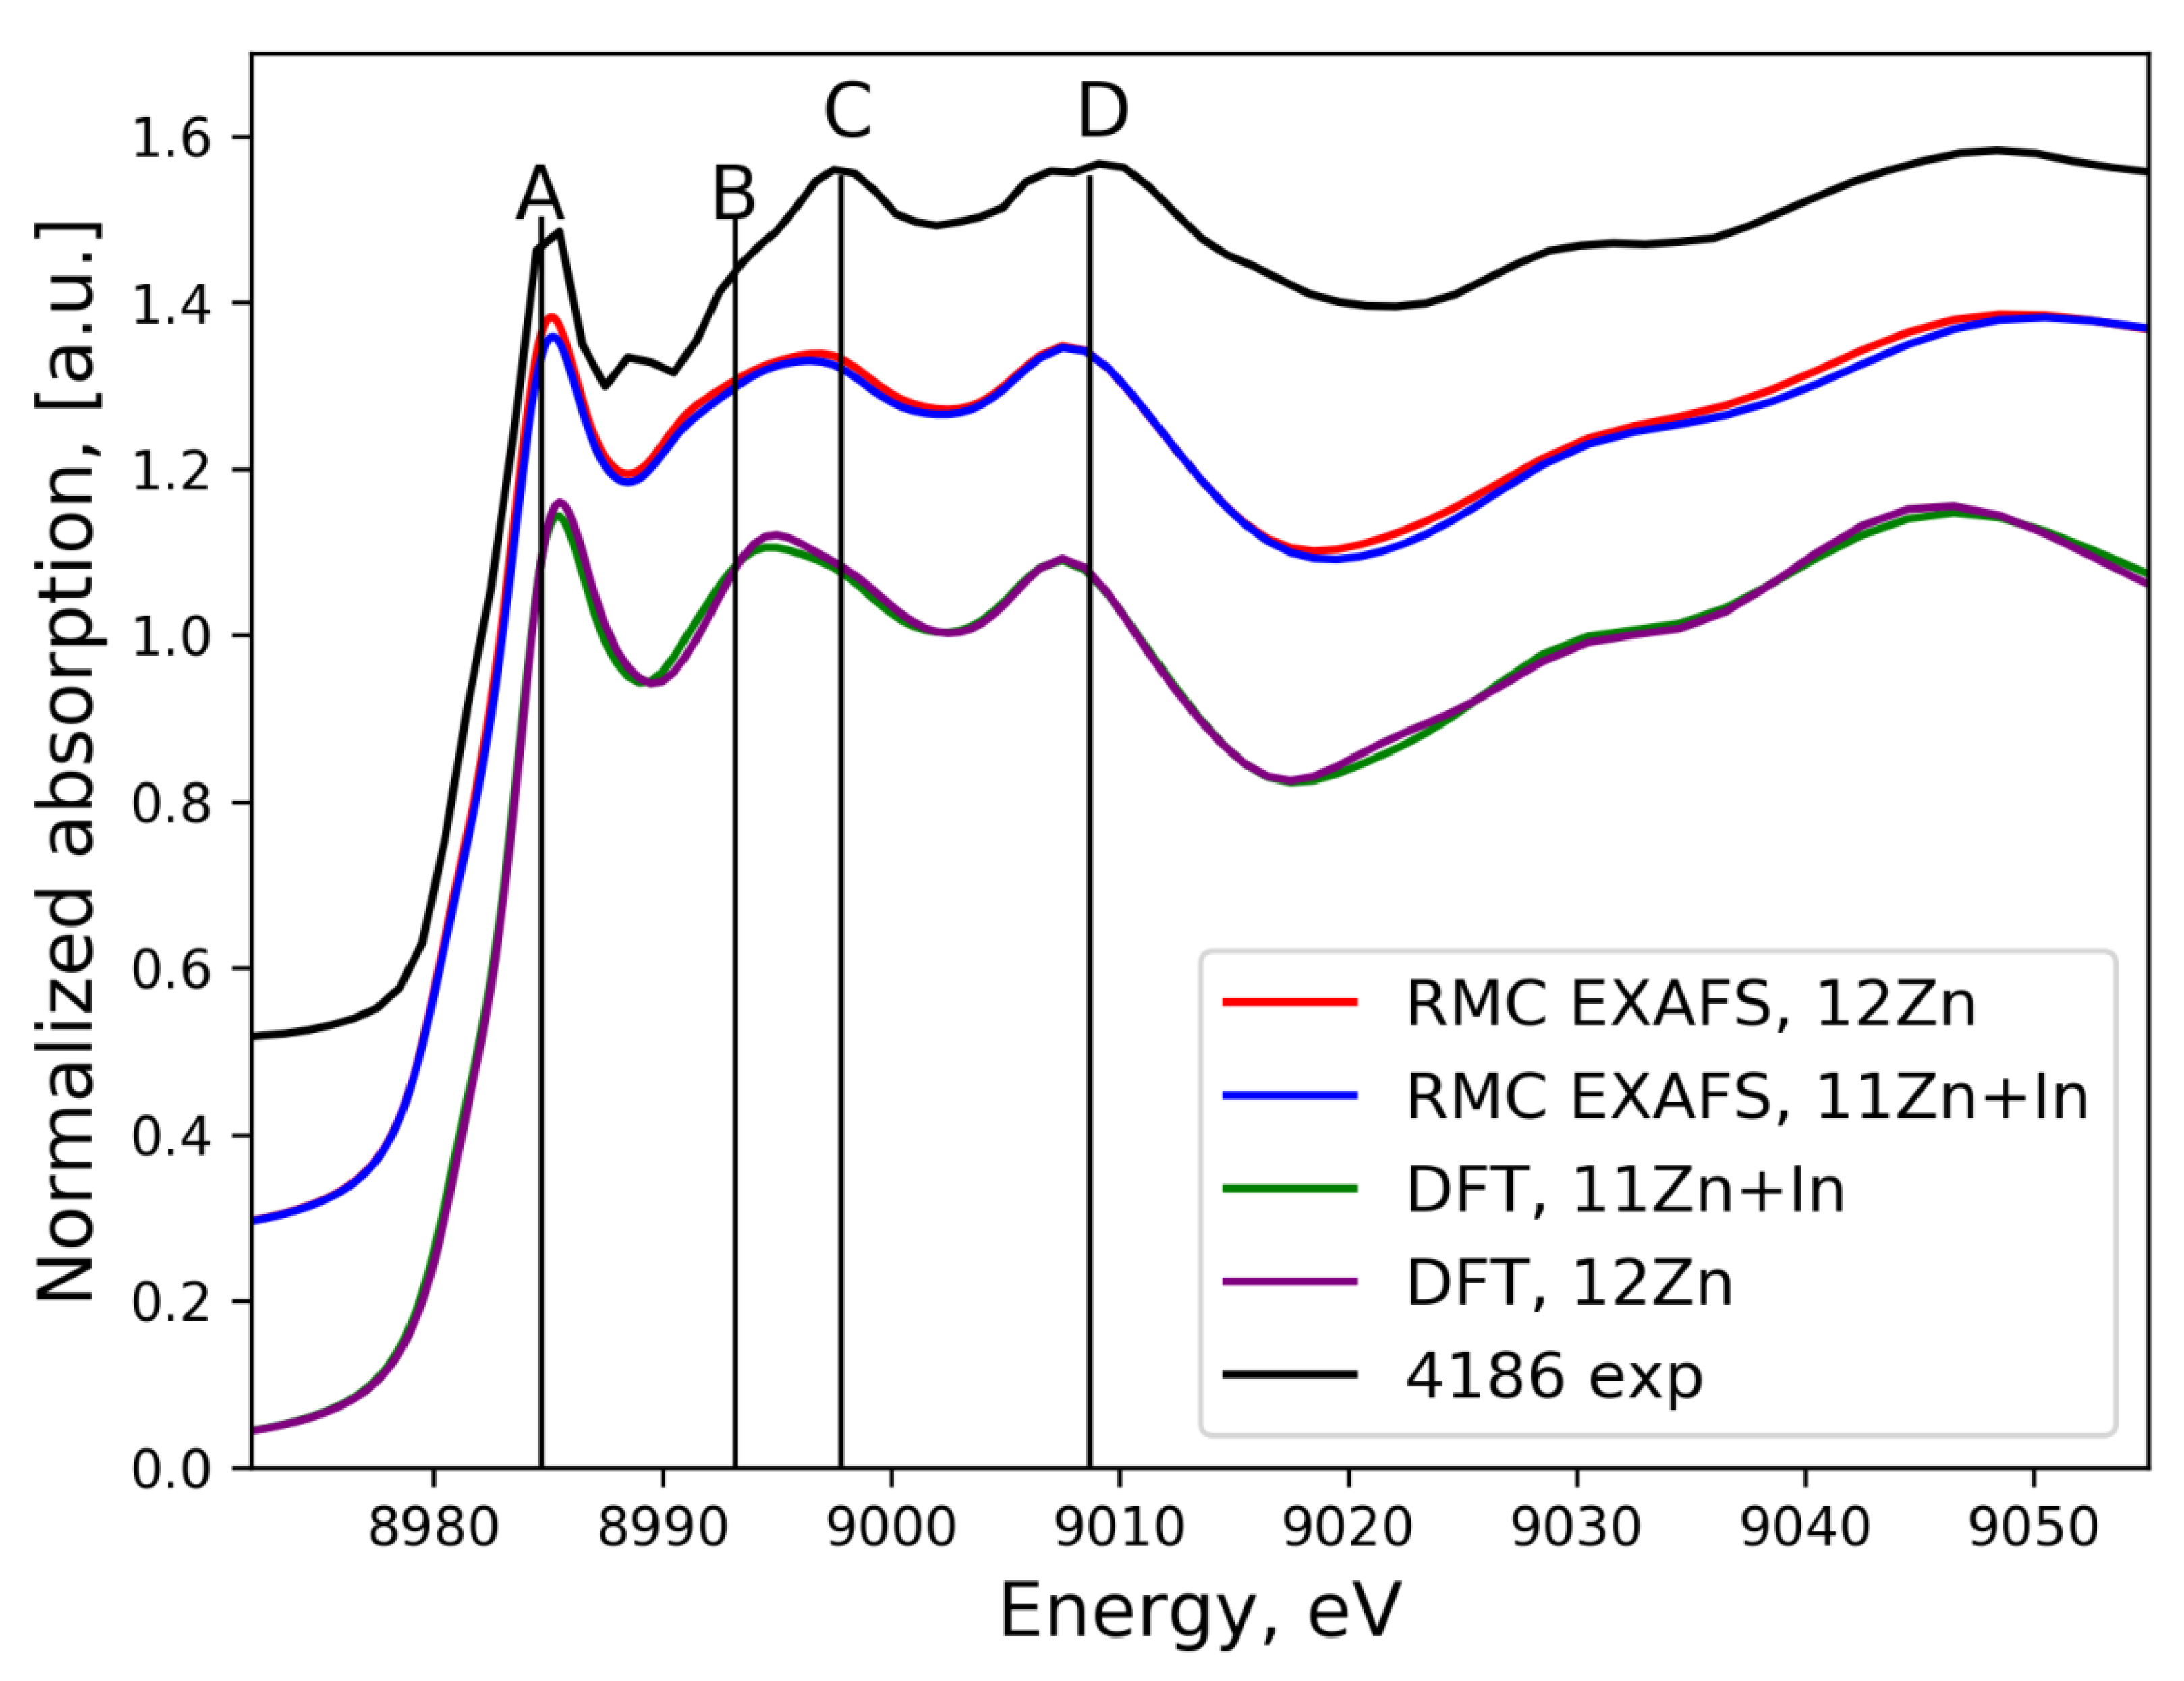
3.3.1. In K-Edge
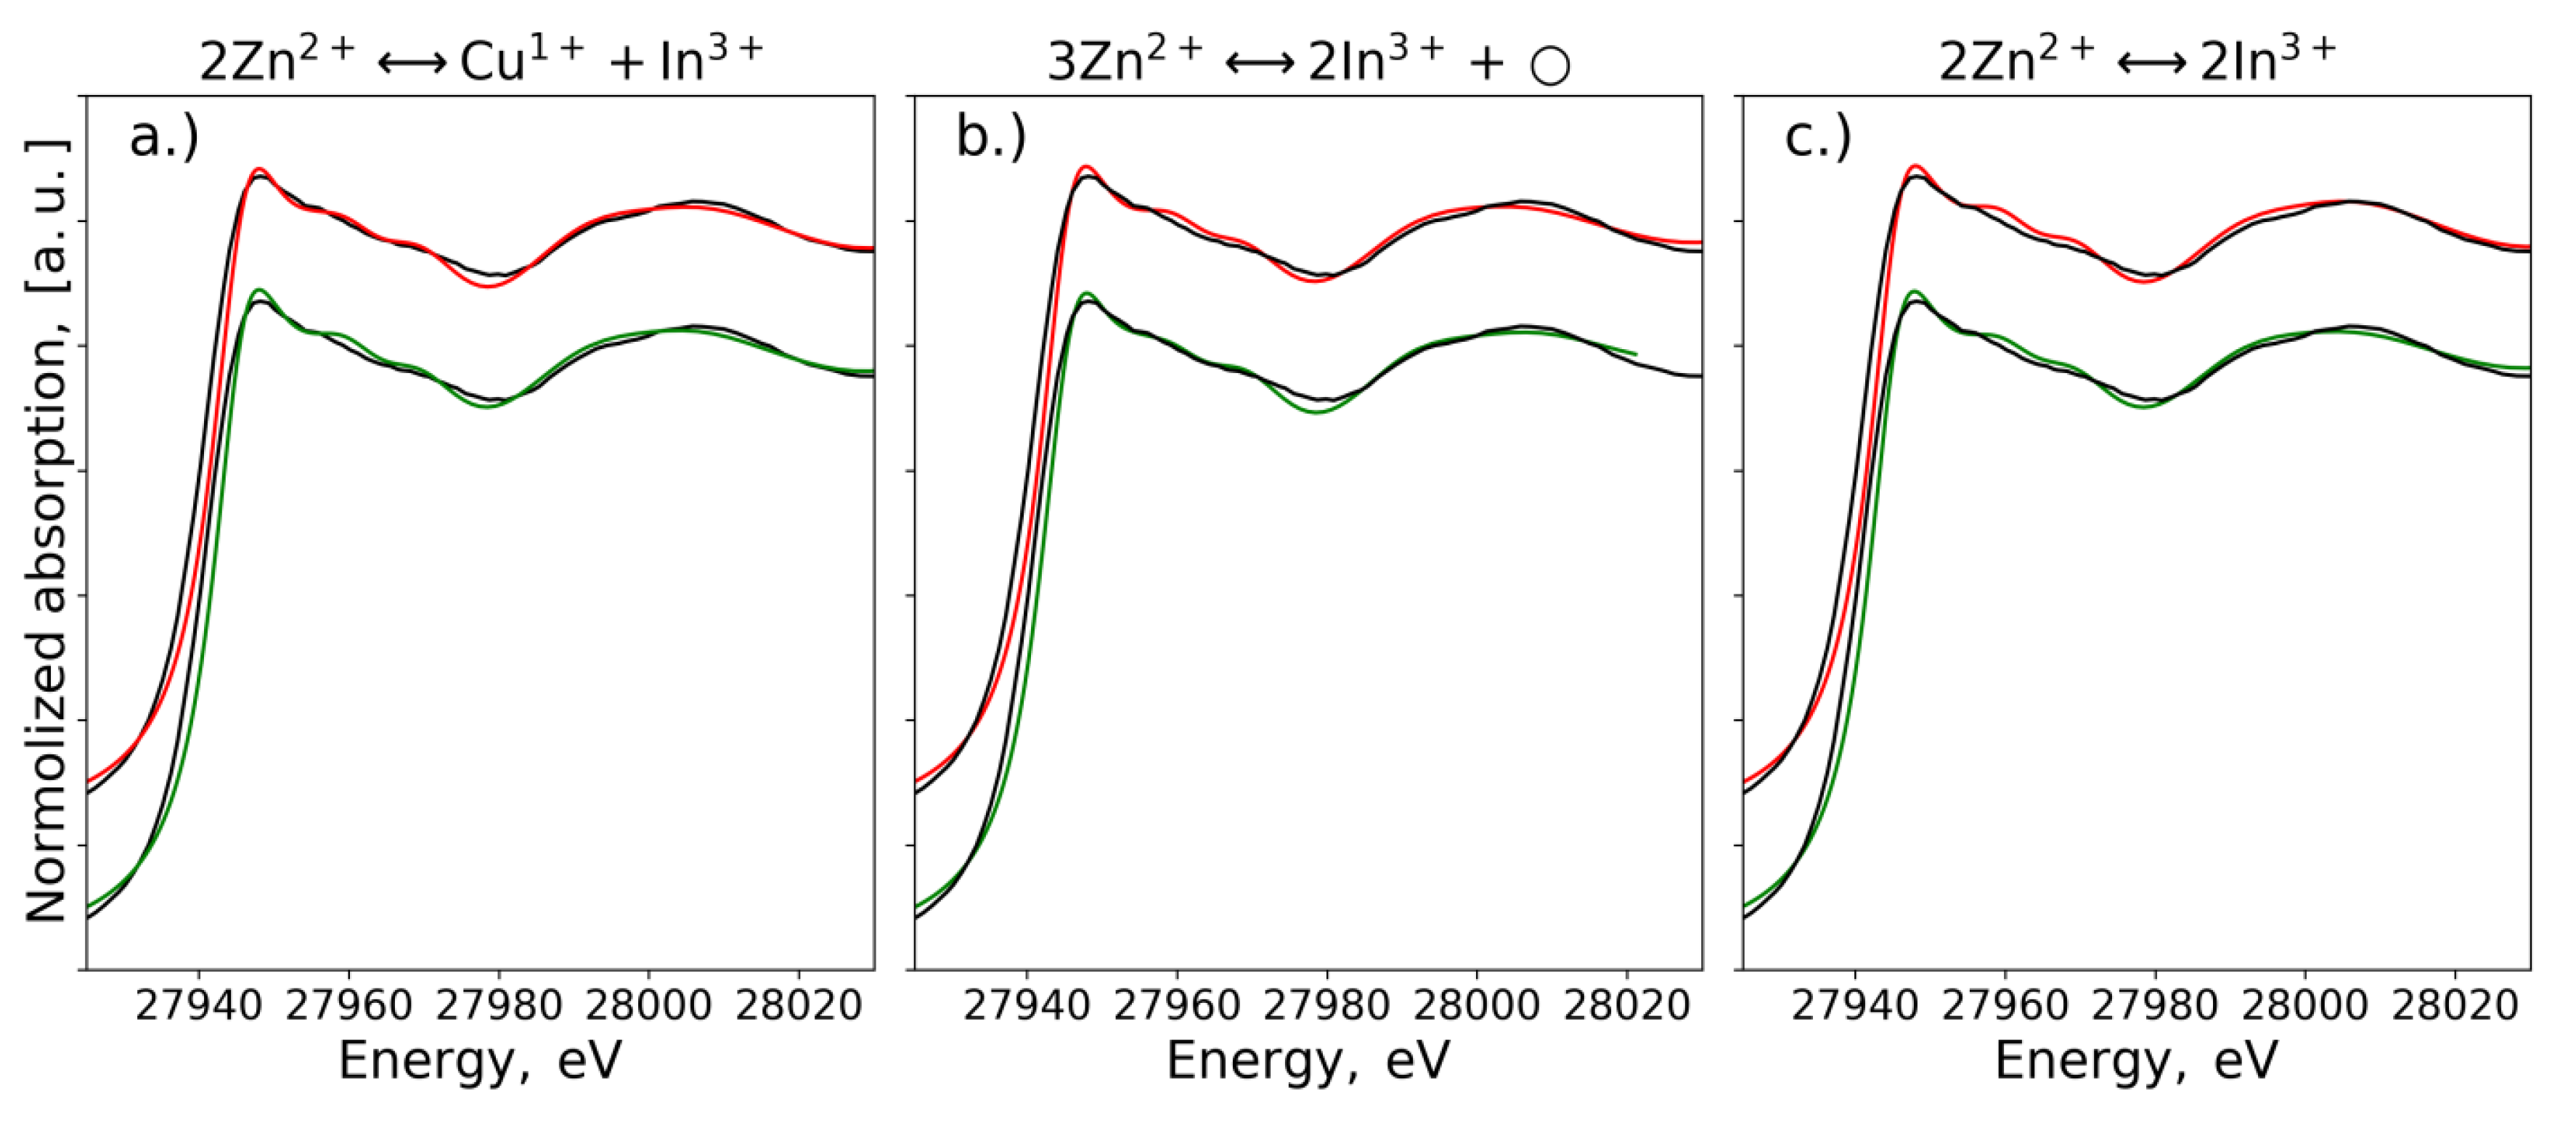
3.3.2. Cu K-Edge
4. Discussion
5. Conclusions
Supplementary Materials
Author Contributions
Funding
Acknowledgments
Conflicts of Interest
References
- Filimonova, O.N.; Trigub, A.L.; Tonkacheev, D.E.; Nickolsky, M.S.; Kvashnina, K.O.; Chareev, D.A.; Chaplygin, I.V.; Kovalchuk, E.V.; Lafuerza, S.; Tagirov, B.R. Substitution mechanisms in In-, Au-, and Cu-bearing sphalerites studied by X-ray absorption spectroscopy of synthetic compounds and natural minerals. Mineral. Mag. 2019, 83, 435–451. [Google Scholar] [CrossRef]
- Trofimov, N.D.; Trigub, A.L.; Tagirov, B.R.; Filimonova, O.N.; Evstigneeva, P.V.; Chareev, D.A.; Kvashnina, K.O.; Nickolsky, M.S. The State of Trace Elements (In, Cu, Ag) in Sphalerite Studied by X-Ray Absorption Spectroscopy of Synthetic Minerals. Minerals 2020, 10, 640. [Google Scholar] [CrossRef]
- Ravel, B.; Newville, M. ATHENA, ARTEMIS, HEPHAESTUS: Data analysis for X-ray absorption spectroscopy using IFEFFIT. J. Synchrotron Radiat. 2005, 12, 537–541. [Google Scholar] [CrossRef] [PubMed] [Green Version]
- Kuzmin, A.; Timoshenko, J.; Kalinko, A.; Jonane, I.; Anspoks, A. Treatment of disorder effects in X-ray absorption spectra beyond the conventional approach. Radiat. Phys. Chem. 2020, 175. [Google Scholar] [CrossRef] [Green Version]
- Harada, M.; Ikegami, R.; Kumara, L.S.R.; Kohara, S.; Sakata, O. Reverse Monte Carlo modeling for local structures of noble metal nanoparticles using high-energy XRD and EXAFS. RSC Adv. 2019, 9, 29511–29521. [Google Scholar] [CrossRef] [Green Version]
- Kompch, A.; Sahu, A.; Notthoff, C.; Ott, F.; Norris, D.J.; Winterer, M. Localization of Ag dopant atoms in cdse nanocrystals by reverse Monte Carlo analysis of EXAFS Spectra. J. Phys. Chem. C 2015, 119, 18762–18772. [Google Scholar] [CrossRef]
- Kraynis, O.; Timoshenko, J.; Huang, J.; Singh, H.; Wachtel, E.; Frenkel, A.I.; Lubomirsky, I. Modeling strain distribution at the atomic level in doped ceria films with extended X-ray absorption fine structure spectroscopy. Inorg. Chem. 2019. [Google Scholar] [CrossRef]
- Timoshenko, J.; Kuzmin, A.; Purans, J. EXAFS study of hydrogen intercalation into ReO3 using the evolutionary algorithm. J. Phys. Condens. Matter 2014, 26, 055401. [Google Scholar] [CrossRef] [Green Version]
- Giannozzi, P.; Baroni, S.; Bonini, N.; Calandra, M.; Car, R.; Cavazzoni, C.; Ceresoli, D.; Chiarotti, G.L.; Cococcioni, M.; Dabo, I.; et al. QUANTUM ESPRESSO: A modular and open-source software project for quantum simulations of materials. J. Phys. Condens. Matter 2009, 21, 395502. [Google Scholar] [CrossRef]
- Blöchl, P.E. Projector augmented-wave method. Phys. Rev. B 1994, 50, 17953–17979. [Google Scholar] [CrossRef] [Green Version]
- Kresse, G. From ultrasoft pseudopotentials to the projector augmented-wave method. Phys. Rev. B 1999, 59, 1758–1775. [Google Scholar] [CrossRef]
- Tagirov, B.R.; Trigub, A.L.; Kvashnina, K.O.; Shiryaev, A.A.; Chareev, D.A.; Nickolsky, M.S.; Abramova, V.D.; Kovalchuk, E.V. Covellite CuS as a matrix for “invisible” gold: X-ray spectroscopic study of the chemical state of Cu and Au in synthetic minerals. Geochim. Cosmochim. Acta 2016, 191, 58–69. [Google Scholar] [CrossRef]
- Trigub, A.L.; Tagirov, B.R.; Kvashnina, K.O.; Chareev, D.A.; Nickolsky, M.S.; Shiryaev, A.A.; Baranova, N.N.; Kovalchuk, E.V.; Mokhov, A.V. X-ray spectroscopy study of the chemical state of “invisible” Au in synthetic minerals in the Fe-As-S system. Am. Mineral. 2017, 102, 1057–1065. [Google Scholar] [CrossRef]
- Maeta, T.; Sueoka, K. Density functional theory calculations of stability and diffusion mechanisms of impurity atoms in Ge crystals. J. Appl. Phys. 2014, 116, 073505. [Google Scholar] [CrossRef]
- Mcgreevy, R.L.; Pusztai, L. Reverse Monte Carlo simulation: A new technique for the determination of disordered structures. Mol. Simul. 1988, 1, 359–367. [Google Scholar] [CrossRef]
- Timoshenko, J.; Kuzmin, A.; Purans, J. Reverse Monte Carlo modeling of thermal disorder in crystalline materials from EXAFS spectra. Comput. Phys. Commun. 2012, 183, 1237–1245. [Google Scholar] [CrossRef]
- Funke, H.; Scheinost, A.; Chukalina, M. Wavelet analysis of extended R-ray absorption fine structure data. Phys. Rev. B 2005, 71, 094110. [Google Scholar] [CrossRef]
- Timoshenko, J.; Kuzmin, A. Wavelet data analysis of EXAFS spectra. Comput. Phys. Commun. 2009, 180, 920–925. [Google Scholar] [CrossRef]
- Ankudinov, A.L.; Ravel, B.; Rehr, J.J.; Conradson, S.D. Real-space multiple-scattering calculation and interpretation of R-ray-absorption near-edge structure. Phys. Rev. B 1998, 58, 7565–7576. [Google Scholar] [CrossRef] [Green Version]
- Cicco, A.D.; Trapananti, A. Reverse Monte Carlo refinement of molecular and condensed systems by R-ray absorption spectroscopy. J. Phys. Condens. Matter 2005, 17, S135–S144. [Google Scholar] [CrossRef]
- Joly, Y. X-ray absorption near-edge structure calculations beyond the muffin-tin approximation. Phys. Rev. B 2001, 63, 125120. [Google Scholar] [CrossRef]
- Guda, S.A.; Guda, A.A.; Soldatov, M.A.; Lomachenko, K.A.; Bugaev, A.L.; Lamberti, C.; Gawelda, W.; Bressler, C.; Smolentsev, G.; Soldatov, A.V.; et al. Optimized finite difference method for the Full-Potential XANES simulations: Application to molecular adsorption geometries in MOFs and metal–ligand intersystem crossing transients. J. Chem. Theory Comput. 2015, 11, 4512–4521. [Google Scholar] [CrossRef]
- Hedin, L.; Lundqvist, I.B.; Lundqvist, S. Local exchange-correlation potentials. Solid State Commun. 1971, 9, 537–541. [Google Scholar] [CrossRef]
- Bunău, O.; Joly, Y. Self-consistent aspects of R-ray absorption calculations. J. Phys. Condens. Matter 2009, 21, 345501. [Google Scholar] [CrossRef] [PubMed]


| System | EEF, eV |
|---|---|
| ZnS + Cu + In (In and Cu atoms are in neighboring sites) | 0.18 |
| ZnS + Cu + In (In and Cu atoms are placed far from each other) | 0.28 |
| ZnS + 2In, (2 In atoms are placed far from each other | 2.99 |
| ZnS + 2In, (2 In atoms are in the nearest positions) | 3.06 |
| ZnS + 2In + □, (In atoms and vacancy are placed far from each other) | 0.89 |
| ZnS + 2In + □, (In atoms and Zn vacancy are placed in the nearest positions) | 0.35 |
| Experiment | Fitting Procedure | Coordination Spheres Around Absorbing Atoms | |||||||
|---|---|---|---|---|---|---|---|---|---|
| S | Zn | In | S | ||||||
| R,Å | σ2*103, Å2 | R,Å | σ2*103, Å2 | R,Å | σ2*103,Å2 | R,Å | σ2*103,Å2 | ||
| ZnS, Zn K-edge | RMC | 2.34 | 5.3 | 3.83 | 14.4 | - | - | 4.50 | 16.1 |
| IFEFFIT, [2] | 2.34 | 5.0 | 3.85 | 17.0 | - | - | 4.46 | 15.0 | |
| Sample 3757, In K-edge | RMC | 2.45 | 3.3 | 3.91 | 13.0 | - | - | 4.48 | 13.7 |
| IFEFFIT, [2] | 2.45 | 4.0 | 3.91 | 14.0 | - | - | 4.48 | 14.0 | |
| Sample 4108, In K-edge | RMC | 2.46 | 2.0 | 3.91 | 13.7 | - | - | 4.49 | 12.3 |
| IFEFFIT, [2] | 2.46 | 3.0 | 3.91 | 15.0 | - | - | 4.49 | 11.0 | |
| Sample 4186, In K-edge | RMC | 2.45 | 3.4 | 3.91 | 13.8 | - | - | 4.49 | 14.2 |
| IFEFFIT, [2] | 2.46 | 4.0 | 3.91 | 16.0 | - | - | 4.47 | 12.0 | |
| Sample 4108, Cu K-edge | RMC, with In in 2nd shell | 2.28 | 4.3 | 3.84 | 21.3 | 3.87 | 8.8 | 4.47 | 14.6 |
| Sample 4108, Cu K-edge | RMC, no In in 2nd shell | 2.28 | 4.3 | 3.84 | 21.0 | - | - | 4.47 | 14.7 |
| IFEFFIT, [2] | 2.30 | 5.0 | 3.81 | 7.0 | - | - | 4.44 | 11.0 | |
| 4.01 | |||||||||
| Sample 4186, Cu K-edge | RMC, with In in 2nd shell | 2.29 | 7.5 | 3.84 | 22.5 | 3.88 | 24.3 | 4.46 | 13.4 |
| Sample 4186, Cu K-edge | RMC, no In in 2nd shell | 2.30 | 7.9 | 3.84 | 24.0 | - | - | 4.47 | 22.5 |
| Sample 4186, Cu K-edge | IFEFFIT, [2] | 2.31 | 6.0 | 3.76 | 11.0 | - | - | 4.31 | 9.0 |
| 3.92 | - | - | 4.52 | ||||||
| Parameter | 3757 In K-Edge | 4108 In K-Edge | 4186 In K-Edge | 4108 Cu K-Edge | 4186 Cu K-Edge | |||||
|---|---|---|---|---|---|---|---|---|---|---|
| RMC | [2] | RMC | [2] | RMC | [2] | RMC | [2] | RMC | [2] | |
| Centroid position, Å | 3.90 4.05 | 3.91 | 3.88 4.04 | 3.91 | 3.73 | 3.91 | 3.66 | 3.81 4.01 | 3.61 | 3.76 3.92 |
| 3.89 | 3.82 | 3.79 | ||||||||
| 4.03 | 4.00 | 3.97 | ||||||||
| Gaussian variance × 103, Å2 | 11.2 1.7 | 14.0 | 9.9 5.3 | 15.0 | 3.7 | 16.0 | 8.8 | 11.0 | 5.4 | 7.0 |
| 4.4 | 7.2 | 7.6 | ||||||||
| 2.8 | 6.5 | 8.9 | ||||||||
| Coordination number | 11.8 0.2 | 12 | 11.0 1.0 | 12 | 1.4 | 12 | 2.8 | 6.4 5.6 | 1.0 | 5.4 6.6 |
| 7.8 | 6.2 | 5.6 | ||||||||
| 2.8 | 3.0 | 5.3 | ||||||||
© 2020 by the authors. Licensee MDPI, Basel, Switzerland. This article is an open access article distributed under the terms and conditions of the Creative Commons Attribution (CC BY) license (http://creativecommons.org/licenses/by/4.0/).
Share and Cite
Trigub, A.L.; Trofimov, N.D.; Tagirov, B.R.; Nickolsky, M.S.; Kvashnina, K.O. Probing the Local Atomic Structure of In and Cu in Sphalerite by XAS Spectroscopy Enhanced by Reverse Monte Carlo Algorithm. Minerals 2020, 10, 841. https://doi.org/10.3390/min10100841
Trigub AL, Trofimov ND, Tagirov BR, Nickolsky MS, Kvashnina KO. Probing the Local Atomic Structure of In and Cu in Sphalerite by XAS Spectroscopy Enhanced by Reverse Monte Carlo Algorithm. Minerals. 2020; 10(10):841. https://doi.org/10.3390/min10100841
Chicago/Turabian StyleTrigub, Alexander L., Nikolay D. Trofimov, Boris R. Tagirov, Max S. Nickolsky, and Kristina O. Kvashnina. 2020. "Probing the Local Atomic Structure of In and Cu in Sphalerite by XAS Spectroscopy Enhanced by Reverse Monte Carlo Algorithm" Minerals 10, no. 10: 841. https://doi.org/10.3390/min10100841