From Crystals to Color: A Compendium of Multi-Analytical Data on Mineralogical Phases in Opaque Colored Glass Mosaic Tesserae

Department of Cultural Heritage, University of Bologna, via degli Ariani 1, 48121 Ravenna, Italy
*
Author to whom correspondence should be addressed.
Minerals 2020, 10(7), 609; https://doi.org/10.3390/min10070609
Submission received: 1 April 2020
/
Revised: 12 June 2020
/
Accepted: 24 June 2020
/
Published: 7 July 2020
(This article belongs to the Special Issue Minerals and Crystals in Glass)
Abstract
:This study aimed at laying the groundwork for a compendium on mineralogical phases responsible for the colors and opacity of ancient glasses, with specific reference to mosaic tesserae. Based on the awareness that a comprehensive database of these phases is currently lacking in the available literature, this compendium foresees two main objectives. The first scope was to set the basis for a well-structured database, as a reference point for scholars from different backgrounds for comparative and methodological purposes. The second goal was to provide insights on analytical methods that could be profitably used for achieving an in-depth characterization of coloring and opacifying inclusions; a tailored multi-analytical approach based on easily accessible and widespread techniques like OM, SEM-EDS, μ-Raman, and XRPD is proposed here. Micro-structural and compositional features of glass tesserae, where different types of crystalline phases were detected (Sb-based, Sn-based, Cu-based, Ca-phosphate-based) are presented in well-structured synoptic tables, following a summary on historical–archaeological information on their use.
1. Introduction
Among the most remarkable finds that archaeology has ever returned on the history of glass and the way its color was manipulated, is certainly the Tell-Umar tablet. Stored at the British Museum and excavated in Iraq, this small clay tablet is inscribed in cuneiform with a complete recipe for making red glass, “written in a slightly obscure style so as to be understood only by skilled craftsmen” and datable back to 1400–1200 BC [1,2,3]. The tablet is, therefore, a tangible evidence of how, since very ancient times, when precious stones like lapis lazuli, turquoise, amethyst, ruby, and emerald were admired and desired, artisans experimented ways to emulate their beauty by using glass, a less expensive amorphous material that could be embellished with colors and shaped into attractive forms and decorative items.
Glass is a sophisticated custodian of our material culture and, playing on words, we could say that the products of glass industry are “looking glasses” of the age in which they were made. Research on ancient glass production, manufacture, and supply has provided fascinating insights into the technology of this multifaceted and captivating material. Especially in the last decades, our knowledge of the distribution of glass across time and space has greatly increased—though several geographical and chronological gaps still exist, the development of a larger picture—focused on the definition of organizational models of ancient glass industries, the recognition of several major glass families, as well as a better understanding of trade networks—has started being defined.
Since the Bronze Age, when glass occurred as the first man-made product, the production of glass was dependent on the combination of several factors (i.e., specific technical skills, access to selected raw materials, availability of fuel, a market for the commercialization of the finished product) and models were developed to describe the ways these factors were organized. For the Bronze Age, the most widely accepted model among scholars was proposed by Pusch and Rehren [4], attested both in Mesopotamia and Egypt. It was based on several elite-attached workshops making colored glass ingots, which were, at a later stage, sent to studios working glass from different producers, in different color shades. For the Roman and Byzantine ages, the widely accepted model stated the existence of primary production sites located in Egypt and along the Levantine coast [5,6,7,8,9,10,11], settled near combustibles and raw materials, which melted tons of raw glass, were then broken into chunks and distributed to a large network of secondary production centers, processing the primary glass (as well as recycled cullet) into the final artefacts [9]. Medieval European and Islamic glass industries seem, conversely, to have been based on integrated workshops, where the production of raw glass and the forming of artefacts occurred jointly. Alongside firing technologies, glassmaking, and glassworking, raw materials have changed over centuries. Evidence has been underpinned for ancient glass being based on silica as the main component, combined with a flux to lower the melting point of silica. Basically, the main pre-industrial glass families include plant-ash glass, mineral-natron glass, lead and lead–barium glass, and wood-ash glass, each splitting into more compositional groups [12].
Research carried out in the last decades also provided sound evidence that the products of ancient glass manufacture were not, unless intentionally desired, entirely colorless. Depending on the oxidation state of the metals, the oxides naturally present in the sand, the most widespread vitrifying agent, could affect the color of the glass, imparting pale chromatic nuances that typically characterize what archaeologists and archaeometrists generally call “slightly colored” or “naturally-colored” glass. In a furnace with oxygen-rich atmosphere, Fe2O3 (Fe3+ ions) can impart a very pale yellow color to transparent glass, while if a shortage of oxygen occurs, FeO (Fe2+ ions) is responsible for an aqua-blue color, which can vary in saturation, depending on the iron concentration. Fe2+ could have been a major concern of the glassmakers if they would have attained a colorless glass—this was obtained by adding manganese or antimony oxides to the batch, which, oxidizing the iron to the ferric state, imparted a pale yellow tint to glass [12,13]. Unless intentionally added for obtaining strong green to turquoise or red and orange chromatic shades (as will be more extensively discussed later in this paper), copper oxides can also be responsible for non-intentional chromatic hues of archaeological glasses, as CuO (Cu2+ ions) can impart light green to light blue tints. Glassmakers could, therefore, also be concerned with manipulating these “undesired” chromatic effects, as it seems plausible that they intentionally chose to use one specific type of glass because they wanted to achieve a specific color tone [14]. The oxidation of ferrous iron to ferric iron with antimony or manganese oxide additives was, for instance, a common practice to decolor the glass [13].
The glass color was due to the combined chemical features and micro-structural properties. It could be either ascribable to transition metal ions acting as coloring agents, discriminating the absorption of radiation that had wavelength in the visible spectrum, or to colloidal dispersions of sub-micrometric particles of a metal in the vitreous matrix. Crystalline phases distributed in the amorphous vitreous matrix could also be responsible for the color of the glass; these inclusions act as opacifiers as well, causing diffusion phenomena of the incident radiation. Opaque colored glasses are, therefore, heterogeneous materials, made of an amorphous matrix where crystalline phases, obtained by selected raw materials exposed to specific pyro-technological processes, are dispersed [15]. As mentioned before, the opacity of glass could also be linked to these micro- and nano-crystals, responsible for the diffusion of incident radiation due to the occurrence of refraction phenomena between the vitreous matrix and the crystalline inclusions within. Basically, the compounds of a few metals (copper, cobalt, tin, antimony, lead, manganese, and iron) were employed, over three millennia, to obtain the full-range of glass colors and shades [12].
Although our understanding of technological processes underlying the coloration of glass has progressively been enhanced, i.e., [7,8,9,10,11,12,13,14,15], the current scenario still stands as a preliminary draft of a multifaceted puzzle. Issues related to raw material identification and access, reasons underpinning changes of materials and recipes over time and space, as well as the definition of when and how these compounds were added to the glass melt, still need to be fully addressed.
The study of coloring and opacifying phases in archaeological and historical glasses represents, therefore, a thought-provoking research area, since it can play a fundamental role in better understanding their production technology, as well as in drawing inferences on the provenance signatures of the identified raw materials. In-depth characterization of micro-textural features distinguishing between opaque colored glasses can, in fact, provide valuable information on raw materials and technological expedients, like furnace temperatures and times of firing.
Moving from this premise, the paper aims at creating a compendium on mineralogical phases responsible for the color and opacity of ancient glasses. The need of such a compendium stems from the consciousness that there is not, in the literature, a comprehensive database of crystalline phase detected in archaeological and historical glasses, which could be useful to scholars from different fields of study (i.e., archaeologists, art historians, material scientists, etc.) for comparative and methodological purposes. On the one hand, this compendium is conceived as the starting point for a well-structured database, reference point for scholars who will be dealing with assemblages of opaque colored glass objects to be investigated; on the other hand, the proposed study also intends to provide insights on the analytical methods that could be profitably used for achieving an in-depth characterization of coloring and opacifying inclusions.
Taking into account the vastness and complexity of the selected topic, extremely articulated under both chronological and geographical perspective, this compendium starts with a main focus on a particular class of objects made of opaque colored glass—mosaic tesserae. Such a choice stems from two main reasons—first, the wide variety of colors and degree of opacity of glass tesserae; second, the awareness of the importance that an in-depth study of colorants and opacifiers has for understanding the technological issues concerning mosaic glass tesserae and their production, where the chrono-typological criteria for the study of the forms are not applicable (for in-depth discussion on this topic, see [16]. From an archaeometric perspective, mosaic tesserae have always received less attention compared to glassware. The reasons behind this issue can probably be related to the fact that tesserae are unfeasible to be studied, based on chrono-typological criteria, to define the circulation and supply of peculiar shapes and decorative features through time and space.
Though mosaics have quite a long history, starting in Mesopotamia in the third millennium BC, they have seen widespread use as a decorative medium for floors and walls from the Roman period onwards. A key role in the advancement of the state of knowledge regarding the use of glass in mosaic has certainly been played by the interdisciplinary studies that have contributed to the Leverhulme Database, recording historical and archaeometric data on more than 300 entries of mosaics, datable between the 4th and 15th century AD and distributed across the Mediterranean basin (http://www.sussex.ac.uk/byzantine/research/mosaictesserae). Collected data showed that, between the 4th and the 6th centuries AD, there was a noticeable increase in the use of mosaics for decorative purposes; however, this “golden age” was followed by a decline in the 7th and 8th century, when the number of newly built buildings adorned with mosaics decreased from more than 50 to 20 and, then, only 9 exemplars remained. Between the 9th and 10th century, a slight increase in the use of mosaic as an ornamental medium could be observed, both in the Levantine area and in Italy. Italian mosaics seemed to dominate the 12th and 13th century, with respectively 20 and 13 records between Veneto, Tuscany, Lazio, Umbria, and Sicily. Eleven more records were documented for Italy in the 14th century, but only two were recorded in the following century [17].
Although the data from the Leverhulme Database represent an important step forward in delineating the history of the mosaic and documenting its spread in the Mediterranean basin, the picture of the manufacturing process and supply of mosaic glass tesserae is, to date, still incomplete and puzzling, and many questions still remain without proper answers, like how and where the raw glass was opacified and colored [16,18,19,20]. It is, above all, still unclear whether the manufacture of tesserae in ancient times was a centralized business, where a single workshop produced tesserae of different colors, or whether multiple workshops specialized in one color at the time. As, unlike tableware and objects, we cannot benefit from the support of chrono-typological studies, the contribution of archaeometry to the study and understanding of mosaic glass tesserae plays an unquestionably fundamental role, since an in-depth and multi-analytical characterization of the base glass and the coloring/opacification technology is an invaluable source of information for shedding new light on their manufacturing processes.
2. Materials and Methods
This study aimed to achieve an in-depth and comprehensive characterization on the micro-textural and compositional features of the different crystalline phases employed in glasses of archaeological and historical-artistic interest as colorants and opacifiers. To this end, previously studied assemblages of mosaic glass tesserae available at the Conservation Science Laboratory of the Department of Cultural Heritage (University of Bologna) were thoroughly revised and re-examined, by implementing available data with further analyses based on the methodology discussed below. More precisely, the sets of glass tesserae selected for this compendium, datable to between the 6th and 16th century AD, were from the Monastic Complex of San Severo in Classe, Ravenna, Italy, 6th–10th century assemblage [21]; the qasr of Khirbet al-Mafjar, plain of Jericho, Palestine, 8th century assemblage [22,23,24,25]; the Great Mosque of Damascus, Syria [24,25], 8th century assemblage; and the Basilica of Saint Peter, Rome, Italy, 16th century assemblage [26]. According to compositional data, all selected tesserae were made by using a silica–soda–lime glass, with natron as the fluxing agent [21,22,23,24,25]. The only exception was represented by samples SP5 (red) and SP23 (white) from the Basilica of Saint Peter in Rome, where plant ash was used as a flux [26].
All samples were preliminarily cleaned by using demineralized water and dentist tools, softly scraping the surfaces to remove the remains of soil and dirt. An Olympus S761 stereomicroscope (magnification up to 45X, Olympus Corporation, Shinjuku, Tokyo, Japan) associated with an Olympus Soft Imaging Solutions GMBH model SC100 camera (Olympus Corporation, Shinjuku, Tokyo, Japan) was, then, used for a preliminary morphological observations and documentation. The multi-analytical approach selected for analyzing the micro-textural features and the chemical signature of the colorants and opacifiers, was based on a combination of Scanning Electron Microscopy coupled with Energy Dispersion Analysis (SEM-EDS), Raman Microscopy (micro-Raman), and X-Ray Powdered Diffraction (XRPD). The polished sections were prepared by embedding micro-fragments of the samples in a polyester resin. After polishing, the sections were carbon-coated to perform the SEM investigation, for high-resolution textural and morphological inspection of the inclusions dispersed in the glassy matrix. Back-scattered electron signal (BSE) was used for the inspection of the morphological features of the inclusions, coupled with EDS spot measurements, to achieve a preliminary qualitative and semi-quantitative elemental analysis of the inclusions themselves. Images and EDS spectra were collected on a low-vacuum ESEM FEI Quanta 200 (FEI Company, Hillsboro, OR, USA), equipped with an EDAX energy dispersive spectrometer (FEI Company, Hillsboro, OR, USA). Analyses were performed in high-vacuum, using an acceleration voltage of 25 kV and an energy resolution of ~200 eV; working distance was set at 10 mm, spot size was between 4 and 5 μm. In order to further formulate hypotheses on the raw materials responsible for the color and opacity of the tesserae, a combined Raman Microscopy (μ-Raman) and X-ray powdered diffraction (XRPD) approach was used. Being a non-destructive technique, μ-Raman was carried out on all samples under study, while XRPD was only performed on selected samples, (where spectroscopic analyses were not entirely discriminant), due to its destructive nature. XRPD analyses were performed on the finely powdered samples that were manually pressed on an Ag sample holder in a Rigaku Miniflex diffractometer, employing CuKα1 radiation, in the range of 2Ɵ: 4°–64°, Ɵ scan speed: 1° min−1; ICCD (International Centre for Diffraction Data) database was used to identify the peaks in the patterns of the analyzed samples (https://www.iccd.com/). Raman spectra were collected by using a Bruker Senterra dispersive Raman spectrometer (Bruker Corporation, Billerica, MA, USA) equipped with an integrated Olympus BX40 microscope (Olympus Corporation, Shinjuku, Tokyo, Japan). A 785 nm He-Ne laser was employed, in the 300–3500 cm−1 region. Analytical measurements were performed with a 50× long working distance objective, operating at a power of 10 mW with a spectral resolution of 3.5 cm−1. Raman measurements were performed on polished section after carbon-coating removal. The IRUG (Infrared & Raman Users Group) database (https://www.irug.org/) was used for the identification of the Raman bands in the spectra of the analyzed samples, together with papers from the literature mentioned in the discussion of the results and in the tables.
3. Results and Discussion
To present the data in a structured and functional way, suitable for scholars from different fields of study who will approach the use of this compendium, the crystalline phases used to impart color and opacity are divided into categories based on “distinctive and common” element: antimony-based (including lead/antimony-based and lead/tin/antimony-based), tin-based (including lead/tin-based), copper-based, and phosphorous-based crystalline phases. In the following sub-sections, a brief reassessment on historical–archaeological data about the use of each coloring/opacifying agent is first provided, followed by some insights into the technological expedients underlying its processing technology. Then, data obtained by the selected multi-analytical approach is illustrated, parallel to a reasoned discussion on the adaptability of each analytical technique to the micro-structural and micro-textural features of the opaque colored glasses with different crystalline phases. The synoptic tables elaborated for each of the above categories, were organized in a way that textural, micro-structural features, and compositional data suitable for a precise characterization of the crystalline phases could be seen together at-a-glance (Table 1, Table 2, Table 3, Table 4, Table 5, Table 6 and Table 7).
3.1. Antimony-Based Crystalline Phases
Extensively found as colorant and opacifier in archaeological glasses, the class of antimony-based crystalline phases encompasses both calcium and lead antimonate, mainly employed to achieve, respectively, the white and yellow colors.
Among the different materials used throughout the centuries for coloring and opacifying glass, antimony-based ones always aroused a particular interest among scholars, which might be due to the fact that they were used for a very long time, from about the beginnings of glass production in the Near East and 18th Dynasty Egypt around 1500 BC to the modern age (though with periods of disruption) [27]. Between the 2nd and the 1st centuries BC, antimony-based crystalline phases were also detected together with tin-based one, in assemblages of glass beads from present-day Britain, France [28,29], and Czechoslovakia [30]; antimony-based compounds were also detected in Hellenistic cast monochrome glass vessels from Staré Hradisko, 2nd–1st century BC [31]. They continued to be increasingly employed in the rest of the Roman world and, by the 1st century AD, they also seemed to have substituted tin-based phases in the above geographical areas. Antimony-based phases were common for most of the Roman imperial age, up to the 4th century AD, when they started being progressively supplanted by tin-based phases from the Eastern Mediterranean to Northern Europe (see Section 3.2). Recent studies identified a concurrent use of antimony- and tin-based phases, as early as the 2nd century CE [32,33], but data from the literature are still too sporadic to properly understand how extended this practice was from a geographical and chronological perspective.
In Roman and Late Antique times, the use of calcium and lead antimonates was noticeably widespread in the coloring and opacification technology of mosaic glass tesserae for achieving, respectively, white (or blue, in combination with cobalt and copper oxides) and yellow (or green, in combination with copper oxide) chromatic shades. This was demonstrated by research undertaken at several sites in Italy, datable back to the 1st–6th centuries AD, like Aquileia [34], Pordenone and Trento [15], Brescia [18], Padua [35], Ravenna [21,36], Siena [18], Pompeii [18], Naples [37], and Faragola [38]. Sb-opacified glasses continued to be used, even if more fragmentarily, until the 13th century AD [36,39,40,41]. From the late 15th century onward, lead antimonate started being extensively used again to achieve an opaque yellow color, especially in Venetian glasses, in the Italian maiolica production, as well as a pigment for painting—the so-called “Naples Yellow” [42].
In the last few years, research was carried out to shed light on the technological processes underlying the obtainment of colored and opacified glasses, using calcium and lead antimonates, with specific attention to ancient Egyptian and Roman glasses [27,43,44,45,46].
According to the literature, glass opacification can be based on two methods—the former relies on the addition of natural or ex situ synthesized crystals to a translucent glass; the latter consists of the introduction of antimony as an oxide or a sulphide, leading to the in situ crystallization of opacifying agents, through the separation of calcium antimonate crystals from the molten glass [43]. Several hypotheses were put forward regarding the use of one or the other process, over the centuries, in the history of glassmaking. With reference to ancient Egyptian glasses, on the one hand Shortland [47] and Mass and colleagues [45,48] have stated the use of the in situ crystallization; on the other hand, based on the characterization of the 18th dynasty Egyptian opaque colored glasses and experimental replicas, Lahlil and co-workers hypothesized that an ex situ process was used, where calcium antimonate opacifiers were first synthesized and, then, added to the molten glass [27,43]. More precisely, they hypothesized that Egyptian craftsmen could have produced Ca2Sb2O7 by using mixtures of Sb2O3 or Sb2O5 with calcium carbonates, heat-treated between 1000 and 1100 °C.
Moving to Roman glasses, research showed that roasted stibnite (a mixture of Sb2O3 and Sb2O4), a lead-free source of antimony commonly found in the Mediterranean and the Near East, is likely to have been the source of antimony intentionally used in the opacification and coloring process of white and turquoise glasses [45,49,50,51]. The in situ crystallization process was identified as the most reliable, presumably based on the use of roasted stibnite, heat-treated between 1 or 2 days, at temperatures around 1100 °C [27]. However, a recent study by Maltoni and Silvestri carried out on Roman glass tesserae from Northeastern Italy provided new data on the possible occurrence of either the ex situ or the in situ opacification process for obtaining calcium antimonate crystallites [15]. More specifically, authors stated that if an uneven distribution of crystals in the glassy matrix was observed, with remains of sand relics and rosary-shaped aggregates, an ex situ method was more likely to have been used; on the other hand, when small euhedral crystals finely dispersed into the matrix were found, the hypothesis of the in situ method stood as more plausible [15,35]. According to previous research, for in situ crystallization the presence of hexagonal or rhombic phases might suggest different firing times and temperatures—the synthesis of pure crystals of Ca-antimonate highlights that CaSb2O6 starts precipitating from 927 °C, at the expense of Ca2Sb2O7, which occurs at lower temperatures, and becomes the only phase from 1094 °C [27]. Moreover, an experimental study on syntheses of in situ Ca-antimonate opacified glass carried out at 1100 °C, from periods ranging from 30 min to 13 days, highlighted that CaSb2O6 is kinetically favored, whereas Ca2Sb2O7 is thermodynamically stable 24. In Roman mosaic glass tesserae [15], the occurrence of hexagonal CaSb2O6 and cubic Ca2Sb2O7 phases [52], therefore, seems to indicate a different firing time of 1–2 days and a temperature of approximately 1100 °C, whilst the presence of the hexagonal phase alone could imply shorter firing times and higher temperatures (over 1100 °C).
In Table 1, micro-textural features and compositional data of calcium antimonate phases detected into opaque white and blue glasses are shown. It can be noticed that, at relatively low magnification (50–100×), inspection under SEM–BSE showed mostly homogeneous micro-structures of the glassy matrices (Figure 1a,b); at about 1000× magnification. BSE inspection allowed the identification of sporadic, micrometric inclusions in the matrix, but more detailed information on their morphology could not be achieved (Figure 2a,b). At higher magnification (5000× up), micrometric euhedral inclusions could be detected, showing a higher average atomic number compared to the surrounding glass; heterogeneously distributed in the matrix, these crystals, with sizes varying from 1 to 40-μm length, could be found either isolated or aggregated into clusters, localized at preferential nucleation sites like bubbles (Figure 2a,b). In both white and blue tesserae, compact aggregates of sub-micrometric euhedral crystals with circular conformation could also be observed, either alone (Figure 3c) or in combination with clusters of the euhedral crystals (Figure 3d). Such circular conformation resembles the so-called rosary-shaped morphology identified by Lahil and colleagues [43], associated with an ex situ opacification process. EDS spot measurement directly performed on the crystals demonstrated that, independent from the crystalline habitus and the conformation of the aggregates, they were mainly made of calcium and antimony (Figure 4a,b). μ-Raman measurements carried out directly on the crystals showed that those with euhedral habitus were made of both cubic Ca2Sb2O7 and hexagonal CaSb2O6, while in the rosary-shaped aggregates, only the presence of cubic Ca2Sb2O7 was observed (Figure 5 and Figure 6). As anticipated before, it was hypothesized that the presence of both phases could indicate a firing time of 1–2 days and a temperature of about 1100 °C, while the occurrence of the rhombic phase alone could be related to lower temperature and longer firing times [15]. In calcium antimonate-containing pale blue tesserae from the 6th century AD mosaic in San Prosdocimo (Padua, Italy), as well as in some tesserae from the 2nd–4th century AD, Roman baths under the church of Santa Maria Maggiore in Trento (Italy), and the 1st–5th century AD Roman Villa of Torre (Pordenone, Italy), a different micro-texture of the vitreous matrices was also found [15,35]. In pale blue tesserae from San Prosdocimo, calcium antimonate was not characterized by euhedral habit and it also seemed to be partly melted in the vitreous matrix, this possibly indicated a different technological expedient. The hypothesis endorsed by the authors was that calcium antimonate was added to a previously colored and transparent glass to achieve opacity, with the ex situ method. To this end, a previously prepared opaque glass was re-melted to be shaped into tesserae, or two glasses—one opaque and one translucent—were mixed. In some white, blue, and azure tesserae from Trento and Pordenone, non-homogenous micro-textures of the vitreous matrices were observed, with uneven distribution of crystals and, in some azure samples, higher average atomic number bands were observed. Within the same chromatic categories, other samples showed homogenously distributed euhedral crystals, with lumps of newly-formed crystals and rosary-shaped aggregates. The use of either an in situ or ex situ opacification method was, respectively, hypothesized for the different micro-textural features observed. According to currently available data, therefore, it is likely that both methods were used in Roman and Late Antique periods, with no relationship observed between the production methods and color [15].
In glasses containing calcium antimonate, diffractometric analyses can be undoubtedly suitable for an exact identification of the crystalline phases (Figure 7 and Figure 8); it is, however, to be reminded that, if no instruments are available that can perform spot measurements directly on the crystals, there is a concrete risk of jointly identifying different crystalline phases (Figure 8), without the possibility of correlating them to morphological features. Thus, when possible, spot analyses (either spectroscopic or diffractometric) are preferred.
Analogous to calcium antimonate, research was also carried out on lead antimonate to better understand its use for coloring and opacifying ancient glass. Lead antimonate compounds are found from the 3rd millennium BC in Mesopotamia until modern times, though with periods of disruption. As anticipated before, at the end of the Roman Empire, the use of lead antimonate in glass technology seemed to have dramatically decreased in Europe, due to their replacement by tin-based opacifiers, but, from the 15th century onward, lead antimonate was again extensively used as yellow opacifier in glasses, and glazed ceramics, and also as a pigment for painting [44]. The complexity of lead antimonates has led to the hypothesis that different recipes were used though the ages, and two main hypotheses were endorsed with reference to the introduction of lead antimonate compounds in the glass—re-use of antimonial litharge and use of lead/antimony minerals [45,46,47], although a univocal position is still lacking and the issue is quite debated [44,53]. The hypothesis of the ex situ synthesis of lead antimonate and its addition to a transparent glass is the most commonly accepted, supported by the evidence of incomplete dissolution and clumped distribution of crystals [47]; in addition, the formation of micrometric euhedral crystals sometimes found in glass tesserae is explained by the precipitation of that phase upon cooling after its partial dissolution [45].
Following pivotal studies undertaken by Turner and Rooksby [49], research by Mass and colleagues on Roman and New Kingdom Egyptian opaque yellow and green glasses unraveled interesting connections between the two glassmaking technologies, based on the potential use of cupellation litharge as the source for lead antimonate [46]. Litharge, a yellow polymorph of lead oxide obtained as by-product of silver refining, was previously identified by the same authors as the most probable material for the introduction of lead antimonate pigment to glassmaking; in use 1500 years prior to the Roman period [45].
Later studies carried out on the New Kingdom Egyptian and Roman opaque yellow glasses [44], as well replication experiments by Molina and colleagues [42], demonstrated that lead antimonate particles responsible for the yellow color and opacity were cubic Pb2Sb2O7. In ancient Egyptian and Roman glass studies, lead antimonate compounds were often referred to as Pb2Sb2O7 and the structure of these crystals was equivalent to the mineral bindheimite Pb2Sb2O6(O, OH), cubic pyrochlore [46,47,48,49,54]. Interestingly, it was also observed that, in the case of Egyptian glasses, antimony was partially substituted by iron and zinc, while, in the case of Roman glasses, iron and tin partially replaced antimony. The most plausible hypothesis was, therefore, that these impurities were incorporated into the glass through different raw materials and technological processes, for the production of the lead antimonate pigment or anima used in the coloration process of Egyptian and Roman glasses, respectively.
A comparative study of three glass productions using lead antimonate opacifiers (18th Dynasty Egyptian, 2nd century BC to 5th century AD Roman, and 18th century modern glass) brought to light similarities and differences in their production, highlighting that lead antimonate production evolved over time, although the hypothesis of the ex situ synthesis of the crystals before being added to the glass was always confirmed [44]. Differences in the nature and relative amount of minor elements like zinc, iron, or tin seem to be useful for testifying changes in the materials used to obtain lead antimonate compounds in different glass productions, with great potentialities for the identification of the supplying area as well. More precisely, zinc and iron are found in the Egyptian glass crystals, while tin and iron are found in Roman opacifiers. According to these results, it would seem that a homogeneous process was used to produce lead antimonate crystals in the Egyptian glasses, while Roman glasses show heterogeneities, suggesting that no fixed recipe was used. A better controlled process was used for modern glasses, likely based on the Muranese recipe books.
Table 2 provides an at-a-glance picture of micro-textural and compositional features of lead antimonate crystalline phases that could be found in ancient glasses. It could be noticed that, even at low magnification (about 100×) inspection under SEM–BSE, a quite heterogeneous texture of the vitreous matrices could be observed, with bands of higher average atomic number (Figure 9a–d). The irregular distribution of crystals in the matrix strongly supports, therefore, the hypothesis of ex situ opacification/coloring technology, providing evidence that they formed inside the glass melts and not prior to their addition, as already observed by Bimson and Freestone [50] in some Roman opaque glasses. Micrometric crystals with anhedral (Figure 10a) or subhedral (Figure 9b)) habitus could be observed at higher magnification, often found in the bands and clustered in aggregates. EDS spot measurements directly performed on the crystals revealed that they were mainly made of lead and antimony (Figure 11); the presence of iron in the crystals was also detected, possibly indicating that it was jointly introduced to lead and antimony. Regarding lead antimonate crystals, either spectroscopic or diffractometric analysis could allow an exact characterization of the crystalline phase—μ-Raman measurements carried out directly on the inclusions allows to characterize them as bindhemite, cubic pyrochlore Pb2Sb2O7 (Figure 12); these data being in agreement with the diffractometric pattern (Figure 13).
In Table 3, textural and compositional data on lead–tin–antimonate crystals are shown. Although they fall into the category of antimony-based phases, it is appropriate to devote specific attention to these crystals, since there are, to date, several examples in the literature of glasses (especially mosaic tesserae) colored with “pigments” based on lead, tin, and antimony [15,33,37,56]. Since the most suitable hypothesis is that the presence of lead–antimonate inclusions doped with tin could be related to the use of tin-rich metallurgical scraps [42,44], precise characterization of these inclusions could represent the starting point for providing insights into the identification of a possible area of origin of the raw materials used as colorants. Inspection under the SEM–BSE signal revealed a basically more homogenous matrix compared to glasses with lead antimonate (Figure 14a–c); micrometric anhedral crystals, either alone or, more frequently, clustered together, could be observed in detail at high magnification (10,000× up) (Figure 15a–c). EDS spot measurements carried out on the crystals demonstrated that, although they are mainly made of antimony and lead, tin could also be distinctively detected, in relatively lower content, compared to antimony (Figure 16). In agreement with the literature [32,57], the m-Raman spectrum shows the typical features assigned to lead antimonate doped with tin (Figure 17): in addition to the shifted Pb–O lattice mode at 140 cm−1, a peak at about 450 cm−1, an increase of the band at about 330 cm−1, and a collapsed band at 510 cm−1 could be observed, indicative of the partial replacement of the Sb+5 species, by a larger Sn4+ cation [57,58]. Interestingly, two additional bands at about 970–980 cm−1 were visible, linkable to the vibration of the (SO4)2− unit of noselite or nosean [Na8Al6Si6O24(SO4)], a mineral of the sodalite group that was related either to reaction product between the ceramic container and sodium oxide from glass [55] or to the raw materials used as a source to obtain the lead antimonate [32]. X-ray diffraction pattern does not allow identifying a precise crystallographic phase as, compatibly with other examples from the literature 15,63, only a possible match with generic lead–tin–antimony-based pyrochlore could be noticed (Figure 18).
3.2. Tin-Based Crystalline Phases
The category of tin-based crystalline phases incorporates both tin oxide and lead–tin-oxides, whose use in archaeological and historical glasses (and glazes) primarily aimed to achieve white and yellow colors.
The use of tin-based phases became consistent from the 4th century AD to substitute antimony-based ones. It was hypothesized that behind this change there was either the need to face a disruption in the supply of antimony or the installation of closer relations between the Roman Empire and India [30]. Before becoming commonly used as a white colorant in 9th–10th century Iraq and Iran, tin oxide seemed to always have been less in use as compared to lead–tin-oxides, mainly added for imparting opacity to glasses (and glazed coatings) colored with copper, manganese, and cobalt oxides. The first use of tin oxide as an opacifier was documented in Spain, in a purple-black glass tessera from a Roman site at Centcelles, not far from Tarragona, datable back to the first half of the 4th century AD [59]. Following studies [28,29] showed that tin-based opacifiers were in use in Northwestern Europe in the pre-Roman period, when antimony-based compounds seemed to have been predominant elsewhere [60]. Tin-based opacifiers seemed to have been less widespread, compared to lead–tin-based phases, and they were mainly used in glasses colored by other colorants. Freestone and colleagues [60] detected SnO2-based crystals in 5th century mosaic glass tesserae from Shikmona, Israel, where it was used as an opacifier in white samples; the same study also reported that tin oxide was found in opaque blue tesserae from the Basilica of San Marco in Venice, Italy, 11th–13th century. White and blue glass tesserae from early Christian Cypriot wall mosaics (5th–7th century) were opacified with SnO2 crystals as well [61]. In the 5th–6th century, white glass tesserae from San Giovanni alle Fonti (Milan, Italy), SnO2 crystals, were also detected in the matrices [56].
The use of tin in opaque red mosaic glass tesserae deserves a special note. With reference to opaque red glass in general, Brill and Cahill [62] suggested that tin could have been introduced in the form of bronze scaling. Although tin plays an active role in deoxidizing and improving a melt, Cable and Smedley [63] noted that the absence of tin from a glass batch had little if any effect on the end result, when an opaque red glass was produced. A first comprehensive study on an assemblage of 20 opaque red glass tesserae from Beit Shean, dated back to the 6th century based on archaeological evidence [64]; tin range in red tesserae from the exedra was found to be almost identical to copper, this lead to the hypothesis that tin was added as an intentional additive. An analogous statement was made with reference to opaque red tesserae from the Lower City Church at Amorium, rebuilt around 900 CE—analyses showed that, in addition to cuprite crystals, cubic, micrometric inclusions of tin oxide or reduced tin occurred in the glassy matrices; ratio of tin to copper ranging from about 1:1 to greater than 2, suggested that tin was added separately to the glass, presumably to aid in the reduction of copper oxide to cuprite [65]. Conversely, in 6th century, red mosaic tesserae from the church of Hagios Polyeuktos, Constantinople, low traces of tin were identified in the glass, leading to the hypothesis that this metal could have been incorporated in the glass as a by-product of a copper–tin alloy for achieving the desired color [66]. A moderate positive correlation between copper and tin was observed in some soda ash red tesserae from the 6th century mosaic from St. Prosdocimus (Padova, Italy), where SnO2 < 1 wt% suggested that a tin bronze was the copper source; no relationship was observed in the other red samples, with SnO2 contents >1 wt%. These were more or less comparable to copper [67], as already observed for the red and orange tesserae from Antioch [68] and Sagalassos [69] in Turkey, and thus suggested different sources for these elements. Later, the use of tin oxide was sporadically encountered in early Medieval England [70,71], Ireland [72], the Netherlands [73], and Italy [26,39,56,74], for obtaining opaque white glass, and in Denmark for opacifying blue glasses colored by cobalt oxide [29]. Last, research carried out on colored glass beads datable to the Merovingian period (5th–7th century AD) and found in large amounts in Switzerland, France, Germany, and the Netherlands area, especially in female graves, deserve a note [75,76]. In early Medieval Schleitheim (Switzerland), in fact, the fragment of a crucible with an adhering yellow glassy residue was found, providing the first archaeological evidence for the production of the lead–tin yellow pigment; analyses demonstrated that locally found glass beads, contemporary with the crucible, were not made directly from the crucible charge, but from a mixture of yellow pigment, prepared separately, and colorless plant ash-based glass.
Recent research on the processes underlying coloring and opacification technologies with tin-based phases demonstrated that a mixture of lead and tin oxides, namely lead–tin calx, was used with Pb/Sn ratio below the stoichiometric requirement of 3.5 for the formation of Pb2SnO4 [77]. The calx could have been mixed with either only silica, a mixture of silica and alkalis, or a pre-prepared frit, then fired again to obtain a glass opacified by SnO2 crystals [78].
Table 4 provides a synoptic outline of the micro-structural features of tin-based crystalline phases detected in ancient glasses, integrated with accurate compositional data obtained from a multi-analytical approach. Regardless of the tin-based phases acting as both colorant and opacifier—in white glasses—or solely as opacifer in glasses colored by other metallic oxides (like copper and cobalt), under SEM–BSE inspection vitreous matrices of glasses with tin-base crystalline phases showed predominantly homogenous micro-textures, with sporadic unevenly distributed inclusions, characterized by higher backscattering (Figure 19a and Figure 20a). Observed at high magnifications (around 5000×), these inclusions appear as micrometric crystals with subhedral or anhedral habitus, found in clusters that had a whole size of few tens of microns, from 10 to 50 μm (Figure 19b and Figure 20b). EDS spot measurements carried out on the crystals demonstrated that they were almost entirely made of tin (Figure 21 and Figure 22); data obtained from both spectroscopic (μ-Raman) and diffractometric (XRPD) analyses were consistent with characterizing the inclusions as cassiterite, SnO2 (Figure 23, Figure 24, Figure 25 and Figure 26). An exact characterization of the crystalline phase as cassiterite was, therefore, possible through the indistinct use of either molecular or diffractometric analysis. The only exception was represented by tin-based inclusions detected into opaque red glasses colored and opacified by copper-based phases (see also Table 6), where XRPD did not allow the identification of tin-based crystalline phase, probably due to the relatively low concentration in the sample; in this case, spot measurements to be performed directly on the inclusion (μ-Raman, μ-XRD, SEM-EBSD) had to be preferred.
Compared to tin-based, lead-tin-based phases appeared to have been more frequently used to impart opaque yellow hues, and green hues, when used in combination with copper oxide. After some occasional attestations between the 1st and the 2nd century BC in North-Western Europe [28,29] and between 1st to 3rd centuries AD in Britain [29,79,80], yellow glass, colored and opacified by lead–tin-oxides was extensively found at several sites, both in Western Europe and in the Eastern Mediterranean, especially during Late Antiquity (5th–7th centuries AD). In Europe, its use was extensively documented in the Netherlands [73,81], in England [70,82], in Ireland [72], in Scotland [82], as well as in Italy at Naples [37], Ravenna [21,36,83], Padua [67], and Milan [84]. In the Eastern Mediterranean and the Levant, examples of lead–tin-oxides opaque yellow and green glasses were found among the assemblages of glass tesserae, datable between the 5th and the 9th century AD at Shikmona [60], Kilise Tepe [20], Hagios Polyeuktos [66], Sagalassos [69], Amorium [65], Petra [85], Cyprus [61], Khirbet al-Mafjar [23], Qusayr’ Amra [86], Nishapur [87,88], and Samarra [89]. Afterward, they were frequently used in Islamic enamels manufactured since the 12th century AD and in Italy too, where lead–tin-oxides were employed both in Venetian glass and in mosaic tesserae manufactured between the 6th and the 16th centuries AD [21,26,74,90].
In spite of this noticeable amount of published data on lead–tin-oxides in glasses, research has long been suffering from a low amount of technological information on the methods related to their production, until recently, when the existing lacunae were greatly filled with replication experiments supported by in-depth study of historical texts [30,77,78]. Processes underlying the preparation of lead–tin calx, anime, and alkali frit were thoroughly explored, new insights suggest that a lead–tin calx was the main component in manufacturing opaque yellow glasses and glazed coatings. In particular, Pb/Sn values proved to be a suitable proxy for checking the differences in the methods of opacification and coloration—if the Pb/Sn ratio was equal to or more than the stoichiometric requirement of 3.5, the deriving calx would contain a combination of PbO, SnO2, and Pb2SnO4. This calx could then have been treated in two different ways, namely lead–tin anima and lead–tin alkali frit, to obtain, after firing at temperatures around 750 °C, a Pb(Sn, Si)O3 opacified yellow glass [78]. The described processes were, however, particularly difficult to be established and understood from compositional and microstructural analyses, this still stood as a main research priority to deal with.
In Table 5, micro-textural features and compositional data of lead–tin-based phases detected in opaque yellow and green glasses are presented. Even at relatively low magnification (50–200×), inspection under SEM–BSE revealed strongly heterogeneous micro-structures of the vitreous matrices, with zoned textures characterized by bands of a higher average atomic number (Figure 27). Inclusions with different habitus (anhedral, subhedral, and acicular) and sizes could be found in the vitreous matrices, mainly concentrated in the bands. Micrometric crystals showing anhedral or, more frequently, subhedral habitus were generally distributed in clusters with a whole size, ranging between 10 and 60 μm (Figure 28a,b). Observed at higher magnification (10.000–20.000×), the subhedral crystals often showed the presence of zones (Figure 28c,d). EDS spot measurements directly performed on the crystals revealed that they were mainly made of lead and tin, the Pb/Sn ratio was estimated to be higher than 3.5 (Figure 29). A comparison between EDS spectra acquired on the zoned crystals demonstrated that the lighter areas had relatively higher lead and tin contents, compared to the greyish zones, enriched in silicon (Figure 30). Crystals with anhedral and subhedral habitus also occurred, clustered in mixed lumps, with thin, sub-micrometric acicular-shaped inclusions (Figure 31a,b); at times, the crystals with acicular habitus were also found to be clustered alone (Figure 31c,d). EDS analyses carried out on, both, the subhedral and acicular crystals set in a mixed cluster, demonstrated that they were both made of lead and tin, with the acicular crystals showing a relatively lower lead and relatively higher tin contents, compared to the subhedral ones (Figure 32 and Figure 33).
In order to achieve precise compositional data on the crystals detected in the vitreous matrices, an integration between spectroscopic and diffractometric analyses is strongly recommended. m-Raman measurements directly performed on the anhedral and subhedral crystals clearly demonstrated that they are consistent with the Lead–Tin Yellow type II (Figure 34), for the bands at 68, 138, 327, and 455 cm−1 [55,91,92]. Lead–Tin Yellow type II (PbSn1−xSixO3) is a lead tin silicon oxide with a cubic structure, and it can show different stoichiometries—either PbSnO3, Pb(Sn, Si)O3 or PbSn2SiO3. Research dealing with its formation indicated that the technological process was still uncertain and, according to Eastaugh and colleagues [93], it probably involved the formation of an intermediate lead silicate at about 690 °C, before the precipitation of lead–tin-silicon compound occurred around 750 °C. Matin and co-workers undertook replication experiments to investigate the conversion of Lead–Tin Oxide type I to type II [77], demonstrating that this conversion took place if SiO2 was added to Lead–Tin Oxide type I and the mix was heated up to between 800 °C and 950 °C. Comparison between Raman spectra of pure PbSnO3 and PbSn1−xSixO3 was not possible, as a signature of PbSnO3 alone was not found in the literature; XRPD was, thus, also carried out, in an attempt to achieve a precise characterization of the mineralogical phase. Though diffraction patterns of lead–tin based compounds showed very close similarity, those acquired on the yellow and green tesserae seemed to compare best to PbSnO3 (Figure 35).
Moving to acicular-shaped crystals, due to their extremely small dimensions, m-Raman measurements could be particularly challenging to be performed and the resulting spectra is hardly informative (Figure 36). A band at 632 cm−1 could be detected, related to cassiterite but not sufficient for a univocal identification, as the two other main bands of SnO2 were lacking—471 and 773 cm−1 [55,92,94]. Integration with diffractometric analyses could provide suitable support, allowing us to determine the presence of cassiterite, together with PbSnO3 in opaque green glasses (Figure 37). Interestingly, in opaque green glasses with lead–tin-based phases, a higher abundance of acicular-shaped crystals could be observed, compared to opaque yellow samples. As the persistence of cubic lead–stannate (responsible for the yellow color) was mainly dependent on the firing temperature [30,77], it could be hypothesized that different firing temperatures were used to achieve the different chromatic shades. Lead–tin-oxide type II crystals are, in fact, stable at up to temperatures between 750 °C and 1000 °C; at higher values, the crystals begin to decompose and re-crystallize as SnO2. As a consequence, it is likely that green tesserae when produced at higher furnace temperatures turns yellow, as they show a relatively high abundance of SnO2 crystals in the glassy matrix.
3.3. Cu-Based Crystalline Phases
Copper-based crystalline phases dispersed into the glassy matrix have commonly been found in opaque red archaeological glasses. Due to the high-level technical achievement involved in its production, opaque red and orange glasses have always attracted the attention of scholars. Three ways of precipitating copper crystals in glass were described by Freestone [95]. First, difficulty in achievement implies the reduction of an oxidized glass in a reducing furnace atmosphere; the second was based on the reduction of copper, with elements like carbon, lead, antimony, iron, or tin; the third wanted cuprite to be directly added to the glass, maintaining the internal oxidation state of the glass. In any case, both heating and cooling could have impacted upon the nucleation and growth of Cu-based phases found in opaque red and orange archaeological glasses.
With reference to opaque red glasses, two technological variants were attested. The first variant, known as “sealing-wax red glass”, is a bright high-lead, high-copper glass containing dendritic crystals of cuprite (Cu2O); its occurrence was mainly documented from the 8th century BC to the 1st AD [96], since then it started to be more sporadically found [97]. The second variant is known as “dullish red glass”, a low-lead, low-copper glass with nanometric droplets of metallic copper dispersed into the vitreous matrix. Dullish red glass could be characterized by variable amounts of potassium and magnesium oxides; these were interpreted as a consequence of the practice of adding wood charcoals or fuel ash to the crucibles to aid the reduction [21,98], or to the use of plant ash as an alkali source [18,99,100,101]. In both cases, the obtainment of the red color required a reducing atmosphere in the furnace, to achieve the reduction from Cu2+ to Cu1+ for cuprite or Cu0 for metallic copper.
In opaque orange glasses, cuprite is generally found as nanocrystals with a cubic habit, homogeneously distributed in the vitreous matrix [15,67]. Research provided evidence that both the number and size of metallic copper and cuprite crystals can influence the final hue of glass tesserae [62,67,95]. Micro-textural analyses performed on paleo-Christian tesserae from St. Prosdocimus have shown that in the majority of the red samples, particles of metallic copper were smaller (below 150 nm) and higher in number than those in brown samples [67]. Analogous differences in the number and size of metallic copper crystals were found in the red and brown samples with bands of different hues—in the SEM–BSE images, the lighter and darker bands of tesserae were identifiable by abundant/small or rare/large Cu nanoparticles, respectively. XANES (X-ray Absorption Near Edge Structure) and EXAFS (Extended X-ray Absorption Fine Structure) high-resolution analyses also confirmed that copper mainly occurred as Cu2O in opaque orange samples and as metallic copper in opaque red and brown ones [102].
Mention is deserved by opaque brown, red, and orange glass tesserae that shows a striped pattern visible under optical microscope, as recent research has shown that the macroscopic banding could be related to different chemical or micro-textural features, or not. The case of Roman red-banded mosaic glass tesserae from North-Eastern Italy (Pordenone and Trento) is quite interesting in this regard [15]. In some of the analyzed samples, the macroscopic banding of the tesserae was ascribed to different chemical or micro-textural features—the non-homogeneity of glassy matrix detected under SEM–BSE—and confirmed by EDS data—had strict connection with the macroscopic banding. Relatively higher iron contents were detected in the darker areas, alongside a higher relative abundance of large crystals up to micrometric sizes. Conversely, in other red-banded tesserae belonging to the same set of samples, the differently colored stripes visible by naked eye did not seem to be linked to the glassy matrix composition, which was quite homogeneous and was characterized by bands, with many crystals alternating with apparently clear bands that had no opacifier. In this specific case, the macro-banding was explained as a result of the different micro-textural distributions of opacifier, with bigger crystals in the darker bands. An analogous situation was found in the orange/red-banded samples from Pordenone and Trento, where the bi-colored patterns also had different explanations. On the one hand, some samples showed a homogenous matrix with abundant bright crystals embedded—areas with bigger and generally non-clustered crystals corresponded to red stripes, while areas with smaller and denser crystals corresponded to orange stripes. On the other hand, some samples were characterized by a non-homogenous matrix, with stripes of different atomic number, resembling the visible striped pattern; this suggested that the red/orange banding could be due to different chemical compositions of glassy matrix, with the red stripes being enriched in lead with respect to the orange ones.
Although the scenario is particularly complex, it is interesting to note that in other assemblages, the presence of banded tesserae with two colors, each with different chemical compositions and opacifiers, was also attested [103]. This strongly supported the hypothesis of a deliberate combination of two different glasses to achieve a bi-colored pattern.
In Table 6, textural and compositional data on copper-based crystals found in opaque red glasses are shown, distinguishing between the “sealing-wax” and “dullish” variants. Under SEM–BSE inspection, the former showed a non-homogenous vitreous matrix (Figure 38a), with bands and clusters of acicular-shaped crystals, made of cassiterite, that had an impact upon the opacity of the glass (for in-depth discussion upon tin-based acicular shaped crystals, see Table 4). At high magnification (20.000×), micrometric crystals in the shape of dendrites could be observed (Figure 38b), which was exclusively made of copper, as demonstrated by the EDS spot measurements (Figure 39 and Figure 40). Raman measurements directly performed on the dendritic inclusions did not provide satisfactory data, while XRPD clearly identified the presence of cuprite and cassiterite. The latter, “dullish” red glass, was characterized by different micro-textural features—though the glassy matrix could appear homogenous at low magnification (Figure 41a). BSE images at higher magnification (7000×) showed a dispersion of abundant nanometric rounded particles (Figure 41b). EDS spot measurements demonstrated that they were made of copper (Figure 39 and Figure 40). Compositional characterization of these nanometric inclusions could not be performed by Raman microscopy due to the nanometric dimensions of the particles dispersed into the glassy matrix. X-ray powdered diffraction analysis could, however, be carried out, with the obtained patterns allowing to exactly identify the crystalline phase as metallic copper (Figure 42 and Figure 43). It was reminded that “dullish” opaque red glass showed low copper (CuO about 2–3 wt%) and low lead (PbO 1–2 wt%) contents. When found at such low concentrations, it was improbable that lead oxide was deliberately added to the glass for gaining the well-known advantages related to its addition, like increasing the refractive index, lowering the melting temperature, and reducing the tendency to devitrify. Thus, it is more plausible that the low lead contents could be related to metal slags or debris used as copper-bearing material.
Last, attention needs to be payed to the green/red striped glass, where the metallic copper was the phase involved in coloring technology. Under optical microscope, the alternation of red and green glass strips could be preliminary observed and documented (Figure 44a). The BSE images highlight the differences in terms of atomic number average between the green (lower atomic number) and the red (higher atomic number) stripes (Figure 44b), where the nanometric rounded particles could be observed at a higher magnification (Figure 44c). EDS spot measurements carried out on both bands showed that, in the red glass, a relatively higher copper content could be found compared to green glass, and the iron content was higher with respect to copper (Figure 45a,b); in the green glass, iron was also detected in high content. As already observed for the “dullish” red glass, it was not possible to further investigate the rounded inclusions in the red glass by means of Raman microscopy, and XRPD did not provide useful results, which could be due to the low crystallinity degree of the inclusions. According to these data, green/red striped glasses could be interpreted as a failed attempt to produce red glasses, where presumably a lack of control in the redox-condition of the furnace probably caused the striped effect. Interestingly, banded glass was not infrequent in the literature when glass was colored and opacified by means of copper phases. In the assemblages of Roman mosaic tesserae from Pordenone, Trento and Aquileia [15,34], several samples of green/red-banded and orange/red-banded tesserae were found, and archaeometric analyses showed that they were all colored by the addition of copper-based phases. It remained, however, still unclear whether the bi-colored pattern could always be interpreted as an accidental occurrence or if a deliberate combination of two different kinds of glass took place.
3.4. Phosphorous-Based Crystalline Phases
The use of calcium phosphate as an opacifier in glasses from archaeological contexts was attested from the 5th–6th century AD. Since Ca-phosphate is the main component of bones, the most credited hypothesis was that the bones themselves were crushed, powdered, burnt, and added to molten glass as opacifiers conferring a whitish hue, substituting more expensive and less accessible calcium antimonates and tin-based phases [104].
Interestingly, this opacifier was mainly found in assemblages of mosaic glass tesserae from sites located across the eastern Mediterranean basin and mainly in blue, turquoise, and green colors—Kilise Tepe, Turkey [20]; Tyana, Turkey [105]; Cyprus, Greece [61]; Petra, Jordan [85,106]; Padova, Italy [35,104]; Ravenna [107]; Qusayr ‘Amra, Jordan [86]; Khirbet al-Mafjar, Palestine [23,24]; and Amorium, Turkey [65].
Thanks to an in-depth study of experimental replicas, recent research provided new insights into some aspects related to the production technology of glasses opacified with Ca-phosphate, with specific attention to melting temperature and pre-treatment of employed materials, namely animal bones [108]. Experiments showed that this opacification technique consisted of adding pre-fired bone to a base glass, avoiding the use of unfired bone, since it could have not been easily powdered. Furthermore, it was proposed that the batch made of silica–soda–lime glass and powdered bone was obtained at a temperature of about 700 °C, when the bone grains reacted with the vitreous matrix and β-rhenanite (β-NaCaPO4) and wollastonite were formed. Longer melting times (from 18 to 36 h) were, instead, needed for obtaining the micro-textural features detected in the original samples of archaeological glass, dotted with gas bubble. When the time of exposure to fire was longer than 36 h, the Ca-phosphate inclusions went through compositional changes—the replacement of calcium by sodium (without a complete transformation into β–rhenanite), resulting in the formation of a partially fused reaction rim. Last, it was observed that, when higher temperatures (1100 °C) were reached, a transparent glass without gas bubbles or bone inclusions was achieved.
Table 7 provides a summary of the micro-textural features that could be observed when mosaic glass tesserae were opacified by the addition of Ca-phosphate. SEM–BSE images showed a non-homogeneous vitreous matrix, dotted with gas bubbles (Figure 46a) and with unevenly distributed inclusions of irregular shape, with dimensions ranging from about 60 µm up to millimeters and characterized by a number of small vacuoles. Bigger inclusions (>100 µm) generally have a reaction rim darker than the core in BSE images (Figure 46b,c); smaller inclusions do not show any reaction rim and tend to be more compact (Figure 46d). EDS data showed that, independent from their conformation, these inclusions were mainly made of calcium and phosphorus (Figure 47a), the rim being generally characterized by higher sodium and silicon contents (Figure 47b). Micro-Raman measurements carried out, respectively, on the core and the rim of the inclusions highlighted the different compositional features—the spectrum of the core (Figure 48a) was consistent with hydroxyapatite [109], with bands located in the region from 400 to 1100 cm−1, where the vibrational modes within the phosphate tetrahedra of the apatite were located [104]; spectrum acquired on the rim had a band in the region between 430 and 1046 cm−1, with other shifts occurring between ~1206 and 1645 cm−1 (Figure 48b). Raman bands located between 430 and 1046 cm−1 were consistent with β-rhenanite (β-NaCaPO4), the reasons behind its formation are explained above. Regarding the other Raman bands between ~1206 and 1645 cm−1, no precise comparison was found in the literature, so as to allow a univocal identification. By carrying out m-Raman measurements on the synthetic and natural apatites, Antonakos and colleagues [110] observed that some forms of hydroxyapatite display, after having been heated at 840 °C, bands at ~1412 and ~1642 cm−1, were linked to the presence of carbonate impurities. Thus, the occurrence of the above bands could be interpreted as a result of modifications of the hydroxyapatite structure that took place when powdered bone was added to the glass at high temperatures. Moving to smaller and more compact Ca-phosphate inclusions without reaction rims, the acquired Raman spectrum was highly comparable to those of the cores of the larger grains (Figure 48c). It could be hypothesized that the modification of hydroxyapatite into β-rhenanite was not accomplished in the crystals with smaller dimensions. It is important to remind that causes related to the occurrence of compact inclusions made of Ca-phosphate have not yet been explained, since further studies are in progress on experimental replicas to gain more insights into this topic [109]. XRPD analysis could certainly provide a general indication of the presence of phosphorous-based inclusions in the glassy matrix, but as it can be seen in Figure 49, the pattern appeared to be greatly affected by both background noise and interference of the amorphous matrix of the glass. The technique allowed the recognition of diffraction peaks associated with calcium phosphate hydrate, but (unless instruments for micro or spot X-ray diffraction analysis were used), it was not possible to reach a more specific characterization of the phases, which, on the other hand, could be performed by µ-Raman analysis.
4. Conclusions
The first and most evident conclusion that this compendium allowed to draw was certainly revisable in the high degree of complexity and heterogeneity that opaque colored archaeological and historical glasses could show in terms of micro-structural and compositional features.
As a direct consequence, an in-depth characterization of these phases could not be adequately and completely developed by resorting to a single analytical technique. The presented data provide evidence that the selection of the techniques seemed to be highly dependent on the nature of the inclusions that we want to investigate, as well. It was, for instance, demonstrated that Raman microscopy could be extremely suitable in discriminating between different phases occurring in the Ca-phosphate-based inclusions, and the same could be stated when dealing with lead–tin based phases, where diffractometric analyses could be less discriminant; conversely, when dealing with copper-based phases, XRD analyses could be more informative, especially when nanometric sizes of the metallic copper particles were found in the matrix. As far as current knowledge is concerned, an integration of at least one spectroscopic and one diffractometric analysis is, therefore, always recommended, as it seems an appropriate compromise in order to achieve a thorough characterization of the crystals responsible for the color and opacity of glass.
This compendium also provides evidence of how, when dealing with the study of such composite materials, the integration between different analytical techniques needs to be considered a fundamental prerequisite for their correct and thorough characterization. Furthermore, in perspective of acquiring highly comparable data supporting the definition of more complete and exhaustive scenarios related to production, manufacturing technology and supply of deeply colored glass objects, the present study could hopefully provide a reference point for opacifying phases comparison, and a base for laying the groundwork for the definition of a shared analytical approach to be used in the characterization of crystalline phases dispersed into colored opaque glasses, evaluated on both the potentialities/limits of each technique and the extremely heterogeneous material features.
Author Contributions
Data curation, S.F.; formal analysis, S.F.; methodology, M.V. and S.F.; project administration, M.V.; resources, M.V.; writing—original draft, S.F.; writing—review and editing, M.V. All authors have read and agreed to the published version of the manuscript.
Funding
This research received no external funding.
Conflicts of Interest
The authors declare no conflict of interest.
References
- Tait, H. Five Thousand Years of Glass, 1st ed.; British Museum Press: New York, NY, USA, 1991. [Google Scholar]
- Oppenheim, L.A.; Brill, R.H.; Barag, D.; von Saldern, A. Glass and Glassmaking in Ancient Mesopotamia. An Edition of the Cuneiform Texts which Contain Instructions for Glassmakers with a Catalogue of Surviving Objects; The Corning Museum of Glass: Corning, NY, USA, 1970. [Google Scholar]
- Gadd, C.J.; Thompson, R.C. A Middle-Babylonian chemical text. Iraq Br. Sch. Archaeol. Iraq 1936, 3, 87–96. [Google Scholar] [CrossRef]
- Pusch, E.; Rehren, T. Rubinglas für den Pharao. Forschungen in der Ramses-Stadt, Band 6, vol. 1; Gerstenberg Verlag: Hildesheim, Germany, 2007. [Google Scholar]
- Nenna, M.-D. Egyptian glass abroad: HIMT glass and its markers. In Neighbours and Successors of Rome; Keller, D., Price, J., Jackson, C., Eds.; Oxbow Books: Oxford, UK, 2014; pp. 177–193. [Google Scholar]
- Nenna, M.; Vichy, M.; Picon, M. L’atelier de verrier de Lyon, du 1er siècle apres J.-C., et l’origine des verres “romains”. Rev. d’Archéomètrie 1997, 21, 81–87. [Google Scholar]
- Nenna, M.-D.; Picon, M.; Vichy, M. Ateliers primaires et secondaires en égypt a l’époque gréco-romaine. In La route du verre; Ateliers Primaires et Secondaires du Second Millénaire av. J.-C. au Moyen Age; Actes du colloque organisé en 1989 par l’Association française pour l’Archéologie du Verre (AFAV); Nenna, M.-D., Ed.; Maison de l’Orient et de la Méditerranée Jean Pouilloux: Lyon, France, 2000; pp. 97–112. [Google Scholar]
- Freestone, I. Glass production in Late Antiquity and the Early Islamic period: A geochemical perspective. In Geomaterials in Cultural Heritage; Maggetti, M., Messiga, B., Eds.; Geological Society of London Special Publication: London, UK, 2006; pp. 210–216. ISBN 1862391955. [Google Scholar]
- Freestone, I.; Gorin-Rosen, Y.; Hughes, M. Primary glass from Israel and the production of glass in Late Antiquity and the Early Islamic period. In La Route du Verre. Ateliers Primaires et Secondaires du Second millénaire av. J.-C. au Moyen Age; Actes du colloque organisé en 1989 par l’Association française pour l’Archéologie du Verre (AFAV); Nenna, M.-D., Ed.; Maison de l’Orient et de la Méditerranée Jean Pouilloux: Lyon, France, 2000; pp. 65–83. [Google Scholar]
- Gorin-Rosen, Y. Hadera, Bet Eli’ezer. Excav. Surv. Isr. 1995, 13, 42–43. [Google Scholar]
- Gorin-Rosen, Y. The ancient glass industry in Israel: Summary of the finds and new discoveries. In La route du Verre. Ateliers Primaires et Secondaires du Second millénaire av. J.-C. au Moyen Age; Actes du colloque organisé en 1989 par l’Association française pour l’Archéologie du Verre (AFAV); Nenna, M.-D., Ed.; Maison de l’Orient et de la Méditerranée Jean Pouilloux: Lyon, France, 2000; pp. 49–63. [Google Scholar]
- Rehren, T.; Freestone, I.C. Ancient glass: From kaleidoscope to crystal ball. J. Archaeol. Sci. 2015, 56, 233–241. [Google Scholar] [CrossRef] [Green Version]
- Sayre, E. The intentional use of antimony and manganese in ancient glasses. In Advances in Glass Technology, Part 2; Plenum Press: New York, NY, USA, 1963; pp. 263–282. [Google Scholar]
- Freestone, I.C.; Degryse, P.; Lankton, J.W.; Gratuze, B.; Schneider, J. HIMT, glass composition and commodity branding in the primary glass industry. In Things that Travelled. Mediterranean Glass in the First Millennium CE; Rosenow, D., Phelps, M., Meek, A., Freestone, I.C., Eds.; UCL Press: London, UK, 2018; pp. 159–190. [Google Scholar]
- Maltoni, S.; Silvestri, A. A mosaic of colors: Investigating production technologies of roman glass tesserae from Northeastern Italy. Minerals 2018, 8. [Google Scholar] [CrossRef] [Green Version]
- James, L. Mosaics in the Medieval World; Cambridge University Press: Cambridge, UK, 2017. [Google Scholar]
- James, L.; Soproni, E.; Bjornolt, B. Mosaics by Numbers. Some Preliminary Evidence from the Leverhulme Database. In New Light on Old Glass: Recent Research on Byzantine Mosaics and Glass; Entwistle, C.L.J., Ed.; The British Museum: London, UK, 2013; pp. 310–328. [Google Scholar]
- Boschetti, C.; Henderson, J.; Evans, J.; Leonelli, C. Mosaic tesserae from Italy and the production of Mediterranean coloured glass (4rd century BCE–4th century CE). Part I: Chemical composition and technology. J. Archaeol. Sci. Rep. 2016, 7, 303–311. [Google Scholar] [CrossRef]
- James, L. Byzantine mosaic glass tesserae: Some material considerations. Byzantine Mod. Greek Stud. 2006, 30, 29–47. [Google Scholar] [CrossRef]
- Neri, E.; Jackson, M.; O’Hea, M.; Gregory, T.; Blet-Lemarquand, M.; Schibille, N. Analyses of glass tesserae from Kilise Tepe: New insights into an early Byzantine production technology. J. Archaeol. Sci. Rep. 2017, 11, 600–612. [Google Scholar] [CrossRef]
- Vandini, M.; Arletti, R.; Cirelli, E. Five Centuries of Mosaic Glass at Saint Severus (Classe, Ravenna). OCNUS 2014, 22, 91–108. [Google Scholar]
- Fiorentino, S.; Chinni, T.; Cirelli, E.; Arletti, R.; Conte, S.; Vandini, M. Considering the effects of the Byzantine–Islamic transition: Umayyad glass tesserae and vessels from the qasr of Khirbet al-Mafjar (Jericho, Palestine). Archaeol. Anthropol. Sci. 2018, 10, 223–245. [Google Scholar] [CrossRef]
- Fiorentino, S.; Vandini, M.; Chinni, T.; Caccia, M.; Martini, M.; Galli, A. Colourants and opacifiers of mosaic glass tesserae from Khirbet al-Mafjar (Jericho, Palestine): Addressing technological issues by a multi-analytical approach and evaluating the potentialities of thermoluminescence and optically stimulated luminescence da. Archaeol. Anthropol. Sci. 2019, 11, 337–359. [Google Scholar] [CrossRef]
- Fiorentino, S. Fragile connections, persistent methodology. A tailor-made archaeometric protocol to investigate technological and cultural issues in the supply of glass tesserae under the Umayyad caliphate. Doctoral Dissertation, University of Bologna, Bologna, Italy, 2019. [Google Scholar]
- Fiorentino, S.; Vandini, M. Mosaics of Cultures. Materials, production technology and circulation of glass tesserae under the Umayyad caliphate (661-750 CE). In Proceedings of the 21st Congress of the International Association for the History of glass, Istanbul, Turkey, 3–8 September 2018. [Google Scholar]
- Arletti, R.; Vezzalini, G.; Fiori, C.; Vandini, M. Mosaic glass from St Peter’s, Rome: Manufacturing techniques and raw materials employed in late 16th-century Italian opaque glass. Archaeometry 2011, 53, 364–386. [Google Scholar] [CrossRef]
- Lahlil, S.; Biron, I.; Galoisy, L.; Morin, G. Rediscovering ancient glass technologies through the examination of opacifier crystals. Appl. Phys. A Mater. Sci. Process. 2008, 92, 109–116. [Google Scholar] [CrossRef]
- Werner, A.E.; Bimson, M. Technical report on the glass gaming pieces. A La Tène III burial at Welwyn Garden City. Archaeologia 1967, 101, 1–62. [Google Scholar] [CrossRef]
- Henderson, J.; Warren, S.E. Analysis of prehistoric lead glass. In Proceedings of the 22nd Symposium on Archaeometry: Held at the University of Bradford, Bradford, UK, 30 March–3 April 1982; Aspinall, A., Warren, S., Eds.; University of Bradford: Bradford, UK, 1983; pp. 168–180. [Google Scholar]
- Tite, M.; Pradell, T.; Shortland, A. Discovery, Production and Use of Tin-Based Opacifiers in Glasses, Enamels and Glazes From the Late Iron Age Onwards: A Reassessment. Archaeometry 2008, 50, 67–84. [Google Scholar] [CrossRef]
- Venclová, N.; Křížová, Š.; Dillingerová, V.; Vaculovič, T. Hellenistic cast monochrome glass vessels from Staré Hradisko, 2nd–1st cent. BCE. J. Archaeol. Sci. Rep. 2018, 22, 540–549. [Google Scholar] [CrossRef]
- Basso, E.; Invernizzi, C.; Malagodi, M.; La Russa, M.F.; Bersani, D.; Lottici, P.P. Characterization of colorants and opacifiers in roman glass mosaic tesserae through spectroscopic and spectrometric techniques. J. Raman Spectrosc. 2014, 45, 238–245. [Google Scholar] [CrossRef]
- Verità, M.; Maggetti, M.; Saguì, L.; Santopadre, P. Colors of Roman Glass: An Investigation of the Yellow Sectilia in the Gorga Collection. J. Glass Stud. 2013, 55, 21–34. [Google Scholar]
- Maltoni, S.; Silvestri, A. Innovation and tradition in the fourth century mosaic of the Casa delle Bestie Ferite in Aquileia, Italy: Archaeometric characterisation of the glass tesserae. Archaeol. Anthropol. Sci. 2016. [Google Scholar] [CrossRef]
- Silvestri, A.; Tonietto, S.; Molin, G.; Guerriero, P. The palaeo-Christian glass mosaic of St. Prosdocimus (Padova, Italy): Archaeometric characterisation of tesserae with antimony- or phosphorus-based opacifiers. J. Archaeol. Sci. 2012, 39, 2177–2190. [Google Scholar] [CrossRef]
- Fiori, C.; Vandini, M.; Mazzotto, V. I Colori del vetro Antico. Il vetro Musivo Bizantino; Il Prato: Saonara, Italy, 2004. [Google Scholar]
- Schibille, N.; Neri, E.; Ebanista, C.; Ammar, M.R.; Bisconti, F. Something old, something new: The late antique mosaics from the catacomb of San Gennaro (Naples). J. Archaeol. Sci. Rep. 2018, 20, 411–422. [Google Scholar] [CrossRef]
- Gliozzo, E.; Santagostino Barbone, A.; Turchiano, M.; Memmi, I.; Volpe, G. The coloured tesserae decorating the vaults of the faragola balneum (Ascoli Satriano, Foggia, Southern Italy). Archaeometry 2012, 54, 311–331. [Google Scholar] [CrossRef]
- Uboldi, M.; Verità, M. Scientific analyses of glasses from Late Antique and Early Medieval archaeological sites in Northern Italy. J. Glass Stud. 2003, 115–137. [Google Scholar]
- Moretti, C.; Hreglich, S. Tecniche di produzione dei vetri opachi impiegate dai vetrai veneziani tra il XV e il XX secolo. Riv. della Stn. Sper. del Vetro 2005, 5, 15–27. [Google Scholar]
- Foster, H.E.; Jackson, C.M. A whiter shade of pale? Chemical and experimental investigation of opaque white Roman glass gaming counters. Glas. Technol. 2005, 46, 327–333. [Google Scholar]
- Molina, G.; Odin, G.P.; Pradell, T.; Shortland, A.J.; Tite, M.S. Production technology and replication of lead antimonate yellow glass from New Kingdom Egypt and the Roman Empire. J. Archaeol. Sci. 2014, 41, 171–184. [Google Scholar] [CrossRef]
- Lahlil, S.; Biron, I.; Cotte, M.; Susini, J.; Menguy, N. Synthesis of calcium antimonate nano-crystals by the 18th dynasty Egyptian glassmakers. Appl. Phys. A Mater. Sci. Process. 2010, 98, 1–8. [Google Scholar] [CrossRef] [Green Version]
- Lahlil, S.; Cotte, M.; Biron, I.; Szlachetko, J.; Menguy, N.; Susini, J. Synthesizing lead antimonate in ancient and modern opaque glass. J. Anal. At. Spectrom. 2011, 26, 1040–1050. [Google Scholar] [CrossRef]
- Mass, J.L.; Stone, R.E.; Wypyski, M.T. The mineralogical and metallurgical origins of Roman opaque colored glasses. Prehistory Hist. Glas. Technol. 1998, 1, 121–145. [Google Scholar]
- Mass, J.L.; Wypyski, M.T.; Stone, R.E. Malkata and Lisht glassmaking technologies: Towards a specific link between second millennium BC metallurgists and glassmakers. Archaeometry 2002, 44, 67–82. [Google Scholar] [CrossRef]
- Shortland, J. The use and origin of antimonate colorants in early Egyptian glass. Archaeometry 2002, 44, 517–530. [Google Scholar] [CrossRef]
- Mass, J.L.; Stone, R.E.; Wypyski, M.T. Investigation of the antimony-containing minerals used by the Romans to prepare opaque colored glasses. Mater. Res. Soc. Symp.-Proc. 1997, 462, 193–204. [Google Scholar] [CrossRef]
- Turner, W.; Rooksby, H. A study of the opalising agents in opal glasses throughout threethousandfour hundred years. Glas. Berichte 1959, 32K, 17–28. [Google Scholar]
- Bimson, M.; Freestone, I.C. An analytical study of the relationship between the Portland vase and other Roman cameo glasses. J. Glass Stud. 1983, 25, 55–65. [Google Scholar]
- Henderson, J. Technological characteristics of Roman enamels. Jewel. Stud. 1991, 5, 65–76. [Google Scholar]
- Zacharias, N.; Karavassili, F.; Das, P.; Nicolopoulos, S.; Oikonomou, A.; Galanis, A.; Rauch, E.; Arenal, R.; Portillo, J.; Roque, J.; et al. A novelty for cultural heritage material analysis: Transmission Electron Microscope (TEM) 3D electron diffraction tomography applied to Roman glass tesserae. Microchem. J. 2018, 138, 19–25. [Google Scholar] [CrossRef]
- Rehren, T.; Shortland, A.J.; Mass, J.L.; Stone, R.E. Comments on J.L., Mass, M.T., Wypyski and R.E., Stone, 2002. Malkata and Lisht glassmaking technologies: Towards a specific link between second millennium BC metallurgists and glassmakers, Archaeometry 44, 67–82, and reply. Archaeometry 2003, 45, 185–198. [Google Scholar] [CrossRef]
- Ricciardi, P.; Colomban, P.; Tournié, A.; Macchiarola, M.; Ayed, N. A non-invasive study of Roman Age mosaic glass tesserae by means of Raman spectroscopy. J. Archaeol. Sci. 2009, 36, 2551–2559. [Google Scholar] [CrossRef]
- Zhao, H.; Li, Q.; Liu, S.; Gan, F. Characterization of microcrystals in some ancient glass beads from china by means of confocal Raman microspectroscopy. J. Raman Spectrosc. 2013, 44, 643–649. [Google Scholar] [CrossRef]
- Rosi, F.; Manuali, V.; Miliani, C.; Brunetti, B.G.; Sgamellotti, A.; Grygar, T.; Hradil, D. Raman scattering features of lead pyroantimonate compounds. Part I: XRD and Raman characterization of Pb2Sb2O7 doped with tin and zinc. J. Raman Spectrosc. 2009, 40, 107–111. [Google Scholar] [CrossRef]
- Rosi, F.; Manuali, V.; Grygar, T.; Bezdicka, P.; Brunetti, B.G.; Sgamellotti, A.; Burgio, L.; Seccaroni, C.; Miliani, C. Raman scattering features of lead pyroantimonate compounds: Implication for the non-invasive identification of yellow pigments on ancient ceramics. Part II. in situ characterisation of Renaissance plates by portable micro-Raman and XRF studies. J. Raman Spectrosc. 2011, 42, 407–414. [Google Scholar] [CrossRef]
- Paynter, S.; Kearns, T.; Cool, H.; Chenery, S. Roman coloured glass in the Western provinces: The glass cakes and tesserae from West Clacton in England. J. Archaeol. Sci. 2015, 62, 66–81. [Google Scholar] [CrossRef] [Green Version]
- Turner, W.E.S.; Rooksby, H.P. Further historical studies based on Xray diffraction methods of the reagents employed in making opal and opaque glasses. Jahrb. des Römisch-Germanischen Zentralmuseum 1961, 8, 1–6. [Google Scholar]
- Freestone, I.C.; Bimson, M.; Buckton, D. Compositional categories of Byzantine glass tesserae. In Annals of the 11th Congress of the International Association for the History of Glass; AIHV: Amsterdam, The Netherlands, 1988; pp. 77–83. [Google Scholar]
- Bonnerot, O.; Ceglia, A.; Michaelides, D. Technology and materials of Early Christian Cypriot wall mosaics. J. Archaeol. Sci. Rep. 2016, 7, 649–661. [Google Scholar] [CrossRef]
- Brill, R.; Cahill, N. A red opaque glass from Sardis and some thoughts on red opaques in general. J. Glass Stud. 1988, 30, 16–27. [Google Scholar]
- Cable, M.; Smedley, J. The replication of an opaque red glass from Nimrud, in Bimson and Freestone 1987. In Early Vitreous Materials. British Museum Occasional Paper No.56; British Museum Occasional Paper: London, UK, 1987; pp. 151–164. [Google Scholar]
- Shugar, A. Byzantine Opaque Red Glass Tesserae from Beit Shean, Israel. Archaeometry 2000, 42, 375–384. [Google Scholar] [CrossRef]
- Wypyski, M.T. Technical Analysis of Glass Mosaic Tesserae from Amorium. Dumbart. Oaks Pap. 2006, 59, 183–192. [Google Scholar] [CrossRef]
- Schibille, N.; McKenzie, J. Glass tesserae from Hagios Polyeuktos, Costantinopole: Their early Bizantine affiliations. In Neighbours and Successors of Rome; Keller, D., Price, J., Jackson, C., Eds.; Oxbow Books: Oxford, UK, 2014; pp. 114–127. [Google Scholar]
- Silvestri, A.; Tonietto, S.; Molin, G.; Guerriero, P. The palaeo-Christian glass mosaic of St. Prosdocimus (Padova, Italy): Archaeometric characterisation of tesserae with copper- or tin-based opacifiers. J. Archaeol. Sci. 2014, 42, 51–67. [Google Scholar] [CrossRef]
- Wypyski, M.T.; Becker, I. Glassmaking technology at Antioch. Evidence from the Atrium House Triclinium and later mosaics. In The Arts of Antioch. Art Historical and Scientific Approaches to Roman Mosaics and a Catalogue of the Worcester Art Museum Antioch Collection; Becker, L., Kondoleon, C., Eds.; Princeton University Press: Worcester, MA, USA, 2005; pp. 115–175. [Google Scholar]
- Schibille, N.; Degryse, P.; Corremans, M.; Specht, C. Chemical characterisation of glass mosaic tesserae from sixth-century Sagalassos (south-west Turkey): Chronology and production techniques. J. Archaeol. Sci. 2012, 39, 1480–1492. [Google Scholar] [CrossRef]
- Henderson, J. The scientific investigation of the glass beads from the Apple Down Anglo-Saxon Cemetry. In Apple Down and the Mardens, Chichester Excavations 7, Chichester District Council; Down, A., Welc, M., Eds.; Chichester District Council: Chichester, UK, 1990; pp. 156–164. [Google Scholar]
- Bayley, J. Glassworking in early medieval England. In Glass in Britain and Ireland AD 350–1100; Price, J., Ed.; British Museum Occasional Paper: London, UK, 2000; Volume 127, pp. 137–142. [Google Scholar]
- Henderson, J. The raw materials of early glass production. Oxford J. Archaeol. 1988, 4, 267–291. [Google Scholar] [CrossRef]
- Sablerrolles, Y.; Henderson, J.; Dijkman, W. Early medieval glass bead making in Maastricht (Jodenstraat 30), The Netherlands. An archaeological and scientific investigation (eds). In Perlen, Archäologie, Techniken, Analysen; Akten des Internationalen Perlensymposiums in Mann; Frreden, U., Wieczorek, A., Eds.; Regesta Imperii: Bonn, Germany, 1997. [Google Scholar]
- Arletti, R.; Conte, S.; Vandini, M.; Fiori, C.; Bracci, S.; Bacci, M.; Porcinai, S. Florence baptistery: Chemical and mineralogical investigation of glass mosaic tesserae. J. Archaeol. Sci. 2011, 38, 79–88. [Google Scholar] [CrossRef]
- Heck, M.; Hoffmann, P. Coloured opaque glass bead of the Merovingians. Archaeometry 2000, 42, 341–357. [Google Scholar] [CrossRef]
- Heck, M.; Rehren, T.; Hoffmann, P. The production of lead-tin yellow at merovingian schleitheim (Switzerland). Archaeometry 2003, 45, 33–44. [Google Scholar] [CrossRef]
- Matin, M.; Tite, M.; Watson, O. On the origins of tin-opacified ceramic glazes: New evidence from early Islamic Egypt, the Levant, Mesopotamia, Iran, and Central Asia. J. Archaeol. Sci. 2018, 97, 42–66. [Google Scholar] [CrossRef]
- Matin, M. Tin-based opacifiers in archaeological glass and ceramic glazes: A review and new perspectives. Archaeol. Anthropol. Sci. 2019, 11, 1155–1167. [Google Scholar] [CrossRef] [Green Version]
- Biek, L.; Kay, P.J. Evidence of glass melting. In Excavations at Catsgore 1970–1973, a Romano-British Village; Leech, R., Ed.; Western Archaeological Trust Excavation Monograph: Bristol, UK, 1982; pp. 132–133. [Google Scholar]
- Rooksky, H.P. Opacifiers in opal glasses through the ages. GEC J. Sci. Technol. 1962, 29, 20–26. [Google Scholar]
- Henderson, J. Scientific analysis of the glass and the glass-bearing artefacts: Technique, raw materials used and archaeological interpretation. In The Excavation Near Wijnaldum. Reports on Frisia in Roman and Medieval Times, Vol. 1; Besteman, J., Bos, J., Gerret, D., Heidinga, H., Eds.; CRC Press: Boca Raton, FL, USA, 1999; pp. 287–289. [Google Scholar]
- Peake, J.; Freestone, I.C. Opaque yellow glass production in the early medieval period: New evidence. In Neighbours and Successors of Rome: Traditions of Glass Production and Use in Europe and the Middle East in the Later 1st Millennium AD; Keller, D., Price, J., Jackson, C., Eds.; Oxbow Books: Oxford, UK, 2014; pp. 15–21. [Google Scholar]
- Fiori, C. Mosaic Tesserae from the Basilica of San Severo and Glass Production in Classe, Ravenna, Italy. In New Light on Old Glass: Recent Research on Byzantine Mosaics and Glass; Entwistle, C., James, L., Eds.; The British Museum: London, UK, 2013; pp. 33–41. [Google Scholar]
- Neri, E.; Verità, M.; Conventi, A. Glass Mosaic Tesserae from the 5th to the 6th Century Baptistery of San Giovanni alle Fonti, Milan, Italy. In New Light on Old Glass: Recent Research on Byzantine Mosaics and Glass; Faulks, S., Ed.; The British Museum: London, UK, 2013; pp. 1–10. [Google Scholar]
- Marii, F. Glass Tesserae from the Petra Church. In New Light on Old Glass: Recent Research on Byzantine Mosaics and Glass; Entwistle, C., James, L., Eds.; The British Museum: London, UK, 2013; pp. 11–24. [Google Scholar]
- Verità, M.; Santopadre, P.; De Palma, G. Scientific investigation of glass mosaic tesserae from the 8th century AD archaeological site of Qusayr’ Amra (Jordan). Boll. ICR 2017, 32, 7–18. [Google Scholar]
- Pilosi, L.; Stamm, K.; Wypyski, M.T. An Islamic cameo glass fragment in the Metropolitan Museum of Art. In Proceedings of the Annales du 18e Congrès de l’Association Internationale pour l’Histoire du Verre (Thessaloniki 2009); ZITI Publishing: Thessaloniki, Greece, 2012; pp. 341–345. [Google Scholar]
- Wypyski, M.T. Chemical analysis of early Islamic glass from Nishapur. J. Glas. Stud. 2015, 57, 131–136. [Google Scholar]
- Schibille, N.; Meek, A.; Wypyski, M.T.; Kröger, J.; Rosser-Owen, M.; Haddon, R.W. The glass walls of Samarra (Iraq): Ninth-century Abbasid glass production and imports. PLoS ONE 2018, 13, 5–7. [Google Scholar] [CrossRef] [Green Version]
- Verità, M. Tecniche di fabbricazione dei materiali musivi vitrei: Indagini chimiche e mineralogiche. In Medieval Mosaics: Light, Color, Materials; Borsook, E., Gioffredi-Superbi, F., Pagliarulo, G., Eds.; Silvana Editoriale: Milano, Italy, 2000; pp. 47–64. [Google Scholar]
- Šefců, R.; Chlumská, Š.; Hostašová, A. An investigation of the lead tin yellows type I and II and their use in Bohemian panel paintings from the Gothic period. Herit. Sci. 2015, 3. [Google Scholar] [CrossRef] [Green Version]
- Welter, N.; Schüssler, U.; Kiefer, W. Characterisation of inorganic pigments in ancient glass beads by means of Raman microscpectroscopy, microprobe analysis and X-ray diffractometry. J. Raman Spectrosc. 2007, 38, 113–121. [Google Scholar] [CrossRef]
- Eastaugh, N.; Walsh, V.; Chaplin, T.; Siddall, R. Pigment Compendium. A Dictionary and Optical Microscopy of Historical Pigments; Routledge: London, UK, 2008. [Google Scholar]
- Bouchard, M.; Smith, D. Catalogue of 45 reference Raman spectra of minerals concerning research in art history or archaeology, especially on corroded metals and coloured glass. Spectrochim. Acta-Part A Mol. Biomol. Spectrosc. 2003, 59, 2247–2266. [Google Scholar] [CrossRef]
- Freestone, I.C. Composition and microstructure of early opaque red glass. In Early Vitreous Materials. British Museum Occasional Paper no.56; Bimson, M., Freestone, I.C., Eds.; British Museum Press: London, UK, 1987; pp. 173–191. [Google Scholar]
- Brill, R. The Chemical Interpretation of the Texts. In Glass and Glassmaking in Ancient Mesopotamia; Barag, D., Brill, R.H., Oppenheim, D., von Saldern, A., Eds.; The Corning Museum of Glass: Corning, NY, USA, 1970. [Google Scholar]
- Hughes, M. A technical study of opaque red glass of the Iron Age in Britain. In Proceedings of the Prehistoric Society; Cambridge University Press: Cambridge, UK, 1972; Volume 38, pp. 98–107. [Google Scholar]
- Henderson, J. Ancient Glass: An Interdisciplinary Exploration; University Press: Cambridge, UK, 2013. [Google Scholar]
- Barber, D.; Freestone, I.; Moulding, K. Ancient copper red glasses: Investigation and analysis by microbeam techniques. In From Mine to Microscope–Advances in the Study of Ancient Technology; Shortland, A., Freestone, I., Rehren, T., Eds.; Oxbow Books: London, UK, 2010; pp. 115–127. ISBN 978-1-84217-259-9. [Google Scholar]
- Freestone, I.; Stapleton, C.; Rigby, V. The production of red glass and enamel in the Late Iron Age, Roman and Byzantine periods. In Through a Glass Brightly: Studies in Byzantine and Medieval Art and Archaeology Presented to David Buckton; Entwistle, C., Ed.; Oxbow Books: London, UK, 2003; pp. 142–154. [Google Scholar]
- Arletti, R.; Dalconi, M.C.; Quartieri, S.; Triscari, M.; Vezzalini, G. Roman coloured and opaque glass: A chemical and spectroscopic study. Appl. Phys. A Mater. Sci. Process. 2006, 83, 239–245. [Google Scholar] [CrossRef]
- Silvestri, A.; Tonietto, S.; D’Acapito, F.; Molin, G. The role of copper on colour of palaeo-Christian glass mosaic tesserae: An XAS study. J. Cult. Herit. 2012, 13, 137–144. [Google Scholar] [CrossRef]
- Maltoni, S.; Silvestri, A.; Molin, G. Opaque red glass tesserae from Roman and early-Byzantine sites of north-eastern Italy: New light on production technologies. In Proceedings of the Annales du 20e Congrès de l’Association Internationale Pour l’Histoire du Verre, Fribourg, Switzerland, 7–11 September 2015; pp. 280–287. [Google Scholar]
- Silvestri, A.; Nestola, F.; Peruzzo, L. Multi-methodological characterisation of calcium phosphate in late-Antique glass mosaic tesserae. Microchem. J. 2016, 124, 811–818. [Google Scholar] [CrossRef]
- Serra, C.; Silvestri, A.; Molin, G. Archaeometric characterization of vitreous mosaic from Tyana (Cappadocia). In Proceedings of the Late Antique/Early Byzantine Glass in the Eastern Mediterranean. Colloquia Anatolica et Aegaea-Acta Congressus Communis Omnium Gentium Smyrnae II; Laflı, E., Ed.; Ege Yayinlari: Izmir, Turkey, 2009; pp. 171–183. [Google Scholar]
- Marii, F.; Rehren, T. Archaeological Coloured Glass Cakes and Tesserae from the Petra Church. In Annales du 17e Congres del’Association Internationale pour l’Histoire du verre; Janssens, K., Ed.; Academic and Scientific Publishers: Brussels, Belgium, 2009; pp. 295–300. [Google Scholar]
- Verità, M. Tessere vitree del battistero Neoniano: Tecniche e provenienza. In Il Battistero Neoniano. Uno Sguardo Attraverso il Restauro; Muscolino, C., Ranaldi, A., Tedeschi, C., Eds.; Angelo Longo Editore: Ravenna, Italy, 2011; pp. 73–87. [Google Scholar]
- Maltoni, S.; Silvestri, A. Investigating a Byzantine technology: Experimental replicas of Ca-phosphate opacified glass. J. Cult. Herit. 2019. [Google Scholar] [CrossRef]
- Penel, G.; Cau, E.; Delfosse, C.; Rey, C.; Hardouin, P.; Jeanfils, J.; Delecourt, C.; Lemaitre, J.; Leroy, G. Raman microspectrometry studies of calcified tissues and related biomaterials. Dent. Med. Probl. 2003, 40, 37–43. [Google Scholar]
- Antonakos, A.; Liarokapis, E.; Leventouri, T. Micro-Raman and FTIR studies of synthetic and natural apatites. Biomaterials 2007, 28, 3043–3054. [Google Scholar] [CrossRef]
Figure 1.
Back-scattered electron signal (BSE) images of the micro-textures of (a) blue- and (b) white-colored glass tesserae (SSV_B1 blue and and SSV_W1 white natron-based tesserae from the monastic complex of San Severo in Classe, Ravenna, Italy—unpublished data).
Figure 1.
Back-scattered electron signal (BSE) images of the micro-textures of (a) blue- and (b) white-colored glass tesserae (SSV_B1 blue and and SSV_W1 white natron-based tesserae from the monastic complex of San Severo in Classe, Ravenna, Italy—unpublished data).

Figure 2.
BSE images (1000×) of the micro-textures of (a) SSV_B1 blue- and (b) SSV_W1 white-colored natron-based tesserae from the monastic complex of San Severo in Classe, Ravenna, Italy—unpublished data. Note that only sporadic inclusions are detectable.
Figure 2.
BSE images (1000×) of the micro-textures of (a) SSV_B1 blue- and (b) SSV_W1 white-colored natron-based tesserae from the monastic complex of San Severo in Classe, Ravenna, Italy—unpublished data. Note that only sporadic inclusions are detectable.

Figure 3.
(a,b) BSE images of micrometric crystals with euhedral habit, found either in clusters or isolated in SSV_W1 white and SSV_B1 blue natron-based tesserae (monastic complex of San Severo in Classe, Ravenna, Italy-unpublished data); (c,d) sub-micrometric euhedral crystals compactly arranged together in a circular conformation (rosary-shaped cluster).


Figure 4.
EDS measurements performed on (a) euhedral crystals and (b) rosary-shaped aggregates, mainly made of Sb. Relatively high amount of Si can be noticed in the spectrum acquired on the euhedral inclusions, due to the interference of glassy matrix in the measurement; O, Na, Mg, Al, Cl, Ca, and Fe can be attributed to the glassy matrix as well (SSV_B1 blue sample from the monastery of San Severo in Classe, Ravenna, Italy—unpublished data).

Figure 5.
Raman spectrum acquired on rosary-shaped aggregates (SSV_B1 blue sample from the monastery of San Severo in Classe, Ravenna, Italy—unpublished data), with bands at 632 and 480 cm−1 demonstrating that they are made of cubic Ca2Sb2O7 [15].
Figure 5.
Raman spectrum acquired on rosary-shaped aggregates (SSV_B1 blue sample from the monastery of San Severo in Classe, Ravenna, Italy—unpublished data), with bands at 632 and 480 cm−1 demonstrating that they are made of cubic Ca2Sb2O7 [15].


Figure 6.
Raman spectrum acquired on euhedral crystals (SSV_B1 blue sample from the monastery of San Severo in Classe, Ravenna, Italy—unpublished data), with bands at 672, 632, 521, 480, 339, 324, and 239 cm−1 demonstrating the co-existence of both cubic Ca2Sb2O7 and hexagonal CaSb2O6 [15].
Figure 6.
Raman spectrum acquired on euhedral crystals (SSV_B1 blue sample from the monastery of San Severo in Classe, Ravenna, Italy—unpublished data), with bands at 672, 632, 521, 480, 339, 324, and 239 cm−1 demonstrating the co-existence of both cubic Ca2Sb2O7 and hexagonal CaSb2O6 [15].

Figure 7.
X-ray diffraction pattern showing the presence of hexagonal CaSb2O6 in the glass (SSV_B1 blue sample from the monastery of San Severo in Classe, Ravenna, Italy—unpublished data).
Figure 7.
X-ray diffraction pattern showing the presence of hexagonal CaSb2O6 in the glass (SSV_B1 blue sample from the monastery of San Severo in Classe, Ravenna, Italy—unpublished data).

Figure 8.
X-ray diffraction pattern demonstrating the presence of both cubic Ca2Sb2O7 and hexagonal CaSb2O6 phases in the glass (SSV_B1 blue sample from the monastery of San Severo in Classe, Ravenna, Italy—unpublished data).
Figure 8.
X-ray diffraction pattern demonstrating the presence of both cubic Ca2Sb2O7 and hexagonal CaSb2O6 phases in the glass (SSV_B1 blue sample from the monastery of San Severo in Classe, Ravenna, Italy—unpublished data).

Figure 9.
BSE images of the vitreous matrices of (a) yellow and (b) green tesserae (SSV_Y1 yellow and SSV_G6 green natron-based tesserae from the monastic complex of San Severo in Classe, Ravenna, Italy—unpublished data). Please note the non-homogeneous textures with zoned bands (c) and dotted with unevenly distributed micrometric and sub-micrometric crystals, either alone or in clusters (d).

Figure 10.
BSE images of the micrometric and sub-micrometric crystals detected in the glassy matrix, with (a) anhedral or (b) subhedral habitus (SSV_Y1 yellow sample from the monastery of San Severo in Classe, Ravenna, Italy—unpublished data).
Figure 10.
BSE images of the micrometric and sub-micrometric crystals detected in the glassy matrix, with (a) anhedral or (b) subhedral habitus (SSV_Y1 yellow sample from the monastery of San Severo in Classe, Ravenna, Italy—unpublished data).

Figure 11.
EDS spectrum acquired on the crystals shown in Figure 10a, mainly made of Pb and Sb. The presence of O, Na, Si, Ca, and Fe could be attributed to interference of the glassy matrix in the measurement (SSV_Y1 yellow sample from the monastery of San Severo in Classe, Ravenna, Italy—unpublished data).

Figure 12.
Raman spectrum acquired on lead antimonate crystals, with bands at 139, 335, and 510 cm−1, consistent with bindhemite, cubic pyrochlore Pb2Sb2O7 [55] SSV_Y1 yellow sample from the monastery of San Severo in Classe, Ravenna, Italy—unpublished data).
Figure 12.
Raman spectrum acquired on lead antimonate crystals, with bands at 139, 335, and 510 cm−1, consistent with bindhemite, cubic pyrochlore Pb2Sb2O7 [55] SSV_Y1 yellow sample from the monastery of San Severo in Classe, Ravenna, Italy—unpublished data).

Figure 13.
X-ray diffraction pattern of yellow glass containing lead-antimonate, consistent with bindhemite, cubic pyrochlore Pb2Sb2O7 (SSV_Y1 yellow sample from the monastery of San Severo in Classe, Ravenna, Italy—unpublished data).
Figure 13.
X-ray diffraction pattern of yellow glass containing lead-antimonate, consistent with bindhemite, cubic pyrochlore Pb2Sb2O7 (SSV_Y1 yellow sample from the monastery of San Severo in Classe, Ravenna, Italy—unpublished data).

Figure 14.
(a) BSE image of homogeneous micro-texture of the vitreous matrix, dotted with unevenly distributed micrometric crystals, either alone or in clusters, (b) BSE image at 500X, and (c) BSE image at 100×, where the distribution of crystal could be better evaluated (DMS_11M green/yellow natron-based tessera, Apollonia-type glass, from the Great Mosque of Damascus, Syria—unpublished data [24,25]).

Figure 15.
BSE images of crystals with anhedral (a,b) or subhedral (c) habitus (DMS_11M green/yellow natron-based tessera, Apollonia-type glass, from the Great Mosque of Damascus, Syria—unpublished data [24,25]).


Figure 16.
EDS spectrum acquired on anhedral crystals, mainly made of Pb and Sb; the presence of Sn was also detected. O, Na, Al, Si, Ca, and Fe could be referred to the interference of the vitreous matrix in the measurement (DMS_11 green/yellow sample from the Great Mosque of Damascus, Syria—unpublished data [24,25]).

Figure 17.
Raman spectrum acquired on lead–tin–antimonate crystals (DMS_11 green/yellow sample from the Great Mosque of Damascus, Syria—unpublished data [24,25]), with bands at 140, 332, 450, and 510 cm−1 consistent with lead antimonate doped with tin [57]. Note the additional bands at 970–980 cm−1, ascribable to noselite [32].


Figure 18.
X-ray diffraction pattern compared to generic syntetic pyrochlore containing lead, antimony, and tin. Only the main peak could be detected in the analyzed sample (DMS_11 green/yellow sample from the Great Mosque of Damascus, Syria—unpublished data [24,25]).

Figure 19.
BSE image of the micro-texture of the vitreous matrix (SP23 white plant ash-based glass tessera from the Basilica of St. Peter in Rome, Italy [26]), showing an almost homogeneous micro-texture (a) with sporadic, unevenly distributed micrometric inclusions, as clusters of crystals with subhedral habit (b).

Figure 20.
BSE image of (a) the micro-texture of the vitreous matrix, with (b) sporadic micrometric crystals showing an anhedral habit, found as small aggregates (SSV_R1 red natron-based glass tessera from the monastic complex of San Severo in Classe, Ravenna—unpublished data).
Figure 20.
BSE image of (a) the micro-texture of the vitreous matrix, with (b) sporadic micrometric crystals showing an anhedral habit, found as small aggregates (SSV_R1 red natron-based glass tessera from the monastic complex of San Severo in Classe, Ravenna—unpublished data).

Figure 21.
EDS spectrum acquired on subhedral crystals, mainly made of Sn. O and Si are due to the interference of the glassy matrix in the measurement (SP23 white plant ash-based glass tessera from the Basilica of St. Peter in Rome, Italy [26]).
Figure 21.
EDS spectrum acquired on subhedral crystals, mainly made of Sn. O and Si are due to the interference of the glassy matrix in the measurement (SP23 white plant ash-based glass tessera from the Basilica of St. Peter in Rome, Italy [26]).

Figure 22.
EDS spectrum acquired on subhedral crystals, mainly made of Sn. O and Si are due to the interference of the glassy matrix in the measurement (SSV_R1 red natron-based glass tessera from the monastic complex of San Severo in Classe, Ravenna—unpublished data).
Figure 22.
EDS spectrum acquired on subhedral crystals, mainly made of Sn. O and Si are due to the interference of the glassy matrix in the measurement (SSV_R1 red natron-based glass tessera from the monastic complex of San Severo in Classe, Ravenna—unpublished data).

Figure 23.
μ-Raman spectrum acquired on euhedral crystals with bands at about 776, 635, and 477 cm−1, ascribable to SnO2 [55] (SP23 planta ash-based white glass tesserae from the Basilica of St. Peter in Rome [26]).

Figure 24.
μ-Raman spectrum acquired on Sn-based crystals found in red glasses, with bands at about 775, 633, and 475 cm−1, ascribable to SnO2 [55] (SSV_R1 red natron-based glass tessera from the monastic complex of San Severo in Classe, Ravenna—unpublished data).
Figure 24.
μ-Raman spectrum acquired on Sn-based crystals found in red glasses, with bands at about 775, 633, and 475 cm−1, ascribable to SnO2 [55] (SSV_R1 red natron-based glass tessera from the monastic complex of San Severo in Classe, Ravenna—unpublished data).

Figure 25.
X-ray diffraction pattern acquired on opaque white glass colored and opacified by tin-based phases, confirming the presence of SnO2 (SP23 planta ash-based white glass tesserae from the Basilica of St. Peter in Rome [26]).
Figure 25.
X-ray diffraction pattern acquired on opaque white glass colored and opacified by tin-based phases, confirming the presence of SnO2 (SP23 planta ash-based white glass tesserae from the Basilica of St. Peter in Rome [26]).

Figure 26.
X-ray diffraction pattern only showing the presence of metallic copper. No SnO2 could be detected (SSV_R1 red natron-based glass tessera from the monastic complex of San Severo in Classe, Ravenna—unpublished data).
Figure 26.
X-ray diffraction pattern only showing the presence of metallic copper. No SnO2 could be detected (SSV_R1 red natron-based glass tessera from the monastic complex of San Severo in Classe, Ravenna—unpublished data).

Figure 27.
BSE images of the micro-texture of the vitreous matrices of yellow (a,b) and green (c,d) glasses. Highly non-homogeneous micro-textures could be observed, with lighter bands of higher average atomic number detectable in BSE (DMS_2Bb yellow natron-based Egypt I glass tessera and DMS_1Ab green natron-based Egypt I glass tessera from the Great Mosque of Damascus, Syria—unpublished data [24,25]).

Figure 28.
Clusters of micrometric subhedral crystals found in the matrices (a,b), mainly concentrated in the bands (DMS_2Bb yellow natron-based Egypt I tessera from the Great Mosque of Damascus—unpublished data [24,25]). These crystals often show the presence of greyish, lower average atomic number zones (c,d).

Figure 29.
EDS spectrum acquired on the subhedral crystals, mainly made of Pb and Sn; O, Na, Mg, Al, Si, Cl, and Fe were due to the interference of the vitreous matrix in the measurement (DMS_2Bb natron-based Egypt I yellow tessera from the Great Mosque of Damascus, Syria—unpublished data [24,25]).

Figure 30.
Comparison between EDS spectra acquired on grey (in red) and white (in black) zones found on subhedral crystals. White, lighter zones showed relatively higher Pb and noticeably lower Si contents; O, Na, Mg, Al, Si, Cl, and Fe were due to the interference of the vitreous matrix in the measurement (DMS_2Bb natron-based Egypt I yellow tessera from the Great Mosque of Damascus, Syria—unpublished data [24,25]).

Figure 31.
Mixed clusters made of micrometric subhedral and thin, sub-micrometric acicular crystals, also found in the matrices (a,b); clusters only made of acicular crystals (c,d), mainly found in green-colored glasses (DMS_1Ab green natron-based Egypt I glass tessera from the Great Mosque of Damascus, Syria—unpublished data [24,25]).

Figure 32.
EDS spectrum acquired on the subhedral crystals in mixed clusters, mainly made of Pb and Sn; O, Na, Al, and Si are due to the interference of the vitreous matrix in the measurement (DMS_1Ab green natron-based Egypt I glass tessera from the Great Mosque of Damascus, Syria—unpublished data [24,25]).

Figure 33.
EDS spectrum acquired on the acicular crystals, mainly made of Sn. Pb was also detected in lower amount as compared to the subhedral crystals; O, Na, Al, Si, and Fe were due to the interference of the vitreous matrix in the measurement (DMS_1Ab green natron-based Egypt I glass tessera from the Great Mosque of Damascus, Syria—unpublished data [24,25]).

Figure 34.
Raman spectrum acquired on subhedral crystals, with bands at 67, 136, 326, and 456 cm−1 consistent with Lead–Tin Yellow type II, PbSn1−xSixO3 [55] (DMS_2Bb yellow natron-based Egypt I glass tessera from the Great Mosque of Damascus, Syria—unpublished data [24,25]).

Figure 35.
X-ray diffraction pattern showing a close match between the yellow-colored tesserae with Pb–Sn-based phases and PbSnO3 (DMS_2Bb yellow natron-based Egypt I glass tessera from the Great Mosque of Damascus, Syria—unpublished data [24,25]).

Figure 36.
Raman spectrum acquired on the acicular-shaped crystals, with the only detected band at 632 cm−1 (DMS_1Ab green natron-based Egypt I glass tessera from the Great Mosque of Damascus Syria—unpublished data [24,25]).

Figure 37.
X-ray diffraction pattern of a green-colored tessera showing, in addition to PbSnO3, the presence of SnO2 as well (DMS_1Ab green natron-based Egypt I glass tessera from the Great Mosque of Damascus Syria—unpublished data [24,25]).

Figure 38.
BSE images of a sealing wax red-colored glass, with (a) details of the vitreous matrix and (b) micrometric inclusions in the shape of dendrites (SP5 orange/red plant ash-based glass tessera from the Basilica of St. Peter, Rome, Italy [26]).
Figure 38.
BSE images of a sealing wax red-colored glass, with (a) details of the vitreous matrix and (b) micrometric inclusions in the shape of dendrites (SP5 orange/red plant ash-based glass tessera from the Basilica of St. Peter, Rome, Italy [26]).

Figure 39.
EDS spectrum acquired on the rounded inclusions, exclusively made of Cu (SP5 orange/red plant ash-based glass tessera from the Basilica of St. Peter, Rome, Italy [26]).
Figure 39.
EDS spectrum acquired on the rounded inclusions, exclusively made of Cu (SP5 orange/red plant ash-based glass tessera from the Basilica of St. Peter, Rome, Italy [26]).

Figure 40.
EDS spectrum acquired on the rounded inclusions, exclusively made of Cu (KH_R1 red natron-based Egypt I glass tessera from Khirbet al-Mafjar, Palestine [23]).
Figure 40.
EDS spectrum acquired on the rounded inclusions, exclusively made of Cu (KH_R1 red natron-based Egypt I glass tessera from Khirbet al-Mafjar, Palestine [23]).

Figure 41.
BSE images of “dullish” red-colored glass (KH_R1 natron-based Egypt I glass tessera from Khirbet al-Mafjar, Palestine [23]), showing the micro-textures of the vitreous matrix (a), dotted with regularly distributed nanometric rounded particles (b).
Figure 41.
BSE images of “dullish” red-colored glass (KH_R1 natron-based Egypt I glass tessera from Khirbet al-Mafjar, Palestine [23]), showing the micro-textures of the vitreous matrix (a), dotted with regularly distributed nanometric rounded particles (b).

Figure 42.
X-ray diffraction pattern (SP5 orange/red plant ash-based glass tessera from the Basilica of St. Peter, Rome, Italy [26]) showing the presence of both curpite (Cu2O) and cassiterite (SnO2).
Figure 42.
X-ray diffraction pattern (SP5 orange/red plant ash-based glass tessera from the Basilica of St. Peter, Rome, Italy [26]) showing the presence of both curpite (Cu2O) and cassiterite (SnO2).

Figure 43.
X-ray diffraction pattern of “dullish” red glass, demonstrating the presence of metallic copper (KH_R1 red natron-based Egypt I glass tessera from Khirbet al-Mafjar, Palestine [23]).
Figure 43.
X-ray diffraction pattern of “dullish” red glass, demonstrating the presence of metallic copper (KH_R1 red natron-based Egypt I glass tessera from Khirbet al-Mafjar, Palestine [23]).

Figure 44.
Textural and micro-textural details of a red/green striped glass tessera (sample DMS_13Ngr from the Great Mosque of Damascus, Foy-2 natron glass—unpublished data [24]): (a) OM image; (b) BSE images showing non-homogenous, zoned vitreous matrix; and (c) BSE detail of the area where the green and red glass are juxtaposed. Note the nanometric rounded particles.

Figure 45.
EDS spectra acquired on the (a) red and (b) green stripes of glass (DMS_13Ngr green and red striped natron-based Foy-2 glass tessera from the Great Mosque of Damascus—unpublished data [24]).
Figure 45.
EDS spectra acquired on the (a) red and (b) green stripes of glass (DMS_13Ngr green and red striped natron-based Foy-2 glass tessera from the Great Mosque of Damascus—unpublished data [24]).

Figure 46.
BSE images of light blue glass tessera opacified with Ca-phosphate (KH_G10 light blue natron-based Egypt I glass tessera from Khirbet al-Mafjar, Palestine [23]). Note the non-homogeneous micro-texture of the vitreous matrix, dotted with gas bubbles (a) and the presence of millimetric inclusions unevenly dispersed inside it, either with reaction rims (b,c) or compact (d).

Figure 47.
EDS spectra acquired on the (a) core and (b) rim of the inclusions. Note: Na and Si enrichment in the rim; O, Na, Mg, Si, Al, Cl, K, and Cu are due to the interference of the glassy matrix in the measurement (KH_G10 light blue natron-based Egypt I glass tessera from Khirbet al-Mafjar, Palestine 33).

Figure 48.
μ-Raman spectra acquired on the (a) core and the (b) rim of bigger Ca-phosphate inclusions (KH_G10 light blue natron-based Egypt I glass tessera from Khirbet al-Mafjar, Palestine [23]). Attribution of bands in the spectra is provided below, in Figure 48d. (c) μ-Raman spectra acquired on smaller, more compact Ca-phosphate inclusions, consisting hydroxyapatite (KH_G10 light blue natron-based Egypt I glass tessera from Khirbet al-Mafjar, Palestine [23]); and (d) bands attribution according to [104,109,110].


Figure 49.
X-ray diffraction pattern of light blue tessera opacified with Ca-phosphate (KH_G10 light blue natron-based Egypt I glass tessera from Khirbet al-Mafjar, Palestine [23]).
Figure 49.
X-ray diffraction pattern of light blue tessera opacified with Ca-phosphate (KH_G10 light blue natron-based Egypt I glass tessera from Khirbet al-Mafjar, Palestine [23]).


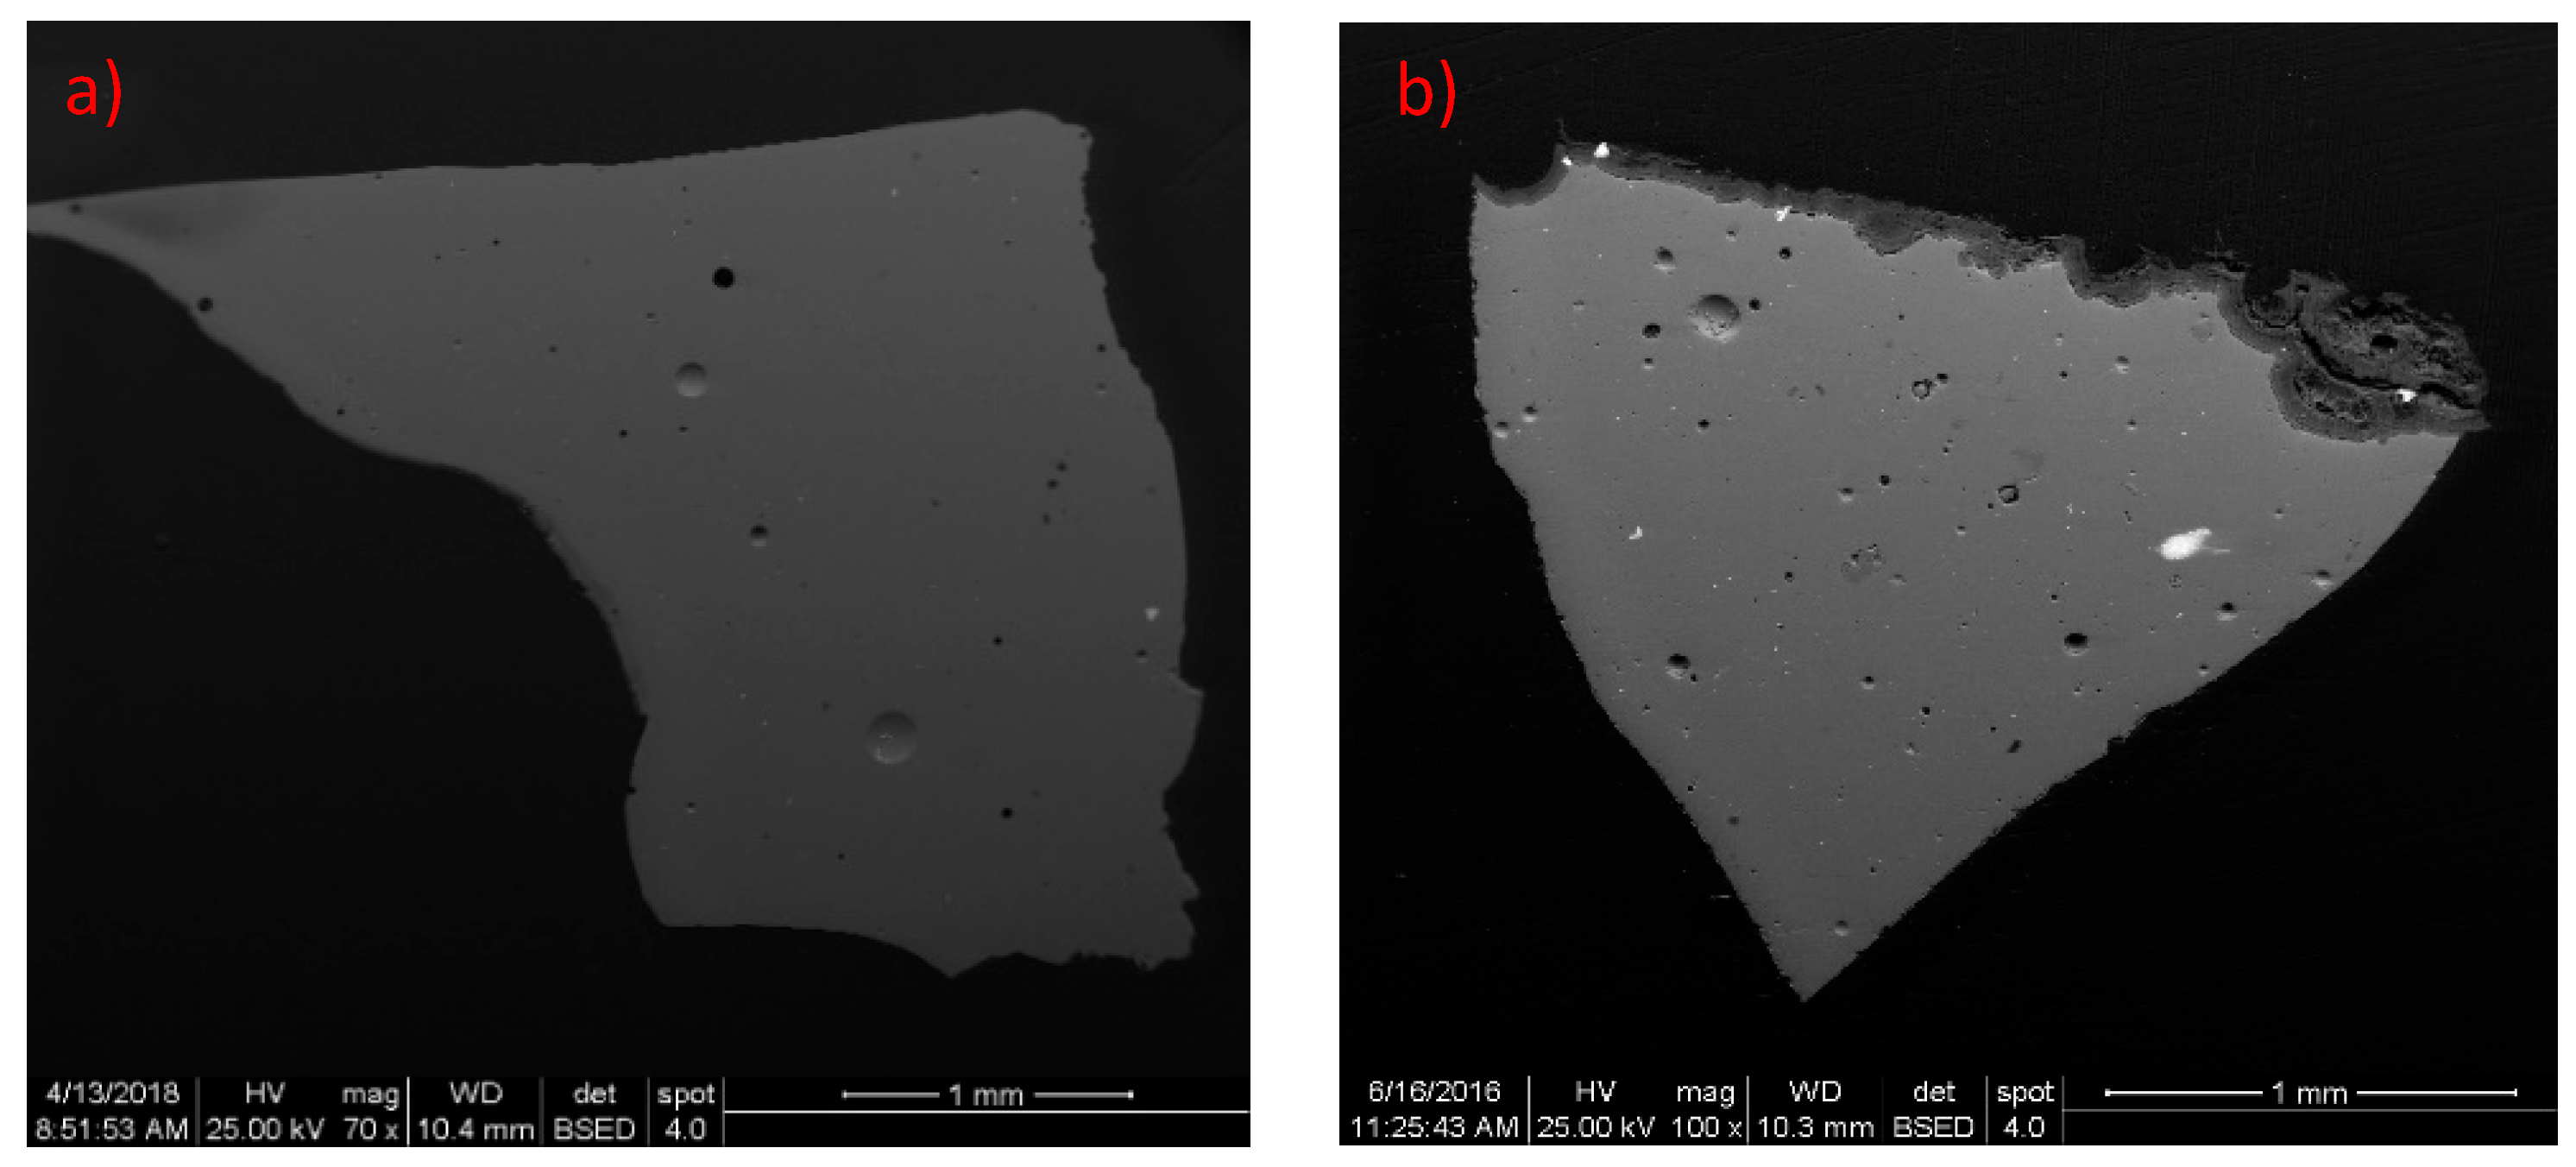
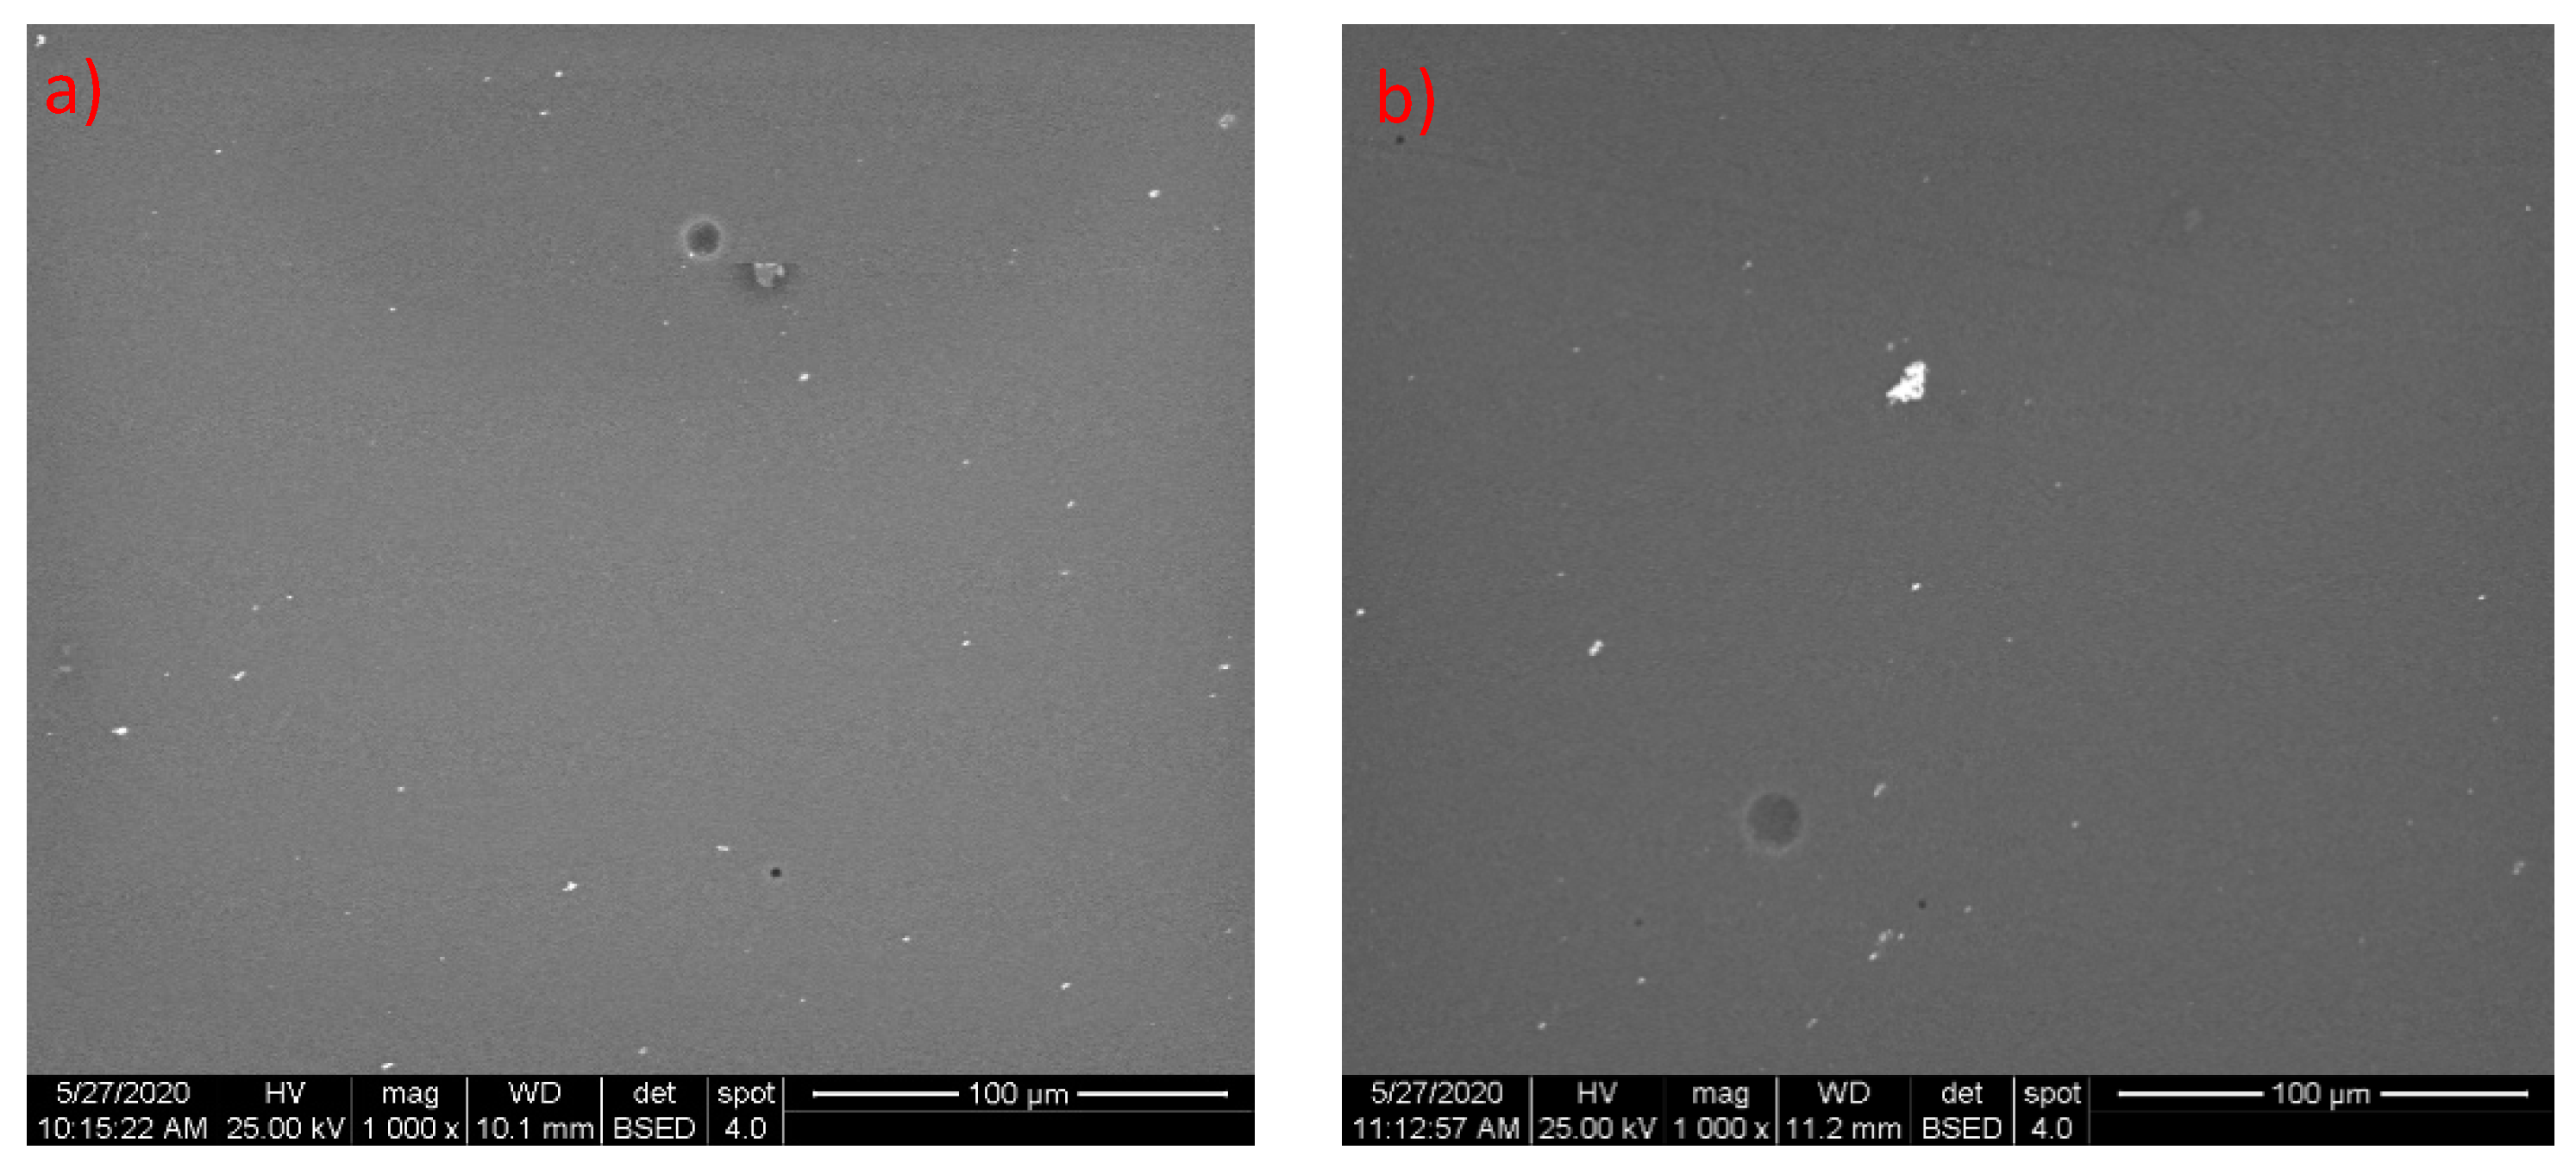
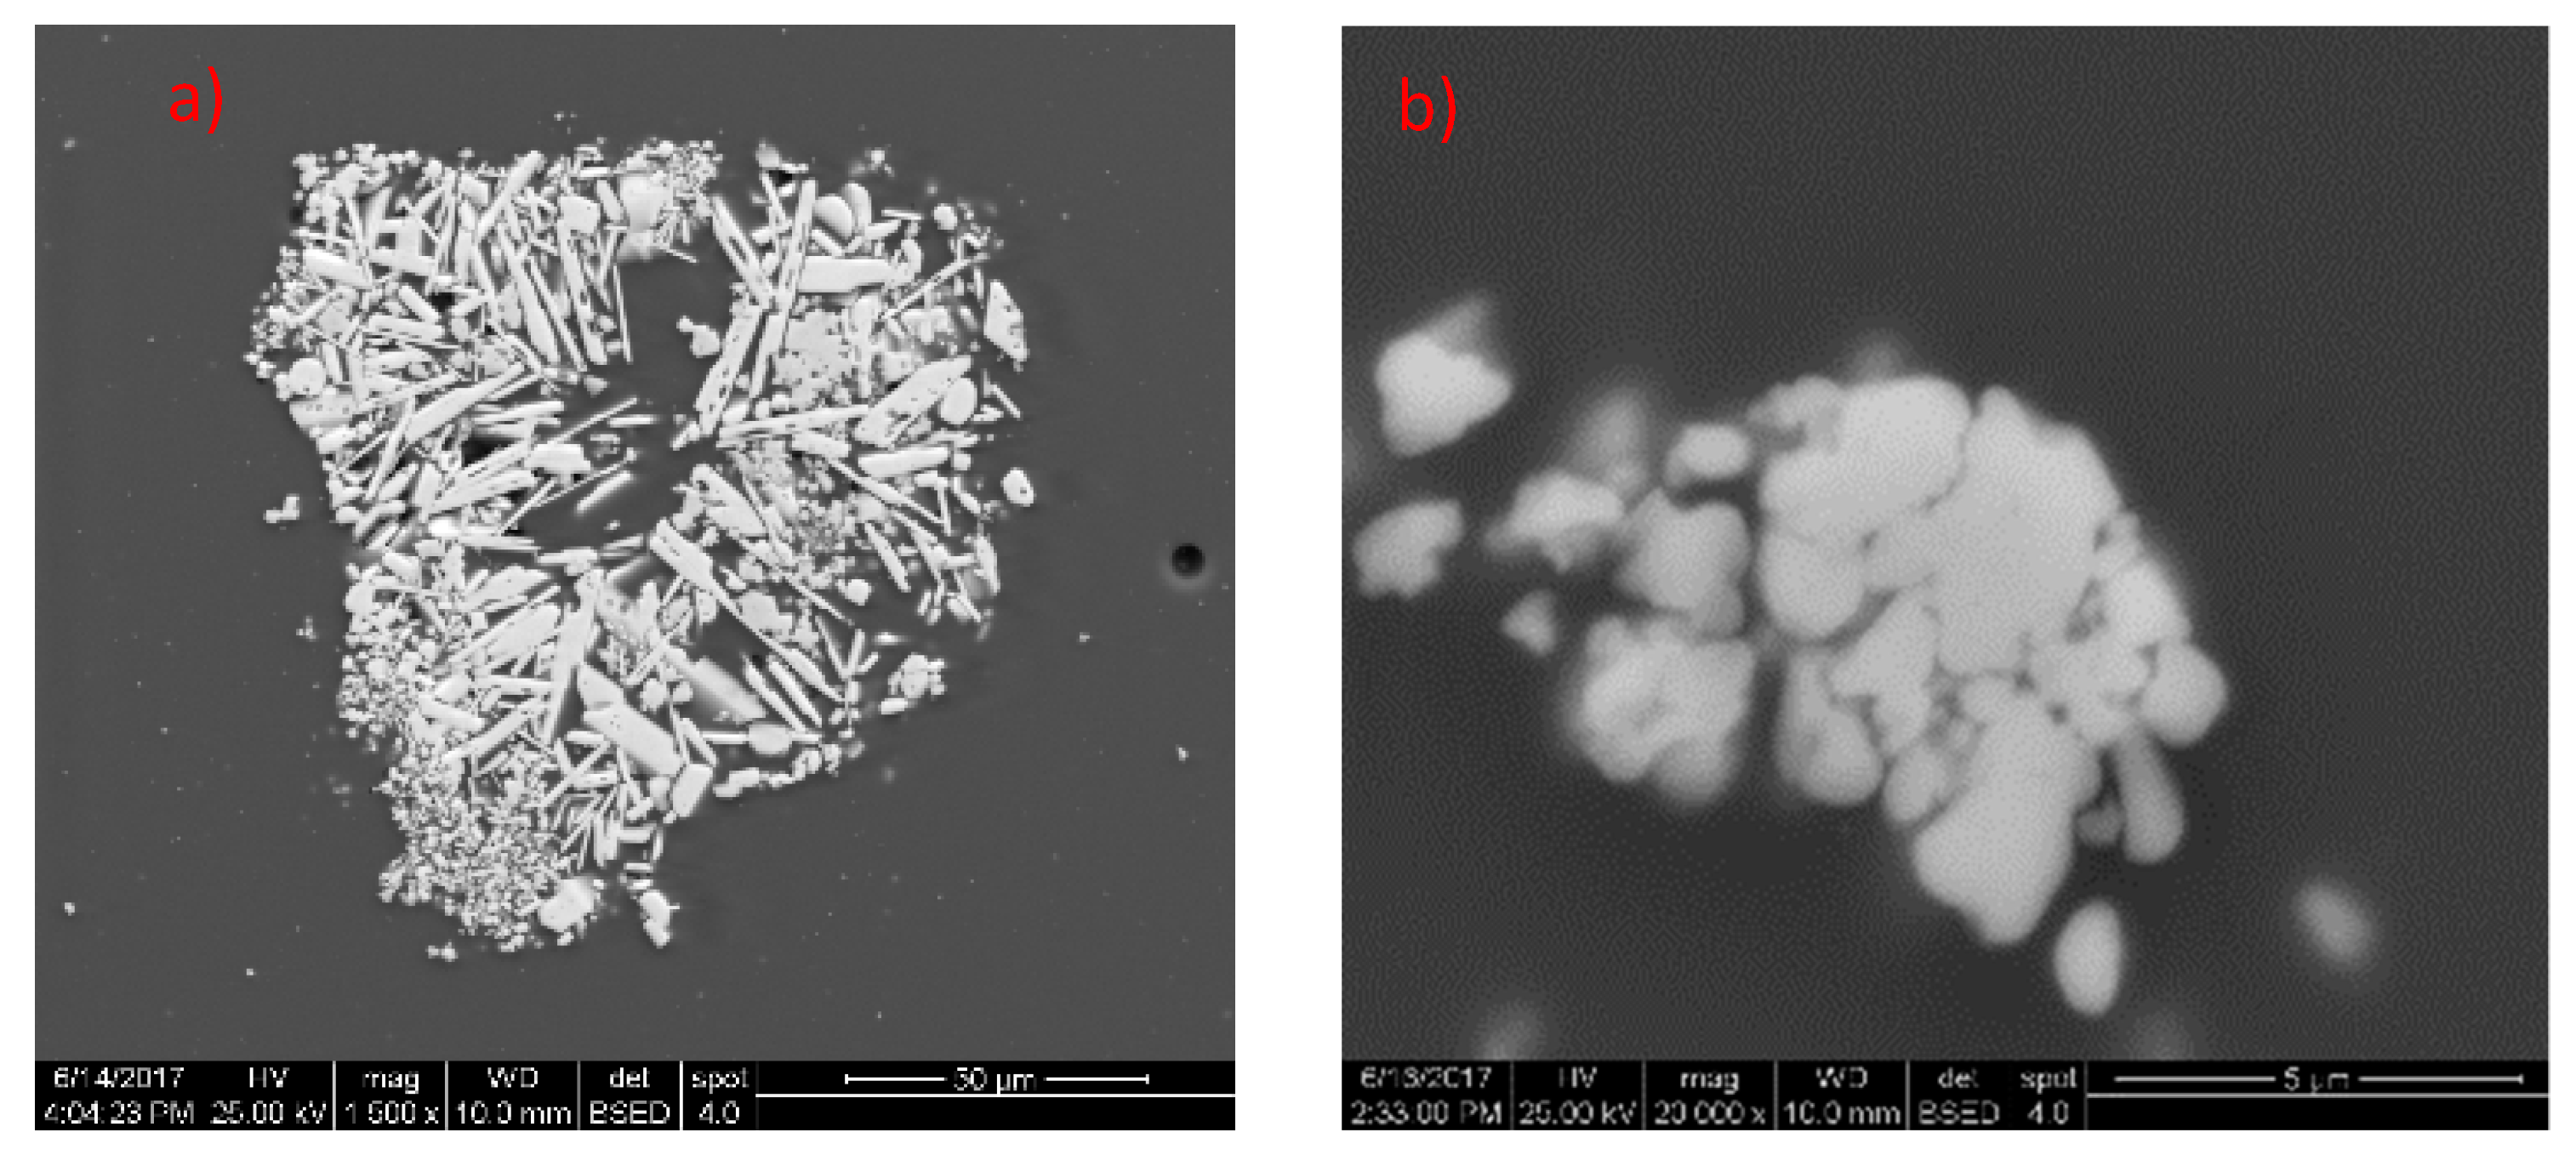
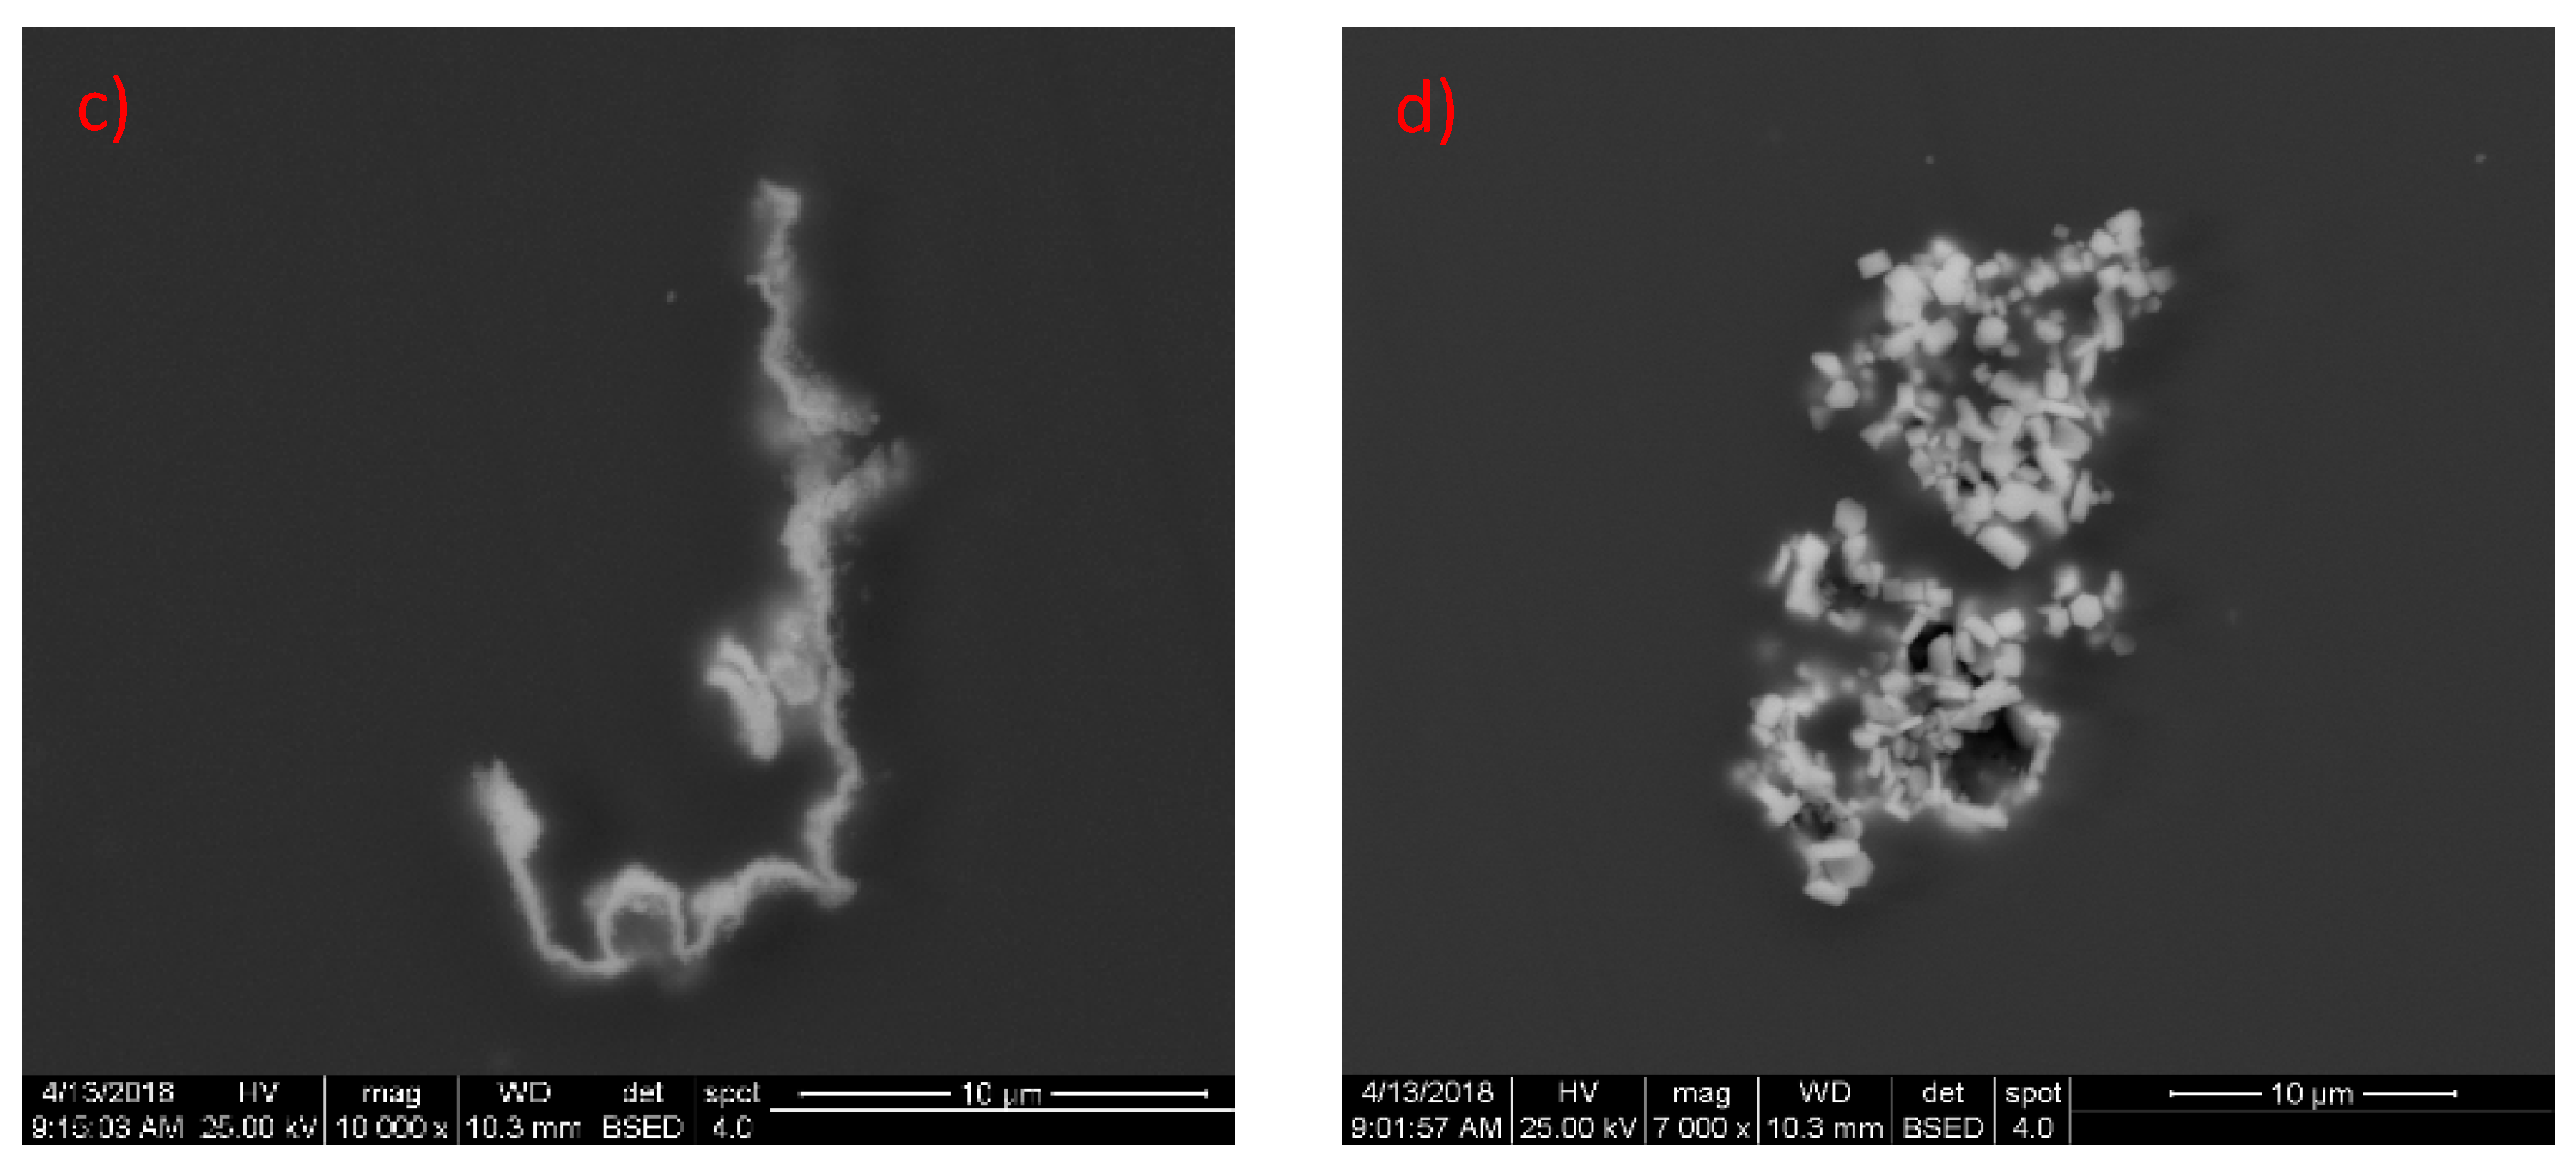
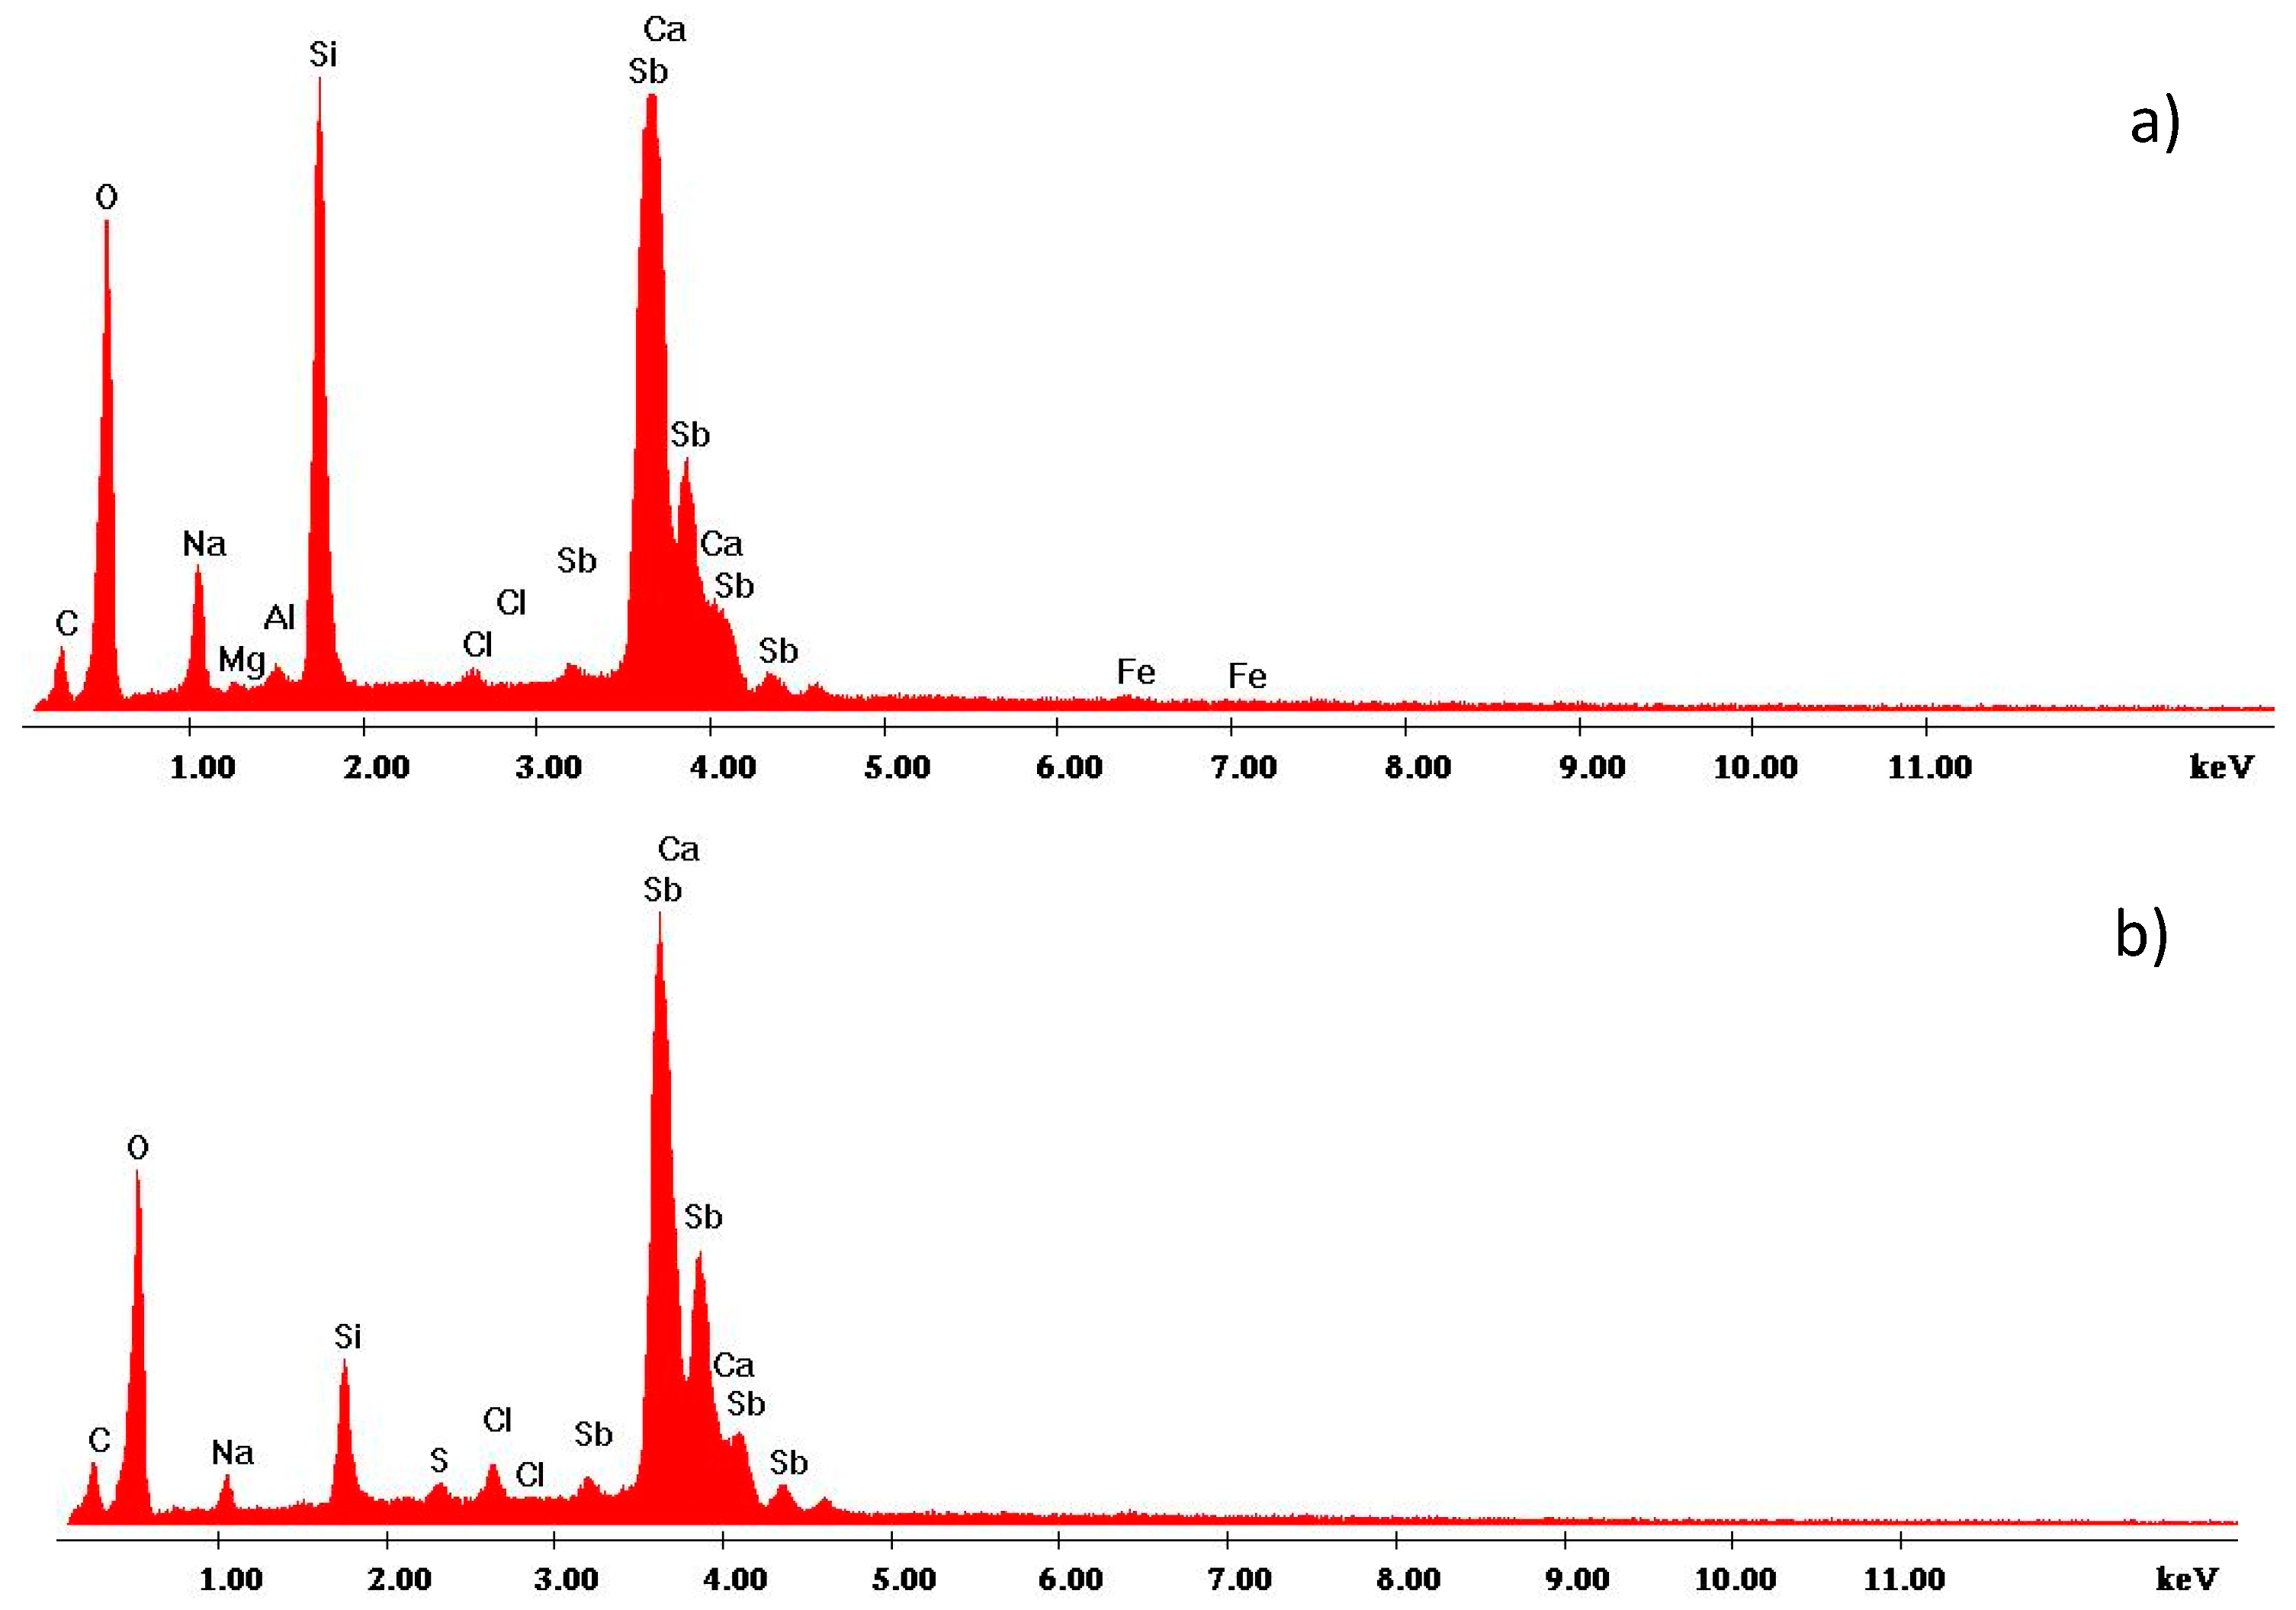
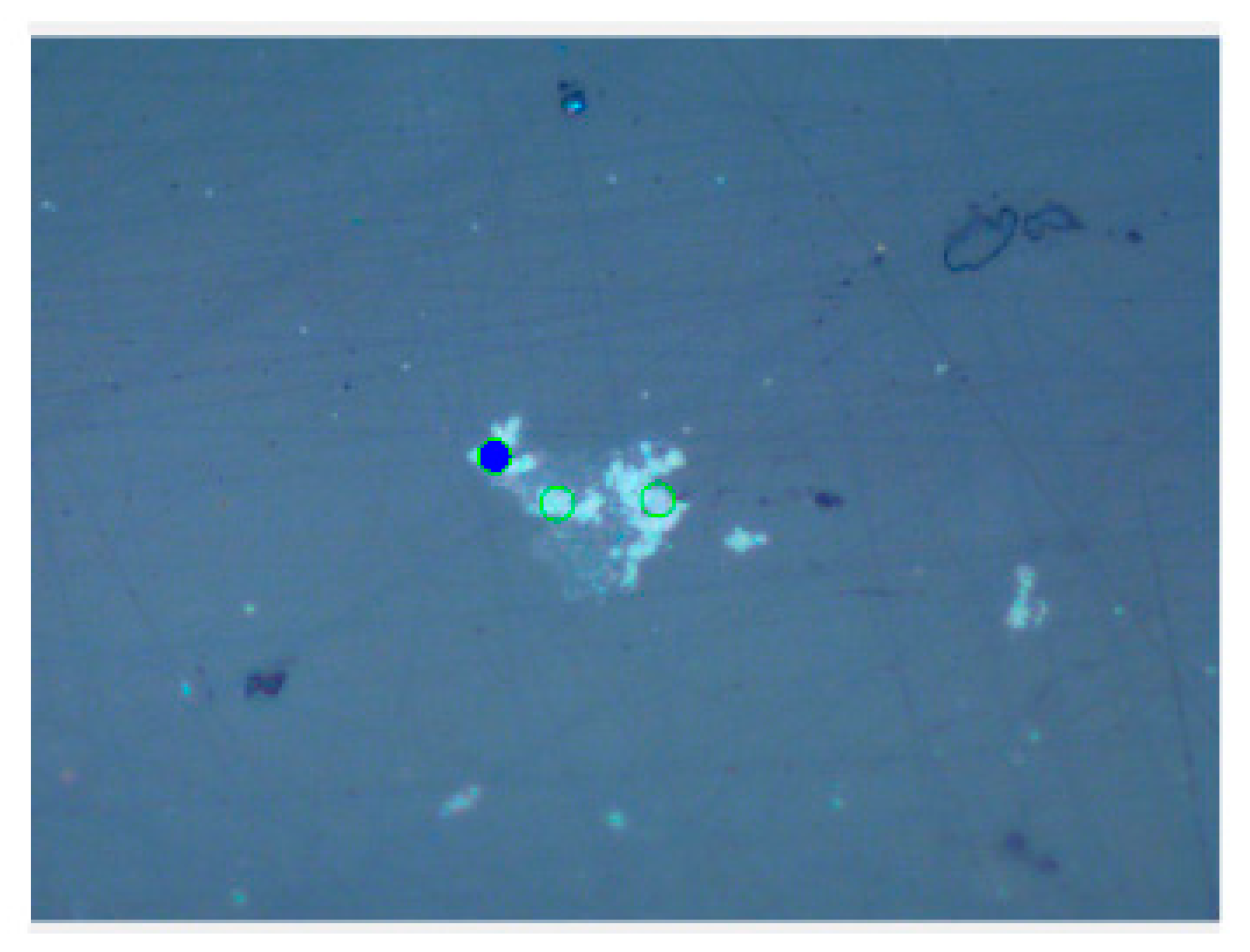
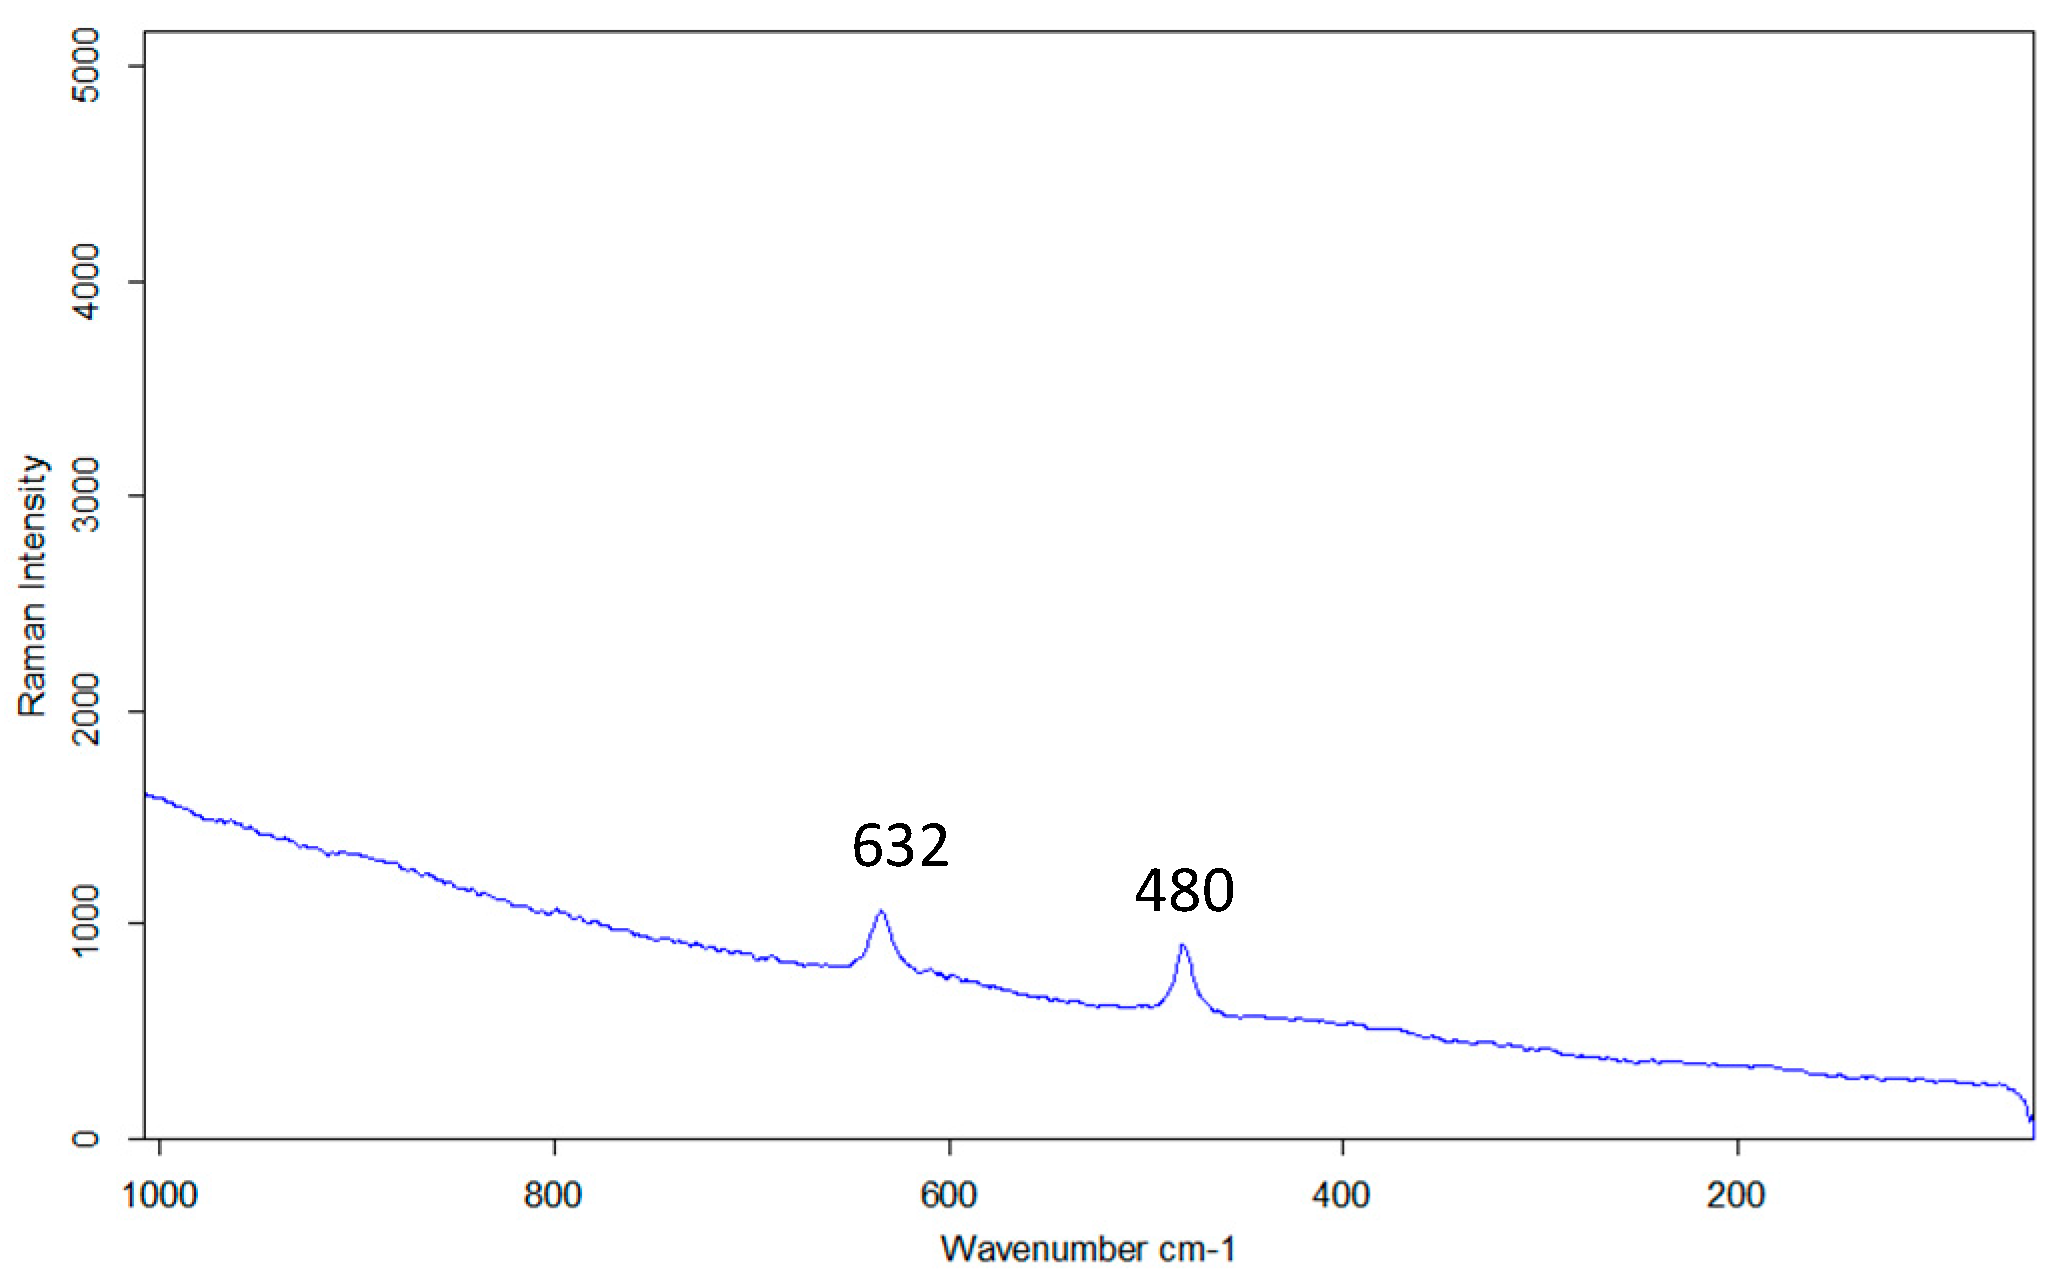
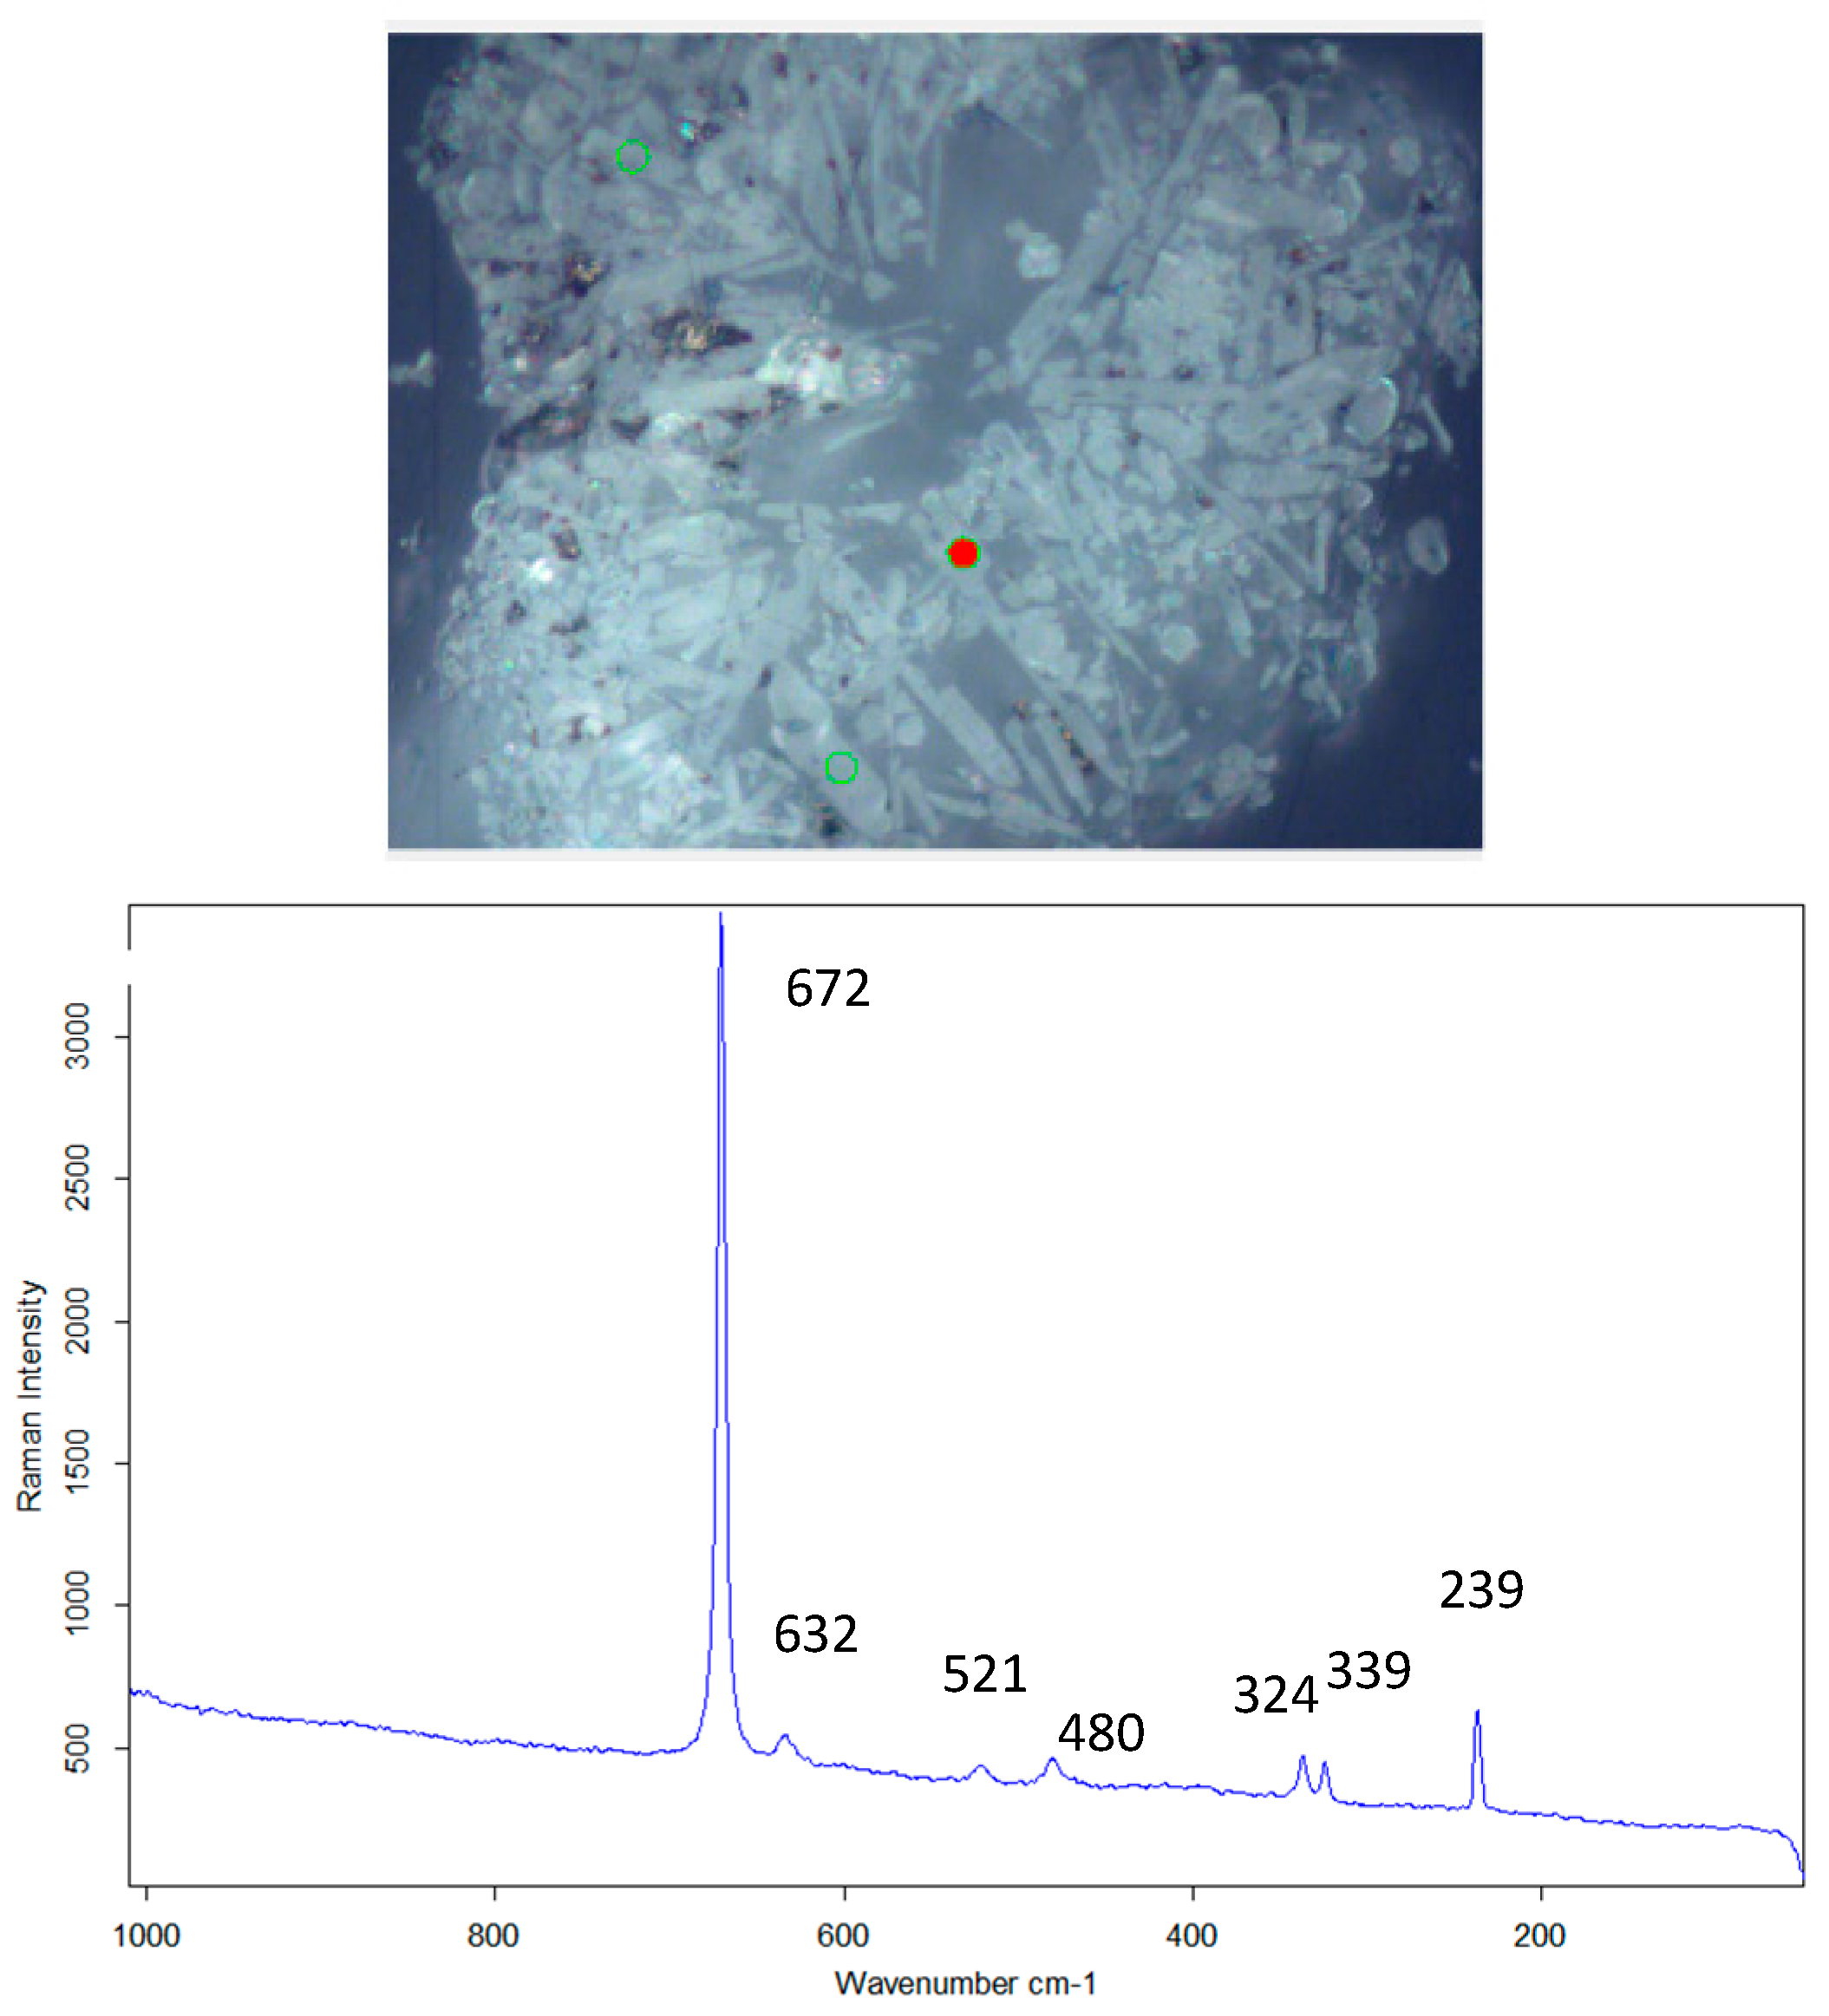
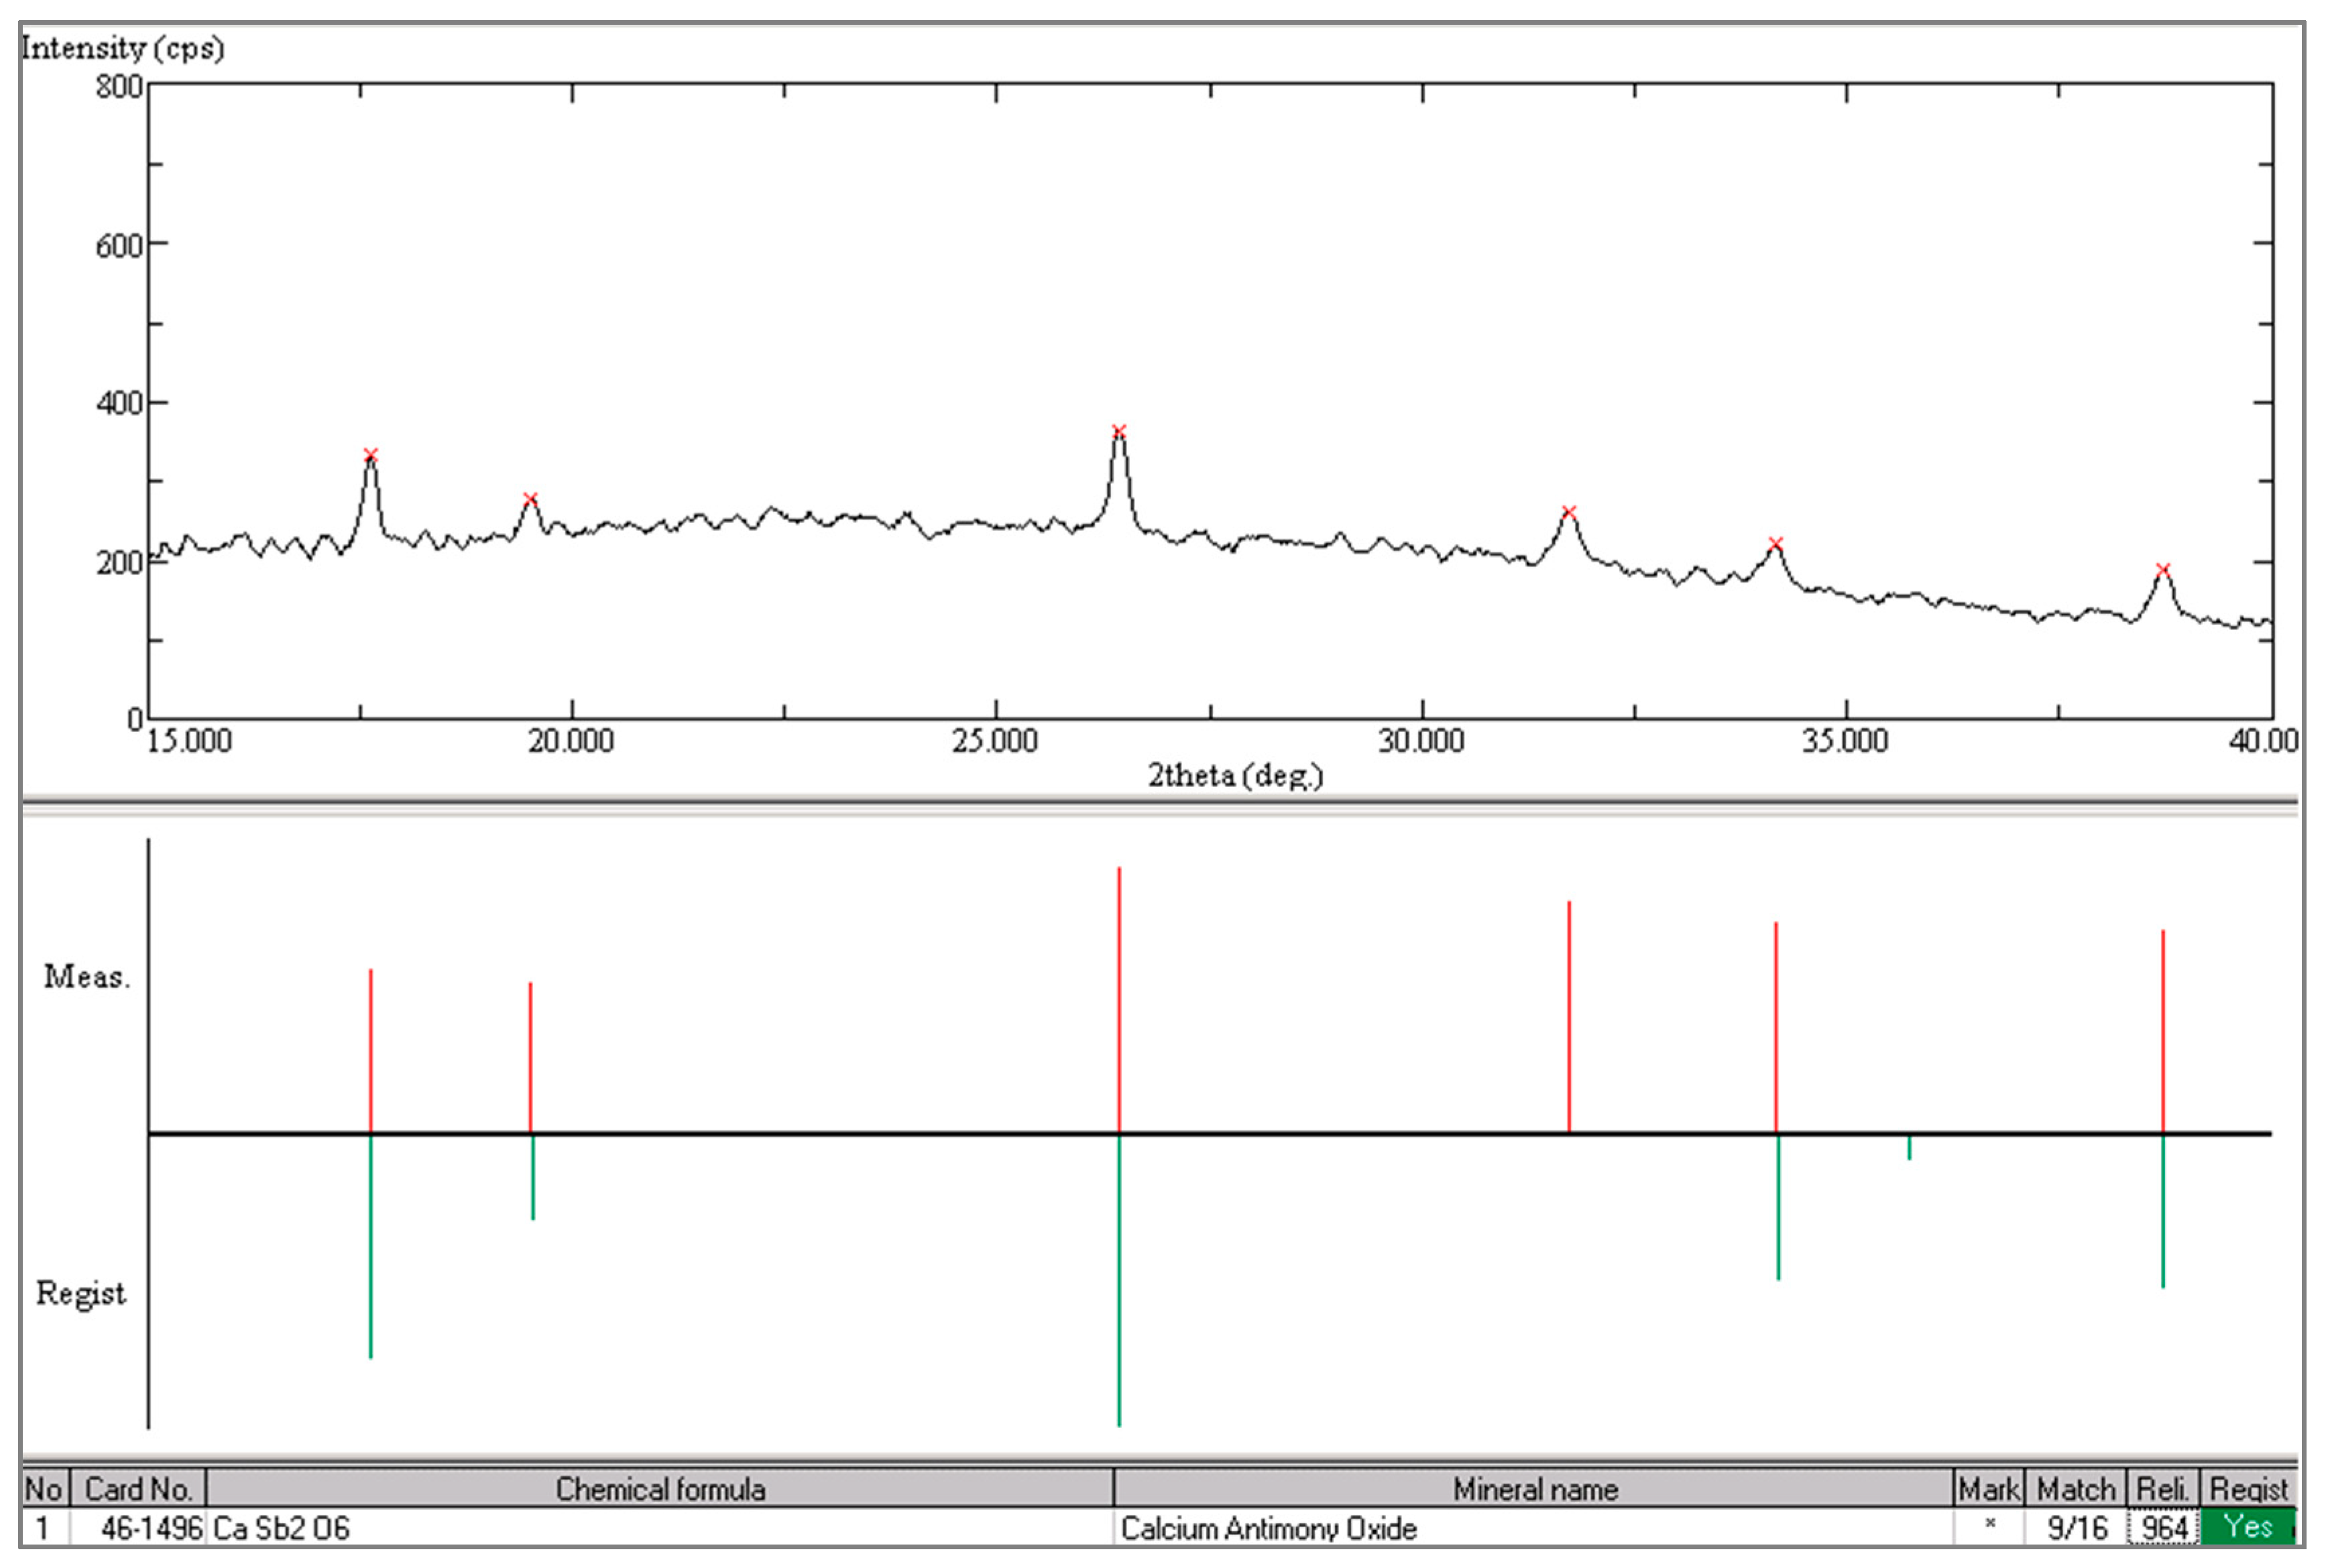
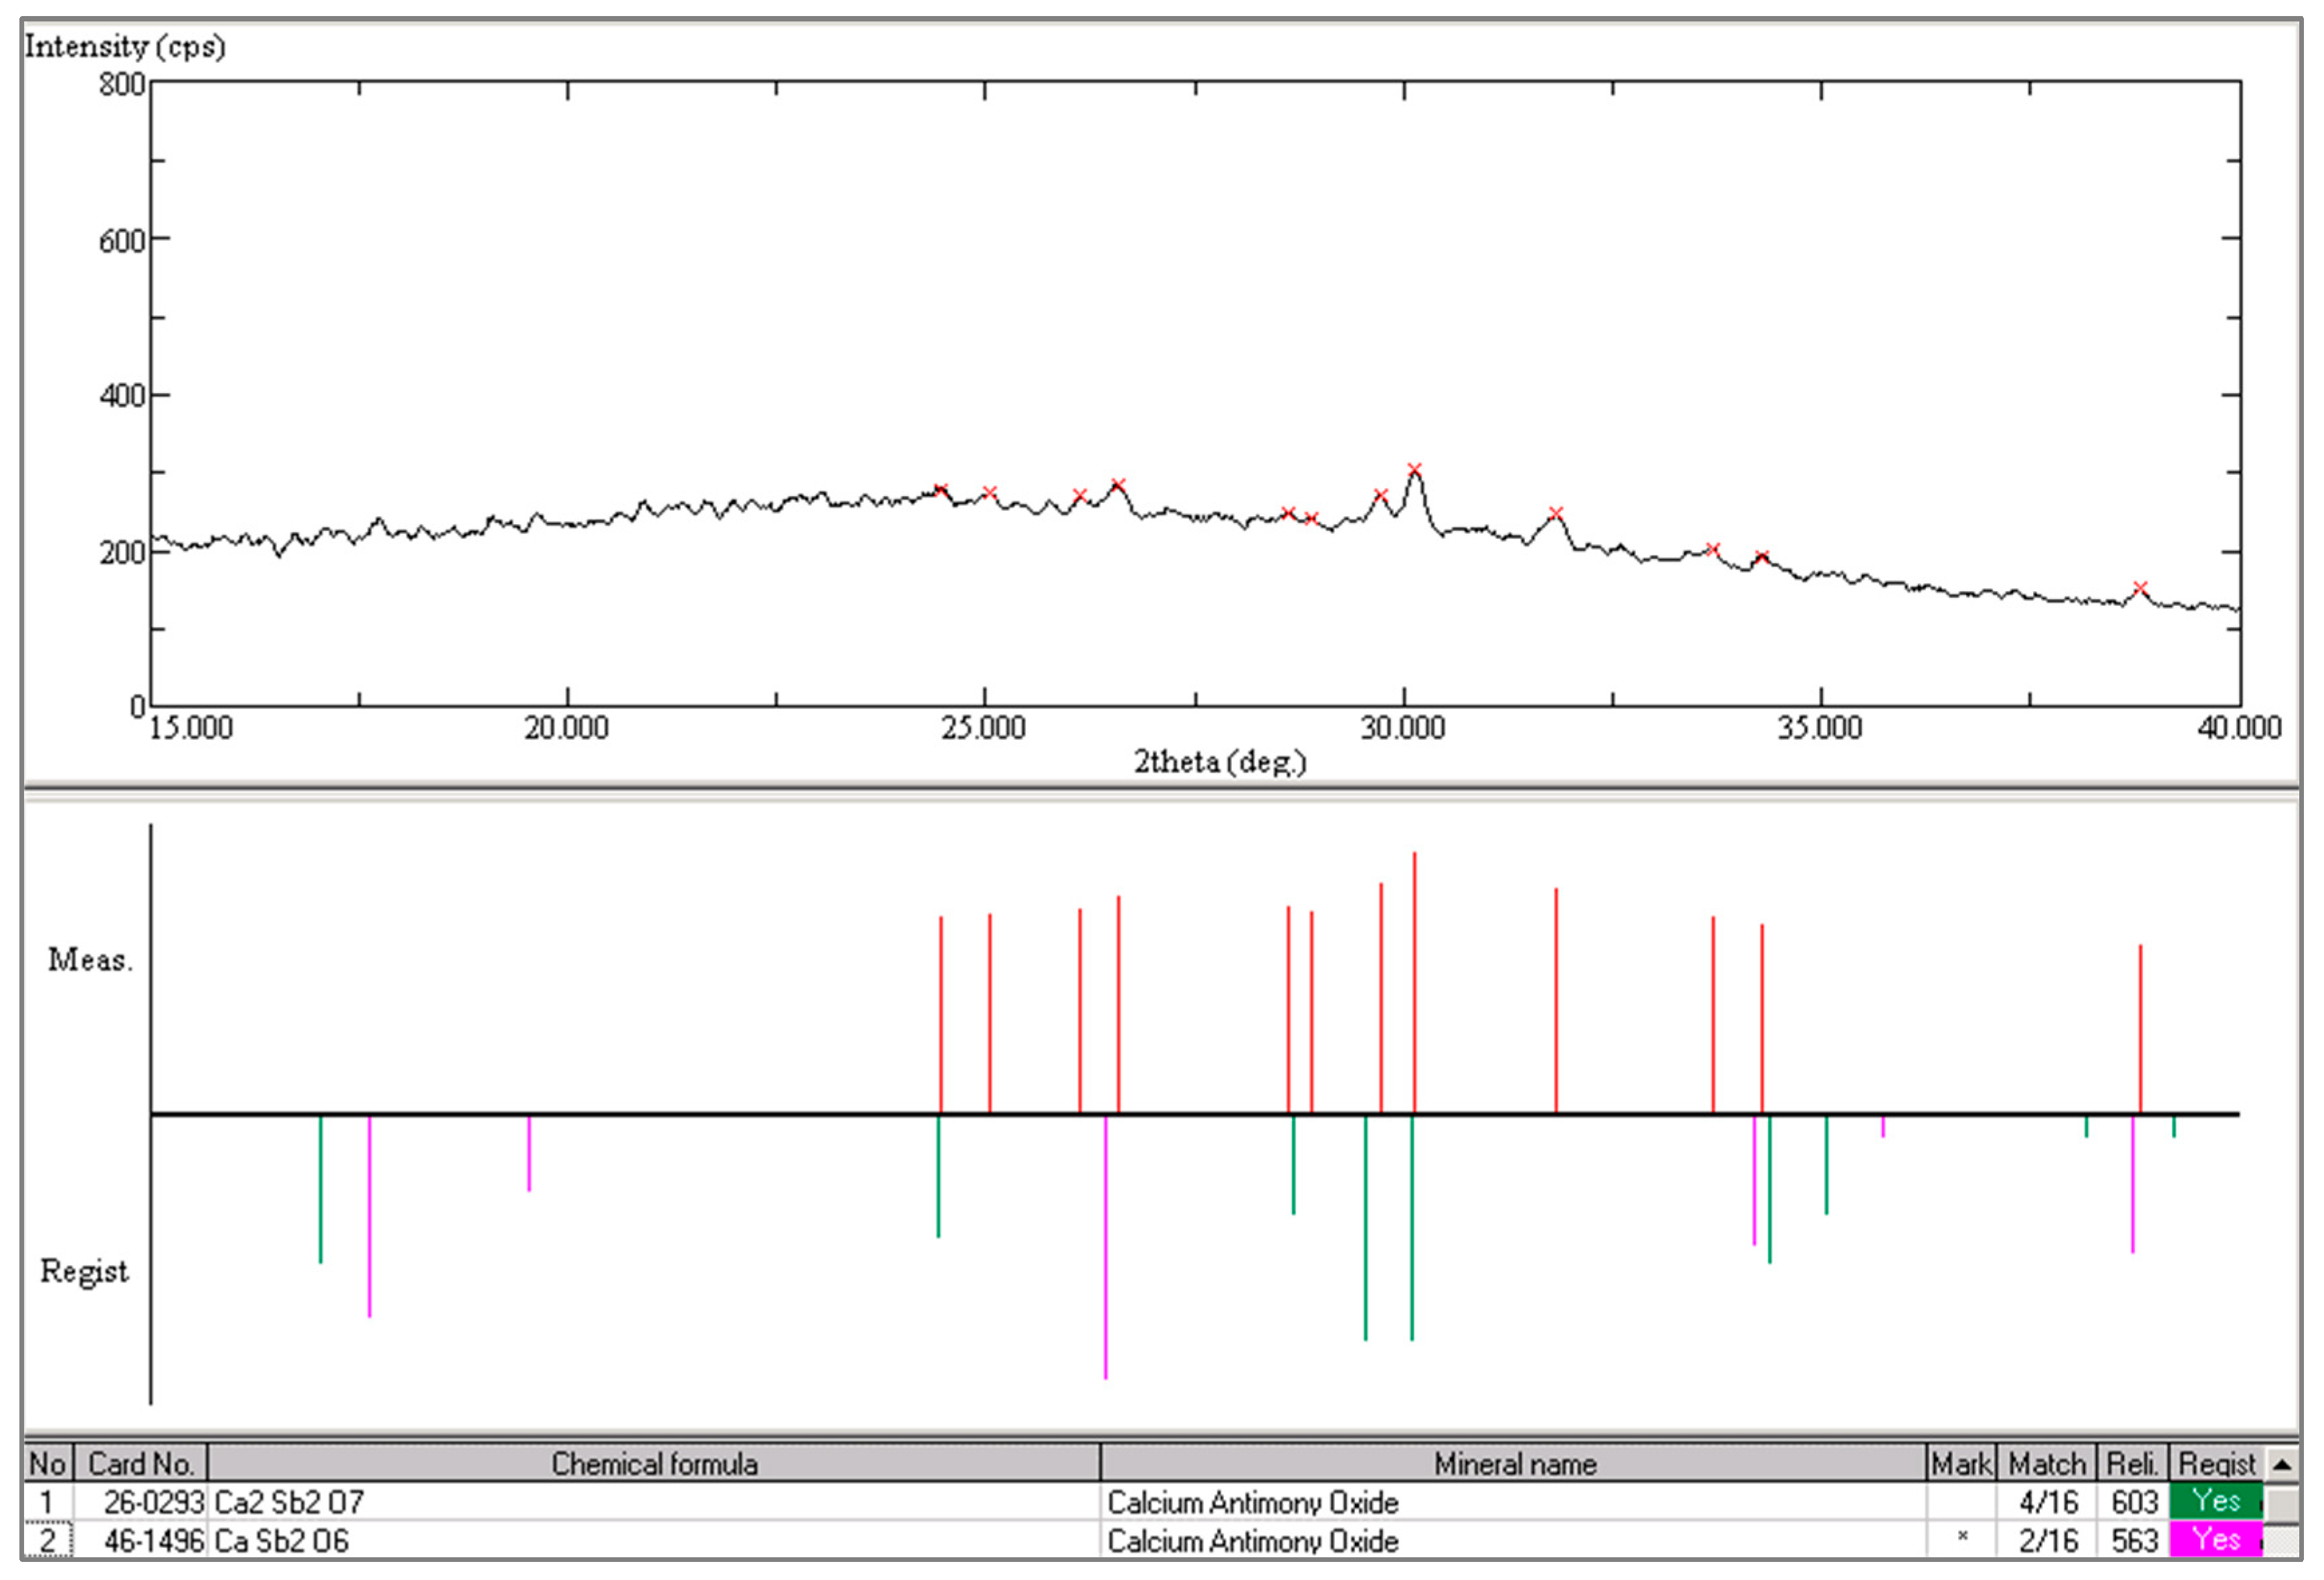
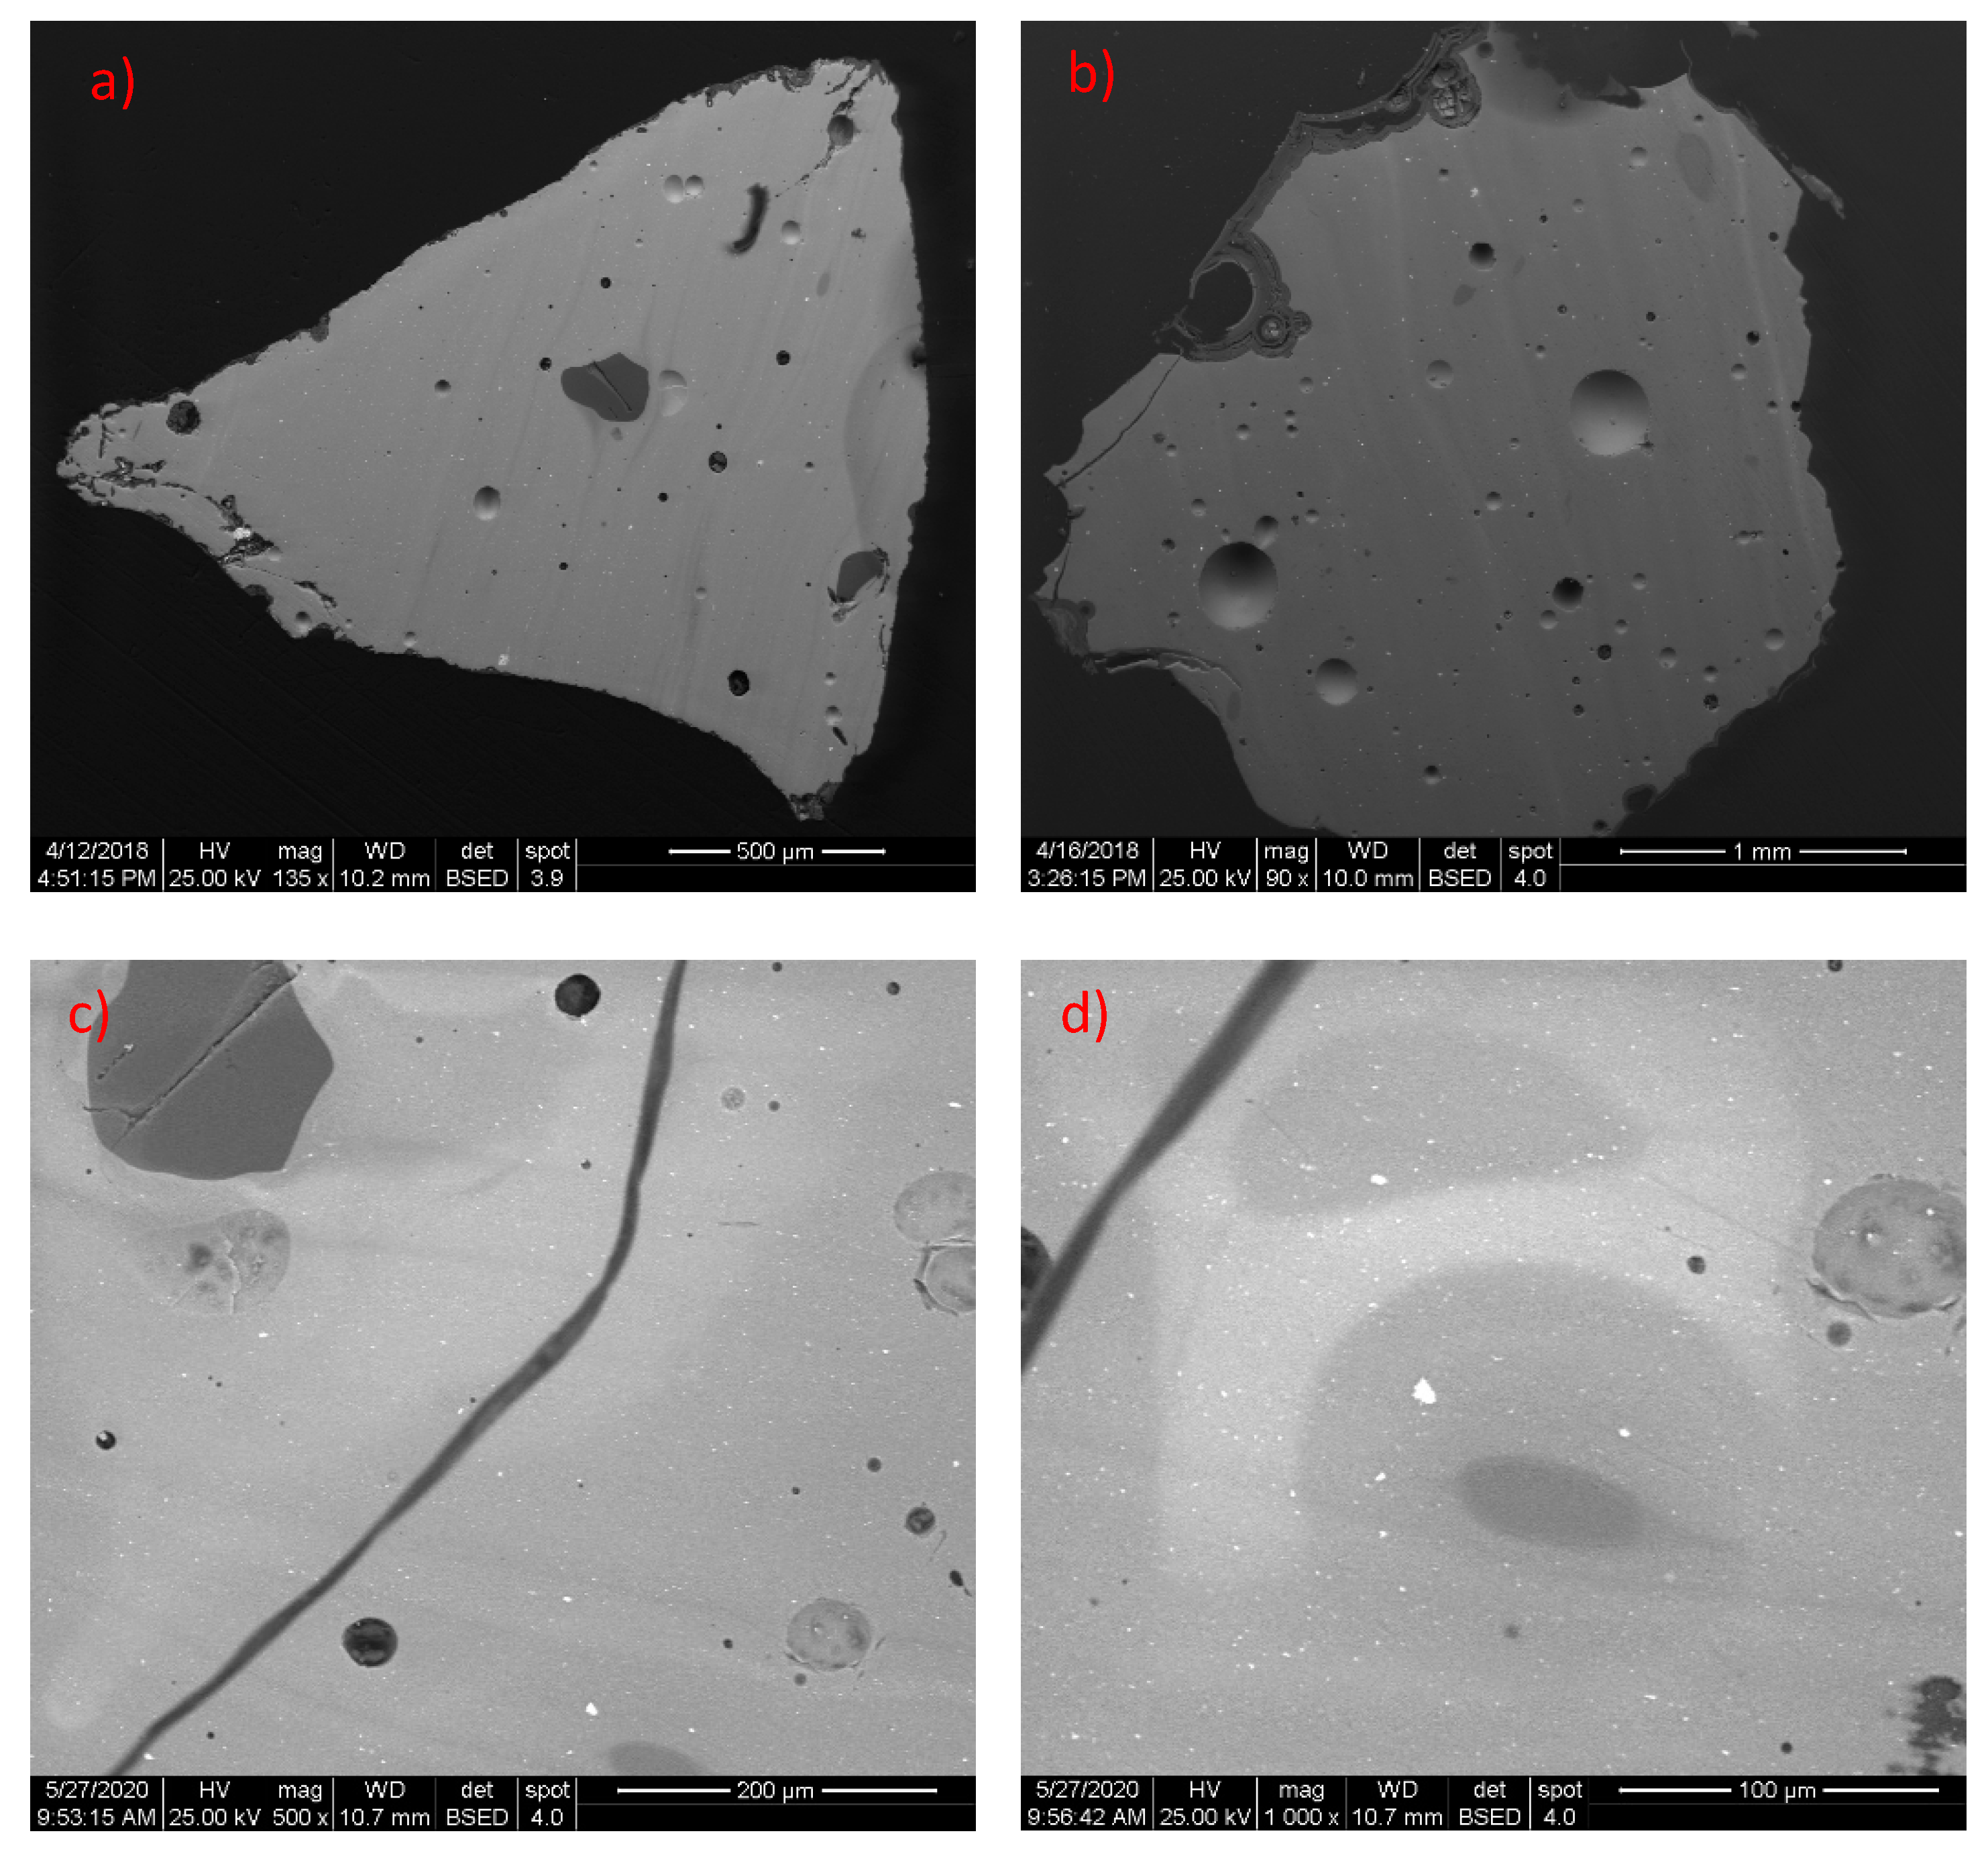
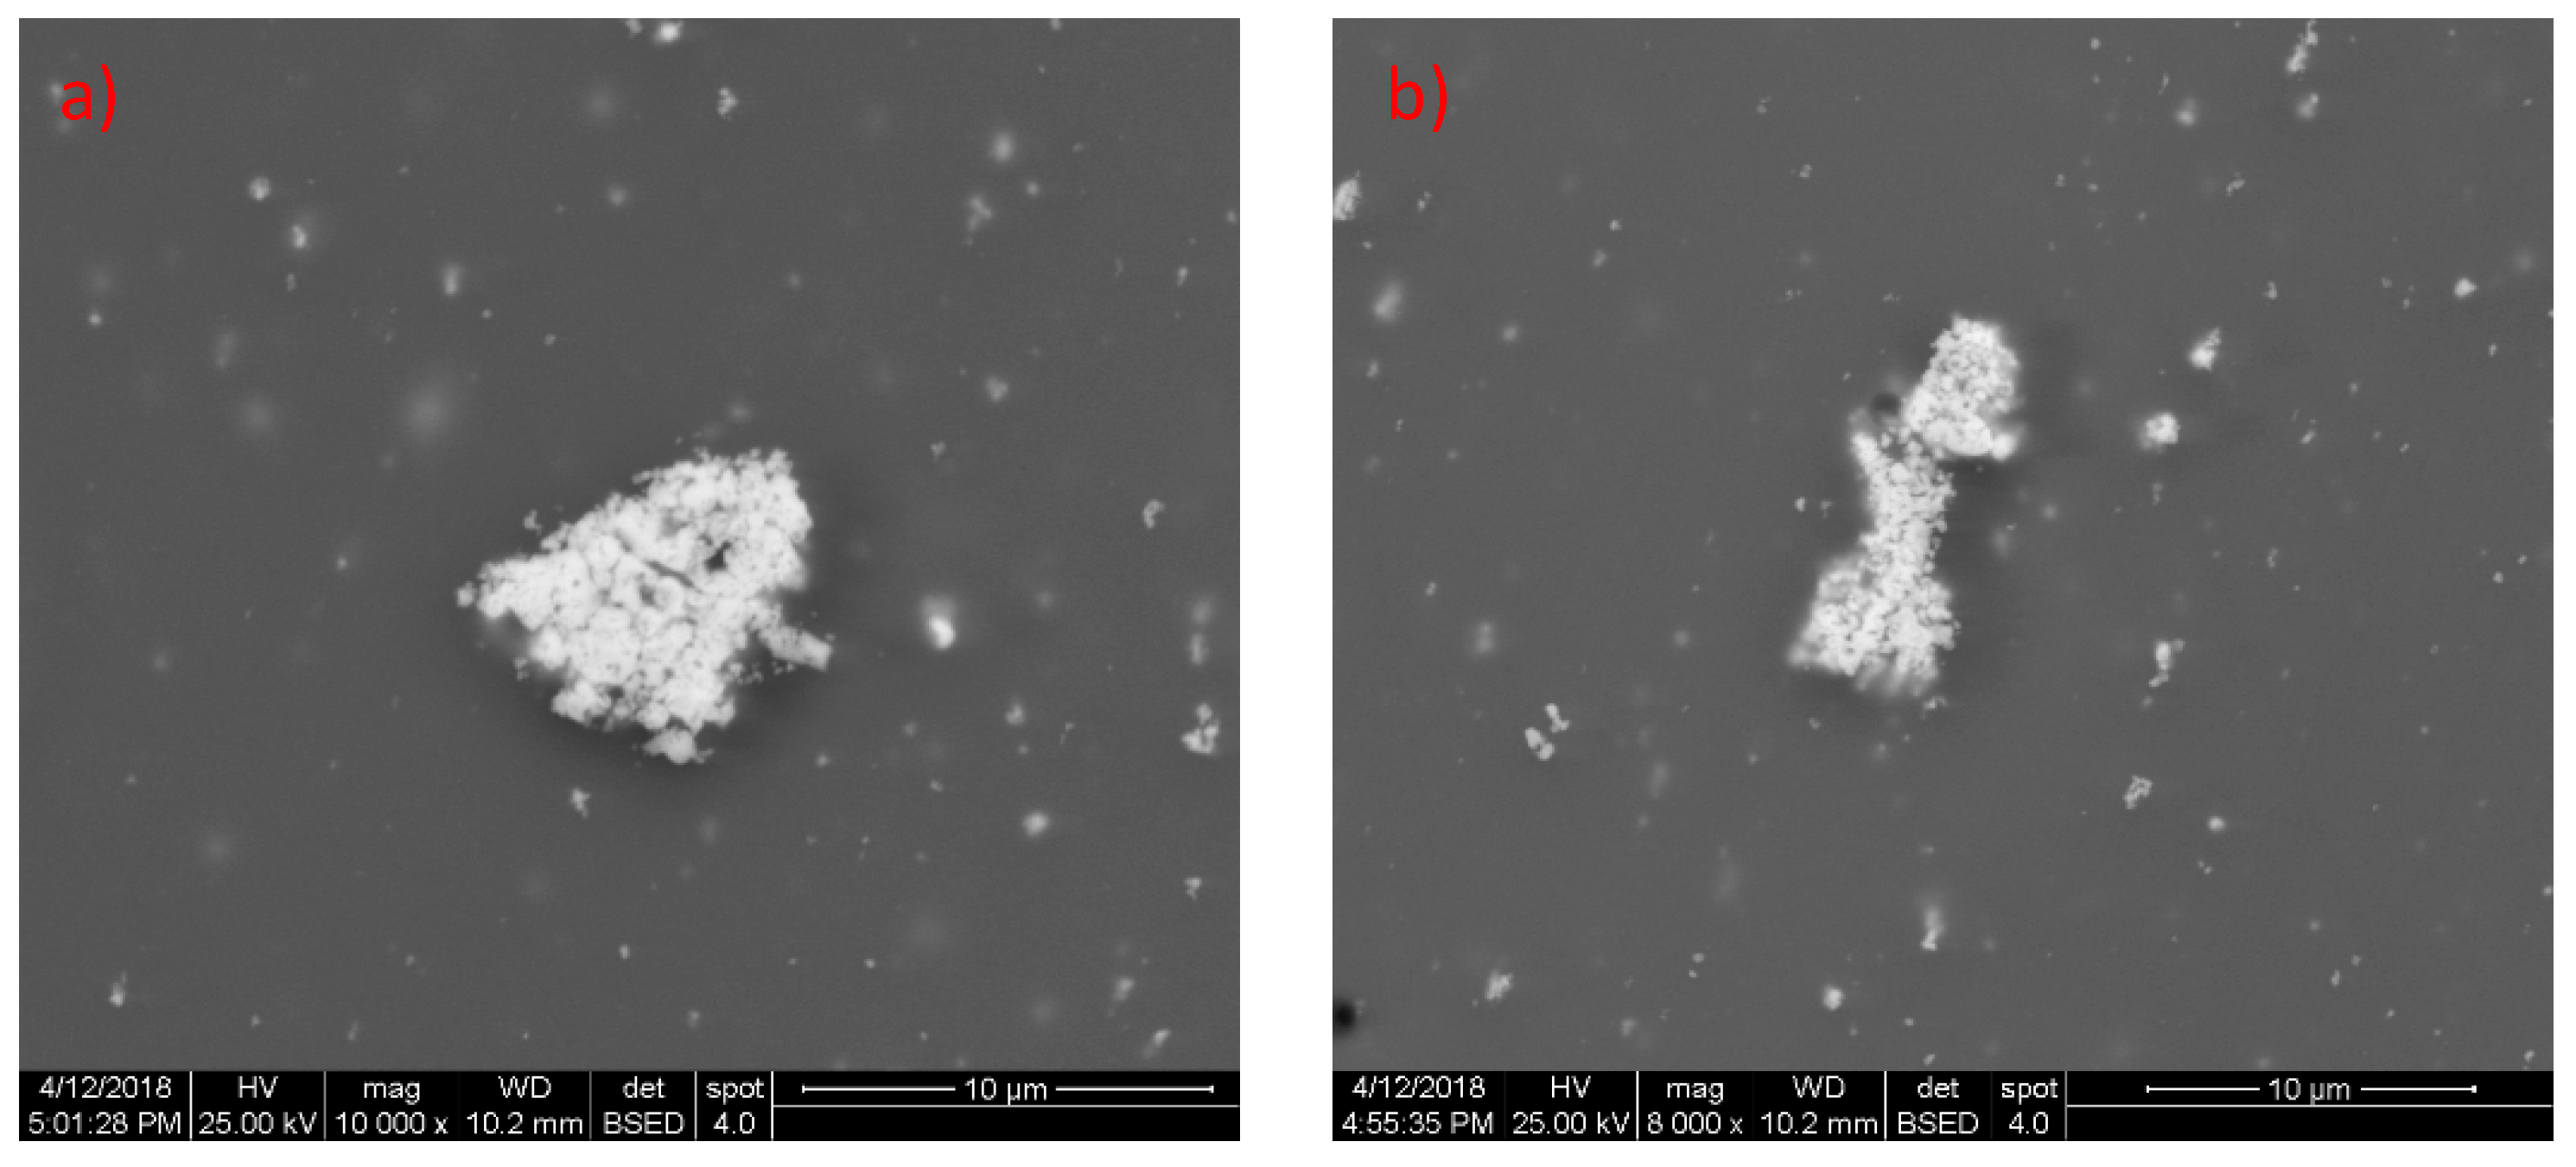
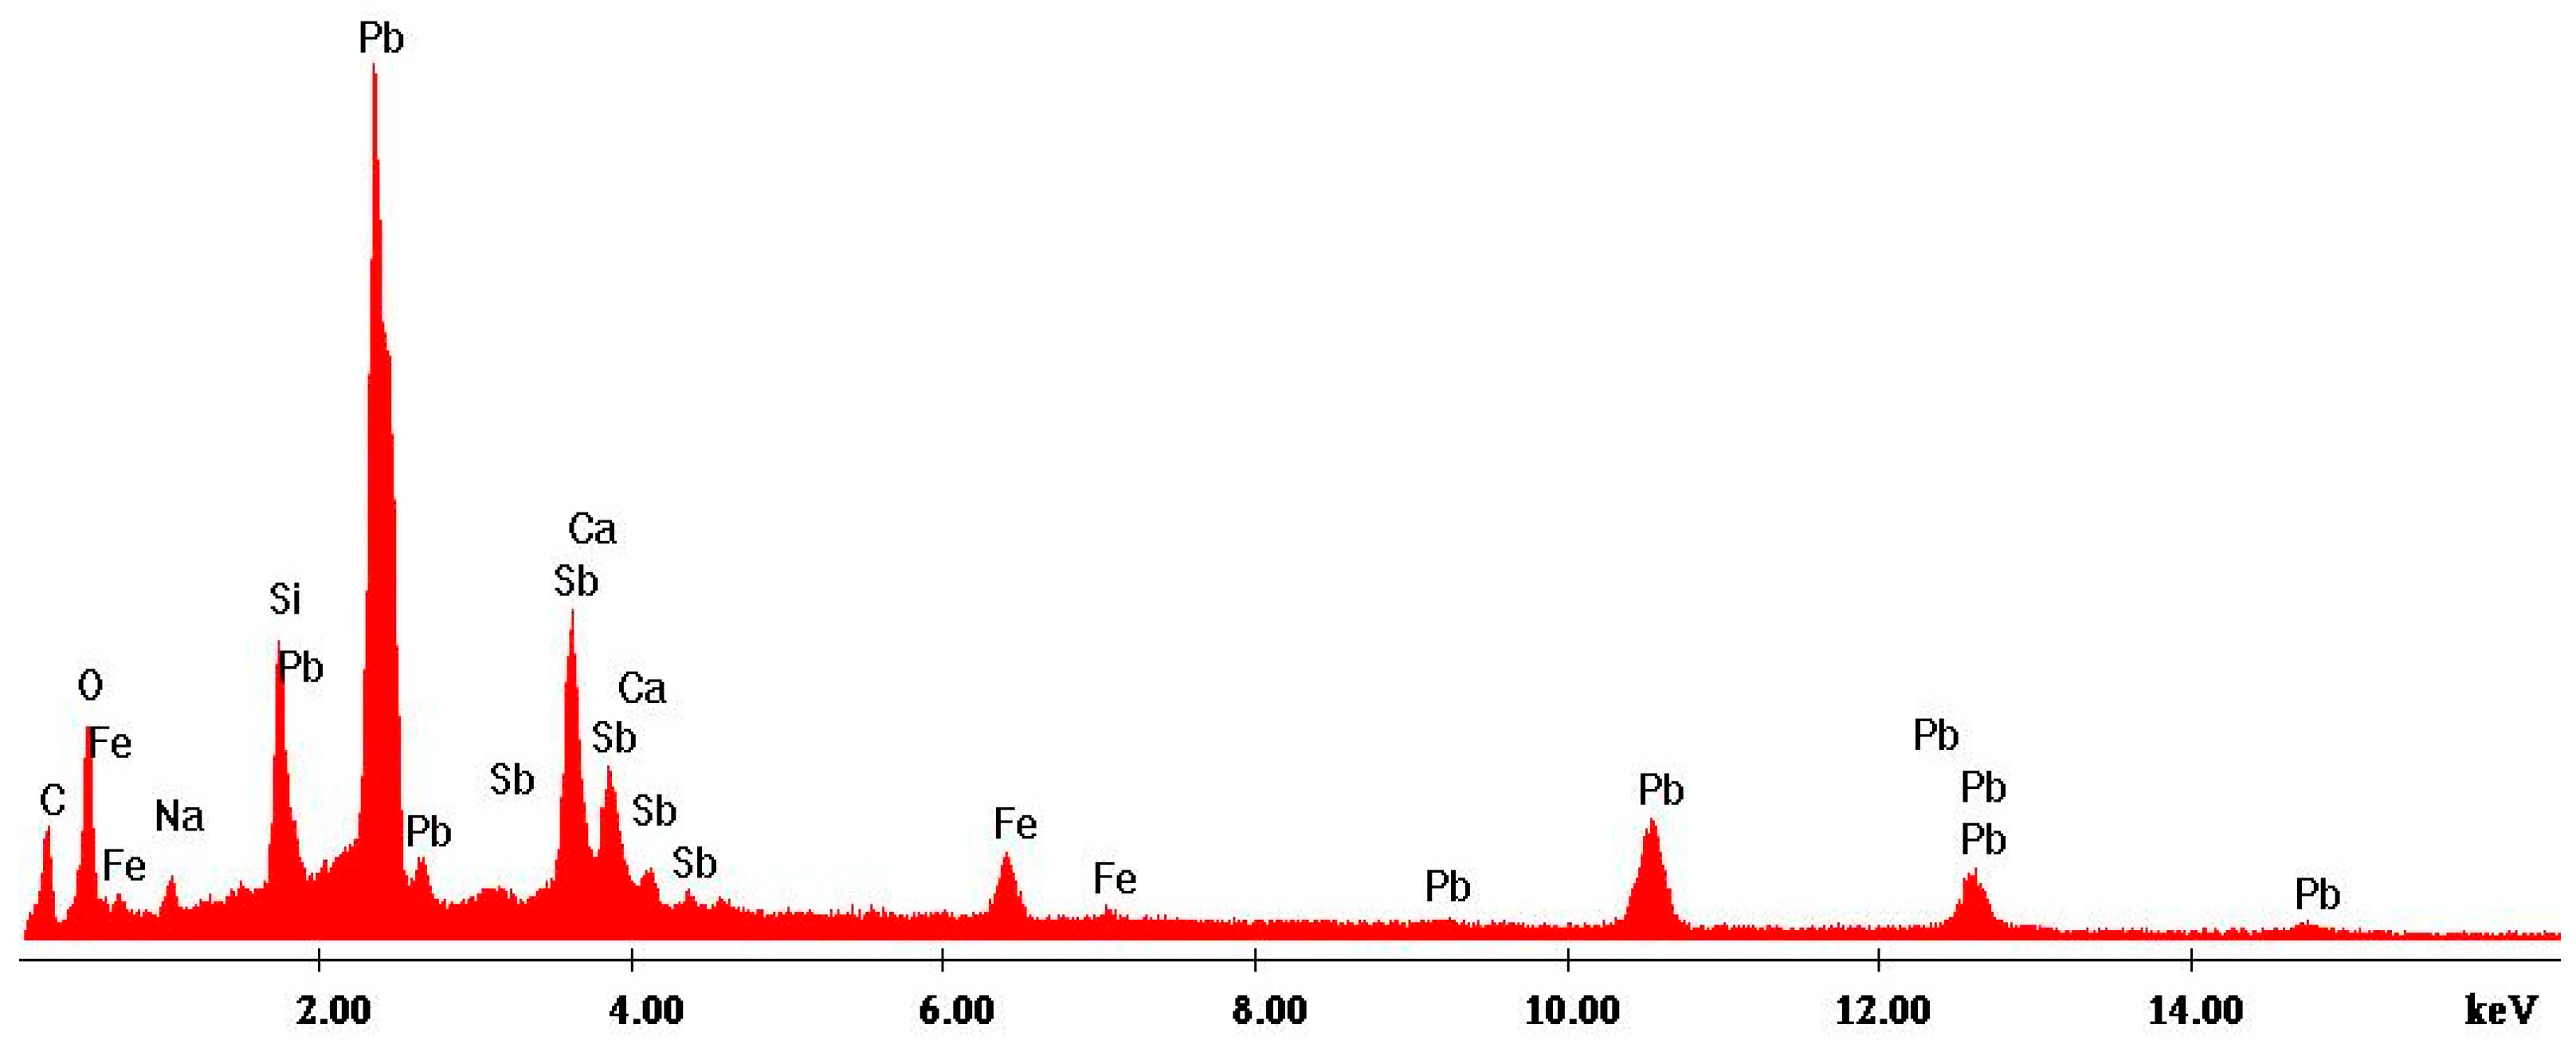
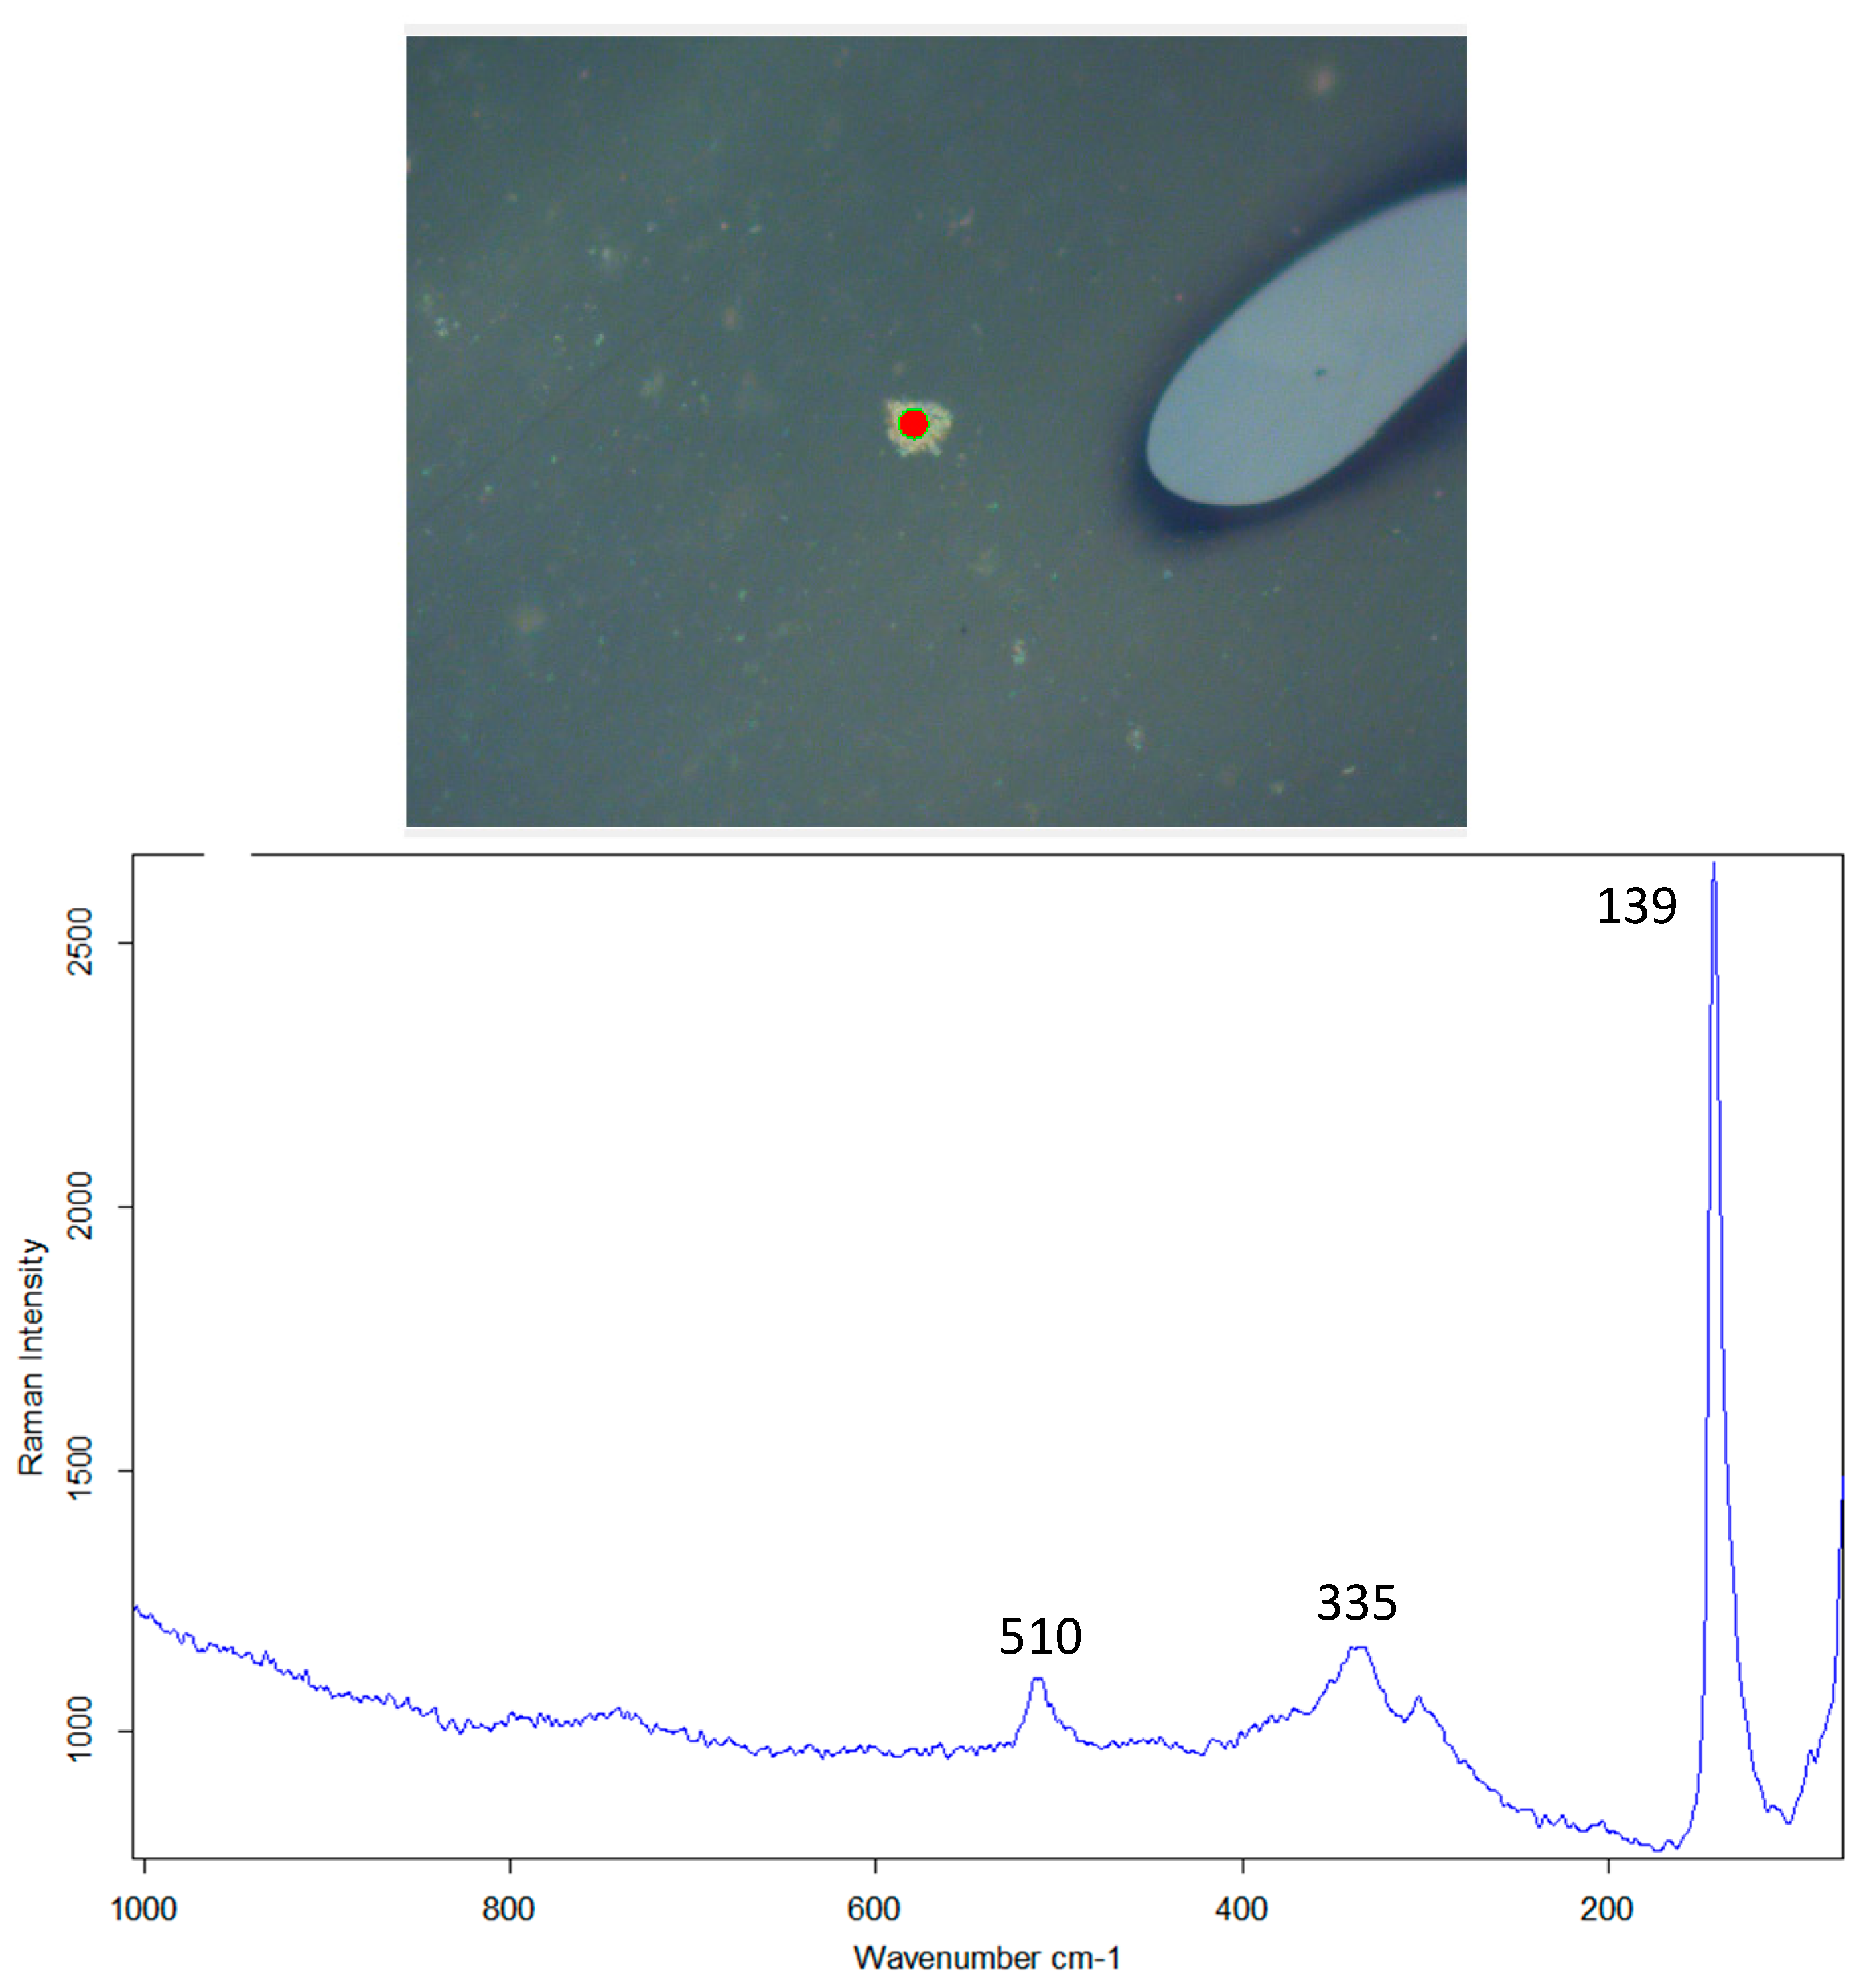
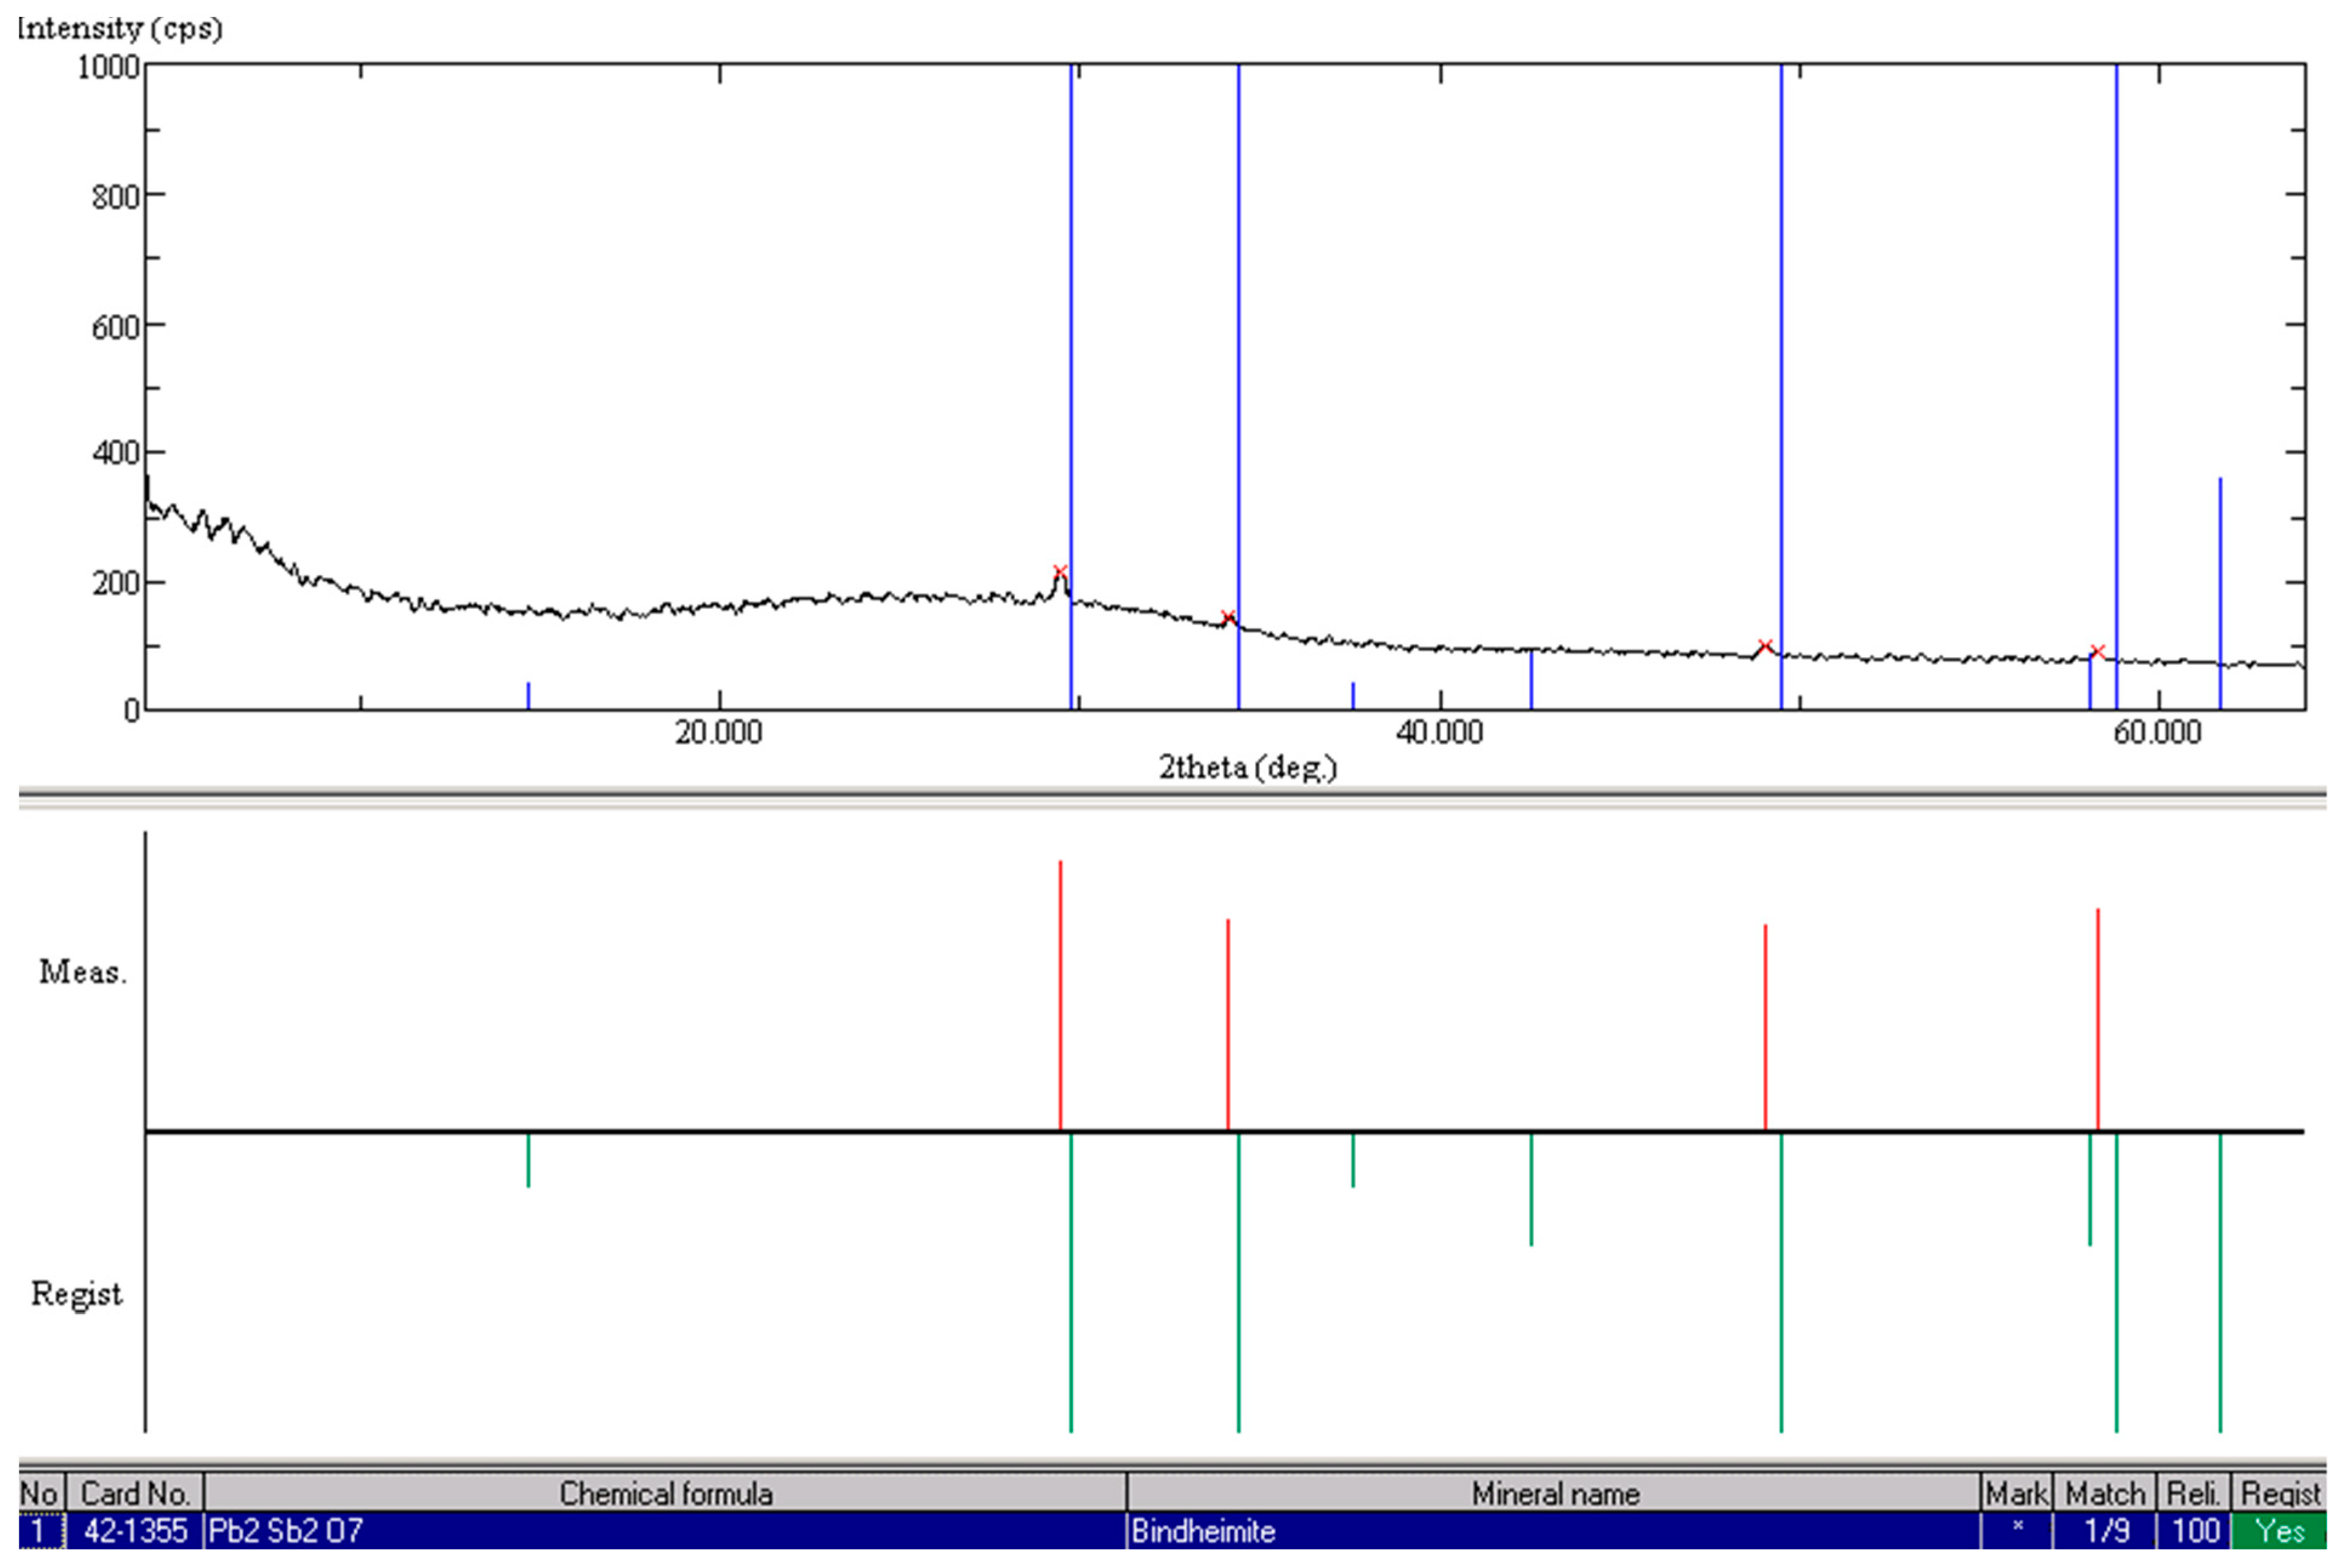
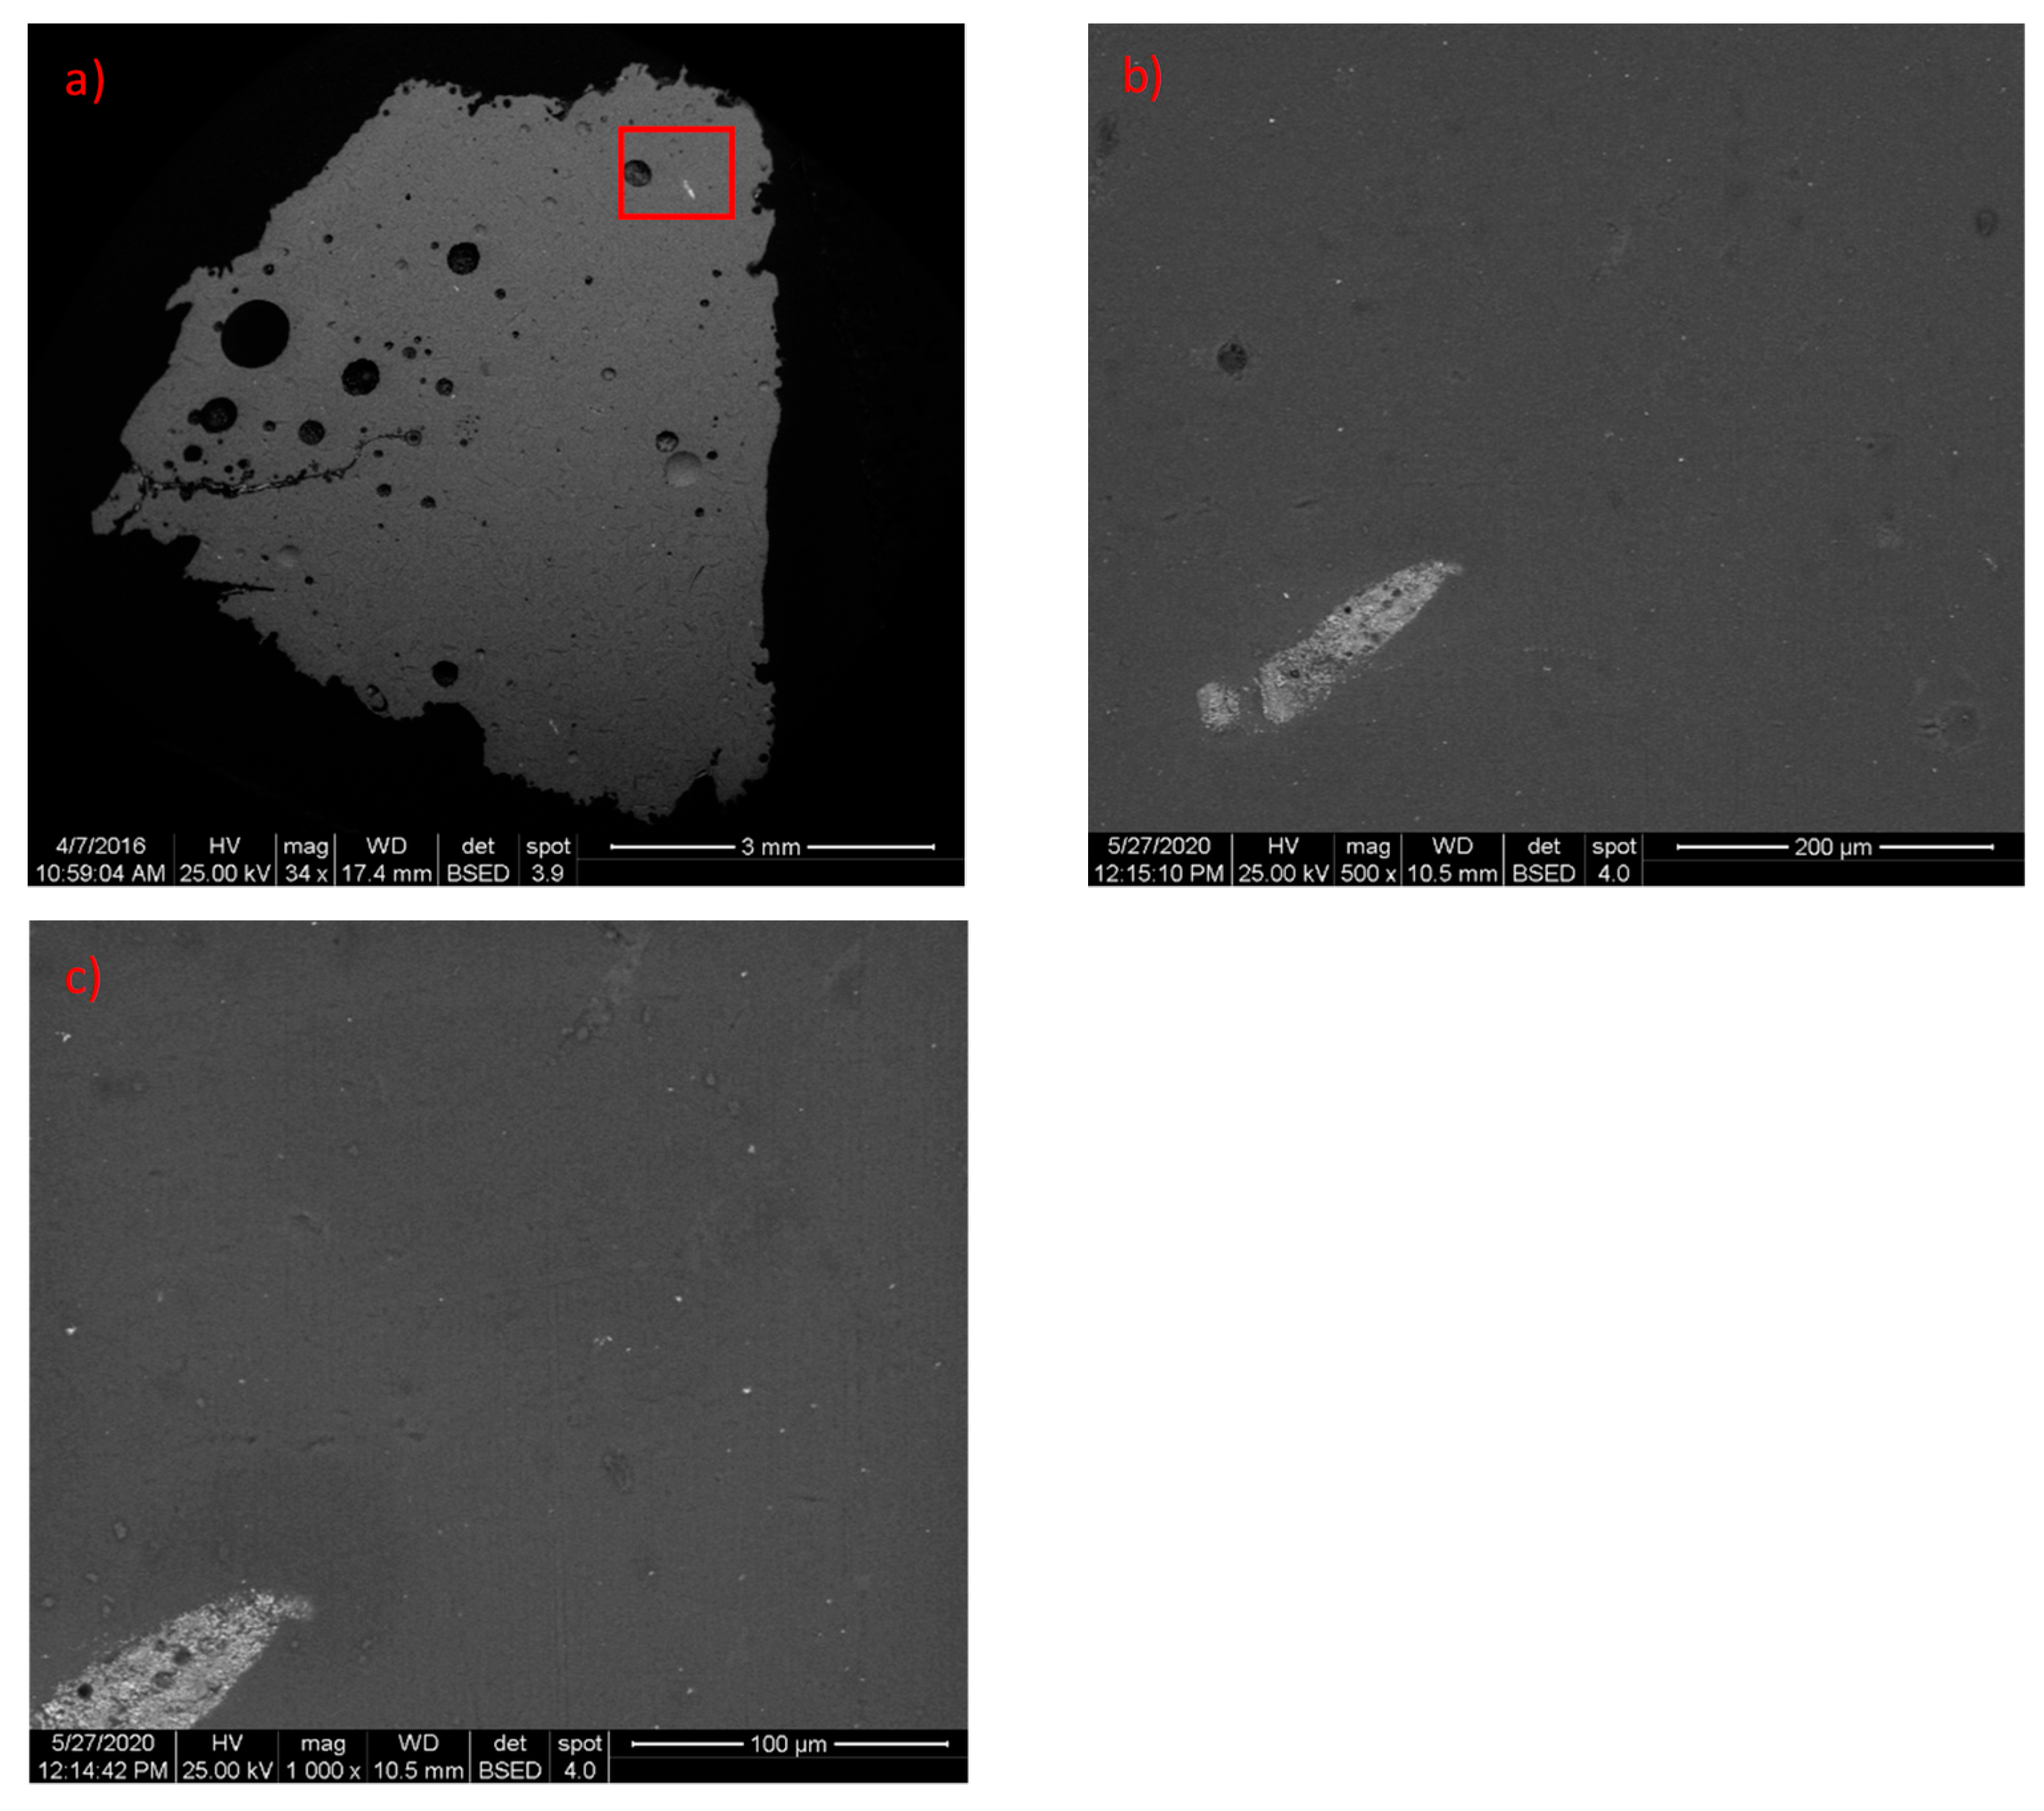
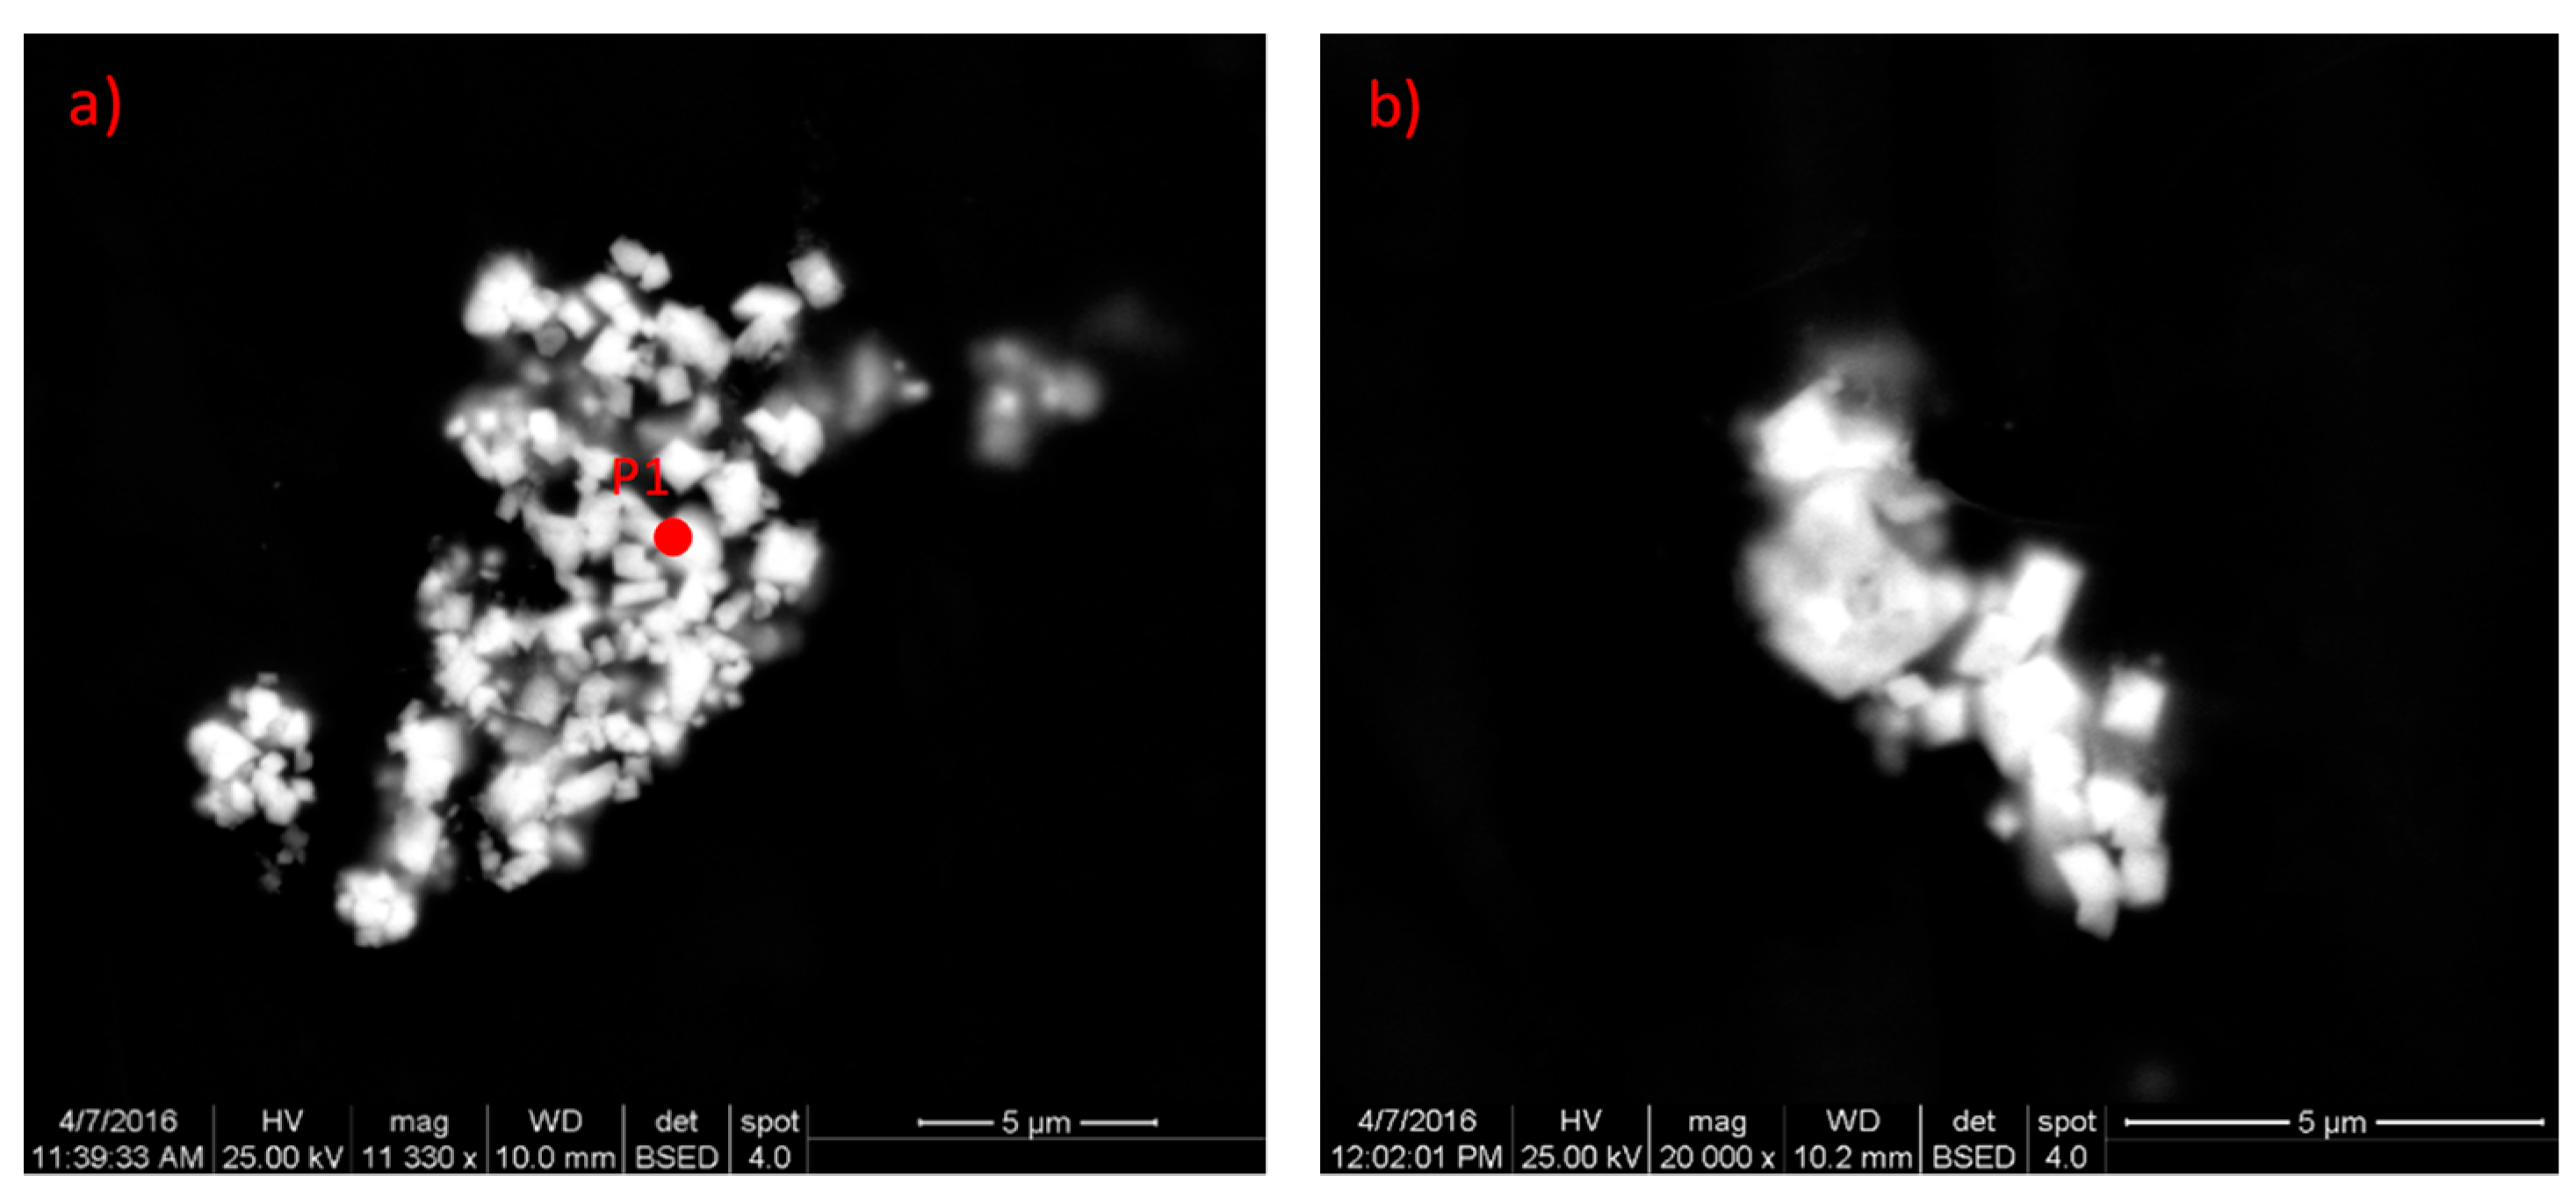
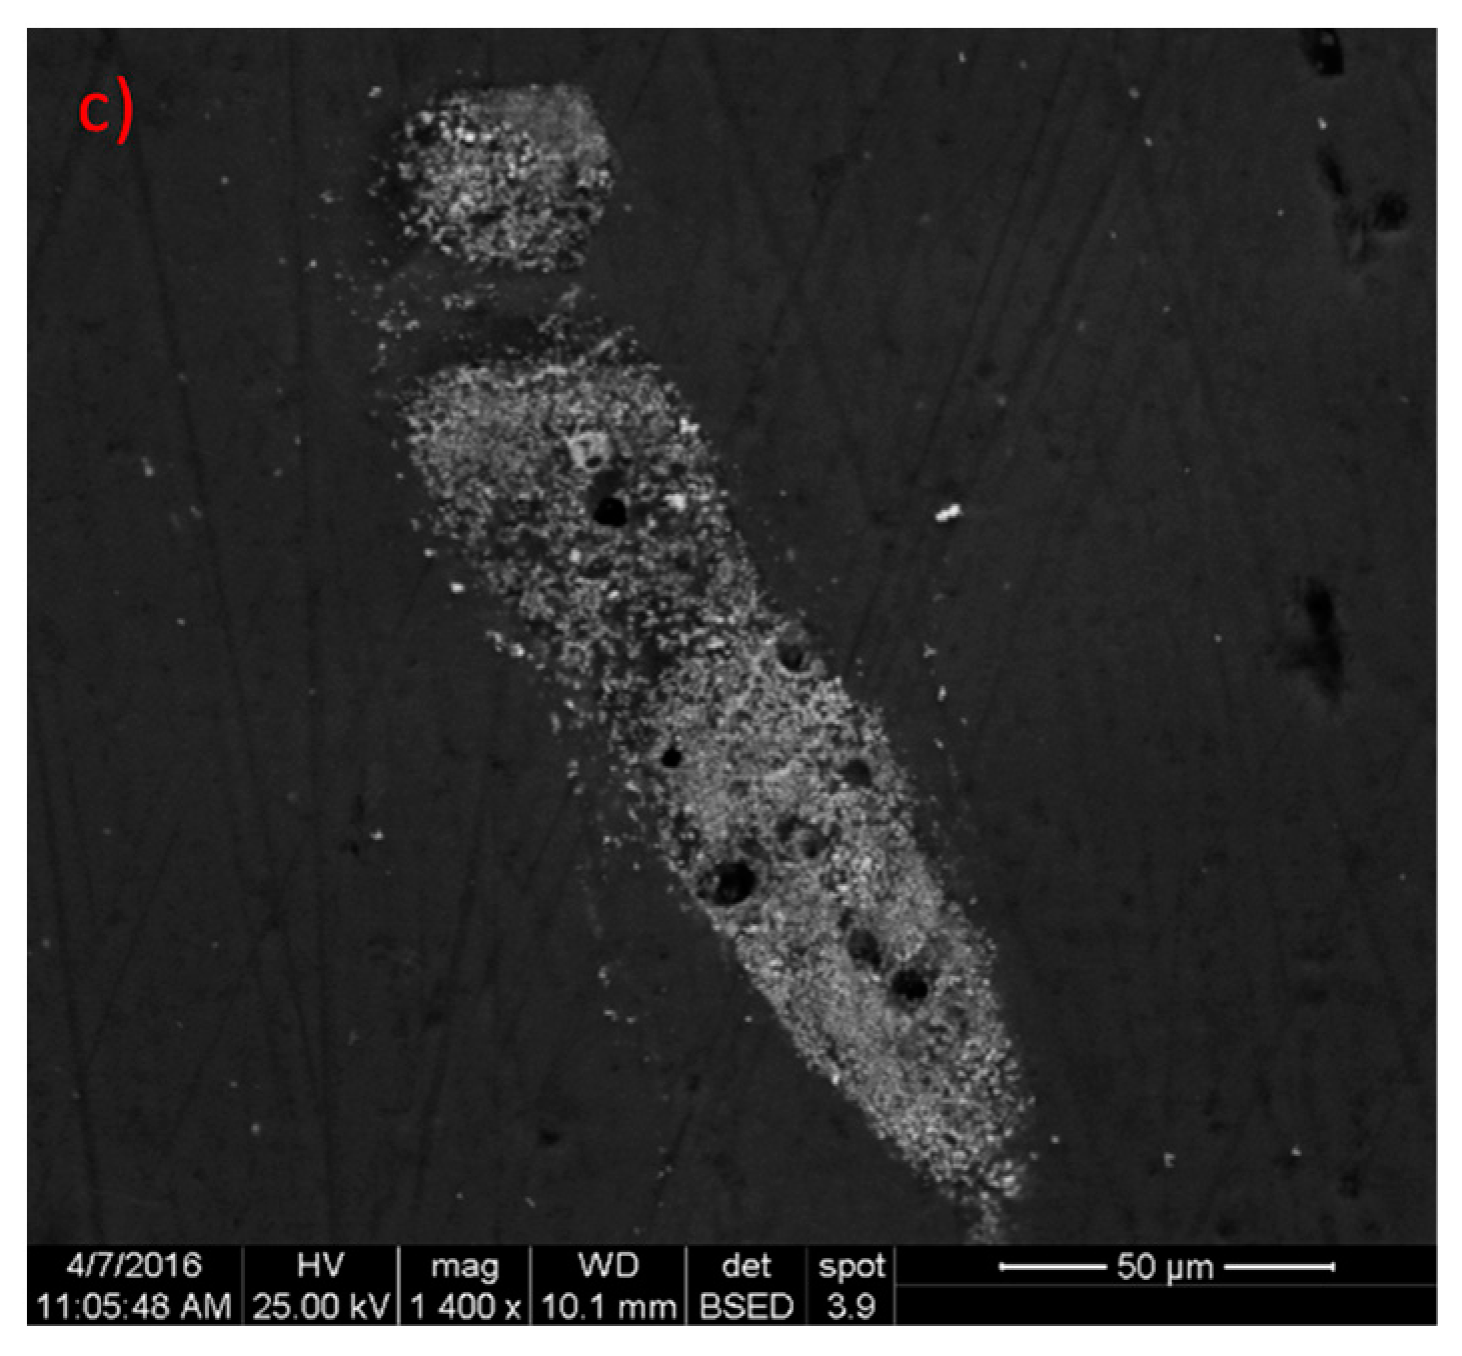
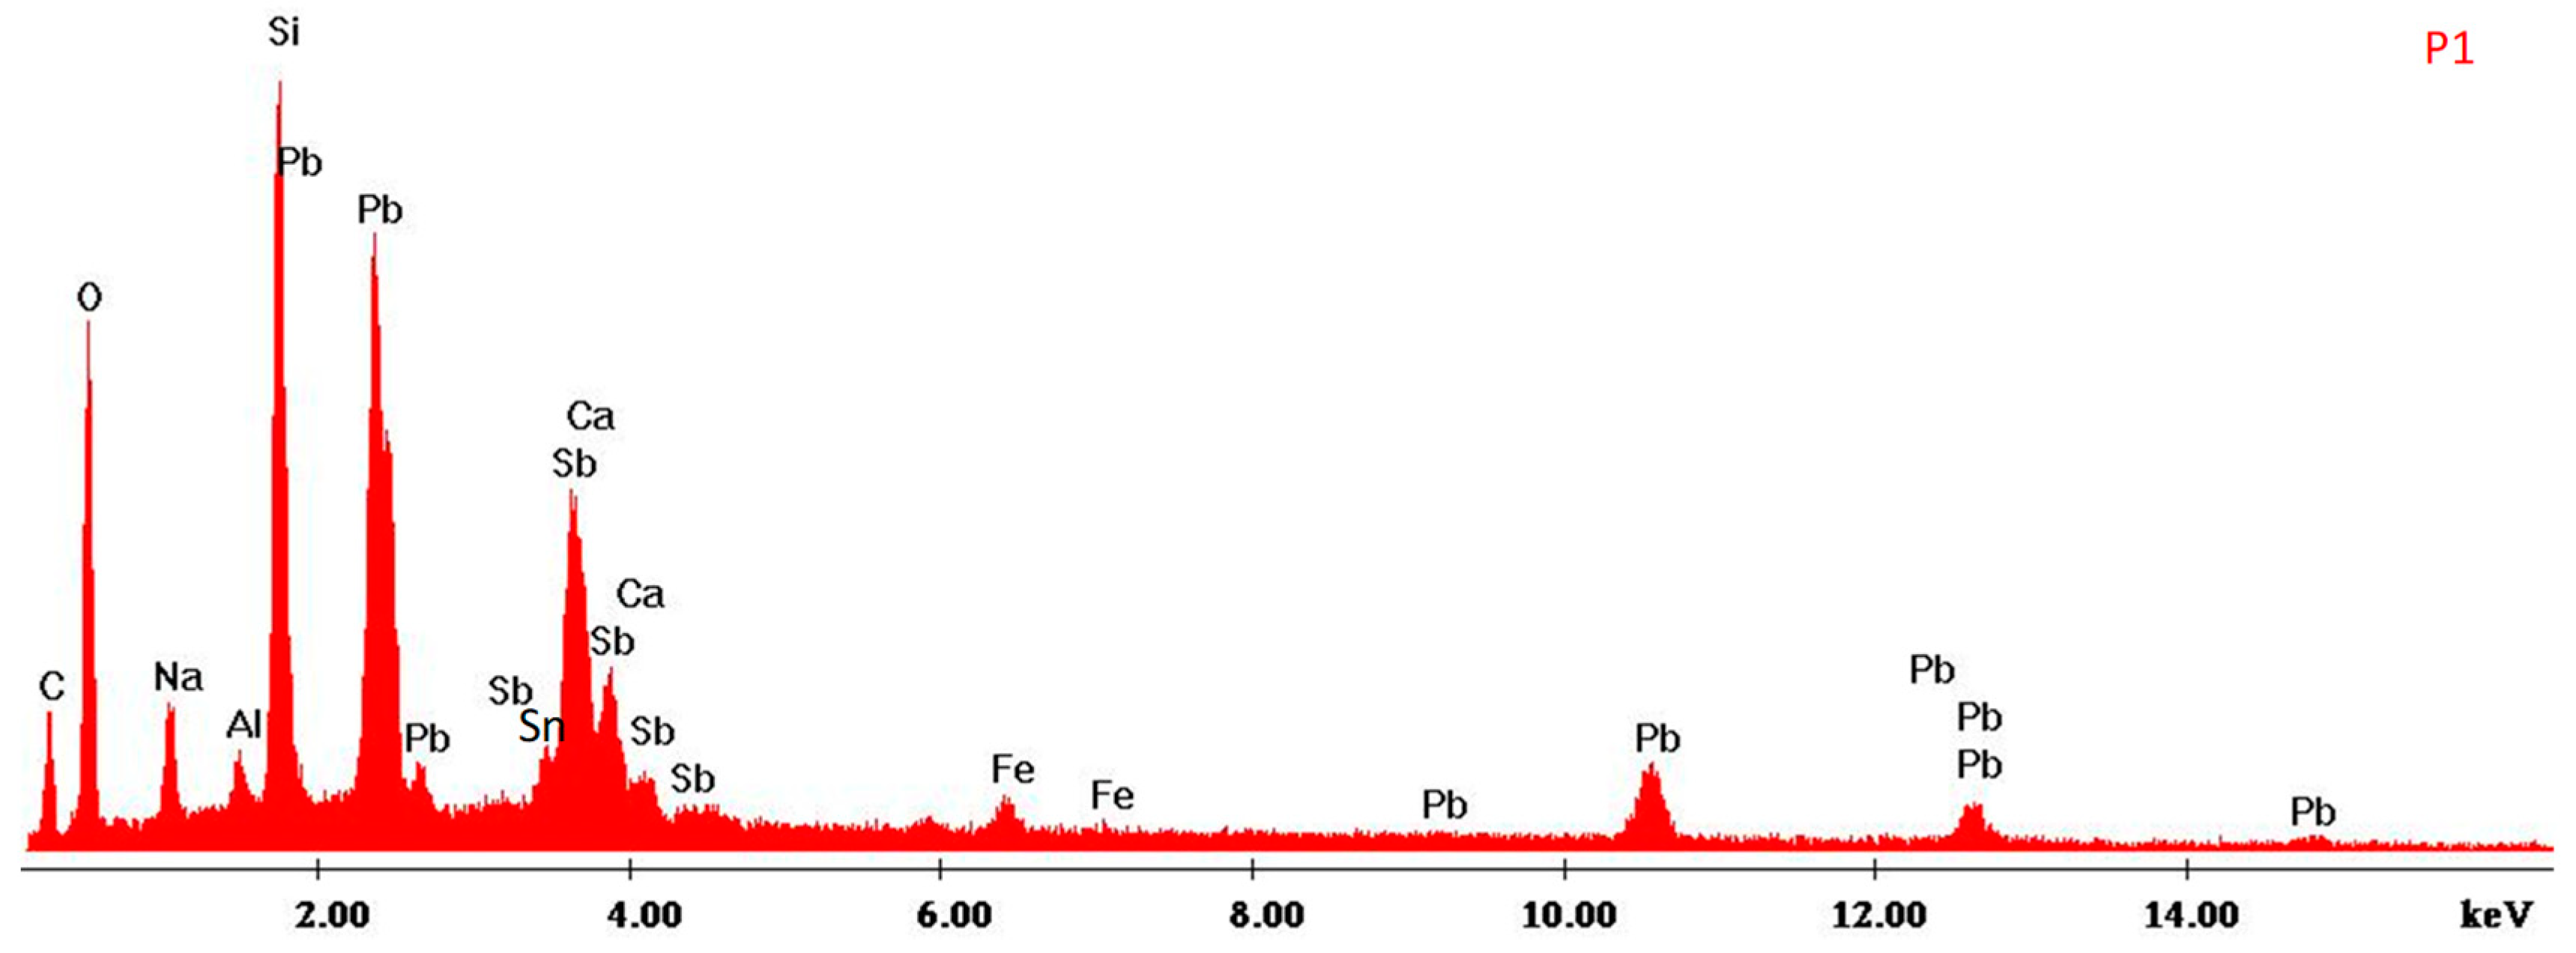
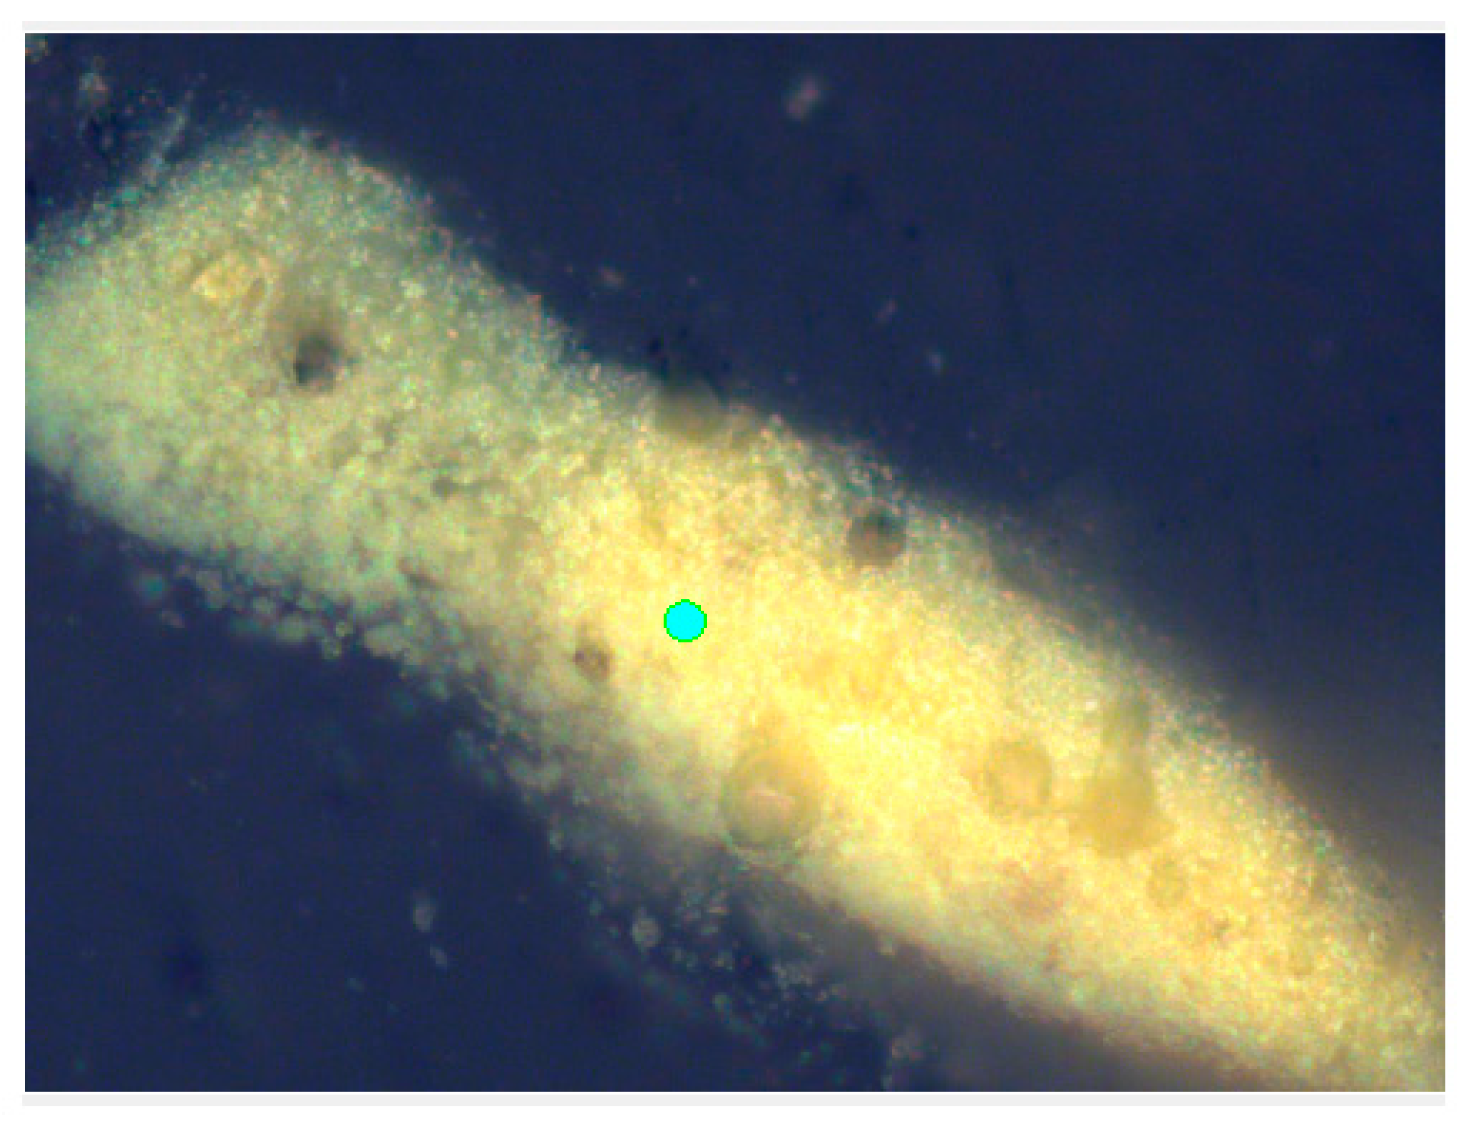
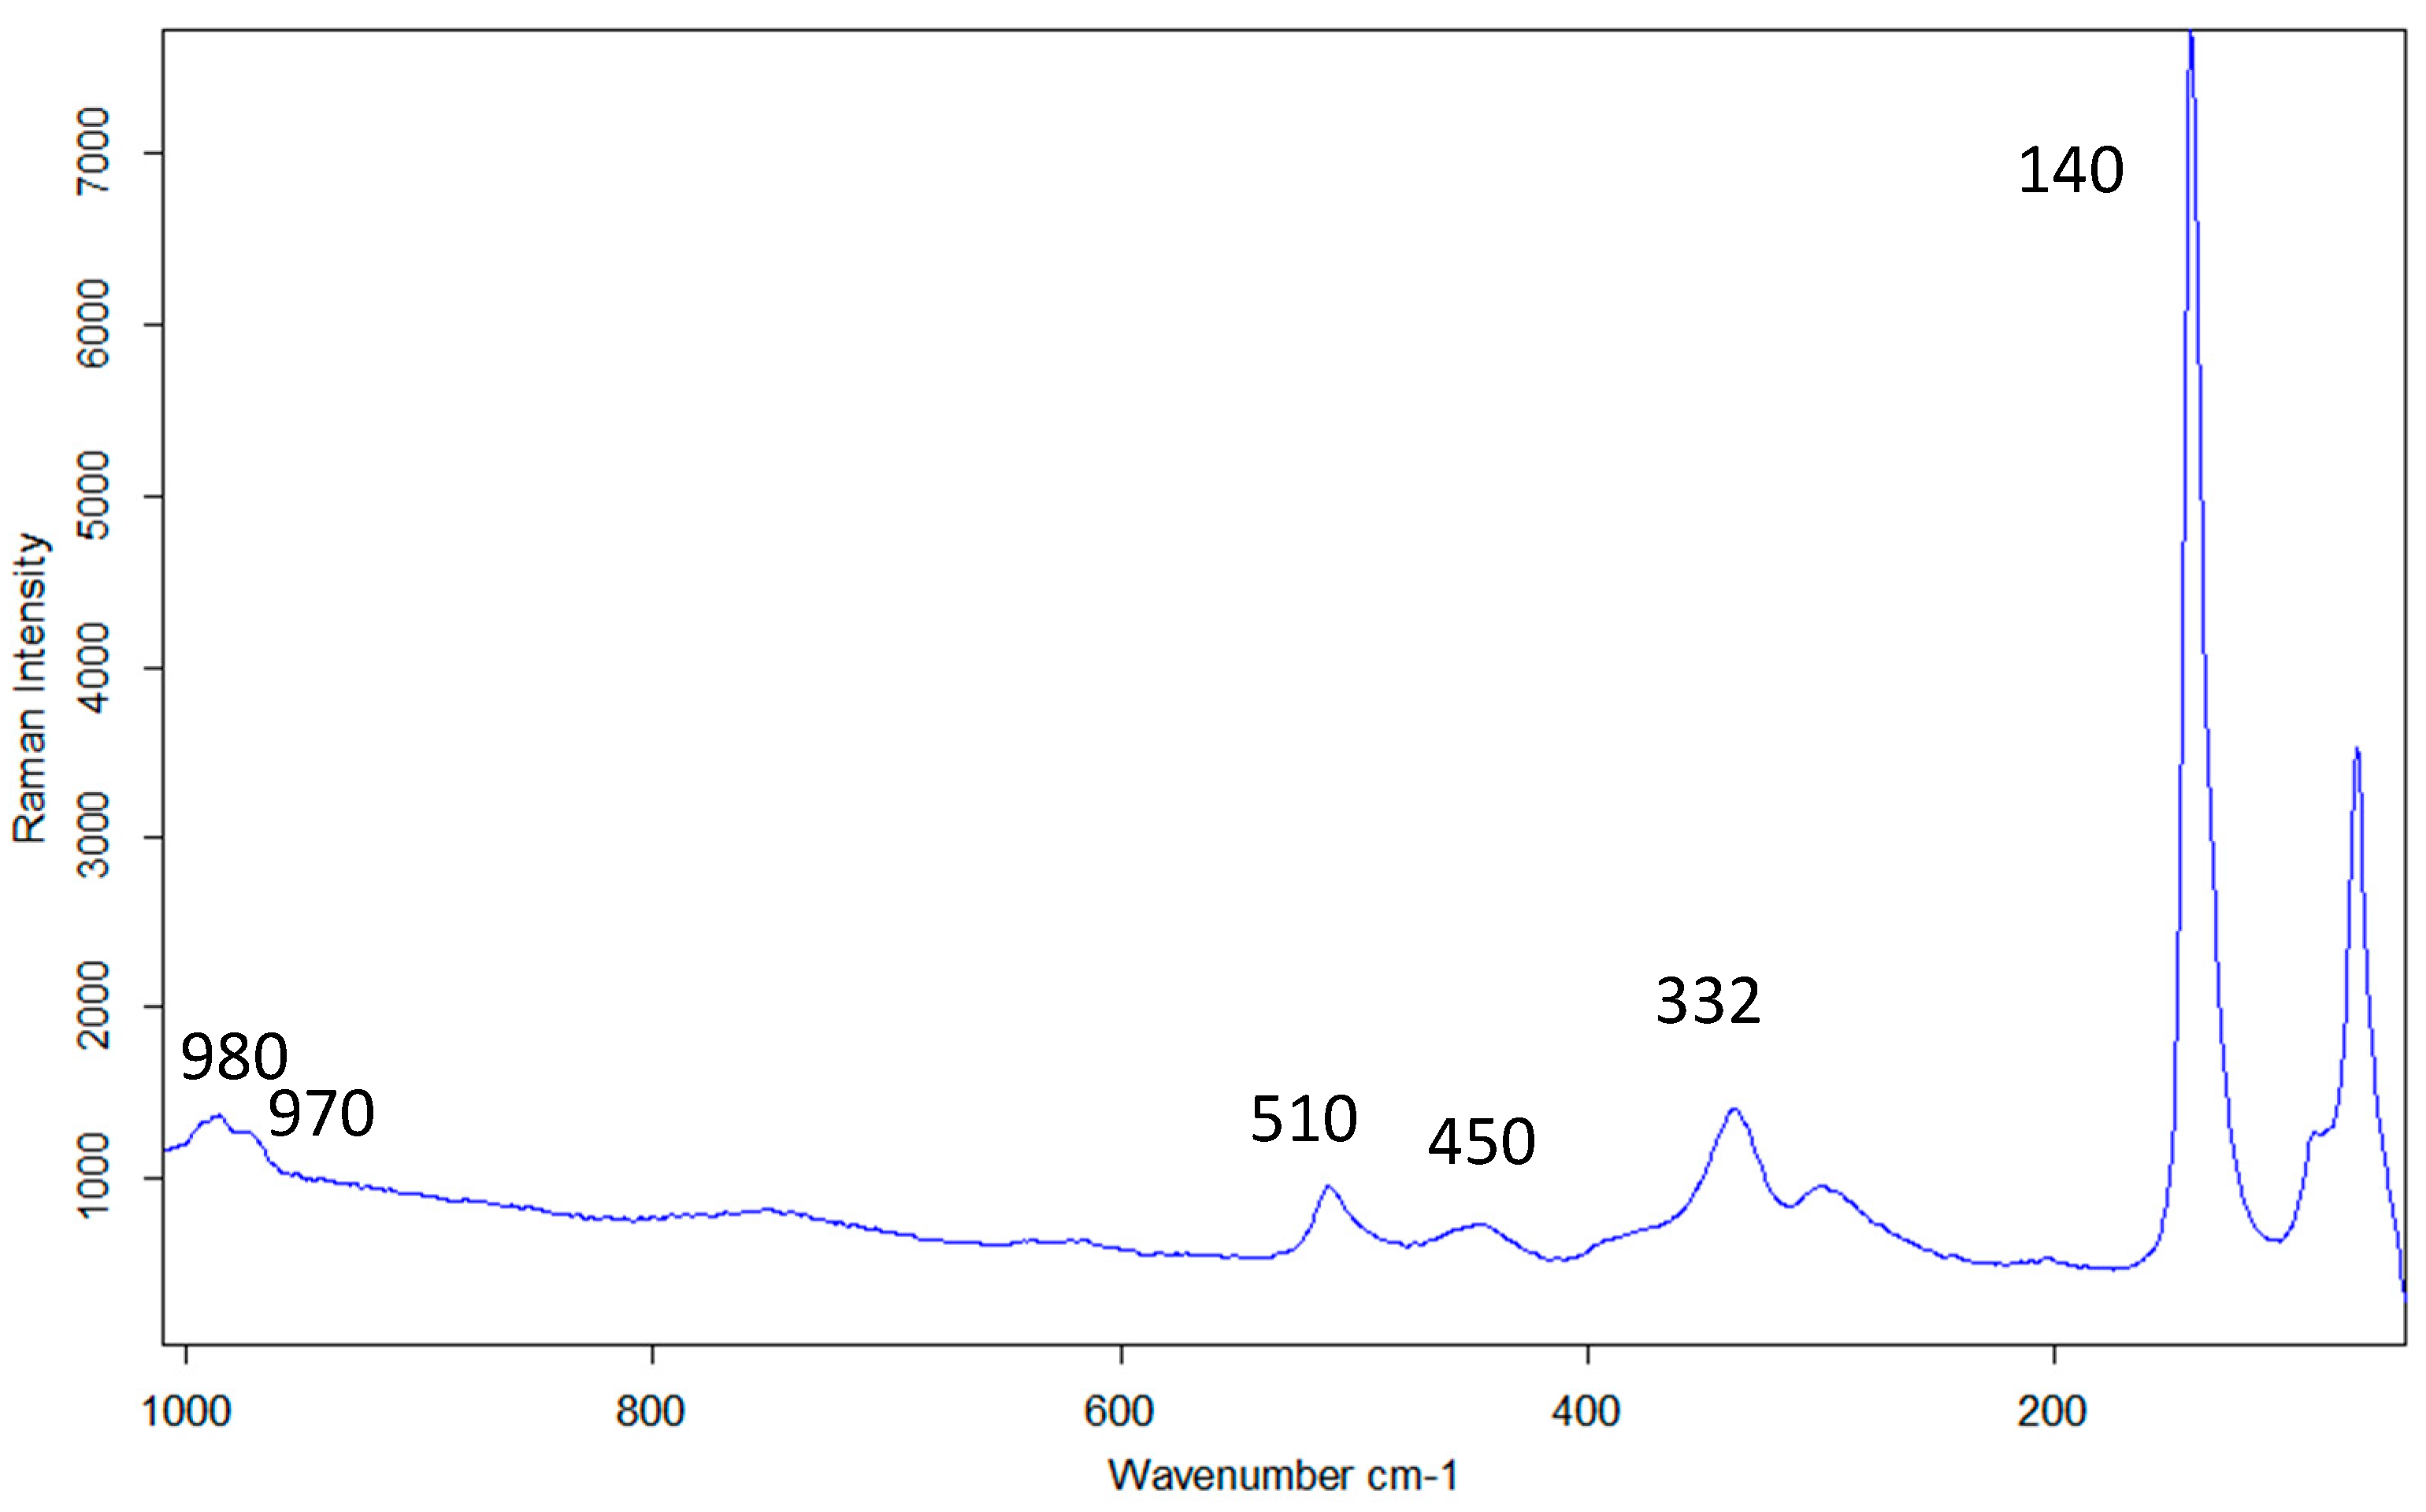
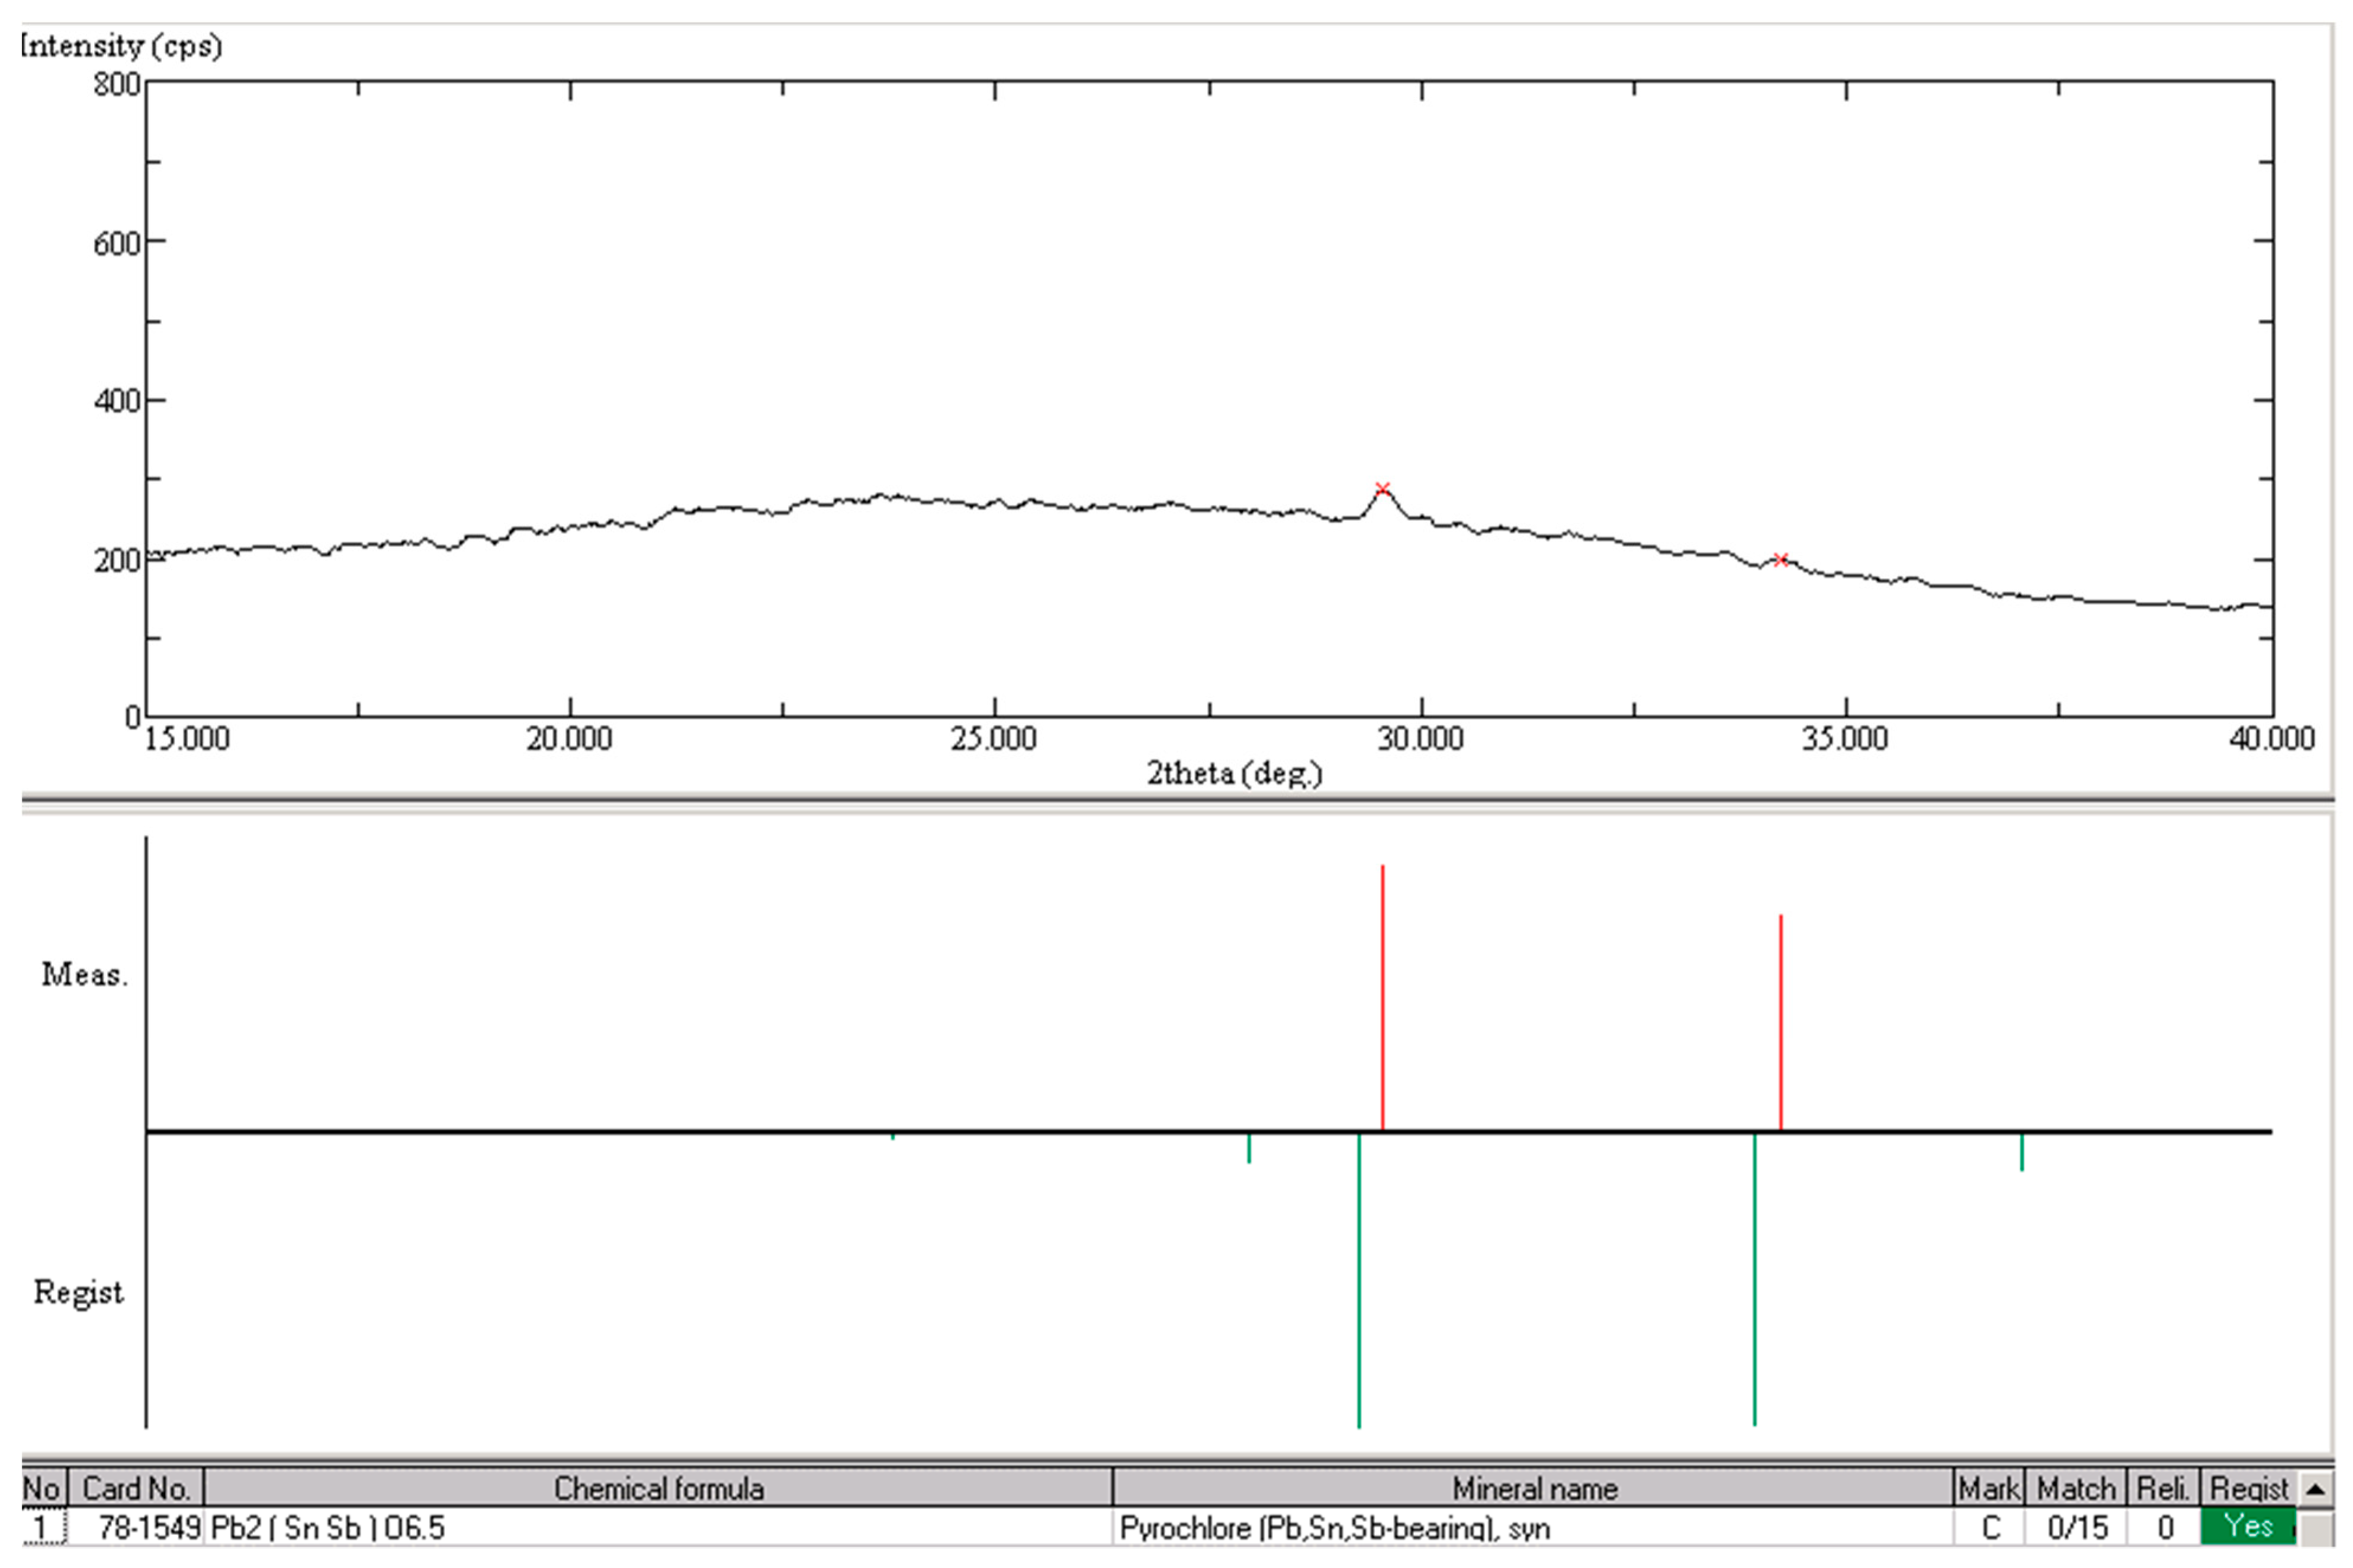
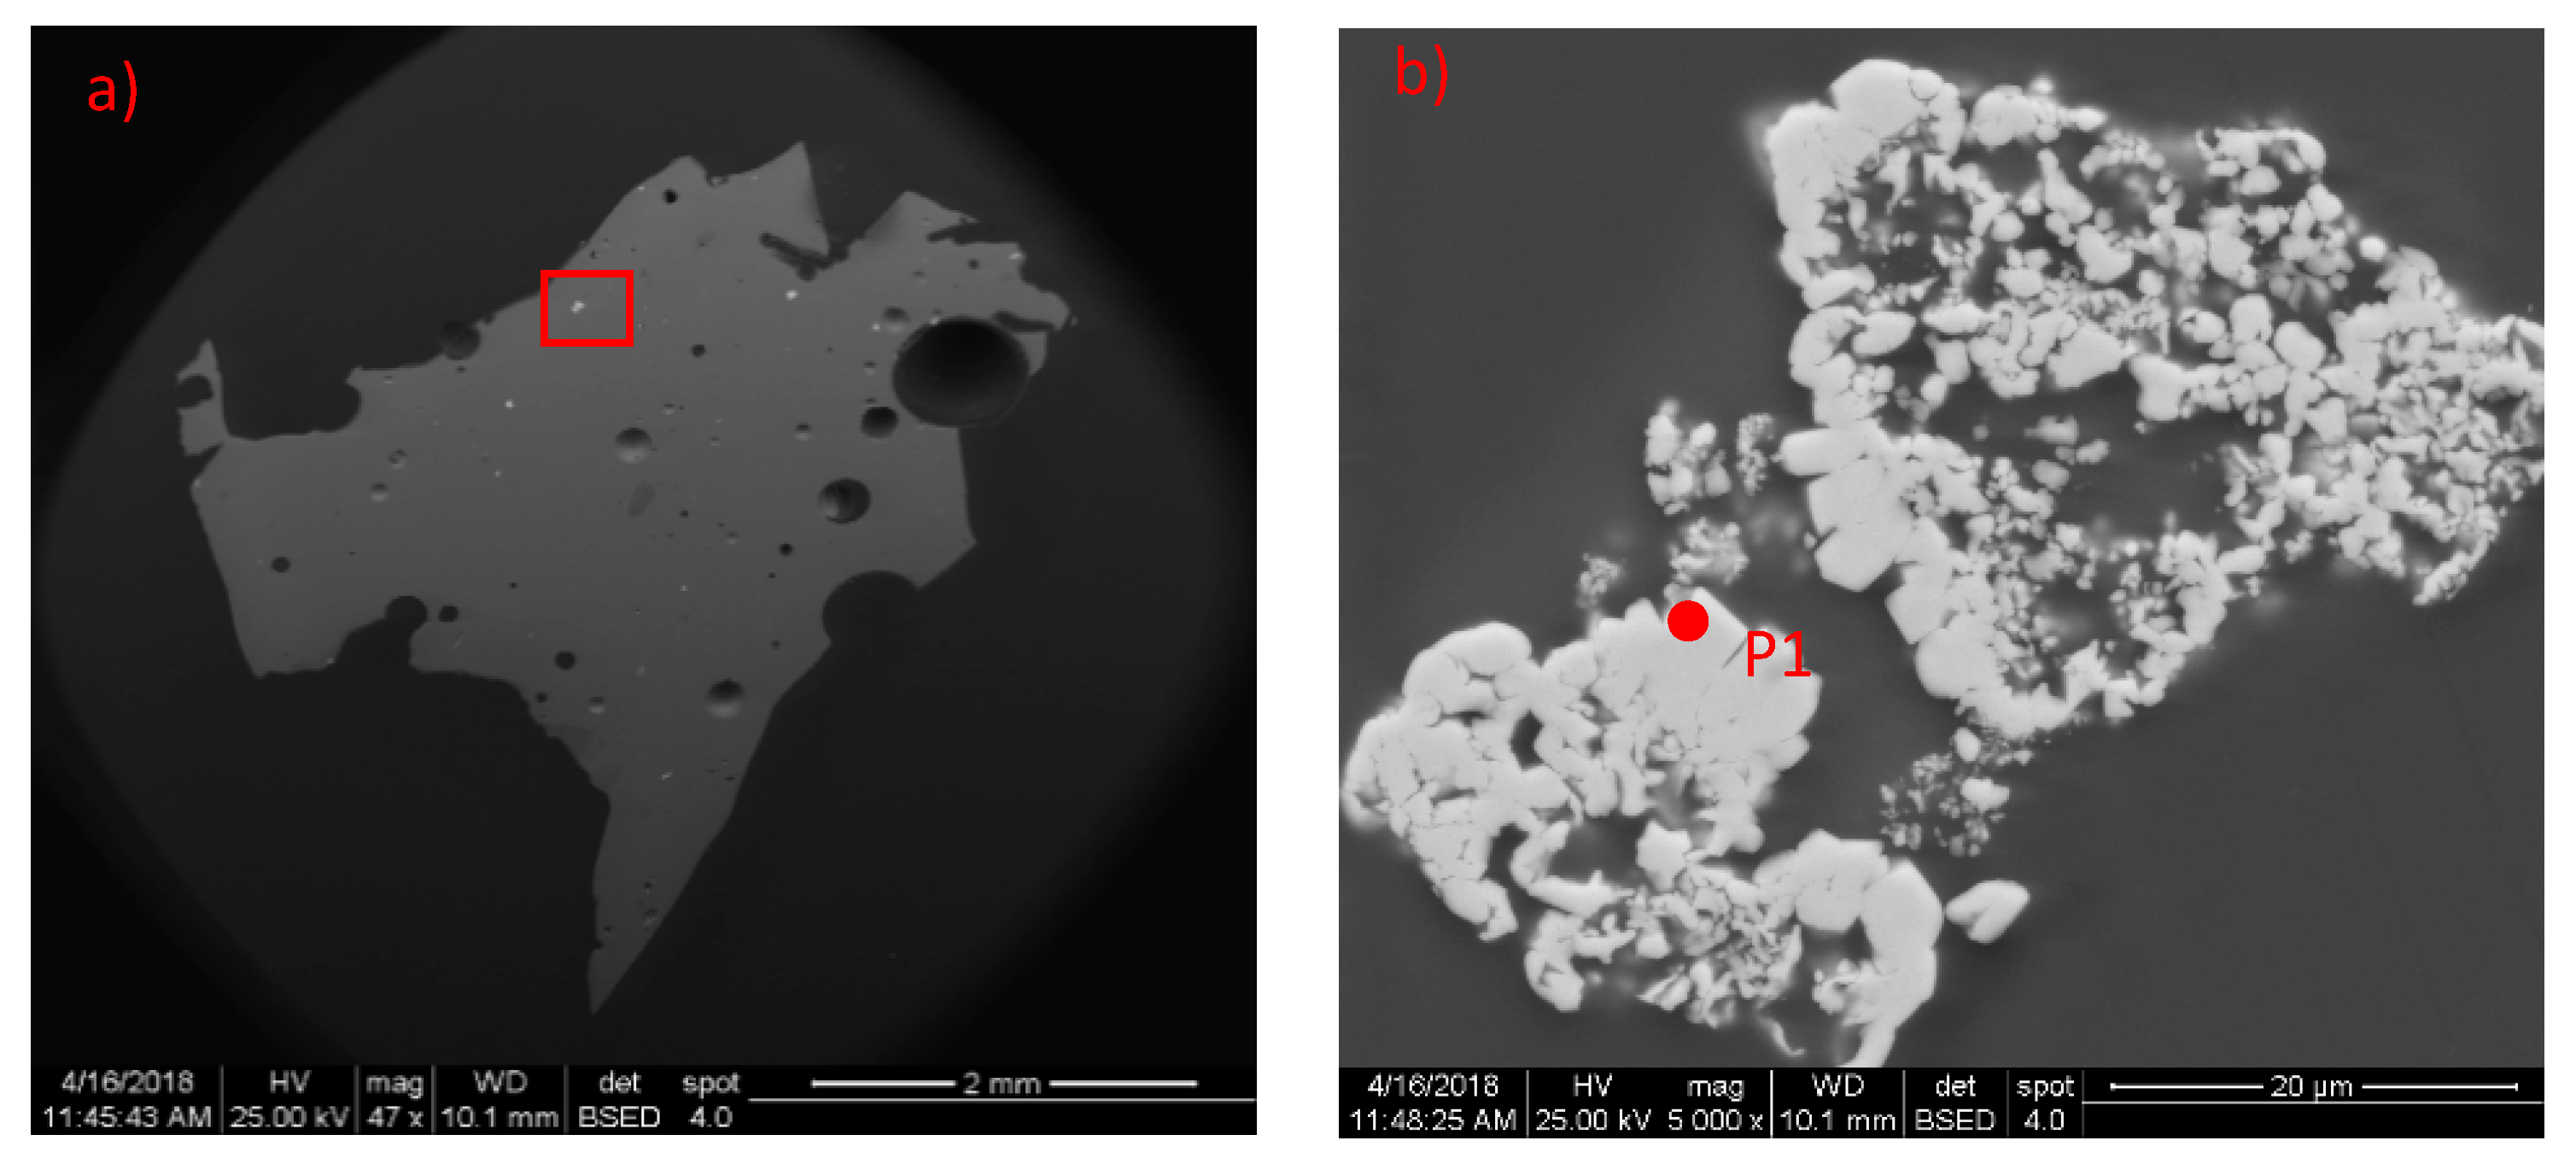
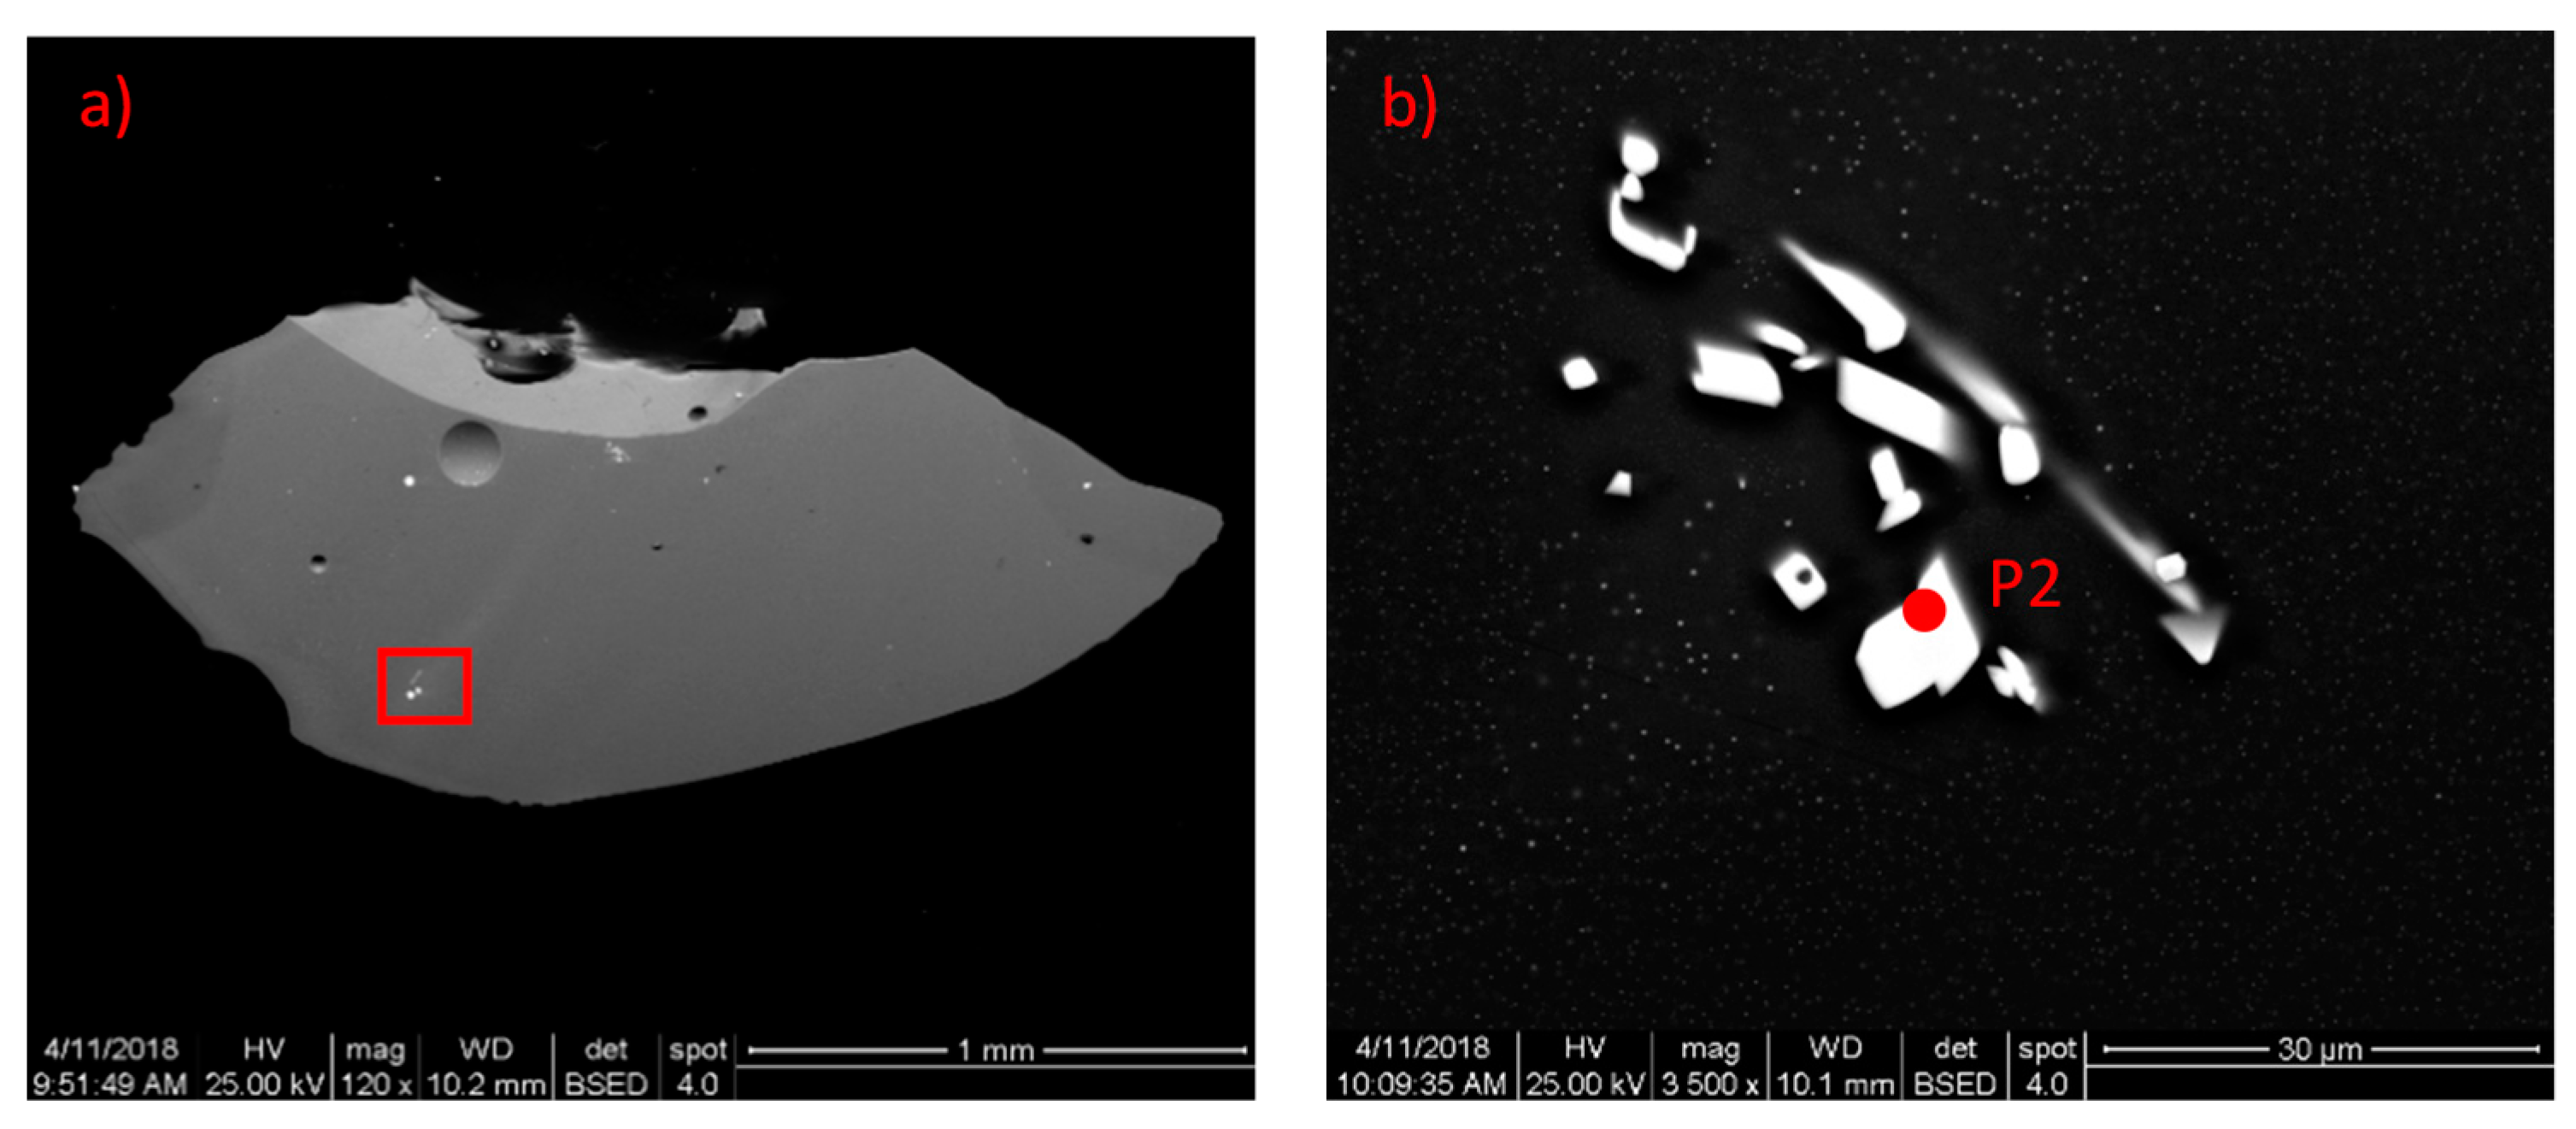
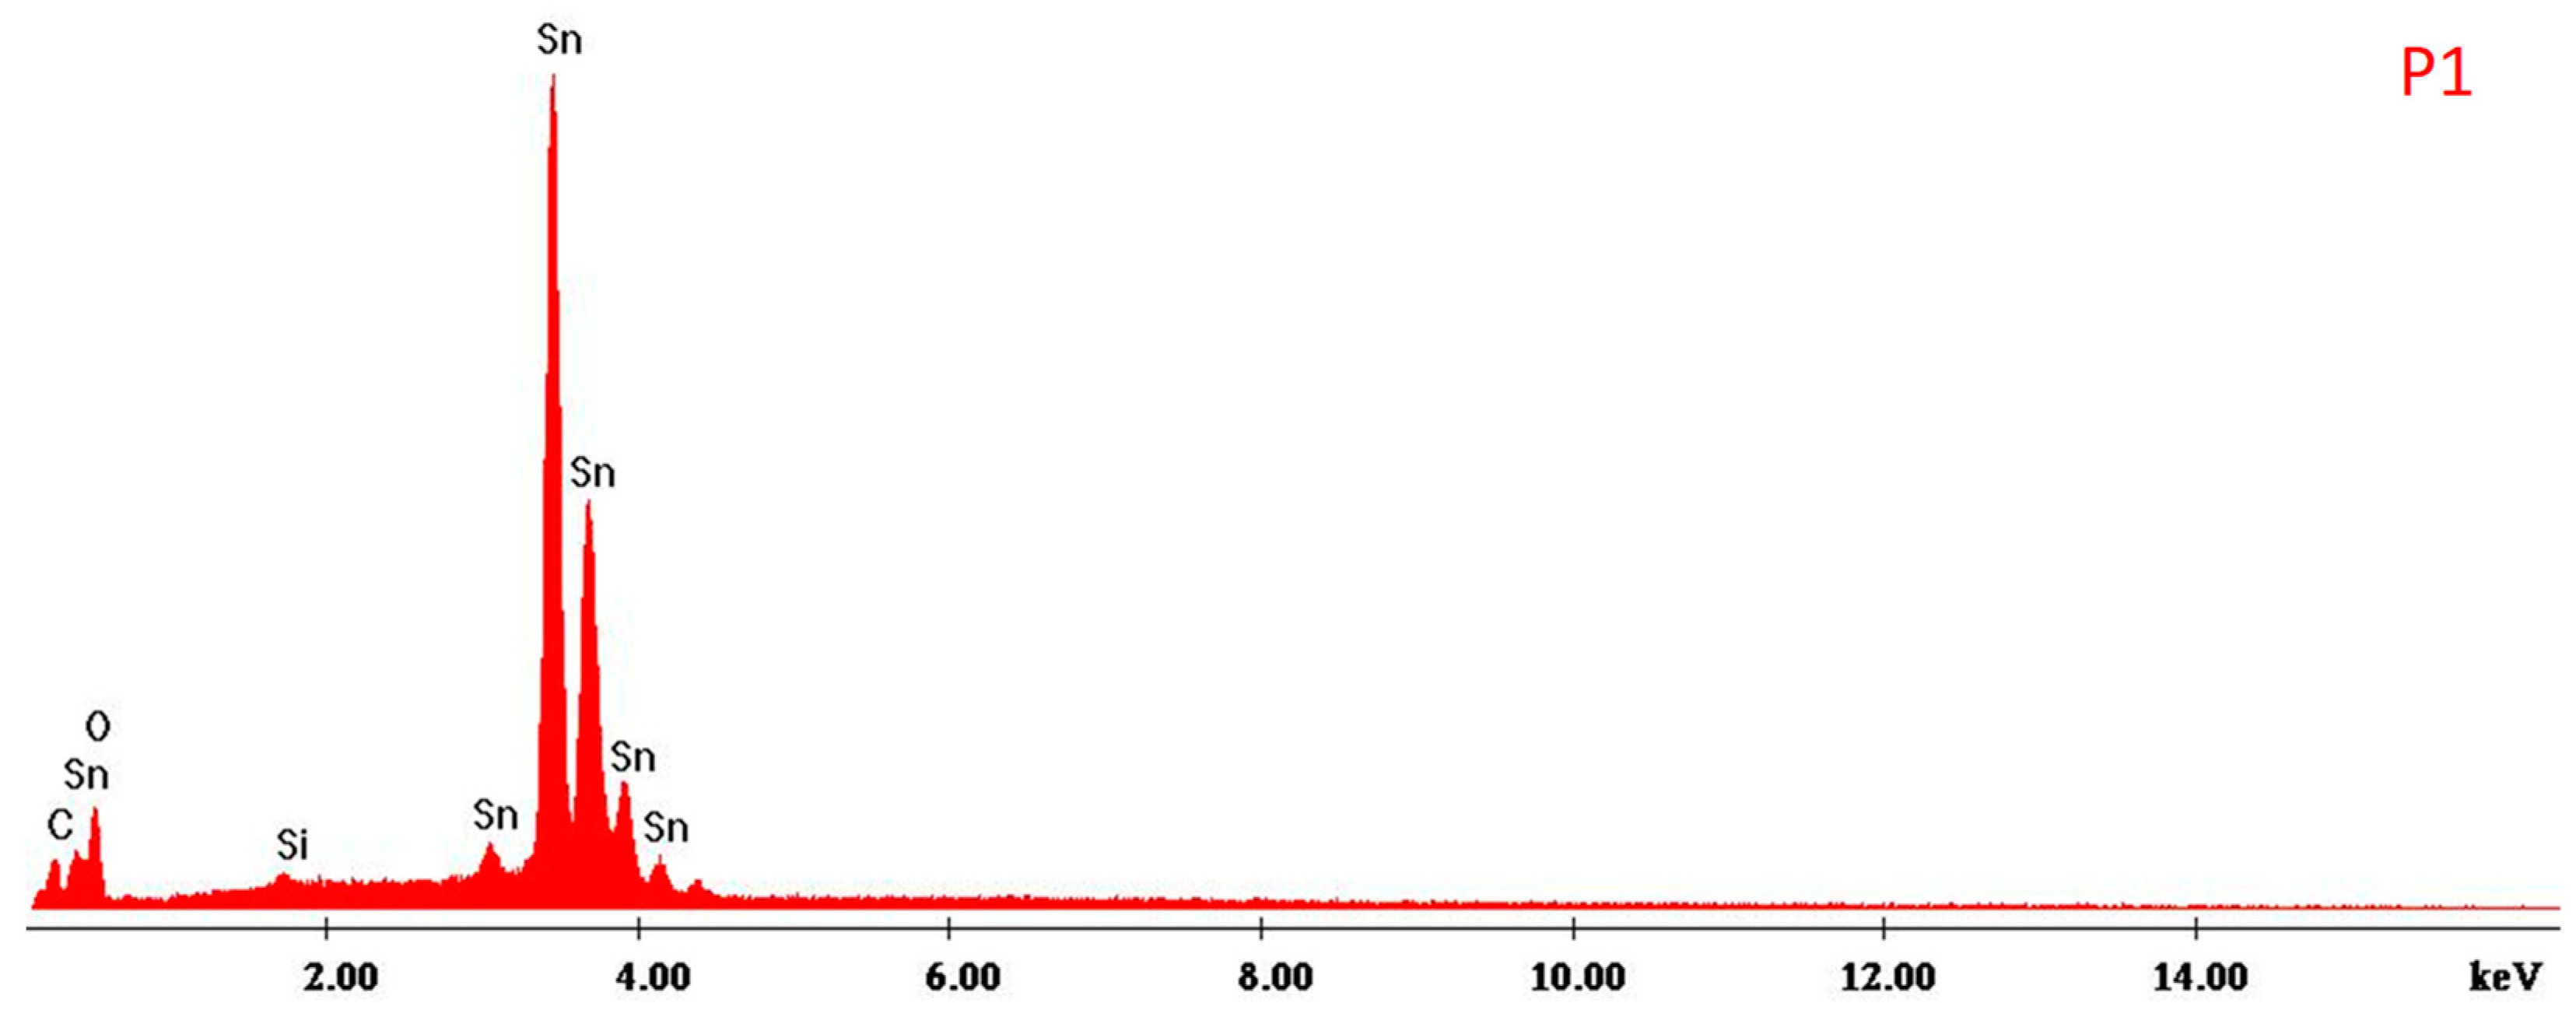
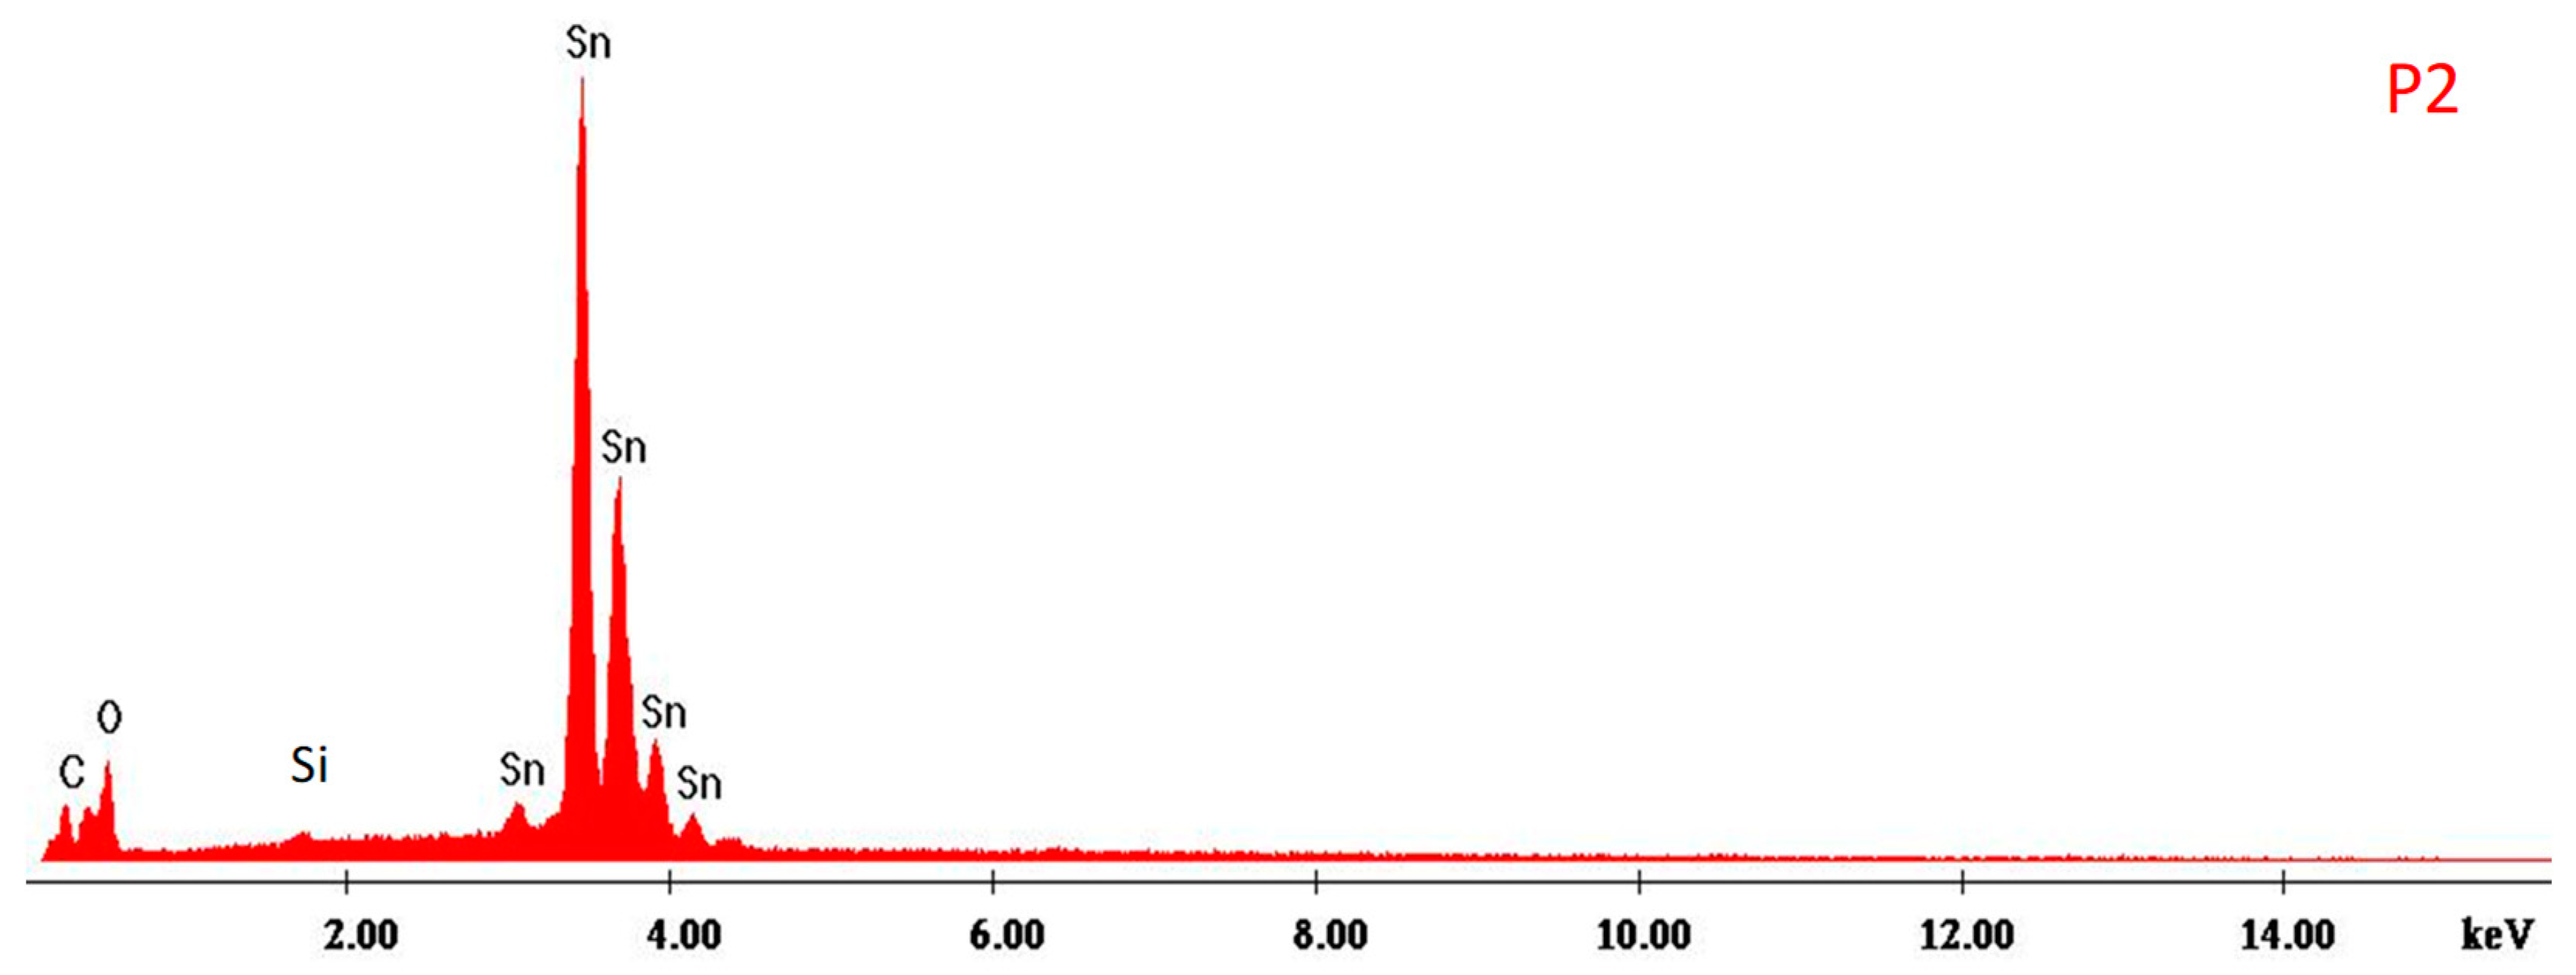
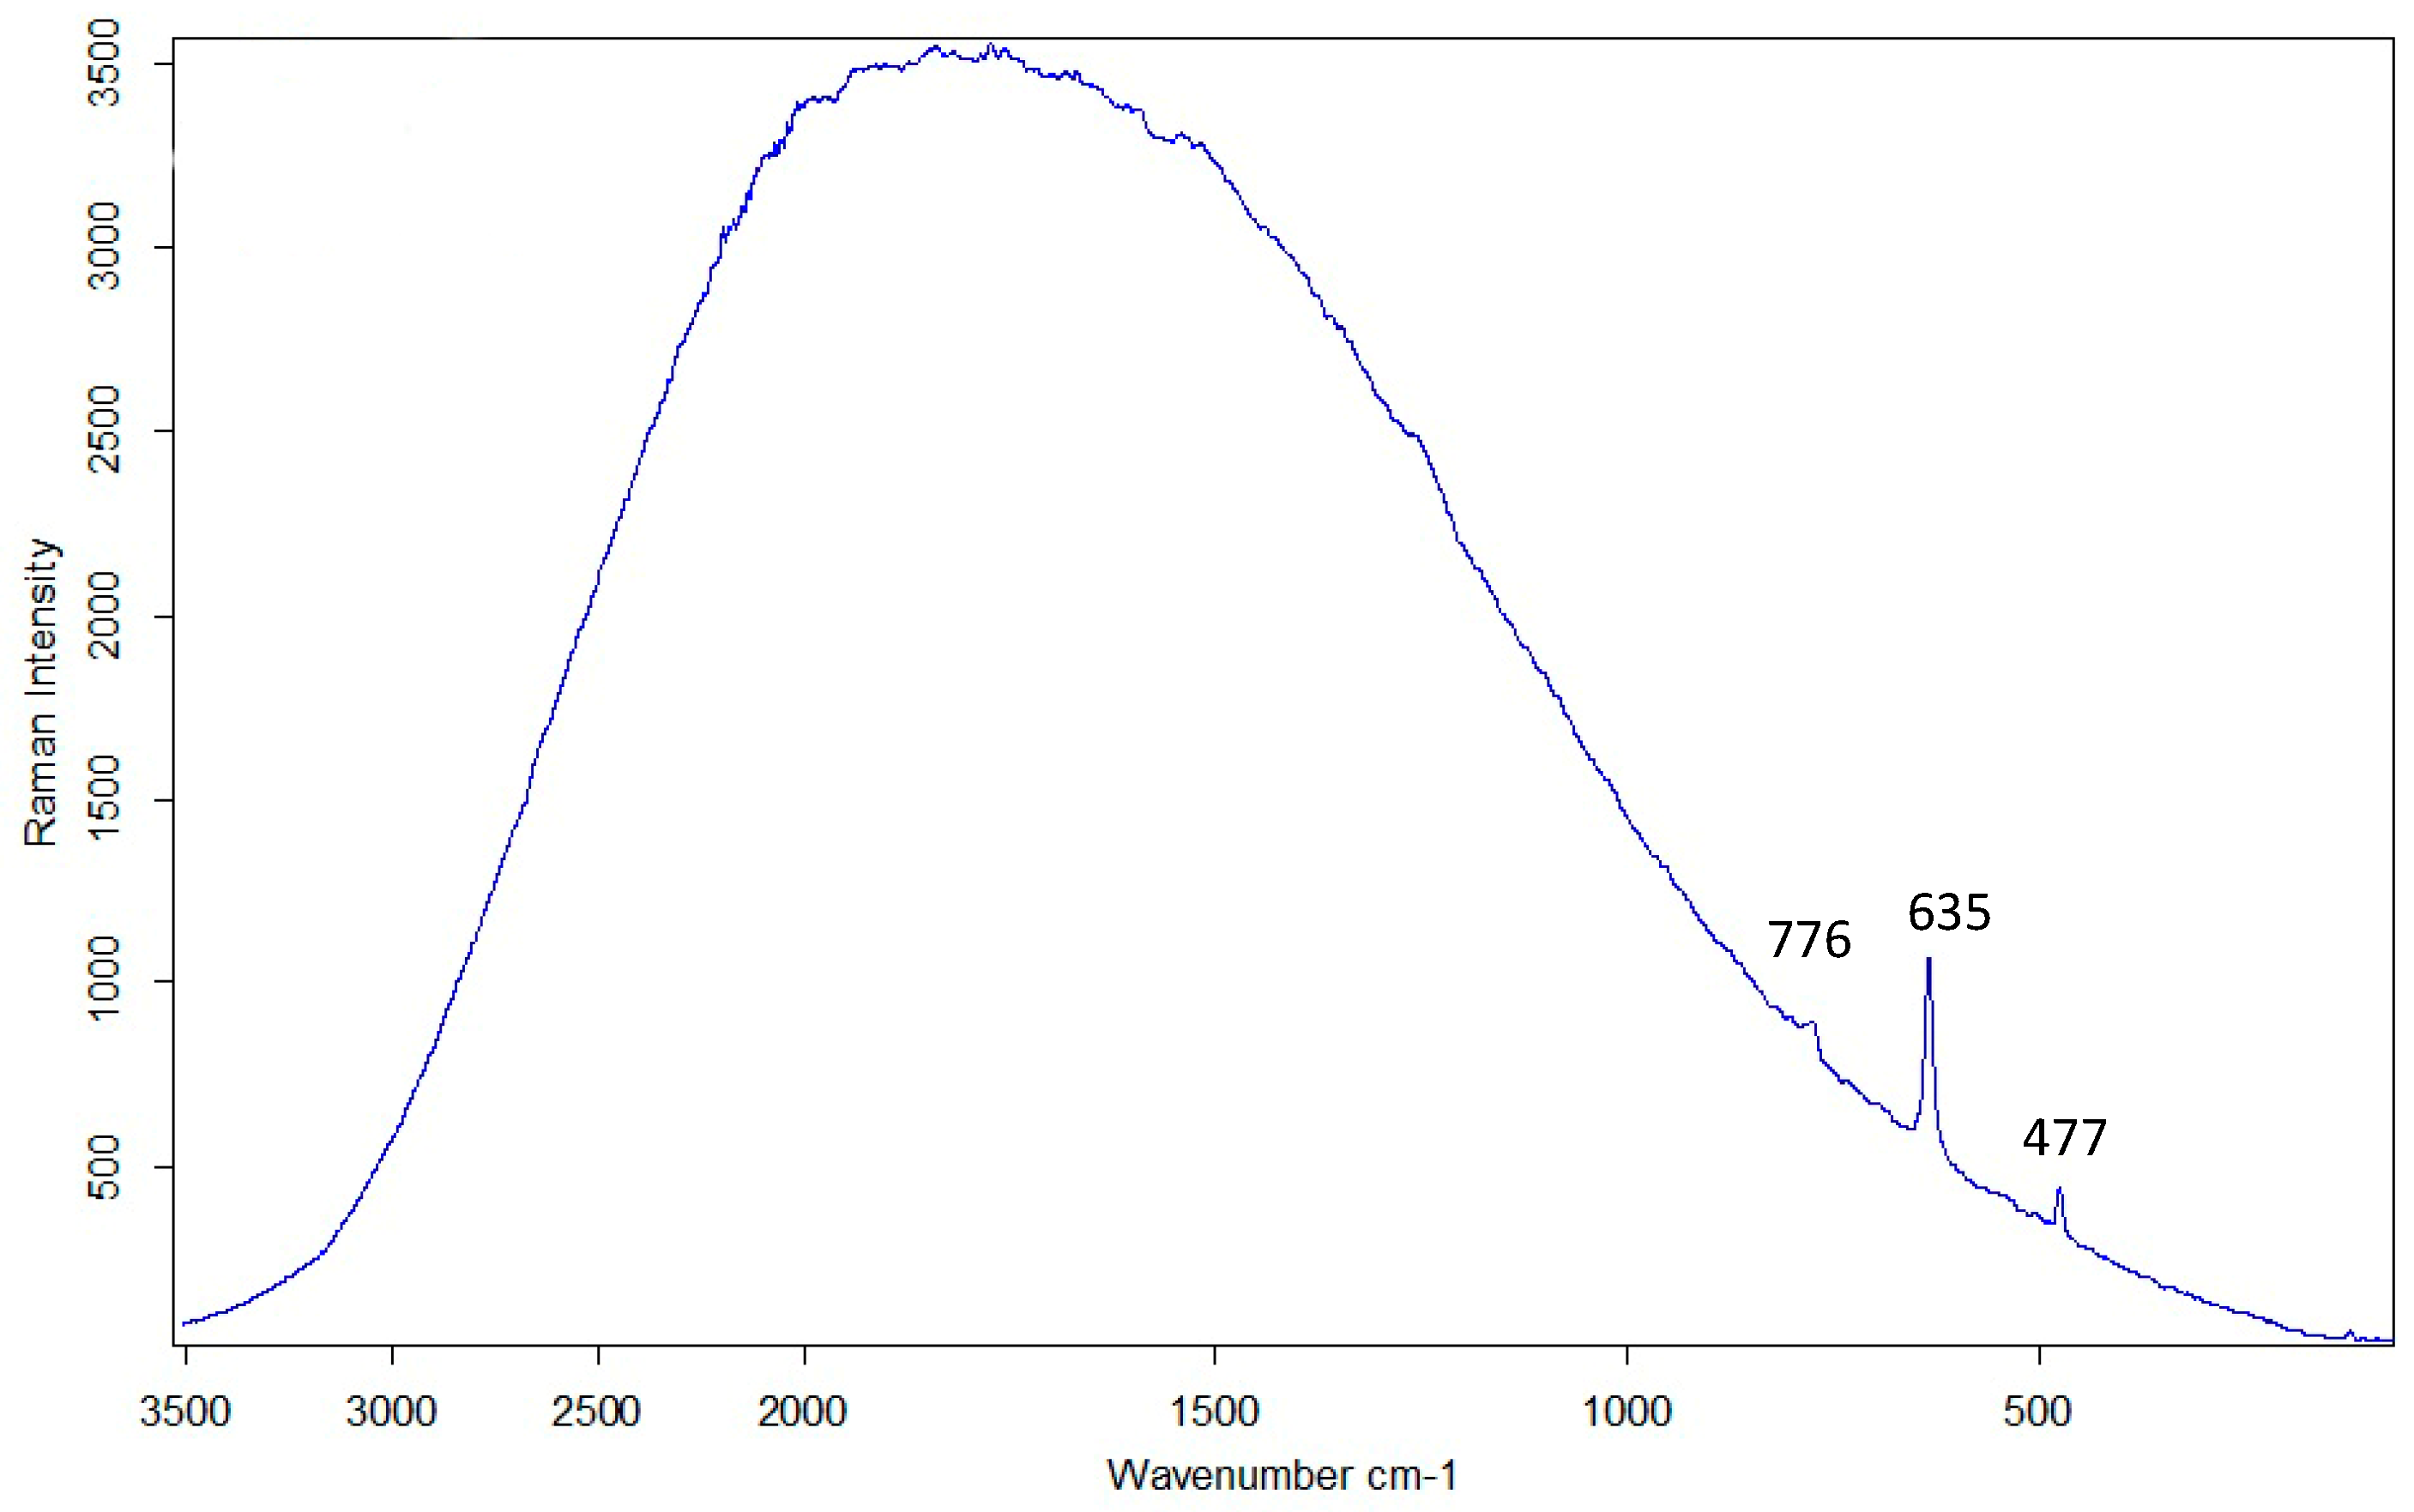
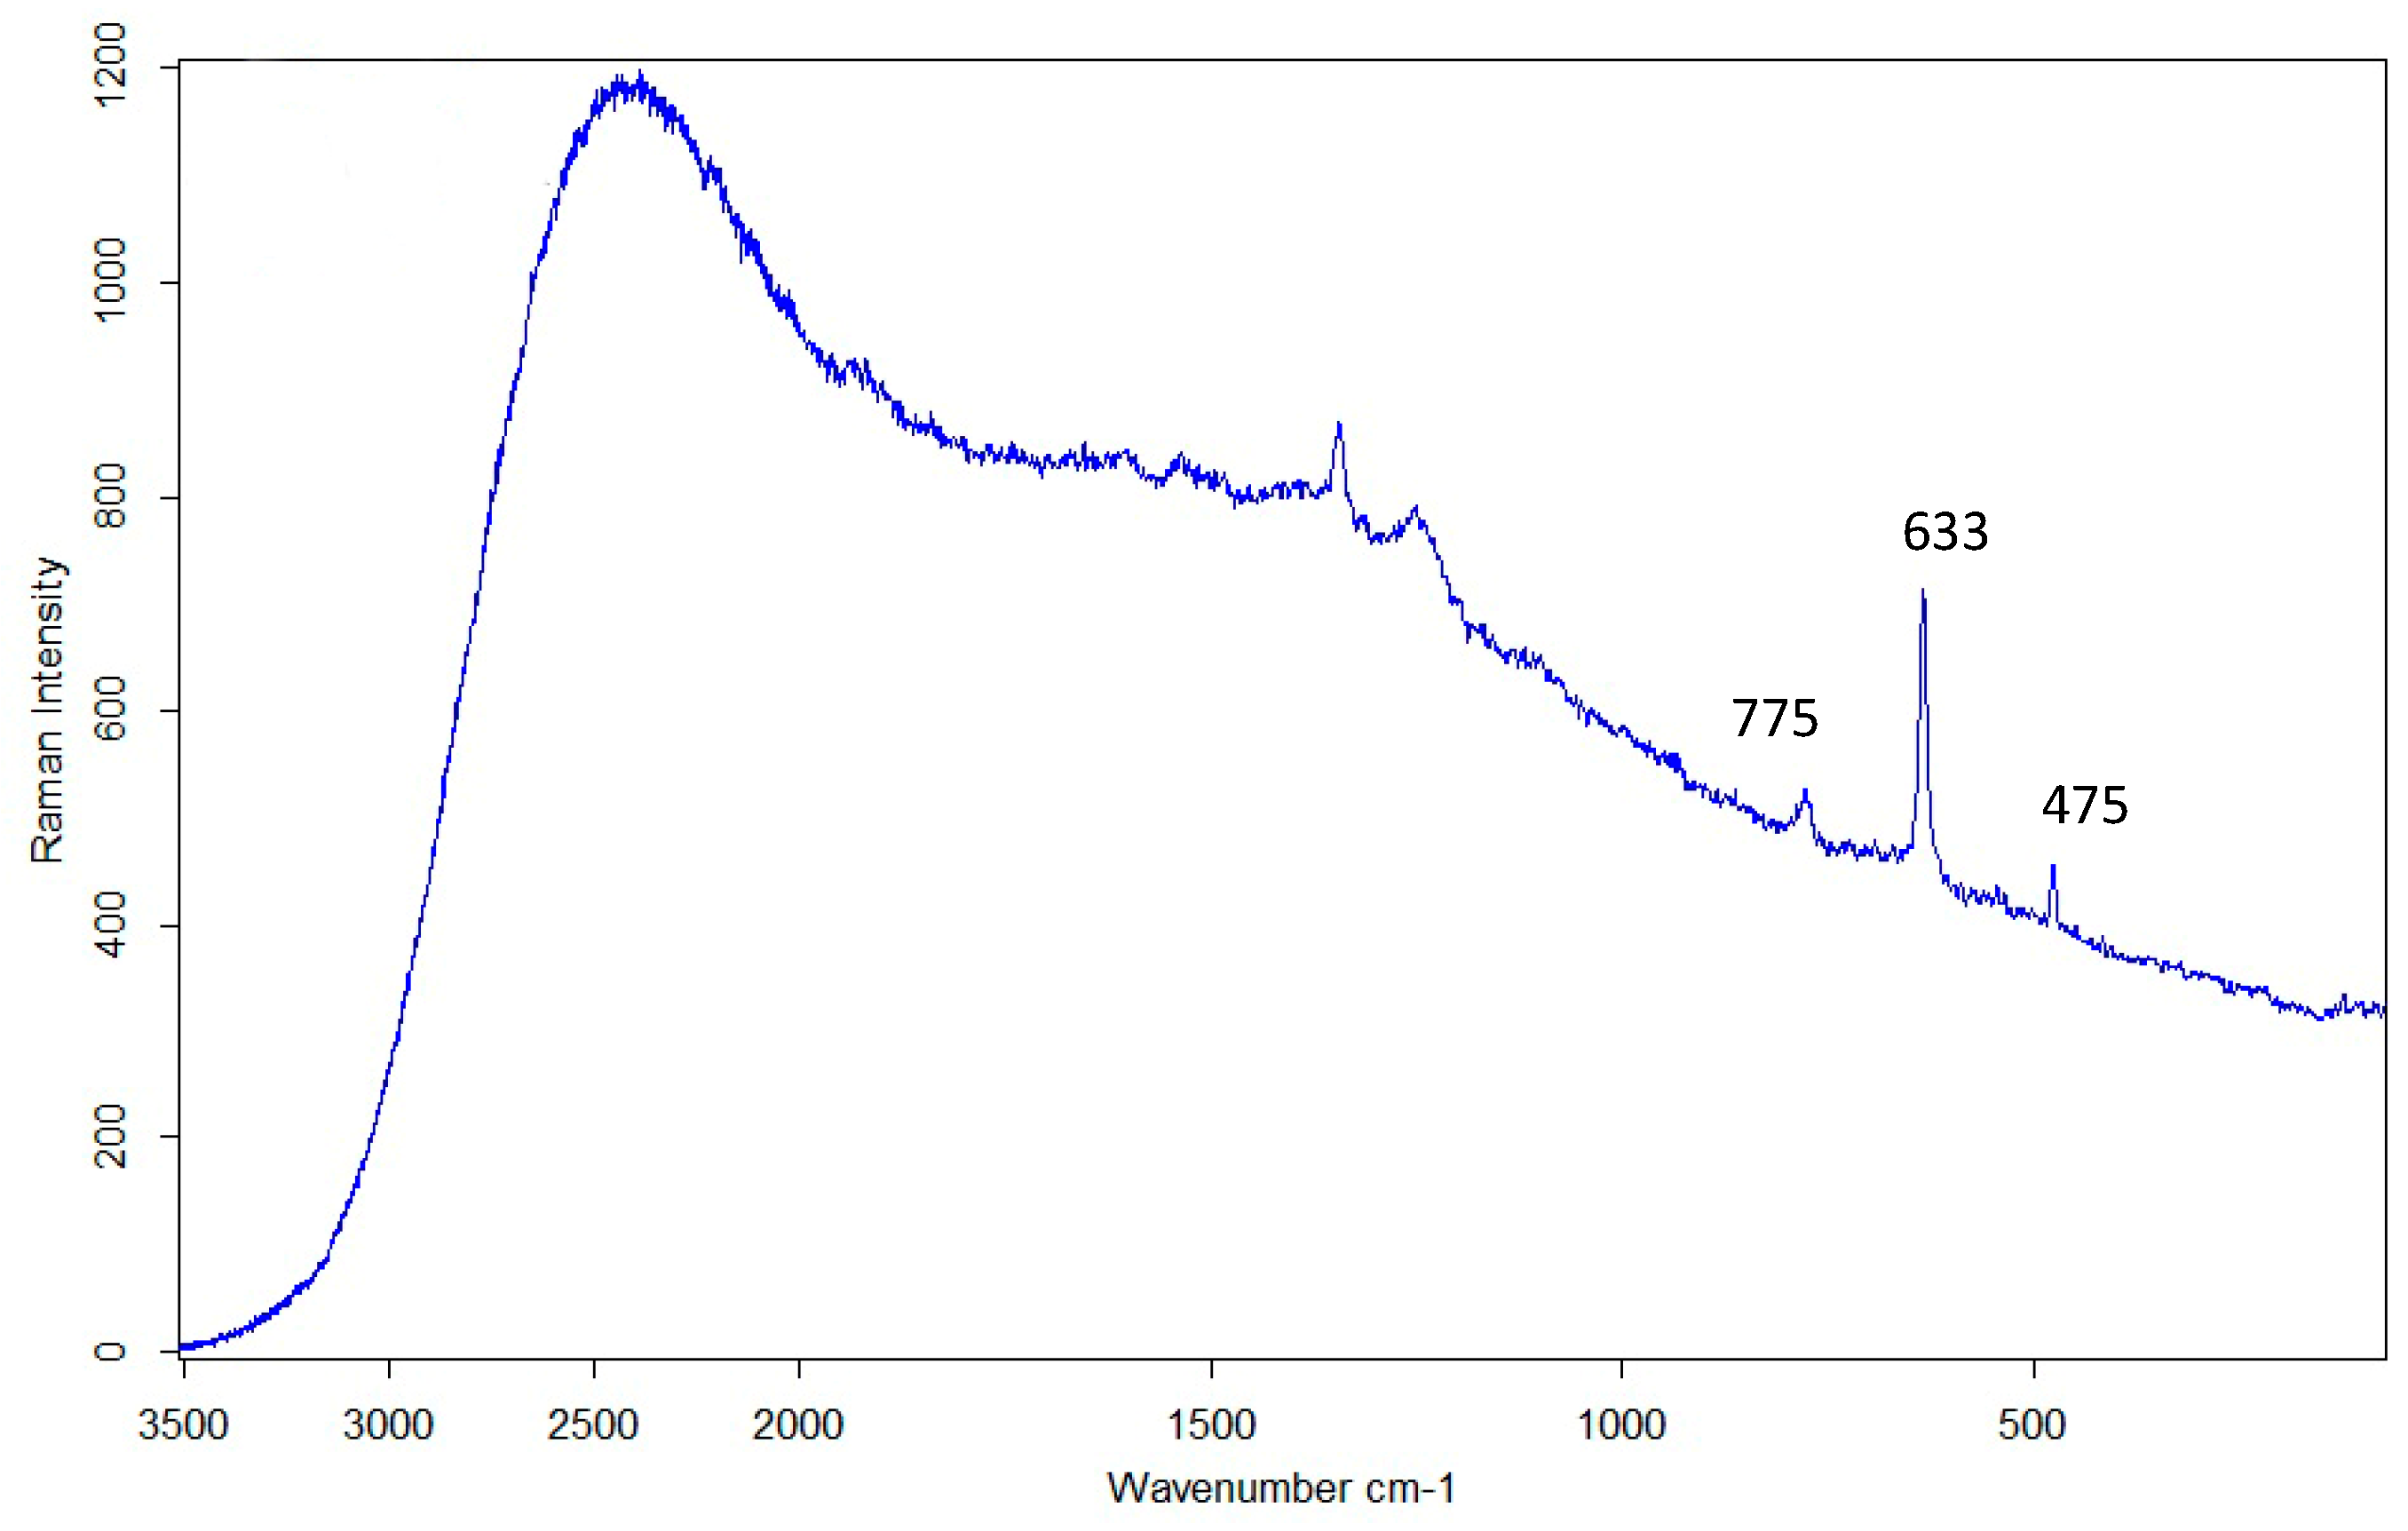
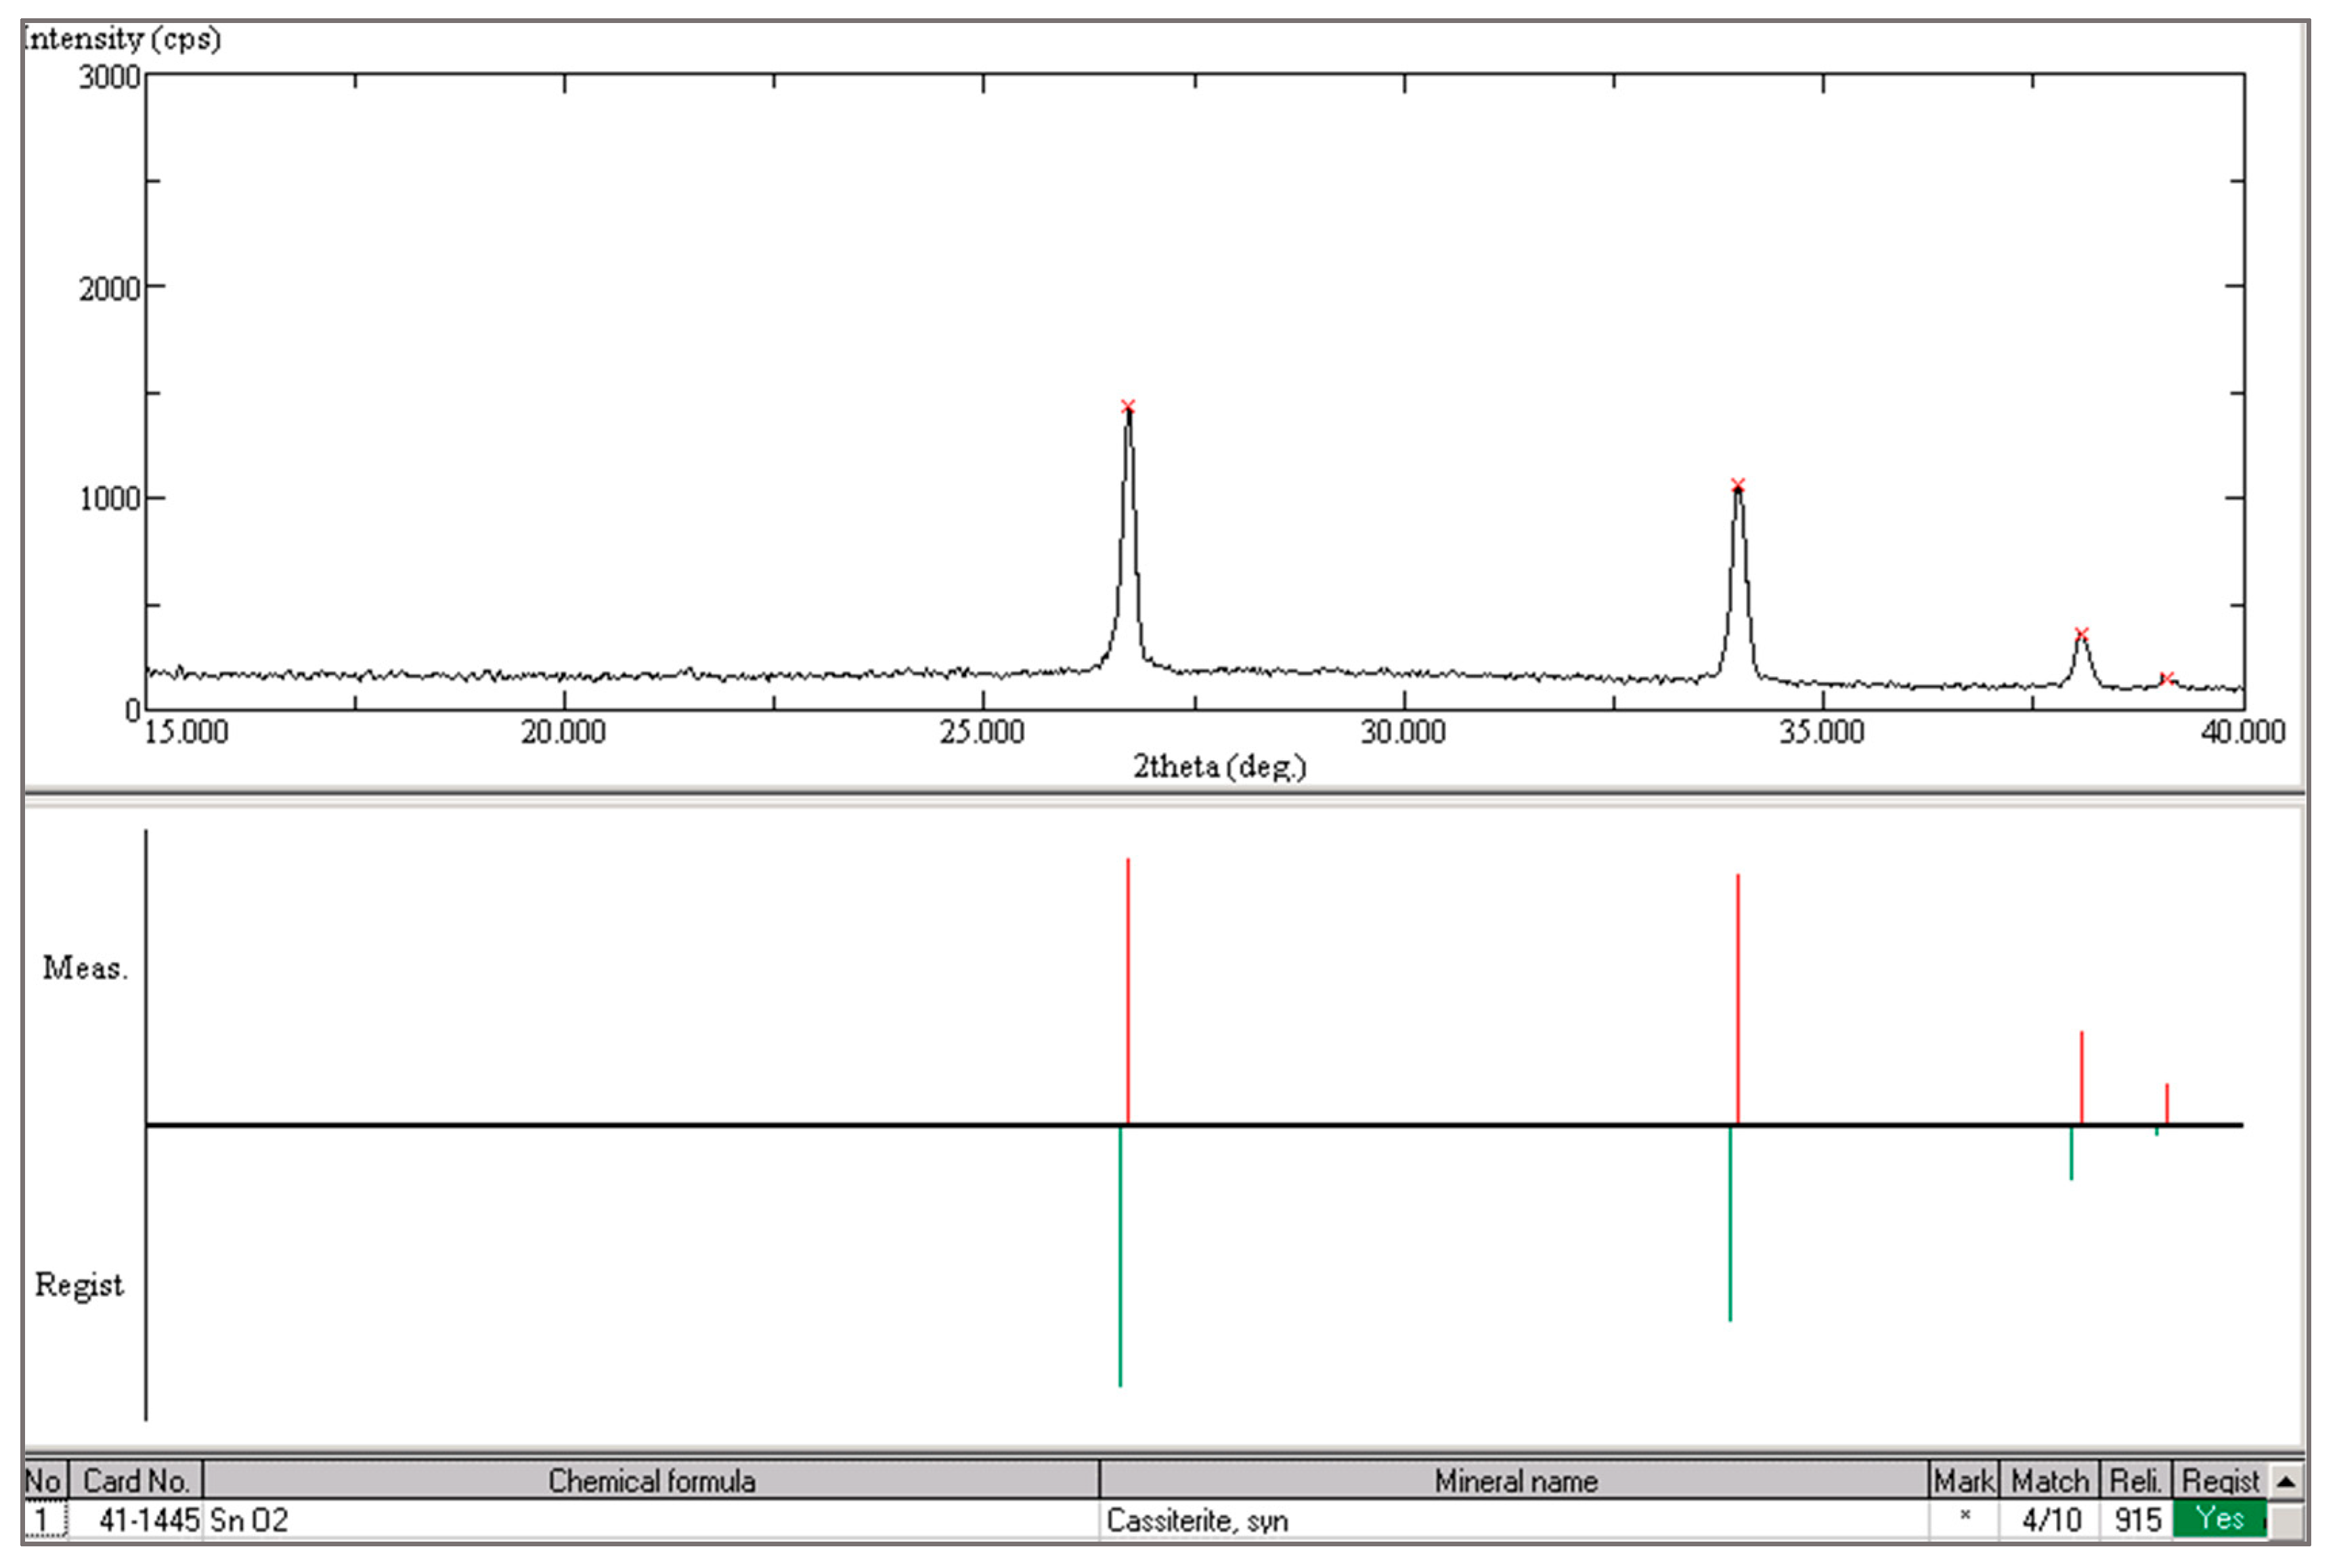
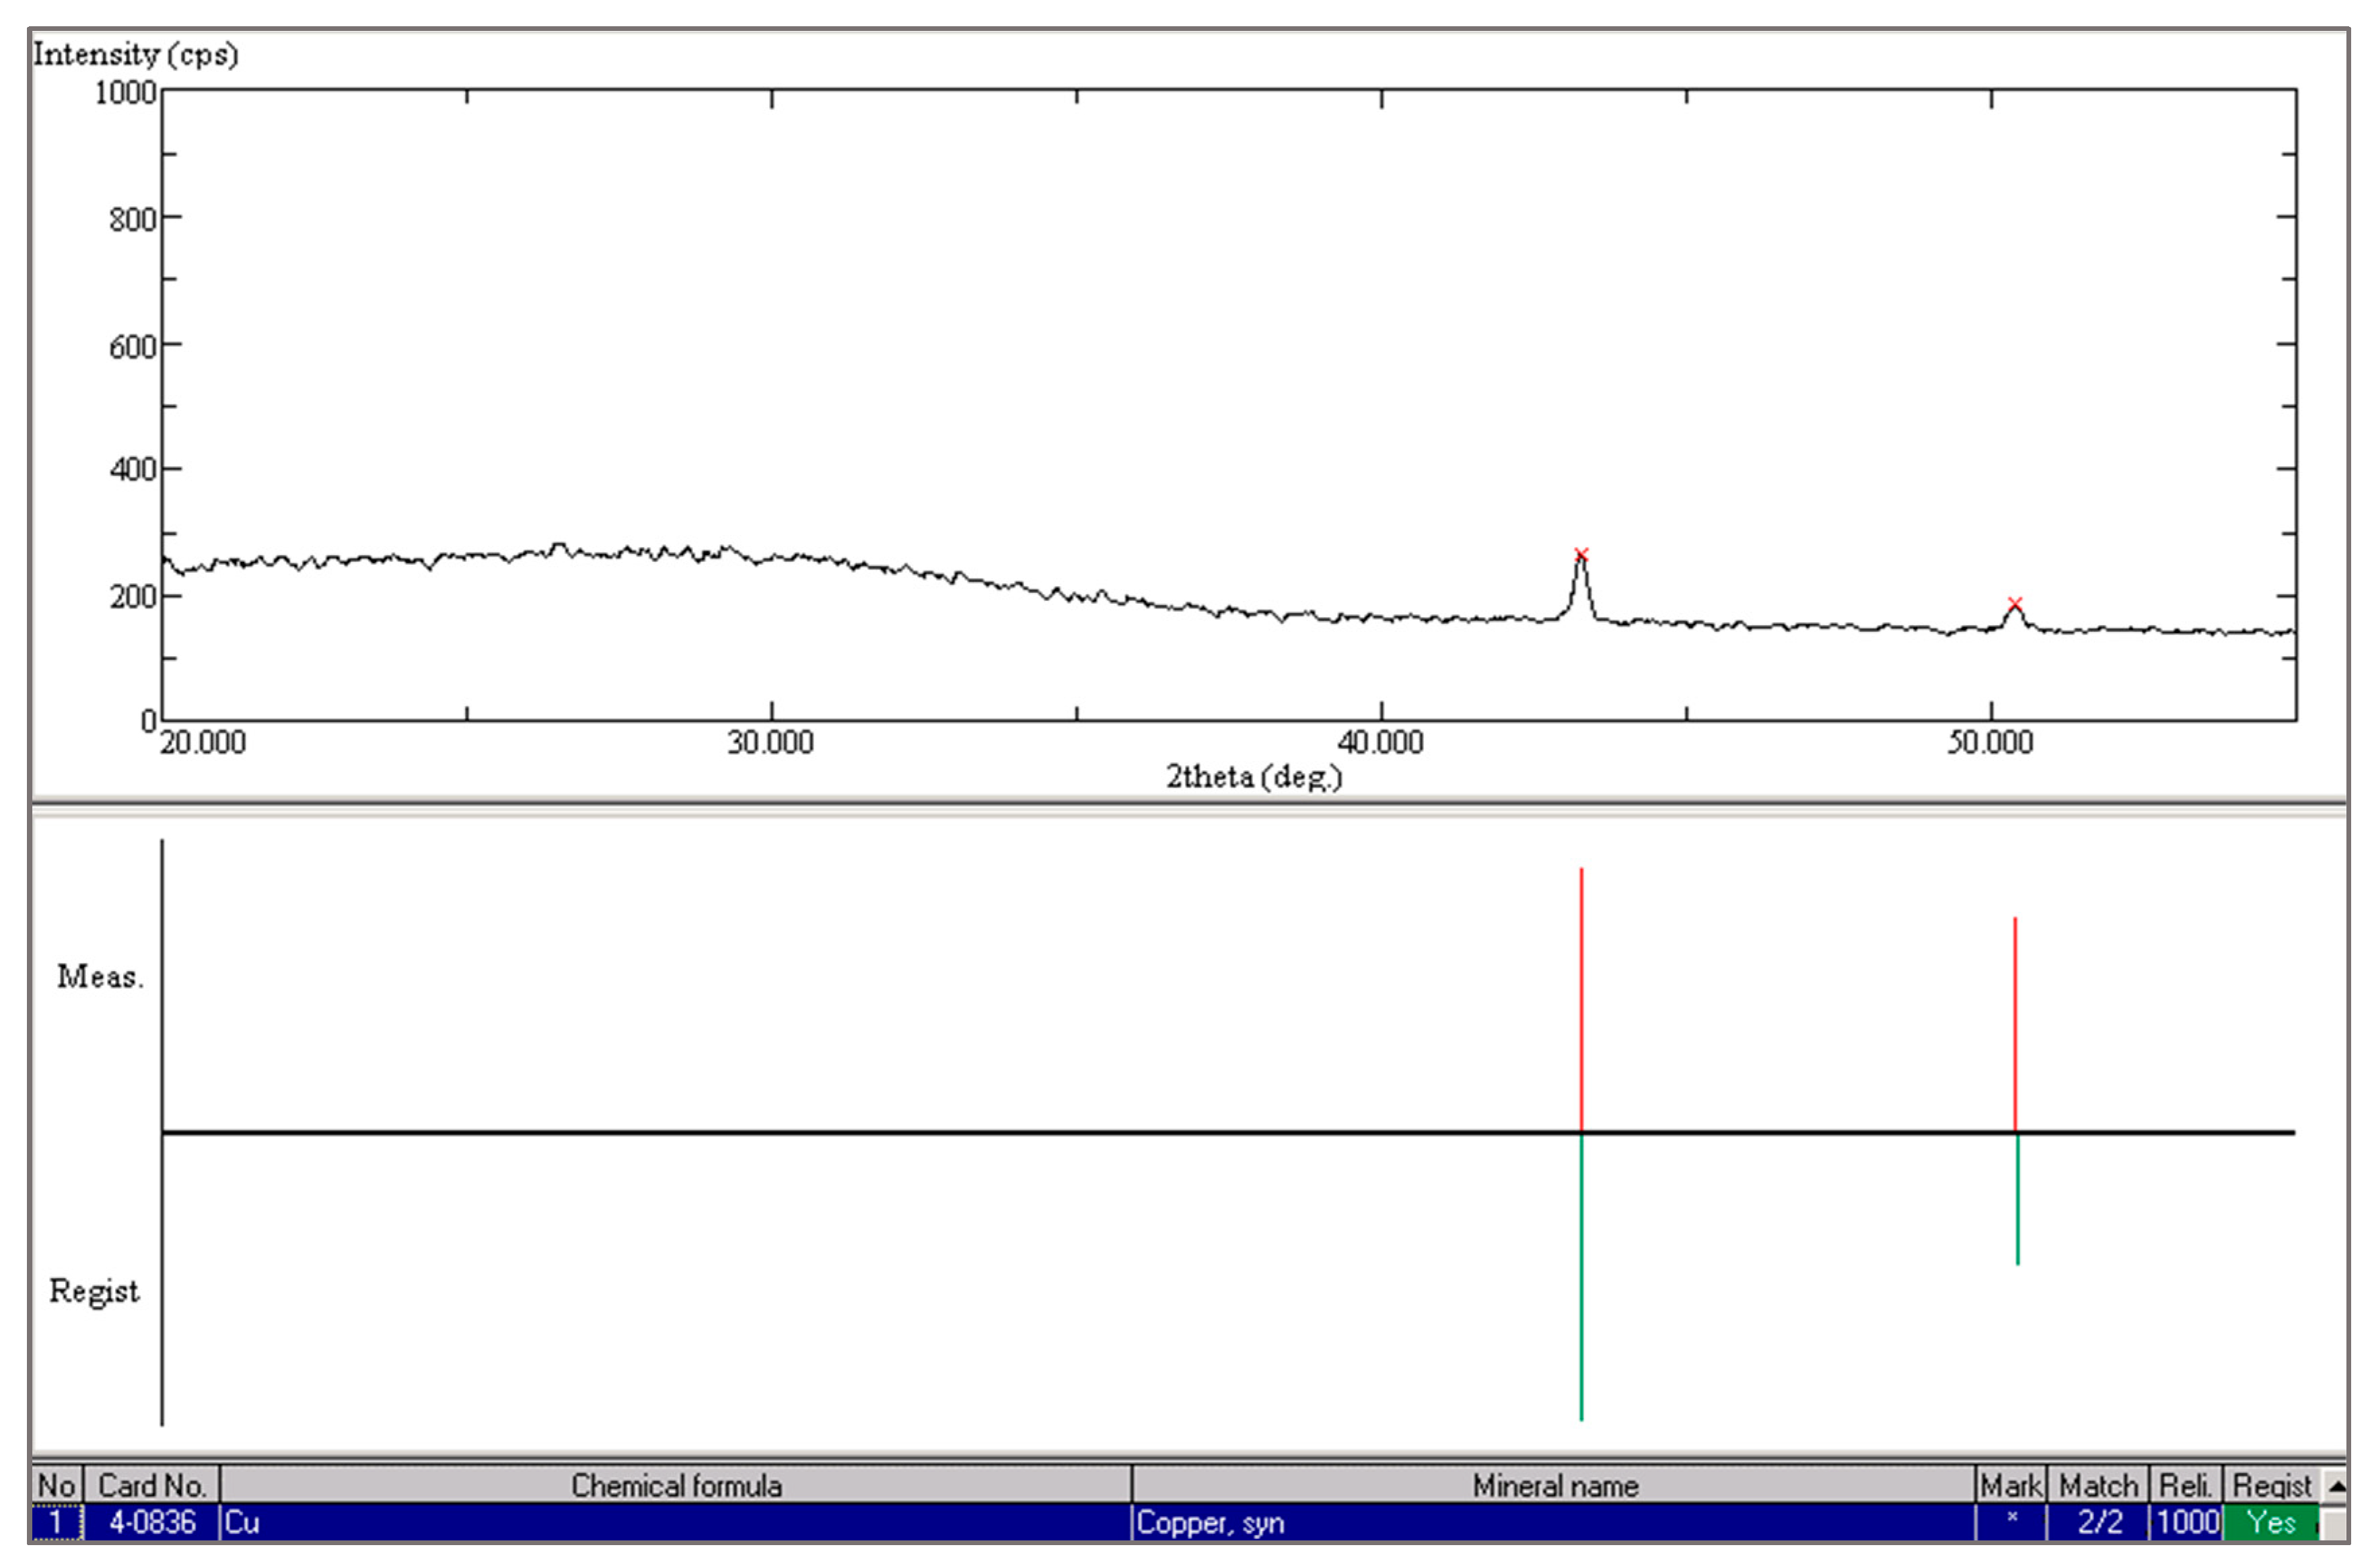
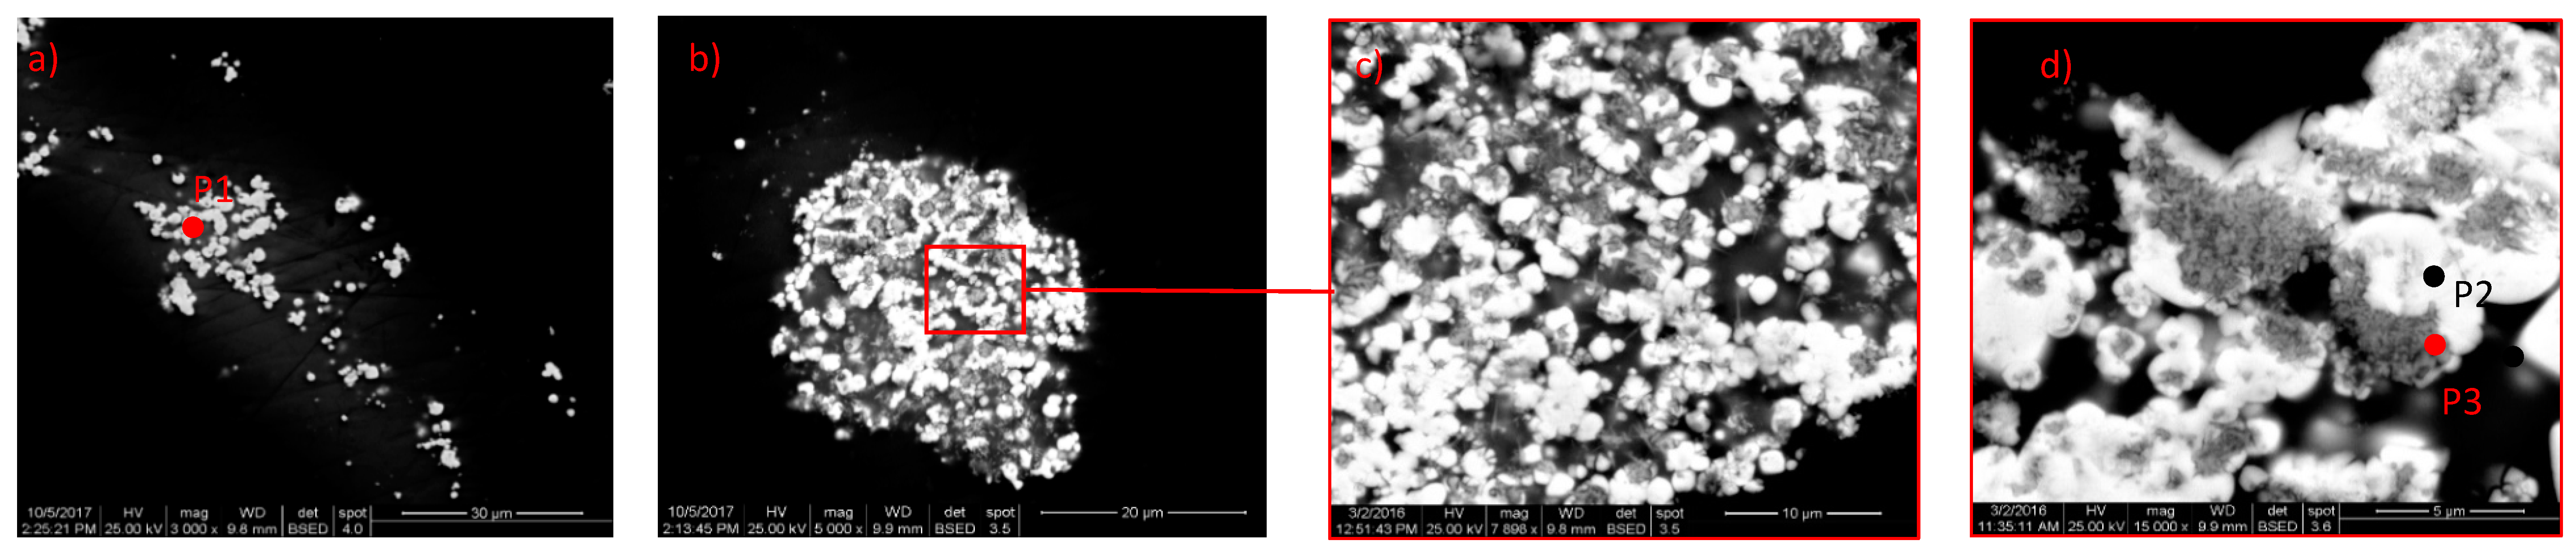
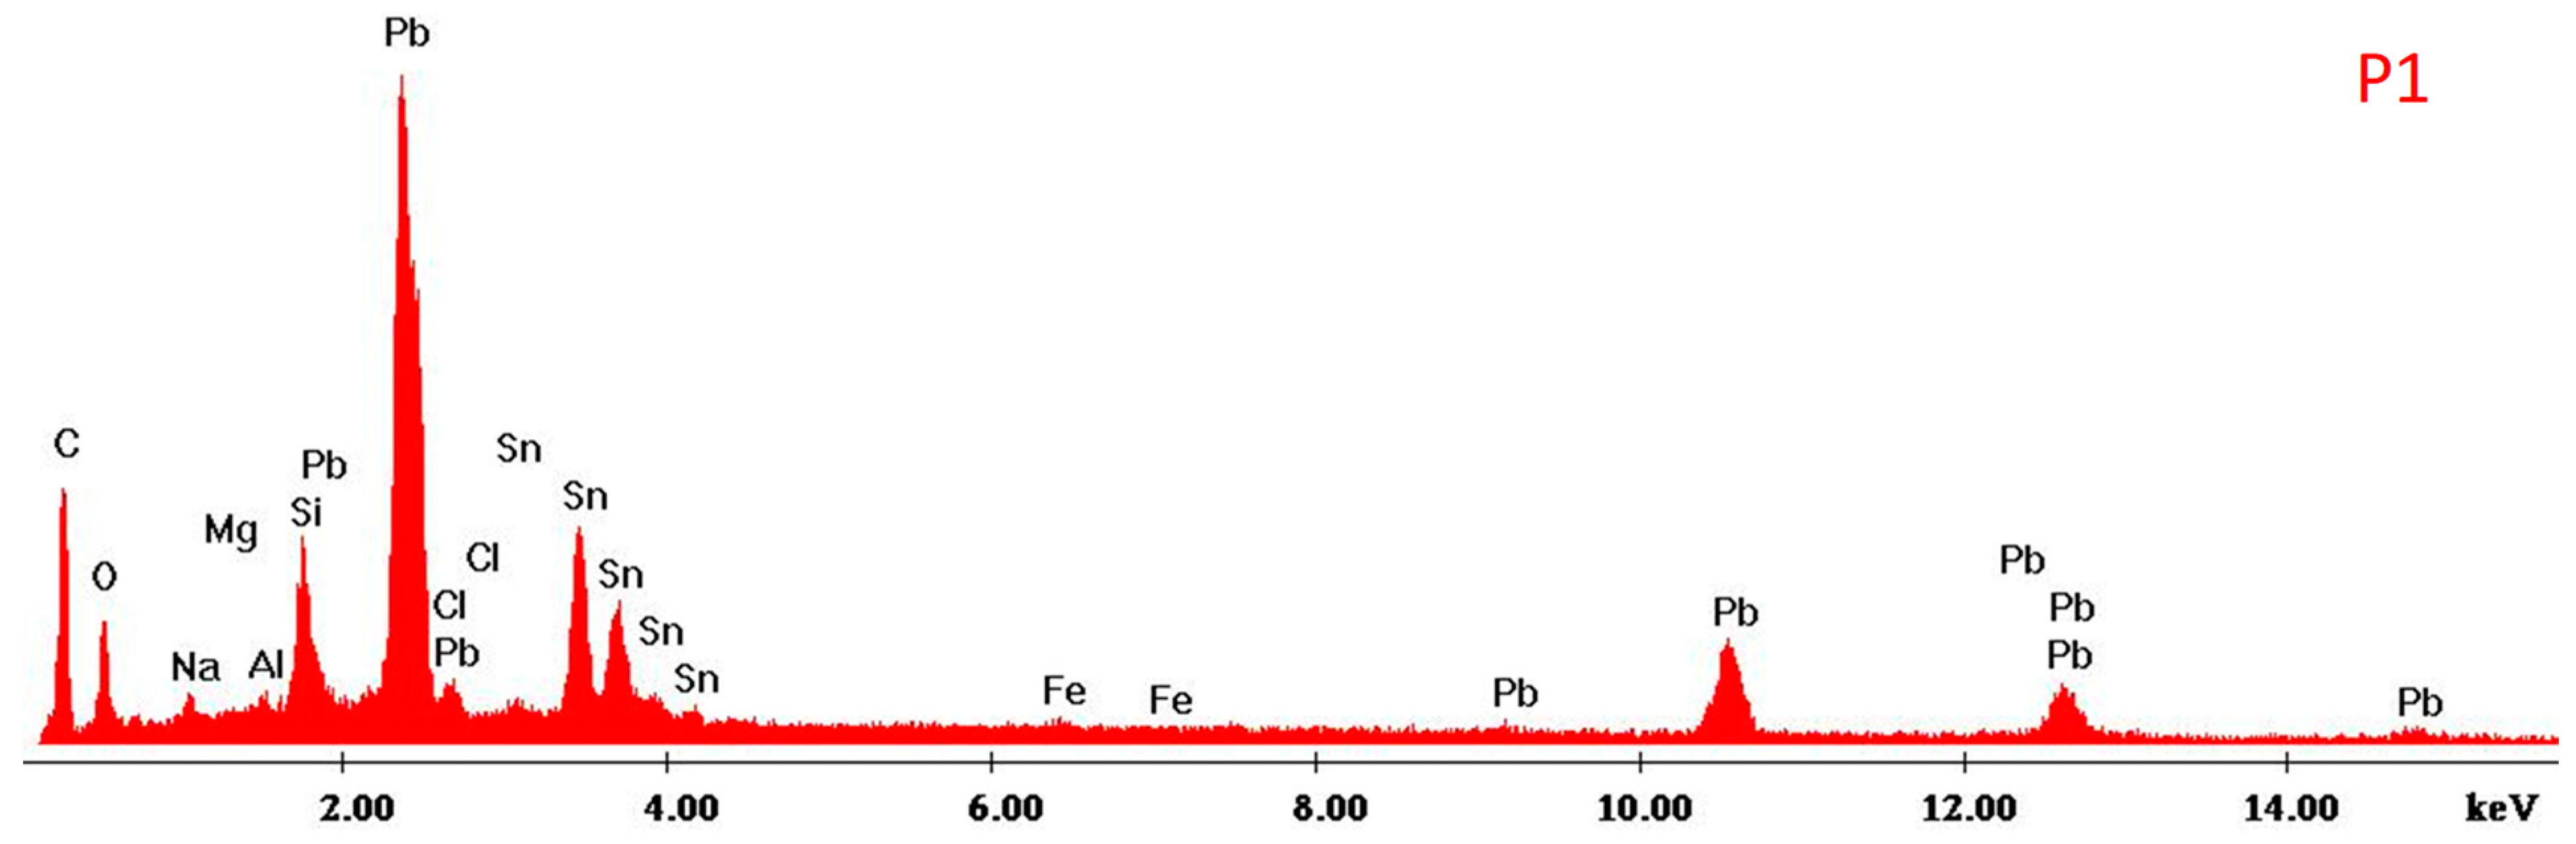
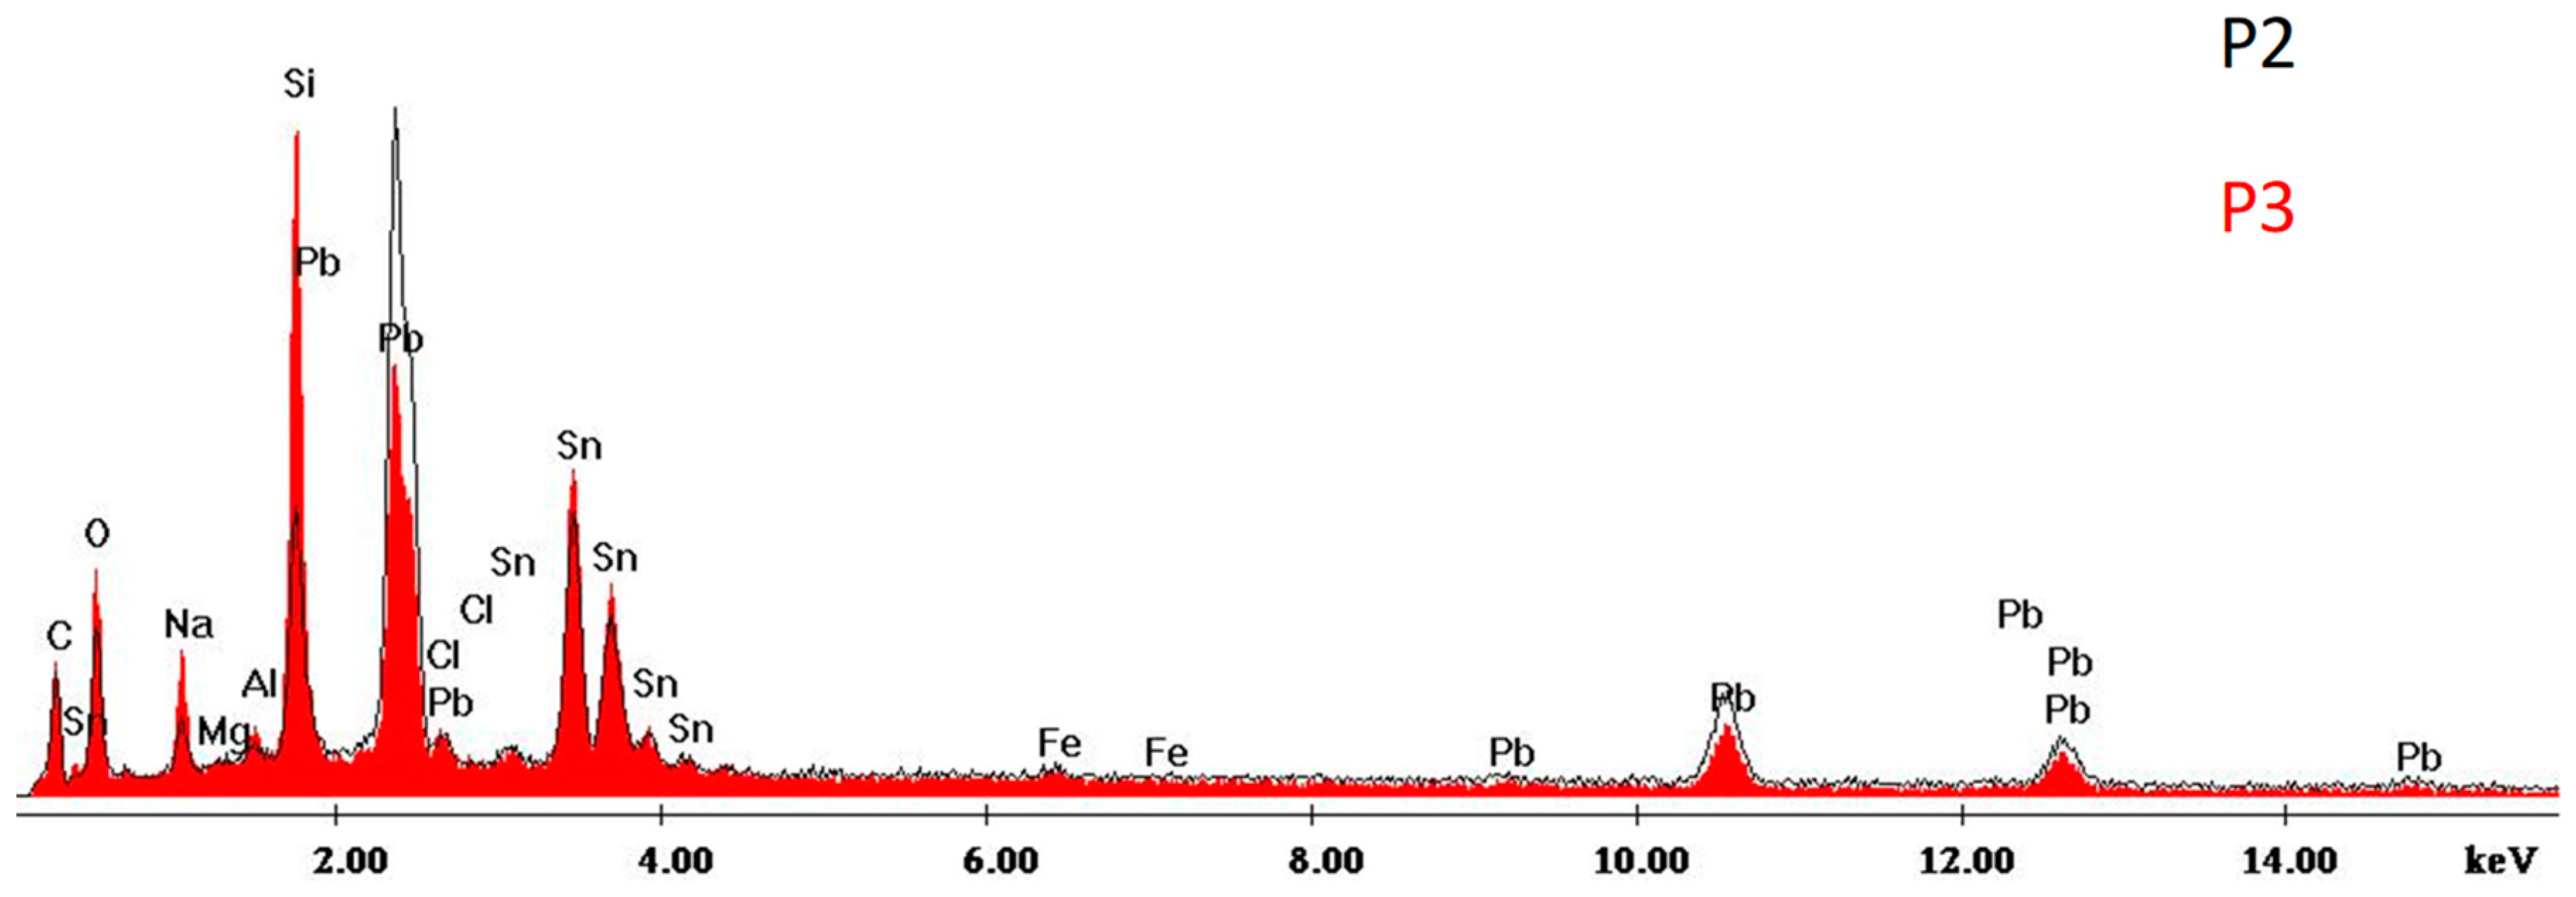
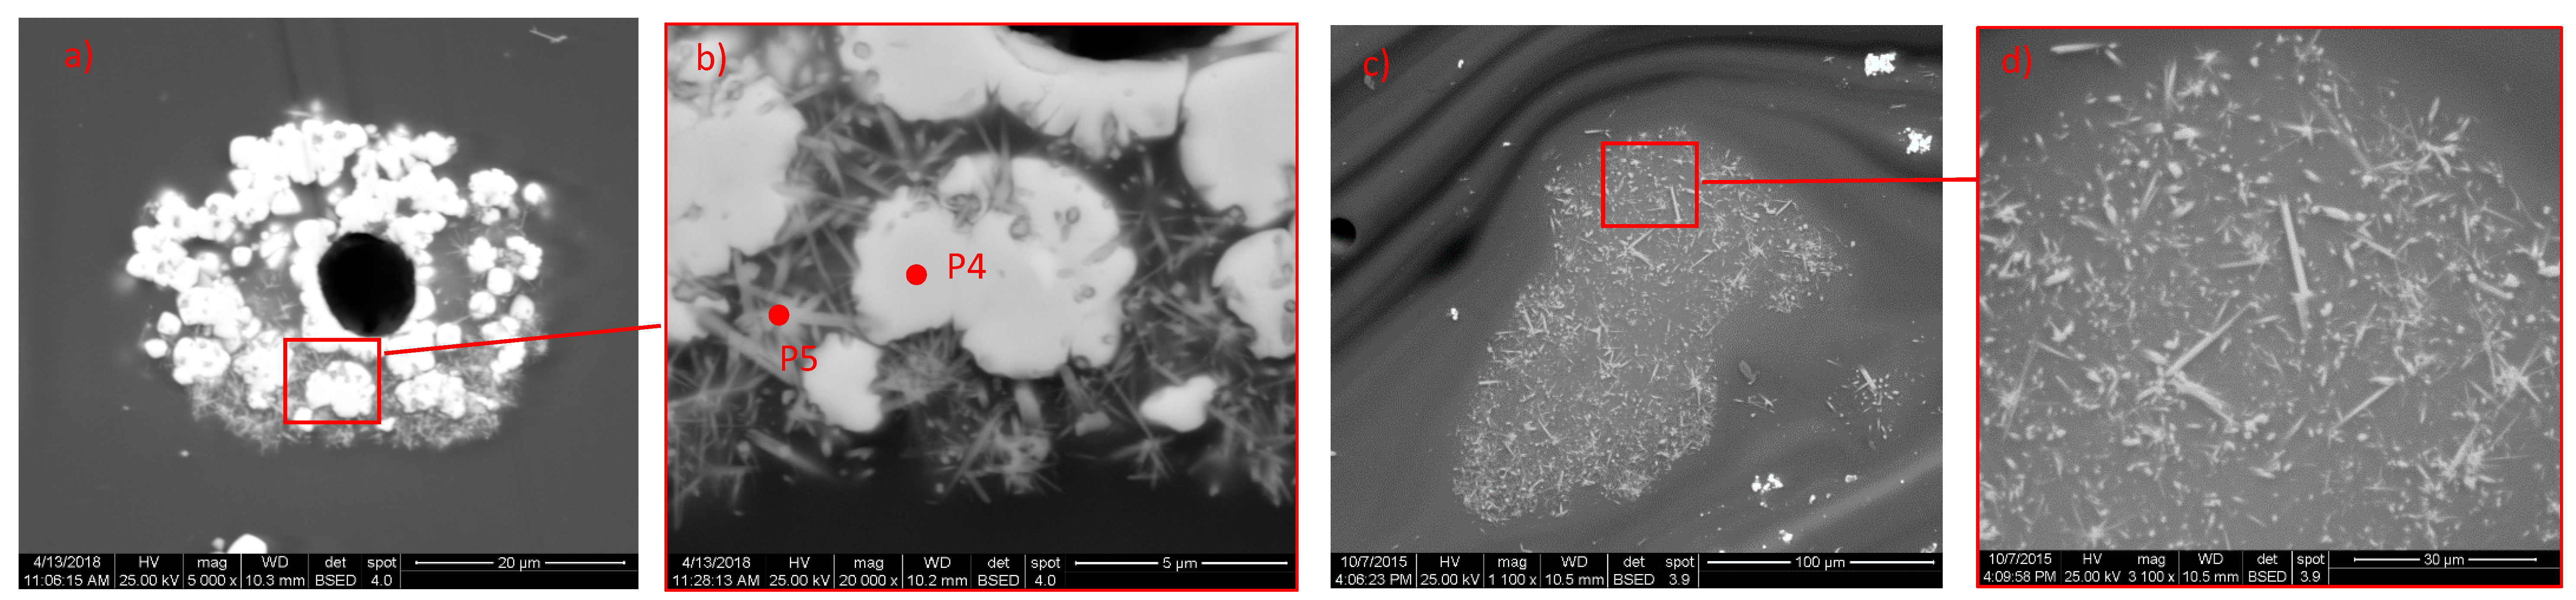
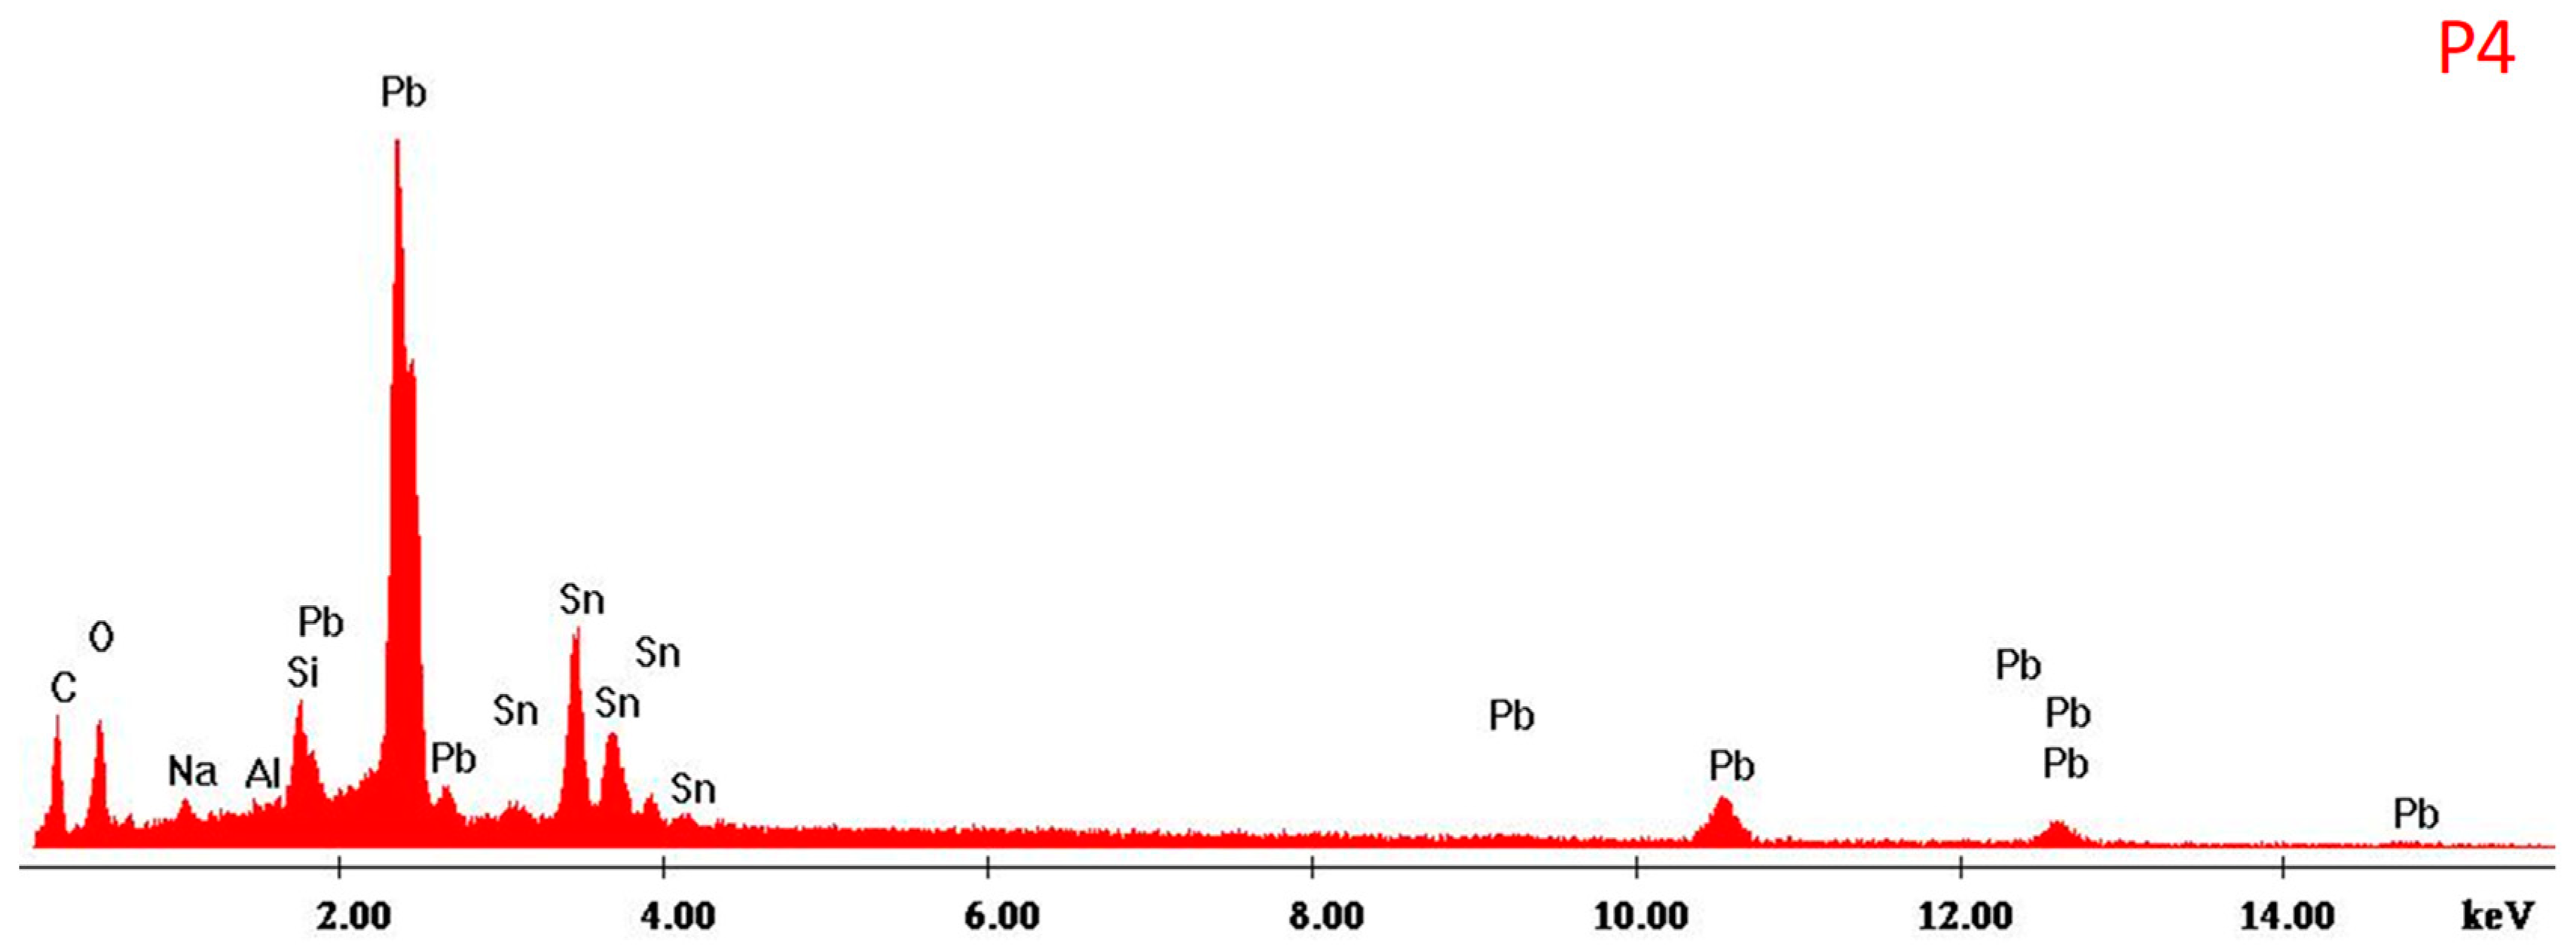
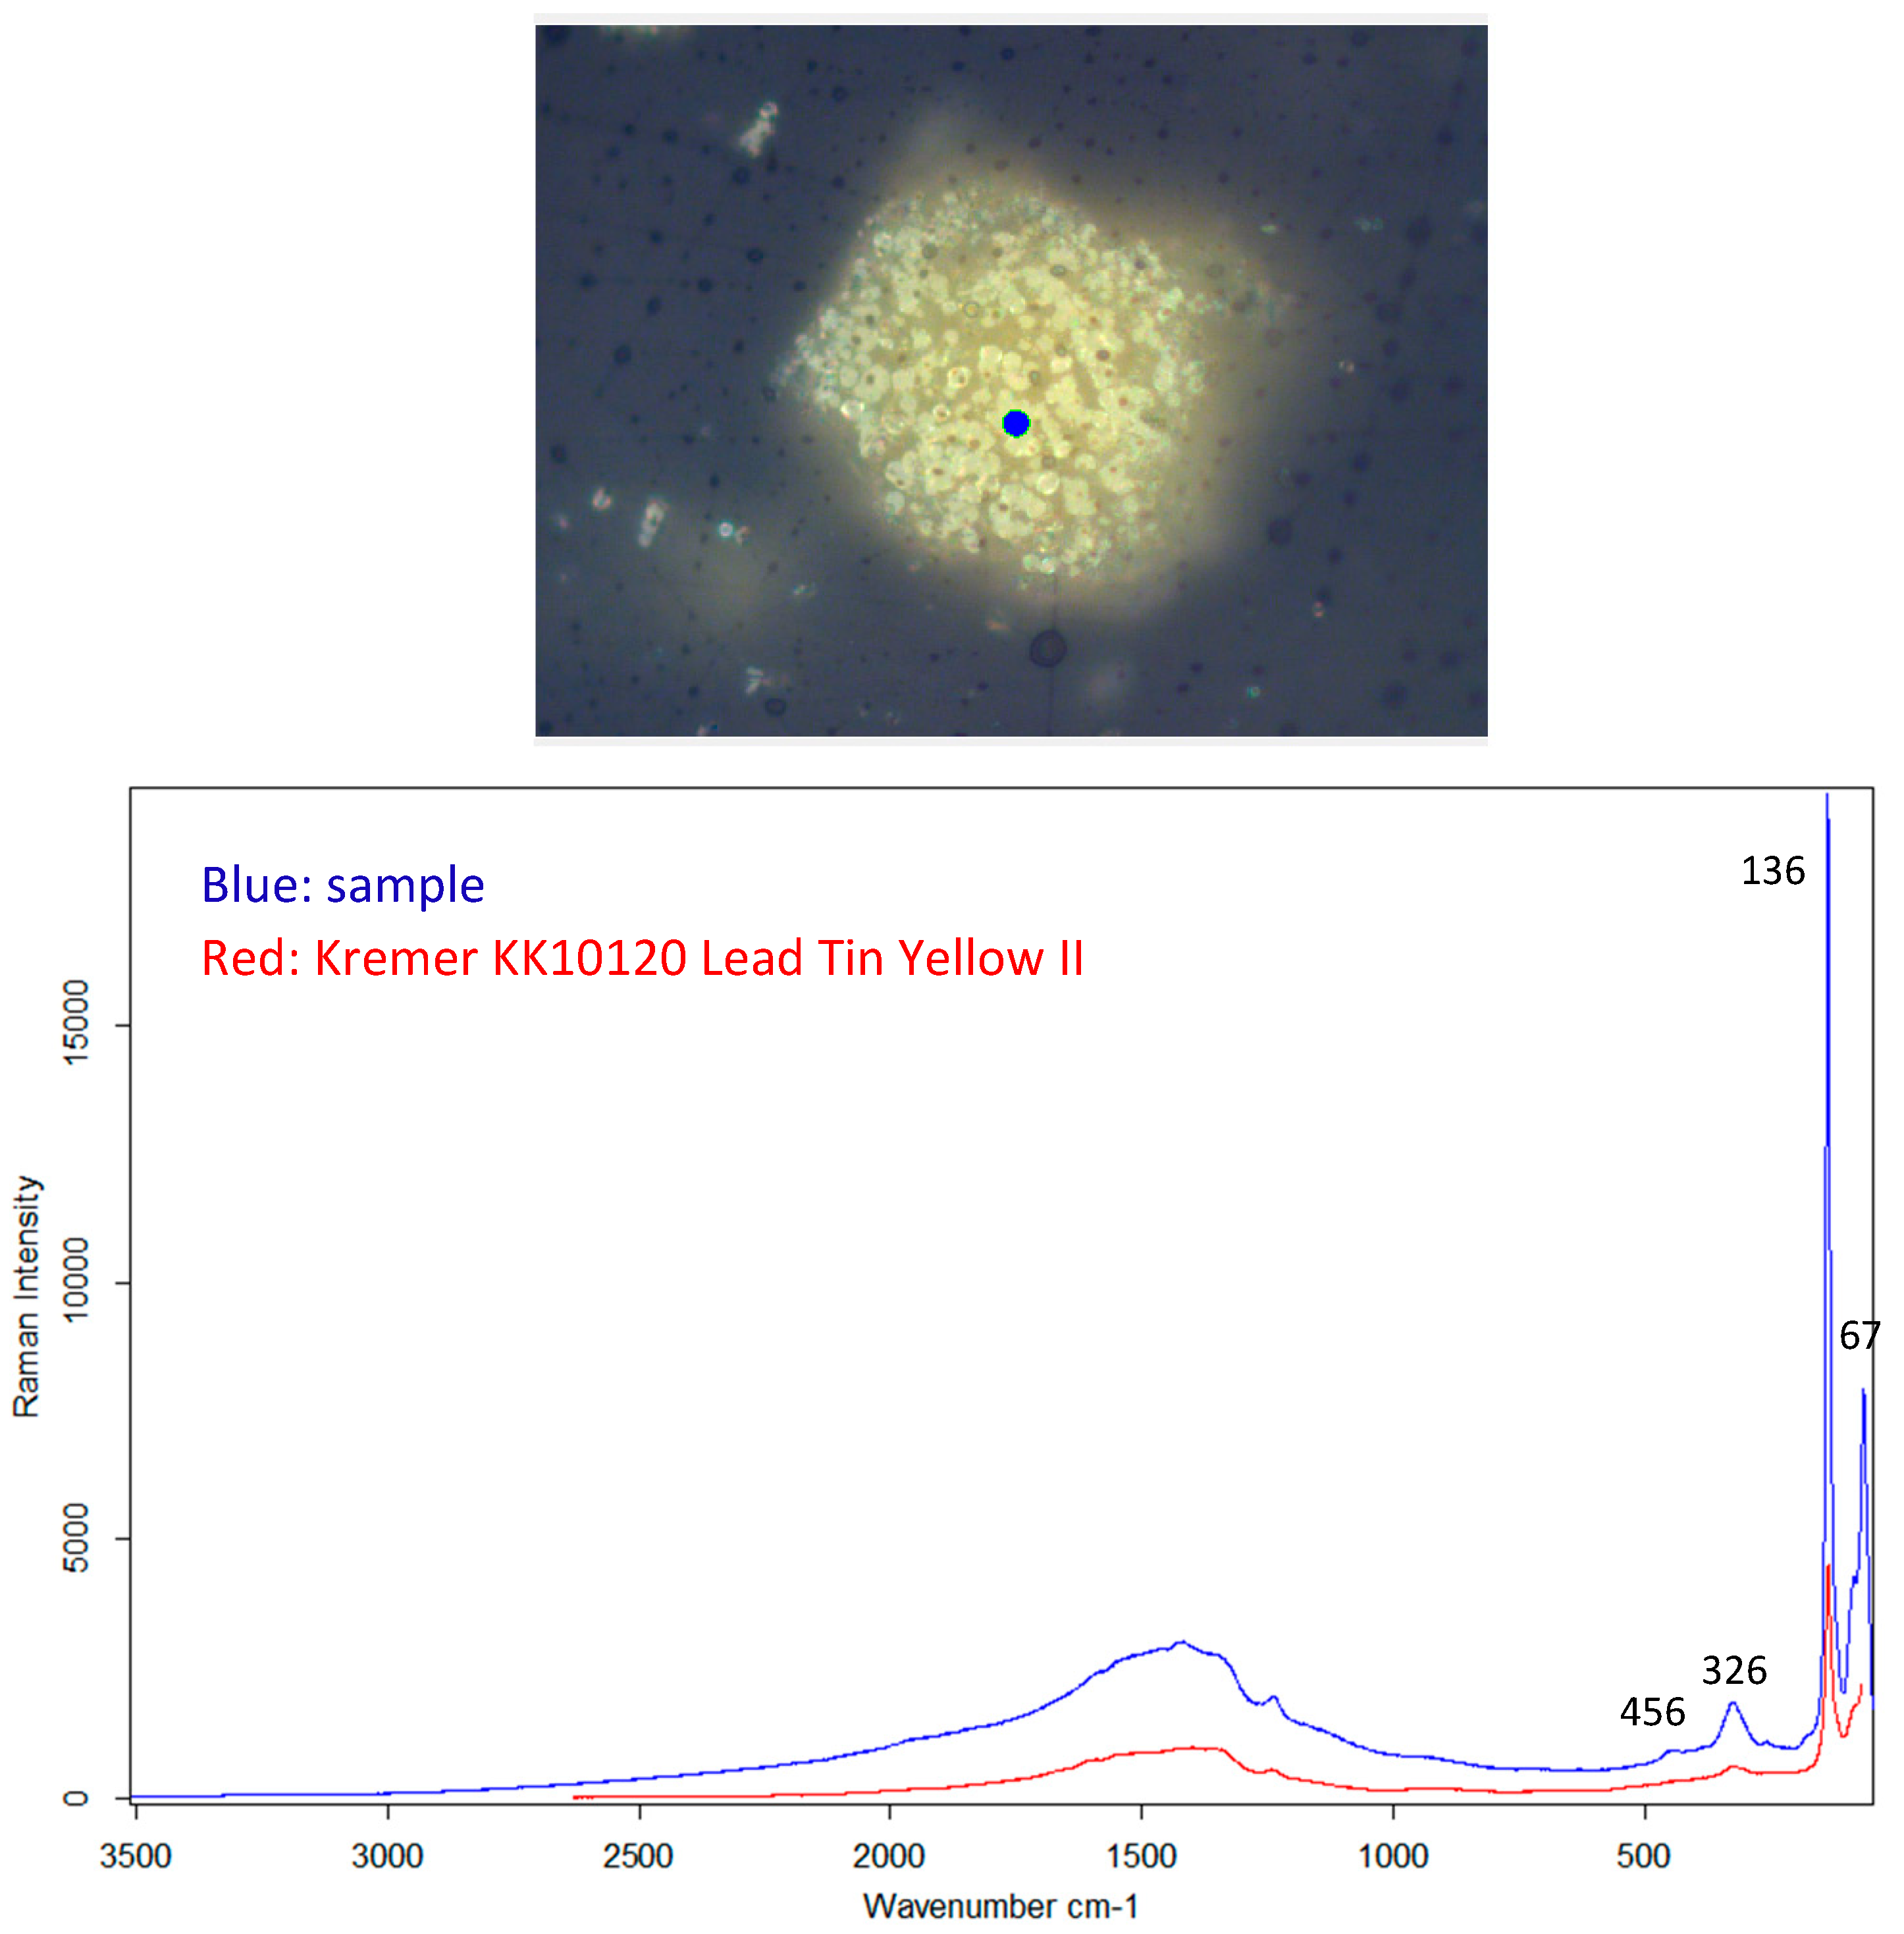
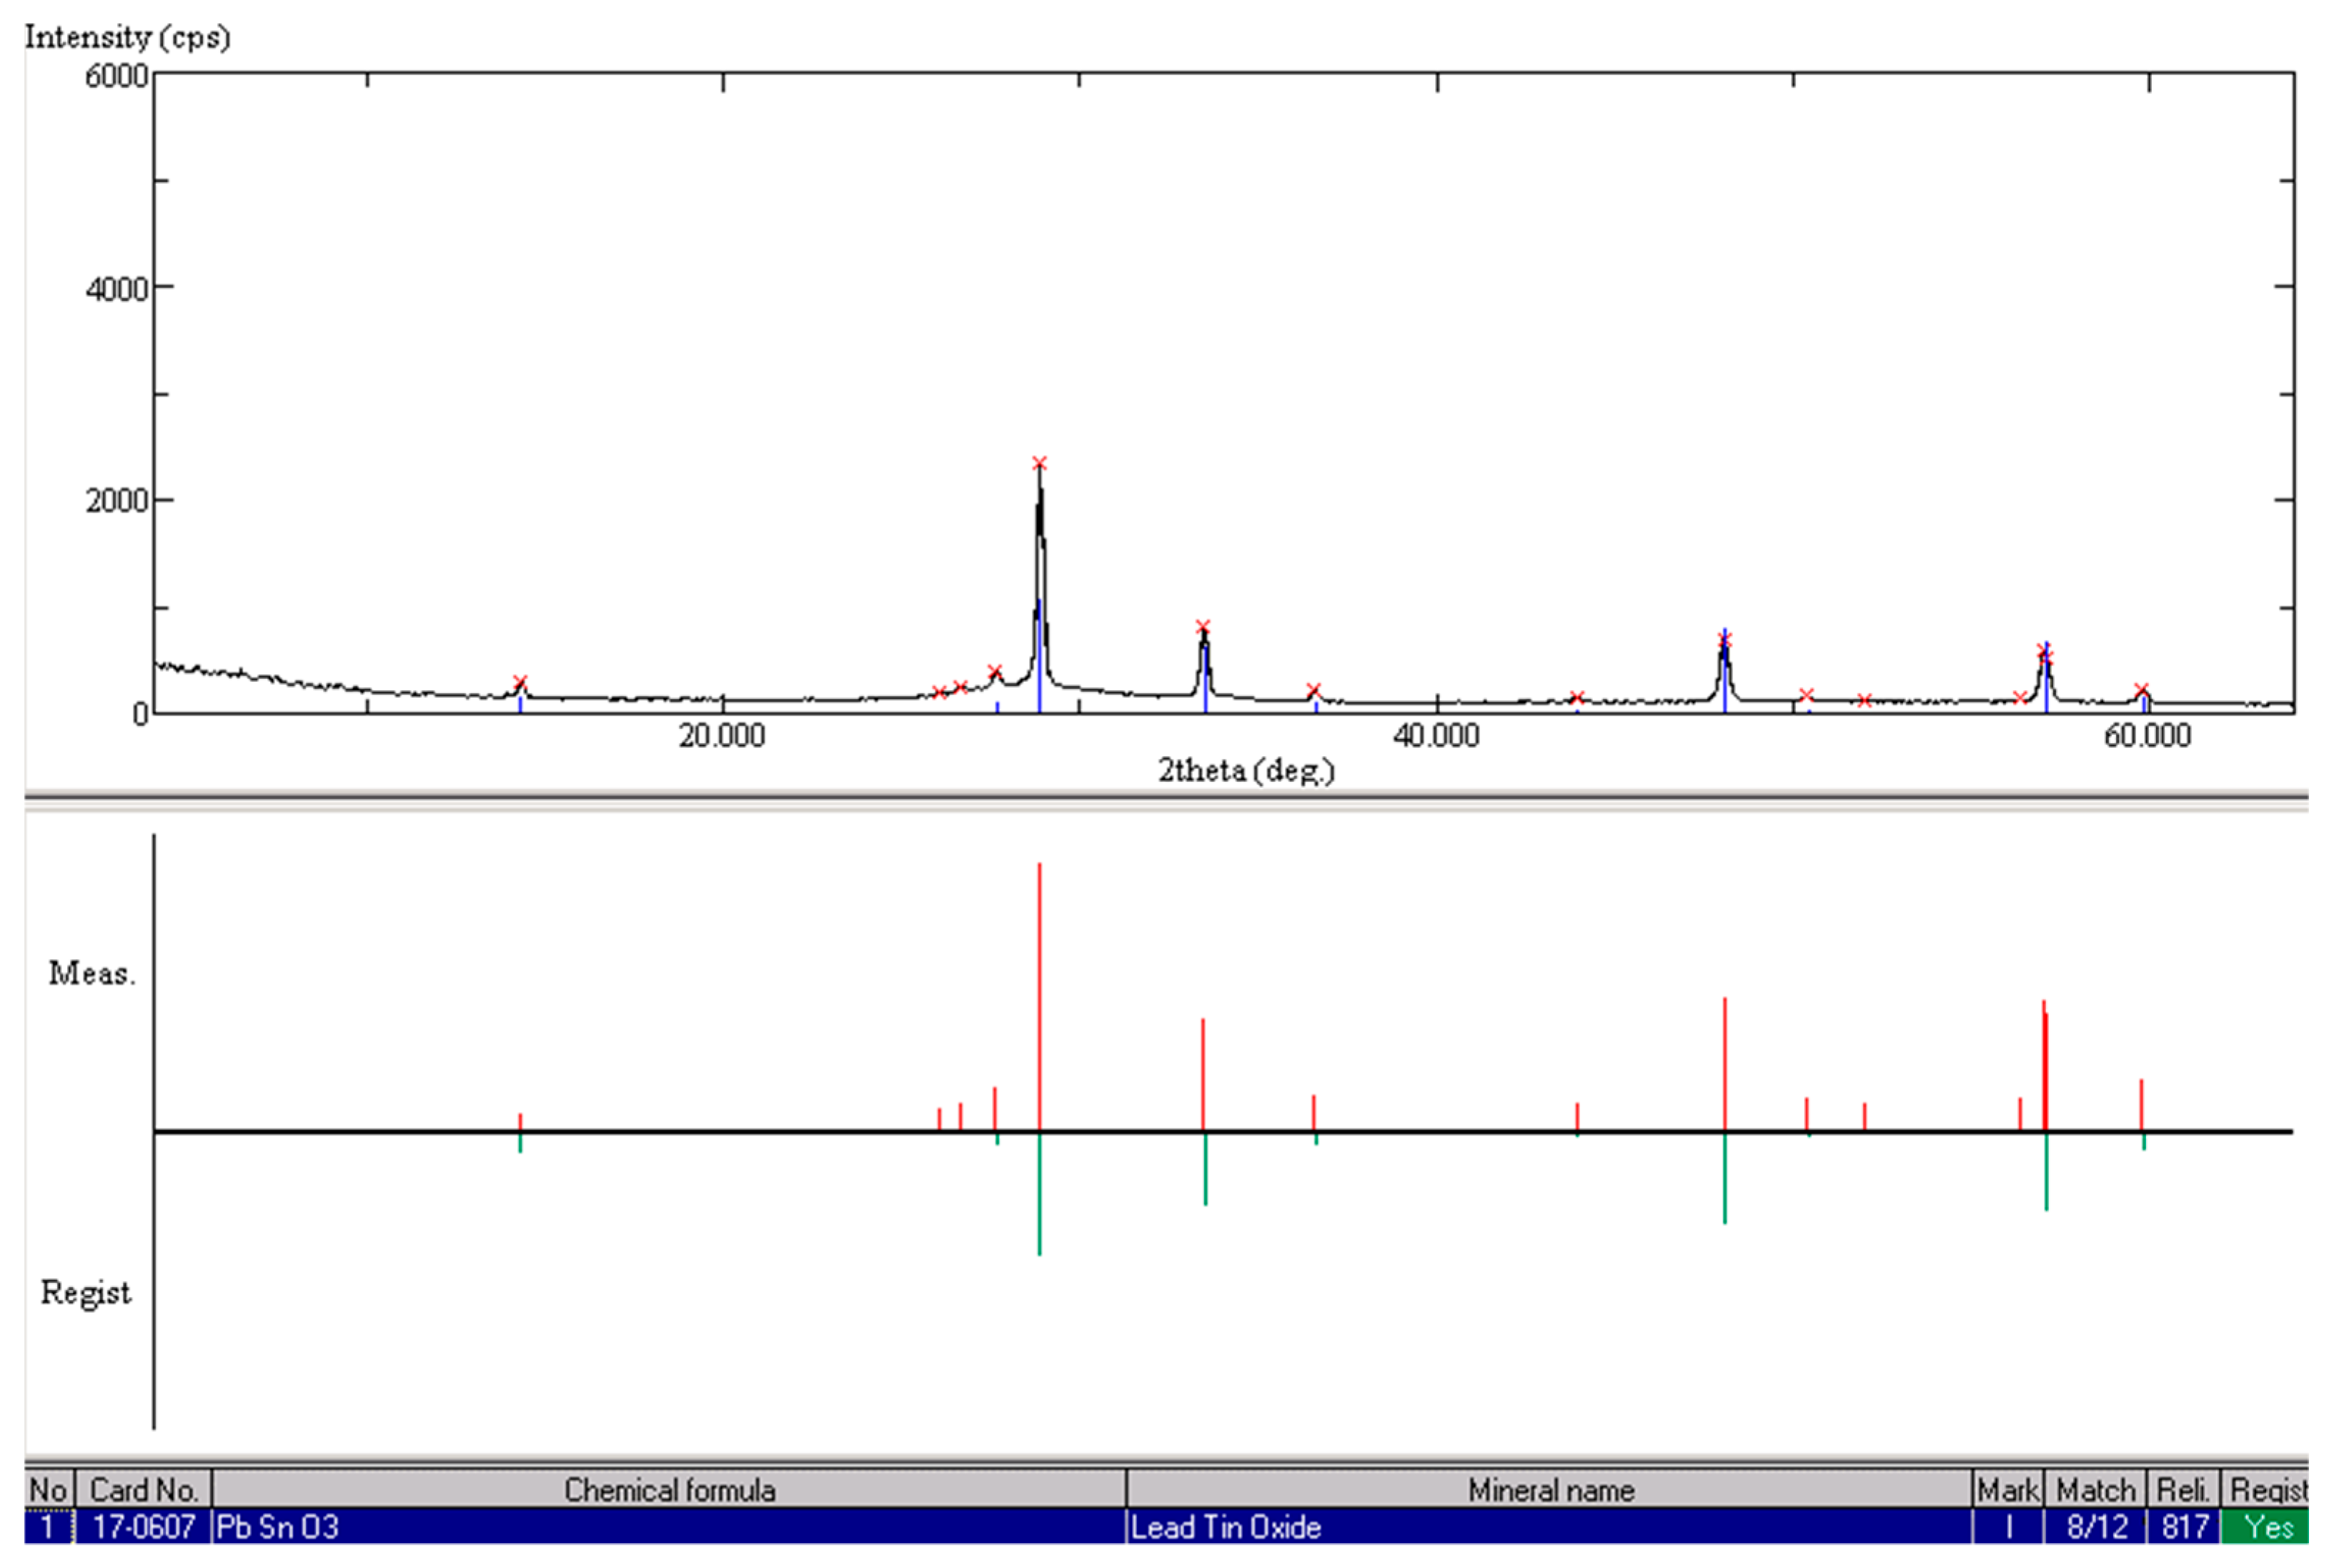
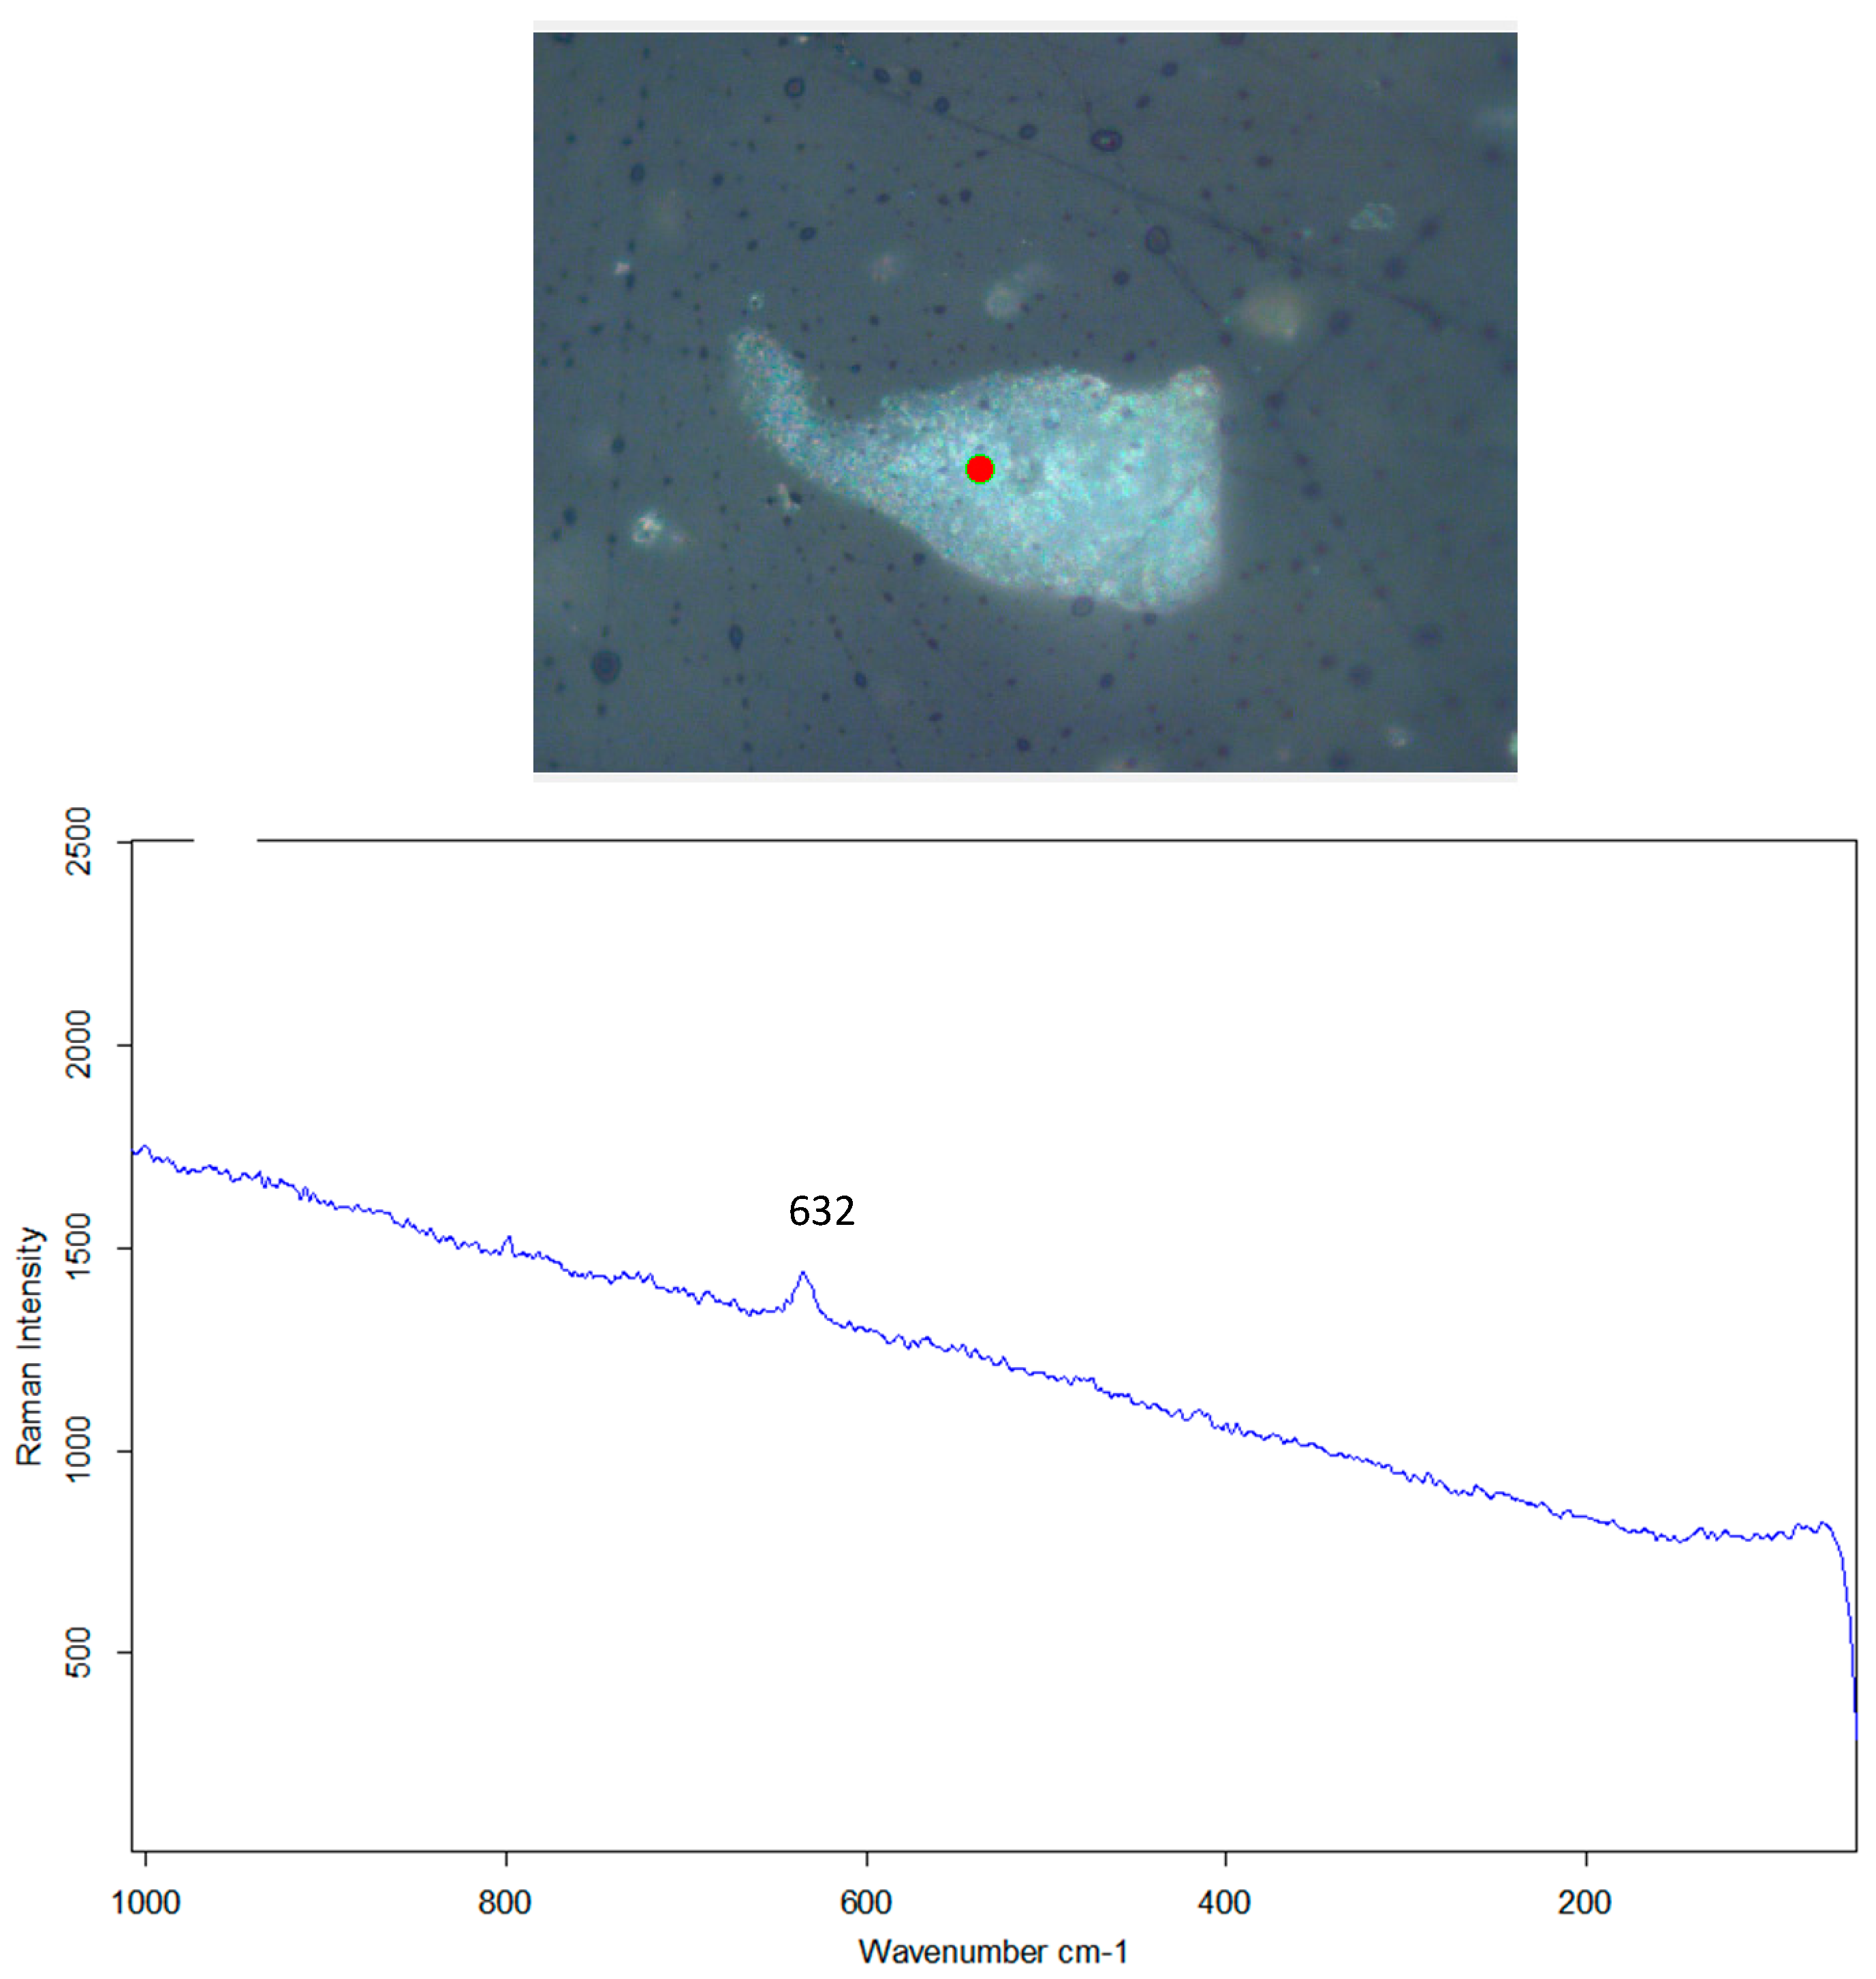
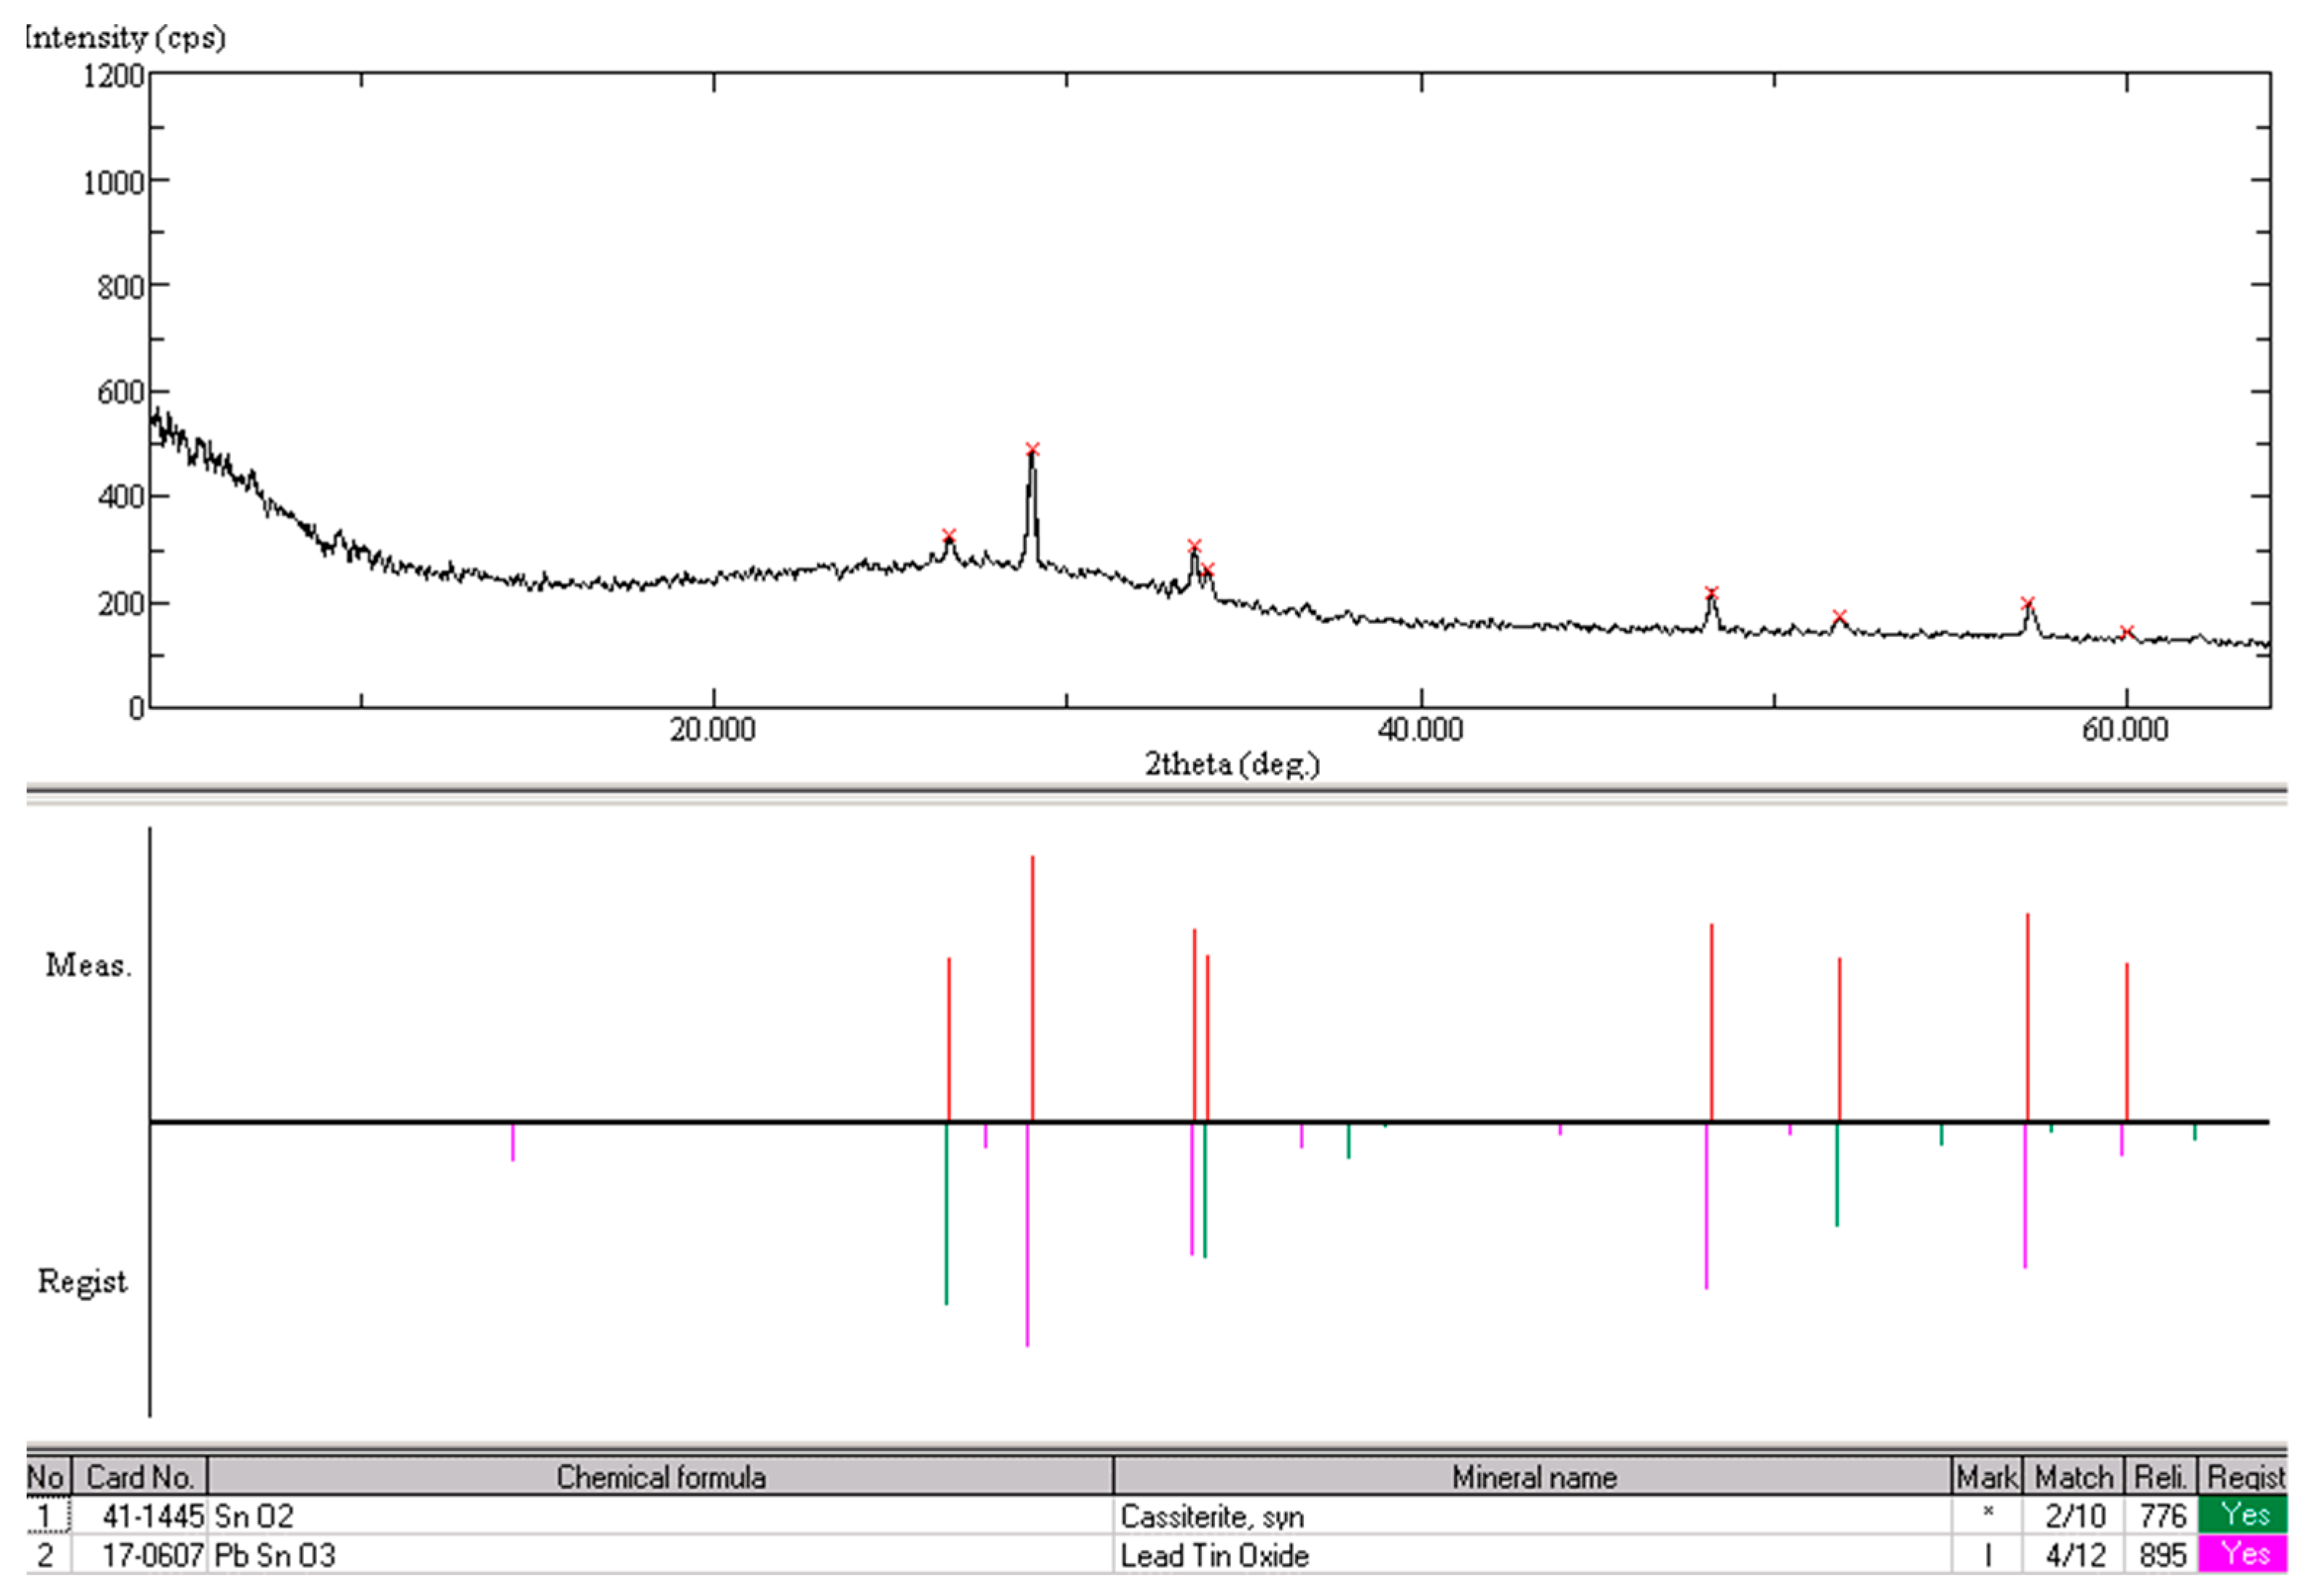
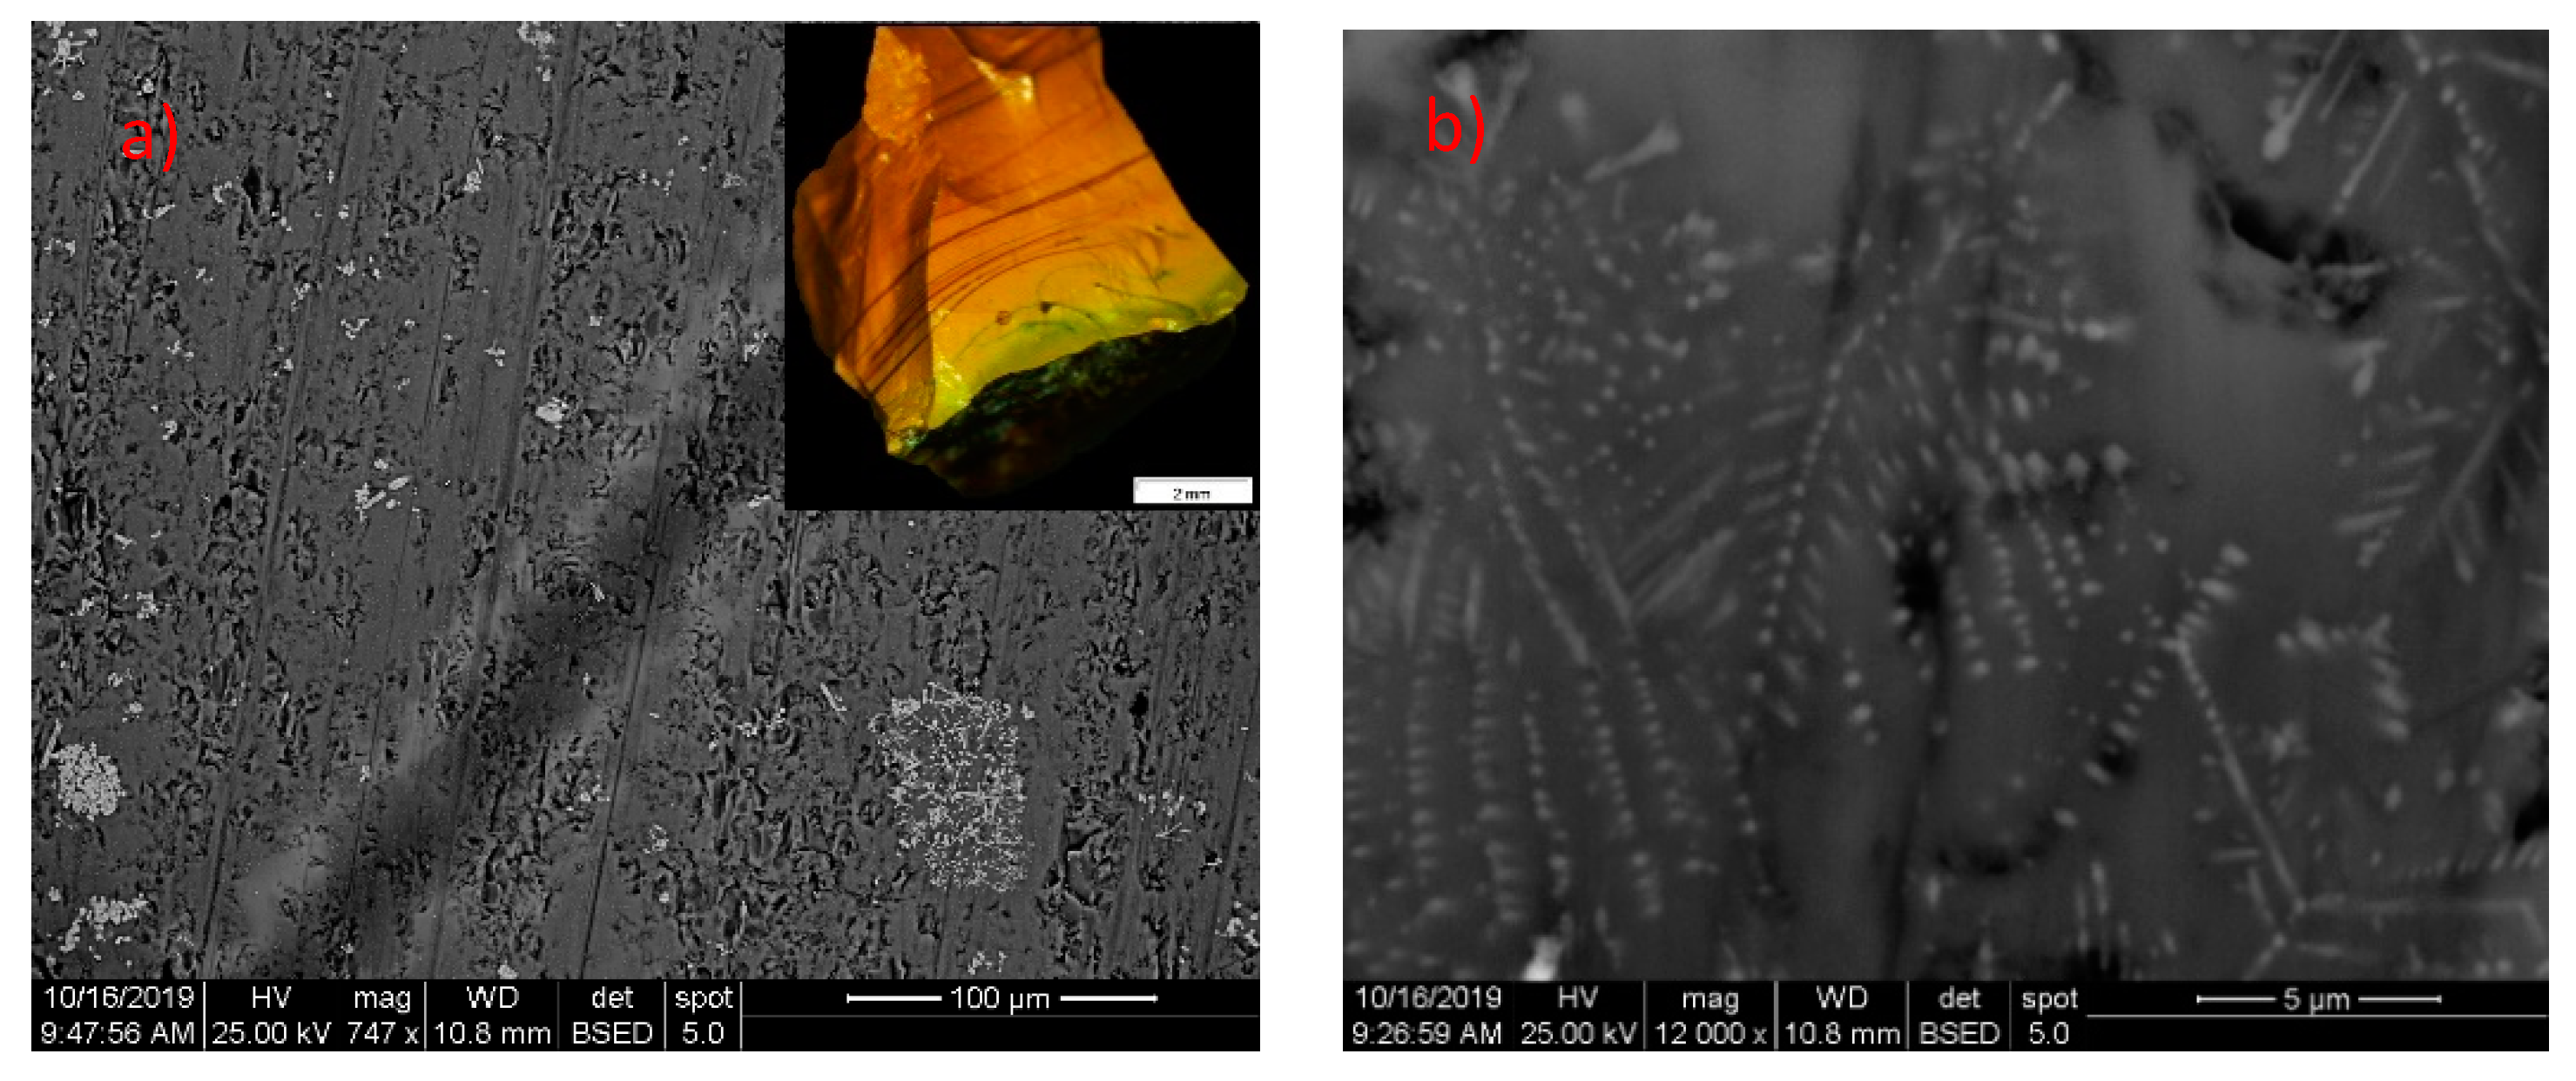
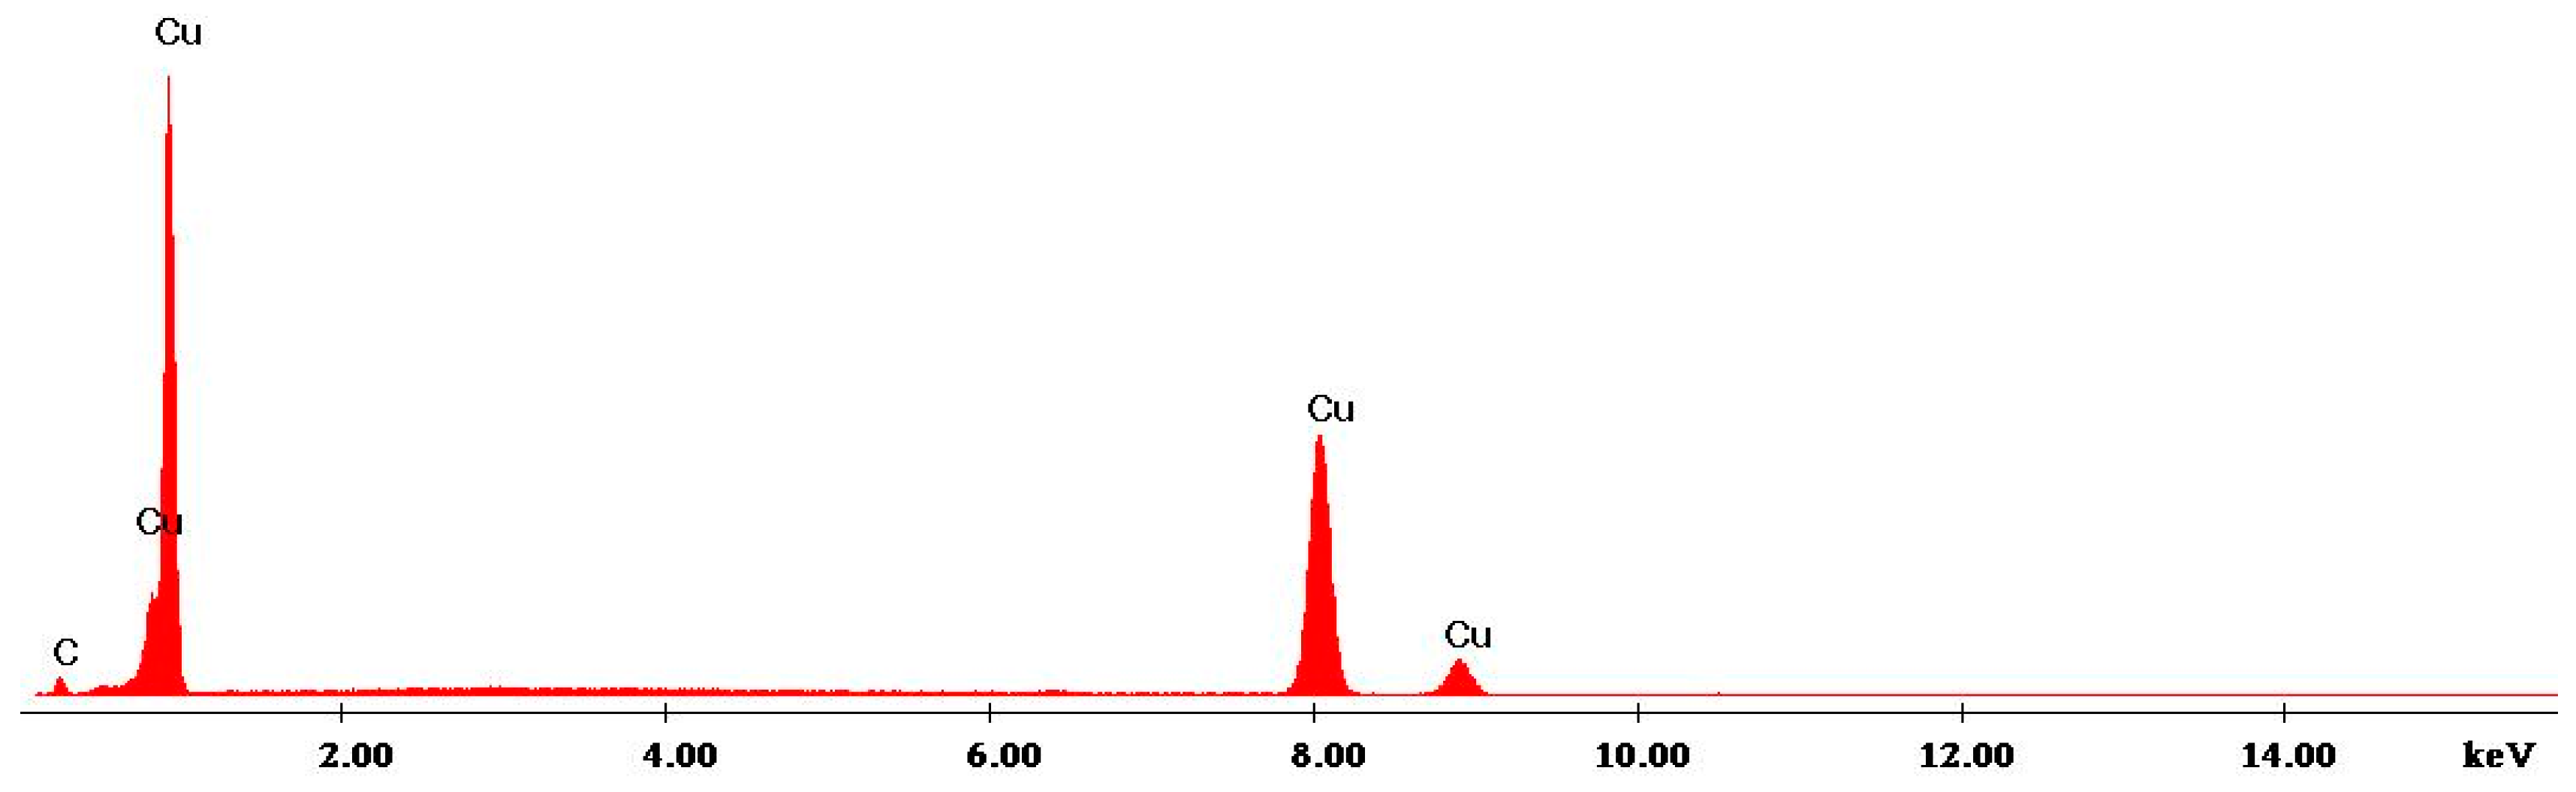
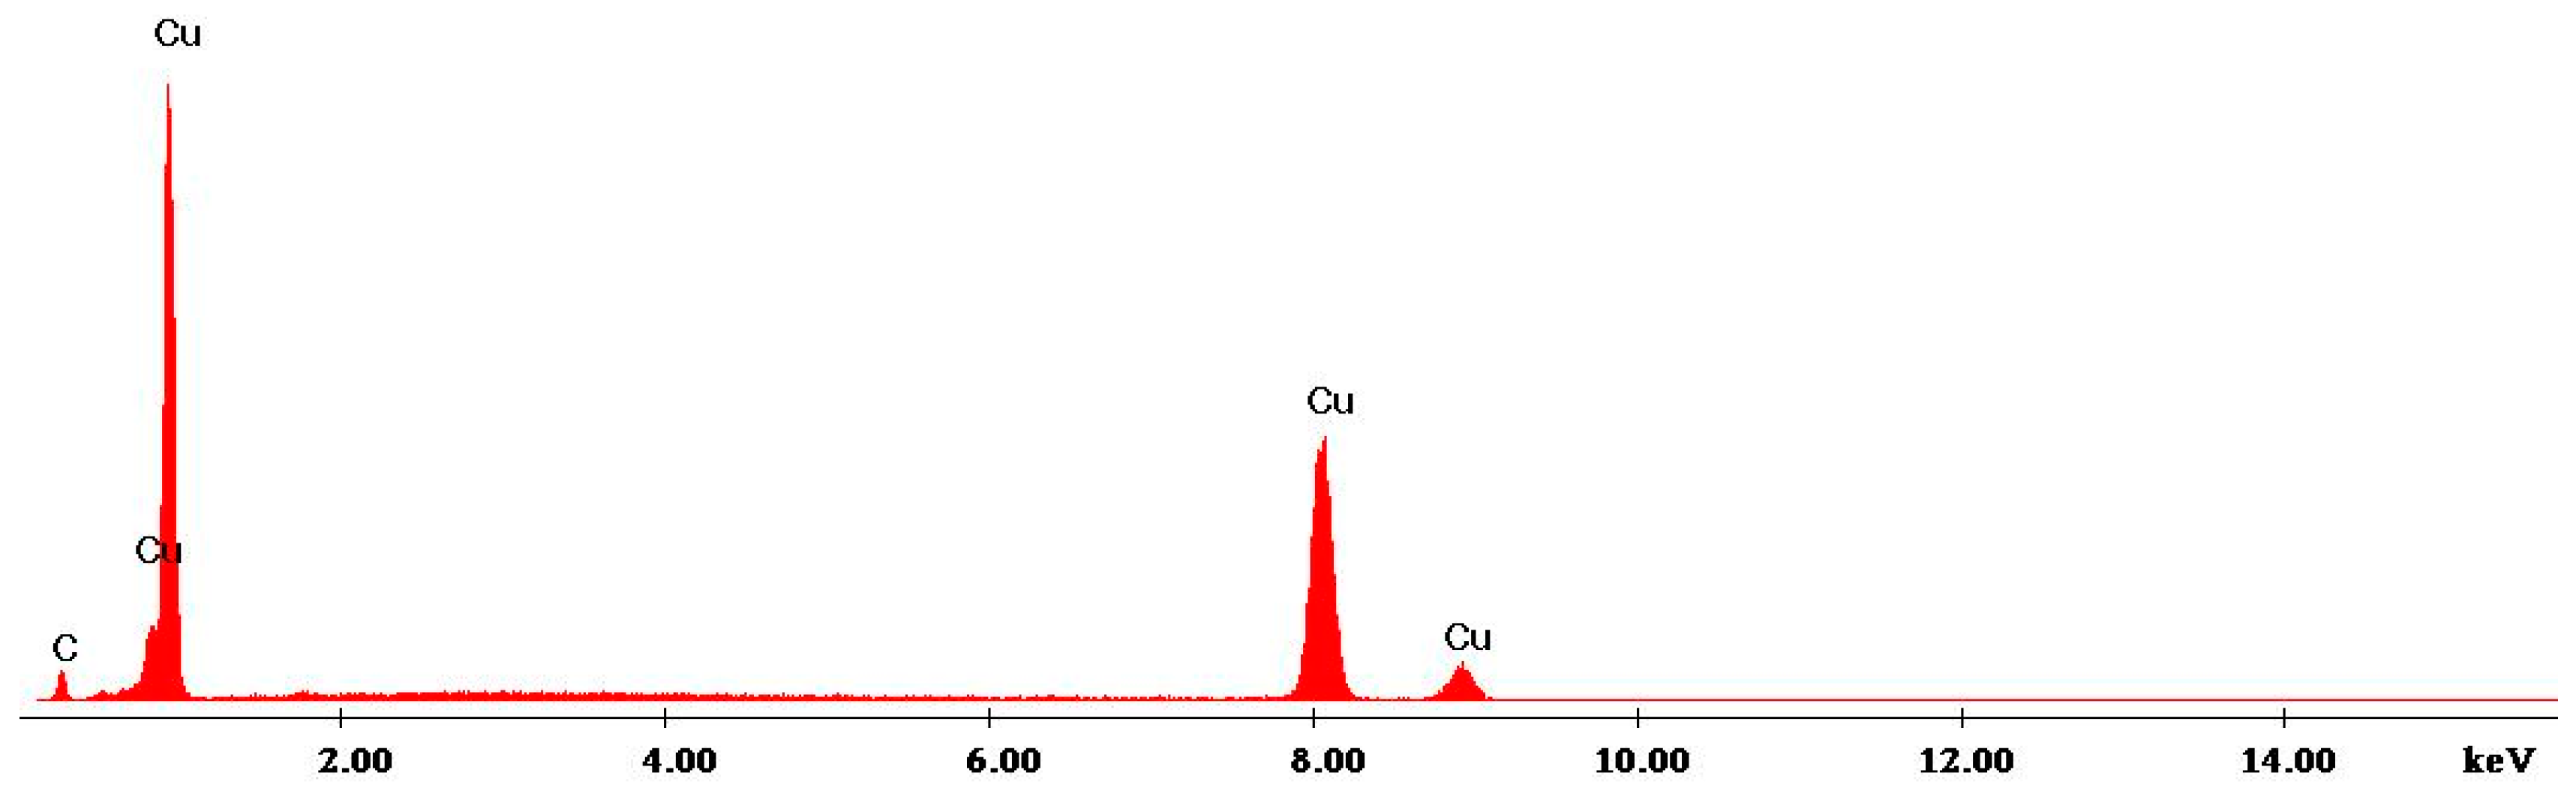
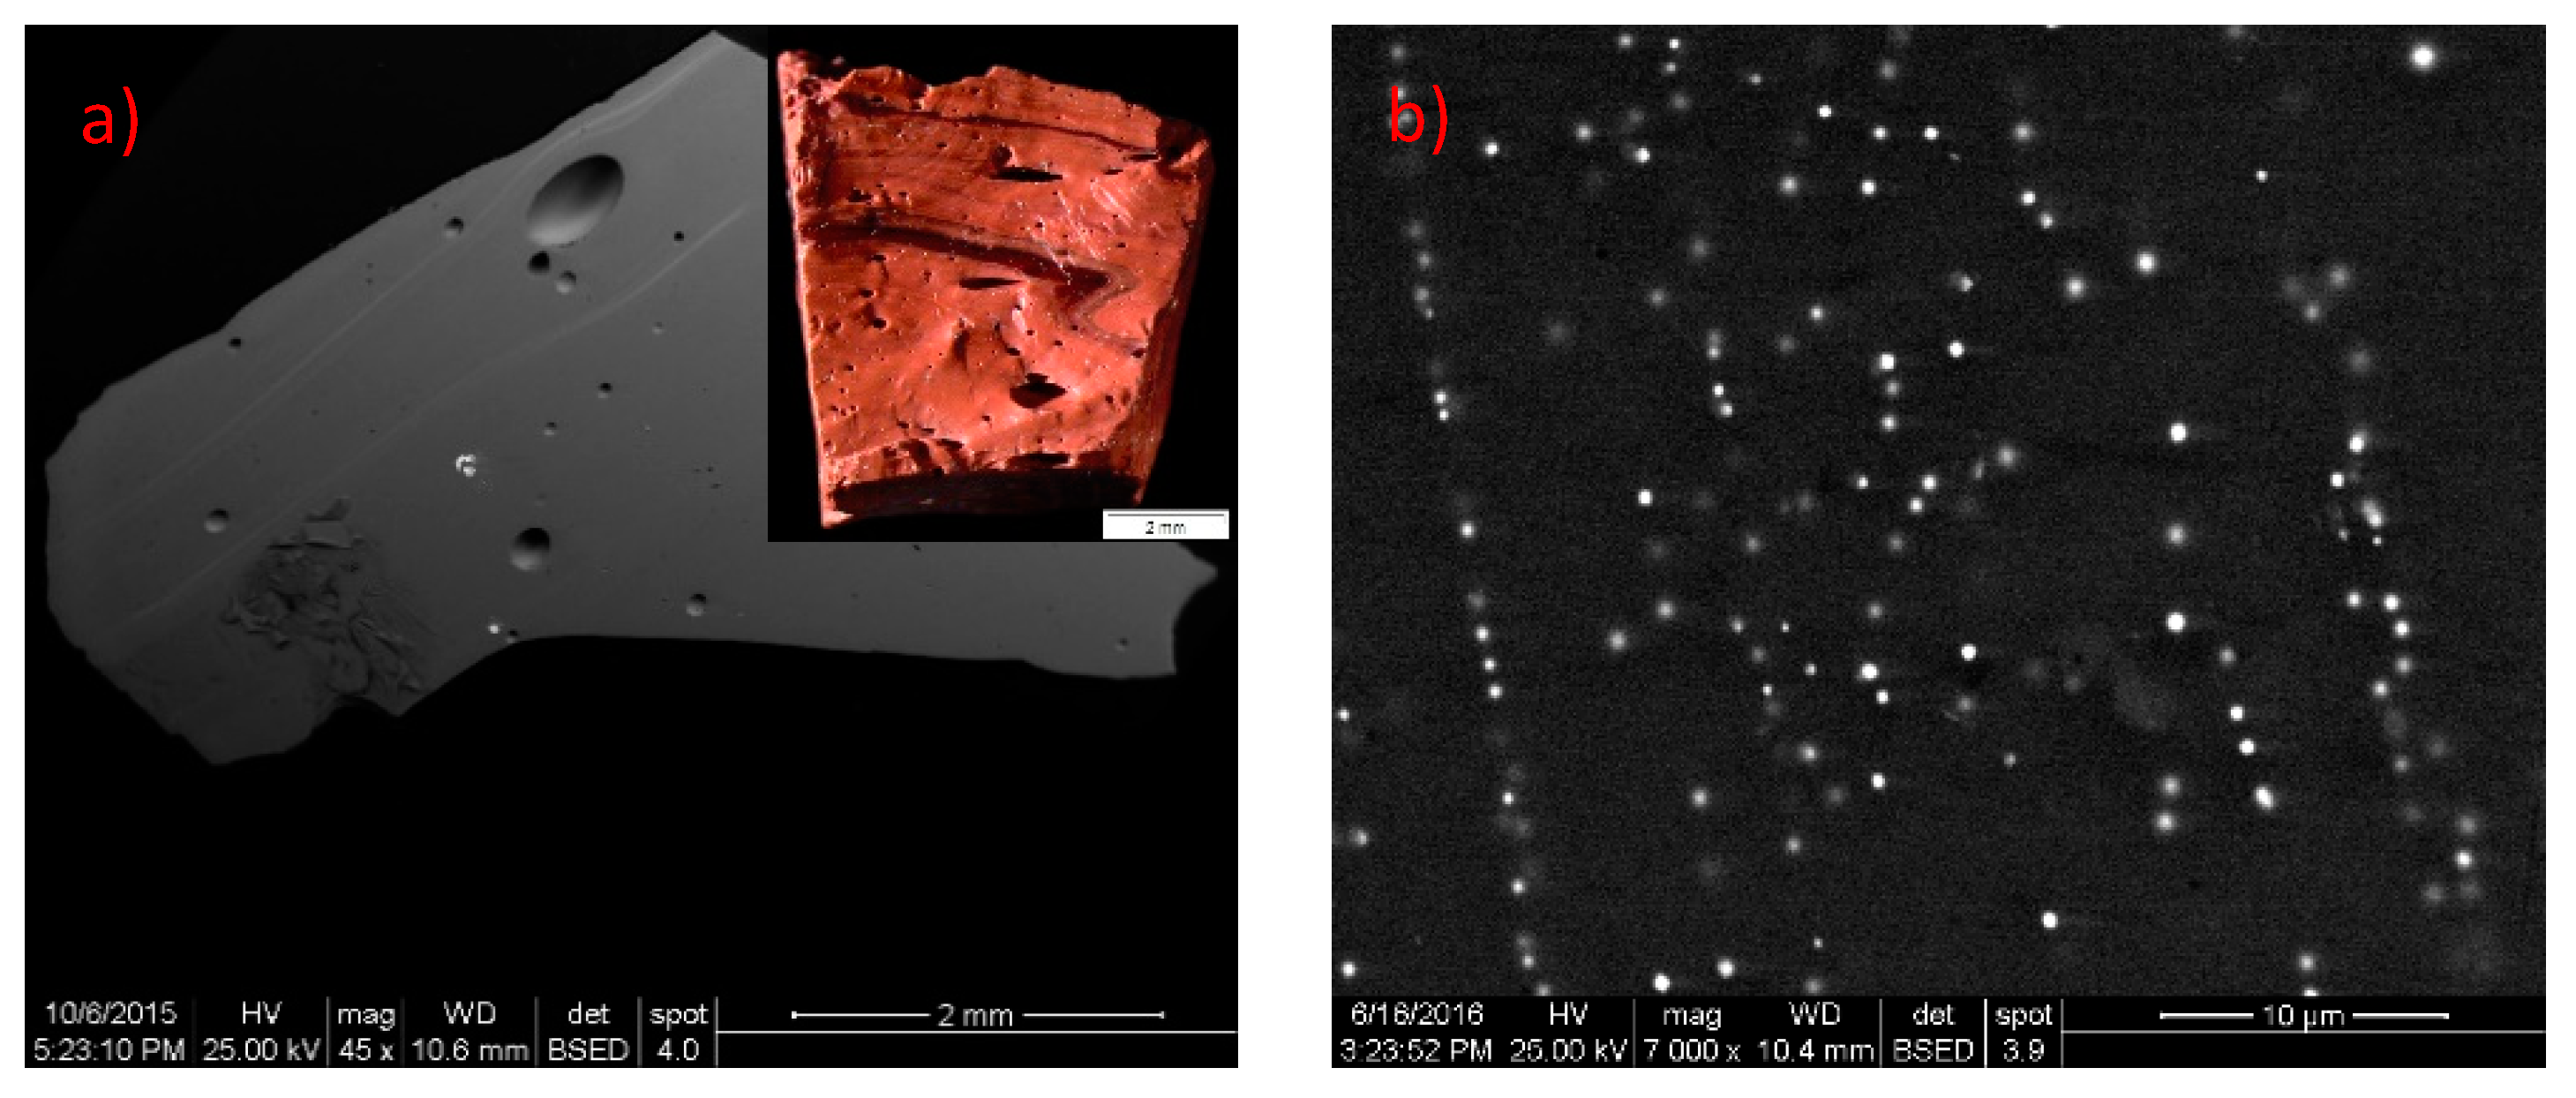
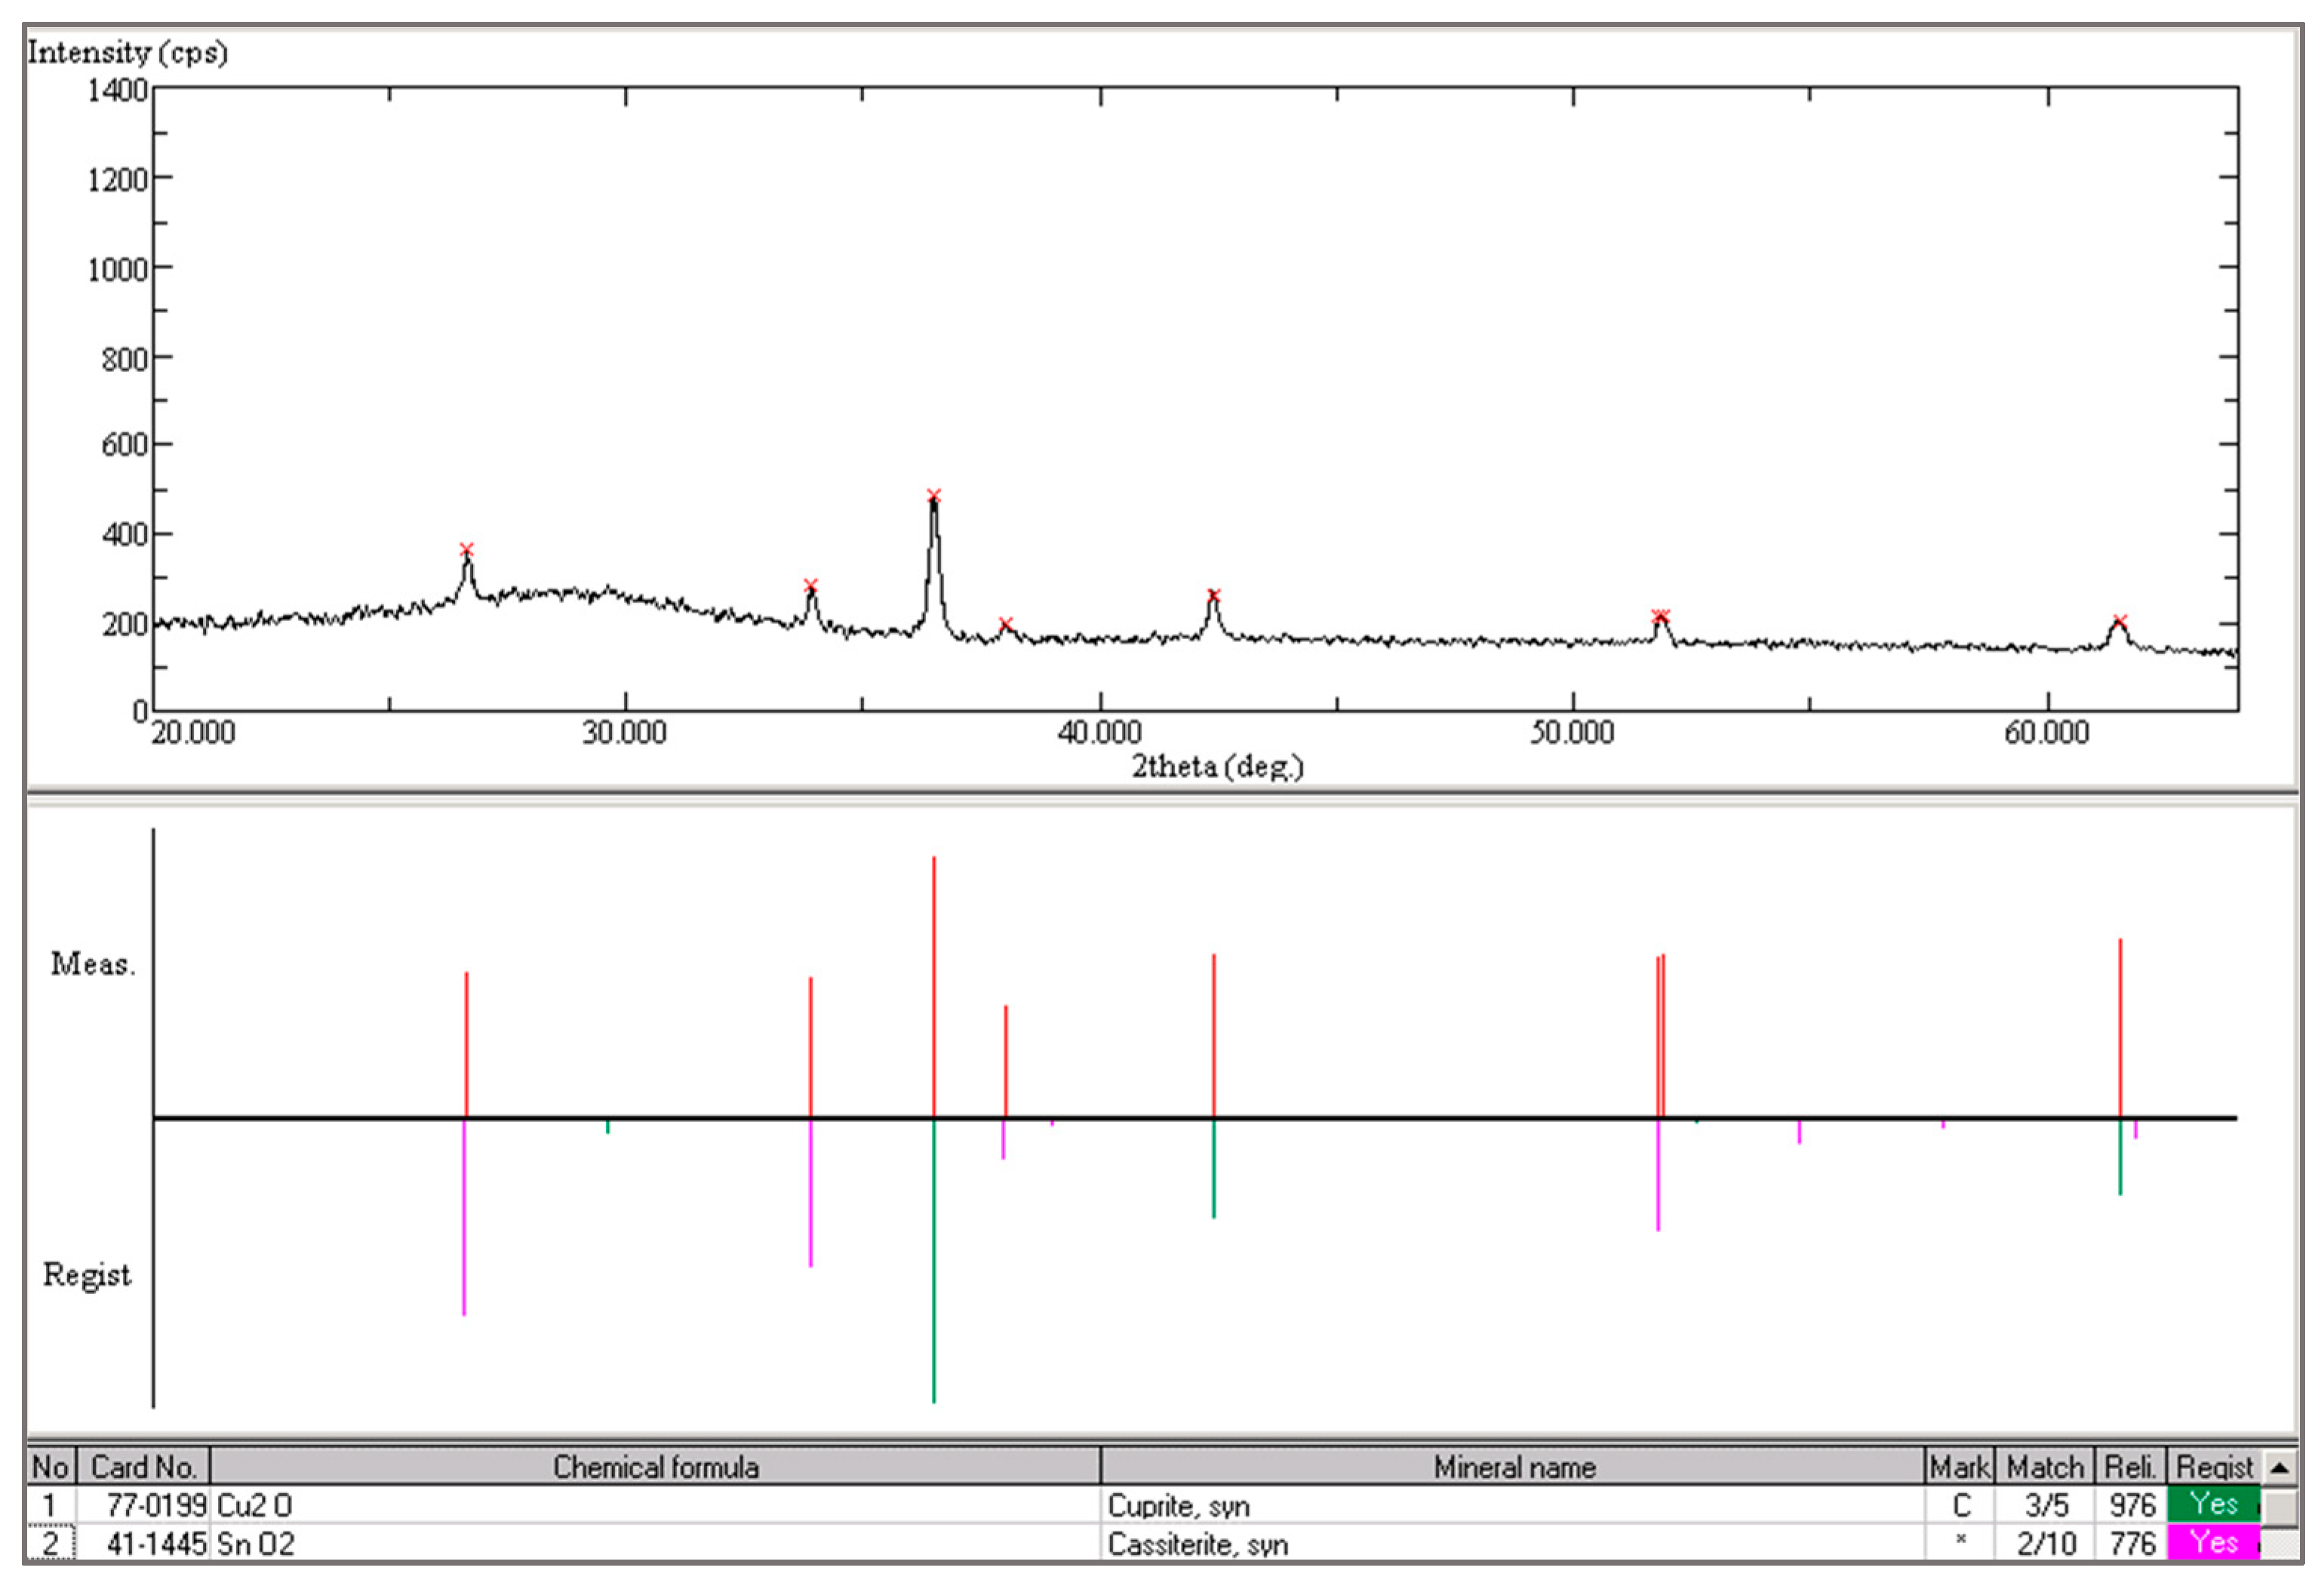
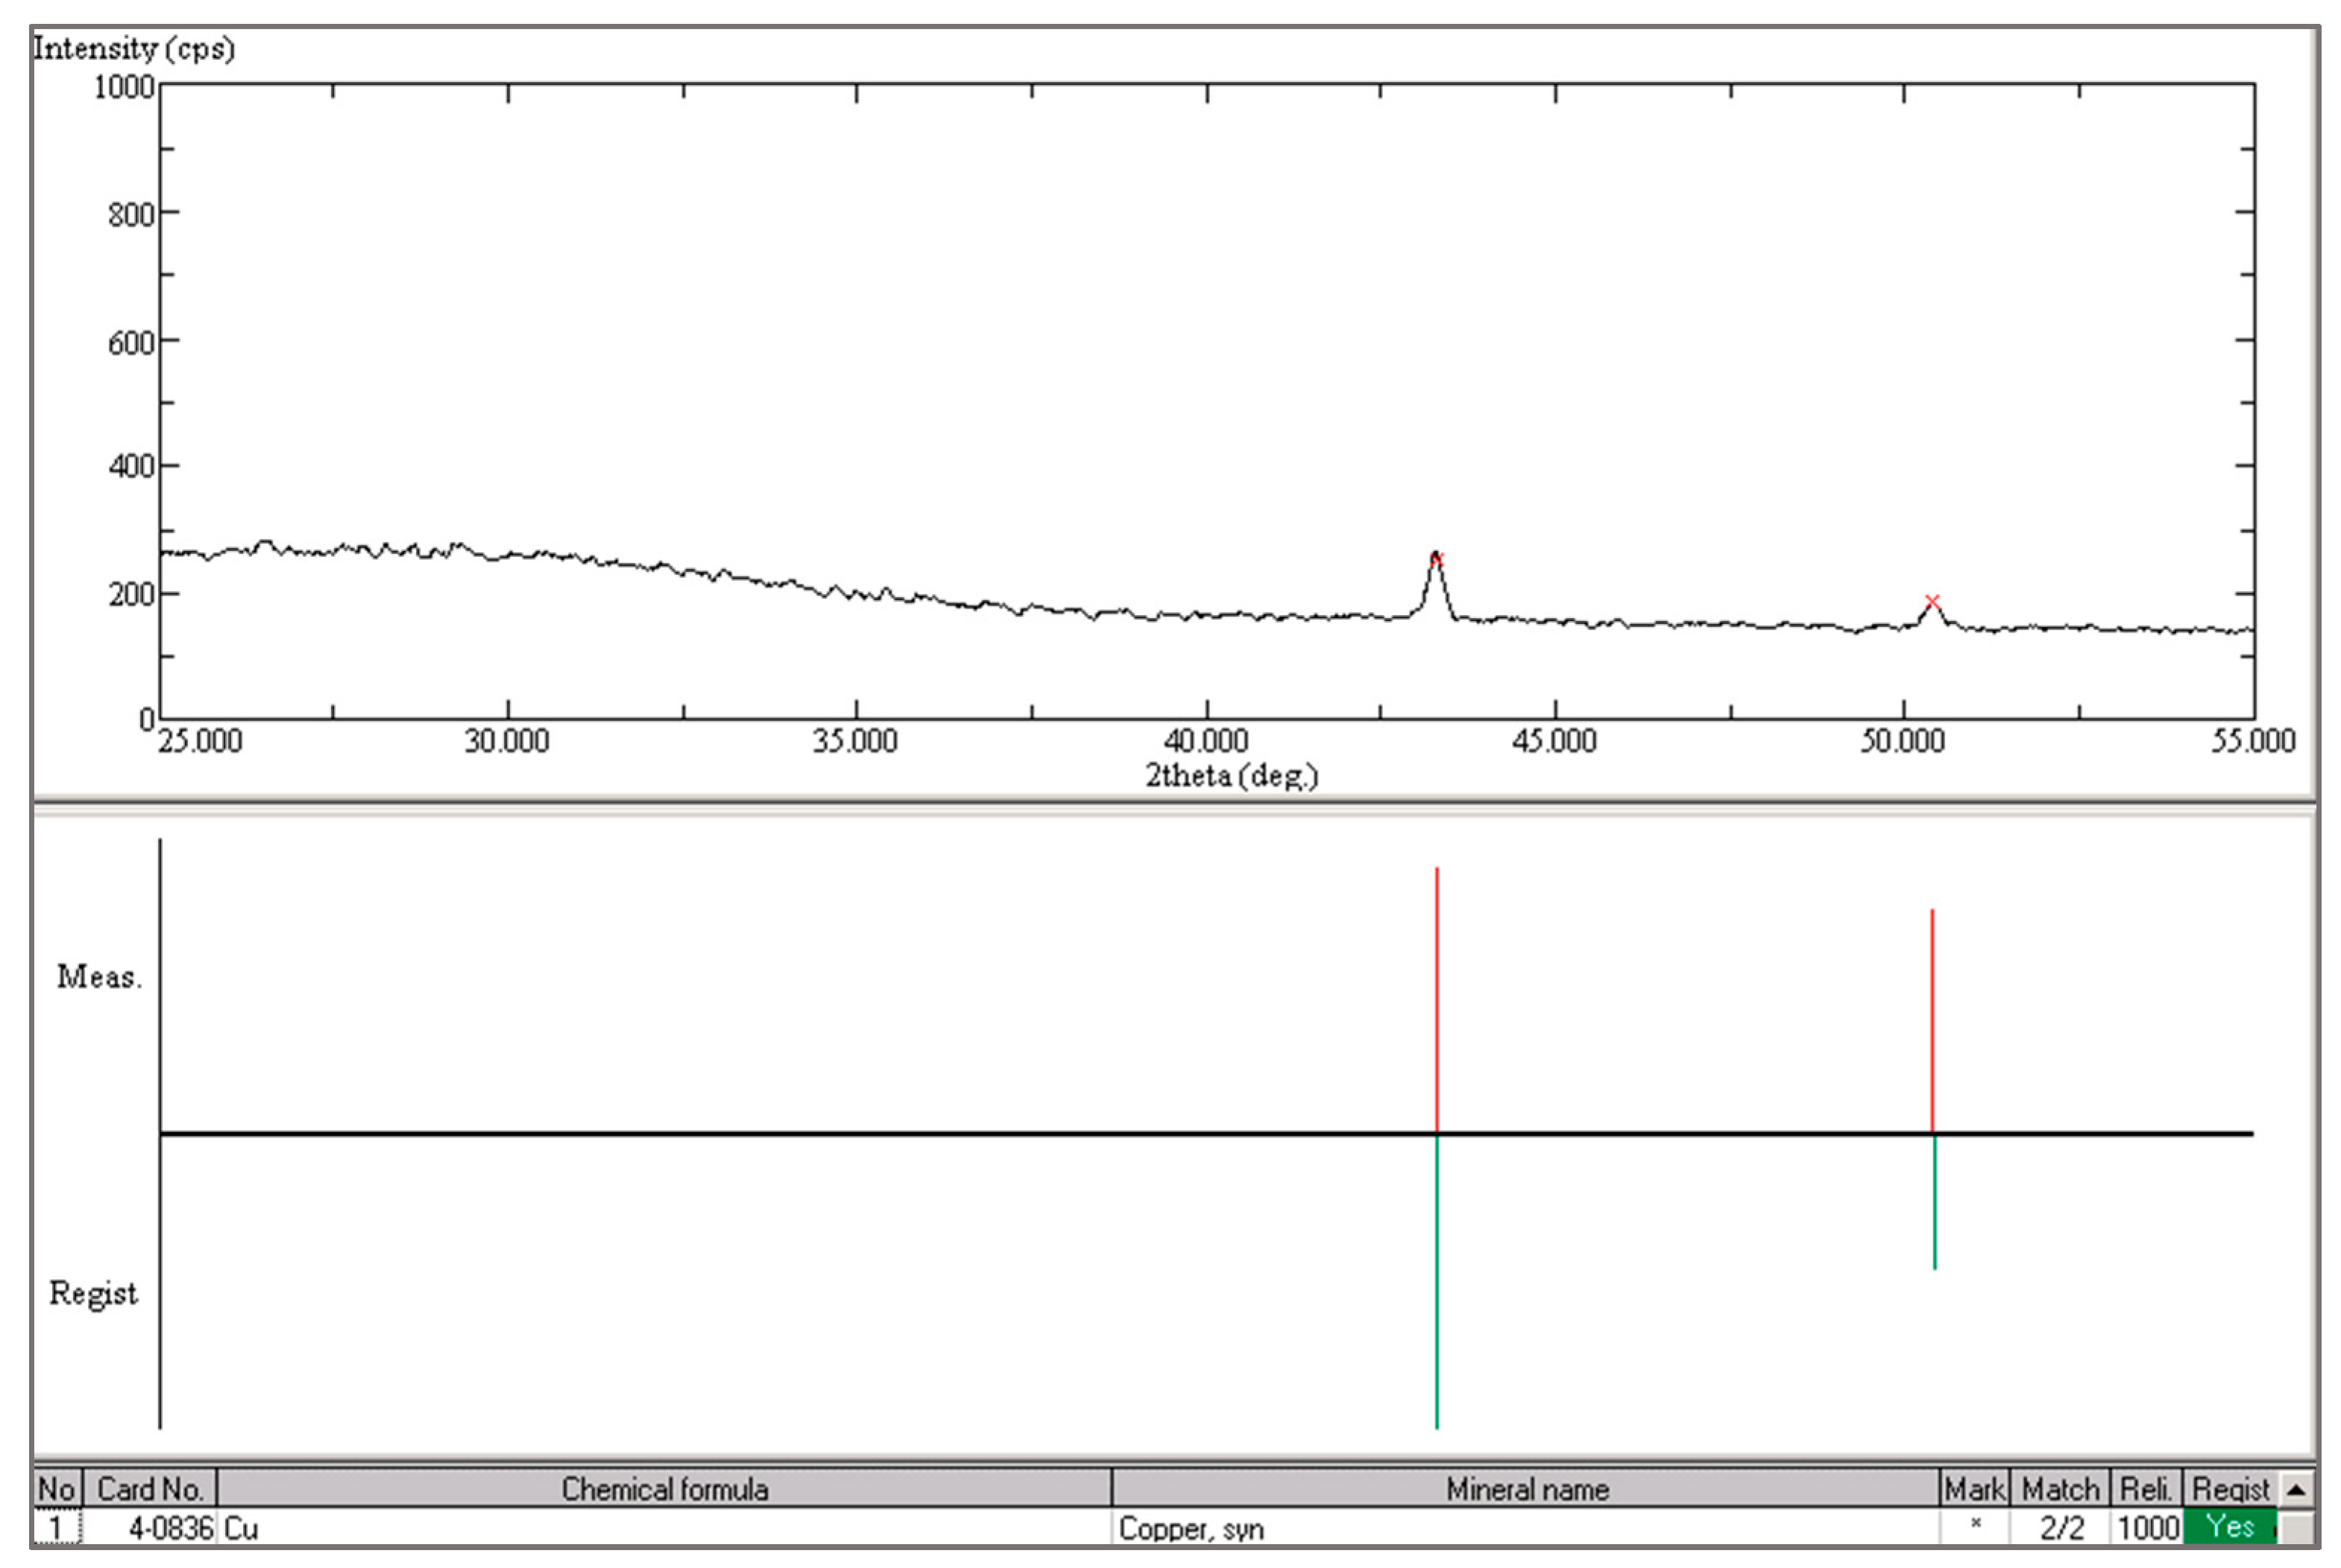
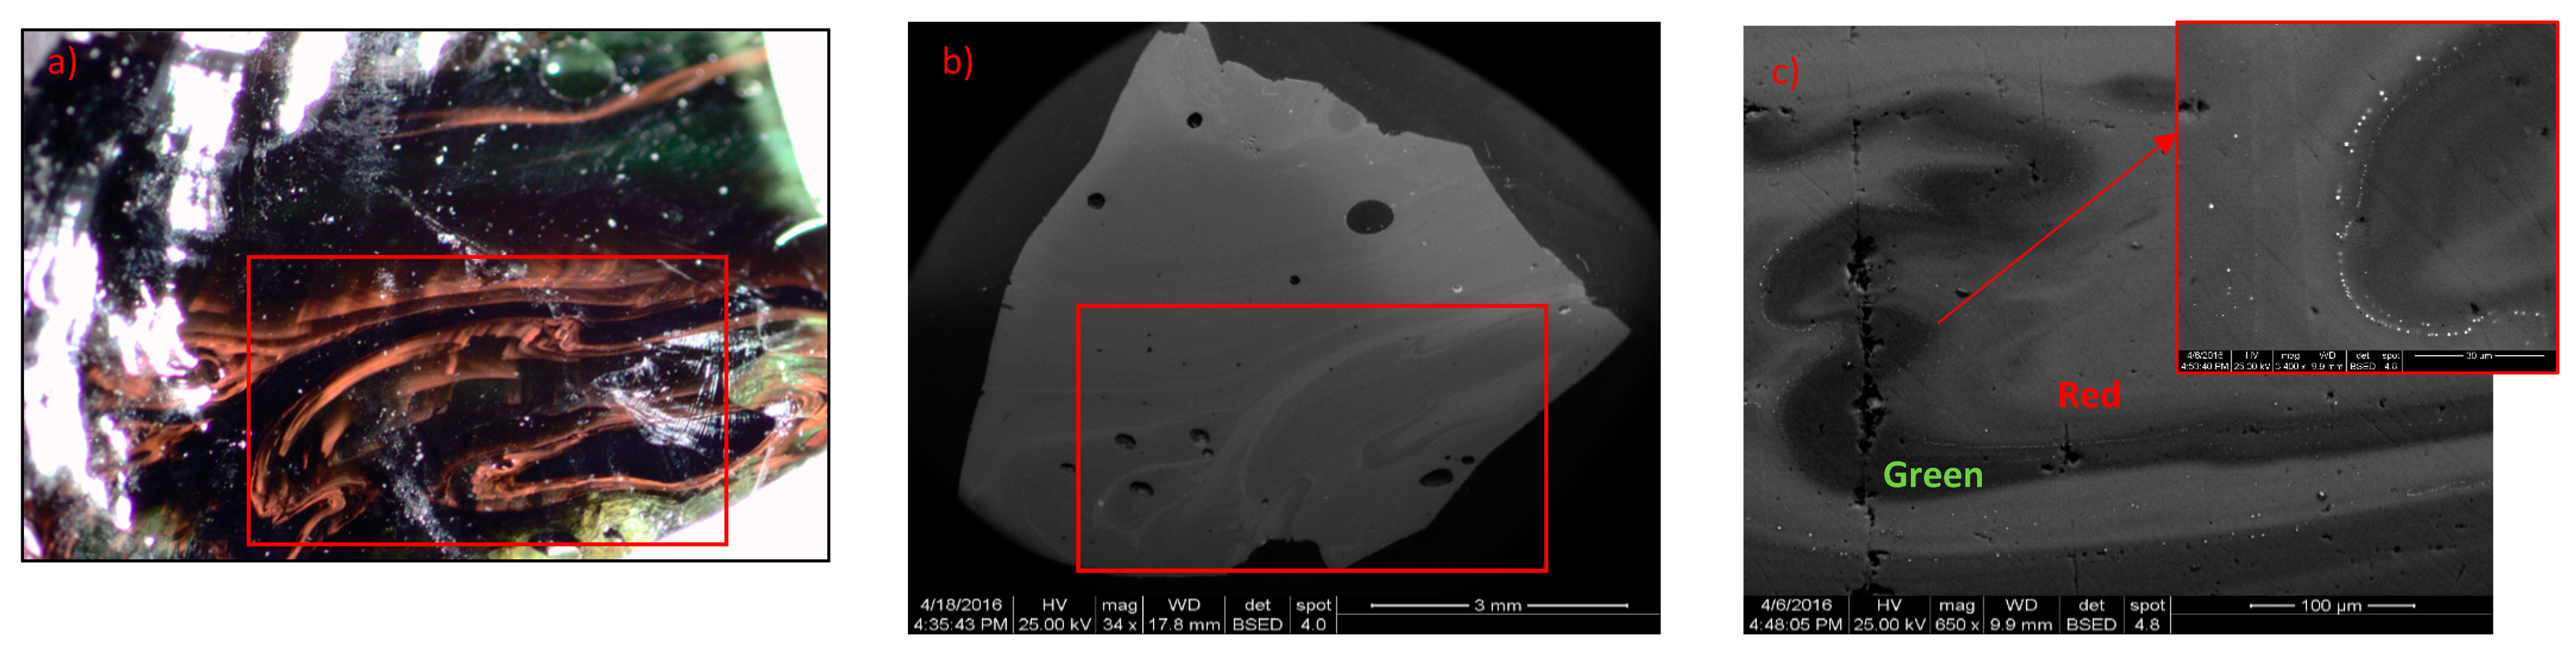
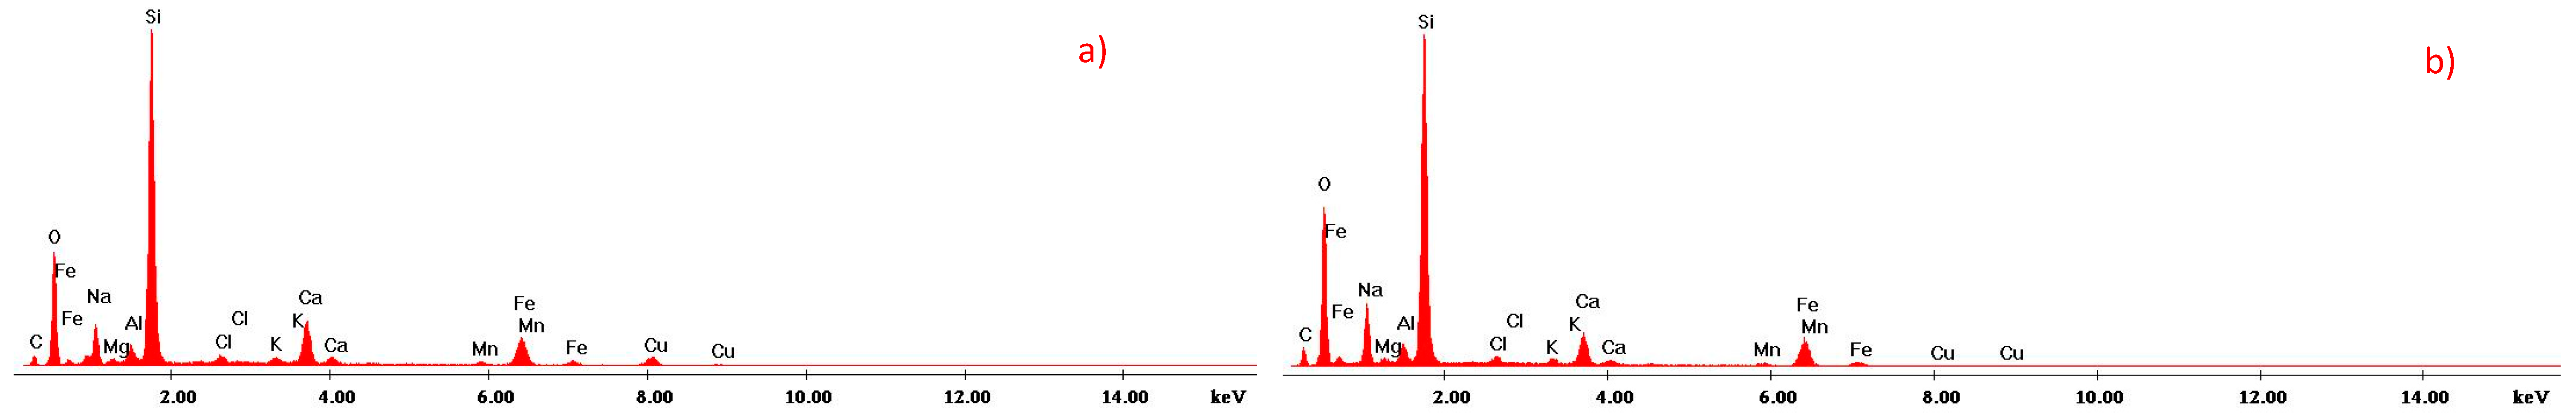
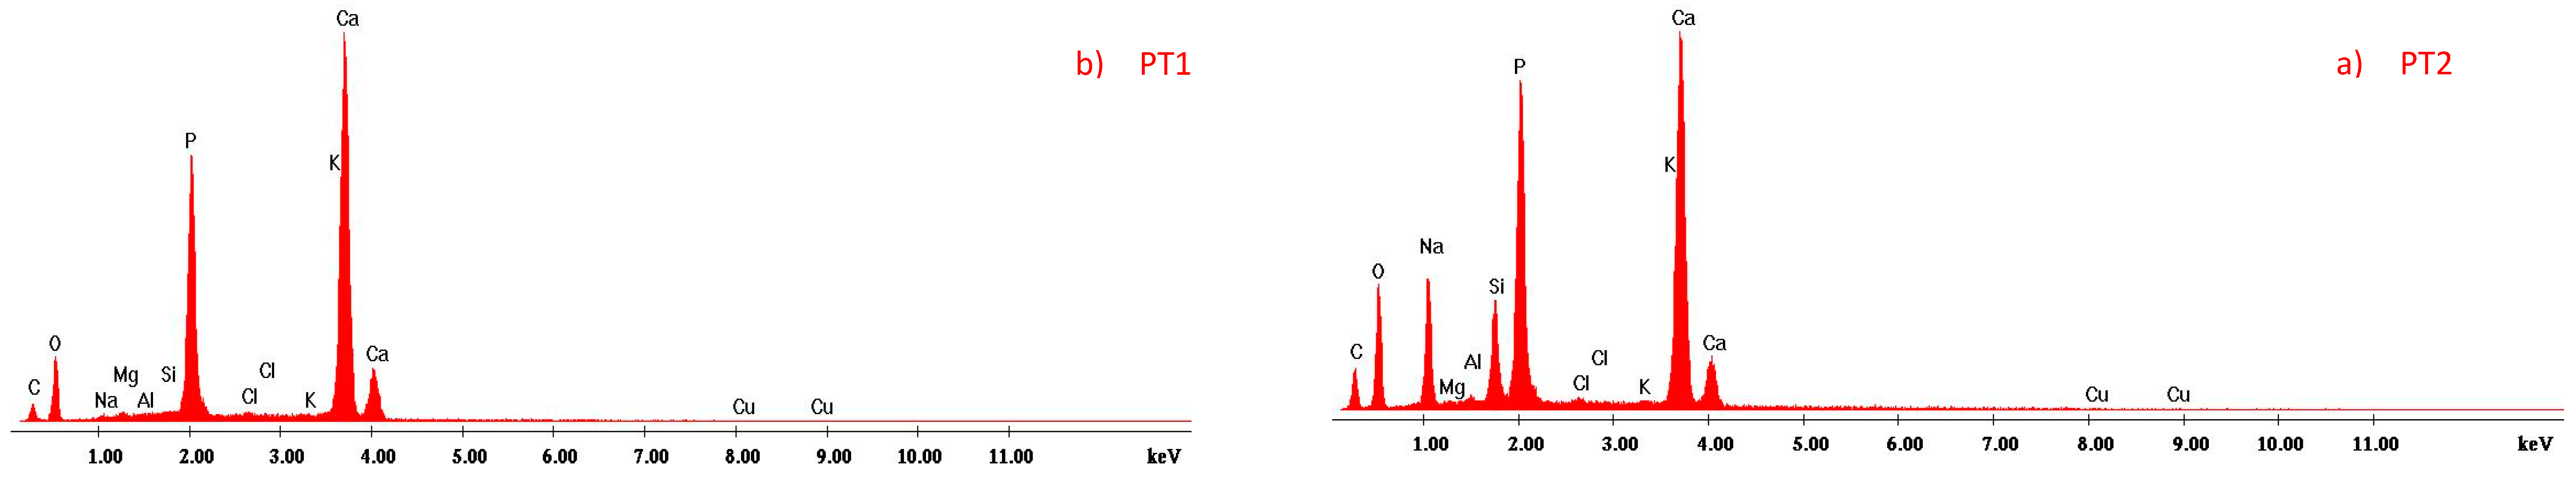
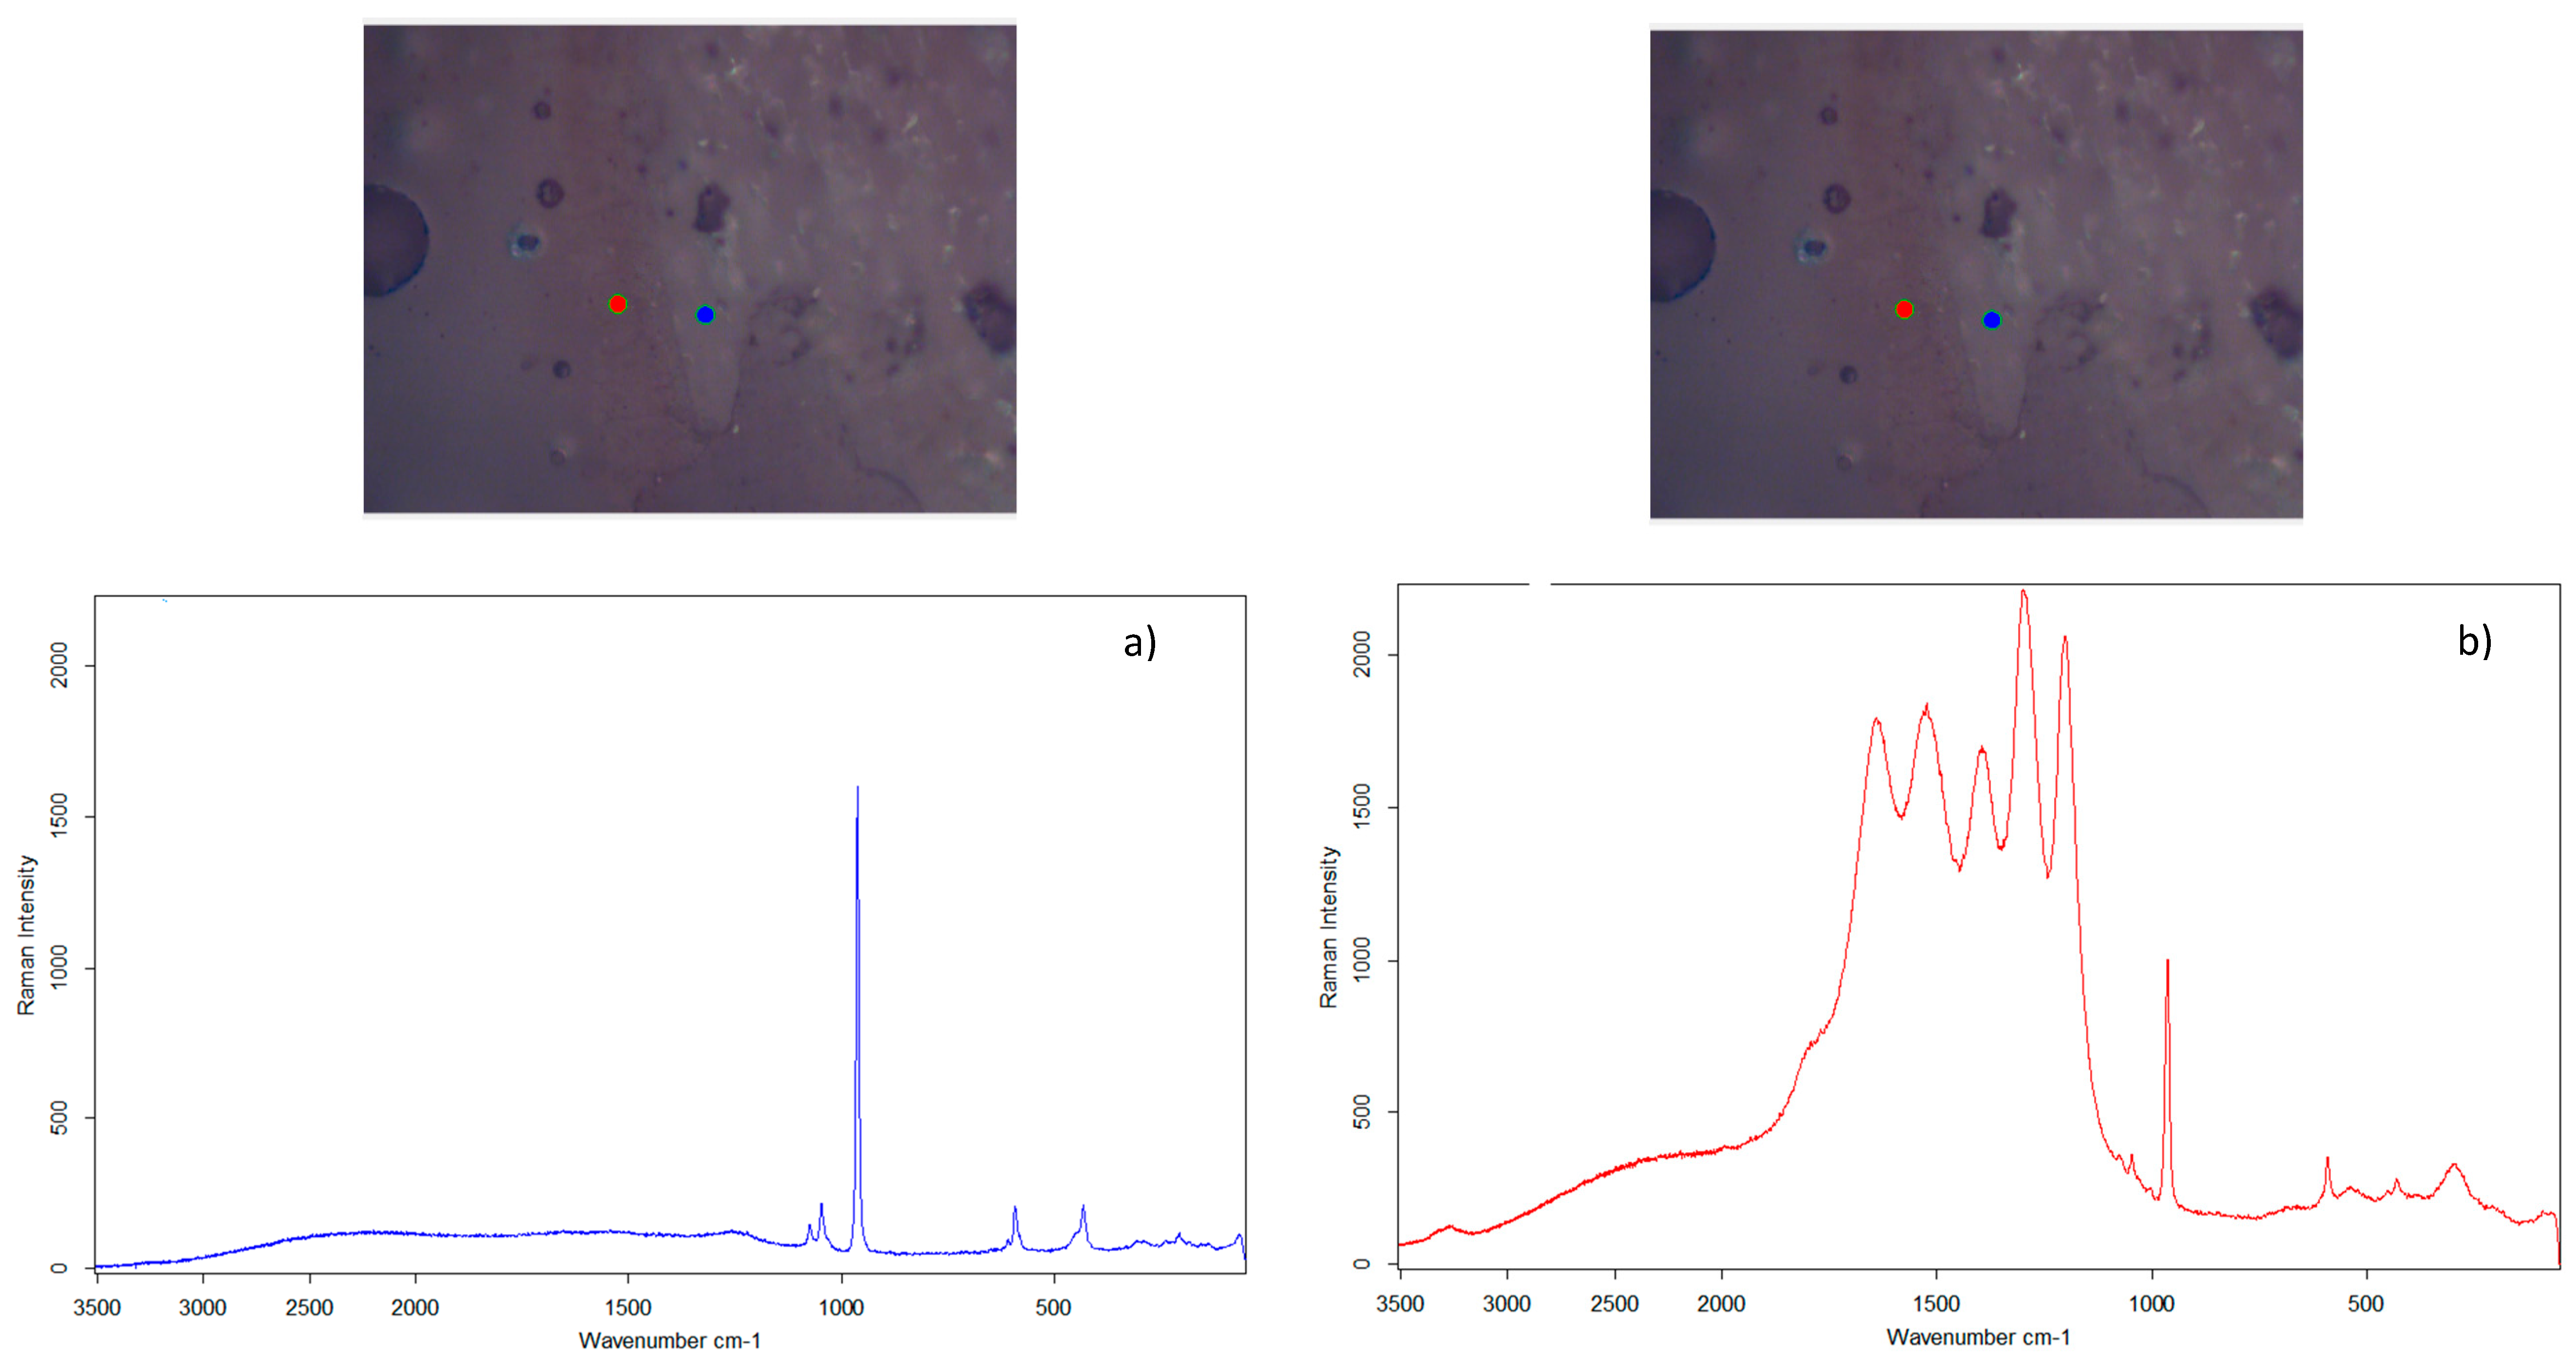
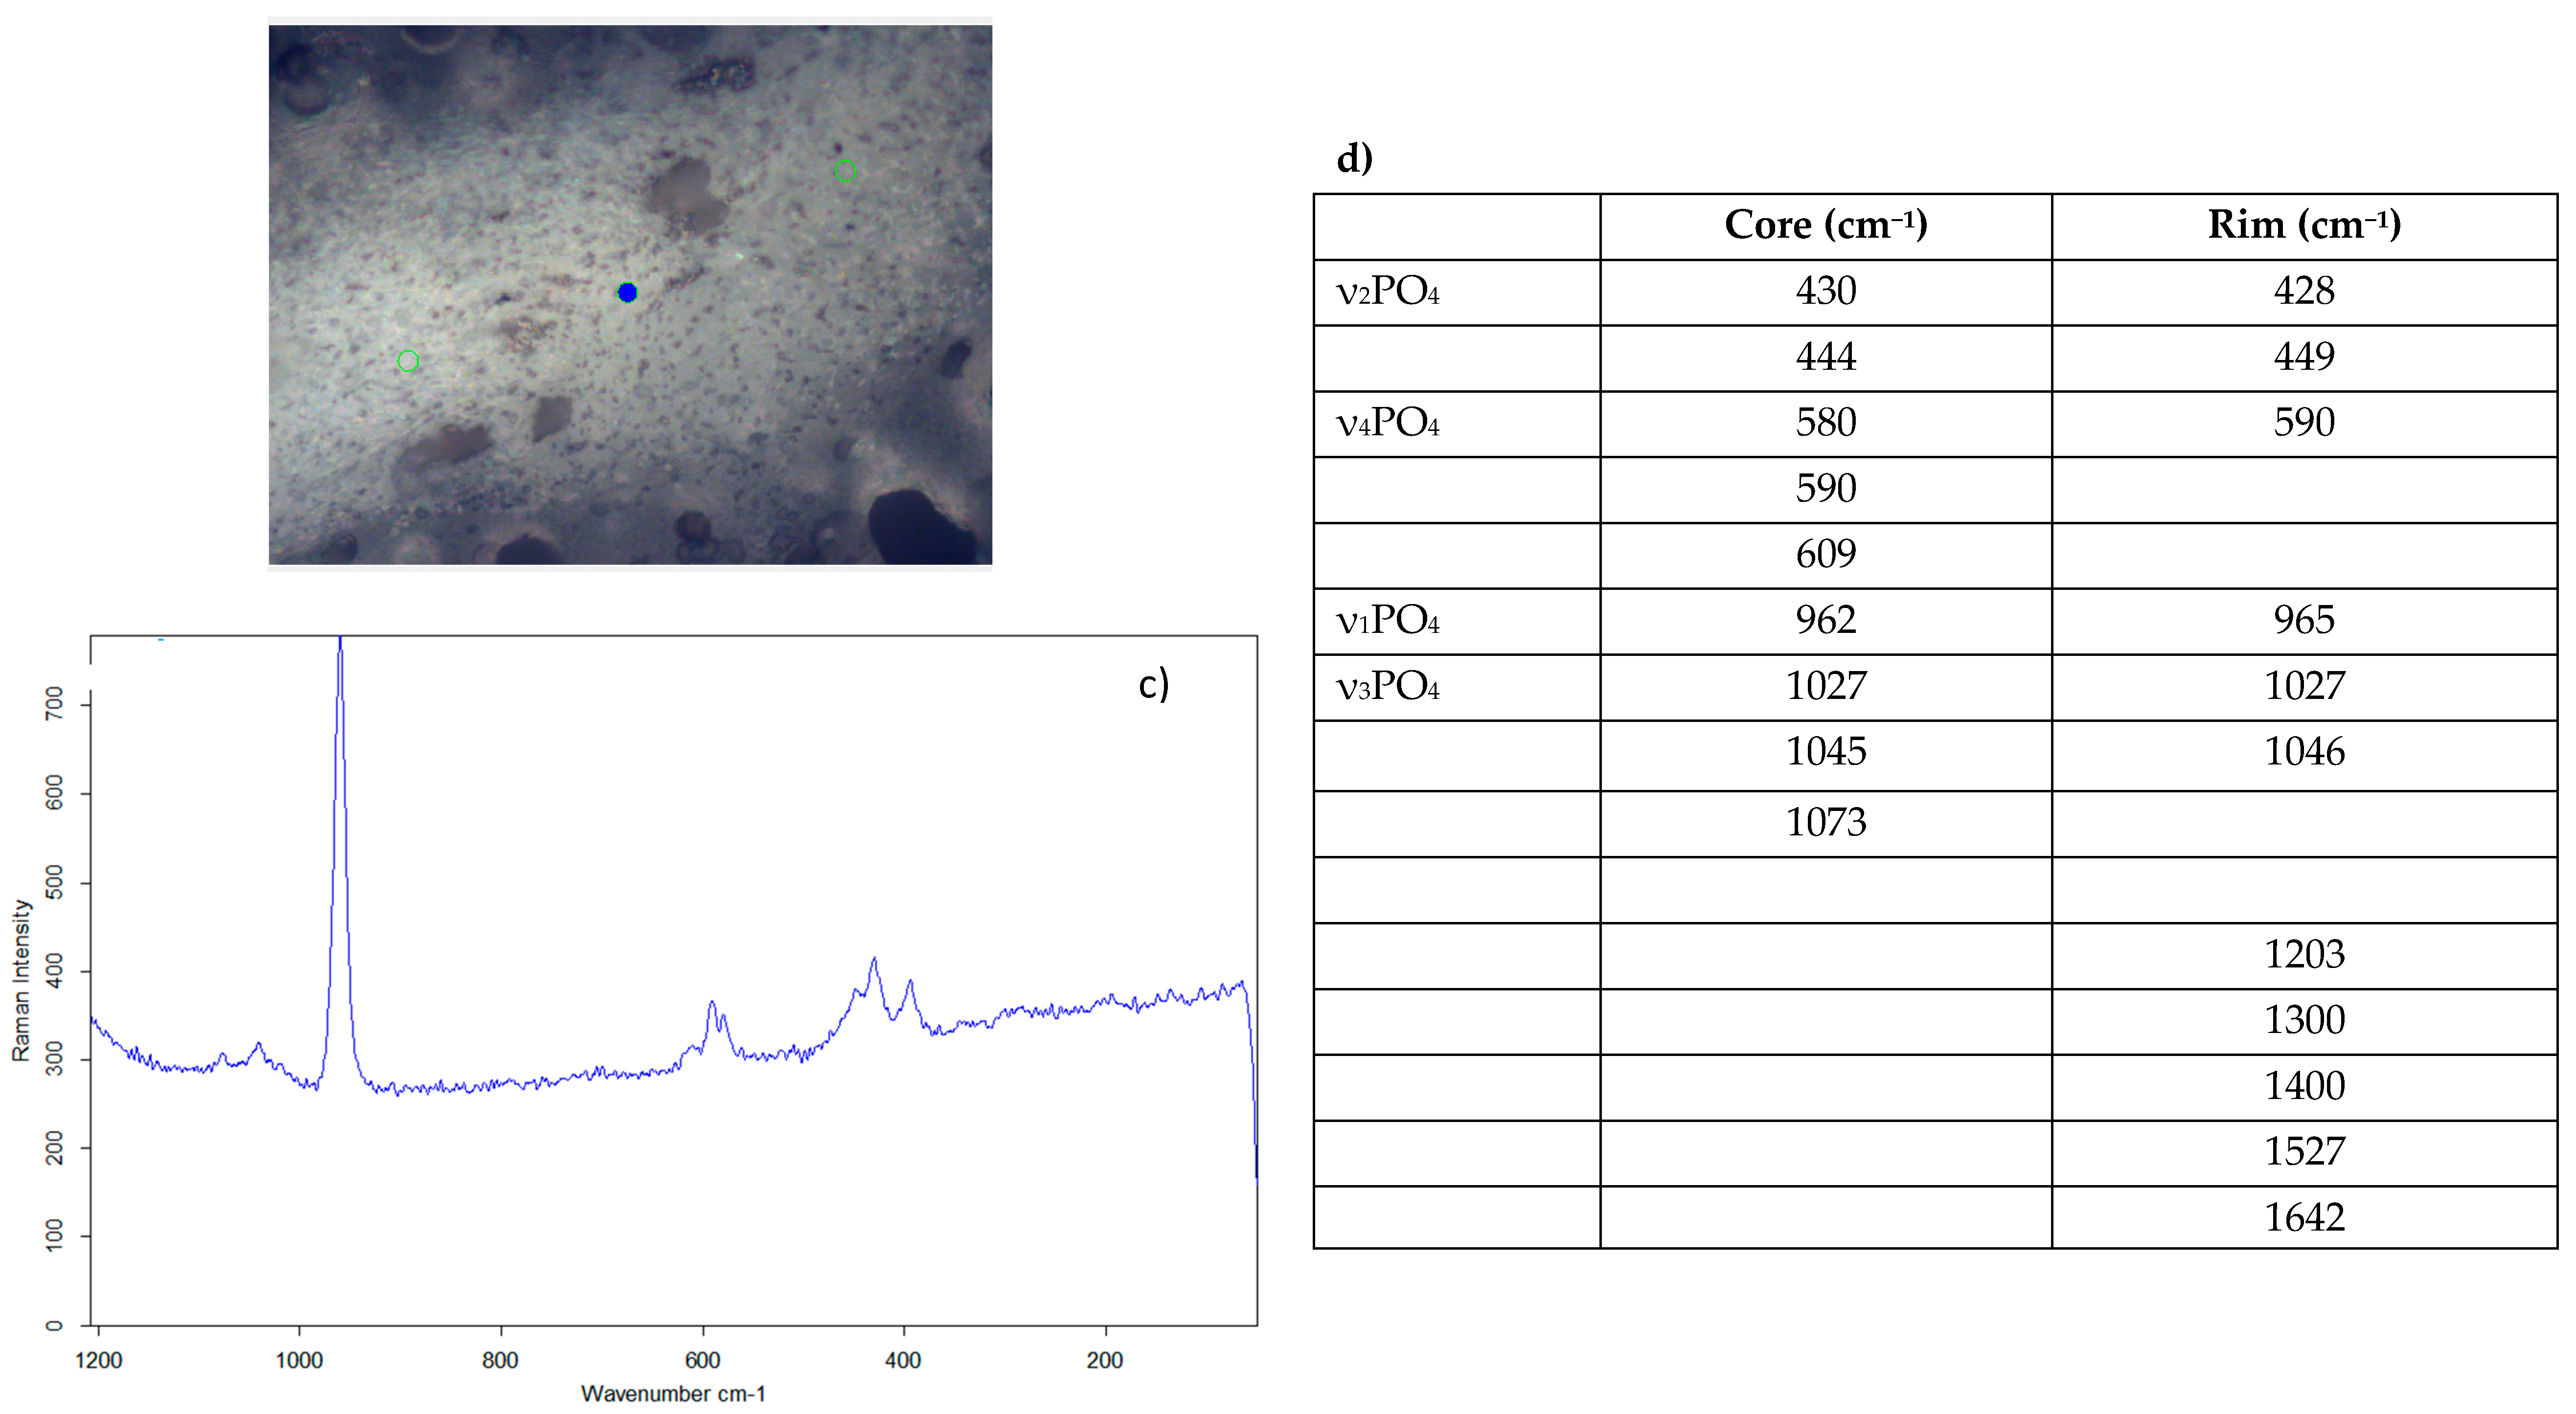
Table 1.
Antimony-Based Phases.
| White-Colored Glass | Blue-Colored Glass |
|---|---|
| Calcium antimonate (CaSb2O6 and/or Ca2Sb2O7) acting as both colorant and opacifier | Calcium antimonate (CaSb2O6 or Ca2Sb2O7) acting as opacifier, cobalt or copper oxide working as colorants. |
Table 2.
Antimony-Based Phases.
| Yellow-Colored Glass | Green-Colored Glass |
|---|---|
| Pb2Sb2O7 acting as both colorant and opacifier | Pb2Sb2O7 acting as both colorant and opacifier, in combination with copper and, possibly, iron, dispersed in the vitreous matrix |
Table 3.
Lead–Tin–Antimony-based phases.
| Yellow-Colored Glass | Green-Colored Glass |
|---|---|
| Pb2Sb2−xSnxO7−x/2 acting as both a colorant and opacifier. | Pb2Sb2−xSnxO7−x/2 acting as both a colorant and opacifier, in combination with copper and, possibly, iron, dispersed in the vitreous matrix. |
Table 4.
Tin-based phases.
| White- and Blue-Colored Class | Red-Colored Glass |
|---|---|
| Tin-based phases acting either as colorant and opacifier in white glasses, or solely as opacifier in blue glasses, colored by copper or cobalt oxides. | Tin-based phases only acting as co-opacifier, metallic copper, or cuprite (Cu2O), working as the main colorants and opacifiers (see Table 6). |
Table 5.
Lead–tin-based phases.
| Yellow-Colored Glass | Green-Colored Glass |
|---|---|
| Lead–Tin Yellow type II (PbSn1−xSixO3) acting as both a colorant and an opacifier | Lead–Tin Yellow type II acting as both a colorant and an opacifier, in combination with copper and, eventually, iron, dispersed in the vitreous matrix |
Table 6.
Cu-based phases.
| Red-Colored Glass |
|---|
| Cu2O dendrites or nanometric particles of metallic Cu acting as both colorant and opacifier. |
Table 7.
Ca-phosphate phases.
| Green-Colored Glass | Blue-Colored Glass |
|---|---|
| Ca-phosphate acting as opacifier, copper oxide as colorant | Ca-phosphate acting as opacifier, cobalt or copper oxide working as colorants |
© 2020 by the authors. Licensee MDPI, Basel, Switzerland. This article is an open access article distributed under the terms and conditions of the Creative Commons Attribution (CC BY) license (http://creativecommons.org/licenses/by/4.0/).
Share and Cite
MDPI and ACS Style
Vandini, M.; Fiorentino, S. From Crystals to Color: A Compendium of Multi-Analytical Data on Mineralogical Phases in Opaque Colored Glass Mosaic Tesserae. Minerals 2020, 10, 609. https://doi.org/10.3390/min10070609
AMA Style
Vandini M, Fiorentino S. From Crystals to Color: A Compendium of Multi-Analytical Data on Mineralogical Phases in Opaque Colored Glass Mosaic Tesserae. Minerals. 2020; 10(7):609. https://doi.org/10.3390/min10070609
Chicago/Turabian StyleVandini, Mariangela, and Sara Fiorentino. 2020. "From Crystals to Color: A Compendium of Multi-Analytical Data on Mineralogical Phases in Opaque Colored Glass Mosaic Tesserae" Minerals 10, no. 7: 609. https://doi.org/10.3390/min10070609
Note that from the first issue of 2016, this journal uses article numbers instead of page numbers. See further details here.