Article

X-ray Fluorescence Analysis of Feldspars and Silicate Glass: Effects of Melting Time on Fused Bead Consistency and Volatilisation

Materials and Engineering Research Institute (MERI), Sheffield Hallam University, City Campus, Howard Street, Sheffield S1 1WB, UK
*
Author to whom correspondence should be addressed.
Minerals 2020, 10(5), 442; https://doi.org/10.3390/min10050442
Submission received: 19 March 2020 / Revised: 14 April 2020 / Accepted: 12 May 2020 / Published: 15 May 2020
(This article belongs to the Special Issue X-ray Fluorescence Spectrometry in Mineral and Glass Analysis)

Abstract

:
Reproducible preparation of lithium tetraborate fused beads for XRF analysis of glass and mineral samples is of paramount importance for analytical repeatability. However, as with all glass melting processes, losses due to volatilisation must be taken into account and their effects are not negligible. Here the effects of fused bead melting time have been studied for four Certified Reference Materials (CRM’s: three feldspars, one silicate glass), in terms of their effects on analytical variability and volatilisation losses arising from fused bead preparation. At melting temperatures of 1065 °C, and for feldspar samples, fused bead melting times shorter than approximately 25 min generally gave rise to a greater deviation of the XRF-analysed composition from the certified composition. This variation might be due to incomplete fusion and/or fused bead inhomogeneity but further research is needed. In contrast, the shortest fused bead melting time for the silicate glass CRM gave an XRF-analysed composition closer to the certified values than longer melting times. This may suggest a faster rate of glass-in-glass dissolution and homogenization during fused bead preparation. For all samples, longer melting times gave rise to greater volatilisation losses (including sulphates and halides) during fusion. This was demonstrated by a linear relationship between SO3 mass loss and time1/2, as predicted by a simple diffusion-based model. Iodine volatilisation displays a more complex relationship, suggestive of diffusion plus additional mechanisms. This conclusion may have implications for vitrification of iodine-bearing radioactive wastes. Our research demonstrates that the nature of the sample material impacts on the most appropriate fusion times. For feldspars no less than ~25 min and no more than ~60 min of fusion at 1065 °C, using Li2B4O7 as the fusion medium and in the context of feldspar samples and the automatic fusion equipment used here, strikes an acceptable (albeit non-ideal) balance between the competing factors of fused bead quality, analytical consistency and mitigating volatilisation losses. Conversely, for the silicate glass sample, shorter fusion times of less than ~30 min under the same conditions provided more accurate analyses whilst limiting volatile losses.

1. Introduction

X-ray fluorescence (XRF) spectroscopy is widely employed for the elemental (chemical) analysis of minerals and glasses. In mineral, geological, mining and archaeological analyses, XRF has been used to assess the elemental composition of minerals and other inorganic materials, allowing for the identification of consistency, impurities and contaminants [1,2,3,4]. Within the glass industry and glass science, XRF spectroscopy is widely used to analyse the chemical composition of commercial and experimental glasses [5,6,7]. XRF has also been widely used to assess the viability and quality of raw materials and minerals for application across multiple manufacturing industries, including glasses, ceramics and refractories [8,9,10,11].
Due to the high manufacturing temperatures of many commercial glasses (ca. 1450–1500 °C for soda-lime-silica container and float glasses), some components are known to volatilise and escape from the melt into the vapour phase and thence the off-gas system, which can have potentially adverse effects on the final glass product, the furnace refractories and gaseous/particulate emissions. Different species can volatilise at different temperatures, pressures, atmospheres and melt durations. Volatilisation of key glass making components, such as Na and B, has been observed at melting temperatures ranging from 1150 to 1600 °C [12,13,14,15]. Other alkali components such as Li and K have also been recorded to have volatilised at similar temperatures [15,16,17] although in the case of Li, volatilisation requires longer melt times, higher temperatures, or a reducing melting atmosphere [17]. As a general rule of thumb, the alkali volatilisation rate increases down the alkali metal series, from Li to Cs. Bingham [18] summarised literature pertaining to volatilisation from soda-lime-silica and commercial silicate glass types, which includes work by Cable and Chaudhry [19] that demonstrates the existence of a linear relationship between log (mass loss) and reciprocal temperature for evaporation of volatile species from soda-lime-silica glass melts. Cable and Chaudhry [19] studied SiO2-Al2O3-Na2O-CaO glasses and, in addition to the relationship between mass loss and temperature, they also showed that the relation between mass loss, M, and melting time at a given temperature, t, was not necessarily M ∝ t1/2, as expected for a simple diffusion-based model, and that volatilisation of Na could be described reasonably accurately by a model including both diffusion in the melt and a first-order reaction for surface loss, i.e., a modified diffusion-based model. Cable and Fernandes [20] explained that volatilisation from glass melts occurs in three separate steps: (i) diffusion of the volatile component/s through the melt to its surface; (ii) evaporation or reaction at the liquid–gas interface; and (iii) transport of the vapour away from the surface in the gas phase. The first stage is diffusion-based and gives rise to the M ∝ t1/2 relationship but, as noted by Cable and Fernandes [20], this can fail to describe data accurately in some cases. More recently, Kucuk et al. [21] studied volatilisation from SiO2-K2O and SiO2-Na2O-CaO glass melts and found similar results to Cable’s [19,20]. However, Matousek and Hlavac [22] found mass loss from SiO2-Na2O-K2O-PbO glasses, and Zhang et al. [23] found mass loss from SiO2-B2O3-SrO-BaO and SiO2-B2O3-CaO-SrO-BaO-ZnO-Al2O3-TiO2 glasses, and all obeyed the relationship M ∝ t1/2. Beerkens [24] also modelled volatilisation from silicate melts and summarised some of the available literature. The differences in results between these various studies suggest that different mechanisms determine or influence volatilisation from glass melts, with different impacts depending on glass composition, the component/s in question (e.g., a particular component such as Na, or total mass loss) and experimental conditions (e.g., static or flowing melt/atmosphere, different vessel geometries).
In the nuclear industry, the globally preferred method of long-term radionuclide immobilisation from high-level radioactive wastes (HLW) is vitrification (the process of turning the waste into a chemically and thermally stable glass waste form) [25]. Retention of radioisotopes such as 137Cs and 99Tc in the melt has proven to be a challenge in HLW vitrification [26,27,28], with experiments showing that over 95% of 99Tc will volatise at temperatures as low as 900 °C, with a melting time of 30 min [26]. As illustrated by Ojovan and Lee [29] for Na, K, Rb, Cs, Te and Mo in HLW vitrification, loss of these elements by volatilisation obeys a linear relationship between log (mass loss) and reciprocal temperature. This is consistent with the literature for commercial glass manufacture summarised above, and highlights the need to maintain radioactive waste vitrification processes at temperatures capable of melting the products whilst minimising volatilisation. However, despite this knowledge of the effects of melting temperature, relatively little research has been published on volatilisation of components from radioactive waste-type glasses as a function of melting time. Banerjee et al. [30] studied Cs volatilisation from SiO2-B2O3-Na2O-Cs2O-(CaO, BaO, ZnO) glasses relevant to radioactive waste immobilisation, and confirmed that for most of the glasses and temperatures studied, the volatilisation (measured as Cs loss) could be accurately described by the simple diffusion-based model, M ∝ t1/2 described above. The three mechanisms described by Cable and Fernandes [20] were used by Banerjee et al. [30] to describe this process, namely diffusion of Cs through the glass melt to its surface, followed by transport of Cs through the melt/vapour interface, and then transport into the atmosphere. However, some of their glasses [30] displayed deviation from this behaviour, suggesting that other processes were involved: the results were thus broadly consistent with Cable’s observations [19,20] described above. It is clear that the mechanisms governing volatilisation from glass melts are highly complex, with multiple contributing factors, and with compositional, temperature and experimental conditions dependencies that are not yet fully understood.
Volatilisation from B2O3-Li2O glass melts during XRF fused bead preparation has also been documented [31], and qualitatively shown to obey similar relationships to those above. Fused beads for oxidised samples such as minerals and oxide glasses often contain added lithium, sodium or ammonium halides (I, Br) as mould release agents [31]. These are added to facilitate release of the cooled fused beads from the mould and to prevent cracking. Claisse and Blanchette [31] discussed this in detail, noting in particular the evaporation of Li, B, halides, sulphates and Na. They also noted the need to limit fusion temperatures in order to maintain volatilisation at acceptable levels. They also stated that volatility of the release agents varies with sample and flux composition, and that “it is impossible to determine the exact amount that remains in a fusion bead to facilitate its separation” [31]. Finally, they noted that a part of the release agent is distributed uniformly in the fused bead, while part is present as a film on the surface of the bead.
The majority of previous studies, including those summarised above, have considered volatilisation of major species (e.g., B, alkalis) or total mass loss from glass melts. Few have studied, at least from a fundamental perspective, losses of particularly volatile species such as halides or sulphates, as a function of melting time or melting temperature. One such study by Tatevosyan et al. [32] considered mass loss (principally F) from SiO2-CaO-Na2O-K2O-Al2O3-F glasses, and showed a deviation from linearity when mass loss was plotted as a function of (time)1/2, i.e., a deviation from M ∝ t1/2. Another study by Parker et al. [33] on SiO2-Al2O3-Na2O-CaO-F glasses showed that, at relatively low temperatures below 950 °C, volatilisation (principally of F but also other constituents) was a diffusion-controlled process (as demonstrated by a (time)1/2 dependency), but at higher temperatures more complex behaviour was observed, involving cellular convection currents driven by surface energy and density gradients. Fluorine, as a halogen, may behave differently in structural terms and in volatilisation rates from other halogens in oxide glasses. However, fluorine can reasonably be expected to be governed by the same relationships as other halides, in terms of volatilisation from oxide glass melts. The fundamental volatilisation behaviour (e.g., in terms of time, temperature) of other halides in oxide glass melts, and particularly those halides relevant to radioactive waste vitrification (Cl and I) has thus, to date, received little attention. However, it has been demonstrated that in radioactive waste borosilicate glass melting, halogen volatilisation increases in the order F < Cl < I [34], following the same trend as the alkalis (see above).
The production of fused beads is a common method of sample preparation for XRF spectroscopy. The fused bead method is often preferred to other techniques [35,36,37,38,39] due to the ability to form a sample of the correct size, shape and finish for analysis without time-consuming sectioning and polishing, whilst reducing the environment-specific effect on the intensity of characteristic element lines [31,35,39]. With the fused bead method, the sample is mixed with a flux (e.g., lithium tetraborate, Li2B4O7), melted at high temperature, and either poured into a disc-shaped mould, or otherwise formed in the required dimensions, to form the bead. The flux is used to reduce the melting point of the sample so that the sample can be entirely and homogeneously dissolved in the matrix, and so that a bead can be produced at temperatures as low as 900–1050 °C [31,35,40]. The flux generally contains low-Z elements, which are not readily detected using laboratory-scale XRF spectrometers, e.g., Li, B and O as in lithium tetraborate, Li2B4O7. However, the presence of mould-release agents consisting of halides (I, Br) can give rise to “an efficient albeit undesirable filter of X-rays” [31] so using the smallest possible quantity of release agent is advisable [31].
The volatile nature of certain components including, but not limited to, the alkalis and boron, as described above, raises the question as to whether the very application of the fused bead process leads to analytical inaccuracies due to volatilisation during XRF fused bead sample preparation, and the extent to which this affects the results. The research presented here sought to address this question by performing XRF analysis on fused beads of standard materials of known composition. Four standard materials were chosen, all of which are British Chemical Standard Certified Reference Materials (BCS-CRMs): BCS-CRM-529 (Anorthic Feldspar) [41], BCS-CRM-532 (Swedish Feldspar) [42], BCS-CRM-375 (Soda Feldspar) [43] and BCS-CRM-525 (Low-Iron Float Glass) [44]. In order to investigate the effects of fused bead melting time on volatilisation and analytical stability and reproducibility, a number of samples were produced for each reference material; melting times ranged from 11 min to 106 min, corresponding to total process times (melting + cooling) of approximately 16 and 111 min. The volatilisation and reproducibility behaviour of each element was then studied from the XRF spectra for each reference sample and each total process time. The melting temperature, as discussed above, affects volatilisation losses but, as will be shown, it can also affect fused bead quality and analytical reproducibility. In order to focus on studying the effects of melting time in the present work, all fused beads were melted at a fixed temperature of 1065 °C. By comparison, a key relevant ISO standard method [11] stipulates the melting of fused beads at 1200 ± 50 °C for 5 min. As shown by several authors including, for example, Ojovan and Lee [29], volatilisation of alkalis from glass melts (e.g., in mg/cm2) can be expected to be one order of magnitude greater using the ISO standard [11] compared to the method we have used here, owing to the substantially higher temperatures used. However, the 5 min melting time for the ISO standard method [11] is considerably shorter than the times used in this study. Consequently, we have focussed here on determining the effects of fused bead melting time, not only in terms of the relationships governing volatilisation losses, but also on the ability to reproducibly manufacture crack-free fused beads that can be readily retrieved from the mould and which provide stable and reproducible analytical results. In planned future work we will seek to investigate the effects of fused bead melting temperature in order to provide a deeper assessment.

2. Materials and Methods

The materials used in this research were British Chemical Standard-Certified Reference Materials (BCS-CRMs) provided by the Bureau of Analyzed Samples Ltd. (BAS). The samples were Anorthic Feldspar (CRM 529 [41]), Swedish Feldspar (CRM 532 [42]), Soda Feldspar (CRM 375 [43]), and Low-Iron Float Glass (CRM 525 [44]). The certified reference analytical compositions for each CRM sample are reproduced in Table A1, Table A2, Table A3 and Table A4. The CRMs were prepared for fused bead generation by mixing approximately 1 g of sample, with approximately 10 g of lithium tetraborate (Li2B4O7) flux. The precision of weighing ensured that all mixtures were at a flux: sample ratio of 9.99 to 10.04. The flux was doped with 0.5 wt% of lithium iodide (LiI) as a non-wetting (release) and anti-cracking agent [11,31]. Attempts to make fused beads with approximately 1 g of CRM 532 resulted in fused beads cracking on cooling so the samples with this CRM were made with approximately 0.76 g of sample, to 10 g of lithium tetraborate and 0.5 wt% of lithium iodide.
The fused beads were prepared using a Claisse LeNeo Fused Bead maker [45], by melting in 5% Au–95% Pt casting bowls at 1065 °C, with fixed, programmed rocking motions during melting and fixed, programmed blown air during cooling. The total process has two elements: the melting time and the cooling time, during which the melt will be automatically poured into a 5% Au-95% Pt mould and air cooled under fixed and highly reproducible conditions [45]. The melting and total process times are detailed in Table 1. Mass loss from fusion was recorded for each fused bead. The shortest total process times used in this study, 16 min and 15 s, failed to produce fused beads with sufficient consistency, and over 50% of the beads made were subject to catastrophic cracking, either during cooling or when removed from the 5% Au-95% Pt mould. This cracking is attributed to the CRM sample materials not fully and homogeneously dissolving in the Li2B4O7 flux and thereby causing local thermal expansion variations, leading to crack formation upon cooling. Consequently, the 16 min 15 s data were not reproduced here and can be considered too brief to produce consistent and useable fused beads for feldspar and glass sample materials under the preparation conditions studied. It is possible that with higher melting temperatures, as in [11], such problems might be avoided. However, in doing so these problems may potentially be replaced by other problems associated with higher volatilisation losses [18,19,20,21,22,23,24,25,26,27,28,29,30,31,32,33].
All XRF data were collected with a PANalytical MagiX PRO XRF spectrometer (Malvern Panalytical Ltd., Malvern, UK). using a Rh anode X-ray tube. The XRF data were analysed using a modified version of the OXI program [46], a Wide Range Oxide XRF program developed and verified in-house. In this case our calibration curve for the oxide standards for the sixteen elements used in this version of OXI had multiple data points to increase accuracy. Details of these elements, numbers of data points and calibration ranges are given in Table 2 and details of the operational conditions for each of the 16 elements in the OXI program are given in Table 3. In addition to collection of XRF data on every fused bead, further XRF data for CRM-525 (Low-Iron Float Glass) were collected 4 separate times for each fused bead to enable quantification of any measurement-to-measurement variabilities which could thence be eliminated (if sufficiently small) from consideration as potential origins of any differences observed between XRF analyses for different fused bead melting times. Mass loss on fusion was established (Table A1, Table A2, Table A3 and Table A4) by mass balance before fusion and after fusion, and is reproduced here as weight (%).
Further XRF data were collected using the PANalytical standardless IQ+ software (Malvern Panalytical Ltd., Malvern, UK). This software can analyse for elements from F to Am. IQ+ results are semi-quantitative so they were not used for analyses of these samples. However, these IQ+ results were particularly useful in measuring how the intensities of the iodine Kα1 line, and hence the abundance of I in the fused beads, decreased with increasing melting time. Table 4 shows details of the operational conditions for each of the IQ+ measurements, which were carried out over 10 different energy ranges.

3. Results

Chemical Analysis of Fused Beads by X-Ray Fluorescence (XRF)

The measured chemical composition of Anorthic Feldspar (CRM-529) [41], as a function of fused bead total process time, is presented in Figure 1 with data in Table A1. The oxides with concentrations greater than 1 wt% can be considered major components, and therefore SiO2, Al2O3, CaO and Na2O are considered major constituents of Anorthic Feldspar. As total processing time (see Table 1) increased from 21 min 45 s to 27 min 45 s, the measured concentrations of CaO and Na2O decreased from 11.0 to 10.32 wt% and 6.0 to 5.4 wt%, respectively. Conversely, SiO2 concentration increased from 55.0 to 56.3 wt% whilst Al2O3 content slightly increased from 26.4 to 26.8 wt%. The apparent concentration of TiO2 as a minor constituent gradually decreased from 0.2 to 0.1 wt% and remained nearly constant beyond 65 min total process time. However, the I Lβ1,2,3 lines overlap with the Ti Kα1,2 lines, so loss of I by volatilisation is likely to be the cause of this observation and not actual volatilisation of Ti; loss of SO3 also follows the same trend but is without the complication of overlapping lines from another component. The observed deviations in K2O and Fe2O3 concentrations, over the range of melting times studied, are very small. Overall, variations in the concentrations of all oxides can be considered to be stable and closer to the certified values at fused bead total process times of 38 min 45s (34 min melting time) and greater.
The analysed oxide concentrations in Swedish Feldspar (CRM-532) [42] deviate with increasing total process time below 38 min 45 s (34 min melting time), as shown in Figure 2 with data in Table A2. The variations of SiO2 and Al2O3 concentrations exhibit opposite trends between 21min 45 s and 38 min 45 s total process time (17 and 34 min melting time), respectively. As SiO2 contents vary between 77.8 and 78.0 wt%, Al2O3 concentrations differ between 13.3 and 13.5 wt%. Both give values closer to the certified values at the shortest melting time, however, the opposite is true of the Na2O content. The analysed concentrations of K2O remain nearly constant over the range of melting times studied. The concentrations of other minor oxides such as MgO, CaO and Fe2O3 are also deemed to be essentially constant over the range of melting times. Overall, at longer melting times the major analysed oxide contents (SiO2, Al2O3, Na2O) converge towards the certified values.
The data for Soda Feldspar (CRM-375) [43] at different total process times provides oxide concentrations of Na2O, CaO and K2O that remain nearly constant, as shown in Figure 3 with data in Table A3. The analysed compositions of this CRM probably display the largest differences from the certified composition, of the four materials studied here, with overestimation of Al2O3 and Na2O and underestimation of SiO2 and K2O being notable. One potential reason might be that (as kindly noted by one reviewer) this CRM material contains many larger-sized particles. Consequently, this material may require longer fusion times to fully dissolve and homogenize in the fused bead. However, the reasons for this difference are not yet established and further research is required, including developing a clearer, quantitative understanding of particle size and melting behaviour effects of the sample material. In terms of variabilities in our analyses of this CRM material, Al2O3 and SiO2 concentrations deviate slightly for total process times shorter than 38 min 45s to 65 min 45s (34 to 61 min melting time), but these variations appear to be small compared to the differences observed in Na2O and SiO2 levels in the Anorthic Feldspar fused beads. The concentrations of MgO and Mn3O4 are very close to zero and remain constant over the range of extended melting times. Fe2O3 concentration remains unchanged at a level of ~0.1 wt% at all melting times. At longer melting times the analysed compositions do converge slightly towards the certified composition.
The chemical analysis of Low Iron Float Glass (CRM-525) [44], as a function of different total process times, is illustrated in Figure 4 with data in Table A4. The analysed SiO2 content deviates between 72.8 and 73.2 wt% at total process times between 21 min 45 s and 38 min 45 s (17 and 34 min melting time). Moreover, the concentrations of other major oxides such as Na2O, CaO and MgO fluctuate slightly below 32 min 45 s (28 min melting time). The measured SO3 content gradually decreases from 0.26 to 0.19 wt% as total process time increases from 21 min 45 s to 110 min 45 s (17 to 106 min melting time). The measured concentration of K2O remains roughly constant for all total process times. Repeated analyses (four per fused bead) were undertaken on each of the fused beads in this series, in order to assess intra-measurement variabilities. Averages of the four measurements are shown in Figure 4, and the Standard Deviations for each data point are reflected in the Y-axis error bars. In the large majority of cases, the error bars are smaller than the markers used for the corresponding data points. Overall, the shortest melting time gave an analysed composition closest to the certified composition, however, these differences were generally modest. The measured SO3 content showed a clear decrease with increasing melting time.
Figure 5 shows the loss of iodine, represented by intensity of the I Kα1 line obtained from IQ+ standardless analysis, and SO3 content analysed using the OXI program, as functions of (time)1/2. A linear relationship is clearly shown for the SO3 data with an R2 value approaching 1, however, the linear fit to the I data clearly shows a poor fit with modest R2, indicating that this behaviour cannot be fully described by a linear relationship.

4. Discussion

As shown in Figure 1, Figure 2, Figure 3 and Figure 4 and Table A1, Table A2, Table A3 and Table A4, all four CRM materials exhibited sample-to-sample fluctuations in XRF-analysed composition and differences from the certified compositions (from [41,42,43,44], reproduced in Appendix A, Table A1, Table A2, Table A3 and 
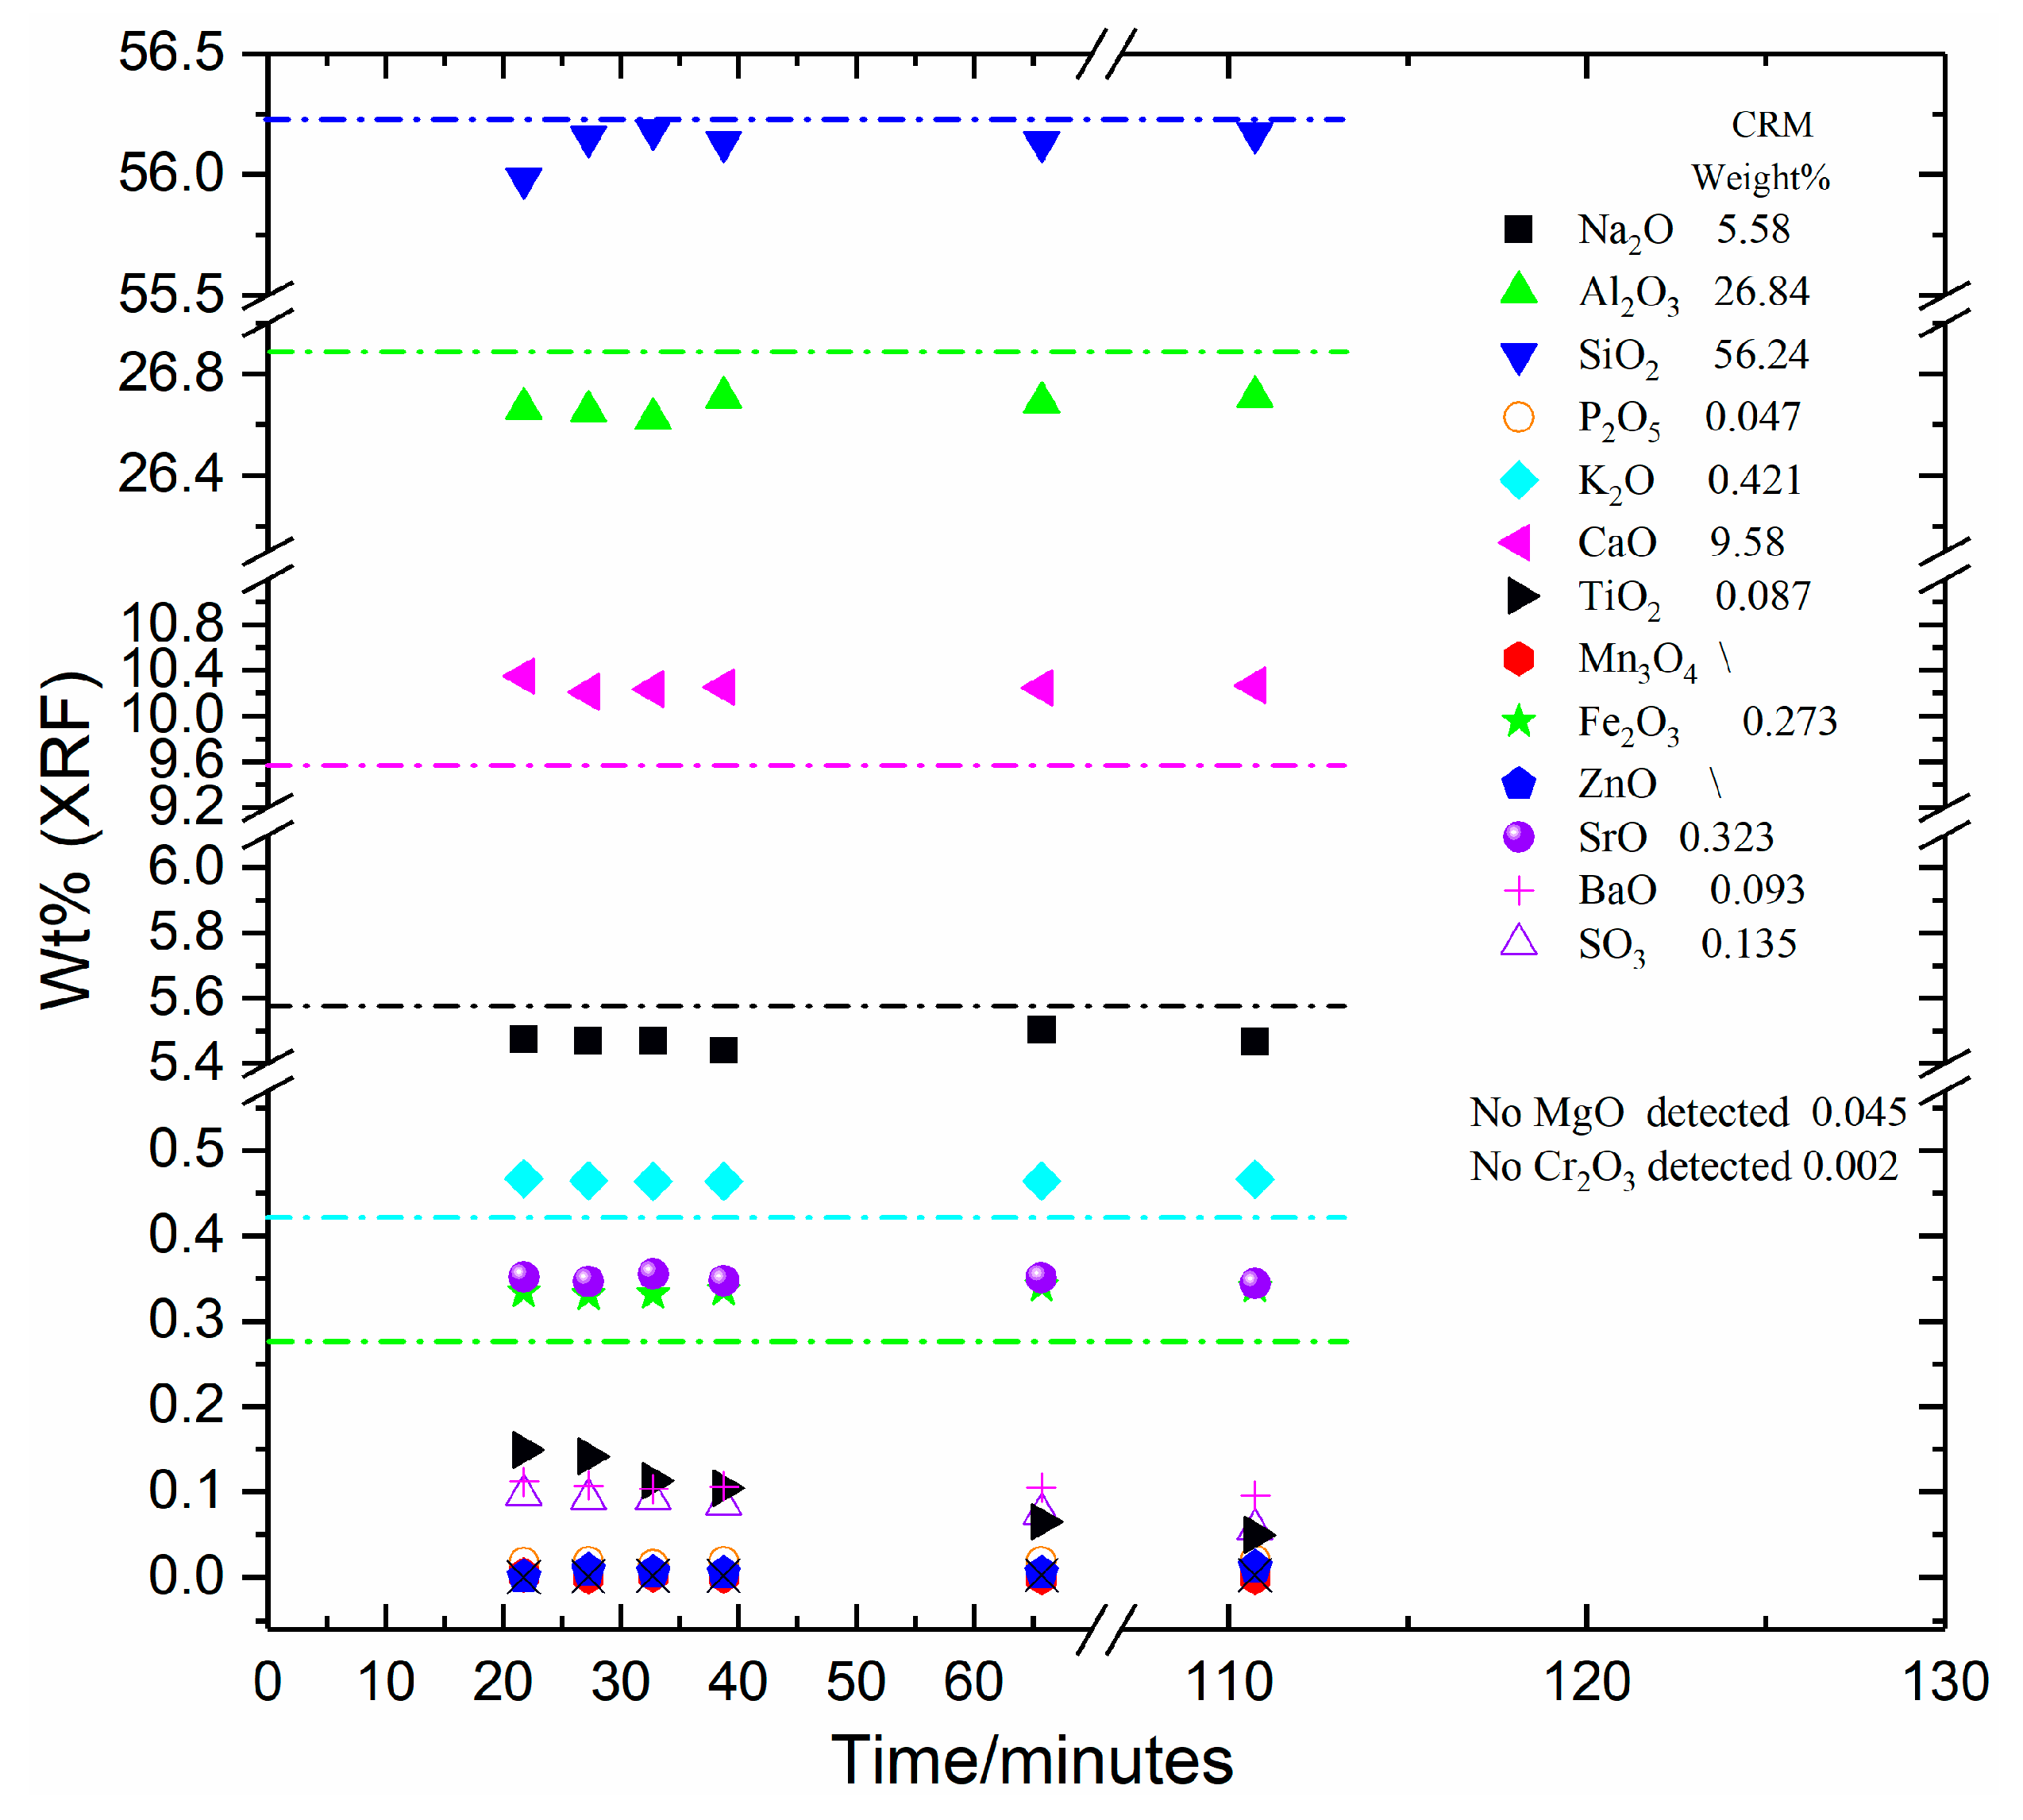
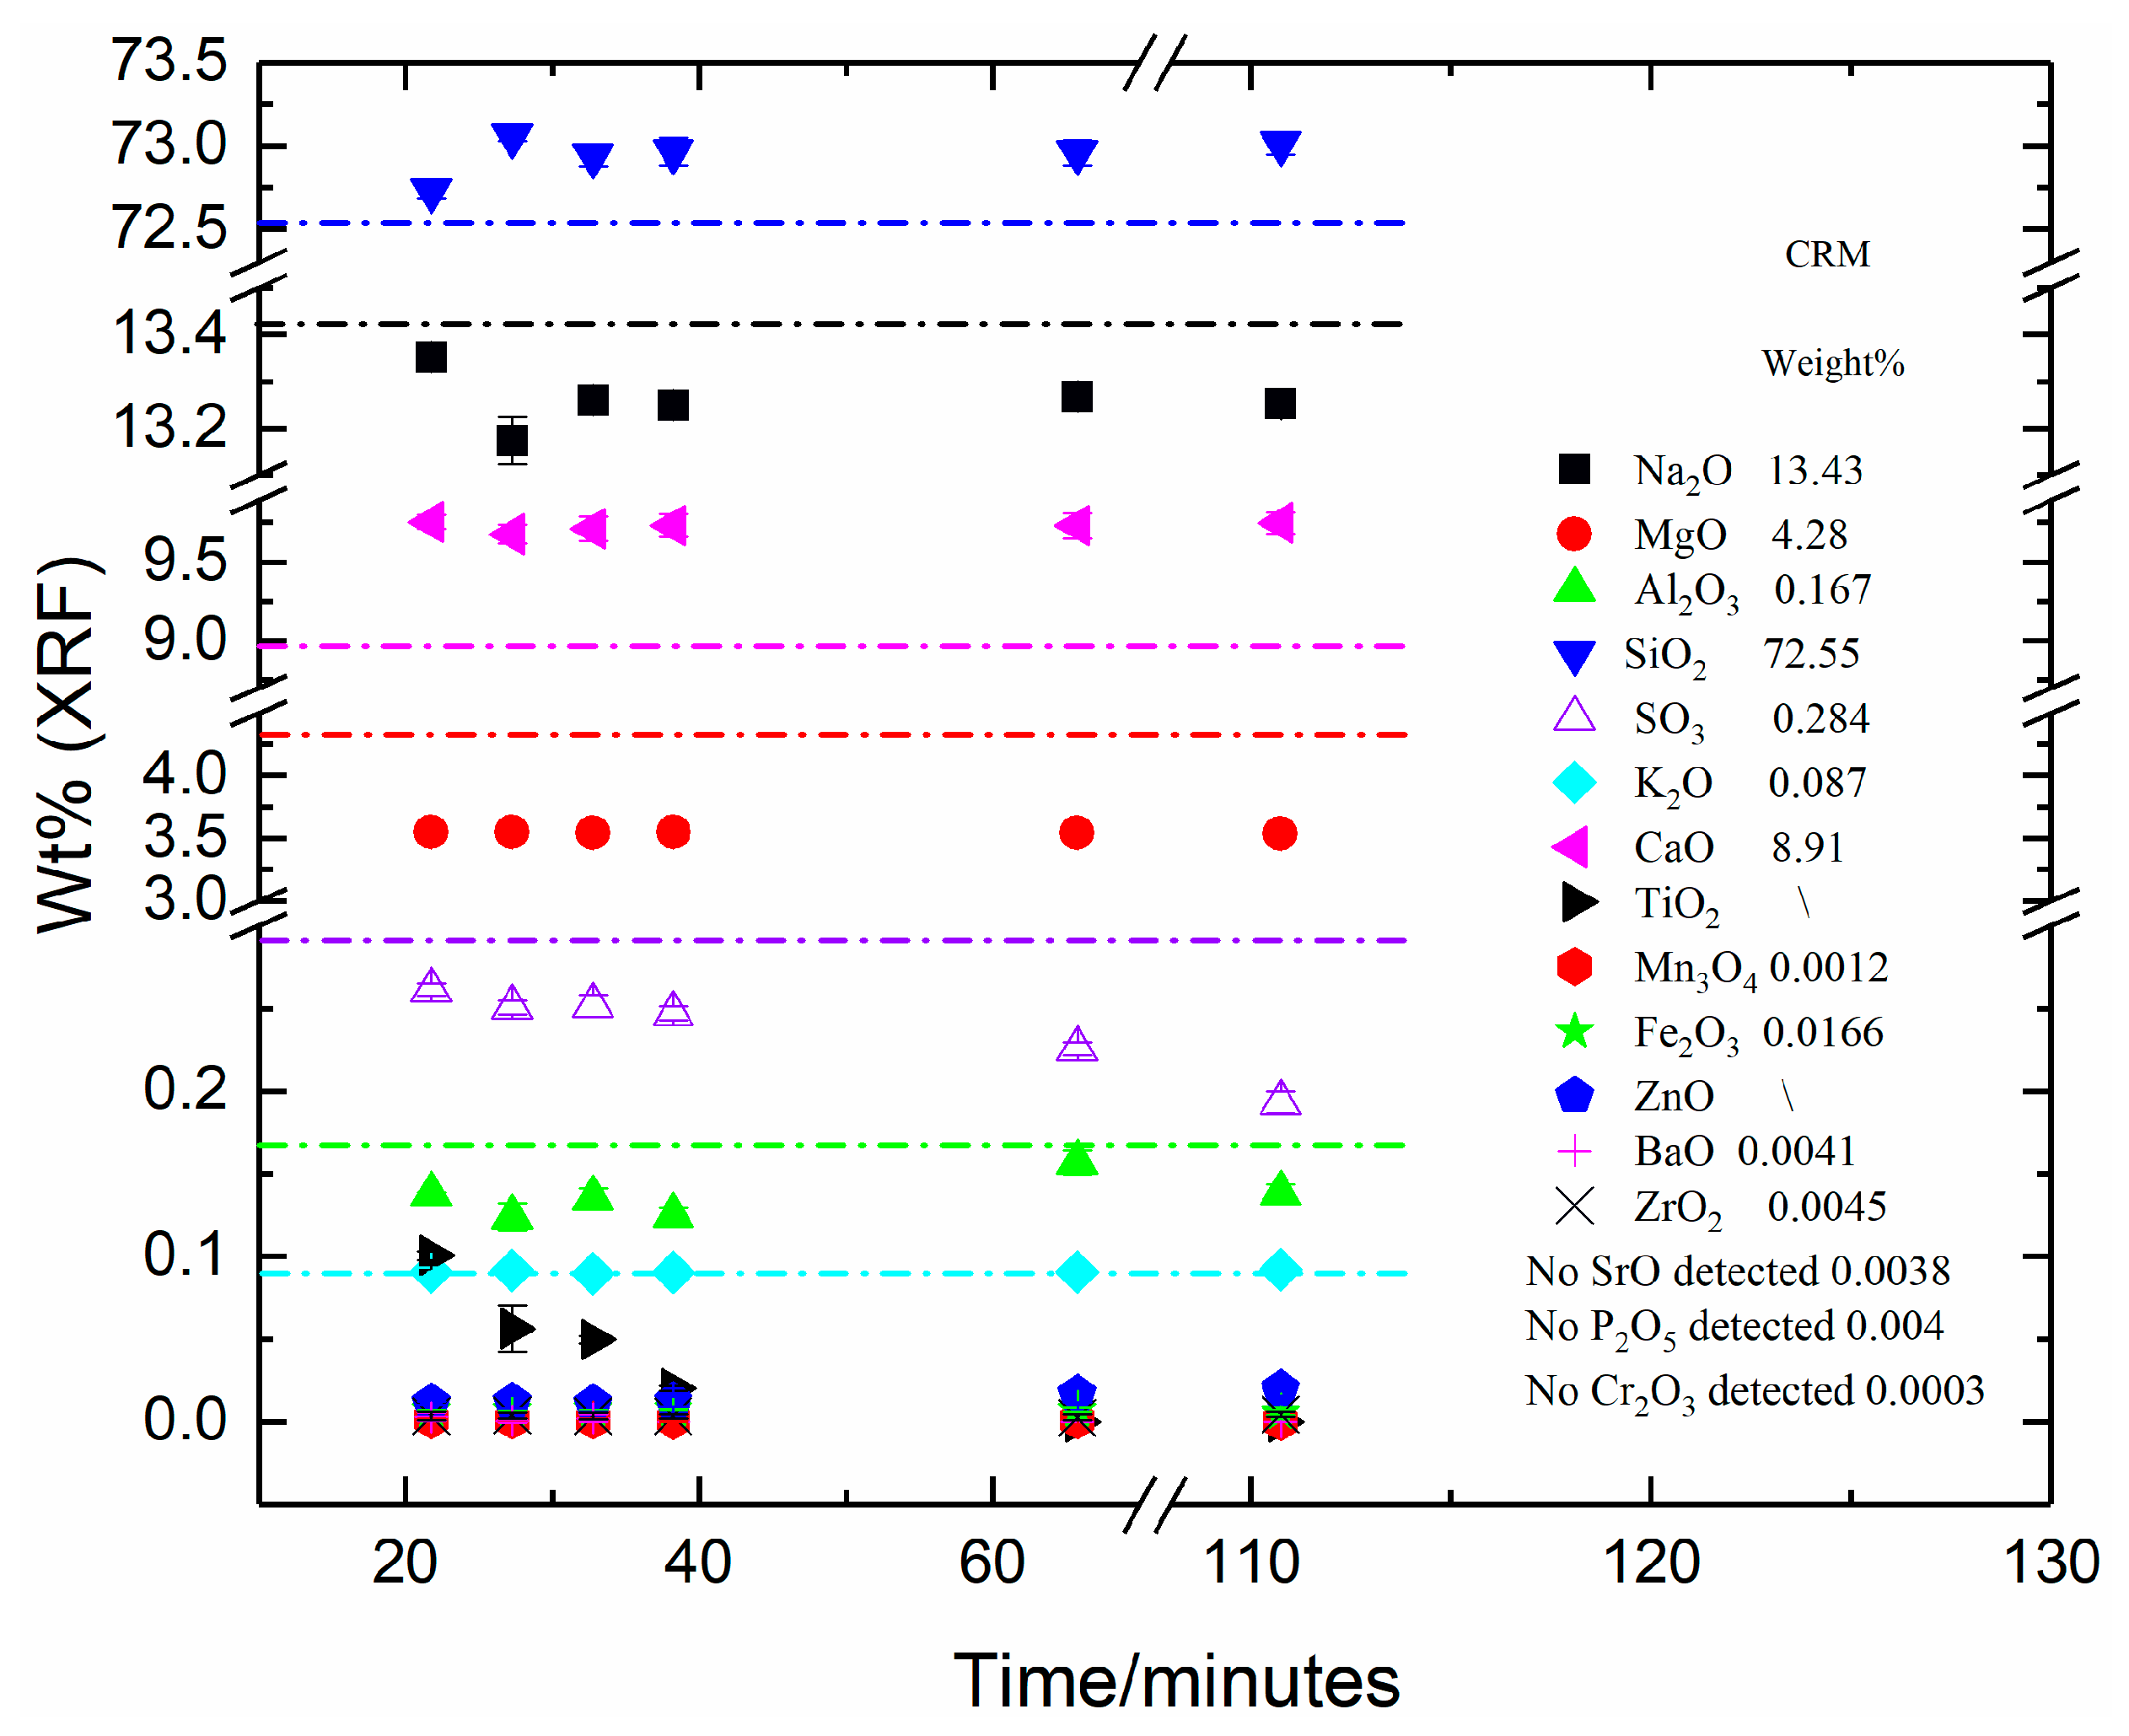
Table A4). Sample-to-sample fluctuations were notable with fused beads with shorter process times (i.e., the samples with total process times of 27 min 45 s and 21 min 45 s; the 16 min 15 s samples were too variable and often cracked during removal from the mould, so mostly these were not analysed). These differences and variabilities in XRF analysis results can be attributed to some combination of: (i) inaccuracy of the XRF OXI program; (ii) imprecision or instability of the XRF spectrometer; and/or (iii) fused bead (sample) related issues.
In order to identify the source/s of the observed differences in results, and to eliminate candidate causes along the way, we will first consider (i) above: inaccuracy (and thus imperfect calibration) of the XRF Wide Range Oxide (OXI) program we have used. Whilst, as shown in Table 2, the calibration curve contains many independent data points for most elements and is thereby considered robust, it is seen, for example, that our Wide Range Oxide (OXI) program consistently overestimated the SiO2 content of CRM-532 (Swedish Feldspar) (Figure 2) by of the order of 0.7 wt%; and underestimated the SiO2 content of CRM-375 (Soda Feldspar) (Figure 3) by of the order of 1.5 wt%. Whilst such inaccuracies are not desirable, they are particularly challenging to completely eliminate from Wide Range Oxide programs that are applied over a large range of sample compositions, as we have done here. However, inaccuracies such as these are systemic and apply to all samples measured, provided they are analysed under the same conditions, as we have carried out in this study. Hence the prospect of point (i) above being responsible for all of the variabilities observed in analysed compositions (Figure 1, Figure 2, Figure 3 and Figure 4), as a function of fused bead total process time, cannot be completely eliminated as a contributing factor, but it was demonstrably not the primary cause.
Point (ii) above, imprecision or instability of the XRF spectrometer, was directly assessed through the repeated measurements (four each) for fused beads representing each time-step for CRM-525, Low-Iron Float Glass (Figure 4, Table A4). The obtained Standard Deviations from these measurements were predominantly very low and, as shown in Figure 4 were, in most cases, smaller than the size of the data markers. Consequently, the observed variations in analysed composition were, for the most part, larger than the Standard Deviations associated with the measurements. This confirms that point (ii) can also be discounted as the main cause of the observed variations in the analysed composition as a function of fused bead total processing times–again, whilst it cannot be completely eliminated as a contributing factor, it was demonstrably not the primary cause.
Points (i) and (ii) above have been largely eliminated as the primary sources of the observed differences and variabilities in XRF analysis results shown in Figure 1, Figure 2, Figure 3 and Figure 4 and in Table A1. This leaves point (iii), fused bead (sample) related issues. An inexhaustive list of potential causes of these issues includes poorly soluble or highly refractory sample material leading to incomplete dissolution in the fused bead; chemically and/or physically inhomogeneous fused beads; contamination of the fused bead from the mould, raw materials or other sources during melting or preparation for analysis; and incorrect or imperfect placement of the fused bead inside the XRF spectrometer. The variability of analysed composition discussed above is observed for the shorter melting times for all four CRM materials, although for the CRM-525 Low-Iron Float Glass sample, the shortest melting time gave the closest analysed composition to the certified composition. This makes it unlikely that contamination or incorrect placement of the XRF samples in the spectrometer could be responsible for these changes as they are consistent and systematic. Consequently, some combination of incomplete fusion and/or inhomogeneity of the fused beads are the most likely explanations for some of the feldspar samples. As noted earlier, CRM-375 Soda Feldspar has larger particle sizes and may need longer fusion times as a result.
Volatilisation during fused bead preparation affects not only the Li2B4O7 flux and LiI mould-release/anti-cracking agent, but also certain components within the samples studied, in particular halides and sulphates but also alkalis, boron and other relatively volatile constituents [12,13,14,15,16,17,18,19,20,21,22,23,24,26,28,29,30,31,32,33,34]. In the case of the samples studied here, losses of iodine and sulphur (as SO3) were notable. The intensity of the iodine Kα1 line, and total analysed content of SO3, in various fused beads of Anorthic Feldspar (CRM-529) [41] were obtained at various fused bead melting times, and both sets of data are shown in Figure 5. Since iodine was not included in our OXI Wide Range Oxide XRF program, the extent of volatilisation of iodine in fused beads was established from the decrease in the intensity of the IKα1 line obtained using the IQ+ standardless program as the melting time increased. Iodine concentration in fused beads is shown to decrease roughly linearly (R2 = 0.861) with decreasing (time)1/2, and iodine essentially completely volatilised when (time)1/2 reached approximately 10 min1/2 (data) or 9 to 10 min1/2 (linear fit), i.e., when melting time reached approximately 80 to 100 min. This behaviour is also reflected in the analysed “apparent content” of TiO2 in all samples. As noted in Section 3, the I Lβ1,2,3 lines overlap with the Ti Kα1,2 lines, so the apparent volatilisation of Ti, as implied by the decreasing analysed TiO2 contents shown in Figure 1, Figure 2, Figure 3 and Figure 4, is readily explained by the loss of I (Figure 5) and not by the volatilisation of Ti, which is highly unlikely under these melting conditions.
As shown in Figure 5, a linear fit to the iodine loss data is imperfect, and the relationship is clearly non-linear. This has important implications for XRF fused bead preparation and also wider implications, for example for vitrification of iodine-bearing radioactive wastes. The simple diffusion-based model discussed in Section 1 does not fully describe the loss of iodine as a function of melting time, and implies that the additional mechanisms described earlier [19,20,21,30,33], including those observed for fluorine, are in evidence. Claisse and Blanchette [31] noted the presence of some of the halide (iodine here) within the fused bead and some on the surface (to promote mould release), and this may help to explain the observed deviations from linearity for iodine in Figure 5. With a film on the bead surface when molten, direct mass transfer across the liquid/gas interface will augment diffusion of iodine from within the melt to the surface. It also underlines the need to minimise melting temperatures in addition to melting times—as shown by Banerjee et al. [30] and Parker et al. [33], above certain temperatures (depending on glass composition among other factors), volatilisation rates can become non-linear and thus it may be that using a lower fusion temperature would reduce or remove the non-linear behaviour observed here (Figure 5). It is known that iodine is particularly volatile from oxide glass melts [26,34]. Conversely to the volatilisation behaviour of iodine, there is also clear evidence for the volatilisation of sulphate, SO3. However, SO3 loss displays a strongly linear relationship with (time)1/2 for the Anorthic Feldspar fused beads (CRM-529, Figure 1, Figure 5 and Table A1) and for the Low-Iron Float Glass (CRM 525 [44], Figure 4 and Table A4). This confirms that sulphate volatilisation obeys M ∝ t1/2, i.e., volatilisation of SO3 can be accurately described as a diffusion-based process. Sulphate volatilisation from silicate glass melts is well known in glass manufacture [18] and has also been documented in XRF fused bead preparation [31]. Here we have thus demonstrated that the mechanism of sulphate volatilisation is solely or predominantly diffusion based.
The loss of iodine and sulphate during fused bead melting are both governed (SO3 solely or predominantly; and I only partially), by diffusion-based mechanisms, as demonstrated by a linear relationship with (time)1/2. For iodine, additional transport mechanisms accelerate mass loss, particularly in the early stages of melting. This underlines the necessity to keep both melting times and melting temperatures to the minimum necessary to achieve good quality fused beads that provide reproducible results. It also illustrates how “over-melting” (i.e., melting for longer than necessary and/or melting hotter than necessary) of samples containing particularly volatile species such as halides and sulphates, can lead to under-estimation of the amounts originally present due to volatilisation losses which can be non-negligible, even at short melting times.
There are many variable parameters impacting upon XRF fused bead preparation quality, consistency and the accuracy, precision and repeatability of analysis [31], and here it has only been possible to study a fraction of these. As noted in Section 1, these parameters include both time and temperature of fused bead preparation, but added to this must be preparation method (e.g., manual or automatic; static or agitated; melt vessel dimensions and surface area to volume ratio) as discussed elsewhere [11,31]. Further parameters requiring attention include fused bead compositions, mixtures and media [11,31], effects of particle size of the sample material and its thermal behaviour (e.g., melting point, viscosity-temperature profile, refractoriness and/or acid-base nature [31]). Multiple analyses involving a number of different fused beads produced under the same conditions, e.g., several independently-produced CRM-525 fused beads melted for the same time under the same conditions, are also needed to further establish consistency and reproducibility of results. All of these factors are recommended for further study, and the authors aim to address the effects of more of these variable parameters in future publications.

5. Conclusions

Reproducible preparation of lithium tetraborate fused beads for XRF analysis of glass and mineral samples, studied here in the context of feldspar and glass Certified Reference Materials, is bounded in time: (i) by the need to melt sufficiently long to produce fused beads of acceptable quality and homogeneity, giving reproducible XRF analysis results; and (ii) by the need to melt sufficiently briefly to minimize losses due to volatilisation, which are not negligible (as illustrated here by loss of SO3 and I). Fused bead melting times shorter than approximately 25 min can give rise to deviations between XRF-analysed and expected compositions: deviations, which are more pronounced at even lower (≤ca. 21 min) melting times. For the feldspar samples this generally resulted in greater differences from the certified compositions. However, for the Low-Iron Float Glass Sample, this gave smaller differences between analysed and certified compositions. This general behaviour is attributed to the degree of fusion and/or fused bead homogeneity. Volatilisation losses of SO3 and, to a limited extent, I, during melting are described by a linear relationship between SO3 loss and (time)1/2. This behaviour is illustrated by loss of iodine mould-release additive and SO3 from the Anorthic Feldspar CRM sample, with further evidence of similar SO3 loss behaviour from the Low-Iron Float Glass CRM sample. The volatilisation behaviour of SO3 can thus be accurately described by a simple diffusion-based model. The volatilisation behaviour of I is more complex, indicating that additional mechanisms complement the diffusion-based mechanism. The lower and upper bounds of approximately 25 and 60 min melting time at 1065 °C, using Li2B4O7 as the fusion medium, and in the context of feldspar samples and the automated process used herein, are established. Shorter melting times favour the glass sample. These criteria strike an acceptable, if imperfect, balance between the competing factors of fused bead quality and volatilisation losses during melting and shorter or longer melting times within these limits can be considered, depending on the sample material and the priorities for analysis. Qualitatively these conclusions can be expanded to encompass other fused bead preparation methods at the same or similar temperatures. Recommendations for further research into the effects of several other variables affecting fused bead preparation, including fused bead mixtures and media, particle size effects, temperature and multiple analyses involving different fused beads produced under the same conditions, have been made.

Author Contributions

Conceptualization, A.M.T.B. and P.A.B.; methodology, A.M.T.B. and P.A.B.; sample preparation and experimentation, A.M.T.B., K.L., A.H.S. and S.V.; formal analysis, W.D. and P.A.B.; writing—original draft preparation, A.M.T.B., D.J.B., J.D.E., E.K., P.R., J.C.R., G.W.-A. and P.A.B.; writing—review and editing, A.M.T.B. and P.A.B.; supervision, P.A.B. and A.M.T.B. All authors have read and agreed to the published version of the manuscript.

Funding

This research received no external funding.

Acknowledgments

The authors are grateful to Sheffield Hallam University for support.

Conflicts of Interest

The authors declare no conflict of interest.

Appendix A

Table A1. XRF data for Anorthic Feldspar (CRM-529, [41]) as a function of total process and melt times. Data are single measurements; <l.d. = below limit of detection; n/m = not measured; * analysed TiO2 content includes contribution from I Lβ1,2,3 lines.
Total Process Time0 (CRM)21 min 45 s27 min 45 s32 min 45 s38 min 45 s65 min 45 s110 min 45 s
Total Process Time (s) 130516651965232539456645
Total Melt Time0 (CRM)17 min23 min28 min34 min61 min106 min
Total Melt Time (s) 102013801680204036606360
Mass Loss on Fusion (wt%)(LOI 0.55%)4.544.835.155.205.906.98
OxideCRM
Na2O5.585.4755.4695.4705.4365.5055.466
MgO0.045<l.d.<l.d.<l.d.<l.d.<l.d.<l.d.
Al2O326.8426.66426.65426.62426.70626.68726.711
SiO256.2455.98256.15656.18556.13456.13456.171
P2O50.0470.0170.0180.0150.0180.0180.019
SO30.1350.0970.0910.0920.0850.0740.056
K2O0.4210.4670.4640.4640.4640.4640.466
CaO9.5810.34810.21110.23710.25210.24710.267
TiO2 *0.0870.1490.1420.1130.1040.0650.049
Cr2O30.002<l.d.<l.d.<l.d.<l.d.<l.d.<l.d.
Mn3O4n/m0.0030.0010.0030.002<l.d.<l.d.
Fe2O30.2730.3340.3310.3320.3360.3410.340
ZnOn/m0.0010.0080.0060.0050.0050.012
SrO0.3230.3520.3470.3550.3470.3510.344
BaO0.0930.1120.1070.1030.1070.1050.096
ZrO2n/m00.0010.0020.0020.0030.003
Sumn/m100.000100.000100.000100.000100.000100.000
Table A2. XRF data for Swedish Feldspar (CRM-532, [42]) as a function of total process and melt times. Data are single measurements; <l.d. = below limit of detection; n/m = not measured; * analysed TiO2 content includes contribution from I Lβ1,2,3 lines.
Total Process Time0 (CRM)21 min 45 s27 min 45 s32 min 45 s38 min 45 s65 min 45 s110 min 45 s
Total Process Time (s) 130516651965232539456645
Total Melt Time0 (CRM)17 min23 min28 min34 min61 min106 min
Total Melt Time (s) 102013801680204036606360
Mass Loss on Fusion (wt%)(LOI 0.56%)6.136.697.076.987.7310.30
OxideCRM
Na2O4.354.2684.2664.2864.2834.2864.296
MgO0.1590.0690.0500.0560.0640.0550.067
Al2O313.4613.42113.37213.35013.27313.34213.374
SiO277.0777.61477.67577.69477.81577.76377.698
P2O5n/m<l.d.<l.d.<l.d.<l.d.<l.d.<l.d.
SO3n/m<l.d.<l.d.<l.d.<l.d.<l.d.<l.d.
K2O3.804.1054.1354.1334.1184.1254.115
CaO0.2120.2050.2050.2030.2040.2050.203
TiO2 *0.0190.0900.04600.0290.008<l.d.<l.d.
Cr2O30.002<l.d.<l.d.<l.d.<l.d.<l.d.<l.d.
Mn3O4n/m<l.d.0.002<l.d.<l.d.<l.d.<l.d.
Fe2O30.18130.2190.2330.2240.2230.2240.220
ZnOn/m0.002<l.d.0.0180.002<l.d.0.025
SrOn/m<l.d.<l.d.<l.d.<l.d.<l.d.<l.d.
BaO0.0150.0060.0120.0060.010<l.d.0.002
ZrO2n/m<l.d.0.003<l.d.<l.d.<l.d.<l.d.
Sumn/m100.000100.000100.000100.000100.000100.000
Table A3. XRF data for Soda Feldspar (CRM-375, [43]) as a function of total process and melt times. Data are single measurements; <l.d. = below limit of detection; n/m = not measured; * analysed TiO2 content includes contribution from I Lβ1,2,3 lines.
Total Process Time0 (CRM)21 min 45 s27 min 45 s32 min 45 s38 min 45 s65 min 45 s110 min 45 s
Total Process Time (s) 130516651965232539456645
Total Melt Time0 (CRM)17 min23 min28 min34 min61 min106 min
Total Melt Time (s) 102013801680204036606360
Mass Loss on Fusion (wt%)(LOI 0.72%)4.254.644.955.105.786.86
OxideCRM
Na2O8.8910.35510.30010.29910.30210.26210.231
MgO0.18<l.d.0.004<l.d.<l.d.<l.d.0.008
Al2O317.8919.84619.83819.76119.76519.83819.815
SiO269.2667.47867.51867.63867.66567.70067.725
P2O50.226<l.d.<l.d.<l.d.<l.d.<l.d.<l.d.
SO3n/m<l.d.<l.d.<l.d.<l.d.<l.d.<l.d.
K2O1.470.8020.8140.8110.8070.8130.811
CaO0.780.8520.8560.8570.8530.8440.850
TiO2 *0.3130.5050.4920.4710.4500.3980.394
Cr2O30.0018<l.d.<l.d.<l.d.<l.d.<l.d.<l.d.
Mn3O40.0040.0010.0030.0020.0020.0010
Fe2O30.2910.1170.1170.1170.1170.1210.121
ZnO0.00050.0150.0100.0090.0070.0020.020
SrO0.012<l.d.0.0020.001<l.d.<l.d.<l.d.
BaO0.0110.0050.0120.0040.0020.002<l.d.
ZrO20.01070.0250.0320.0310.0310.0190.026
Sumn/m100.000100.000100.000100.000100.000100.000
Table A4. XRF data for Low-Iron Float Glass (CRM-525, [44]) as a function of total process and melt times. Data are averages of 4 measurements. Calculated standard deviations shown in brackets; <l.d. = below limit of detection; n/m = not measured; * analysed TiO2 content includes contribution from I Lβ1,2,3 lines.
Total Process Time0 (CRM)21 min45 s27 min45 s32 min45 s38 min45 s65 min45 s110 min45 s
Total Process Time (s) 130516651965232539456645
Total Melt Time0 (CRM)17 min23 min28 min34 min61 min106 min
Total Melt Time (s) 102013801680204036606360
Mass Loss on Fusion (wt%)(no LOI)5.556.056.546.847.249.59
OxideCRM
Na2O13.4313.352 (0.011)13.174 (0.051)13.260 (0.013)13.249 (0.016)13.266 (0.029)13.252 (0.017)
MgO4.283.550 (0.018)3.546 (0.010)3.542 (0.008)3.549 (0.006)3.545 (0.032)3.536 (0.011)
Al2O30.1670.138 (0.001)0.124 (0.008)0.135 (0.006)0.125 (0.004)0.157 (0.008)0.138 (0.005)
SiO272.5572.728 (0.040)73.057 (0.026)72.938 (0.059)72.965 (0.083)72.959 (0.076)73.012 (0.068)
P2O50.004<l.d.<l.d.<l.d.<l.d.<l.d.<l.d.
SO30.2840.261 (0.004)0.251 (0.004)0.252 (0.006)0.247 (0.004)0.226 (0.004)0.193 (0.007)
K2O0.0870.090 (0.003)0.092 (0.002)0.090 (0.003)0.090 (0.002)0.091 (0.001)0.092 (0.002)
CaO8.919.754 (0.044)9.676 (0.059)9.708 (0.078)9.730 (0.072)9.729 (0.079)9.747 (0.069)
TiO2 *n/m0.101 (0.003)0.056 (0.014)0.050 (0.002)0.020 (0.001)0.000 (0.000)0.000 (0.000)
Cr2O30.0003<l.d.<l.d.<l.d.<l.d.<l.d.<l.d.
Mn3O40.00120.001 (0.000)0.001 (0.001)0.001 (0.001)0.001 (0.001)0.001 (0.000)0.000 (0.000)
Fe2O30.01660.007 (0.000)0.007 (0.000)0.007 (0.000)0.008 (0.001)0.007 (0.001)0.006 (0.002)
ZnOn/m0.011 (0.001)0.012 (0.004)0.011 (0.004)0.012 (0.003)0.017 (0.005)0.020 (0.004)
SrO0.0038<l.d.<l.d.<l.d.<l.d.<l.d.<l.d.
BaO0.00410.003 (0.002)0.001 (0.001)0.002 (0.002)0.000 (0.000)0.000 (0.000)0.000 (0.000)
ZrO20.00450.003 (0.002)0.004 (0.002)0.003 (0.002)0.003 (0.001)0.003 (0.002)0.004 (0.002)
Sumn/m100.000100.000100.000100.000100.000100.000

References

  1. Jenkins, R. X-Ray Fluorescence Spectrometry, 2nd ed.; Wiley-Interscience: Hoboken, NJ, USA, 2012. [Google Scholar]
  2. Shackley, M.S. (Ed.) X-Ray Fluorescence Spectrometry (XRF) in Geoarchaeology; Springer: New York, NY, USA, 2011. [Google Scholar]
  3. Ramsey, M.H.; Potts, P.J.; Webb, P.C.; Watkins, P.; Watson, J.S.; Coles, B.J. An objective assessment of analytical method precision: Comparison of ICP-AES and XRF for the analysis of silicate rocks. Chem. Geol. 1995, 124, 1–19. [Google Scholar] [CrossRef]
  4. Marguí, E.; Van Grieken, R. X-Ray Fluorescence Spectrometry and Related Techniques, an Introduction; Momentum Press: New York, NY, USA, 2013. [Google Scholar]
  5. Austin, M.J.; Fletcher, W.W.; Hickson, K.; Leech, R.J. Mathematical correction of matrix effects in the X-ray fluorescence analysis of soda-lime-silica glasses. Glass Technol. 1971, 12, 65–71. [Google Scholar]
  6. Fletcher, W.W. An international comparison of the X-ray fluorescence and wet chemical analyses of two soda-lime-magnesia-silica glasses. Glass Technol. 1976, 17, 226–230. [Google Scholar]
  7. West, M. A quality system for the production and determination of the elemental composition of two coloured soda–lime–silica glass reference materials. Glass Technol. 2001, 42, 109–112. [Google Scholar]
  8. BSI Standards, BS 2975-2:2008. Sampling and Analysis of Glass-Making Sands, Part 2: Methods for Chemical Analysis; The British Standards Institute: London, UK, 2008. [Google Scholar]
  9. West, M. Practical guide for the assessment of glass making sands: Part 2—Chemical analysis. Glass Technol. Eur. J. Glass Sci. Technol. A 2010, 51, 103–115. [Google Scholar]
  10. West, M.; Jamieson, S.; Flower, M.; Jones, S. Practical guide for the assessment of glassmaking limestones and dolomites: Part 2—chemical analysis. Glass Technol. Eur. J. Glass Sci. Technol. A 2014, 55, 37–48. [Google Scholar]
  11. BSI Standards. BS EN ISO 12677:2011 Incorporating Corrigendum March 2014. In Chemical Analysis of Refractory Products by X-Ray Fluorescence (XRF)—Fused Cast-Bead Method; The British Standards Institute: London, UK, 2014. [Google Scholar]
  12. Vance, E.R.; Hayward, P.J.; Hamon, R.F. Volatile Losses from Sphene Glass-Ceramic and Borosilicate Glass Melts. J. Am. Ceram. Soc. 1988, 71, 318–320. [Google Scholar] [CrossRef]
  13. Snyder, M.J.; Mesko, M.G.; Shelby, J.E. Volatilization of boron from E-glass melts. J. Non-Cryst. Solids 2006, 352, 669–673. [Google Scholar] [CrossRef]
  14. Angel, P.W.; Cooper, A.R. Effect of melting time and temperature on properties of a sodium borate glass. J. Non-Cryst. Solids 1997, 221, 70–77. [Google Scholar] [CrossRef]
  15. Van Limpt, H.; Beerkens, R.; Verheijen, O. Models and experiments for sodium evaporation from sodium-containing silicate melts. J. Am. Ceram. Soc. 2006, 89, 3446–3455. [Google Scholar] [CrossRef]
  16. van Limpt, H.; Beerkens, R. Evaporation experiments and modelling for glass melts. Glass Technol. 2007, 48, 113–118. [Google Scholar]
  17. Sossi, P.A.; Klemme, S.; O′Neill, H.S.C.; Berndt, J.; Moynier, F. Evaporation of moderately volatile elements from silicate melts: Experiments and theory. Geochim. Cosmochim. Acta. 2019, 260, 204–231. [Google Scholar] [CrossRef]
  18. Bingham, P.A. Design of new energy-friendly compositions. In Fiberglass and Glass Technology, Energy-Friendly Compositions and Applications; Wallenberger, F.T., Bingham, P.A., Eds.; Springer: New York, NY, USA, 2010. [Google Scholar]
  19. Cable, M.; Chaudhry, M.A. Volatilisation from soda-lime-silica melts at one atmosphere and reduced pressues. Glass Technol. 1975, 16, 125–134. [Google Scholar]
  20. Cable, M.; Fernandes, M.H.V. The volatilisation of molten sodium metaborate. Glass Technol. 1987, 28, 135–140. [Google Scholar]
  21. Kucuk, A.; Clare, A.G.; Jones, L.E. Differences between surface and bulk properties of glass melts I. Compositional differences and influence of volatilization on composition and other physical properties. J. Non-Cryst. Solids 2000, 261, 28–38. [Google Scholar]
  22. Matousek, J.; Hlavac, J. A study of the volatilisation of lead glass. Glass Technol. 1971, 12, 103–106. [Google Scholar]
  23. Zhang, T.; Fahrenholtz, W.G.; Reis, S.T.; Brow, R.K. Borate volatility from SOFC sealing glasses. J. Am. Ceram. Soc. 2008, 91, 2564–2569. [Google Scholar] [CrossRef]
  24. Beerkens, R.G.C. Modelling the kinetics of volatilization from glass melts. J. Am. Ceram. Soc. 2001, 84, 1952–1960. [Google Scholar] [CrossRef]
  25. Gin, S.; Jollivet, P.; Tribet, M.; Peuget, S.; Schuller, S. Radionuclides containment in nuclear glasses: An overview. Radiochim. Acta. 2017, 105, 927–959. [Google Scholar] [CrossRef]
  26. Langowski, M.H.; Darab, J.G.; Smith, P.A. Volatility Literature of Chlorine, Iodine, Cesium, Strontium, Technetium, and Rhenium; Technetium and Rhenium Volatility Testing; Pacific Northwest National Laboratory: Richland, WA, USA, 1996; PNNL-11052. [Google Scholar]
  27. Jin, T.; Chun, J.; Dixon, D.R.; Kim, D.; Crum, J.V.; Bonham, C.C.; VanderVeer, B.J.; Rodriguez, C.P.; Weese, B.L.; Schweiger, M.J.; et al. Melter feed viscosity during conversion to glass: Comparison between low-activity waste and high-level waste feeds. J. Am. Ceram. Soc. 2018, 101, 1880–1891. [Google Scholar] [CrossRef]
  28. Matlack, K.S.; Pegg, I.L.; D′Angelo, N.; Bardakci, T.; Joseph, I.; Muller, I.S.; Callow, R.A. Improving Technetium Retention in Hanford LAW Glass—Phase 2; Office of River Protection: Richland, WA, USA, 2011; ORP-62357. [Google Scholar]
  29. Ojovan, M.I.; Lee, W.E. An Introduction to Nuclear Waste Immobilisation, 2nd ed.; Elsevier: Amsterdam, The Netherlands, 2014. [Google Scholar]
  30. Banerjee, D.; Josepth, A.; Sudarsan, V.K.; Wattal, P.K.; Das, D. Effect of compostion and temperature on volatilization of Cs from borosilicate glasses. J. Am. Ceram. Soc. 2012, 95, 1284–1289. [Google Scholar] [CrossRef]
  31. Claisse, F.; Blanchette, J.S. Physics and Chemistry of Borate Fusion: Theory and Application, 3rd ed.; Katanax Inc.: Metuchen, NJ, USA, 2016. [Google Scholar]
  32. Tatevosyan, K.M.; Manvelyan, G.G.; Melik-Akhnasaryan, A.F. Investigating the volatilization of fluorine during the melting of milk glass. Glass Ceram. 1965, 22, 511–513. [Google Scholar] [CrossRef]
  33. Parker, J.M.; Al-Dulaimy, J.A.M.; Juma′a, Q.A. Volatilisation from fluoride opal melts. Glass Technol. 1984, 25, 180–187. [Google Scholar]
  34. Hrma, P. Retention of Halogens in Waste Glass, Report PNNL-19361; Pacific Northwest National Laboratory: Richland, WA, USA, 2010. [Google Scholar]
  35. Nakayama, K.; Nakamura, T. Calibrating standards using chemical reagents for glass bead x-ray fluorescence analyses of geochemical samples. X-Ray Spectrom. 2008, 37, 204–209. [Google Scholar] [CrossRef]
  36. Nakayama, K.; Wagatsuma, K. A new sample preparation method using borate fusion for x-ray fluoresence analysis of vanadium, chromium, cobalt, molybdenum, and tungsten in high-speed steel. ISIJ Int. 2016, 56, 2330–2332. [Google Scholar] [CrossRef] [Green Version]
  37. Ogasawara, M.; Mikoshiba, M.; Geshi, N.; Shimoda, G.; Ishizuka, Y. Optimization of analytical conditions for major element analysis of geological samples with XRF using glass beads. Bull. Geol. Surv. Jpn. 2018, 69, 91–103. [Google Scholar] [CrossRef] [Green Version]
  38. Hernández Caraballo, E.A.; Domínguez, J.R.; Alvarado, J. Determination of Cd, Pb, and Zn in sediment reference materials by AAS after alkaline fusion dissolution with lithium tetraborate. At. Spectrosc. 2000, 21, 132–135. [Google Scholar]
  39. Loubser, M. Chemical and Physical Aspects of Lithium Borate Fusion. Master’s Thesis, University of Pretoria, Pretoria, South Africa, 2009. [Google Scholar]
  40. Hooper, P.R.; Atkins, L. The preparation of fused samples in X-ray fluorescence analysis. Mineral. Mag. 1969, 37, 409–413. [Google Scholar] [CrossRef]
  41. Bureau of Analysed Samples Ltd. Catalogue # 882, Anorthic Feldspar, BCS-CRM 529. 2020, pp. 3–4. Available online: https://www.basrid.co.uk/images/bascertificates2013/bcs_ss-crm/BCS-CRM%20529%20Jul2019.pdf (accessed on 15 May 2020).
  42. Bureau of Analyzed Samples Ltd. Catalogue # 882, Swedish Feldspar, BCS-CRM 532. 2020, pp. 3–4. Available online: https://www.basrid.co.uk/images/bascertificates2013/bcs_ss-crm/BCS-CRM%20532%20Jul2019.pdf (accessed on 15 May 2020).
  43. Bureau of Analyzed Samples Ltd. Catalogue # 882, Soda Feldspar, BCS-CRM 375. 2020, pp. 3–4. Available online: https://www.basrid.co.uk/images/bascertificates2013/bcs_ss-crm/BCS-CRM%20375_1%20Nov2004.pdf (accessed on 15 May 2020).
  44. Bureau of Analyzed Samples Ltd. Catalogue # 882, Low-Iron Float Glass, BCS-CRM 525. 2020, pp. 3–4. Available online: https://www.basrid.co.uk/images/bascertificates2013/bcs_ss-crm/BCS-CRM%20525%20Jul2017.pdf (accessed on 15 May 2020).
  45. Malvern Panalytical; LeNeo® Fusion Instrument: Malvern, UK, 2017.
  46. Giles, H.L.; Hurley, P.W.; Webster, H.W.M. Simple approach to the analysis of oxides, silicates and carbonates using x-ray fluorescence spectrometry. X-Ray Spectrom. 1995, 24, 205–218. [Google Scholar] [CrossRef]
Figure 1. XRF OXI results for Certified Reference Material (CRM)-529 [41] (Anorthic Feldspar) as a function of total process time. Error bars are smaller than the data markers. Horizontal dotted lines indicate the certified composition of CRM-529. Analysed TiO2 content includes contribution from I Lβ1,2,3 lines.
Minerals 10 00442 g001
Figure 2. XRF OXI results for CRM-532 [42] (Swedish Feldspar) as a function of total process time. Error bars are smaller than the data markers. Horizontal lines indicate the certified composition of CRM-532. Analysed TiO2 content includes contribution from I Lβ1,2,3 lines.
Minerals 10 00442 g002
Figure 3. XRF OXI results for CRM-375 [43] (Soda Feldspar) as a function of total process time. Error bars are smaller than the data markers. Horizontal lines indicate the certified composition of CRM-375. Analysed TiO2 content includes contribution from I Lβ1,2,3 lines.
Minerals 10 00442 g003
Figure 4. XRF OXI results for CRM-525 [44] (Low-Iron Float Glass) as a function of total process time. Error bars are smaller than the data markers except where shown. Horizontal lines indicate the certified composition of CRM-525. Analysed TiO2 content includes contribution from I Lβ1,2,3 lines.
Minerals 10 00442 g004
Figure 5. Relative intensity of iodine Kα1 line (IQ+ program) and analysed SO3 content (OXI program), measured for Anorthic Feldspar (CRM-529 [40]) fused bead samples as a function of (melting time)1/2. Linear fits and associated R2 values are marked.
Minerals 10 00442 g005
Table 1. Sample melting and cooling profiles used to generate the fused beads.
Total Process TimeRemoval/Cooling TimeTotal Melting Time
16 min 15 s4 min 45 s11 min 30s
21 min 45 s4 min 45 s17 min
27 min 45 s4 min 45 s23 min
32 min 45 s4 min 45 s28 min
38 min 45 s4 min 45 s34 min
65 min 45 s4 min 45 s61 min
110 min 45 s4 min 45 s106 min
Table 2. Numbers of data points and calibration ranges for the elemental oxide standards used in our OXI Wide Range Oxide XRF program.
OxideCalibration Curve Data PointsCalibration Range (wt%)
Na2O100.0–52.7
MgO90.0–100.0
Al2O3100.0–100.0
SiO2100.0–100.0
P2O550.0–24.9
SO330.0–4.7
K2O90.0–49.1
CaO100.0–57.7
TiO280.0–9.9
Cr2O340.0–5.9
Mn3O440.0–100.0
Fe2O3100.0–100.0
ZnO20.0–24.9
SrO40.0–59.3
ZrO230.0–10.5
BaO60.0–50.0
Table 3. Operational conditions for the XRF OXI program. Rh-anode X-ray tube used for these scans. Al tube filter is 200 µm thick; brass tube filter is 100 µm thick. F = flow detector; D = duplex detector; S = scintillator detector. The flow detector uses an Ar-CH4 gas mixture.
ChannelX-Ray LineCrystalCollimatorDetectorTube FilterTube kVTube mA
NaNa KαPX1700 µmFNone32125
MgMg KαPX1700 µmFNone32125
AlAl KαPE 002300 µmFNone32125
SiSi KαInSb 111-C700 µmFNone32125
PP KαGe 111300 µmFNone32125
SS KαGe 111300 µmFNone32125
KK KαLiF 200300 µmFNone32125
CaCa KαLiF 200300 µmFNone32125
TiTi KαLiF 200300 µmFNone40100
CrCr KαLiF 220150 µmDNone5080
MnMn KαLiF 200300 µmDAl6066
FeFe KαLiF 200300 µmDAl6066
ZnZn KαLiF 200300 µmSBrass6066
SrSr LαInSb 111-C700 µmFNone32125
ZrZr LαGe 111300 µmFNone32125
BaBa Lβ1LiF 200300 µmDNone5080
Table 4. Operation conditions for the XRF scans used in the IQ+ program. Rh anode X-ray tube used for these scans. Collim. = collimator, Detect. = detector. Al tube filter is 200µm thick, brass tube filter is 100µm thick for scan number 1 and is 300µm thick for scan number 2. F = flow detector, D = duplex detector, S = scintillator detector. The flow detector uses an Ar-CH4 gas mixture.
ScanKα RangeLα RangeCrystalCollim.Detect.Tube FilterTube kVTube mA
1Te-Ce-LiF 220150 µmSBrass6040
2Mo-I-LiF 200150 µmSBrass6040
3Kr-TcRa-AmLiF 220150 µmSAl6040
4Zn-RbRe-ULiF 220150 µmSAl6040
5V-CuPr-WLiF 220150 µmDNone5048
6K-VIn-CeLiF 200150 µmFNone4060
7P-ClZr-RuGe 111300 µmFNone4060
8Si-SiRb-SrPE 002300 µmFNone4060
9Al-AlBr-BrPE 002300 µmFNone4060
10F-MgMn-SePX1150 µmFNone4060

