Article

A Microfluidic Biosensor Based on Magnetic Nanoparticle Separation, Quantum Dots Labeling and MnO2 Nanoflower Amplification for Rapid and Sensitive Detection of Salmonella Typhimurium

1
Key Laboratory of Agricultural Information Acquisition Technology, Ministry of Agriculture and Rural Affairs, China Agricultural University, Beijing 100083, China
2
Key Laboratory of Modern Precision Agriculture System Integration Research, Ministry of Education, China Agricultural University, Beijing 100083, China
3
Veterinary Laboratory, Hebei Animal Disease Control Center, Shijiazhuang 050035, China
*
Author to whom correspondence should be addressed.
Micromachines 2020, 11(3), 281; https://doi.org/10.3390/mi11030281
Submission received: 15 February 2020 / Revised: 3 March 2020 / Accepted: 5 March 2020 / Published: 9 March 2020
(This article belongs to the Special Issue Biosensors for Pathogen Detection, Volume II)

Abstract

:
Screening of foodborne pathogens is an effective way to prevent microbial food poisoning. A microfluidic biosensor was developed for rapid and sensitive detection of Salmonella Typhimurium using quantum dots (QDs) as fluorescent probes for sensor readout and manganese dioxide nanoflowers (MnO2 NFs) and as QDs nanocarriers for signal amplification. Prior to testing, amino-modified MnO2 nanoflowers (MnO2-NH2 NFs) were conjugated with carboxyl-modified QDs through EDC/NHSS method to form MnO2-QD NFs, and MnO2-QD NFs were functionalized with polyclonal antibodies (pAbs) to form MnO2-QD-pAb NFs. First, the mixture of target Salmonella Typhimurium cells and magnetic nanoparticles (MNPs) modified with monoclonal antibodies (mAbs) was injected with MnO2-QD-pAb NFs into a microfluidic chip to form MNP-bacteria-QD-MnO2 complexes. Then, glutathione (GSH) was injected to dissolve MnO2 on the complexes into Mn2+, resulting in the release of QDs. Finally, fluorescent intensity of the released QDs was measured using the fluorescent detector to determine the amount of Salmonella. A linear relationship between fluorescent intensity and bacterial concentration from 1.0 × 10² to 1.0 × 10⁷ CFU/mL was found with a low detection limit of 43 CFU/mL and mean recovery of 99.7% for Salmonella in spiked chicken meats, indicating the feasibility of this biosensor for practical applications.

1. Introduction

Food safety has become one of the most important issues in the world. Foodborne pathogenic bacteria are the main cause of foodborne illnesses, including Escherichia coli O157:H7, Listeria monocytogenes, and Salmonella etc. At present, available methods for detecting these bacteria include culture plating, enzyme-linked immunosorbent assay (ELISA), and polymerase chain reaction (PCR), etc. However, they either require a long time, need professional operation, or lack sensitivity. Therefore, simple, fast and sensitive methods for pathogenic bacteria detection are needed to ensure food safety.
In recent years, various biosensors have been reported for determination of foodborne bacteria, such as electrochemical [1,2], quartz crystal microbalance [3,4] and surface plasmon resonance [5,6], etc. They have attracted great attention because of their simple operation, short time, miniaturized size, and high sensitivity. Optical biosensors mainly rely on the measurement of absorbance [7,8], fluorescence [9,10] or Raman scattering [11,12]. Among them, fluorescent biosensors have shown their characteristics of contactless detection, high sensitivity, and inexpensive instrumentation. To date, many fluorescent materials have been employed to develop various fluorescent biosensors, including organic dyes [13,14], up-converting nanoparticles [15,16] and fluorescent microspheres [17,18], etc. As is well known, quantum dots (QDs) are an excellent fluorescent probe with the advantages of wide excitation range, strong fluorescent signal and long fluorescent lifetime, and are often used for fluorescent biosensing [19,20,21].
To make better use of QDs, they are often combined with other functional nanomaterials, such as Graphene and TiO2, to improve the sensitivity [22,23]. As an easy-to-synthesize and non-toxic nanomaterial with high specific surface area, manganese dioxide nanoflowers (MnO2 NFs) have been used to develop biosensors for detection of different targets, such as Tumor cells, GSH and glucose [24,25,26]. Besides, MnO2 can be easily reduced to Mn2+ using glutathione (GSH) [27], H2O2 [28], thiocholine [29], etc., resulting in decomposition of MnO2 NFs.
In the past decades, microfluidic chips have drawn numerous attentions in biochemical analysis field due to high integration, complete automation and small size [30,31], and have been applied for detecting tumor cells [32], proteins [33] and pathogens [34,35,36,37], etc. An interesting study was a microfluidic chip containing a passive micromixer with triangular baffles and circular obstructions, which was demonstrated with a high mixing index of 0.99 under optimal conditions [38]. Therefore, the combination of QDs labeling, MnO2 decomposition and microfluidic chip might be a promising method to detect foodborne pathogens with higher sensitivity, easier operation and shorter time.
In this study, we developed an optical biosensor using QDs for fluorescent labeling, MnO2 NFs for signal amplification, and microfluidic chip for automatic operation to rapidly and sensitively determine Salmonella Typhimurium. As shown in Scheme 1, the bacterial sample was first injected with MnO2-QDs-pAb NFs and magnetic nanoparticles (MNPs) modified with monoclonal antibody against Salmonella Typhimurium into the microfluidic chip. Then, the MNP-bacteria-QD-MnO2 complexes were formed after efficient mixing and sufficient incubation. After the complexes were captured in the separation chamber using the external magnetic field, GSH was finally injected into the chamber to decompose the MnO2 NFs into Mn2+ for releasing the QDs, whose fluorescent intensity was measured by the optical detector to determine the amount of the Salmonella cells.

2. Materials and Methods

2.1. Materials

Phosphate buffered saline (PBS, 10 mM, pH 7.4) from Sigma Aldrich (St. Louis, MO, USA) was used as a buffer solution. KMnO4 from Sinopharm chemical (Beijing, China), and HCl and polyvinylpyrrolidone (PVP) from Sigma Aldrich (St. Louis, MO, USA) were used to synthesize MnO2 NFs. (3-aminopropyl) triethoxysilane (APTES) from Aladdin (Shanghai, China) was used to modify MnO2 NFs with amino groups. The carboxylated CdSe/ZnS core/shell QDs (emission wavelength: 651 nm, concentration: 1 µM) from Mesolight (Suzhou, China) were used as fluorescent probes. The monoclonal antibodies against Salmonella (mAbs, 1 mg/mL) from Meridian (Memphis, TN, USA) and the polyclonal antibodies against Salmonella (pAbs, 2.5 mg/mL) from Fitzgerald (Acton, MA, USA) were used to specifically recognize the Salmonella Typhimurium cells. N-(3-Dimethylaminopropyl)-N’-ethylcarbodiimide hydrochloride (EDC·HCl) and N-Hydroxysulfosuccinimide sodium (NHSS) from Sigma Aldrich (St. Louis, MO, USA) were used to prepare theMnO2-QD-pAb NFs. The biotin labeling kit from Elabscience (Wuhan, China) was used to biotinylate the mAbs. The streptavidin-modified MNPs with diameters of 150 nm from Ocean Nanotech (MHS-150-10, San Diego, CA, USA) were used to magnetically separate the Salmonella cells. Bovine serum albumin (BSA) from Coolaber (Beijing, China) was used for blocking. Luria-Bertani (LB) medium from Aoboxing Biotech (Beijing, China) was used for bacterial culture. The silicone elastomer kit (Sylgard 184) from Dow Corning (Midland, MI, USA) was used to fabricate the poly (dimethoxy) silane (PDMS) channel. The Objet24 3D printer from Stratasys (Eden Prairie, MN, USA) was used to fabricate the mold of the channel. The NdFeB magnets (grade: N52) bought locally were used to generate the external magnetic field. Deionized water produced by Advantage A10 from Millipore (18.2 MΩ∙cm, Billerica, MA, USA) was used to prepare all the solutions.

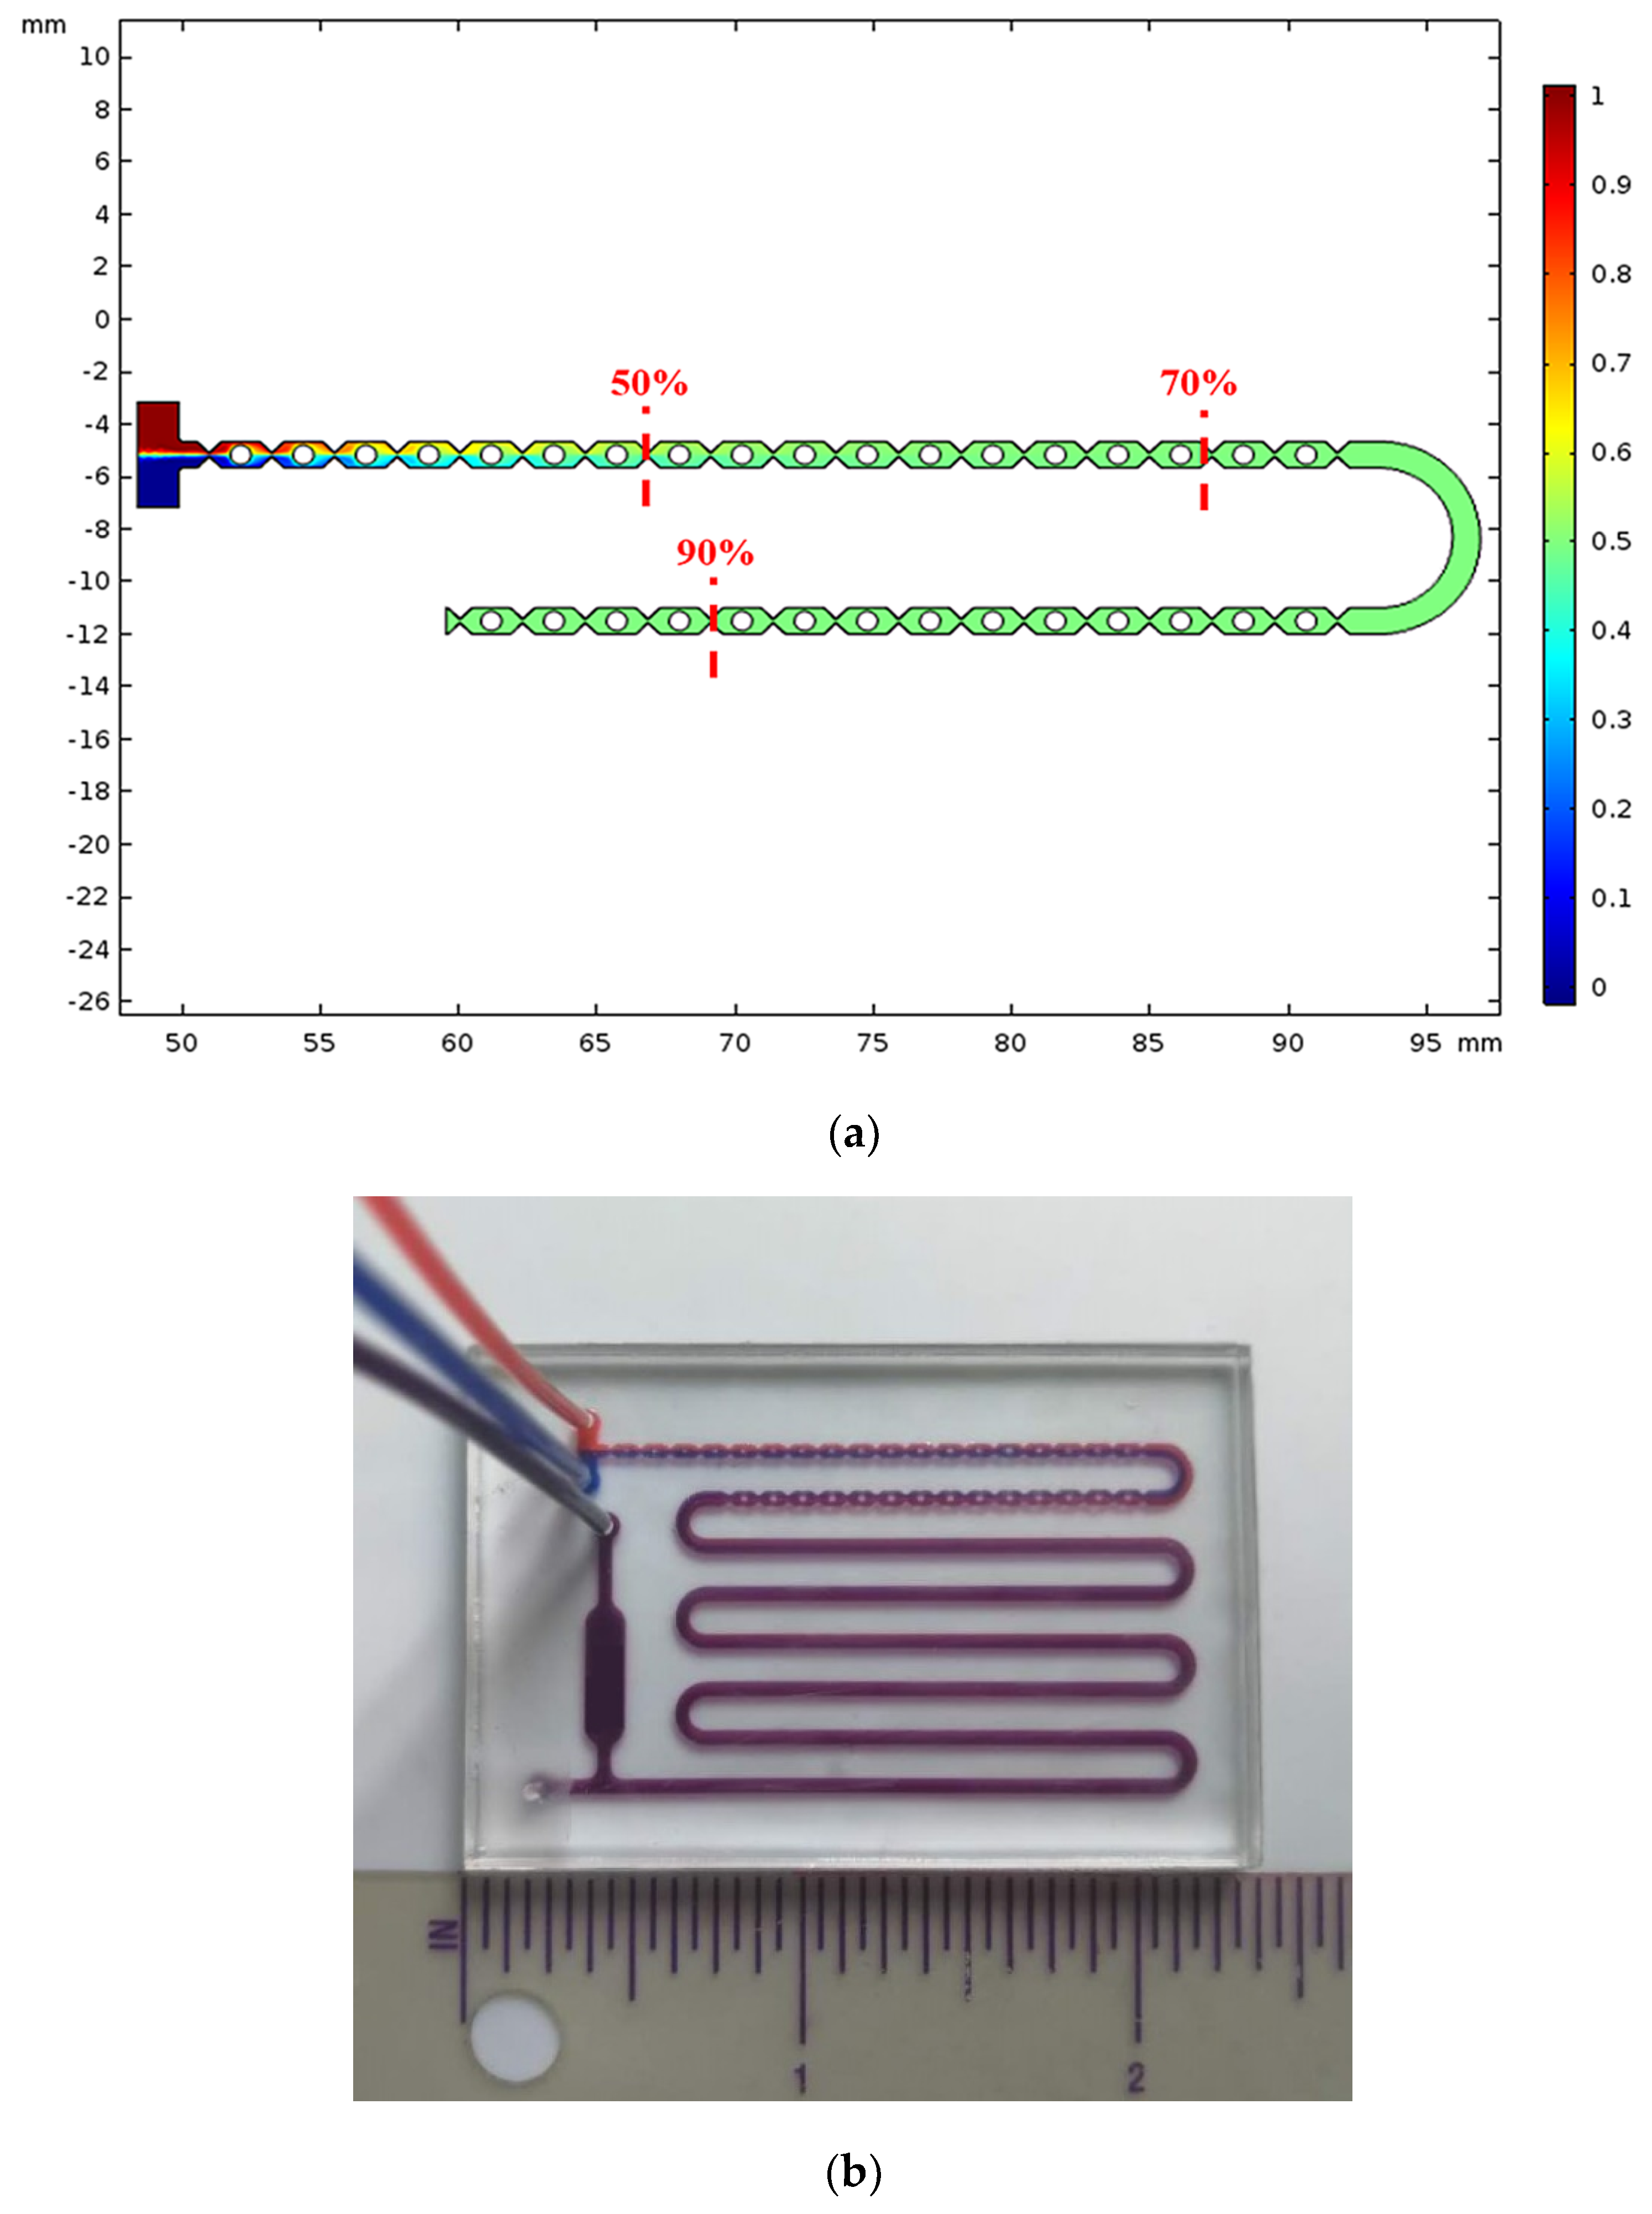
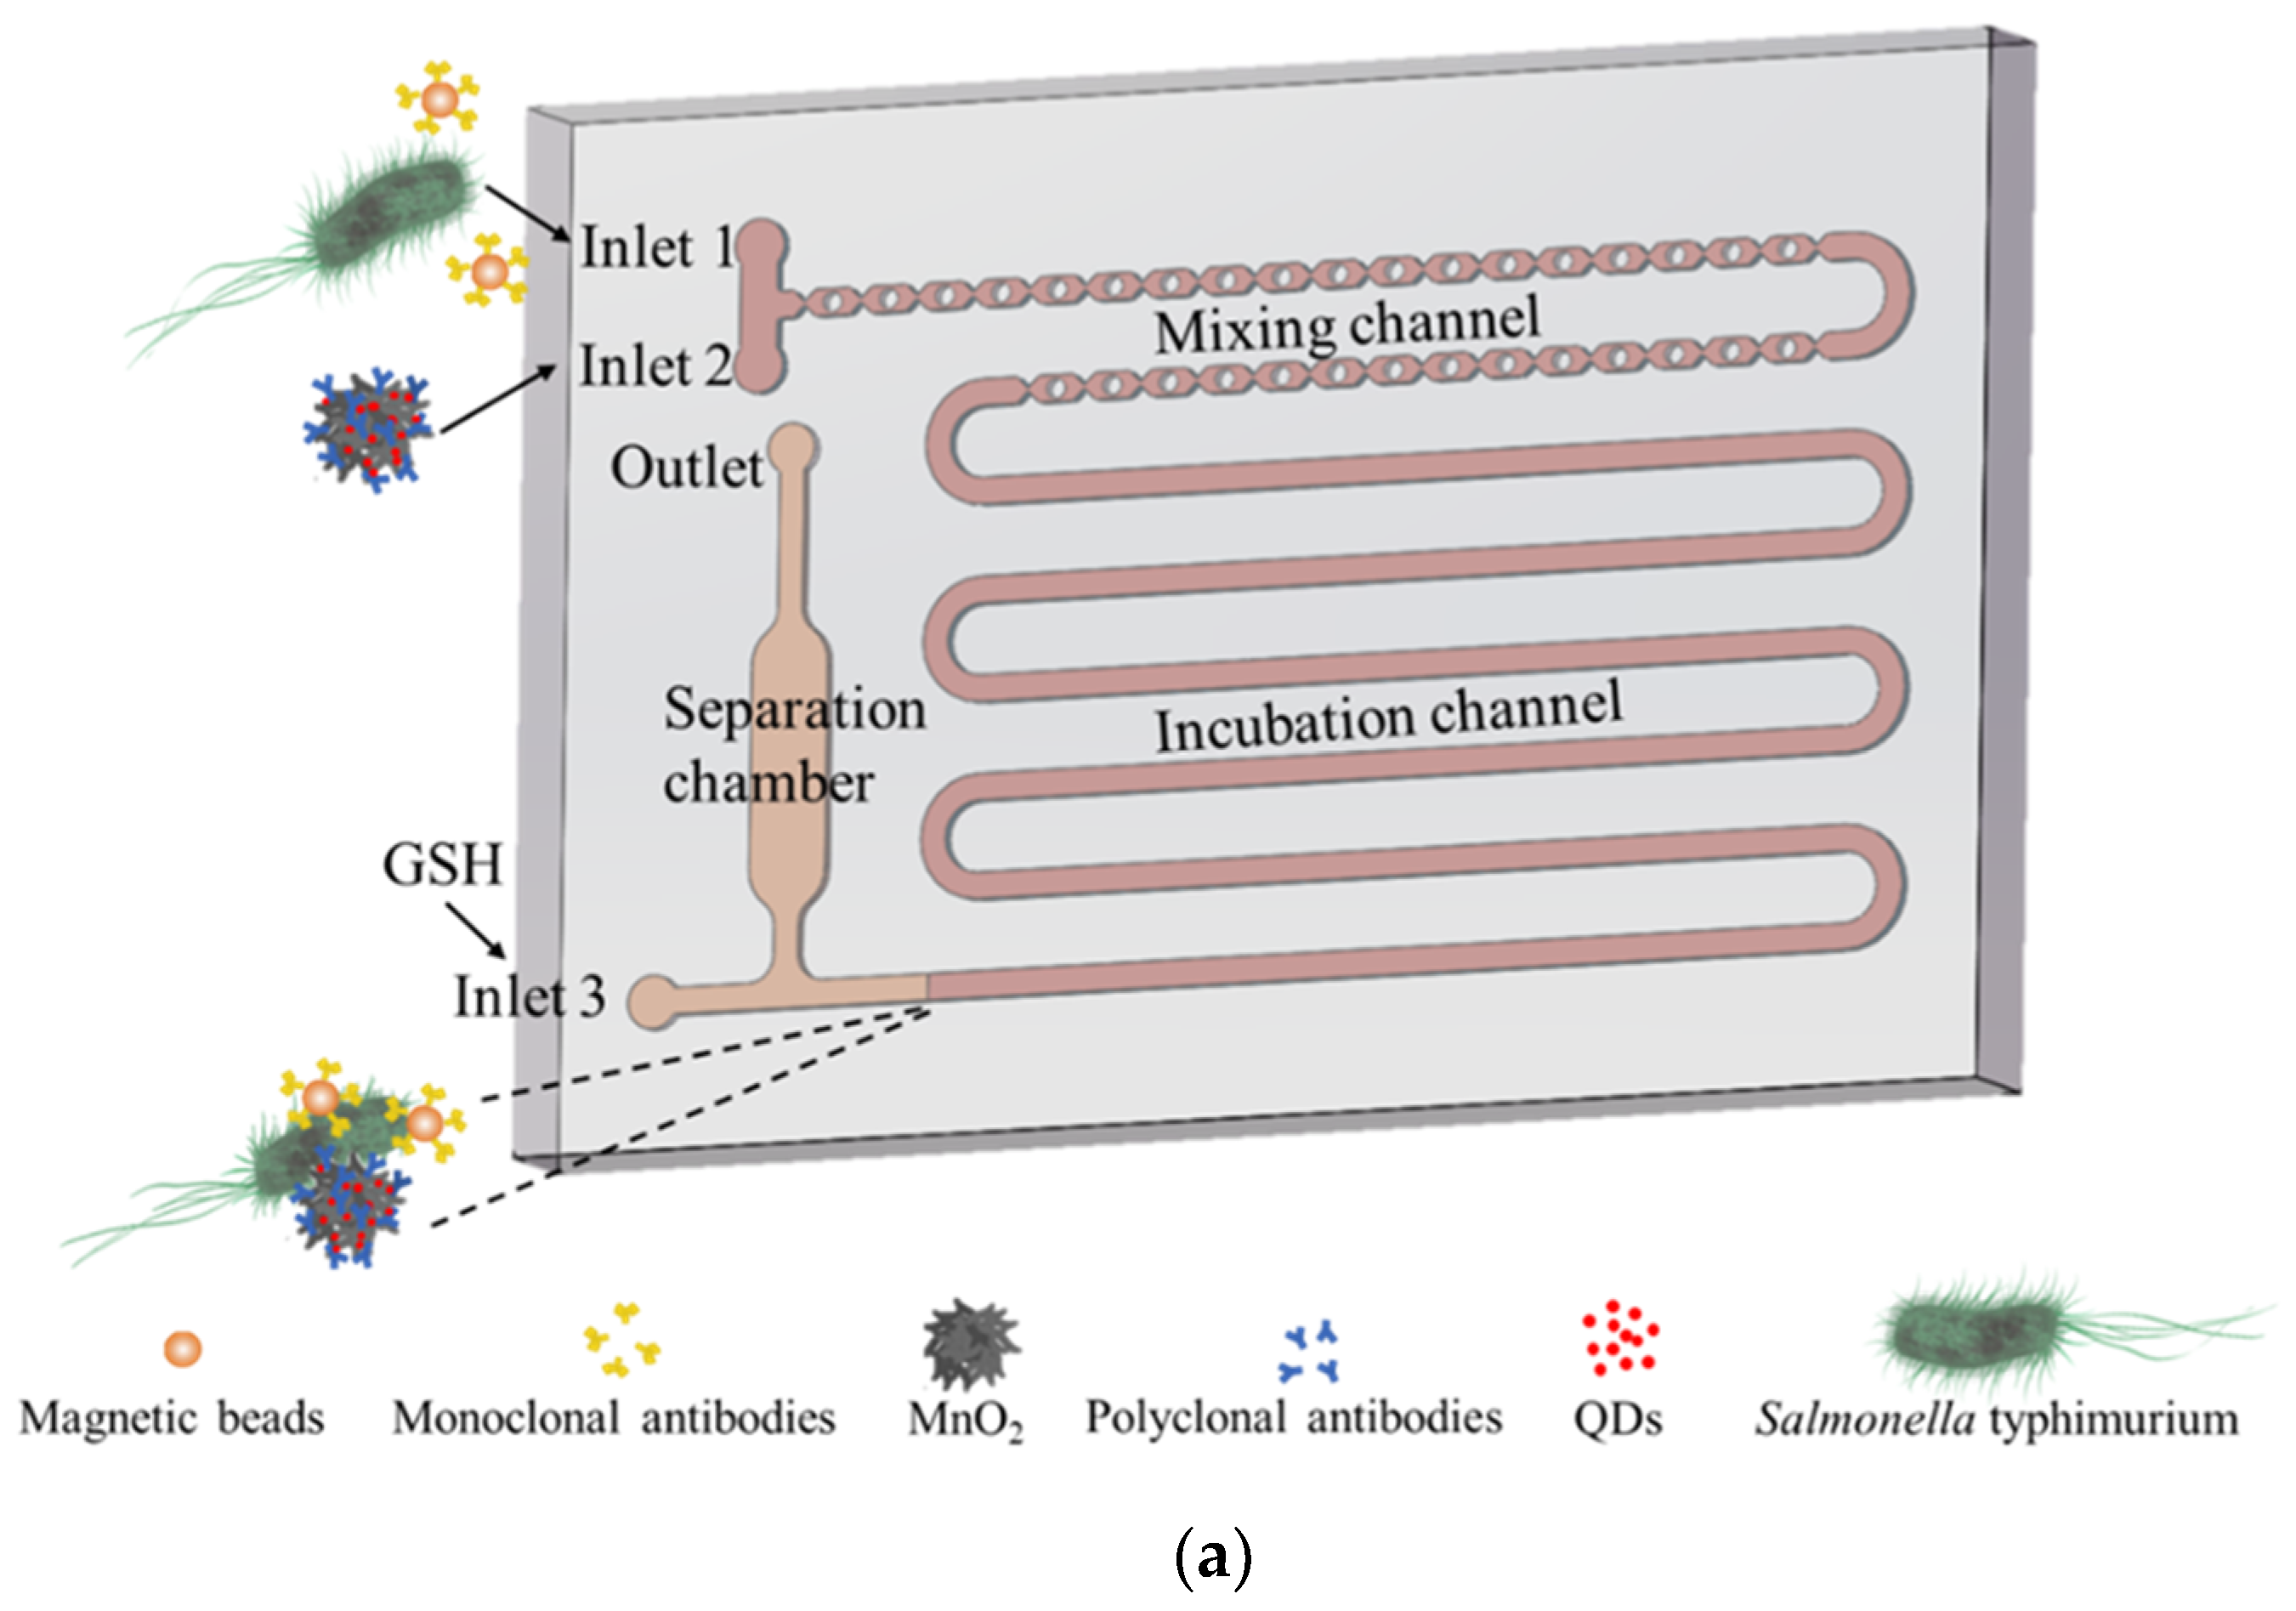
2.2. Design and Fabrication of the Microfluidic Chip

The design of the microfluidic chip with the convergence-divergence mixing channel was inspired by a previous report [37]. The microfluidic chip mainly consisted of three parts: (1) the mixing channel with the structure of convergence-divergence with a width of 1 mm and height of 400 µm for mixing the bacterial sample with the MNPs and the MnO2-QD-pAb NFs; (2) the incubating channel with the same width and height for forming the MNP-bacteria-QD-MnO2 complexes; and (3) the separation chamber with a length of 11 mm, width of 3 mm and height of 1 mm for capturing the MNP-bacteria-QD-MnO2 complexes with the external magnetic field and reducing MnO2 NFs into Mn2+ with GSH.
The microfluidic chip was fabricated based on 3D printing and surface plasma bonding. As shown in Scheme 1b, the 3D mold was drawn in stl format using the Solidworks software (Dassault Systèmes SolidWorks Corporation, Waltham, MA, USA) and printed by the Objet24 3D printer. Prior to use, the mold was thoroughly washed by deionized water to remove residual supporting materials. The prepolymer of PDMS and the curing agent were mixed at the ratio of 10:1 and poured into the mold, followed by curing at 65 °C for 12 h after degassing for 15 min in vacuum to remove bubbles. The PDMS replica was peeled off and bonded onto the glass slide to form the microfluidic chip after surface plasmon treatment (Harrick Plasma, Ithaca, NY, USA) and baked at 65 °C for aging to finally obtain the microfluidic chip.

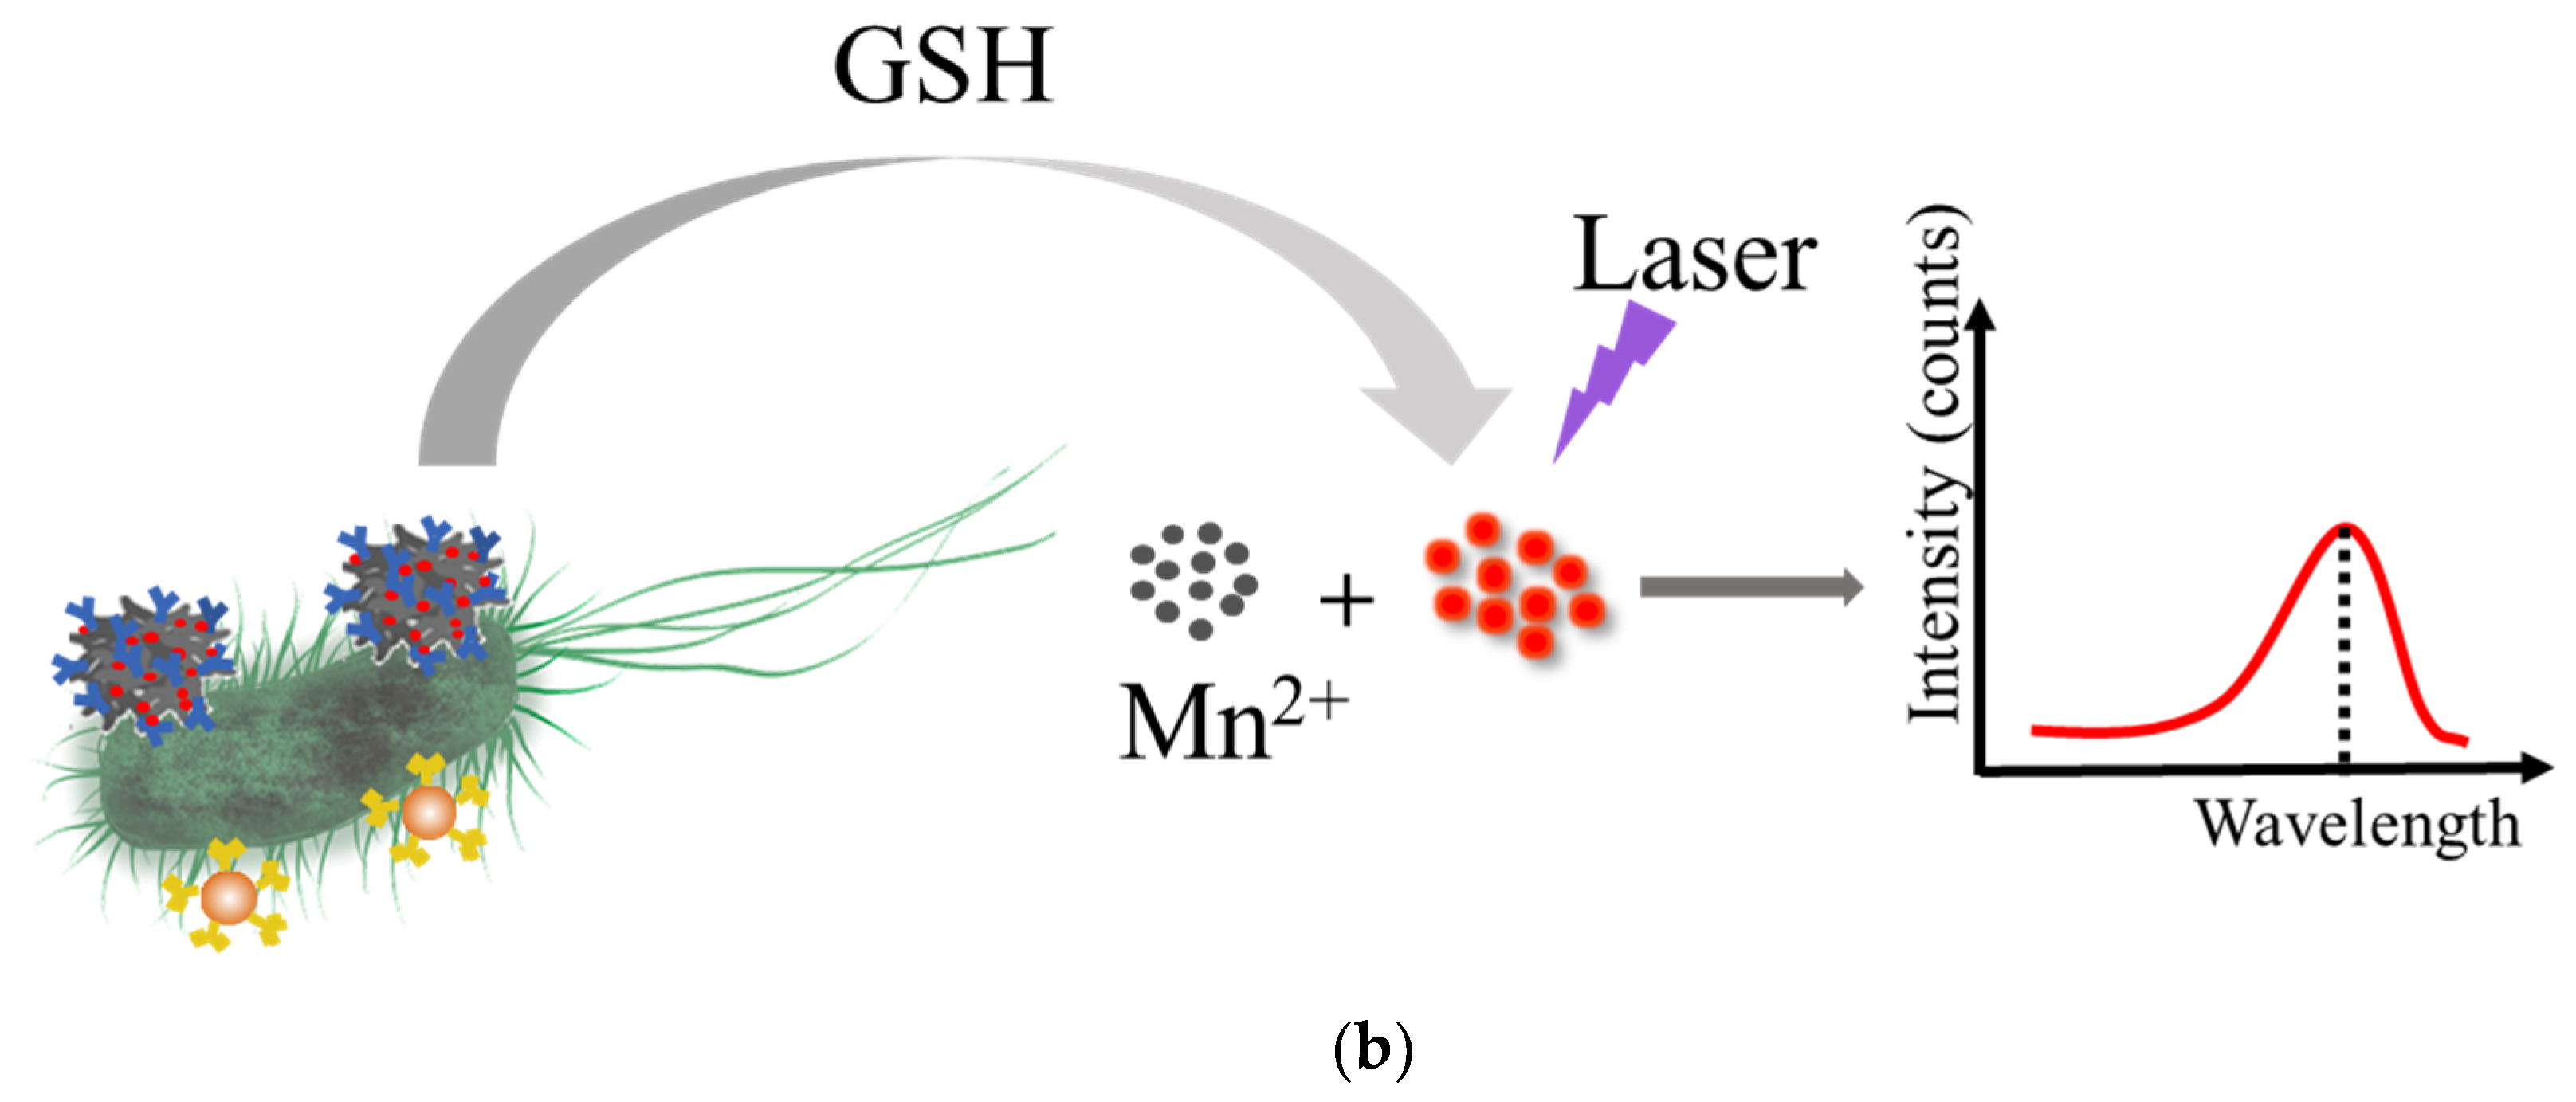
2.3. Synthesis of the MnO2-QD-pAb NFs

The MnO2-QD-pAb NFs were synthesized based on our previous study [39]. First, 10 mg of MnO2 NFs were centrifuged at 10,000 rpm for 10 min to remove the supernatant and resuspended with 2 mL of ethanol. Then, 1 mL of APTES was added and incubated at 37 °C with gentle stirring for 12 h to obtain NH2-MnO2 NFs in deionized water. After 5 µL of QDs (1 µM), 48 µL of EDC (1 mg/mL) and 11 µL of NHSS (1 mg/mL) were transferred into a centrifuge tube containing 1 mL of PB (pH 6.0, 0.01 M) and incubated for 1 h, 700 µL of NH2-MnO2 NFs (1 mg/mL) were added and incubated for 2 h at room temperature, followed by centrifugation to obtain the MnO2-QD NFs. Finally, 14 µL of polyclonal antibodies (2.5 mg/mL) and 500 µL of MnO2-QD NFs (1 mg/mL) were incubated with 10 µg of EDC (1 mg/mL) for 30 min, and 210 µL of 10% BSA (w/v) and 30 µL of EDC were added and incubated for another 1 h, followed by centrifugation and resuspending in 500 µL of PB containing 1% BSA to obtain the MnO2-QD-pAb NFs, which were stored at 4 °C for further use.

2.4. Detection of the Target Bacteria in Pure Cultures

The detection of the target bacteria was based on the forming of the MNP-bacteria-QD-MnO2 sandwich complexes and the release of the QDs from the MnO2 NFs on the complexes. First, 1 mL of the bacterial culture containing Salmonella Typhimurium at each concentration of 1.0 × 10²–1.0 × 10⁷ CFU/mL was mixed with 20 µg of MNPs modified with monoclonal antibody against Salmonella Typhimurium and 50 µg of the MnO2-QD-pAb NFs, and injected into the microfluidic chip through inlet 1 (bacterial culture and MNPs) and inlet 2 (MnO2-QD-pAb NFs) at the flow rate of 25 µL/min using two precise syringe pumps (Pump 11 elite, Harvard Apparatus, Holliston, MA, USA), respectively. The MNP-bacteria-QD-MnO2 complexes were formed and captured in the separation chamber by applying the magnetic field generated by two repelling NdFeB magnets at the bottom of the chamber. Then, 500 µL of PBST (PBS containing 0.05% Tween 20) was injected into the chamber to remove the residual background and excessive MnO2-QD-pAb NFs. After 100 µL of GSH (20 mM) was injected to the chamber through inlet 3 and incubated for 15 min to release the QDs from the MnO2 NFs, the released QDs were finally flushed out and measured by the optical detector to determine the amount of target bacteria. The portable optical detector from Ocean Optics (Dunedin, FL, USA) consisted of a USB4000-UV-VIS spectrophotometer with a spectral range of 200–850 nm for fluorescence detection, a USB-LS-450 blue LED pulsed light source for fluorescence excitation, a QR400-7 UV-Vis optical probe for optical transmission, and a Spectra-Suite software for data analysis.

2.5. Detection of the Target Bacteria in Spiked Samples

The chicken samples were purchased from a local supermarket. First, 25 g of chicken sample was added into 225 mL of sterile PBS and homogenized (BagMixer, Interscience, Mourjou, France) for 4 min, followed by standing for 5 min to obtain the supernatant. Then, different concentrations of the Salmonella Typhimurium cells were added into the supernatant to obtain the spiked chicken samples with bacterial concentrations ranging from 1.0 × 10² to 1.0 × 10⁷ CFU/mL. Finally, the spiked chicken samples were detected using this biosensor.

3. Results

3.1. Simulation of the Microfluidic Chip

The micromixer is the key to the microfluidic chip, which has a great impact on the detection time and sensitivity of this biosensor. COMSOL software (COMSOL Inc., Stockholm, Sweden) was used to simulate the mixer with a convergence-divergence structure and evaluate its mixing efficiency. As shown in Figure 1a, the mixing efficiency reaches 50%, 70% and 90%, when the number of the convergence-divergence structures is 7, 16 and 28, respectively. This indicates that the convergence-divergence mixer has an excellent mixing efficiency. To ensure complete mixing of MNPs modified with monoclonal antibody against Salmonella Typhimurium, the MnO2-QD-pAb NFs, and the target bacteria, 32 convergence-divergence structures and a serpentine incubating channel were used. As shown in Figure 1b, the microfluidic chip has a length of ~6 cm and width of ~4 cm. To further verify the mixing efficiency of the chip, red and blue inks were injected into the chip at the same rate of 25 µL/min. As can be seen from Figure 1b, blue and red inks were fully mixed after flowing through the mixing channel.

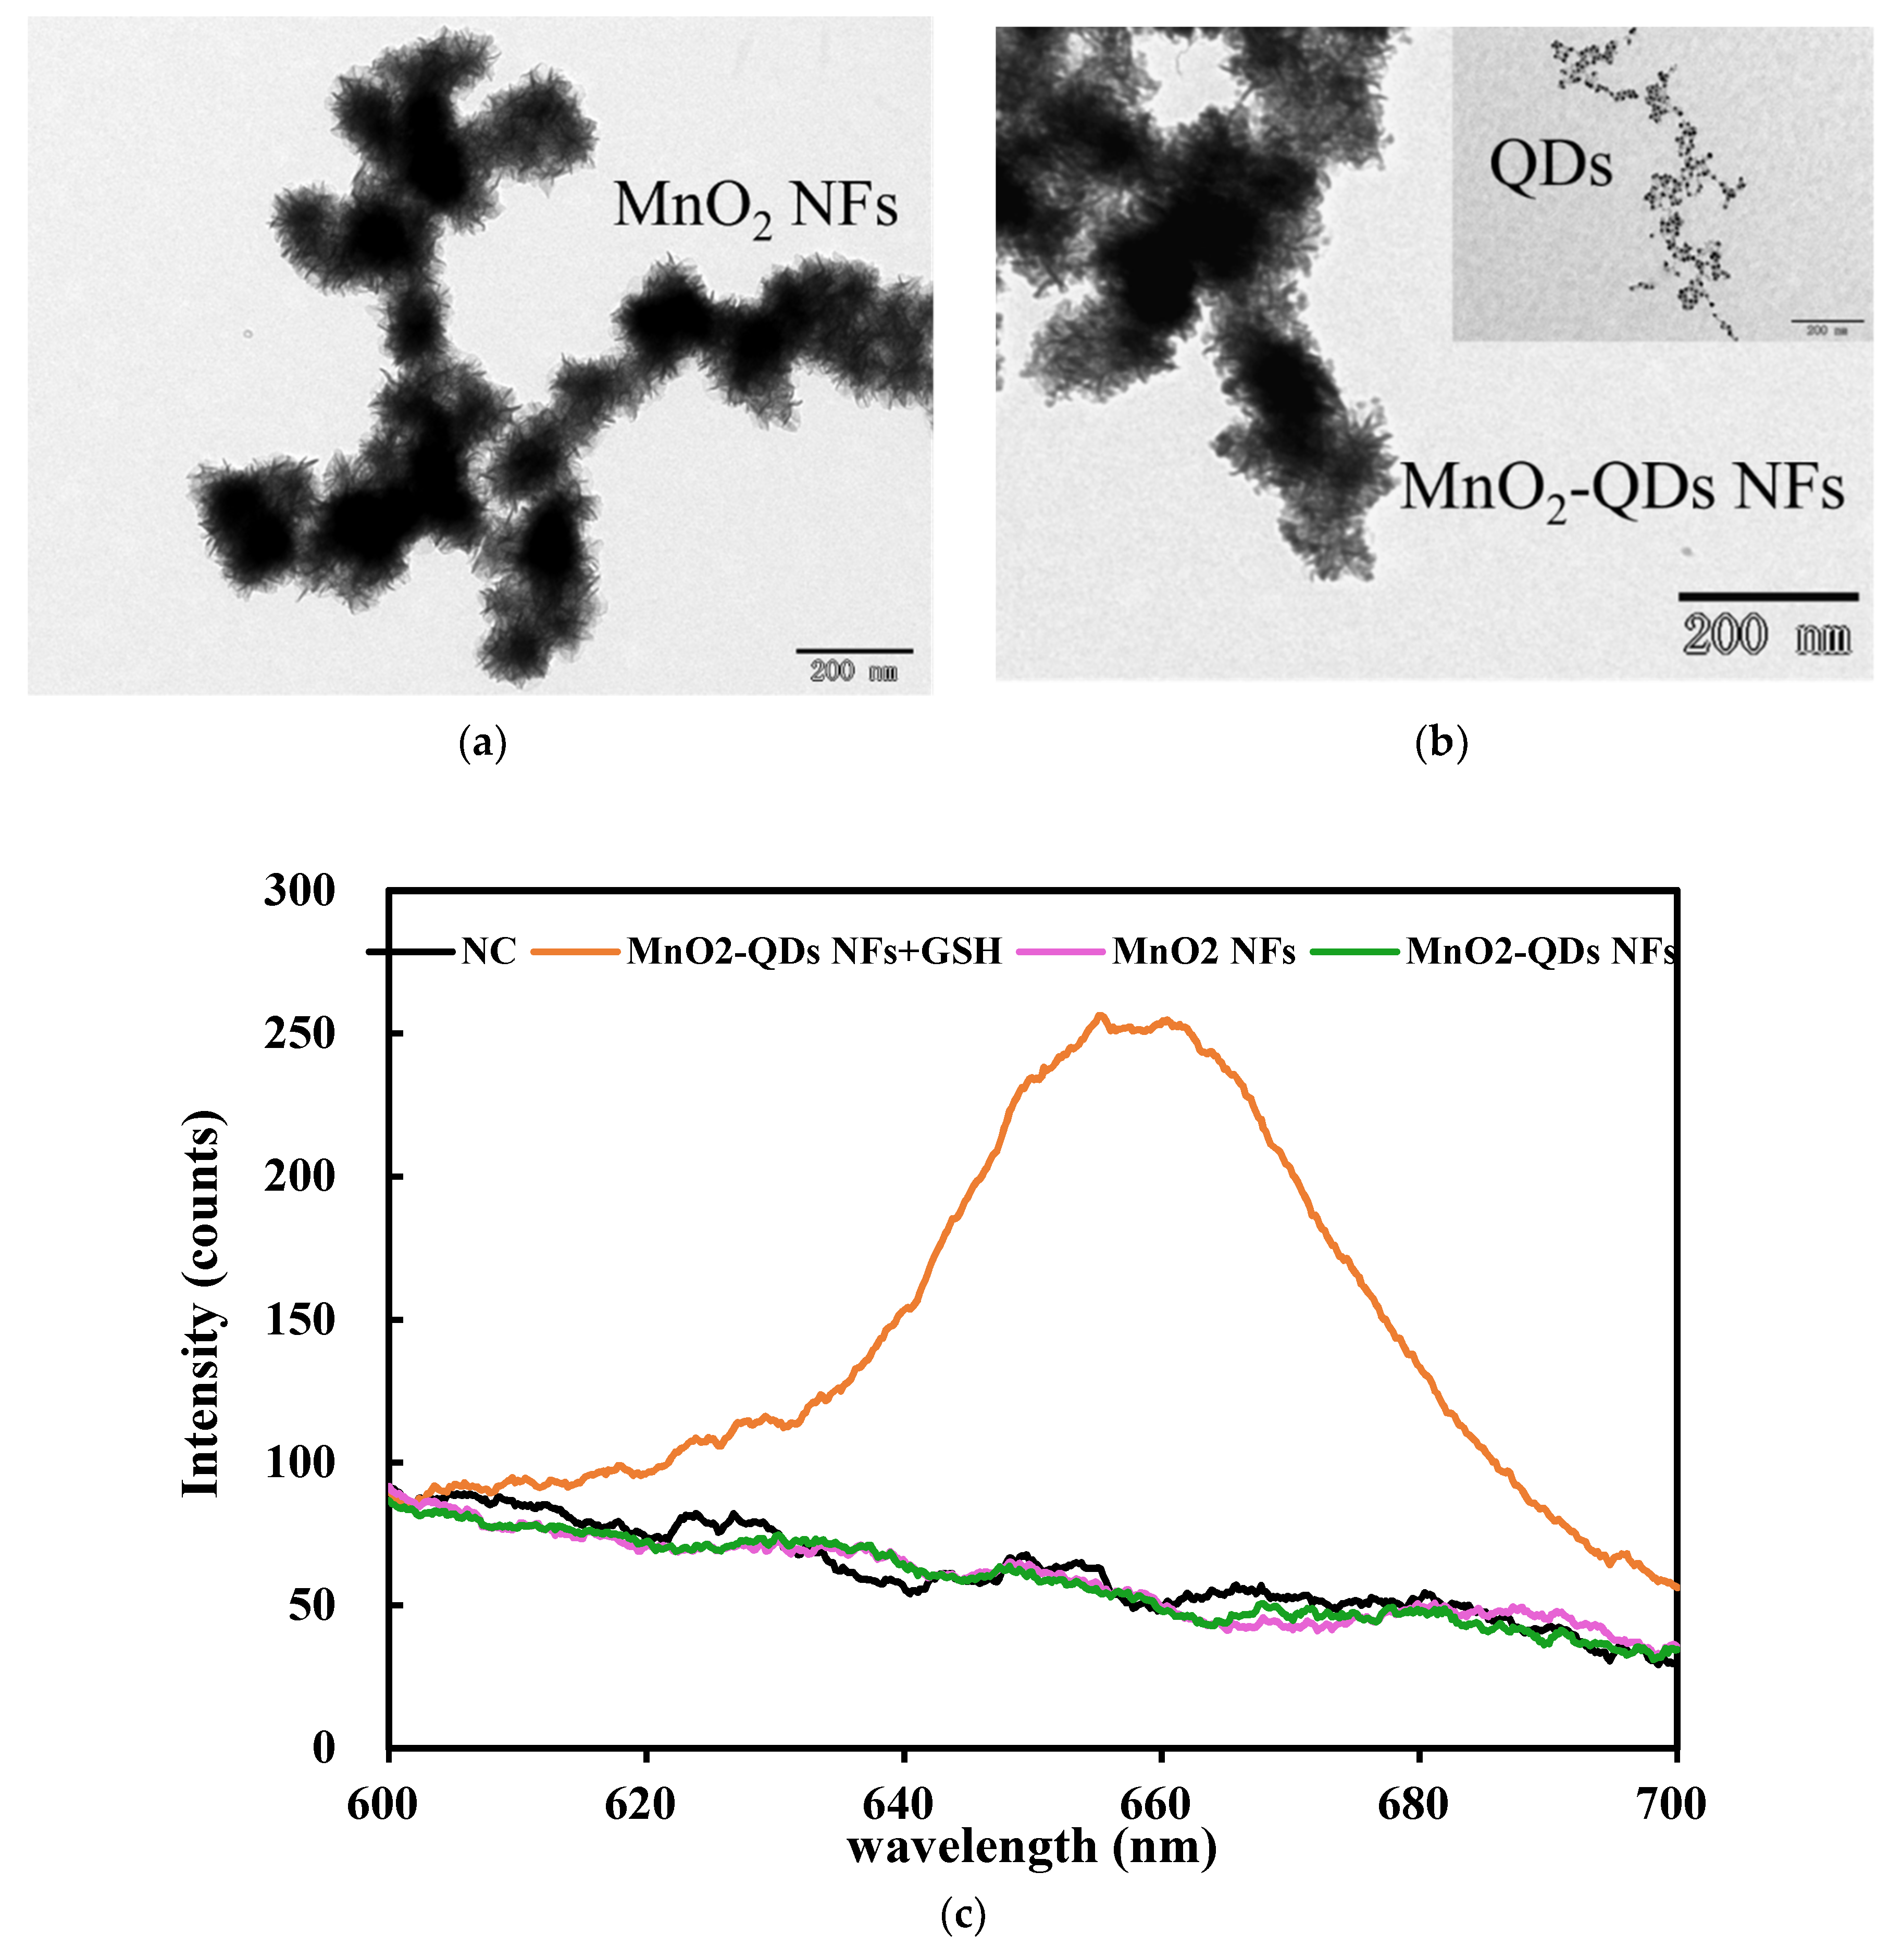
3.2. Characterization of the MnO2 NFs and MnO2-QD NFs

The MnO2 NFs and their derivates are the key materials of this biosensor. Thus, transmission electron microscopy (TEM) was used to characterize the MnO2 NFs and MnO2-QD NFs. As shown in Figure 2a, the MnO2 NFs have many flakes deriving from their backbones, and their average size is ~200 nm. As shown in Figure 2b, there are many small dots with an average size of ~10 nm on the MnO2 NFs, which is consistent with the size of QDs (see the insert of Figure 2b), indicating successful synthesis of the MnO2-QD NFs. Besides, to verify the basic concept of this biosensor, the fluorescent intensities of the MnO2 NFs, the MnO2-QD NFs and the mixture of MnO2-QD NFs and GSH were measured using the optical detector. Figure 2c shows that only the mixture of MnO2-QD NFs and GSH has a fluorescent signal due to the decomposition of the MnO2 NFs, resulting in the release of the QDs. The MnO2 NFs do not have fluorescent signals, indicating that there are only little background noises from the MnO2 NFs. The MnO2-QD NFs also do not have fluorescent signals since the fluorescence of the QDs is absorbed and/or blocked by MnO2. To further investigate the release of the QDs from the MnO2-QD NFs, twofold dilutions of the MnO2-QD NFs were prepared and incubated with 100 µL of 20 mM GSH for 15 min. The fluorescent intensity of the released QDs was detected and shown in Figure S1. It shows that there is a good linear relationship between the fluorescent intensity of the released QDs and the concentration of the MnO2-QD NFs.

3.3. Optimization of the Microfluidic Biosensor

The amount of QDs, the amount of MnO2-QD-pAb NFs, and the flow rate have a great impact on the sensitivity of this microfluidic biosensor. The detailed procedures for their optimization can be found in the Supplementary Materials. As shown in Figure S2, the optimal amount of 50 pmol for the QDs, the optimal amount of 50 µg for the MnO2-QD-pAb NFs, and the optimal flow rate of 25 µL/min could be obtained and were used in this study.

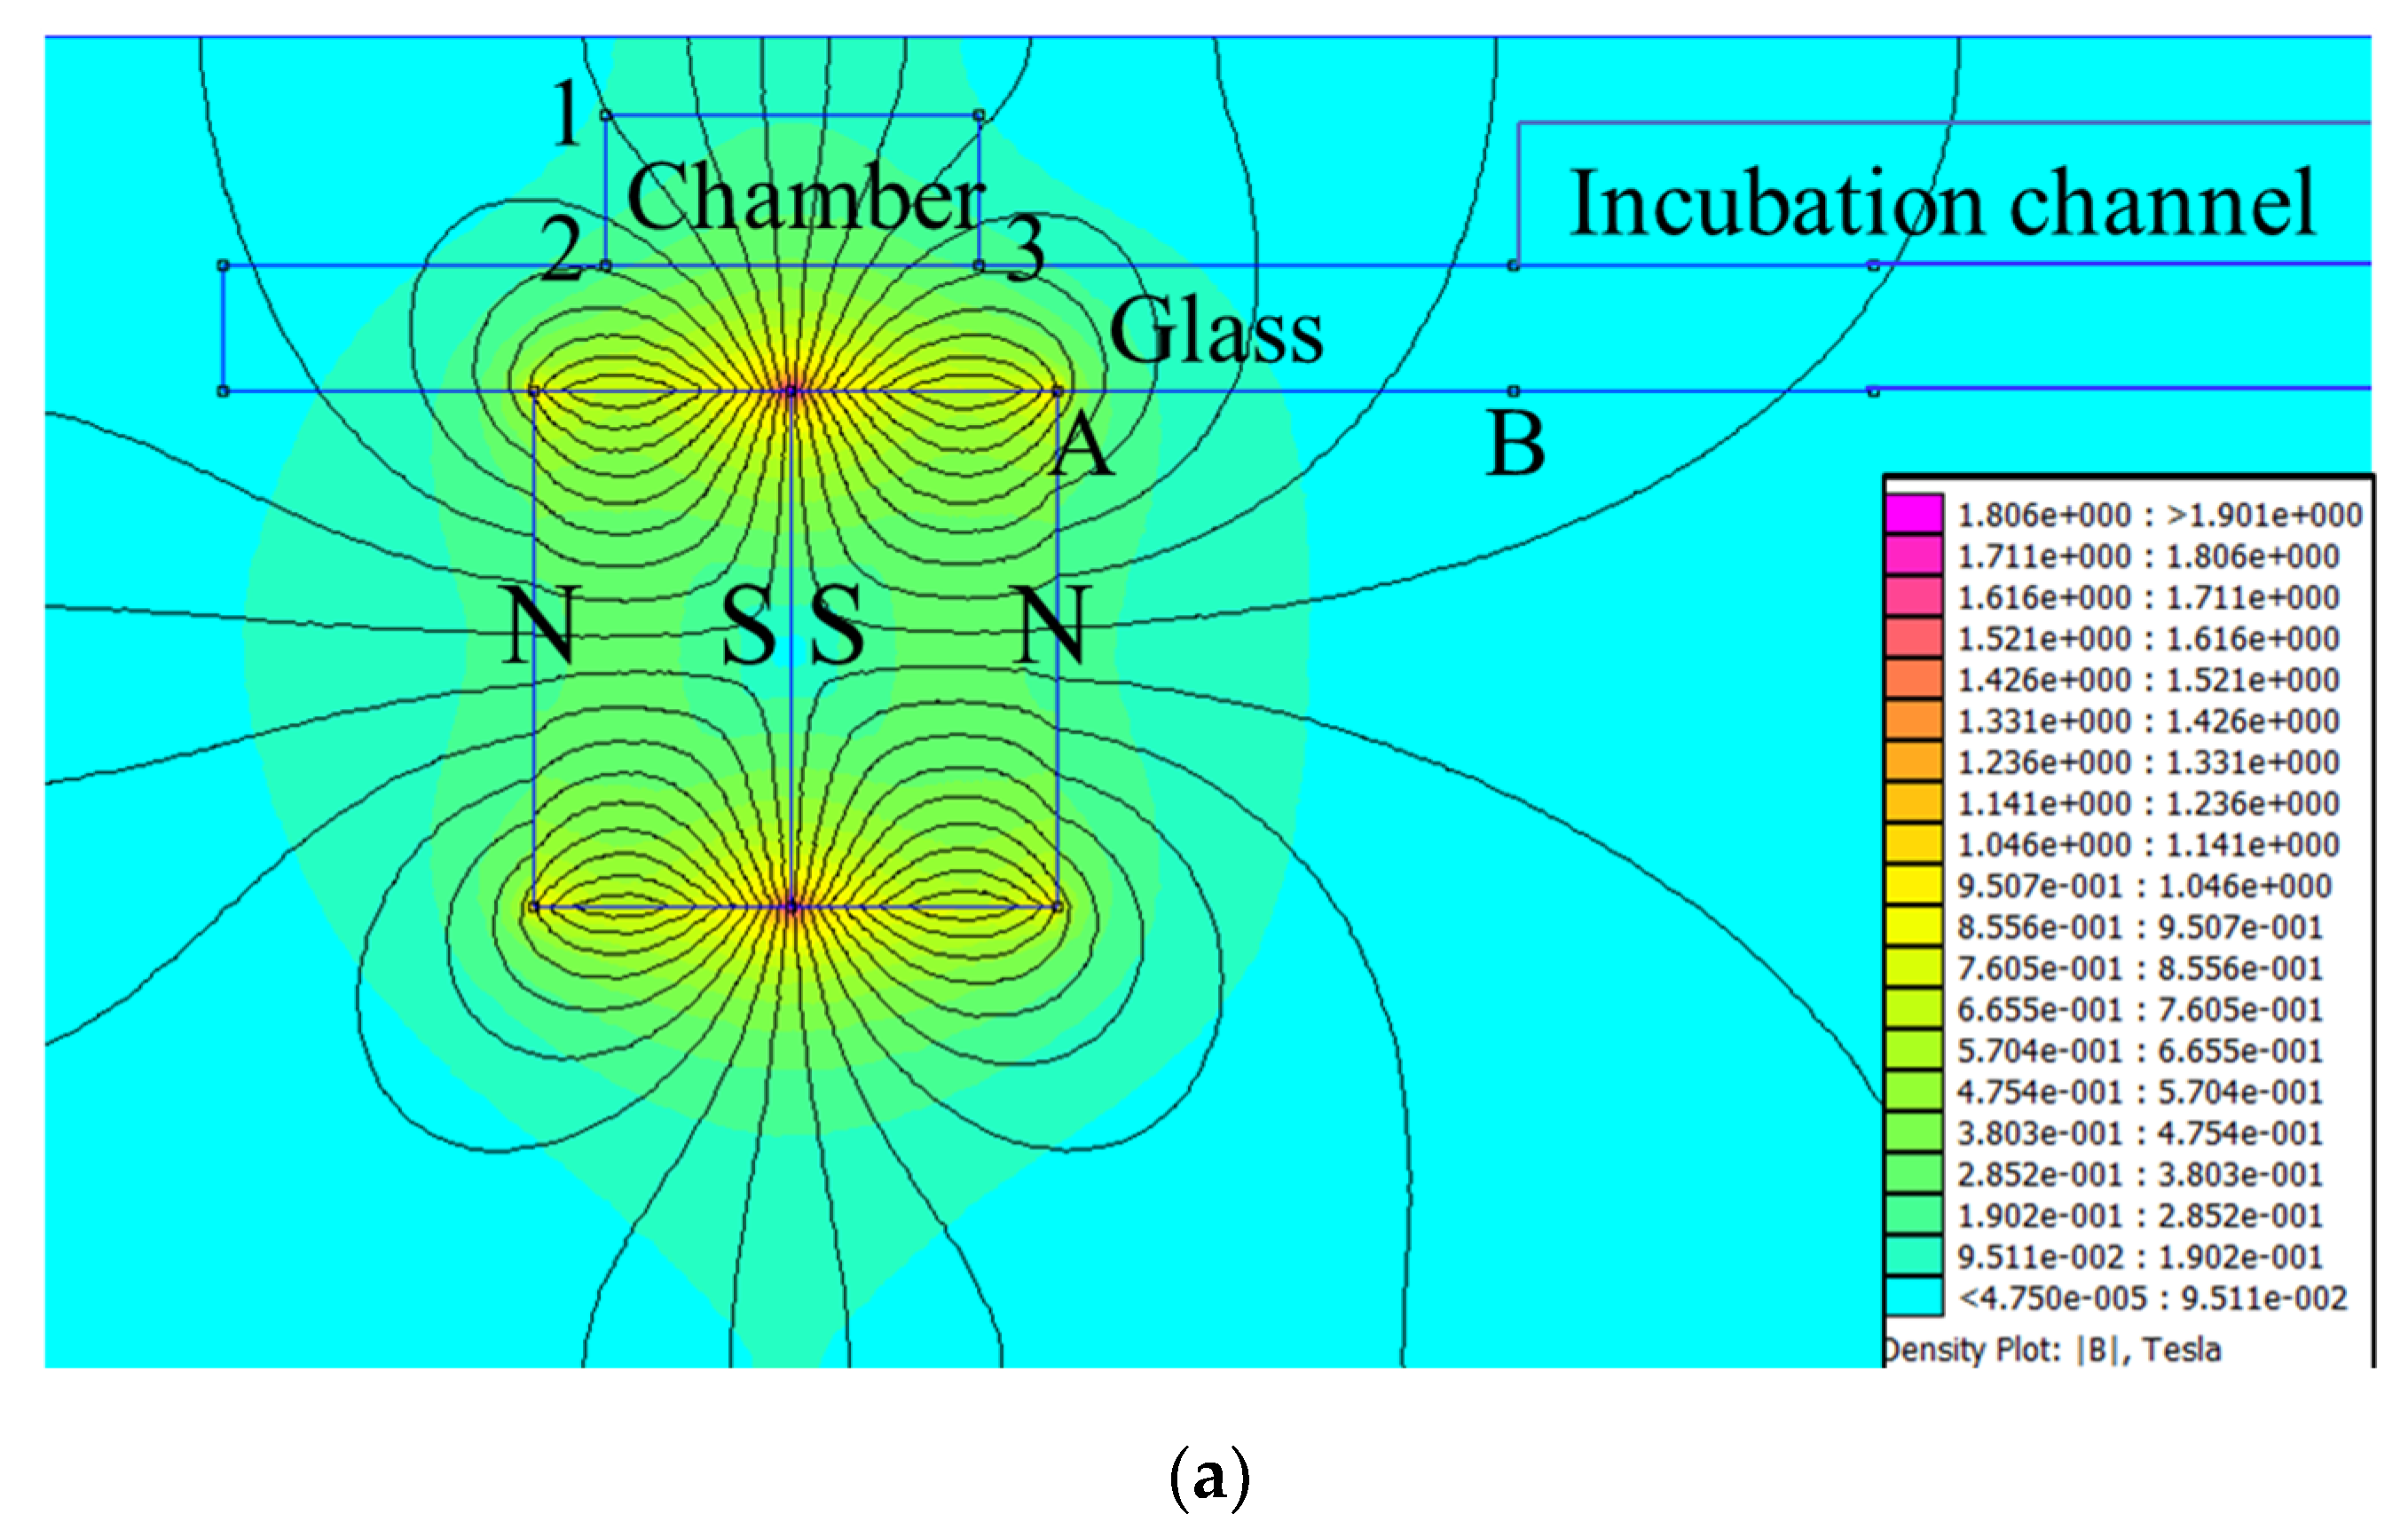
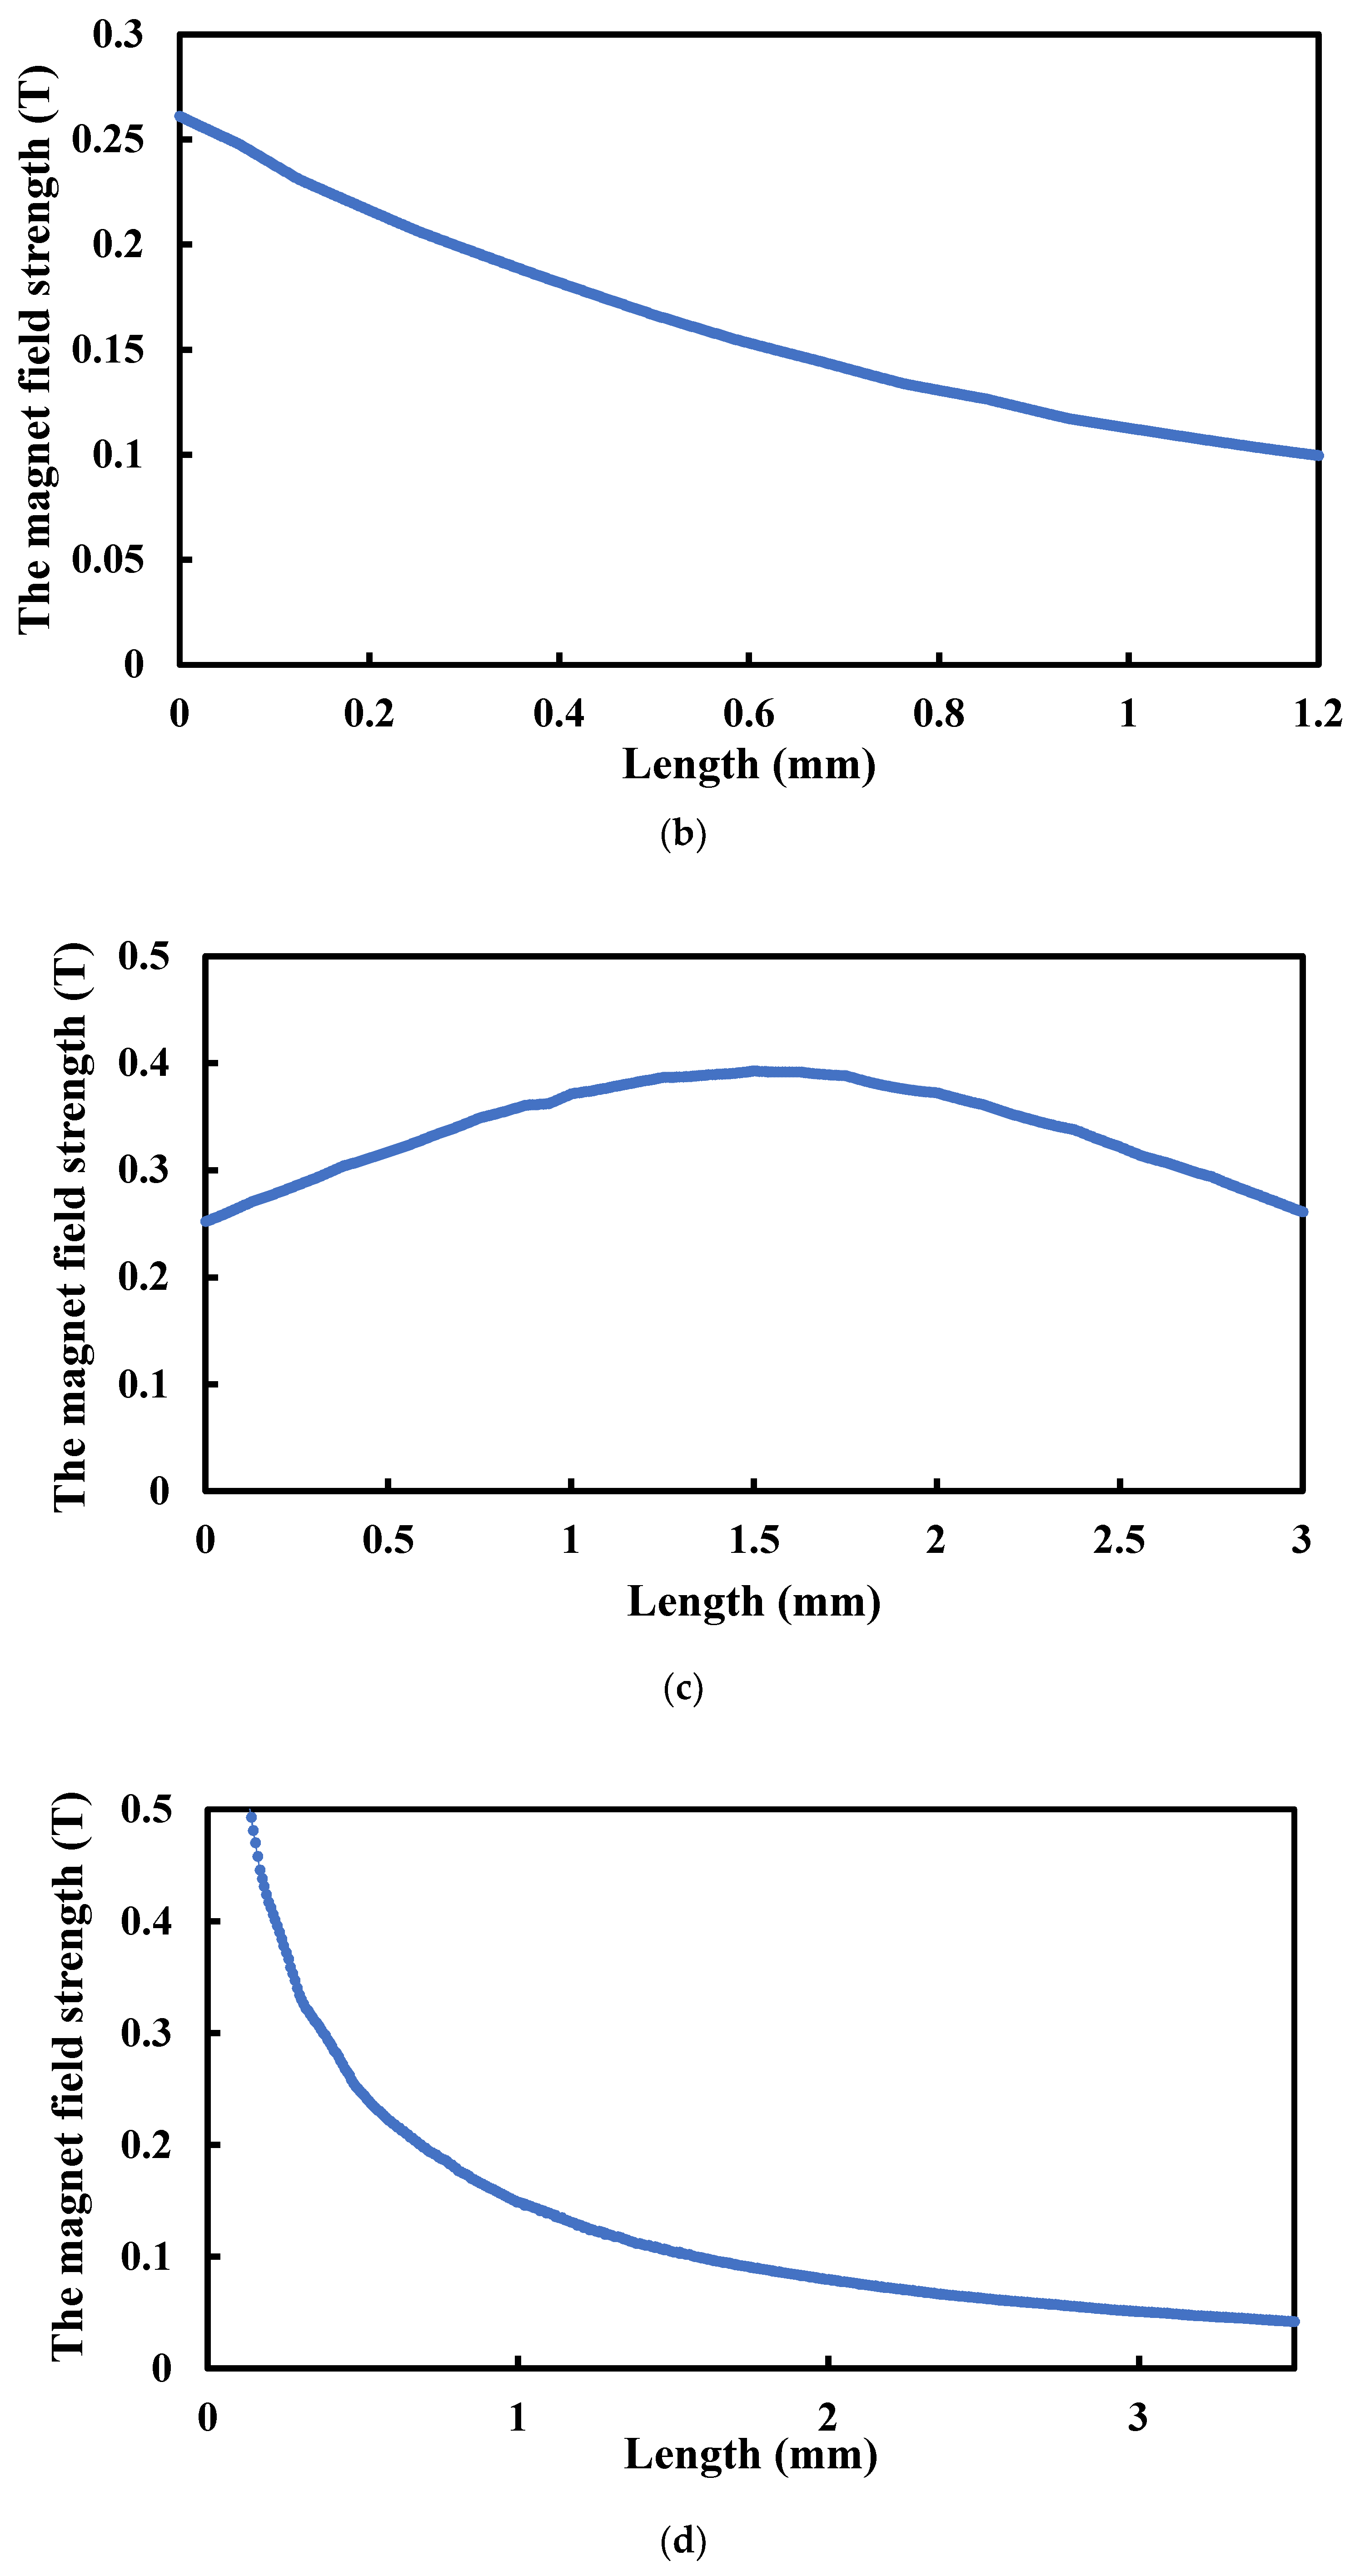
3.4. Simulation of the Magnetic Field

The magnetic field for capturing the MNP-bacteria-QD-MnO2 complexes in the separation chamber is important in the development of this biosensor. To better investigate the distribution of the magnetic field in the microfluidic chip, the Finite Element Method Magnetics (FEMM) Software (Developed by David Meeker, and available from the website: http://www.femm.info/) was used to simulate the magnetic field generated by two repelling magnets (material: NdFeB, grade: N52, dimension: 9 × 4 × 2 mm). Figure 3a shows the distribution of the magnetic field at the chip. The strength of the magnetic field in the separation chamber changes from 0.10 T to 0.26 T at the vertical horizontal direction (Point 2 to 1, Figure 3b) and from 0.25 to 0.39 T at the horizontal direction (Point 2 to 3, Figure 3c), which was strong enough to capture the MNPs with the size of 150 nm. Besides, to check if the magnetic field has an impact on the MNPs and their conjugates when they flowed through the incubation channel, the strength of the magnetic field at the horizontal direction from the right magnet was obtained from FEMM simulation. As shown in Figure 3d, the strength of the magnetic field at the closest position (point B) of the incubation channel is only 0.05 T, which is not strong enough to capture the flowing MNPs or their conjugates [40]. To further verify this, 20 µg of the MNPs in 1 mL of PBS were injected into the chip with the flow rate of 25 µL/min. As shown in Figure S3, when the magnetic field is applied, almost all MNPs are captured in the separation chamber other than in the incubation channel.

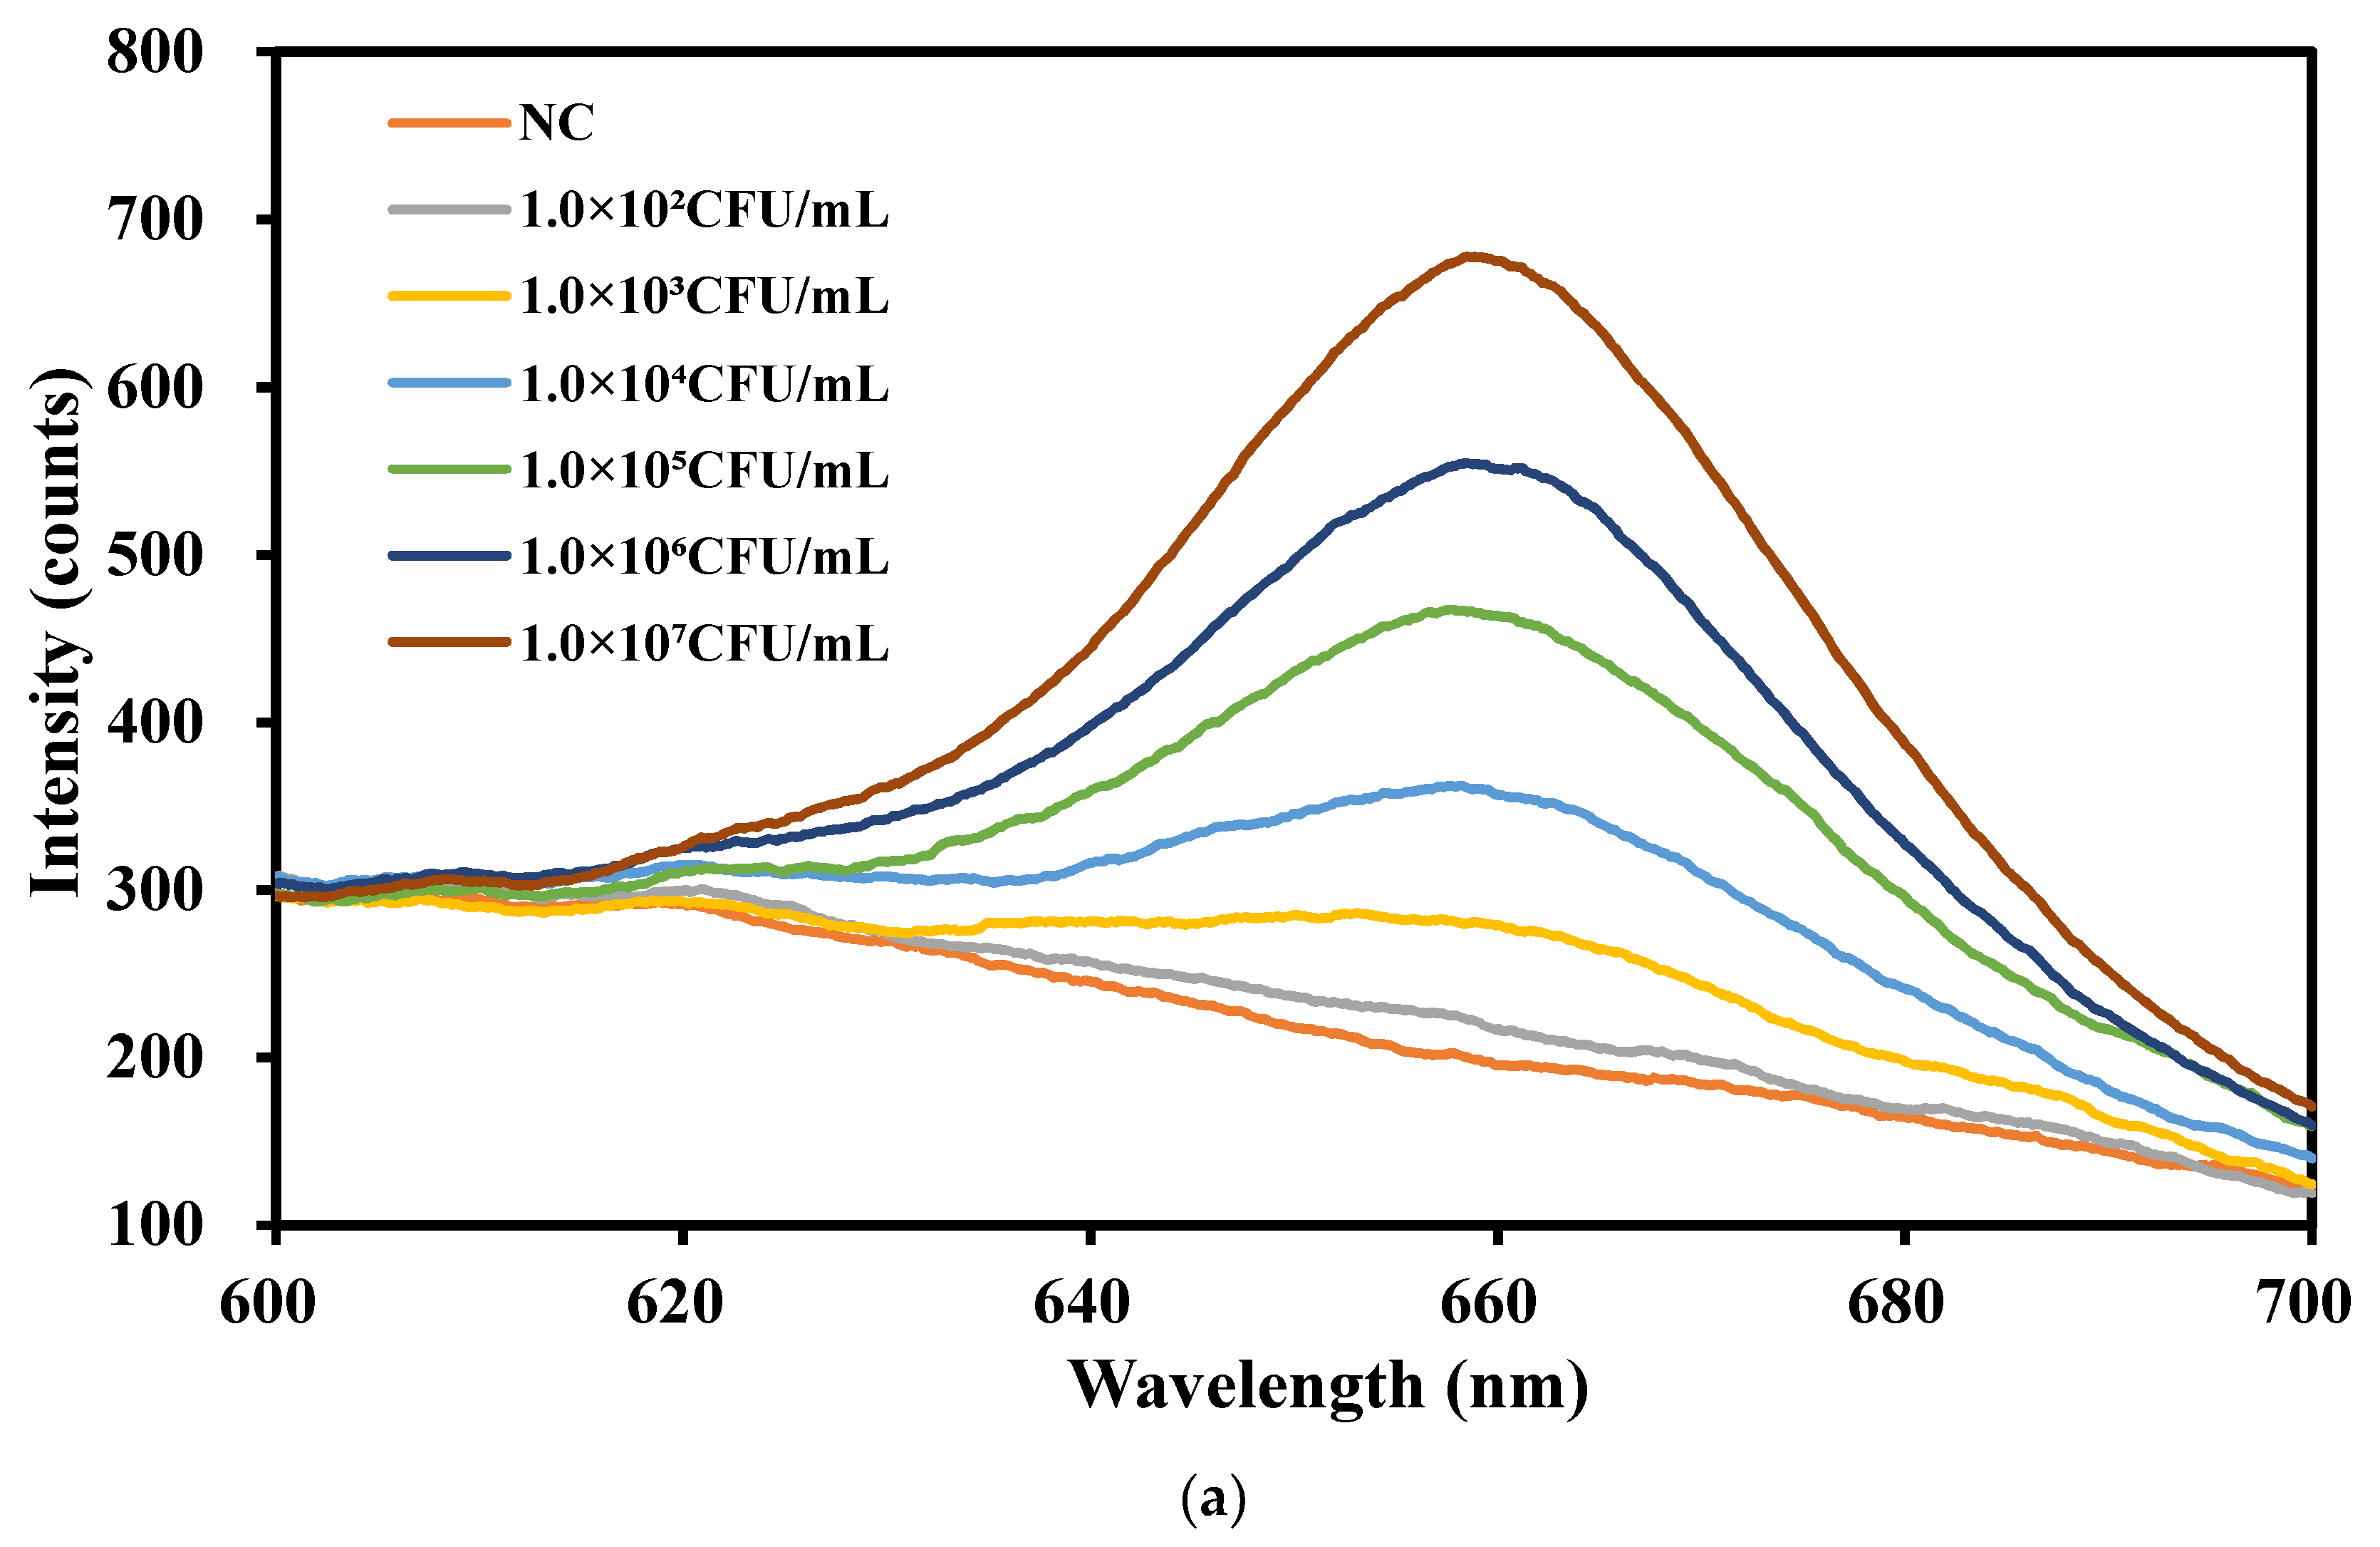
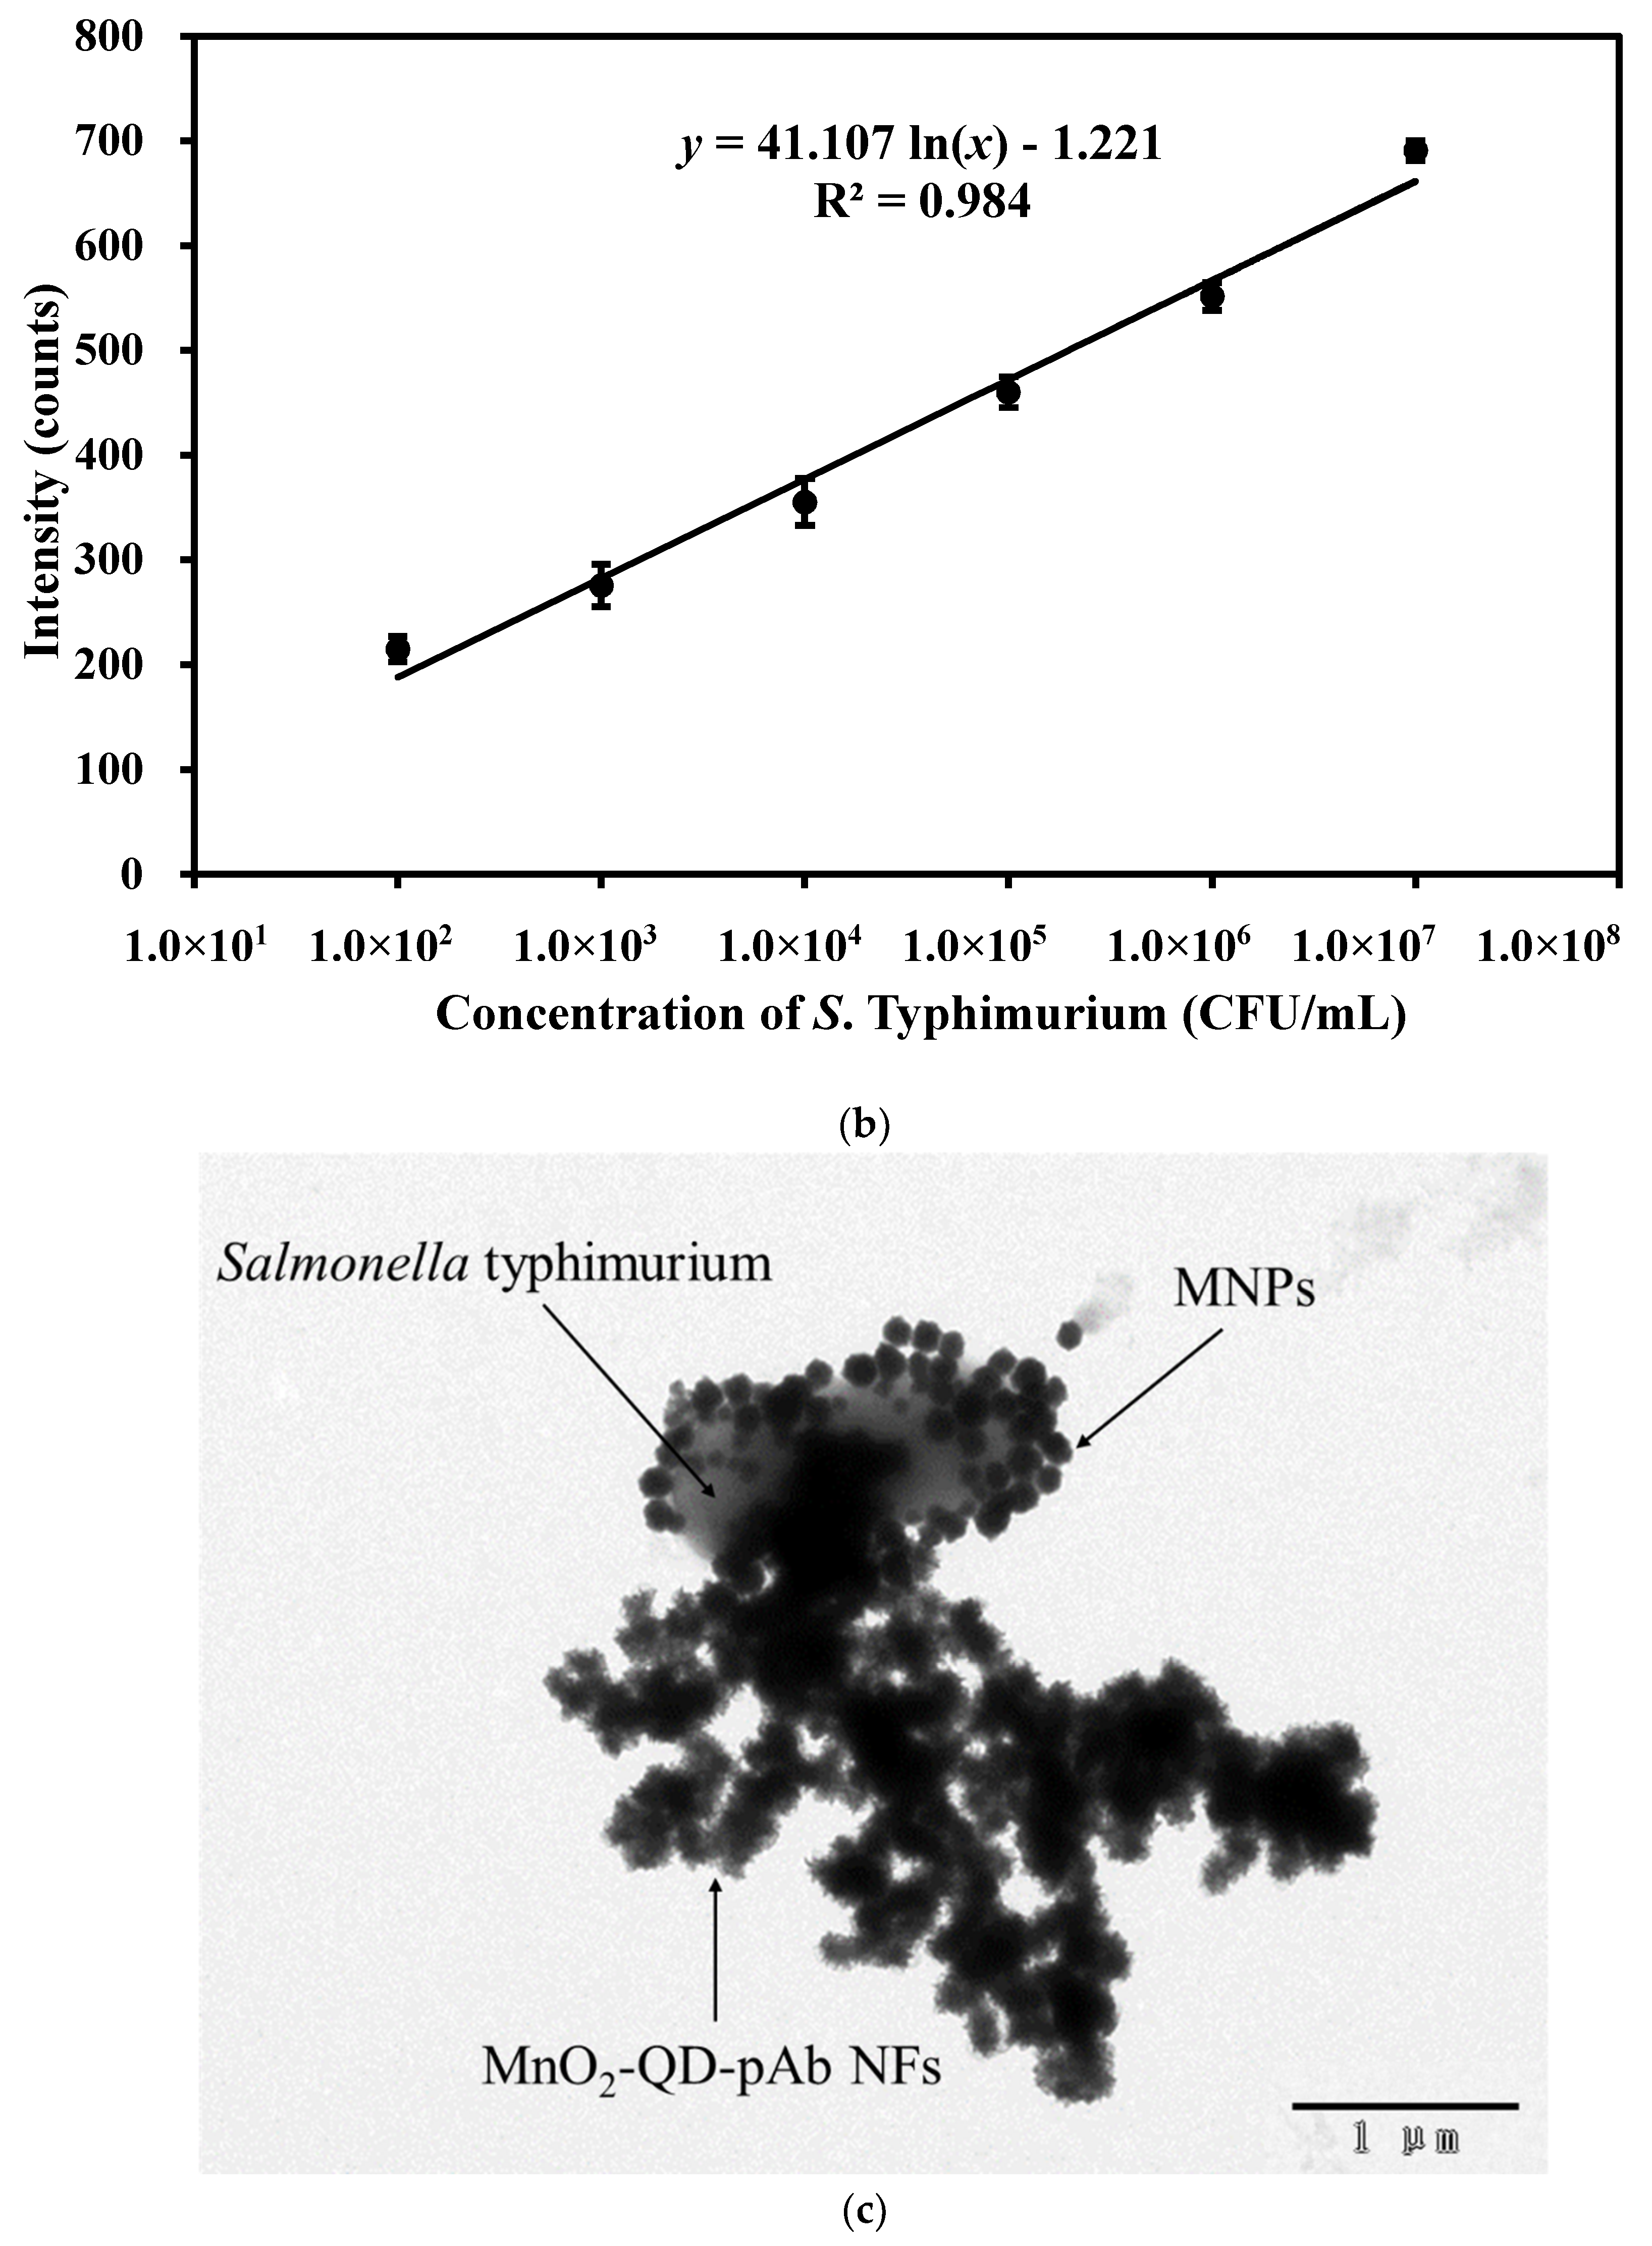
3.5. Calibration Model of This Biosensor

The calibration model of this biosensor is the basis for quantitative determination of unknown concentrations of target bacteria. Different concentrations of the Salmonella Typhimurium cells ranging from 1.0 × 10² CFU/mL to 1.0 × 10⁷ CFU/mL were detected using this biosensor under optimal conditions. As shown in Figure 4a, the fluorescent intensity at the characteristic wavelength of 661 nm increases from about 200 counts to about 700 counts when the bacterial concentration changes from 102 CFU/mL to 107 CFU/mL. As shown in Figure 4b, a good linear relationship between the fluorescent intensity (I) at 661 nm and the bacterial concentration (C) is found and can be expressed as I = 41.107 ln(C) − 1.221 (R2 = 0.984). Based on three times the signal-to-noise ratio, the low detection limit of this biosensor was calculated to be 43 CFU/mL. To further confirm the formation of the MNP-bacteria-MnO2-QD complexes, transmission electron microscope was conducted and the image is shown in Figure 4c, indicating successful formation of the complexes. The high sensitivity of this biosensor could be attributed to these reasons: (1) the high load of the MnO2 NFs with the QDs, resulting in stronger fluorescent signals; (2) the effective release of the QDs by GSH into aqueous solution, resulting in much less absorption of the fluorescence by the MnO2 NFs and no blocking of the fluorescence; (3) the good control of the background noise by automatic operations and continuous-flow washing in the microfluidic chip, resulting in less background noise; (4) the efficient concentration of the MNP-bacteria-MnO2-QD complexes in the separation chamber by the magnetic field, resulting in stronger fluorescent signals.

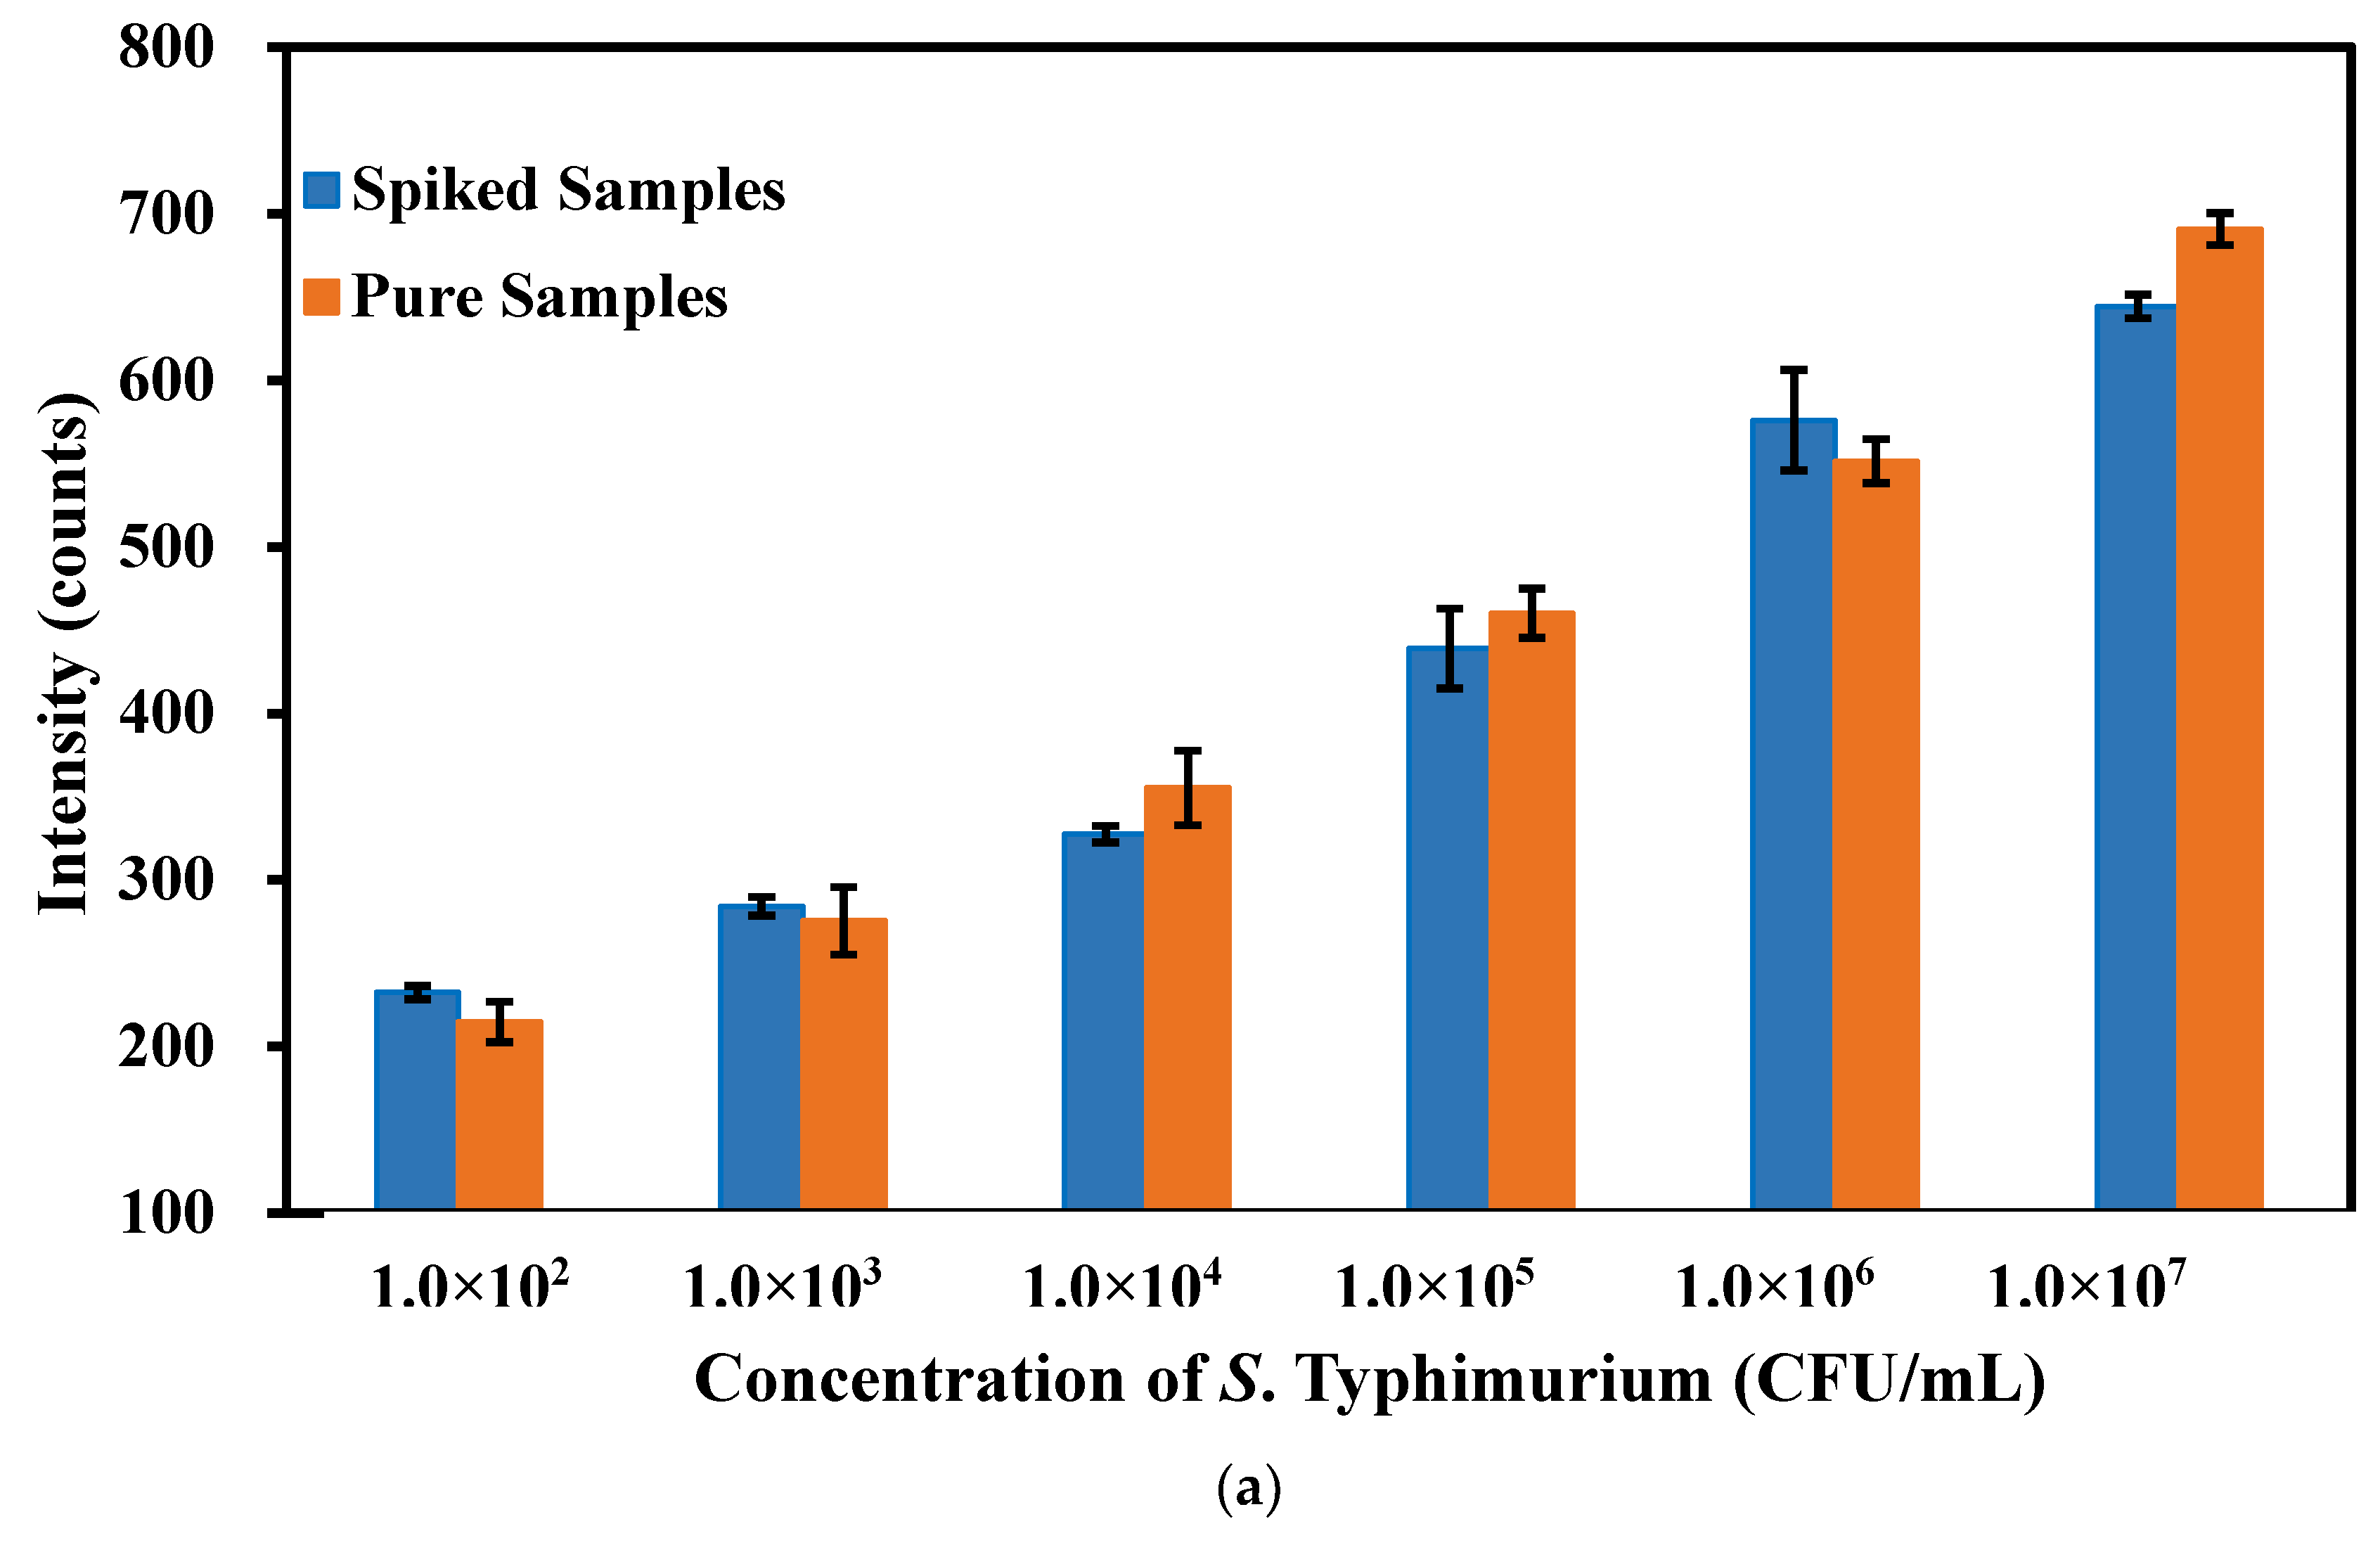
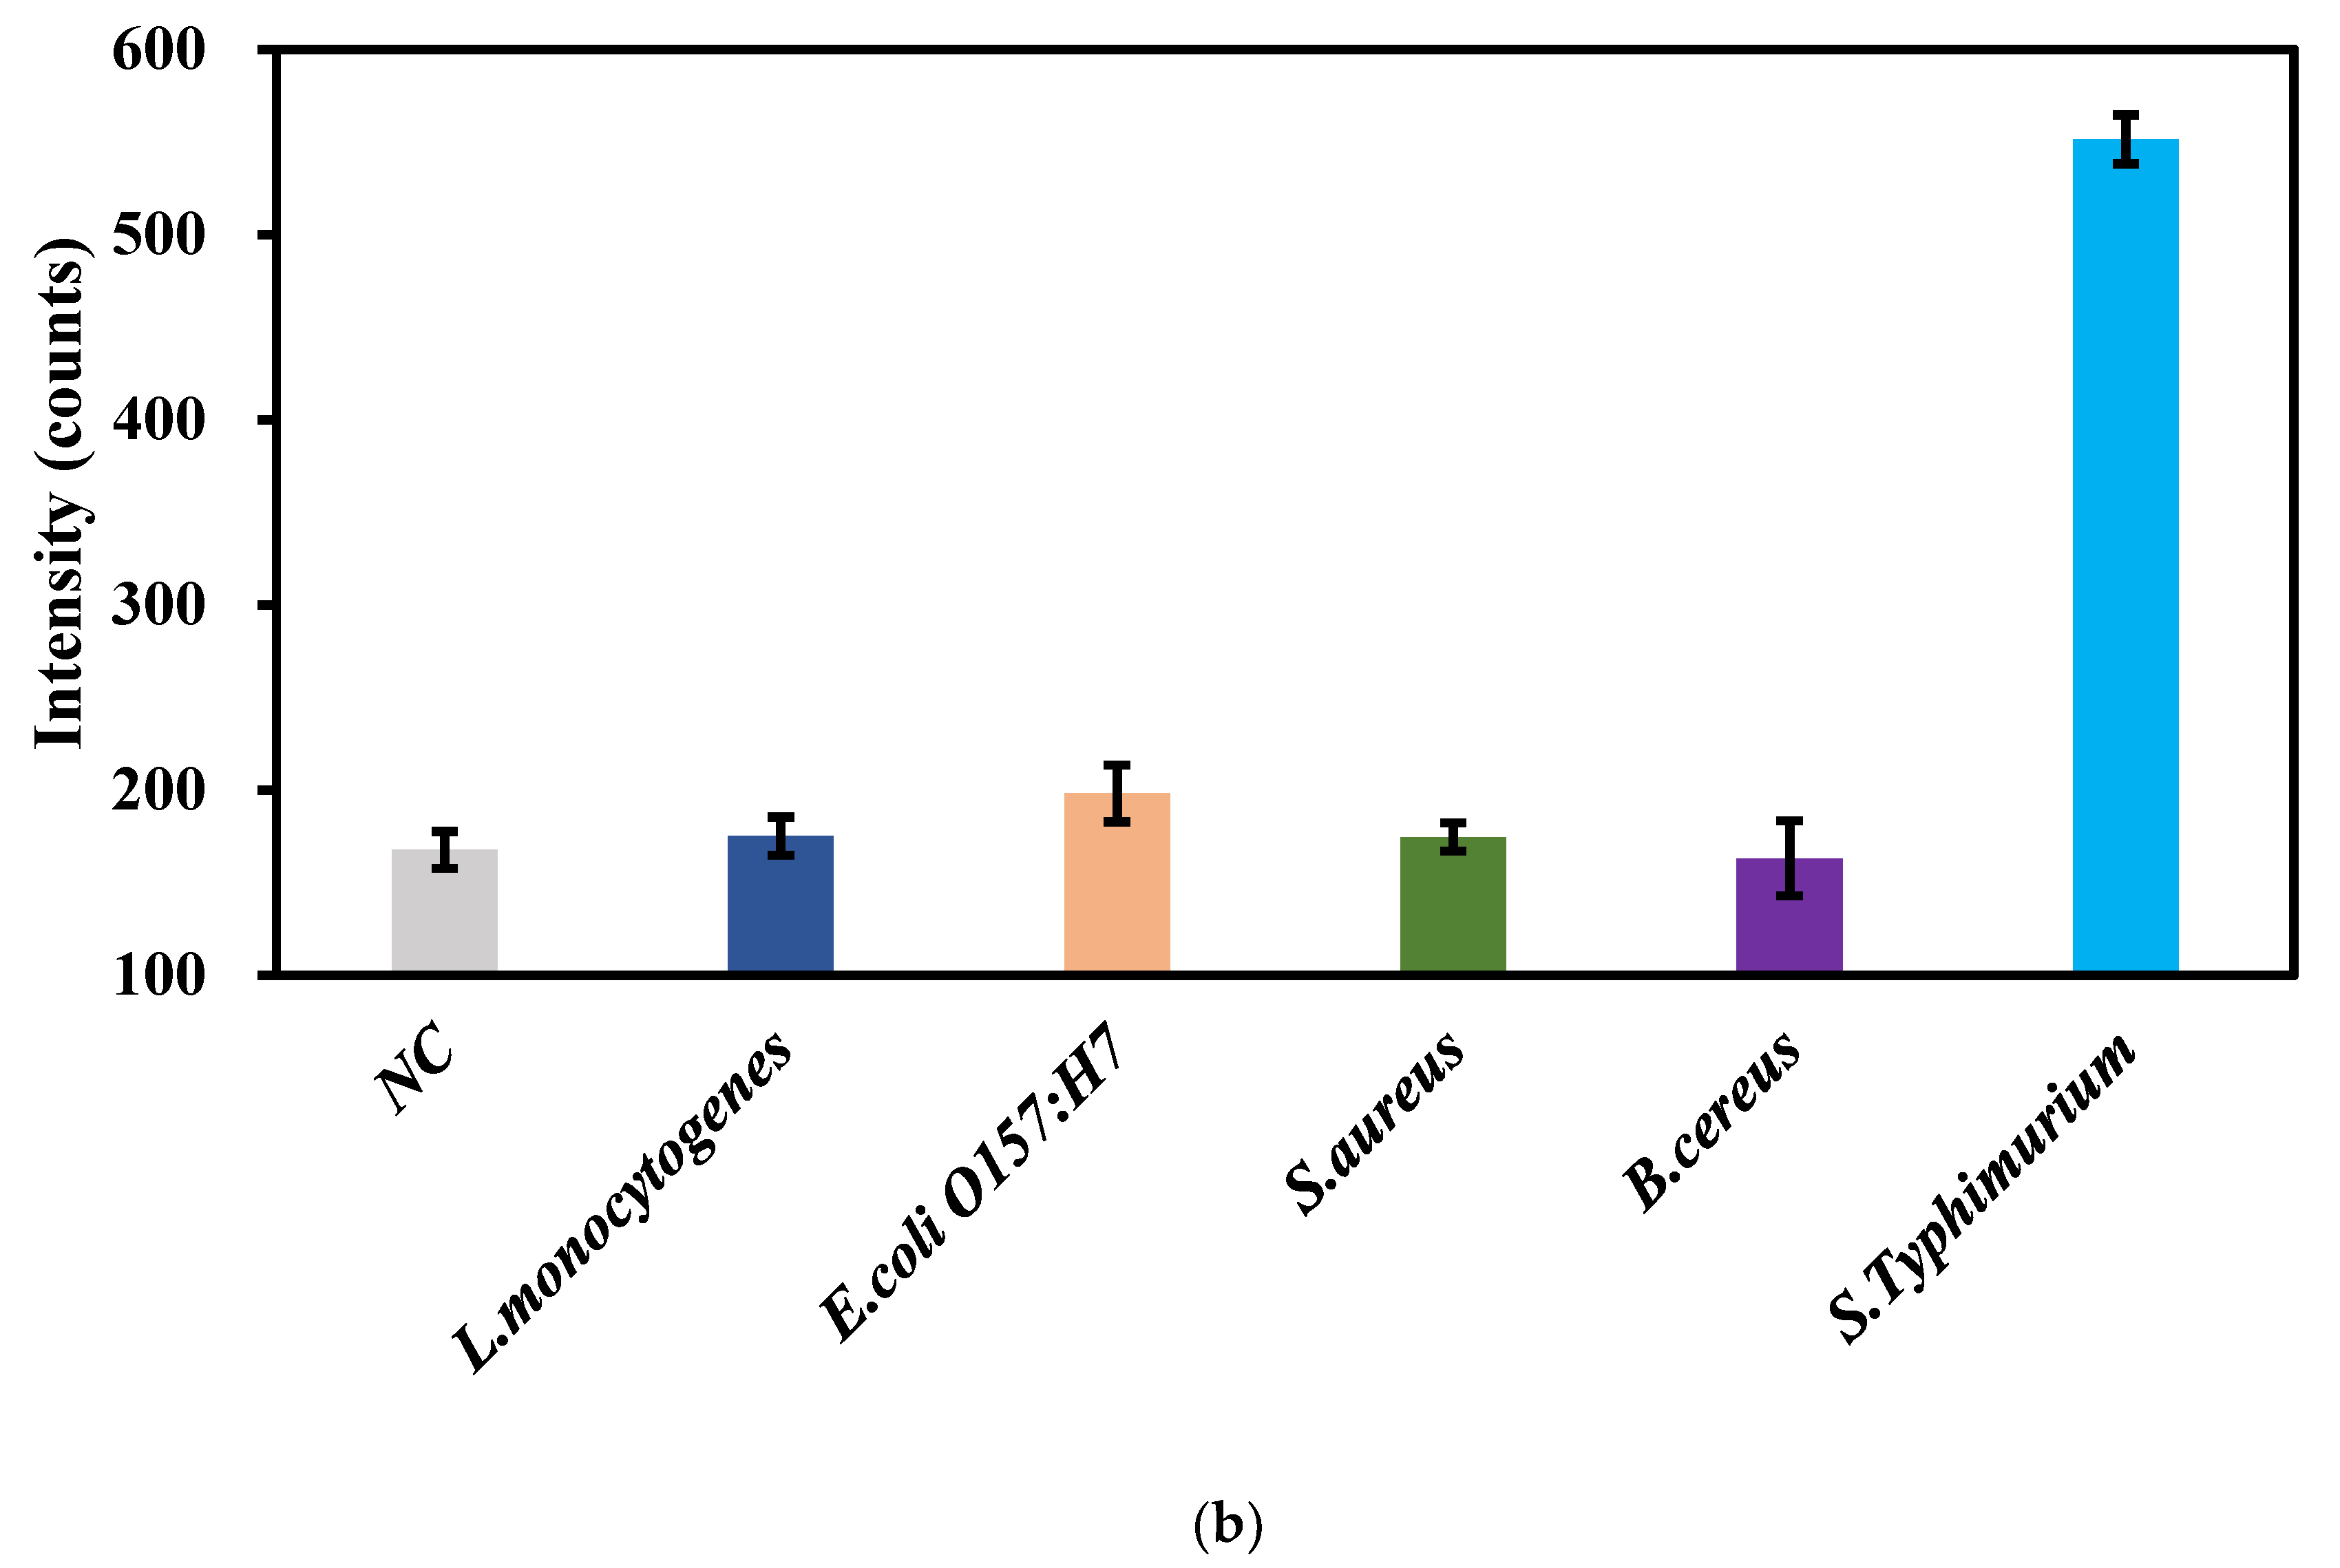
3.6. Applicability of This Biosensor

To evaluate the applicability of this biosensor for detection of Salmonella Typhimurium in food samples, chicken meats were purchased from the local supermarket and used as a real sample model. Prior to testing, 25 g of a chicken meat was added into 225 mL of PBS to obtain the supernatant. Different concentrations of target Salmonella Typhimurium cells were added into the supernatant to prepare the spiked chicken samples with the bacterial concentrations ranging from 1.0 × 10² to 1.0 × 10⁷ CFU/mL, which were detected by this biosensor. As shown in Figure 5a, there are only slight differences on the fluorescent intensity between the spiked chicken sample and the pure culture at each concentration, which are mainly caused by non-specific binding of the impurities in the spiked samples. The recoveries (the ratio of the readout of the biosensor to the original concentration) for the concentrations from 1.0 × 10² to 1.0 × 10⁷ CFU/mL were 111.5%, 104.0%, 90.6%, 94.7%, 105.0%, and 92.6%, respectively, and the mean recovery was 99.7%, verifying the applicability of this fluorescent biosensor for detection of Salmonella Typhimurium in real samples.
The specificity of this biosensor was evaluated using L. monocytogenes, E. coli O157:H7, S. aureus and B. cereus as non-target bacteria. The negative control (PBS) and the same concentration (1.0 × 10⁵ CFU/mL) of the target and non-target bacteria were detected using this biosensor. As shown in Figure 5b, it was obvious that the fluorescent intensity of the target bacteria is much higher than those of the non-target bacteria, which are close to that of the negative control, indicating that this biosensor has a good specificity. This could be attributed to the good specificity of the monoclonal and polyclonal antibodies against the target bacteria.

4. Conclusions

In summary, a microfluidic biosensor using MNPs for separation and enrichment, QDs for fluorescent labeling, MnO2 NFs for signal amplification, and GSH for QDs release was successfully developed for rapid and sensitive detection of Salmonella Typhimurium. Under the optimal conditions, this biosensor had a wide linear detection range from 1.0 × 10² to 1.0 × 10⁷ CFU/mL and was able to detect Salmonella Typhimurium as low as 43 CFU/mL in spiked chicken meats. The MnO2 NFs were demonstrated to have high specific surface area to load more QDs for signal amplification to improve the sensitivity of the biosensor. More importantly, this biosensor integrated the mixing, immune reaction, magnetic separation, and QDs release onto one single microfluidic chip, which was promising for in-field applications in foodborne pathogen detection. This biosensor also has the potential to be extended for the detection of other foodborne pathogens by changing the biological recognition elements.

Supplementary Materials

The following are available online at https://www.mdpi.com/2072-666X/11/3/281/s1, Figure S1: The fluorescence of the released QDs on 2-fold dilutions of the MnO2-QD NFs, Figure S2: (a) Optimization of the amount of the QDs; (b) Optimization of the amount of the MnO2-QD-pAb NFs; (c) Optimization of the flow rate, Figure S3: (a) Difference in separation chamber with or without magnets; (b) The color of supernatant of MNPs, suspended MNPs after separating and original MNPs. Procedure 1: Preparation of the bacteria, Procedure 2: Preparation of the MnO2 NFs.

Author Contributions

In this paper, L.H. contributed to the Methodology, Data Curation, Validation and Writing-original draft. L.X. contributed to the Formal analysis and Investigation. F.H. contributed to the Resources. G.C. and W.Q. contributed to the Software. M.Z., Q.H. and Z.W. contributed to the Resources. J.L. contributed to the Conceptualization, Supervision and Writing-review & editing. All authors have read and agreed to the published version of the manuscript.

Funding

This research was funded by Chinese Academy of Engineering (2018-ZD-02-04-01) and National Key Research and Development of China (2016YFD0500900).

Acknowledgments

The authors would like to thank Walmart Food Safety Collaboration Center for its great support.

Conflicts of Interest

The authors declare no conflict of interest.

References

  1. Mutreja, R.; Jariyal, M.; Pathania, P.; Sharma, A.; Sahoo, D.K.; Suri, C.R. Novel surface antigen based impedimetric immunosensor for detection of Salmonella typhimurium in water and juice samples. Biosens. Bioelectron. 2016, 85, 707–713. [Google Scholar] [CrossRef] [PubMed]
  2. Ronkainen, N.J.; Halsall, H.B.; Heineman, W.R. Electrochemical biosensors. Chem. Soc. Rev. 2010, 39, 1747–1763. [Google Scholar] [CrossRef] [PubMed]
  3. Wang, L.; Wang, R.; Chen, F.; Jiang, T.; Wang, H.; Slavik, M.; Wei, H.; Li, Y. QCM-based aptamer selection and detection of Salmonella typhimurium. Food Chem. 2017, 221, 776–782. [Google Scholar] [CrossRef] [PubMed]
  4. Bakhshpour, M.; Piskin, A.K.; Yavuz, H.; Denizli, A. Quartz crystal microbalance biosensor for label-free MDA MB 231 cancer cell detection via notch-4 receptor. Talanta 2019, 204, 840–845. [Google Scholar] [CrossRef] [PubMed]
  5. Yazgan, I.; Noah, N.M.; Toure, O.; Zhang, S.; Sadik, O.A. Biosensor for selective detection of E. coli in spinach using the strong affinity of derivatized mannose with fimbrial lectin. Biosens. Bioelectron. 2014, 61, 266–273. [Google Scholar] [CrossRef] [PubMed]
  6. Souto, D.E.P.; Volpe, J.; Goncalves, C.C.; Ramos, C.H.I.; Kubota, L.T. A brief review on the strategy of developing SPR-based biosensors for application to the diagnosis of neglected tropical diseases. Talanta 2019, 205, 120122. [Google Scholar] [CrossRef]
  7. Mei, H.; Pan, J.; Zhang, Z.; Zhang, L.; Tong, L. Coiled Optical Nanofiber for Optofluidic Absorbance Detection. ACS Sens. 2019, 4, 2267–2271. [Google Scholar] [CrossRef]
  8. Huang, J.; Sun, J.; Warden, A.R.; Ding, X. Colorimetric and photographic detection of bacteria in drinking water by using 4-mercaptophenylboronic acid functionalized AuNPs. Food Control 2020, 108, 106885. [Google Scholar] [CrossRef]
  9. Zheng, L.; Qi, P.; Zhang, D. Identification of bacteria by a fluorescence sensor array based on three kinds of receptors functionalized carbon dots. Sens. Actuators B Chem. 2019, 286, 206–213. [Google Scholar] [CrossRef]
  10. Shrivastava, S.; Lee, W.I.; Lee, N.E. Culture-free, highly sensitive, quantitative detection of bacteria from minimally processed samples using fluorescence imaging by smartphone. Biosens. Bioelectron. 2018, 109, 90–97. [Google Scholar] [CrossRef]
  11. Liang, W.; Chen, Q.; Peng, F.; Shen, A.; Hu, J. A novel surface-enhanced Raman scattering (SERS) detection for natural gas exploration using methane-oxidizing bacteria. Talanta 2018, 184, 156–161. [Google Scholar] [CrossRef] [PubMed]
  12. Ilhan, H.; Guven, B.; Dogan, U.; Torul, H.; Evran, S.; Cetin, D.; Suludere, Z.; Saglam, N.; Boyaci, I.H.; Tamer, U. The coupling of immunomagnetic enrichment of bacteria with paper-based platform. Talanta 2019, 201, 245–252. [Google Scholar] [CrossRef] [PubMed]
  13. Zhou, B.; Chen, Y.-T.; Zhen, X.-L.; Lou, L.; Yong-Sheng, W.; Suo, Q.-L. Fluorescent resonance energy transfer of organic fluorescent dyes with gold nanoparticles and their analytical application. Gold Bull. 2018, 51, 145–151. [Google Scholar] [CrossRef]
  14. Li, H.P.; Dou, Z.; Chen, S.Q.; Hu, M.; Li, S.; Sun, H.M.; Jiang, Y.; Zhai, Q.G. Design of a Multifunctional Indium-Organic Framework: Fluorescent Sensing of Nitro Compounds, Physical Adsorption, and Photocatalytic Degradation of Organic Dyes. Inorg. Chem. 2019, 58, 11220–11230. [Google Scholar] [CrossRef] [PubMed]
  15. Yuan, J.; Cen, Y.; Kong, X.J.; Wu, S.; Liu, C.L.; Yu, R.Q.; Chu, X. MnO2-Nanosheet-Modified Upconversion Nanosystem for Sensitive Turn-On Fluorescence Detection of H2O2 and Glucose in Blood. ACS Appl. Mater. Interfaces 2015, 7, 10548–10555. [Google Scholar] [CrossRef] [PubMed]
  16. Hu, Q.; Wei, Q.; Zhang, P.; Li, S.; Xue, L.; Yang, R.; Wang, C.; Zhou, L. An up-converting phosphor technology-based lateral flow assay for point-of-collection detection of morphine and methamphetamine in saliva. Analyst 2018, 143, 4646–4654. [Google Scholar] [CrossRef] [PubMed]
  17. Li, Y.; Ma, Q.; Liu, Z.; Wang, X.; Su, X. A novel enzyme-mimic nanosensor based on quantum dot-Au nanoparticle@silica mesoporous microsphere for the detection of glucose. Anal. Chim. Acta 2014, 840, 68–74. [Google Scholar] [CrossRef]
  18. Zhang, H.; Nie, C.; Wang, J.; Guan, R.; Cao, D. Synthesis of novel organic-inorganic hybrid fluorescent microspheres and their applications as Fe(III), Hg(II) and biothiols probes. Talanta 2019, 195, 713–719. [Google Scholar] [CrossRef]
  19. Shan, X.; Chai, L.; Ma, J.; Qian, Z.; Chen, J.; Feng, H. B-doped carbon quantum dots as a sensitive fluorescence probe for hydrogen peroxide and glucose detection. Analyst 2014, 139, 2322–2325. [Google Scholar] [CrossRef]
  20. Zhou, L.; Ji, F.; Zhang, T.; Wang, F.; Li, Y.; Yu, Z.; Jin, X.; Ruan, B. An fluorescent aptasensor for sensitive detection of tumor marker based on the FRET of a sandwich structured QDs-AFP-AuNPs. Talanta 2019, 197, 444–450. [Google Scholar] [CrossRef]
  21. Rong, M.; Yang, X.; Huang, L.; Chi, S.; Zhou, Y.; Shen, Y.; Chen, B.; Deng, X.; Liu, Z.Q. Hydrogen Peroxide-Assisted Ultrasonic Synthesis of BCNO QDs for Anthrax Biomarker Detection. ACS Appl. Mater. Interfaces 2019, 11, 2336–2343. [Google Scholar] [CrossRef] [PubMed]
  22. Zhang, X.; Wang, B.; Liu, Z. Tuning PbS QDs deposited onto TiO2 nanotube arrays to improve photoelectrochemical performances. J. Colloid Interface Sci. 2016, 484, 213–219. [Google Scholar] [CrossRef] [PubMed] [Green Version]
  23. Yang, J.; Zhang, Z.; Yan, G. An aptamer-mediated CdSe/ZnS QDs@graphene oxid composite fluorescent probe for specific detection of insulin. Sens. Actuators B Chem. 2018, 255, 2339–2346. [Google Scholar] [CrossRef]
  24. Chen, Y.; Tan, C.; Zhang, H.; Wang, L. Two-dimensional graphene analogues for biomedical applications. Chem. Soc. Rev. 2015, 44, 2681–2701. [Google Scholar] [CrossRef] [PubMed]
  25. Dong, Z.Z.; Lu, L.; Ko, C.N.; Yang, C.; Li, S.; Lee, M.Y.; Leung, C.H.; Ma, D.L. A MnO2 nanosheet-assisted GSH detection platform using an iridium(iii) complex as a switch-on luminescent probe. Nanoscale 2017, 9, 4677–4682. [Google Scholar] [CrossRef] [PubMed]
  26. Wang, Q.; Pang, H.; Dong, Y.; Chi, Y.; Fu, F. Colorimetric determination of glutathione by using a nanohybrid composed of manganese dioxide and carbon dots. Mikrochim. Acta 2018, 185, 291. [Google Scholar] [CrossRef]
  27. Yan, X.; Song, Y.; Zhu, C.; Song, J.; Du, D.; Su, X.; Lin, Y. Graphene Quantum Dot-MnO2 Nanosheet Based Optical Sensing Platform: A Sensitive Fluorescence “Turn Off-On” Nanosensor for Glutathione Detection and Intracellular Imaging. ACS Appl. Mater. Interfaces 2016, 8, 21990–21996. [Google Scholar] [CrossRef]
  28. Gao, Z.F.; Ogbe, A.Y.; Sann, E.E.; Wang, X.; Xia, F. Turn-on fluorescent sensor for the detection of glucose using manganese dioxide−phenol formaldehyde resin nanocomposite. Talanta 2018, 180, 12–17. [Google Scholar] [CrossRef]
  29. Yan, X.; Song, Y.; Zhu, C.; Li, H.; Du, D.; Su, X.; Lin, Y. MnO2 Nanosheet-Carbon Dots Sensing Platform for Sensitive Detection of Organophosphorus Pesticides. Anal. Chem. 2018, 90, 2618–2624. [Google Scholar] [CrossRef]
  30. Reinmets, K.; Dehkharghani, A.; Guasto, J.S.; Fuchs, S.M. Microfluidic quantification and separation of yeast based on surface adhesion. Lab Chip 2019, 19, 3481–3489. [Google Scholar] [CrossRef] [Green Version]
  31. Yang, R.-J.; Fu, L.-M.; Hou, H.-H. Review and perspectives on microfluidic flow cytometers. Sens. Actuators B Chem. 2018, 266, 26–45. [Google Scholar] [CrossRef]
  32. Pang, L.; Ding, J.; Ge, Y.; Fan, J.; Fan, S.K. Single-Cell-Derived Tumor-Sphere Formation and Drug-Resistance Assay Using an Integrated Microfluidics. Anal. Chem. 2019, 91, 8318–8325. [Google Scholar] [CrossRef] [PubMed]
  33. Tian, S.; Zhang, Z.; Chen, J.; Du, M.; Li, Z.; Yang, H.; Ji, X.; He, Z. Digital analysis with droplet-based microfluidic for the ultrasensitive detection of beta-gal and AFP. Talanta 2018, 186, 24–28. [Google Scholar] [CrossRef] [PubMed]
  34. Trinh, K.T.L.; Lee, N.Y. A portable microreactor with minimal accessories for polymerase chain reaction: Application to the determination of foodborne pathogens. Microchim. Acta 2017, 184, 4225–4233. [Google Scholar] [CrossRef]
  35. Ghosh Dastider, S.; Barizuddin, S.; Yuksek, N.S.; Dweik, M.; Almasri, M.F. Efficient and Rapid Detection ofSalmonellaUsing Microfluidic Impedance Based Sensing. J. Sens. 2015, 2015, 1–8. [Google Scholar] [CrossRef] [Green Version]
  36. Liu, J.; Jasim, I.; Shen, Z.; Zhao, L.; Dweik, M.; Zhang, S.; Almasri, M. A microfluidic based biosensor for rapid detection of Salmonella in food products. PLoS ONE 2019, 14, e0216873. [Google Scholar] [CrossRef] [Green Version]
  37. Wang, S.; Zheng, L.; Cai, G.; Liu, N.; Liao, M.; Li, Y.; Zhang, X.; Lin, J. A microfluidic biosensor for online and sensitive detection of Salmonella typhimurium using fluorescence labeling and smartphone video processing. Biosens. Bioelectron. 2019, 140, 111333. [Google Scholar] [CrossRef]
  38. Santana, H.S.; Silva, J.L.; Taranto, O.P. Optimization of micromixer with triangular baffles for chemical process in millidevices. Sens. Actuators B Chem. 2019, 281, 191–203. [Google Scholar] [CrossRef]
  39. Xue, L.; Huang, F.; Hao, L.; Cai, G.; Zheng, L.; Li, Y.; Lin, J. A sensitive immunoassay for simultaneous detection of foodborne pathogens using MnO2 nanoflowers-assisted loading and release of quantum dots. Sumbitted to Food Chem. Food Chem. 2020. under review. [Google Scholar]
  40. Lin, J.; Li, M.; Li, Y.; Chen, Q. A high gradient and strength bioseparator with nano-sized immunomagnetic particles for specific separation and efficient concentration of E. coli O157:H7. J. Magn. Magn. Mater. 2015, 378, 206–213. [Google Scholar] [CrossRef]
Scheme 1. (a) The schematic of the microfluidic chip; (b) The principle of the fluorescent biosensor for rapid and sensitive detection of Salmonella Typhimurium.
Micromachines 11 00281 sch001aMicromachines 11 00281 sch001b
Figure 1. (a) The simulation on mixing efficiency of the mixing channel; (b) The mixing of two inks in the microfluidic chip.
Micromachines 11 00281 g001
Figure 2. (a) The TEM image of the MnO2 NFs; (b) The TEM image of the MnO2-QD NFs. The inset is the TEM image of the QDs; (c) The fluorescent spectra of the QDs, MnO2 NFs, MnO2-QD NFs, and the mixture of the MnO2-QD NFs and GSH.
Micromachines 11 00281 g002
Figure 3. (a) The distribution of the magnetic field; (b) The strength of the magnetic field in the separation chamber at the vertical direction; (c) The strength of the magnetic field in the separation chamber at the horizontal direction; (d) The strength of the magnetic field from the separation chamber to the incubation channel.
Micromachines 11 00281 g003aMicromachines 11 00281 g003b
Figure 4. (a) The spectra of the MNP-bacteria-MnO2-QD complexes at different concentrations from 1.0 × 10² CFU/mL to 1.0 × 10⁷ CFU/mL; (b) The linear relationship between the fluorescent intensity and the bacterial concentration; (c) The TEM image of the MNP-bacteria-MnO2-QD complexes.
Micromachines 11 00281 g004aMicromachines 11 00281 g004b
Figure 5. (a) Detection of chicken samples spiked with Salmonella Typhimurium (N = 3); (b) Detection of L. monocytogenes, E. coli O157:H7, S. aureus, B. cereus, and S. Typhimurium at the same concentration of 105 CFU/mL, and the negative control (N = 3).
Micromachines 11 00281 g005aMicromachines 11 00281 g005b

