Article

Changes in Plasma Lipid Levels Following Cortical Spreading Depolarization in a Transgenic Mouse Model of Familial Hemiplegic Migraine

by
Inge C. M. Loonen
1,†,
Isabelle Kohler
2,†,‡,§,
Mohan Ghorasaini
2,
Martin Giera
2,
Arn M. J. M. van den Maagdenberg
1,3,
Oleg A. Mayboroda
2 and
Else A. Tolner
1,3,*
1
Department of Human Genetics, Leiden University Medical Center, 2333 ZC Leiden, The Netherlands
2
Center for Proteomics and Metabolomics, Leiden University Medical Center, 2333 ZC Leiden, The Netherlands
3
Department of Neurology, Leiden University Medical Center, 2333 ZC Leiden, The Netherlands
*
Author to whom correspondence should be addressed.
These authors contributed equally to this work.
Current affiliation: Division of BioAnalytical Chemistry, Amsterdam Institute of Molecular and Life Sciences (AIMMS), Vrije Universiteit Amsterdam, 1081 HV Amsterdam, The Netherlands.
§
Current affiliation: Center for Analytical Sciences Amsterdam, 1098 XH Amsterdam, The Netherlands.
Metabolites 2022, 12(3), 220; https://doi.org/10.3390/metabo12030220
Submission received: 2 February 2022 / Revised: 23 February 2022 / Accepted: 24 February 2022 / Published: 1 March 2022
(This article belongs to the Special Issue Frontiers in the Study of Metabolic Diseases Using Rodent Models)

Abstract

:
Metabolite levels in peripheral body fluids can correlate with attack features in migraine patients, which underscores the potential of plasma metabolites as possible disease biomarkers. Migraine headache can be preceded by an aura that is caused by cortical spreading depolarization (CSD), a transient wave of neuroglial depolarization. We previously identified plasma amino acid changes after CSD in familial hemiplegic migraine type 1 (FHM1) mutant mice that exhibit increased neuronal excitability and various migraine-related features. Here, we aimed to uncover lipid metabolic pathways affected by CSD, guided by findings on the involvement of lipids in hemiplegic migraine pathophysiology. Using targeted lipidomic analysis, we studied plasma lipid metabolite levels at different time points after CSD in wild-type and FHM1 mutant mice. Following CSD, the most prominent plasma lipid change concerned a transient increase in PGD2, which lasted longer in mutant mice. In wild-type mice only, levels of anti-inflammatory lipid mediators DPAn-3, EPA, ALA, and DHA were elevated 24 h following CSD compared to Sham-treated animals. Given the role of PGs and neuroinflammation in migraine pathophysiology, our findings underscore the potential of monitoring peripheral changes in lipids to gain insight in central brain mechanisms.

Graphical Abstract

1. Introduction

Migraine is a very common, highly disabling brain disorder, characterized by recurrent attacks of typically unilateral headache and associated neurological symptoms [1,2]. In about one-third of patients, the headache phase is preceded by transient focal neurological symptoms referred to as the aura [2]. The electrophysiological correlate of the aura is cortical spreading depolarization (CSD), a transient wave of intense neuronal and glial depolarization that slowly propagates through the cortex, which is followed by a long-lasting neuronal inactivity [3]. CSD events have been associated with the release of neuropeptides [3] and various brain metabolite changes, as shown for example by mass spectrometry (MS) imaging of brain sections of mice [4]. Due to CSD-related blood–brain barrier disruption [3,5,6], CSD-induced metabolite changes in the brain may be traceable in peripheral body fluids. In earlier work, we investigated CSD-related plasma metabolic changes using capillary electrophoresis—mass spectrometry (CE–MS) followed by multivariate data analysis, and observed changes in plasma levels of lysine and its by-product pipecolic acid in a mouse model of familial hemiplegic migraine type 1 (FHM1) [7]. FHM1 is a monogenic subtype of migraine with aura caused by specific missense mutations in the CACNA1A gene that encodes the pore-forming α1A subunit of neuronal CaV2.1 voltage-gated calcium channels [8]. FHM1 mutant knock-in mice carrying the human pathogenic R192Q missense mutation (‘R192Q mutant mice’) exhibit an enhanced CaV2.1 channel function and consequently a higher level of glutamatergic neurotransmission in the cortex, resulting in an enhanced susceptibility to experimentally induced CSD [9,10,11]. In the FHM1 mutant mice, CSDs are associated with an increased neuroinflammatory response, either immediately following CSD [12] or lasting for at least one day after CSD [13].
To further explore whether peripheral metabolic changes can be detected in response to CSD, also in the context of rare hemiplegic migraine, we here targeted a specific class of regulatory lipids, namely pro-resolving lipid mediators [14], of which we measured plasma levels at different time points following CSD. This targeted approach was chosen based on previous findings on lipid mediators that were indicated to play an important role in migraine pathophysiology, being involved in vasodilatation [15] and neuro-inflammation [16], and which have been related to increased attack severity [17] and frequency ([18,19,20,21,22] for review). However, little is known about the mechanisms underlying these processes at the metabolome level. Profiling CSD- and FHM1-related changes in plasma lipid metabolites in a quantitative manner, which is only possible in a targeted metabolomics approach, may offer a clinically applicable approach to obtain insight into pathophysiological mechanisms and may identify plasma lipid mediators as putative disease biomarkers. In patients with common migraine, such an approach revealed a migraine-associated decrease in high-density lipoprotein (HDL) and omega-3 fatty acid plasma levels [23] and various changes in serum lipid metabolites [24]. During migraine attacks, elevated levels of prostaglandins PGE2, PGD2α and PGF2 have been reported in saliva of patients [25,26], and for PGE2 also in plasma [27]. Based on the indicated role of lipids in migraine pathophysiology, we here carried out a targeted analysis of pro-resolving lipid mediators in plasma following CSD induction in WT and FHM1 mutant mice. Using reversed-phase liquid chromatography-tandem mass spectrometry (RPLC-MS/MS), absolute concentrations of lipids in plasma were assessed at different time points after CSD induction, that is, for a short-term period up to 1.5 h and for a long-term period up to 48 h after CSD.

2. Results

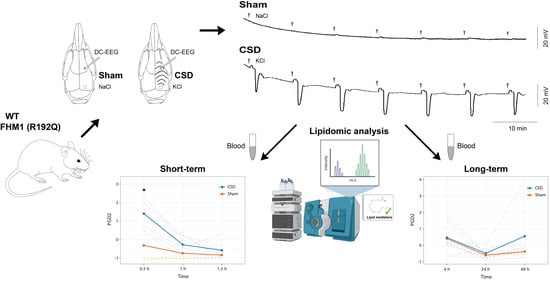
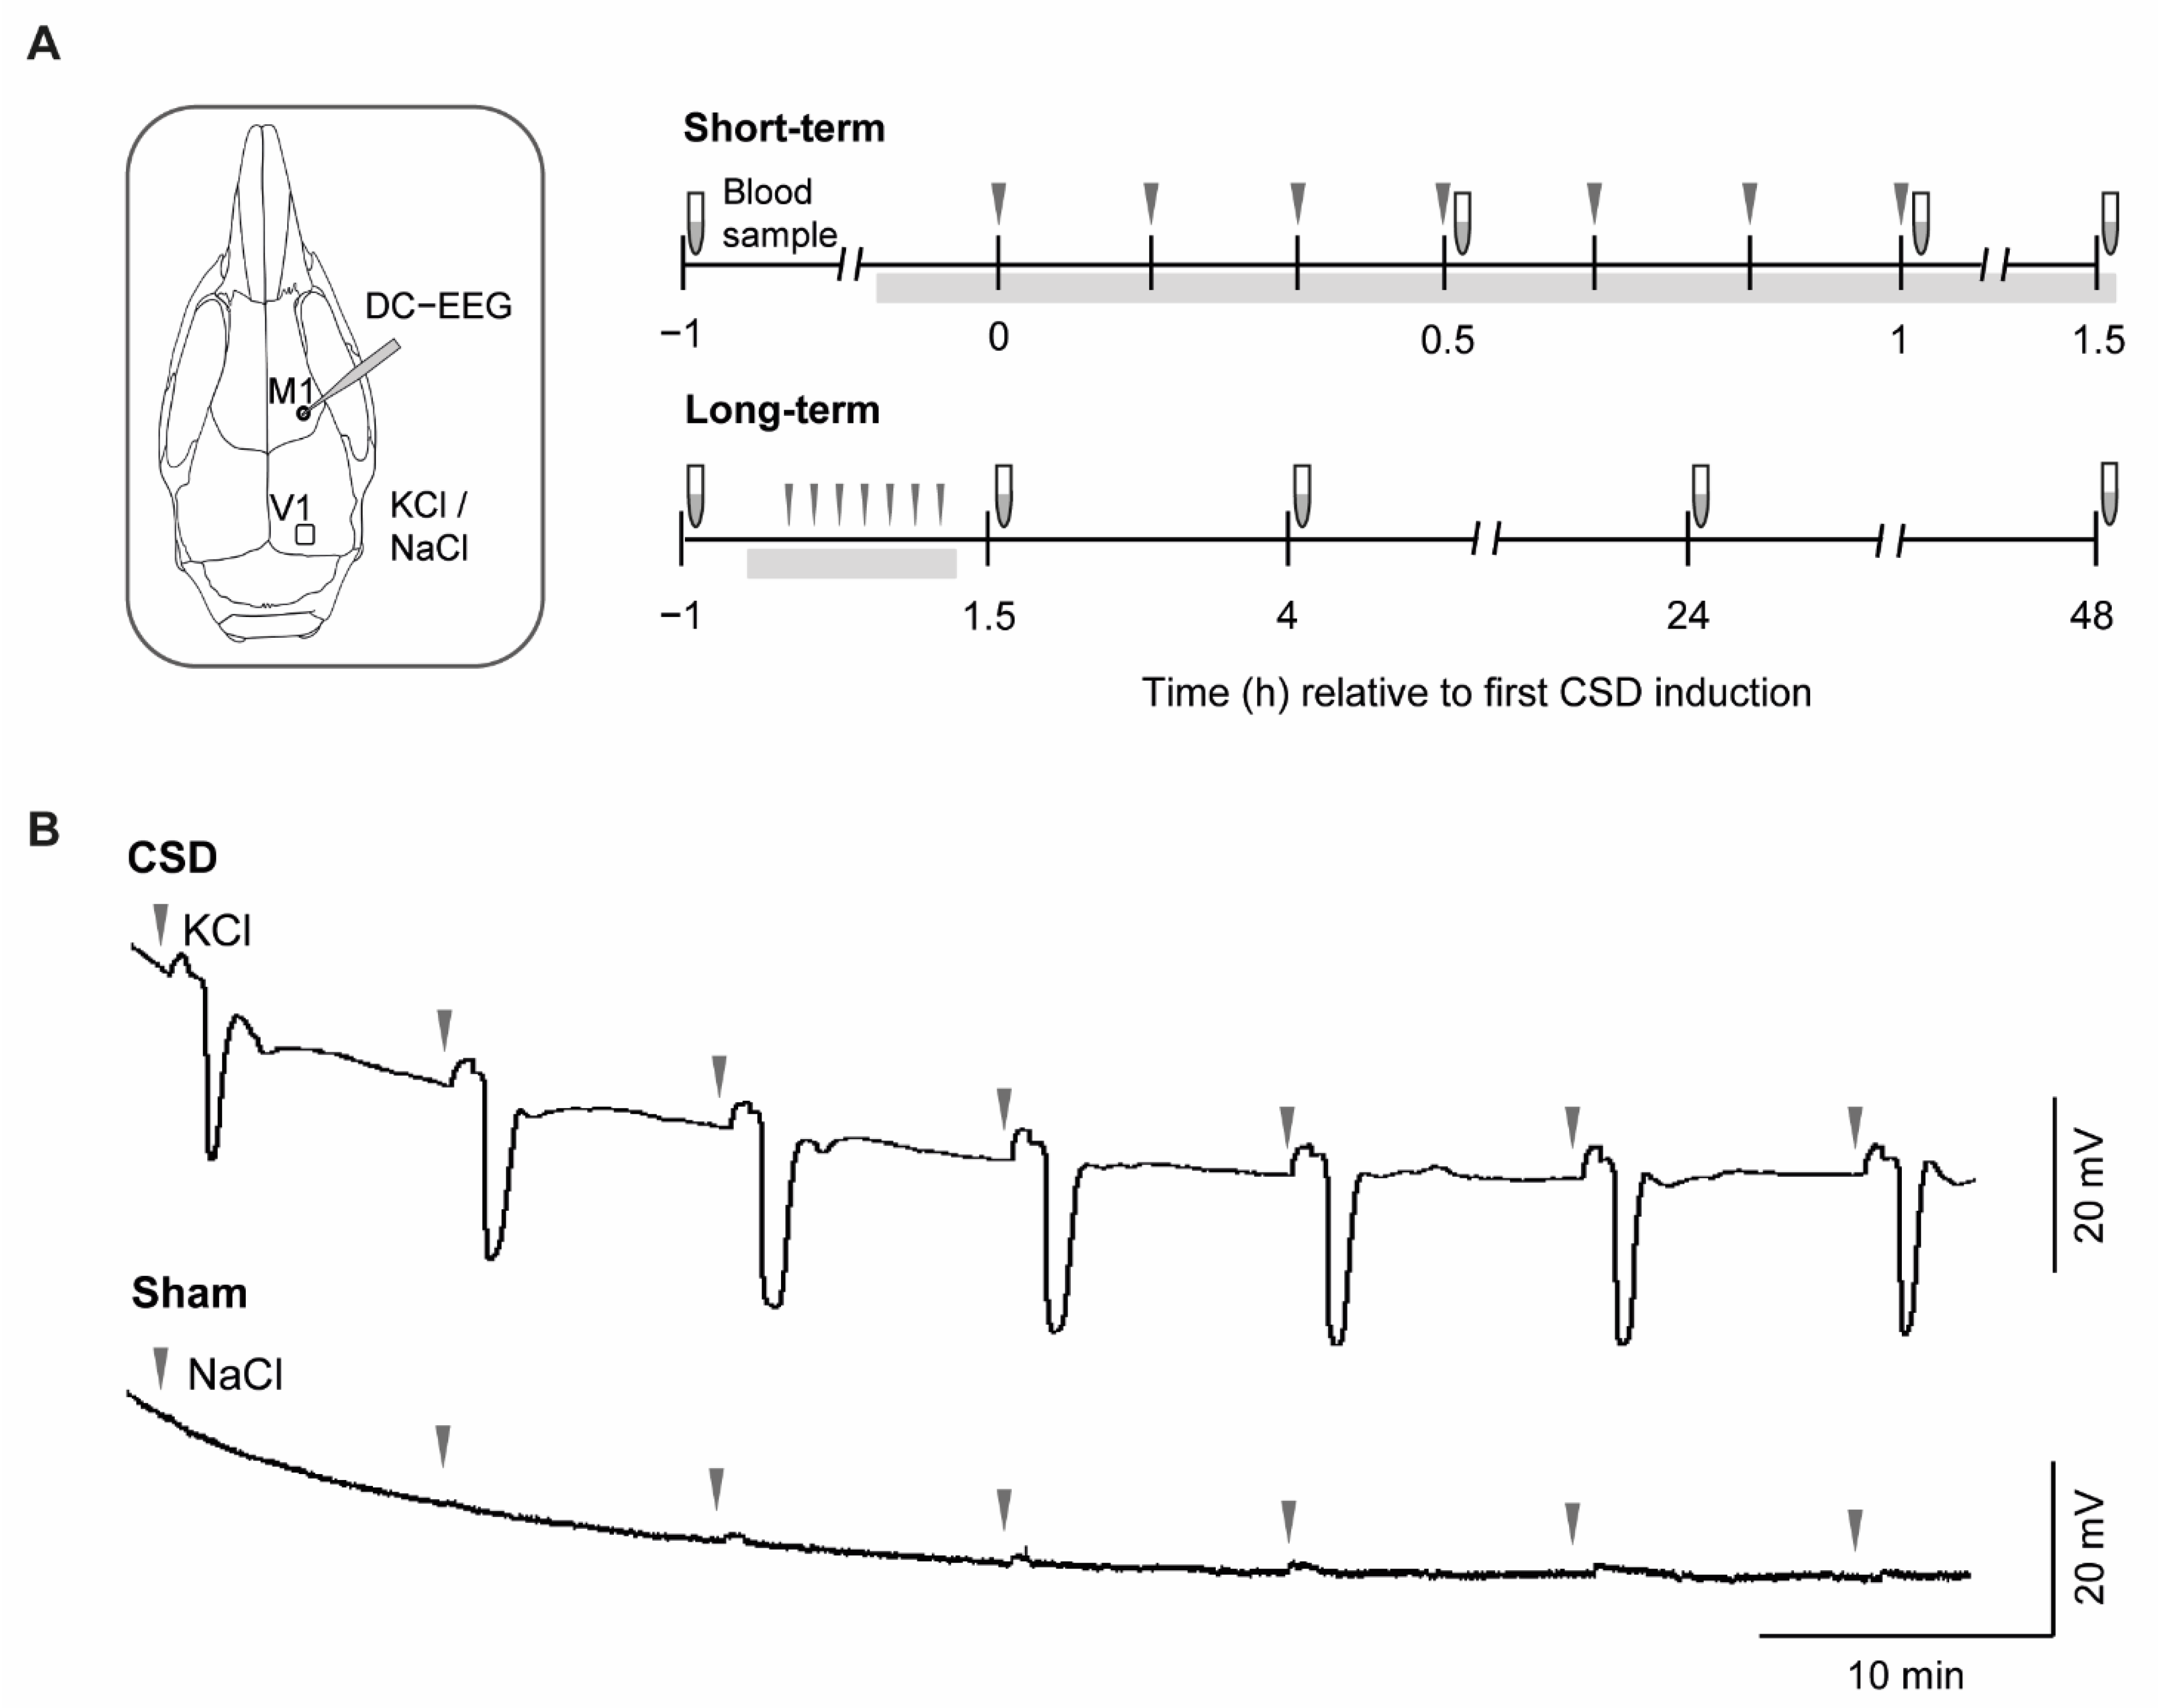
2.1. CSD Characteristics and Physiological Parameters

The study involved two independent sets of mouse experiments, covering short- and long-term time frames of blood sampling during and following induction of 7 CSD events in the cortex of mice during a 1 h period, by topical application of 300 mM KCl (or 300 mM NaCl in the Sham procedure) (Figure 1A,B). The 7-CSD induction paradigm was chosen mainly as it increases chances of capturing CSD-associated changes in peripheral lipid levels and allowed for blood sample collection in the immediate phase of CSD initiation (with a sample collected after the 4th CSD), directly after the CSD induction period (i.e., sample after the 7th CSD), and at multiple time points up to 2 days after CSD induction. In the short-term experiments, blood sample collection was performed up to 1.5 h following CSD, from anesthetized mice (as mice were kept under anesthesia after the CSD induction method until blood withdrawal), whereas in the long-term experiment, sample collection was performed up to 48 h following CSD, from awake mice (as mice needed to be woken up from anesthesia). CSD characteristics amplitude and half-width duration did not differ between WT and R192Q mutant mice for both the short-term and long-term experiments (Table 1). Physiological parameters pH, pCO2, pO2, mean arterial blood pressure that were assessed during the short-term experiments, were within physiological ranges and did not differ between genotypes and treatment groups (Table 1).

2.2. Targeted Quantitative Analysis of Lipid Mediators in Peripheral Plasma Following CSD

To decipher the contribution of lipid mediators to consequences of CSD, absolute plasma concentrations of adrenic acid (AdA), docosahexaenoic acid (DHA), arachidonic acid (AA), eicosapentaenoic acid (EPA), docosapentaenoic acid omega-3 (DPAn-3), linoleic acid (LA), linolenic acid (ALA), 10-hydroxydocosahexaenoic acid (10-HDHA), 7-HDHA, 17-HDHA, leukotriene E4 (LTE4), 5-hydroxyeicosatetraenoic acid (5-HETE), 8-HETE, 11-HETE, 12-HETE, 15-HETE, 14,15-diHETE, 19,20-dihydroxydocosapentaenoic acid (19,20-DiHDPA), and prostaglandin D2 (PGD2) were determined using a targeted RPLC-MS/MS approach. PGE2, 8(9)-epoxyeicosatrienoic acid (8(9)-EET), 11(12)-EET, 14(15)-EET, 9-hydroxyoctadecadienoic acid (9-HoDE), 13-HoDE, 9-hydroxyoctadecatrienoic acid (9-HoTrE) and 13-HoTrE showed a signal higher than the limit of detection (LOD) but lower than the validated lower limit of quantitation (LLOQ) of the quantitation method so instead of the concentration, the peak area was determined. Table S1 provides a list of all targeted (and measured) lipid mediators, structured by metabolic class.
Firstly, we evaluated the lipid concentrations in the plasma samples that were collected from untreated mice, so prior to the start of the CSD experiments. For some of the metabolites quantified, a relatively large inter-individual biological variability was observed between animals within each group. To allow for a comparison across metabolites and experimental groups, these metabolites data were reported as the ratio between the metabolic product and the substrate of a shared metabolic pathway, reflecting the enzymatic activity. Figure 2 shows a volcano plot built on the comparison of the plasma lipid mediators in WT and R192Q mutant mice that revealed no statistically significant differences in lipid concentrations between the two genotypes at baseline. Supplementary Figure S1 shows the abundance of the plasma lipids in a heatmap from the baseline samples. Accordingly, no genotype-specific difference was revealed.

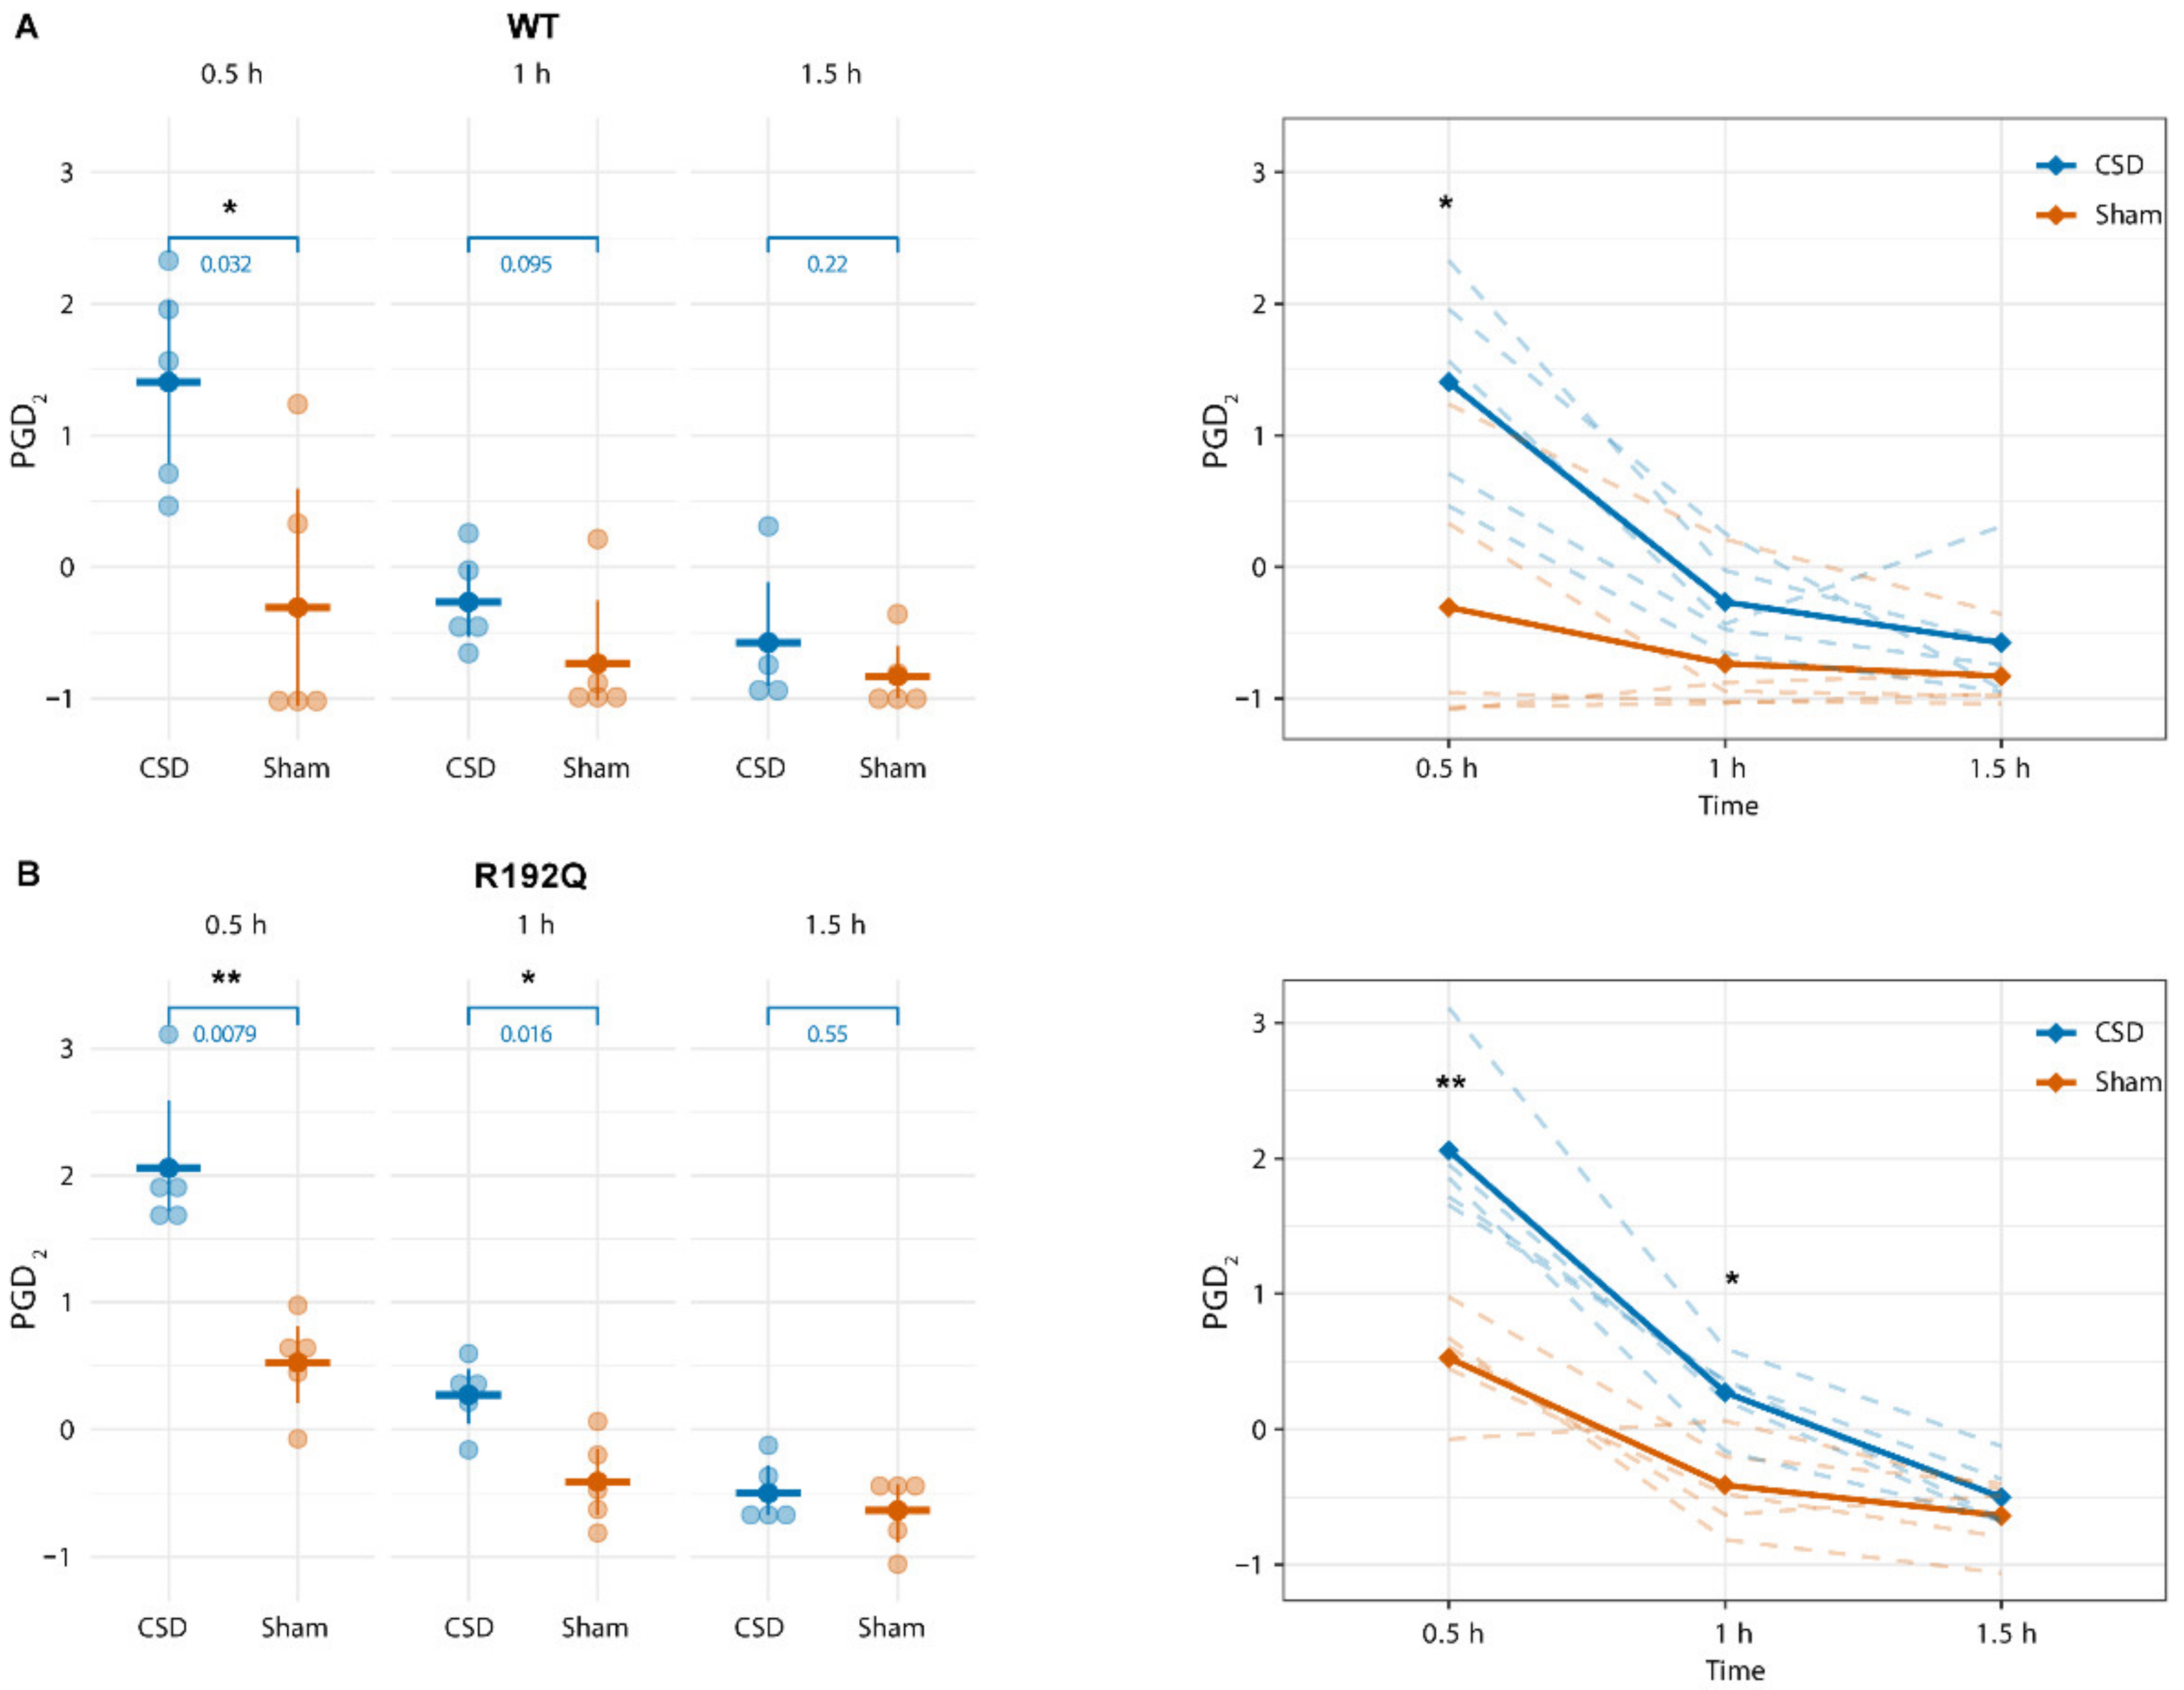
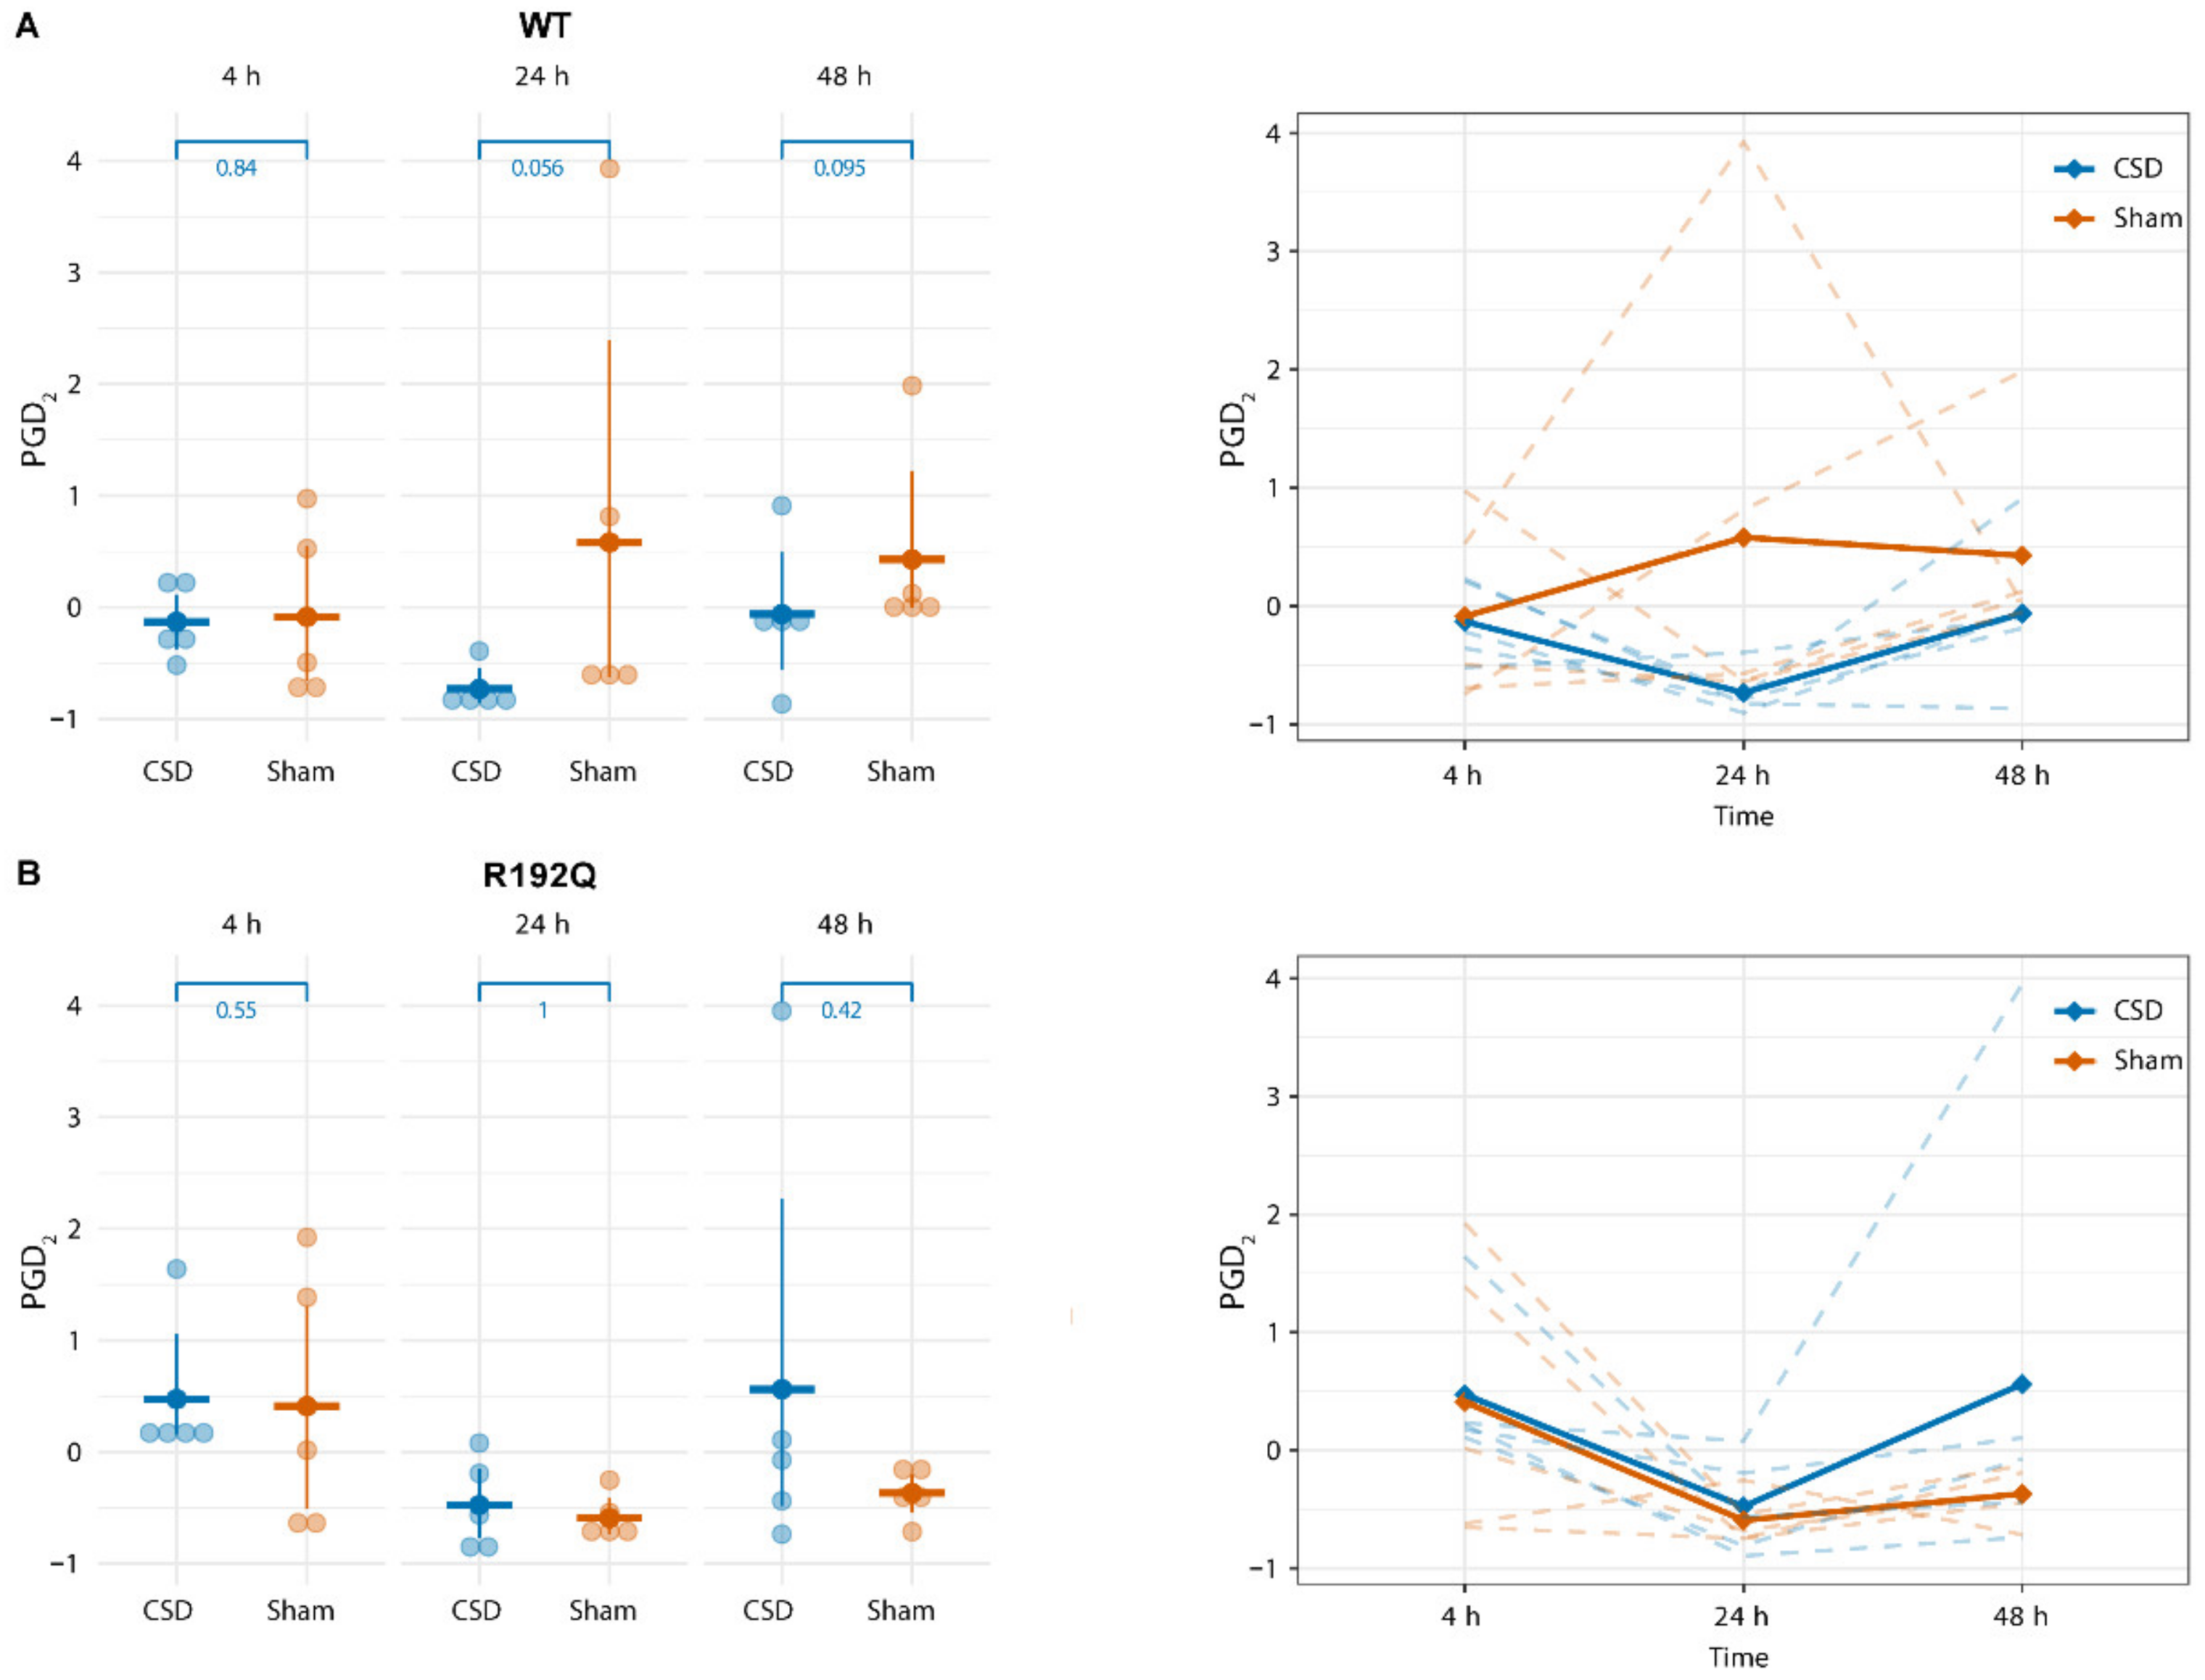
2.3. PGD2 Shows a Transient Increase Following CSD That Persists Longer in R192Q Mutant Mice

Considering the complexity of the experimental approach (two genotypes, two intervention groups and several time points), we addressed the time-specific changes in response to CSD induction within each genotype (WT and R192Q mutant) using a two-factor (time and intervention) repeated measures ANOVA test. Using F-factor and p-value of the ANOVA models as selection criteria, only PGD2 levels were found to change significantly over time following CSD, showing a transient increase in both genotypes (WT: F = 6.814, p = 0.007, RQ: F = 12.496, p = 0.001). Figure 3 shows the time course of the observed increase in PGD2 for WT (Figure 3A,B) and R192Q mutant mice (Figure 3B,C). In both WT and mutant mice, PGD2 levels were enhanced compared to levels in the Sham group at 0.5 h following the start of CSD induction, while for WT animals, PGD2 levels were comparable to levels in the Sham group at 1 h, plasma PGD2 concentration remained significantly higher at 1 h for R192Q mutant mice and had returned to the level of the Sham group only at 1.5 h. Within the intervention groups (CSD or Sham), no differences in PGD2 levels were detected at 0.5 h between WT and R192Q mutant mice (CSD–WT: median = 0.0532, interquartile range (IQR) = 0.023, CSD–RQ: median = 0.0585, IQR = 0.004, p = 0.403; Sham–WT: median = 0.0072, IQR = 0.025, Sham–RQ: median = 0.0357, IQR = 0.004, p = 0.21; indicated p-values obtained from a Mann–Whitney U-test).

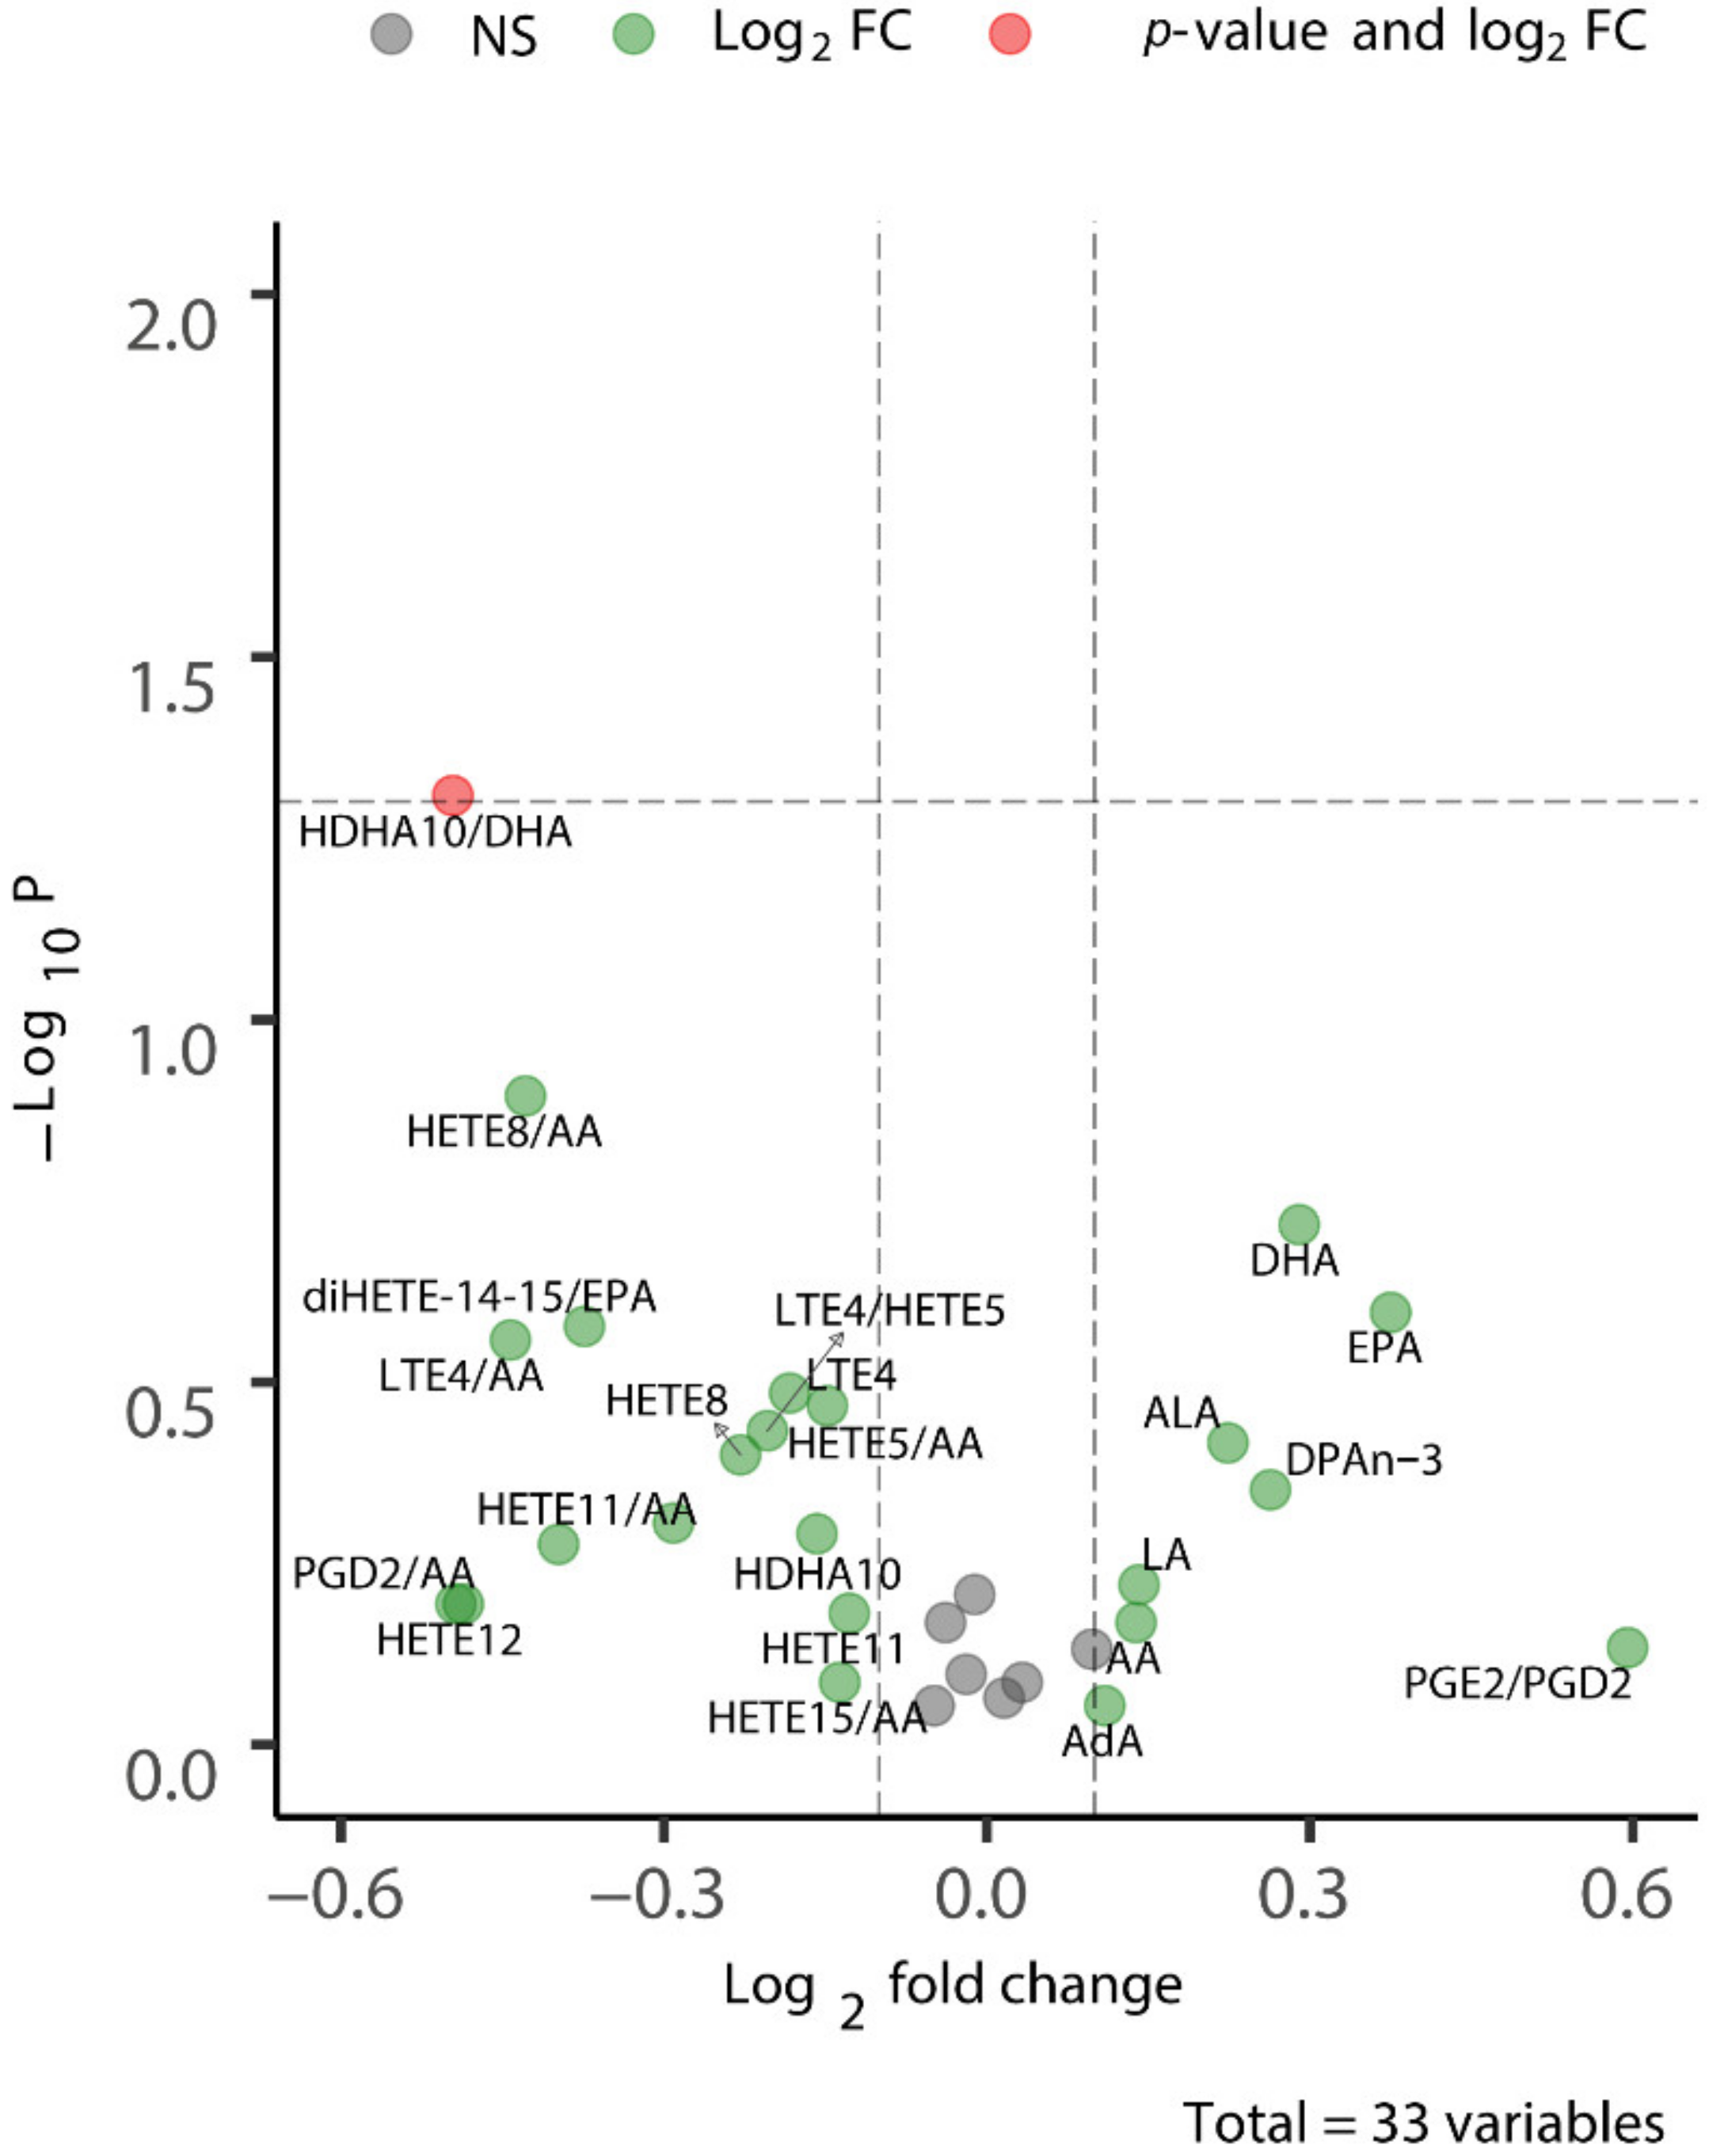
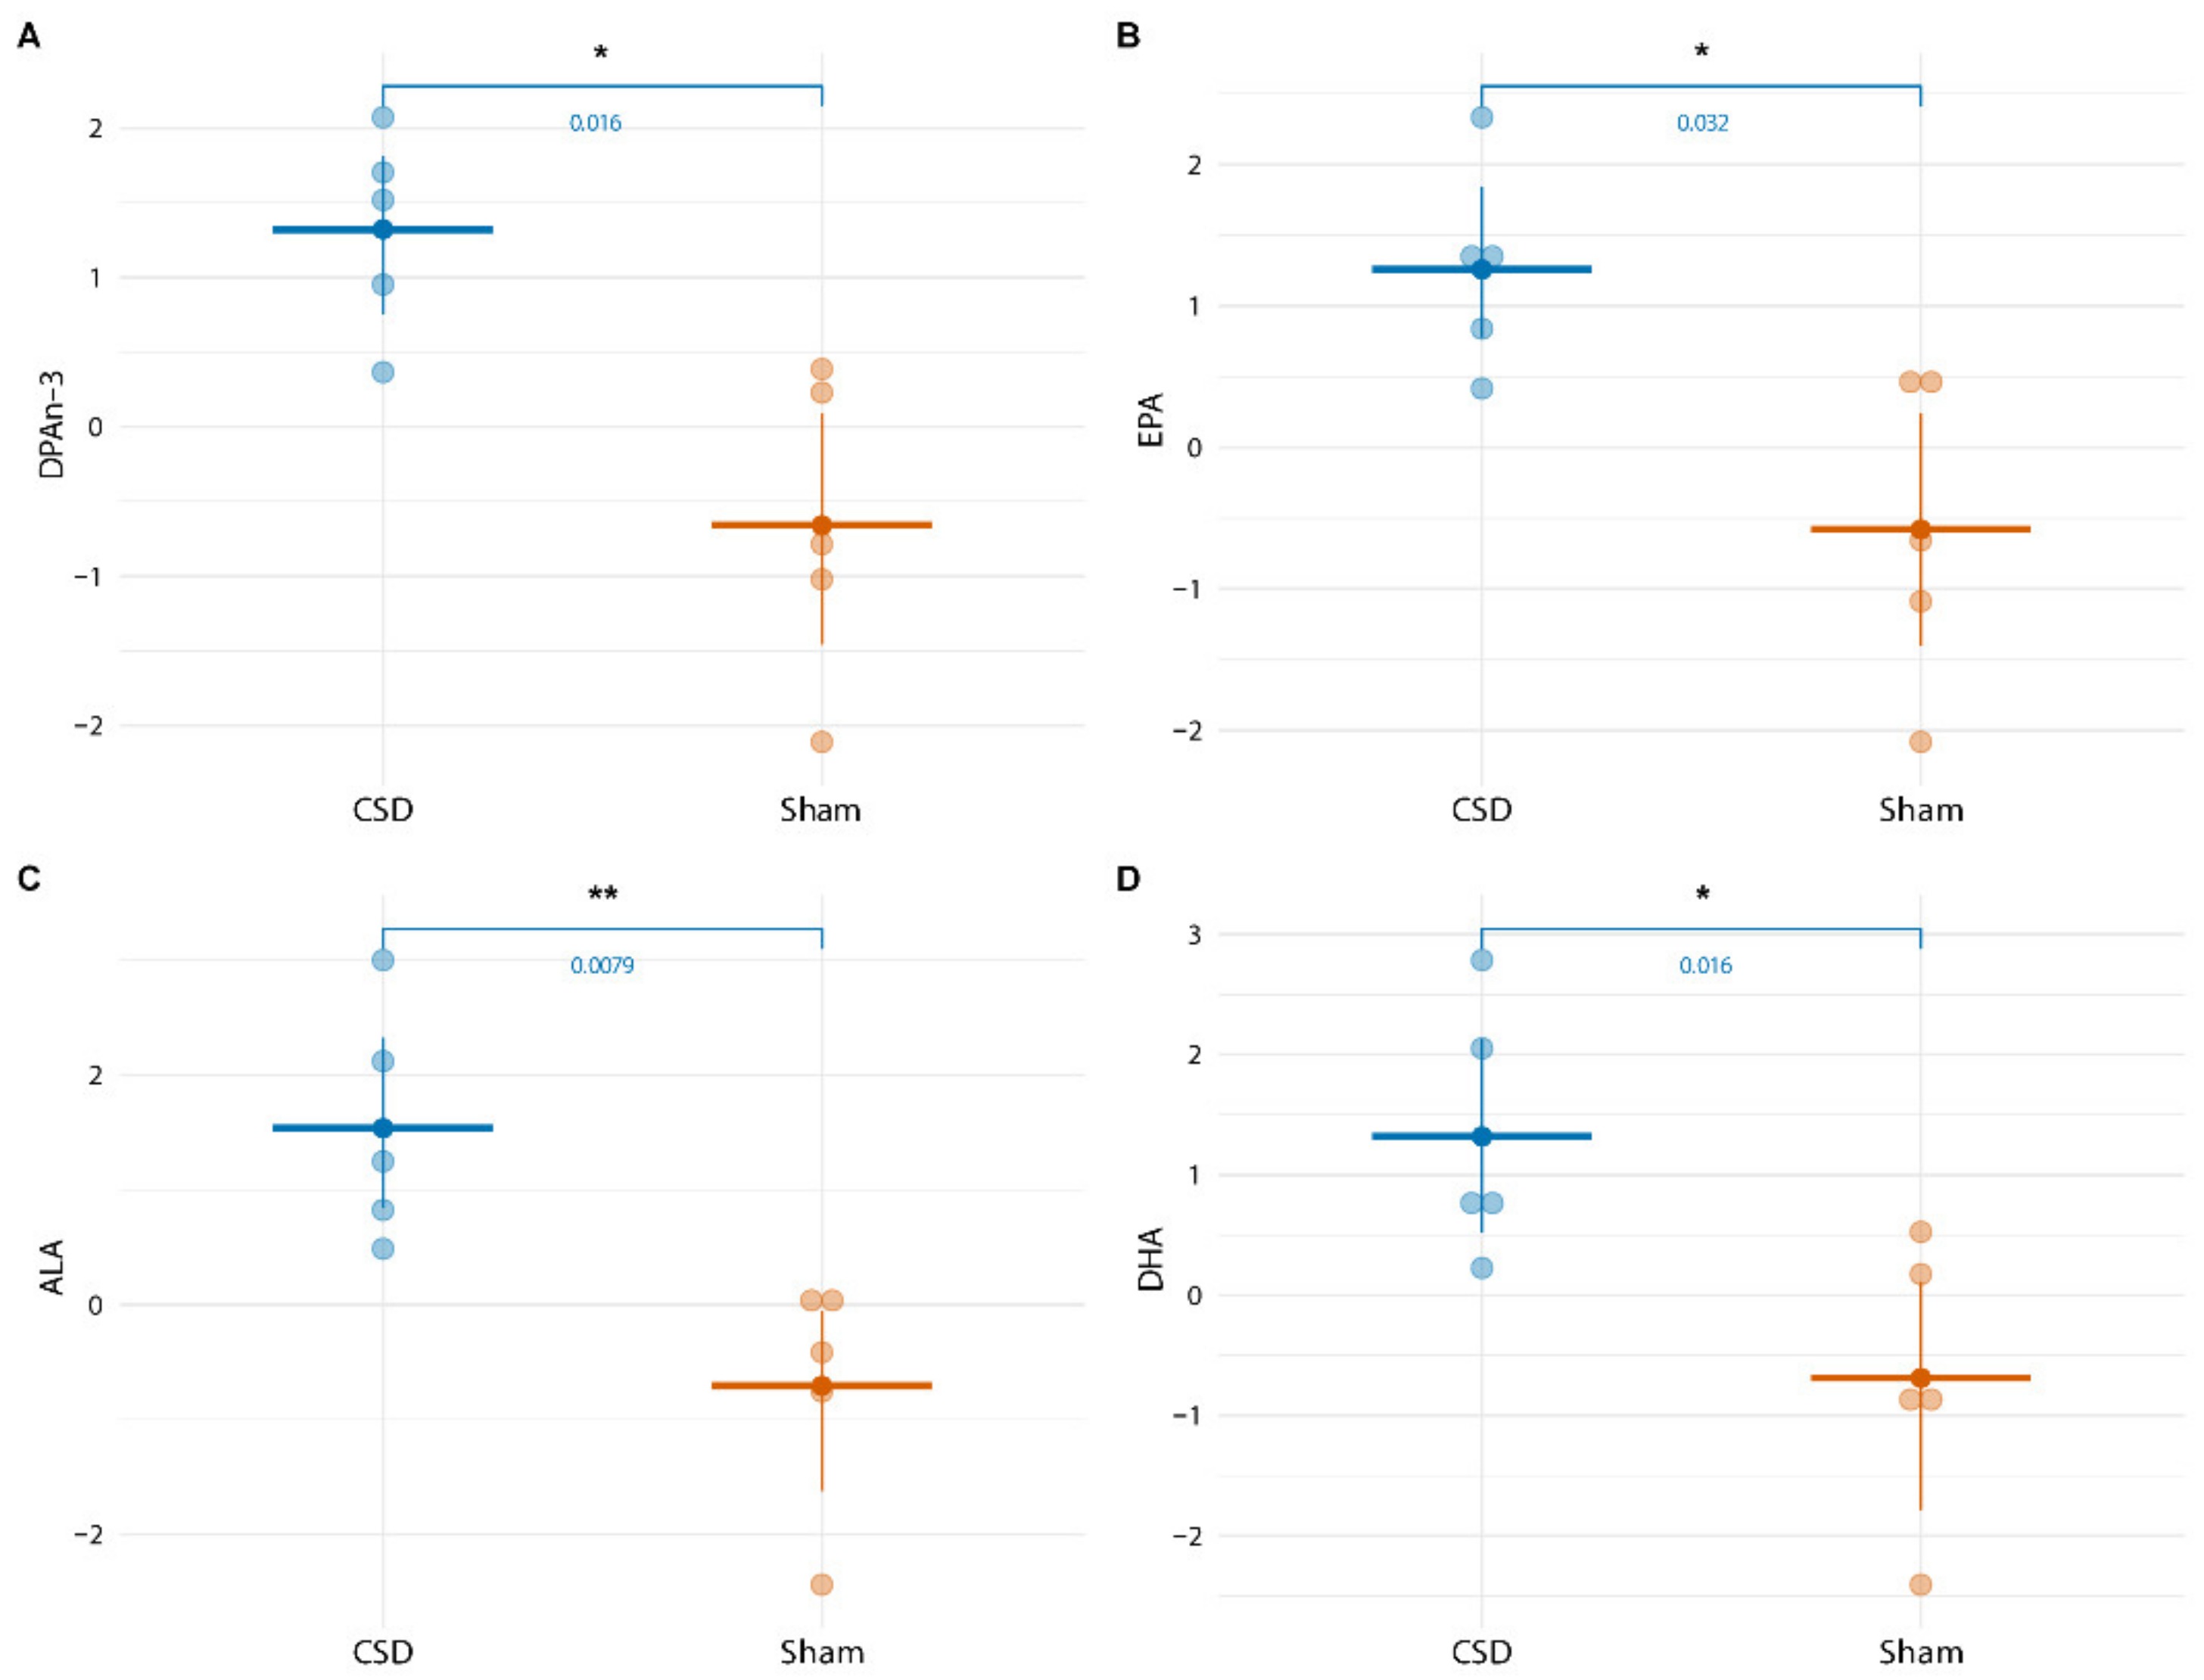
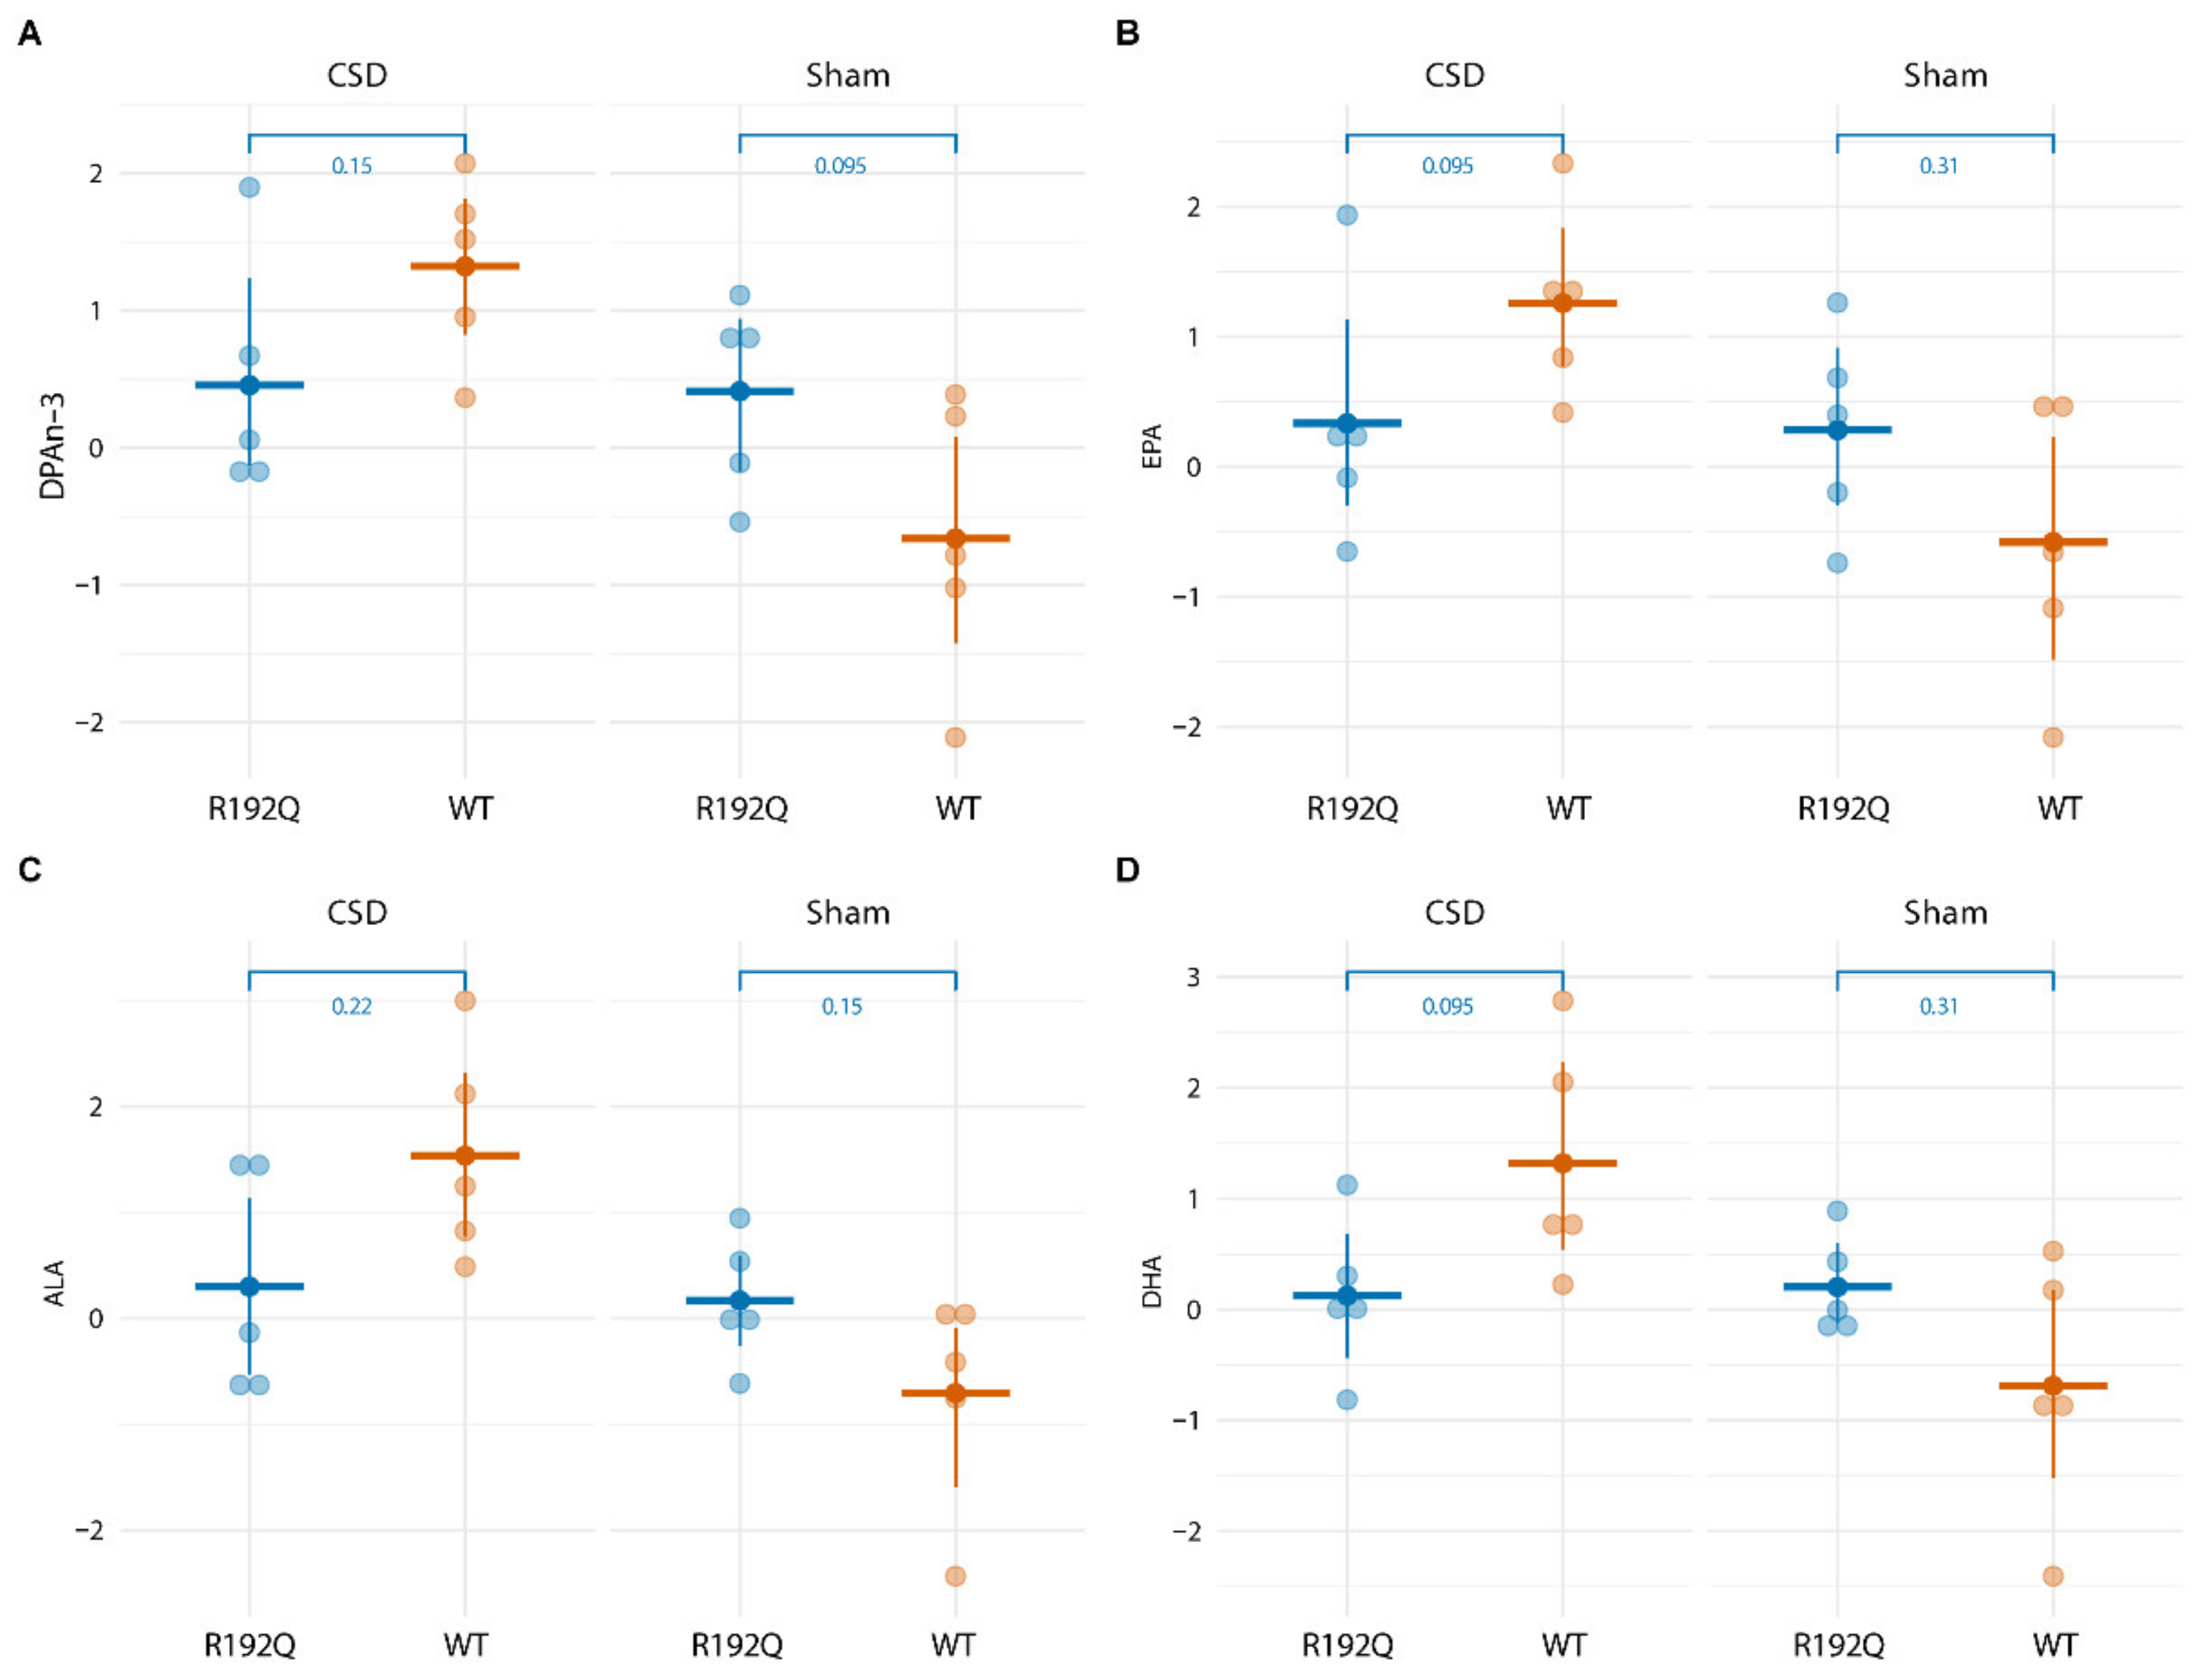
2.4. Long-Term CSD-Related Changes in the Plasma Lipid Metabolome

For the long-term experiments with blood sampling performed from 4 to 48 h following the start of CSD induction, PGD2 plasma concentrations remained stable and did no longer show a CSD-related increase (Figure 4). With respect to other lipid mediators, four lipids showed a transient increase in WT mice at 24 h following CSD in comparison to the Sham group, i.e., DPAn-3 (F = 6.736, p = 0.007), EPA (F = 5.506, p = 0.0151), ALA (F = 4.672, p = 0.025) and DHA (F = 4.44, p = 0.029; Figure 5). This transient increase was not observed for R192Q mutant mice (see Figures S1–S4 for DPAn-3, EPA, ALA, and DHA concentrations at all time points for WT and R192Q mice). When comparing the 24 h plasma concentrations of these four lipids following CSD between genotypes, no significant differences were found (Figure 6).

3. Discussion

Using a translational approach by investigating effects of CSD in WT and FHM1 R192Q mutant mice, we set out to uncover novel plasma lipid changes that could increase our understanding of migraine pathophysiology and serve as possible disease biomarkers, in particular with respect to hemiplegic migraine and the migraine aura phase. To this end, we used a targeted approach to assess changes in lipid concentrations in plasma samples over time (both short-term and long-term) up to 48 h after experimentally induced CSD, as a correlate of the migraine aura. Under naïve, untreated conditions, WT and FHM1 mutant mice did not show differences in plasma concentrations of the measured lipid mediators. However, following induction of multiple CSD events within a 1 h time period, in anesthetized mice, plasma levels of PGD2 were increased at 30 min after the first CSD in both WT and FHM1 mutant mice. Levels returned back to baseline within 1–1.5 h following the first CSD, which took longer in the mutant mice. In long-term experiments at 4 h, 24 h and 48 h after CSD, PGD2 plasma levels were no longer increased, whereas plasma concentrations of DPAn-3, ALA, DHA and EPA showed a slight and transient increase at 24 h after CSD induction in WT mice only.
Lipids and lipid mediators are essential for normal functioning of many processes in the brain, such as structural development, energy metabolism, and mediation of synaptic plasticity [28]. In the context of disease, changes in brain lipid metabolism have been implicated in the pathophysiology of several brain disorders including migraine and comorbid disorders stroke and epilepsy ([22] for review). In the same mutant mouse model studied here, as it is also considered a model of ischemic stroke [29], the occurrence of spreading depolarizations surrounding the infarcted cortical area [30] were associated with changes in the lipid profile in brain tissue [31]. Moreover, for both mice [32] and patients following stroke [33] lipid changes were observed in plasma. In a rat model for temporal lobe epilepsy, lipid concentrations measured both in the hippocampus and plasma revealed upregulation of DHA [34]. These findings underscore the potential of plasma lipids as biomarkers for changes in brain activity. Such changes include excessive neuronal activity known to occur during seizures and around infarct areas, as well as changes in brain activity in the context of migraine during the aura phase, likely as the result of CSD [35].
Prostaglandins are lipid compounds that are localized in brain structures known to be relevant to migraine pathophysiology, including the cortex, thalamus, brainstem and trigeminal ganglia, as well as cerebral blood vessels [19]. The relationship between prostaglandins and migraine headache was first observed in 1968 when Carlson et al. [36] found that intravenous PGE1 injection resulted in migraine-like headaches in eight healthy subjects, of which one person reported a unilateral headache accompanied by visual symptoms resembling a migraine aura. Prostaglandins are generally believed to mediate migraine headache initiation based on their known role of inducing dilatation of cranial vessels [19]. In the present study, in our FHM1 mouse model, we found that PGD2 was upregulated in mice that underwent CSD. PGD2 is able to dilate the human middle cerebral artery [37,38], to induce dural and peripheral sensory afferent sensitization, albeit to a lesser extent than PGE2 [19,39], and to induce migraine-like headache [38]. Platelets of headache-free migraineurs were reported to have lower amounts of PGD2 when compared to healthy individuals [40]. This finding related to vasoconstriction of cerebral arterioles measured interictally in migraine patients without aura, which was even more pronounced in migraine patients with aura [41]. In primary cultures of rat trigeminal neurons, PGD2 was shown to induce neuronal release of CGRP [42], a neuropeptide released upon trigeminal nerve activation and linked to neuroinflammation and pain in migraine headaches [43]. In the context of CSD, the increased levels of PGD2 observed at 30 min after CSD initiation may reflect a brain neuroinflammatory response, which has been reported to occur after CSD [44], and can induce the release of inflammatory mediators including PGD2 [19]. If such process would occur following CSD during the aura phase in patients, this can potentially activate vessel dilatation and activate sensory afferents leading to a migraine headache. Our findings suggest that PGD2 could have the potential to serve as a biomarker for aura-related changes, when measured in patients in plasma following the migraine aura phase. Since we found this transient increase to last longer in the FHM1 mutant mice, a longer duration of elevated PGD2 levels following an aura in patients might be indicative of specific changes in the context of hemiplegic migraine. The lowered PGD2 levels measured interictally in migraine patients [40] seem to underscore the biomarker potential of PGD2 also for periods in between migraine attacks.
The contrast between increased plasma levels of PGD2 and unaltered levels of PGE2 following CSD in our experiments seems in line with clinical and preclinical data that underscore distinct mechanisms and roles of the different types of prostaglandins in the context of migraine [19]. While infusion of PGD2 has been shown to provoke similar migraine-headache symptoms in healthy volunteers, as does infusion of PGE1, PGE2 or PGI2 [15,36,38,45], vasodilatory effects were reported to be more pronounced for PGD2 compared to other prostaglandins [19,38]. In patients such provocation experiments have only been performed using PGE2 and PGI2, and only for migraine patients without aura, whereby the majority of patients developed migraine-like attacks [46,47]. The change in PGD2 following CSD, in the present study, may suggest the involvement of PGD2 in CSD-induced dilatation of cranial vessels with relevance to migraine with aura. It will therefore be of interest in future clinical studies to compare infusion effects of the different prostaglandins in migraine patients with and without aura.
The absence, in our study, of a change in PGE2 levels as well as of other blood lipid metabolite changes reported in clinical studies [19,20,22,24] may reflect that only selected metabolites are altered following CSD, which can be of relevance for understanding differences in pathways underlying the headache phase in attacks of migraine with and without aura. The absence of a change in PGE2, as well as other prostaglandins besides PGD2, seems unexpected given their downstream position with respect to arachidonic acid (AA) [19], of which levels were shown to be transiently elevated for a period of minutes in the cortex during CSD [48]. However, it should be noted that migraine-related changes in lipid mediators may be brain region specific, which could result in no apparent changes of such metabolites in plasma. For PGE2, such regional changes were observed in rats following nitroglycerin administration as experimental trigger of headache pathways, whereby reduced PGE2 levels were observed in the hypothalamus while levels in the brainstem were enhanced [49]. Additional reasons for differences between the limited amount of lipid changes in the present work and those of earlier (pre)clinical reports may include biomarker differences between plasma and serum [50] or variation of lipid mediators across the estrus cycle (given the use of female mice in our study) as reported for plasma PGE2 in the context of menstrual migraine [51].
About 1 day after CSD induction, when samples were collected in awake mice, we found an increase in plasma levels of DPAn-3, DHA, ALA and EPA in WT mice that was absent in FHM1 mutant mice. DHA, DPA, and EPA are polyunsaturated fatty acids that originate from desaturation and elongation enzymes from ALA. EPA is converted into DPA, which is further converted into DHA, with both processes being reversible [52]. ALA, DHA, and EPA are linked to the unsaturated fatty acid pathway, as are AA and linoleic acid that were among the targeted metabolites. Follow-up studies covering more metabolites of this pathway would, however, be required to enable a meaningful interpretation on the observed changes with respect to the known pathway interactions. In the brain, EPA and DHA inhibit neuroinflammatory processes in several ways, that is, (1) inhibition of the production of neuroinflammatory proteins such as tumor necrosis factor alpha (TNF-α) and various interleukins in various cell types, (2) reduction in the activity of mitogen-activated protein kinases (MAPKs), and (3) inhibition of signaling pathways resulting in lower macrophage responses [53]. FHM1 mutant mice, compared to WT, show more widespread neuroinflammatory changes in the brain at 30 min following CSD [12], as well as a unique cortical neuroinflammatory gene expression profile at 24 h following CSD [13]. Our finding of increased plasma levels of anti-inflammatory lipid metabolites at 24 h in WT mice, but not in FHM1 mutant mice, suggests a reduced anti-inflammatory response in FHM1 mutants. The absence of such an elevation in anti-inflammatory mediators in mutant mice suggests a neuro-inflammatory condition in the FHM1 mouse model, as has been published in, e.g., Franceschini et al. [54], perhaps to counteract the enhanced neuronal excitability in the brain of mutant mice. All four anti-inflammatory mediators have previously been associated with migraine, although not hemiplegic migraine. One study reported abnormally low serum levels of ALA in the majority of migraine patients [55]. Another study in which migraine GWAS data were investigated with respect to genetically associated blood metabolic traits, DHA and DPA were identified as fatty acids that were genetically associated with a higher risk for migraine [56]. Of note, lower dietary intake of DHA and EPA are associated with a higher attack frequency in migraine patients [18]; vice versa, increasing dietary intake of EPA and DHA in chronic and episodic migraine patients resulted in a reduction in headache frequency and severity [57] and physical pain [58], underscoring the involvement of these lipids in migraine pathophysiology. Our findings suggest that DPAn-3, DHA, ALA, and EPA might have potential as biomarkers of an anti-inflammatory response (when levels are elevated), or a neuroinflammatory response (in case of an absence of elevated levels) in the context of an aura and hemiplegic migraine.
Our findings underscore the potential of modulating the synthesis or actions of prostaglandins and reducing neuroinflammatory responses in the treatment of hemiplegic migraine and perhaps migraine with aura. With CSD as the correlate of the migraine aura, increased PGD2 levels after CSD could suggest that in patients such a change may occur following the aura phase. The prolonged duration of the PGD2 elevation in FHM1 mutant mice, compared to WT, may suggest a specific association of PGD2 with migraine susceptibility, in particular in the context of hemiplegic migraine. Putative novel migraine treatments based on our finding (after validation) could include targeting actions of PGD2, e.g., by blocking the receptors involved [19]. Since prostaglandins are synthesized in various brain cells from arachidonic acid by activated COX following stimulation [59], another therapeutic approach could be to intervene with prostaglandin synthesis by inhibition of COX, using nonsteroidal anti-inflammatory drugs, NSAIDs. Our observation of CSD-induced elevated anti-inflammatory lipid mediators DPAn-3, EPA, ALA, and DHA in WT (that were not altered in FHM1 mutant mice), suggests a reduced anti-inflammatory response in the context of hemiplegic migraine and CSD. This is in line with earlier work in which we observed specific CSD-related neuroinflammatory changes in the brain of FHM1 mutant mice [12,13]. In the context of treatment regimes, our findings appear in line with the use of NSAIDs in acute migraine treatment [60]. Thus, our combined findings of a CSD-related increase in PGD2 that was prolonged in FHM1 mutant mice, and the absence of CSD-related rises in anti-inflammatory lipid mediators in FHM1 mutant mice underscore the potential of anti-inflammatory treatment strategies. Such treatments would be expected to inhibit an increase in PGD2, which could arise during the aura phase, and stimulate an anti-inflammatory response that may be impaired in patients with hemiplegic migraine. Upon validation of our findings, additional strategies aimed at specifically targeting the pathways involving PGD2 and DPAn-3, EPA, ALA, and DHA may provide a basis for novel, more selective, treatments.
The design chosen for this study has some limitations. First, it was not feasible to estimate the sample size beforehand. A power analysis for longitudinal designs is complex because within-subject correlation strongly affects the estimated sample sizes, and given the low number of metabolic studies on peripheral and central diseases, which hampers an accurate power analysis. Second, the use of anesthetic and analgesic agents may have reduced our chances of finding CSD-associated lipid mediator changes. Using isoflurane anesthesia in the experiments and carprofen administration for the long-term survival experiments may have influenced our results. Isoflurane anesthesia has been shown to have inhibitory effects on lipid metabolism e.g., [61,62,63] and carprofen administration inhibits COX-2 that is involved in prostaglandin synthesis [64]. The increase in PGD2 levels, however, was no longer evident at 1 h after the first CSD in WT mice and at 1.5 h in R192Q mutant mice in the short-term experiments where carprofen was not used. The absence of elevated PGD2 levels at 1.5 h and later time points in the long-term experiments is therefore in line with the normalization of PGD2 at 1.5 h seen in the short-term data, making it less likely that carprofen suppressed levels of PGD2 levels in the long-term experiments. The analgesic effects of carprofen in mice have been reported to be diminished by 6 h after administration [65]; therefore, the effects of the presence of carprofen would not be expected at the 24 and 48 h sample collection time points. Whether levels of other prostaglandins such as PGE2 may have been suppressed by carprofen in the long-term experiments cannot be excluded. The absence of PGE2 changes in the short-term experiments may suggest, however, that CSD does not cause a specific increase in levels of this metabolite. By comparison of the CSD-treated animals with Sham-treated controls, we reduced the possible influence of isoflurane or carprofen on the outcomes, allowing us to relate the observed metabolite changes specifically to the prior occurrence of CSD. Nevertheless, it remains possible that the use of these agents may have masked CSD-associated effects on lipid metabolism, which could explain the limited amount of CSD-related changes in our study. Future studies in which CSD is induced in unanesthetized awake animals could be performed to overcome this potential issue. This would be possible, for example, by (repeated) optogenetic stimulation, by which single or multiple CSDs can be induced in freely behaving mice [66], allowing blood sample collection at both short-term and longer-term time points, during and after CSD induction, without the need for anesthetic and analgesic agents. Such future studies can help validating our findings, may identify additional CSD-associated metabolic changes, and can also address whether a single CSD may already be sufficient to yield the identified metabolite changes.

Conclusions

This targeted study investigated changes in plasma concentrations of lipid mediators over time following induction of multiple CSD events in transgenic FHM1 mutant mice, carrying the FHM1 R192Q mutation, and WT controls. Plasma samples collected after CSD induction were analyzed by RPLC-MS/MS and revealed CSD-associated increases in lipid concentrations. That is, of PGD2 directly following CSD in both genotypes and, in WT mice only, increased lipid concentrations of DPAn-3, ALA, DHA and EPA at 24 h after CSD. Taken together, our findings are consistent with previously identified migraine-relevant lipid mediators associated with headache pain mechanisms and associated neuroinflammatory changes, and underscore the potential that peripheral plasma lipid mediator changes can give insights to central migraine mechanisms, in particular in the context of the aura phase and hemiplegic migraine. Given the overlap in their pathophysiology, the observed changes in peripheral body fluids may be of relevance also for other central nervous system disorders that are comorbid with migraine, such as epilepsy and stroke [67].

4. Material and Methods

4.1. Experimental Design and Animal Experiments

The main goal of the study was to investigate the CSD-related changes in plasma metabolic profiles at multiple time points after CSD in female homozygous Cacna1a FHM1 R192Q knock-in mice (‘R192Q mutant mice’) [9] and WT littermates. Mice (age 2 to 4 months) were kept under standard housing conditions with a 12 h light/dark cycle with food and water available ad libitum. Animal experiments were approved by the Animal Experiment Ethics Committee of Leiden University Medical Center. The experimental design, as illustrated in Figure 1, consisted of two paradigms, i.e., short-term and long-term experiments. For both paradigms, mice were randomly divided into four groups (n = 5), i.e., CSD and Sham treatment groups for R192Q mutant and WT mice.

4.2. CSD Induction and Recording in Anesthetized Mice

Mice were anesthetized with 4% isoflurane in pressurized air (0.5 L/min) for induction and 1.5% for maintenance. For short-term experiments, a catheter was inserted into the left femoral artery for blood sampling and continuous blood pressure monitoring. Arterial blood gases (pCO2 and pO2) and pH were measured at the start and end of the recordings. In both short-term and long-term experiments, multiple (i.e., 7) CSD events were evoked as described by Shyti et al. [7] and Eising et al. [13] to have a pronounced exposure of the brain to CSDs and increases chances of finding CSD-associated changes in peripheral blood plasma samples. Briefly, mice were mounted in a stereotaxic frame (David Koph, Tujunga, CA, USA) in a shielded Faraday cage on a homeothermic heating pad with continuous monitoring of core temperature (37.0 ± 0.5 °C). A midline incision over the head was made to expose the skull. Two cranial windows were prepared at the following coordinates from bregma: 3.5 mm posterior, 2 mm lateral for CSD induction in the visual cortex (V1) and 0.5 mm anterior, 2 mm lateral for CSD recording in the motor cortex (M1). CSD events were induced by applying a cotton ball soaked in 300 mM potassium chloride (KCl) solution over the dura that was removed after 30 s, followed by thorough washing with saline solution. This procedure was repeated 6 times with 10 min intervals. Sham experiments involved the same procedure using 300 mM sodium chloride (NaCl) solution instead of KCl. CSD events were recorded as DC-potential changes using a glass electrode filled with 150 mM NaCl. Signals were filtered with a DC-500 Hz low-pass filter, 30X amplified and digitized at 1000 Hz sampling rate (PowerLab 16/30; AD Instruments Inc., Colorado Springs, CO, USA).

4.3. Collection and Preparation of Plasma Samples

Blood samples were collected before CSDs were induced, during the CSD induction period, and up to 48 h after CSD induction, to capture plasma lipid level changes across both immediate and delayed time periods following CSD. For short-term experiments, all blood samples except for the first time-point (t-1h) were collected via the femoral artery catheter. The samples at t-1h were collected via tail cuts (arterial blood). Samples (40 µL) were collected in heparinized blood collection capillaries (Microvette CB 300, Sarstedt, Nümbrecht, Germany) ~1 h before the 1st CSD event (t-1h), right after the 4th (t-0.5h), and 7th (t-1h) CSD event, and 1.5 h after the 1st CSD (t-1.5h), and for Sham experiments at the same time points before or after the first NaCl application. For long-term experiments, all samples were collected via tail cuts, ~1 h before the 1st CSD event (t-1h), and 1.5 h (t-1.5h), 4 h (t-4h), 24 h (t-24h), and 48 h (t-48h) after the 1st CSD event, and at the same time points before or after the first NaCl application. Blood samples were centrifuged for 10 min with 4000 rpm at 4 °C prior to plasma collection. Plasma was transferred to cryotubes (Sarstedt), snap-frozen in liquid nitrogen, and stored at −80°C. In short-term experiments, mice were under isoflurane anesthesia for the entire experiment, for a period of ~2 h, and sacrificed directly after collection of the last sample. In long-term experiments, the mice were under isoflurane anesthesia for ~1.5 h for the surgery and CSD induction part of the experiment. In the long-term survival experiments, mice received a subcutaneous injection of carprofen (5 mg/kg), a non-steroidal anti-inflammatory drug to minimize the animal discomfort after surgery, directly after the 7th CSD while still under anesthesia. The skin overlaying the skull was sutured and 15 min after the carprofen injection, mice were allowed to wake up in a recovery cage equipped with a heating light. After the last sample collection (i.e., t-48h), mice were sacrificed.

4.4. Targeted Analysis of Lipid Mediators

The targeted analysis of lipid mediators was performed using reversed-phase liquid chromatography-tandem mass spectrometry (RPLC-MS/MS) [14]. Samples were randomized prior to the analysis. Protein precipitation was performed using 25 µL MeOH added to 5 µL of plasma. The mixture was agitated and stored at −20 °C for 20 min prior to centrifugation at 16,000 rcf for 10 min at 4 °C. Some 25 µL of supernatant was collected and evaporated to dryness under a gentle steam of N2. Samples were reconstituted with 20 µL MeOH, agitated, prior to the addition of 30 µL of water. After agitation, 45 µL of the reconstituted samples were injected into the RPLC-MS/MS system. RPLC experiments were carried out using a Nexera LC system (Shimadzu, ‘s-Hertogenbosch, The Netherlands) equipped with a solvent degasser, a column oven, an autosampler with thermostat, and a quaternary pump. Separation was performed on a Kinetex C18 column from Phenomenex of 50 mm × 2.1 mm i.d., and 1.7 µm particle size. The mobile phase was composed of 0.01% acetic acid in water (A) and 0.01% acetic acid in MeOH (B). The flow rate was set to 400 µL/min with the following gradient profile: 30% B for 1 min, 30–45% B in 0.1 min, 45–53.5% B in 1.9 min, 53.5–55.5% B in 2 min, 55.5–90% B in 3 min, 90–100% B in 0.1 min, and 100% B for 2 min for a total analysis time of 9 min. Samples were kept at 6 °C and the separation was performed at 50 °C. A C8 Security Guard cartridge from Phenomenex of 20 mm × 2.00 mm i.d. was used as a pre-column. All the solvents used for the experiments were of LC-MS grade or higher.
The RPLC system was hyphenated to a QTRAP 6500 LC-MS/MS system (SCIEX, Nieuwerkerk aan den IJssel, The Netherlands) equipped with a Turbo Spray IonDrive ESI source operating in negative mode. ESI capillary voltage was set at –4500 V. Nebulizing gas and curtain gas pressures were set at 40 psi and 30 psi, respectively. Heater gas temperature and pressure were fixed at 450 °C and 30 psi, respectively. Data was acquired in selected reaction monitoring (SRM) mode with a time window of ~30 s around the expected retention time. Dwell time and inter-channel delay were 150 ms and 5 ms, respectively. For all compounds, an entrance potential of −10 V was used.
Deuterated internal standards (IS), i.e., 15-HETE-d8, DHA-d5, LTB4-d4, and PGE2-d4 were added prior to the protein precipitation to each sample at a final concentration of 1 ng/mL. All compounds were quantified using a calibration curve prepared in MeOH/water (40:60, v/v) consisting of 7 calibrants concentrations, each injected twice. Concentrations were estimated using the ratio of the peak area for each compound over the peak area of its respective IS. A weighing factor of 1/x and linear regression were used for quantitation.

4.5. Statistical Analysis

Data were acquired using Analyst®1.6.2 build 8489 software and analyzed with MultiQuant® version 2.1, and GraphPad Prism version 6.05. The R environment (R version 4.1.1) was used for data analysis and visualization, with the following software packages: tidyverse (1.3.1), broom.mixed (0.2.7), ggplot2 (3.3.5), ggsignif (0.6.3), superheat (0.1.0), and EnhancedVolcano (1.10.0). In comparing CSD features (amplitude and duration) in short-term and long-term experiments and physiological parameters across all experimental groups in the short-term experiment, one-way ANOVA was used for normally distributed datasets and the Kruskal–Wallis test for non-normally distributed datasets. Two factor (time and intervention) repeated measures ANOVA including correction for multiple testing was used to compare plasma lipid concentrations between genotypes over time in the RPLC-MS/MS experiments. The volcano plot, comparing baseline plasma lipid concentrations between genotypes (Figure 2), shows datapoints uncorrected for multiple testing. Subsequent comparison for selected metabolites at specific time points between CSD and Sham groups was performed with an unpaired two-tailed Mann–Whitney U test, since a minority of lipid metabolite datasets was not normally distributed. Data are expressed as individual measured values (concentration, area, concentration ratio, or area ratio depending on the fatty acid and enzymatic pathway) and median (horizontal line).

Supplementary Materials

The following Supplementary Figures and Table are available online at https://www.mdpi.com/article/10.3390/metabo12030220/s1, Figure S1: Heatmap summarizing the measured plasma lipid levels at baseline (per individual mouse) grouped by genotype, Figure S2: CSD is associated with long-term changes in DPAn-3 in WT mice, Figure S3: CSD is associated with long-term changes in EPA in WT mice, Figure S4: CSD is associated with long-term changes in ALA in WT mice, Figure S5: CSD is associated with long-term changes in DHA in WT mice, Table S1: List of targeted metabolites with retention times and MS/MS transitions used for lipids quantitation.

Author Contributions

Conceptualization, I.C.M.L., I.K., A.M.J.M.v.d.M., O.A.M. and E.A.T.; formal analysis, I.C.M.L., I.K., M.G. (Mohan Ghorasaini), M.G. (Martin Giera) and O.A.M.; funding acquisition, I.K., A.M.J.M.v.d.M. and E.A.T.; investigation, I.C.M.L. and I.K.; methodology, I.C.M.L., I.K., O.A.M. and E.A.T.; supervision, A.M.J.M.v.d.M., O.A.M. and E.A.T.; visualization, I.C.M.L. and O.A.M.; writing—original draft, I.C.M.L., I.K., A.M.J.M.v.d.M., O.A.M. and E.A.T. All authors have read and agreed to the published version of the manuscript.

Funding

IK is a recipient of a fellowship (#P2GEP3_155633) supported by the Swiss National Science Foundation. This study was also financially supported by the EU Marie Curie IAPP Program “BRAINPATH” (#612360, A.M.J.M.v.d.M. & E.A.T.), EU “EUROHEADPAIN” grant (#602633, A.M.J.M.v.d.M.), an LUMC fellowship (E.A.T.), Marie Curie Career Integration Grant (#294233, E.A.T.), and the Medical Delta program “Medical NeuroDelta: Ambulant Neuromonitoring for Prevention and Treatment of Brain Disease” (A.M.J.M.v.d.M.).

Institutional Review Board Statement

All experiments involving mice were performed according to Dutch Law and following institutional guidelines (Animal Welfare Body of the Leiden University Medical Centre, LUMC, Leiden, the Netherlands) in confirmation with EU directive 2010/63. Prior to the start of the experiments, a project license was obtained from the national authority (Centrale Commissie Dierproeven, the Hague, the Netherlands) after review by an independent animal ethical committee (DEC) and filed under number AVD1160020171406.

Informed Consent Statement

Not applicable.

Data Availability Statement

The data presented in this study are available in the article and Supplementary Materials. Further information can be made available upon reasonable request to the authors.

Acknowledgments

The authors thank Sandra van Heiningen for technical support and genotyping of the transgenic mice, and Lisanne Vijfhuizen for help with data analysis.

Conflicts of Interest

The authors declare no conflict of interest.

References

  1. Goadsby, P.J.; Lipton, R.B.; Ferrari, M.D. Migraine--current understanding and treatment. N. Engl. J. Med. 2002, 346, 257–270. [Google Scholar] [CrossRef] [PubMed] [Green Version]
  2. Headache Classification Committee of the International Headache Society (IHS). The international classification of headache disorders, 3rd edition. Cephalalgia 2018, 38, 1–211. [Google Scholar] [CrossRef] [PubMed]
  3. Ayata, C.; Lauritzen, M. Spreading Depression, Spreading Depolarizations, and the Cerebral Vasculature. Physiol. Rev. 2015, 95, 953–993. [Google Scholar] [CrossRef] [PubMed] [Green Version]
  4. Carreira, R.J.; Shyti, R.; Balluff, B.; Abdelmoula, W.M.; van Heiningen, S.H.; van Zeijl, R.J.; Dijkstra, J.; Ferrari, M.D.; Tolner, E.A.; McDonnell, L.A.; et al. Large-scale mass spectrometry imaging investigation of consequences of cortical spreading depression in a transgenic mouse model of migraine. J. Am. Soc. Mass Spectrom. 2015, 26, 853–861. [Google Scholar] [CrossRef] [Green Version]
  5. Somjen, G.G. Mechanisms of spreading depression and hypoxic spreading depression-like depolarization. Physiol. Rev. 2001, 81, 1065–1096. [Google Scholar] [CrossRef] [Green Version]
  6. Gursoy-Ozdemir, Y.; Qiu, J.; Matsuoka, N.; Bolay, H.; Bermphol, D.; Jin, H.; Wang, X.; Rosenberg, G.A.; Lo, E.H.; Moskowitz, M.A. Cortical spreading depression activates and upregulates MMP-9. J. Clin. Investig. 2004, 113, 1447–1455. [Google Scholar] [CrossRef]
  7. Shyti, R.; Kohler, I.; Schoenmaker, B.; Derks, R.J.; Ferrari, M.D.; Tolner, E.A.; Mayboroda, O.A.; van den Maagdenberg, A.M.J.M. Plasma metabolic profiling after cortical spreading depression in a transgenic mouse model of hemiplegic migraine by capillary electrophoresis--mass spectrometry. Mol. Biosyst. 2015, 11, 1462–1471. [Google Scholar] [CrossRef]
  8. Ferrari, M.D.; Klever, R.R.; Terwindt, G.M.; Ayata, C.; van den Maagdenberg, A.M. Migraine pathophysiology: Lessons from mouse models and human genetics. Lancet Neurol. 2015, 14, 65–80. [Google Scholar] [CrossRef]
  9. Van den Maagdenberg, A.M.; Pietrobon, D.; Pizzorusso, T.; Kaja, S.; Broos, L.A.; Cesetti, T.; van de Ven, R.C.G.; Tottene, A.; van der Kaa, J.; Plomp, J.J.; et al. A Cacna1a knockin migraine mouse model with increased susceptibility to cortical spreading depression. Neuron 2004, 41, 701–710. [Google Scholar] [CrossRef]
  10. Tottene, A.; Conti, R.; Fabbro, A.; Vecchia, D.; Shapovalova, M.; Santello, M.; van den Maagdenberg, A.M.J.M.; Ferrari, M.D.; Pietrobon, D. Enhanced excitatory transmission at cortical synapses as the basis for facilitated spreading depression in Ca(v)2.1 knockin migraine mice. Neuron 2009, 61, 762–773. [Google Scholar] [CrossRef]
  11. Vecchia, D.; Tottene, A.; van den Maagdenberg, A.M.; Pietrobon, D. Mechanism underlying unaltered cortical inhibitory synaptic transmission in contrast with enhanced excitatory transmission in CaV2.1 knockin migraine mice. Neurobiol. Dis. 2014, 69, 225–234. [Google Scholar] [CrossRef] [PubMed]
  12. Dehghani, A.; Phisonkunkasem, T.; Ozcan, S.Y.; Dalkara, Y.; van den Maagdenberg, A.M.J.M.; Tolner, E.A.; Karatas, H. Widespread brain parenchymal HMGB1 and NF-κB neuroinflammatory responses upon cortical spreading depolarization in familial hemiplegic migraine type 1 mice. Neurobiol. Dis. 2021, 156, 105424. [Google Scholar] [CrossRef] [PubMed]
  13. Eising, E.; Shyti, R.; ’t Hoen, P.A.C.; Vijfhuizen, L.S.; Huisman, S.M.H.; Broos, L.A.M.; Mahfouz, A.; Reinders, M.J.T.; Ferrari, M.D.; Tolner, E.A.; et al. Cortical Spreading Depression Causes Unique Dysregulation of Inflammatory Pathways in a Transgenic Mouse Model of Migraine. Mol. Neurobiol. 2017, 54, 2986–2996. [Google Scholar] [CrossRef] [PubMed] [Green Version]
  14. Jonasdottir, H.S.; Ioan-Facsinay, A.; Kwekkeboom, J.; Brouwers, H.; Zuurmond, A.; Toes, R.; Deelder, A.M.; Giera, M. An advanced LC MS/MS platform for the analysis of specialized pro-resolving lipid mediators. Chromatographia 2015, 78, 391–401. [Google Scholar] [CrossRef]
  15. Wienecke, T.; Olesen, J.; Oturai, P.S.; Ashina, M. Prostacyclin (epoprostenol) induces headache in healthy subjects. Pain 2008, 139, 106–116. [Google Scholar] [CrossRef]
  16. Janoska, M.; Chorążka, K.; Domitrz, I. Migraine frequency and its association with dyslipidemia in women. Neurol. I Neurochir. Pol. 2015, 49, 95–98. [Google Scholar] [CrossRef]
  17. Rist, P.M.; Tzourio, C.; Kurth, T. Associations between lipid levels and migraine: Cross-sectional analysis in the epidemiology of vascular ageing study. Cephalalgia 2011, 31, 1459–1465. [Google Scholar] [CrossRef] [Green Version]
  18. Sadeghi, O.; Maghsoudi, Z.; Khorvash, F.; Ghiasvand, R.; Askari, G. The relationship between different fatty acids intake and frequency of migraine attacks. Iran. J. Nurs. Midwifery Res. 2015, 20, 334–339. [Google Scholar]
  19. Antonova, M.; Wienecke, T.; Olesen, J.; Ashina, M. Prostaglandins in migraine: Update. Curr. Opin. Neurol. 2013, 26, 269–275. [Google Scholar] [CrossRef]
  20. Ferroni, P.; Barbanti, P.; Spila, A.; Fratangeli, F.; Aurilia, C.; Fofi, L.; Egeo, G.; Guadagni, F. Circulating Biomarkers in Migraine: New Opportunities for Precision Medicine. Curr. Med. Chem. 2019, 26, 6191–6206. [Google Scholar] [CrossRef]
  21. Gross, E.C.; Lisicki, M.; Fischer, D.; Sándor, P.S.; Schoenen, J. The metabolic face of migraine—From pathophysiology to treatment. Nat. Rev. Neurol. 2019, 15, 627–643. [Google Scholar] [CrossRef]
  22. Hussain, G.; Anwar, H.; Rasul, A.; Imran, A.; Qasim, M.; Zafar, S.; Imran, M.; Kamran, S.K.S.; Aziz, N.; Razzaq, A.; et al. Lipids as biomarkers of brain disorders. Crit. Rev. Food Sci. Nutr. 2020, 60, 351–374. [Google Scholar] [CrossRef] [PubMed]
  23. Onderwater, G.L.J.; Ligthart, L.; Bot, M.; Demirkan, A.; Fu, J.; van der Kallen, C.J.H.; Vijfhuizen, L.S.; Pool, R.; Liu, J.; Vanmolkot, F.H.; et al. Large-scale plasma metabolome analysis reveals alterations in HDL metabolism in migraine. Neurology 2019, 92, e1899–e1911. [Google Scholar] [CrossRef] [PubMed] [Green Version]
  24. Ren, C.; Liu, J.; Zhou, J.; Liang, J.; Wang, Y.; Sun, Y.; Ma, B.; Yin, Y. Lipidomic analysis of serum samples from migraine patients. Lipids Health Dis. 2018, 17, 22. [Google Scholar] [CrossRef] [Green Version]
  25. Tuca, J.O.; Planas, J.M.; Parellada, P.P. Increase in PGE2 and TXA2 in the saliva of common migraine patients. Action of calcium channel blockers. Headache 1989, 29, 498–501. [Google Scholar] [CrossRef] [PubMed]
  26. Durham, P.L.; Vause, C.V.; Derosier, F.; McDonald, S.; Cady, R.; Martin, V. Changes in salivary prostaglandin levels during menstrual migraine with associated dysmenorrhea. Headache 2010, 50, 844–851. [Google Scholar] [CrossRef] [PubMed]
  27. Sarchielli, P.; Alberti, A.; Codini, M.; Floridi, A.; Gallai, V. Nitric oxide metabolites, prostaglandins and trigeminal vasoactive peptides in internal jugular vein blood during spontaneous migraine attacks. Cephalalgia 2000, 20, 907–918. [Google Scholar] [CrossRef]
  28. Tracey, T.J.; Steyn, F.J.; Wolvetang, E.J.; Ngo, S.T. Neuronal Lipid Metabolism: Multiple Pathways Driving Functional Outcomes in Health and Disease. Front. Mol. Neurosci. 2018, 11, 10. [Google Scholar] [CrossRef] [Green Version]
  29. Chen, S.P.; Tolner, E.A.; Eikermann-Haerter, K. Animal models of monogenic migraine. Cephalalgia 2016, 36, 704–721. [Google Scholar] [CrossRef] [Green Version]
  30. Eikermann-Haerter, K.; Lee, J.H.; Yuzawa, I.; Liu, C.H.; Zhou, Z.; Shin, H.K.; Zheng, Y.; Qin, T.; Kurth, T.; Waeber, C.; et al. Migraine mutations increase stroke vulnerability by facilitating ischemic depolarizations. Circulation 2012, 125, 335–345. [Google Scholar] [CrossRef] [Green Version]
  31. Mulder, I.A.; Ogrinc Potočnik, N.; Broos, L.A.M.; Prop, A.; Wermer, M.J.A.; Heeren, R.M.A.; van den Maagdenberg, A.M.J.M. Distinguishing core from penumbra by lipid profiles using Mass Spectrometry Imaging in a transgenic mouse model of ischemic stroke. Sci. Rep. 2019, 9, 1090. [Google Scholar] [CrossRef] [Green Version]
  32. Golovko, S.A.; Golovko, M.Y. Plasma Unesterified Fatty-Acid Profile Is Dramatically and Acutely Changed under Ischemic Stroke in the Mouse Model. Lipids 2018, 53, 641–645. [Google Scholar] [CrossRef] [PubMed]
  33. Arabadzhieva, D.Y.; Slavov, Z.; Kaprelyan, A. Serum lipid anomalies in adult patients with acute ischemic stroke. Scr. Sci. Med. 2015, 47, 31. [Google Scholar] [CrossRef] [Green Version]
  34. Heischmann, S.; Quinn, K.; Cruickshank-Quinn, C.; Liang, L.; Reisdorph, R.; Reisdorph, N.; Patel, M. Exploratory Metabolomics Profiling in the Kainic Acid Rat Model Reveals Depletion of 25-Hydroxyvitamin D3 during Epileptogenesis. Sci. Rep. 2016, 6, 31424. [Google Scholar] [CrossRef] [Green Version]
  35. Dreier, J.P.; Major, S.; Pannek, H.W.; Woitzik, J.; Scheel, M.; Wiesenthal, D.; Martus, P.; Winkler, M.K.L.; Hartings, J.A.; Fabricius, M.; et al. Spreading convulsions, spreading depolarization and epileptogenesis in human cerebral cortex. Brain 2012, 135, 259–275. [Google Scholar] [CrossRef]
  36. Carlson, L.A.; Ekelund, L.G.; Orö, L. Clinical and metabolic effects of different doses of prostaglandin E1 in man. Prostaglandin and related factors. Acta Med. Scand. 1968, 183, 423–430. [Google Scholar] [CrossRef]
  37. Davis, R.J.; Murdoch, C.E.; Ali, M.; Purbrick, S.; Ravid, R.; Baxter, G.S.; Tilford, N.; Sheldrick, R.L.G.; Clark, K.L.; Coleman, R.A. EP4 prostanoid receptor-mediated vasodilatation of human middle cerebral arteries. Br. J. Pharm. 2004, 141, 580–585. [Google Scholar] [CrossRef] [Green Version]
  38. Wienecke, T.; Olesen, J.; Ashina, M. Discrepancy between strong cephalic arterial dilatation and mild headache caused by prostaglandin D₂ (PGD₂). Cephalalgia 2011, 31, 65–76. [Google Scholar] [CrossRef] [PubMed]
  39. Zhang, X.C.; Strassman, A.M.; Burstein, R.; Levy, D. Sensitization and activation of intracranial meningeal nociceptors by mast cell mediators. J. Pharm. Exp. Pharm. Exp. 2007, 322, 806–812. [Google Scholar] [CrossRef] [Green Version]
  40. Mezei, Z.; Kis, B.; Gecse, A.; Tajti, J.; Boda, B.; Telegdy, G.; Vécsei, L. Platelet arachidonate cascade of migraineurs in the interictal phase. Platelets 2000, 11, 222–225. [Google Scholar]
  41. Viola, S.; Viola, P.; Litterio, P.; Buongarzone, M.P.; Fiorelli, L. Stroke risk and migraine: Near-infrared spectroscopy study. Neurol. Sci. 2012, 33 (Suppl. 1), S173–S175. [Google Scholar] [CrossRef] [PubMed]
  42. Jenkins, D.W.; Feniuk, W.; Humphrey, P.P. Characterization of the prostanoid receptor types involved in mediating calcitonin gene-related peptide release from cultured rat trigeminal neurons. Br. J. Pharm. 2001, 134, 1296–1302. [Google Scholar] [CrossRef] [PubMed] [Green Version]
  43. Durham, P.L. Calcitonin gene-related peptide (CGRP) and migraine. Headache 2006, 46 (Suppl. 1), S3–S8. [Google Scholar] [CrossRef] [Green Version]
  44. Karatas, H.; Erdener, S.E.; Gursoy-Ozdemir, Y.; Lule, S.; Eren-Koçak, E.; Sen, Z.D.; Dalkara, T. Spreading depression triggers headache by activating neuronal Panx1 channels. Science 2013, 339, 1092–1095. [Google Scholar] [CrossRef] [PubMed]
  45. Wienecke, T.; Olesen, J.; Oturai, P.S.; Ashina, M. Prostaglandin E2(PGE2) induces headache in healthy subjects. Cephalalgia 2009, 29, 509–519. [Google Scholar] [CrossRef]
  46. Wienecke, T.; Olesen, J.; Ashina, M. Prostaglandin I2 (epoprostenol) triggers migraine-like attacks in migraineurs. Cephalalgia 2010, 30, 179–190. [Google Scholar] [CrossRef]
  47. Antonova, M.; Wienecke, T.; Olesen, J.; Ashina, M. Prostaglandin E2 induces immediate migraine-like attack in migraine patients without aura. Cephalalgia 2012, 32, 822–833. [Google Scholar] [CrossRef] [Green Version]
  48. Lauritzen, M.; Hansen, A.J.; Kronborg, D.; Wieloch, T. Cortical spreading depression is associated with arachidonic acid accumulation and preservation of energy charge. J. Cereb. Blood Flow Metab. 1990, 10, 115–122. [Google Scholar] [CrossRef] [Green Version]
  49. Tassorelli, C.; Greco, R.; Armentero, M.T.; Blandini, F.; Sandrini, G.; Nappi, G. A role for brain cyclooxygenase-2 and prostaglandin-E2 in migraine: Effects of nitroglycerin. Int. Rev. Neurobiol. 2007, 82, 373–382. [Google Scholar]
  50. Alsaif, M.; Guest, P.C.; Schwarz, E.; Reif, A.; Kittel-Schneider, S.; Spain, M.; Rahmoune, H.; Bahn, S. Analysis of serum and plasma identifies differences in molecular coverage, measurement variability, and candidate biomarker selection. Proteom. Clin. Appl. 2012, 6, 297–303. [Google Scholar] [CrossRef]
  51. Nattero, G.; Allais, G.; De Lorenzo, C.; Benedetto, C.; Zonca, M.; Melzi, E.; Massobrio, M. Relevance of prostaglandins in true menstrual migraine. Headache 1989, 29, 233–238. [Google Scholar] [CrossRef]
  52. Yazdi, P.G. A review of the biologic and pharmacologic role of docosapentaenoic acid n-3. F1000Res 2013, 2, 256. [Google Scholar] [CrossRef] [Green Version]
  53. Soveyd, N.; Abdolahi, M.; Bitarafan, S.; Tafakhori, A.; Sarraf, P.; Togha, M.; Okhovat, A.A.; Hatami, M.; Sedighiyan, M.; Djalali, M. Molecular mechanisms of omega-3 fatty acids in the migraine headache. Rev. Iran. J. Neurol. 2017, 16, 210–217. [Google Scholar]
  54. Franceschini, A.; Vilotti, S.; Ferrari, M.D.; van den Maagdenberg, A.M.J.M.; Nistri, A.; Fabbretti, E. TNFα levels and macrophages expression reflect an inflammatory potential of trigeminal ganglia in a mouse model of familial hemiplegic migraine. PLoS ONE 2013, 8, e52394. [Google Scholar] [CrossRef]
  55. Gross, E.C.; Putananickal, N.; Orsini, A.L.; Vogt, D.R.; Sandor, P.S.; Schoenen, J.; Fischer, D. Mitochondrial function and oxidative stress markers in higher-frequency episodic migraine. Sci. Rep. 2021, 11, 4543. [Google Scholar] [CrossRef]
  56. Tanha, H.M.; Sathyanarayanan, A.; International Headache Genetics Consortium; Nyholt, D.R. Genetic overlap and causality between blood metabolites and migraine. Am. J. Hum. Genet. 2021, 108, 2086–2098. [Google Scholar] [CrossRef] [PubMed]
  57. Ramsden, C.E.; Zamora, D.; Faurot, K.R.; MacIntosh, B.A.; Horowitz, M.; Keyes, G.S.; Yuan, Z.X.; Miller, V.; Lynch, C.; Honvoh, G. Dietary alteration of n-3 and n-6 fatty acids for headache reduction in adults with migraine: Randomized controlled trial. BMJ 2021, 374, n1448. [Google Scholar] [CrossRef]
  58. Ramsden, C.E.; Faurot, K.R.; Zamora, D.; Palsson, O.S.; MacIntosh, B.A.; Gaylord, S.; Taha, A.Y.; Rapoport, S.I.; Hibbeln, J.R.; Davis, J.M. Targeted alterations in dietary n-3 and n-6 fatty acids improve life functioning and reduce psychological distress among patients with chronic headache: A secondary analysis of a randomized trial. Pain 2015, 156, 587–596. [Google Scholar] [CrossRef] [PubMed]
  59. Sang, N.; Chen, C. Lipid signaling and synaptic plasticity. Neuroscientist 2006, 12, 425–434. [Google Scholar] [CrossRef]
  60. Pardutz, A.; Schoenen, J. NSAIDs in the Acute Treatment of Migraine: A Review of Clinical and Experimental Data. Pharmaceuticals 2010, 3, 1966–1987. [Google Scholar] [CrossRef] [PubMed]
  61. Kitazawa, M.; Kaneko, Y.; Shiratori, R.; Tsukamoto, S.; Oshida, S. Changes of fatty acid composition of brain synaptosomal phospholipids in isoflurane exposure rat. Nihon Arukoru Yakubutsu Igakkai Zasshi 2001, 36, 171–181. [Google Scholar] [PubMed]
  62. Sano, Y.; Ito, S.; Yoneda, M.; Nagasawa, K.; Matsuura, N.; Yamada, Y.; Uchinaka, A.; Bando, Y.K.; Murohara, T.; Nagata, K. Effects of various types of anesthesia on hemodynamics, cardiac function, and glucose and lipid metabolism in rats. Am. J. Physiol. Heart Circ. Physiol. 2016, 311, H1360–H1366. [Google Scholar] [CrossRef] [PubMed]
  63. Söbbeler, F.J.; Carrera, I.; Pasloske, K.; Ranasinghe, M.G.; Kircher, P.; Kästner, S.B.R. Effects of isoflurane, sevoflurane, propofol and alfaxalone on brain metabolism in dogs assessed by proton magnetic resonance spectroscopy (1 H MRS). Randomized Control. Trial. BMC Vet. Res. 2018, 14, 69. [Google Scholar] [CrossRef] [Green Version]
  64. Scher, J.U.; Pillinger, M.H. The anti-inflammatory effects of prostaglandins. J. Investig. Med. 2009, 57, 703–708. [Google Scholar] [CrossRef]
  65. Foley, P.L.; Kendall, L.V.; Turner, P.V. Clinical Management of Pain in Rodents. Rev. Comp. Med. 2019, 69, 468–489. [Google Scholar] [CrossRef] [PubMed]
  66. Houben, T.; Loonen, I.C.M.; Baca, S.M.; Schenke, M.; Meijer, J.H.; Ferrari, M.D.; Terwindt, G.M.; Voskuyl, R.A.; Charles, A.; van den Maagdenberg, A.M.J.M.; et al. Optogenetic induction of cortical spreading depression in anesthetized and freely behaving mice. J. Cereb. Blood Flow Metab. 2017, 37, 1641–1655. [Google Scholar] [CrossRef] [PubMed] [Green Version]
  67. Altamura, C.; Corbelli, I.; de Tommaso, M.; Di Lorenzo, C.; Di Lorenzo, G.; Di Renzo, A. Pathophysiological Bases of Comorbidity in Migraine. Front. Hum. Neurosci. 2021, 15, 640574. [Google Scholar] [CrossRef] [PubMed]
Figure 1. CSD experiments with short- and long-term plasma sample collection in mice, followed by plasma lipid metabolomics analysis. (A). Inset shows locations of topical application of KCl/NaCl over the visual cortex (V1) and the DC-EEG recording site in the motor cortex (M1). Topical application of 300 mM KCl (for CSD induction) or NaCl (Sham procedure), as indicated by arrowheads, was performed every 10 min over a period of 1 h in isoflurane-anesthetized mice. Note that each application of KCl was sufficient to induce a single CSD event, thus in total 7 CSD events were induced within a 1 h time window. In the schematic of the short-term and long-term experiments, the period during which mice were kept under isoflurane anesthesia is indicated by the grey bar underneath the timeline. In short-term experiments, mice were under isoflurane anesthesia for the entire experiment with a duration of ~2 h, and sacrificed directly after collection of the last sample. In long-term experiments, the mice were under isoflurane anesthesia for ~1.5 h during the surgery and CSD induction part of the experiment. For both short- and long-term experiments, baseline blood samples were obtained 1 h prior to CSD through a tail cut. In the short-term experiments, additional sampling was performed every 0.5 h up to 1.5 h after the first CSD event by sampling from the femoral artery catheter in anesthetized mice. In the long-term experiments, sampling was performed at 1.5 h, 4 h, 24 h and 48 h after the first CSD, using tail blood samples from awake mice. (B) DC-EEG example traces of the CSD and Sham paradigm showing that CSD was induced only following KCl application and not after NaCl application (KCl or NaCl application moments indicated by arrowheads).
Metabolites 12 00220 g001
Figure 2. Baseline plasma lipid concentrations are similar between WT and R192Q mutant mice. The volcano plot shows that there are no significant differences in the concentration of measured plasma lipids between WT and R192Q mutant mice. For some metabolites, the ratio between product/substrate of a metabolic pathway was used (e.g., HDHA10/DHA, HETEB/AA, diHETE-14-15/EPA in the plot), given the large inter-individual variation in the absolute concentrations. See Supplementary Table S1 for the list of targeted metabolites, structured by metabolic class; note that since the data analysis was conducted in the R environment, the metabolite names had to be adapted to make them readable for the software.
Metabolites 12 00220 g002
Figure 3. CSD is associated with a short-term transient increase in plasma PGD2 level. In both WT (A) and R192Q mutant mice (B), a transient increase in PGD2 was observed at 30 min following the first CSD induction compared to Sham-treated mice, that at 1 h was no longer evident in WT mice while remaining increased in R192Q mutant mice. For both WT and R192Q mutant mice, at 1.5 h following the first CSD, PGD2 levels were comparable to that of Sham-treated mice. Indicated p-values obtained from a Mann–Whitney U-test. Panels on the right show the time course of the levels of plasma PGD2 for WT and R192Q mutant mice for CSD compared to Sham groups. *: p ≤ 0.05; **: p ≤ 0.01.
Metabolites 12 00220 g003
Figure 4. PGD2 plasma levels are not altered at long-term time points up to 48 h following CSD. For both WT (A) and R192Q mutant mice (B), there were no changes in PGD2 levels at 4 h, 24 h and 48 h following CSD, compared to levels of Sham-treated mice. Panels on the right show the time course of the levels of plasma PGD2 for WT and R192Q mutant mice for CSD compared to Sham groups.
Metabolites 12 00220 g004
Figure 5. CSD-related increase in lipid concentration of DPAn-3 (A), EPA (B), ALA (C), and DHA (D) in WT mice at 24 h following CSD. In WT mice, levels of DPAn-3, EPA, ALA, and DHA were significantly higher at 24 h following CSD in comparison to levels in Sham-treated mice. *: p ≤ 0.05; **: p ≤ 0.01.
Metabolites 12 00220 g005
Figure 6. Plasma lipid concentrations of DPAn-3 (A), EPA (B), ALA (C), and DHA (D) compared between WT and R192Q mutant mice at 24 h following CSD did not differ.
Metabolites 12 00220 g006
Table 1. CSD characteristics and systemic physiological parameters in catheterized mice during short-term experiments.
Experimental GroupsnAmplitude (mV)Duration (s)pHpCO2pO2MABP
(mm Hg)
Short-term
WT Sham
WT CSD
R192Q Sham
R192Q CSD

5
5
5
5

-
18 ± 5
-
14 ± 6

-
47 ± 4
-
43 ± 6

7.34 ± 0.06
7.35 ± 0.02
7.36 ± 0.04
7.34 ± 0.01

32 ± 7
32 ± 5
28 ± 4
33 ± 4

115 ± 11
110 ± 12
120 ± 7
115 ± 9

77 ± 7
72 ± 4
74 ± 6
79 ± 7
Long-term
WT Sham
WT CSD
R192Q Sham
R192Q CSD
5
5
5
5
-
21 ± 3
-
22 ± 1
-
59 ± 19
-
54 ± 17
-
-
-
-
-
-
-
-
-
-
-
-
-
-
-
-
Values are shown as means ± SD. All physiological parameters during CSD recordings were within physiological ranges. For both CSD features and physiological parameters, group differences are not statistically significant (1-way ANOVA). Mean arterial blood pressure (MABP) and arterial partial pressure of carbon dioxide (pCO2) and oxygen (pO2) are expressed in mmHg, averaged over the recording period. n: number of mice; -: indicates that CSD features were not obtained during Sham experiments (since no CSD events were induced upon topical NaCl application), and physiological parameters were not obtained for long-term experiments (since no femoral artery catheterization was performed in these experiments).
Publisher’s Note: MDPI stays neutral with regard to jurisdictional claims in published maps and institutional affiliations.

