Possible Influence of Weight Gain and Creatinine Levels in Predicting Response to Nivolumab: A Multicenter Analysis

 ,
,  , , ,
, , ,  ,
,
Abstract
:1. Introduction
2. Results
3. Discussion
4. Materials and Methods
5. Conclusions
Author Contributions
Funding
Acknowledgments
Conflicts of Interest
References
- Hugo, W.; Zaretsky, J.M.; Sun, L.; Song, C.; Moreno, B.H.; Hu-Lieskovan, S.; Berent-Maoz, B.; Pang, J.; Chmielowski, B.; Cherry, G.; et al. Genomic and transcriptomic features of response to anti-PD-1 therapy in metastatic melanoma. Cell 2016, 165, 35–44. [Google Scholar] [CrossRef] [PubMed] [Green Version]
- Riaz, N.; Havel, J.J.; Makarov, V.; Desrichard, A.; Urba, W.J.; Sims, J.S.; Hodi, F.S.; Martín-Algarra, S.; Mandal, R.; Sharfman, W.H.; et al. Tumor and Microenvironment Evolution during Immunotherapy with Nivolumab. Cell 2017, 171, 934–949. [Google Scholar] [CrossRef] [PubMed] [Green Version]
- Weber, J.S.; Kudchadkar, R.R.; Gibney, G.T.; Yu, B.; Cheng, P.; Martinez, A.J.; Kroeger, J.; Gallenstein, D.; Richards, A.; Welsh, E.; et al. Updated survival, toxicity and biomarkers of nivolumab with/without peptide vaccine in patients naive to, or progressed on ipilimumab. J. Clin. Oncol. 2014, 32, 3009. [Google Scholar] [CrossRef]
- Naik, G.S.; Waikar, S.S.; Johnson, A.E.; Buchbinder, E.I.; Haq, R.; Hodi, F.S.; Schoenfeld, J.D.; Ott, P.A. Complex inter-relationship of body mass index, gender and serum creatinine on survival: Exploring the obesity paradox in melanoma patients treated with checkpoint inhibition. J. Immunother. Cancer 2019, 7, 89. [Google Scholar] [CrossRef] [PubMed] [Green Version]
- McQuade, J.L.; Daniel, C.R.; Hess, K.R.; Mak, C.; Wang, D.Y.; Rai, R.R.; Park, J.J.; Haydu, L.E.; Spencer, C.; Wongchenko, M.; et al. Association of body-mass index and outcomes in patients with metastatic melanoma treated with targeted therapy, immunotherapy, or chemotherapy: A retrospective, multicohort analysis. Lancet Oncol. 2018, 19, 310–322. [Google Scholar] [CrossRef] [Green Version]
- Heymsfield, S.B.; McManus, C.; Stevens, V.; Smith, J. Muscle mass: Reliable indicator of protein-energy malnutrition severity and outcome. Am. J. Clin. Nutr. 1982, 35, 1192–1199. [Google Scholar] [CrossRef] [PubMed] [Green Version]
- Shachar, S.S.; Williams, G.R.; Muss, H.B.; Nishijima, T.F. Prognostic value of sarcopenia in adults with solid tumours: A meta-analysis and systematic review. Eur. J. Cancer 2016, 57, 58–67. [Google Scholar] [CrossRef] [PubMed]
- Porporato, P.E. Understanding cachexia as a cancer metabolism syndrome. Oncogenesis 2016, 5, e200. [Google Scholar] [CrossRef] [PubMed] [Green Version]
- Thongprayoon, C.; Cheungpasitporn, W.; Kashani, K. Serum creatinine level, a surrogate of muscle mass, predicts mortality in critically ill patients. J. Thorac. Dis. 2016, 8, E305–E311. [Google Scholar] [CrossRef] [PubMed] [Green Version]
- Kleber, M.; Cybulla, M.; Bauchmüller, K.; Ihorst, G.; Koch, B.; Engelhardt, M. Monitoring of renal function in cancer patients: An ongoing challenge for clinical practice. Ann. Oncol. 2007, 18, 950–958. [Google Scholar] [CrossRef] [PubMed]
- Miller, A.E.; MacDougall, J.D.; Tarnopolsky, M.A.; Sale, D.G. Gender differences in strength and muscle fiber characteristics. Eur. J. Appl. Physiol. 1993, 66, 254–262. [Google Scholar] [CrossRef] [PubMed]
- Juretic, A.; Spagnoli, G.C.; Hörig, H.; Babst, R.; Von Bremen, K.; Harder, F.; Heberer, M. Glutamine requirements in the generation of lymphokine-activated killer cells. Clin. Nutr. 1994, 13, 42–49. [Google Scholar] [CrossRef]
- Spittler, A.; Winkler, S.; Gotzinger, P.; Oehler, R.; Willheim, M.; Tempfer, C.; Weigel, G.; Fugger, R.; Boltz-Nitulescu, G.; Roth, E. Influence of glutamine on the phenotype and function of human monocytes. Blood 1995, 86, 1564–1569. [Google Scholar] [CrossRef] [PubMed] [Green Version]
- Adrian, T.; Alecu, L.; Poiana, C.; Tomescu, L.; Slavu, I.; Tulin, R.; Pituru, S.; Orlov, C.; Jecan, R.; Cristian, B.; et al. Functional radical cervical dissection for differentiated thyroid cancer: The experience of a single center. J. Mind Med. Sci. 2018, 5, 278–283. [Google Scholar] [CrossRef]
- Alecu, L.; Tulin, A.; Enciu, O.; Bărbulescu, M.; Ursuţ, B.; Obrocea, F. Gastrointestinal Stromal Tumors: Diagnosis and Surgical Treatment. Chirurgia 2015, 110, 525–529. [Google Scholar] [PubMed]
- Lennon, H.; Sperrin, M.; Badrick, E.; Renehan, A.G. The obesity paradox in cancer: A review. Curr. Oncol. Rep. 2016, 18, 56. [Google Scholar] [CrossRef] [PubMed]
- Seijkens, T.; Kusters, P.; Chatzigeorgiou, A.; Chavakis, T.; Lutgens, E. Immune cell crosstalk in obesity: A key role for costimulation? Diabetes 2014, 63, 3982–3991. [Google Scholar] [CrossRef] [PubMed] [Green Version]
- Wang, Z.; Aguilar, E.G.; Luna, J.I.; Dunai, C.; Khuat, L.T.; Le, C.T.; Mirsoian, A.; Minnar, C.M.; Stoffel, K.M.; Sturgill, I.R.; et al. Paradoxical effects of obesity on T cell function during tumor progression and PD-1 checkpoint blockade. Nat. Med. 2019, 25, 141–151. [Google Scholar] [CrossRef] [PubMed]
- Han, S.J.; Zaretsky, A.G.; Andrade-Oliveira, V.; Collins, N.; Dzutsev, A.; Shaik, J.; da Fonseca, D.M.; Harrison, O.J.; Tamoutounour, S.; Byrd, A.L.; et al. White Adipose Tissue Is a Reservoir for Memory T Cells and Promotes Protective Memory Responses to Infection. Immunity 2017, 47, 1154–1168.e6. [Google Scholar] [CrossRef] [PubMed] [Green Version]


| Characteristic | N (%) |
|---|---|
| Female | 13 (22.8%) |
| Male | 44 (77.19%) |
| Age | |
| Mean | 62 |
| Range | [39–80] |
| Site of tumor | |
| Melanoma | 26 (45.61%) |
| NSCLC | 24 (42.1%) |
| Renal cell carcinoma | 7 (12.28%) |
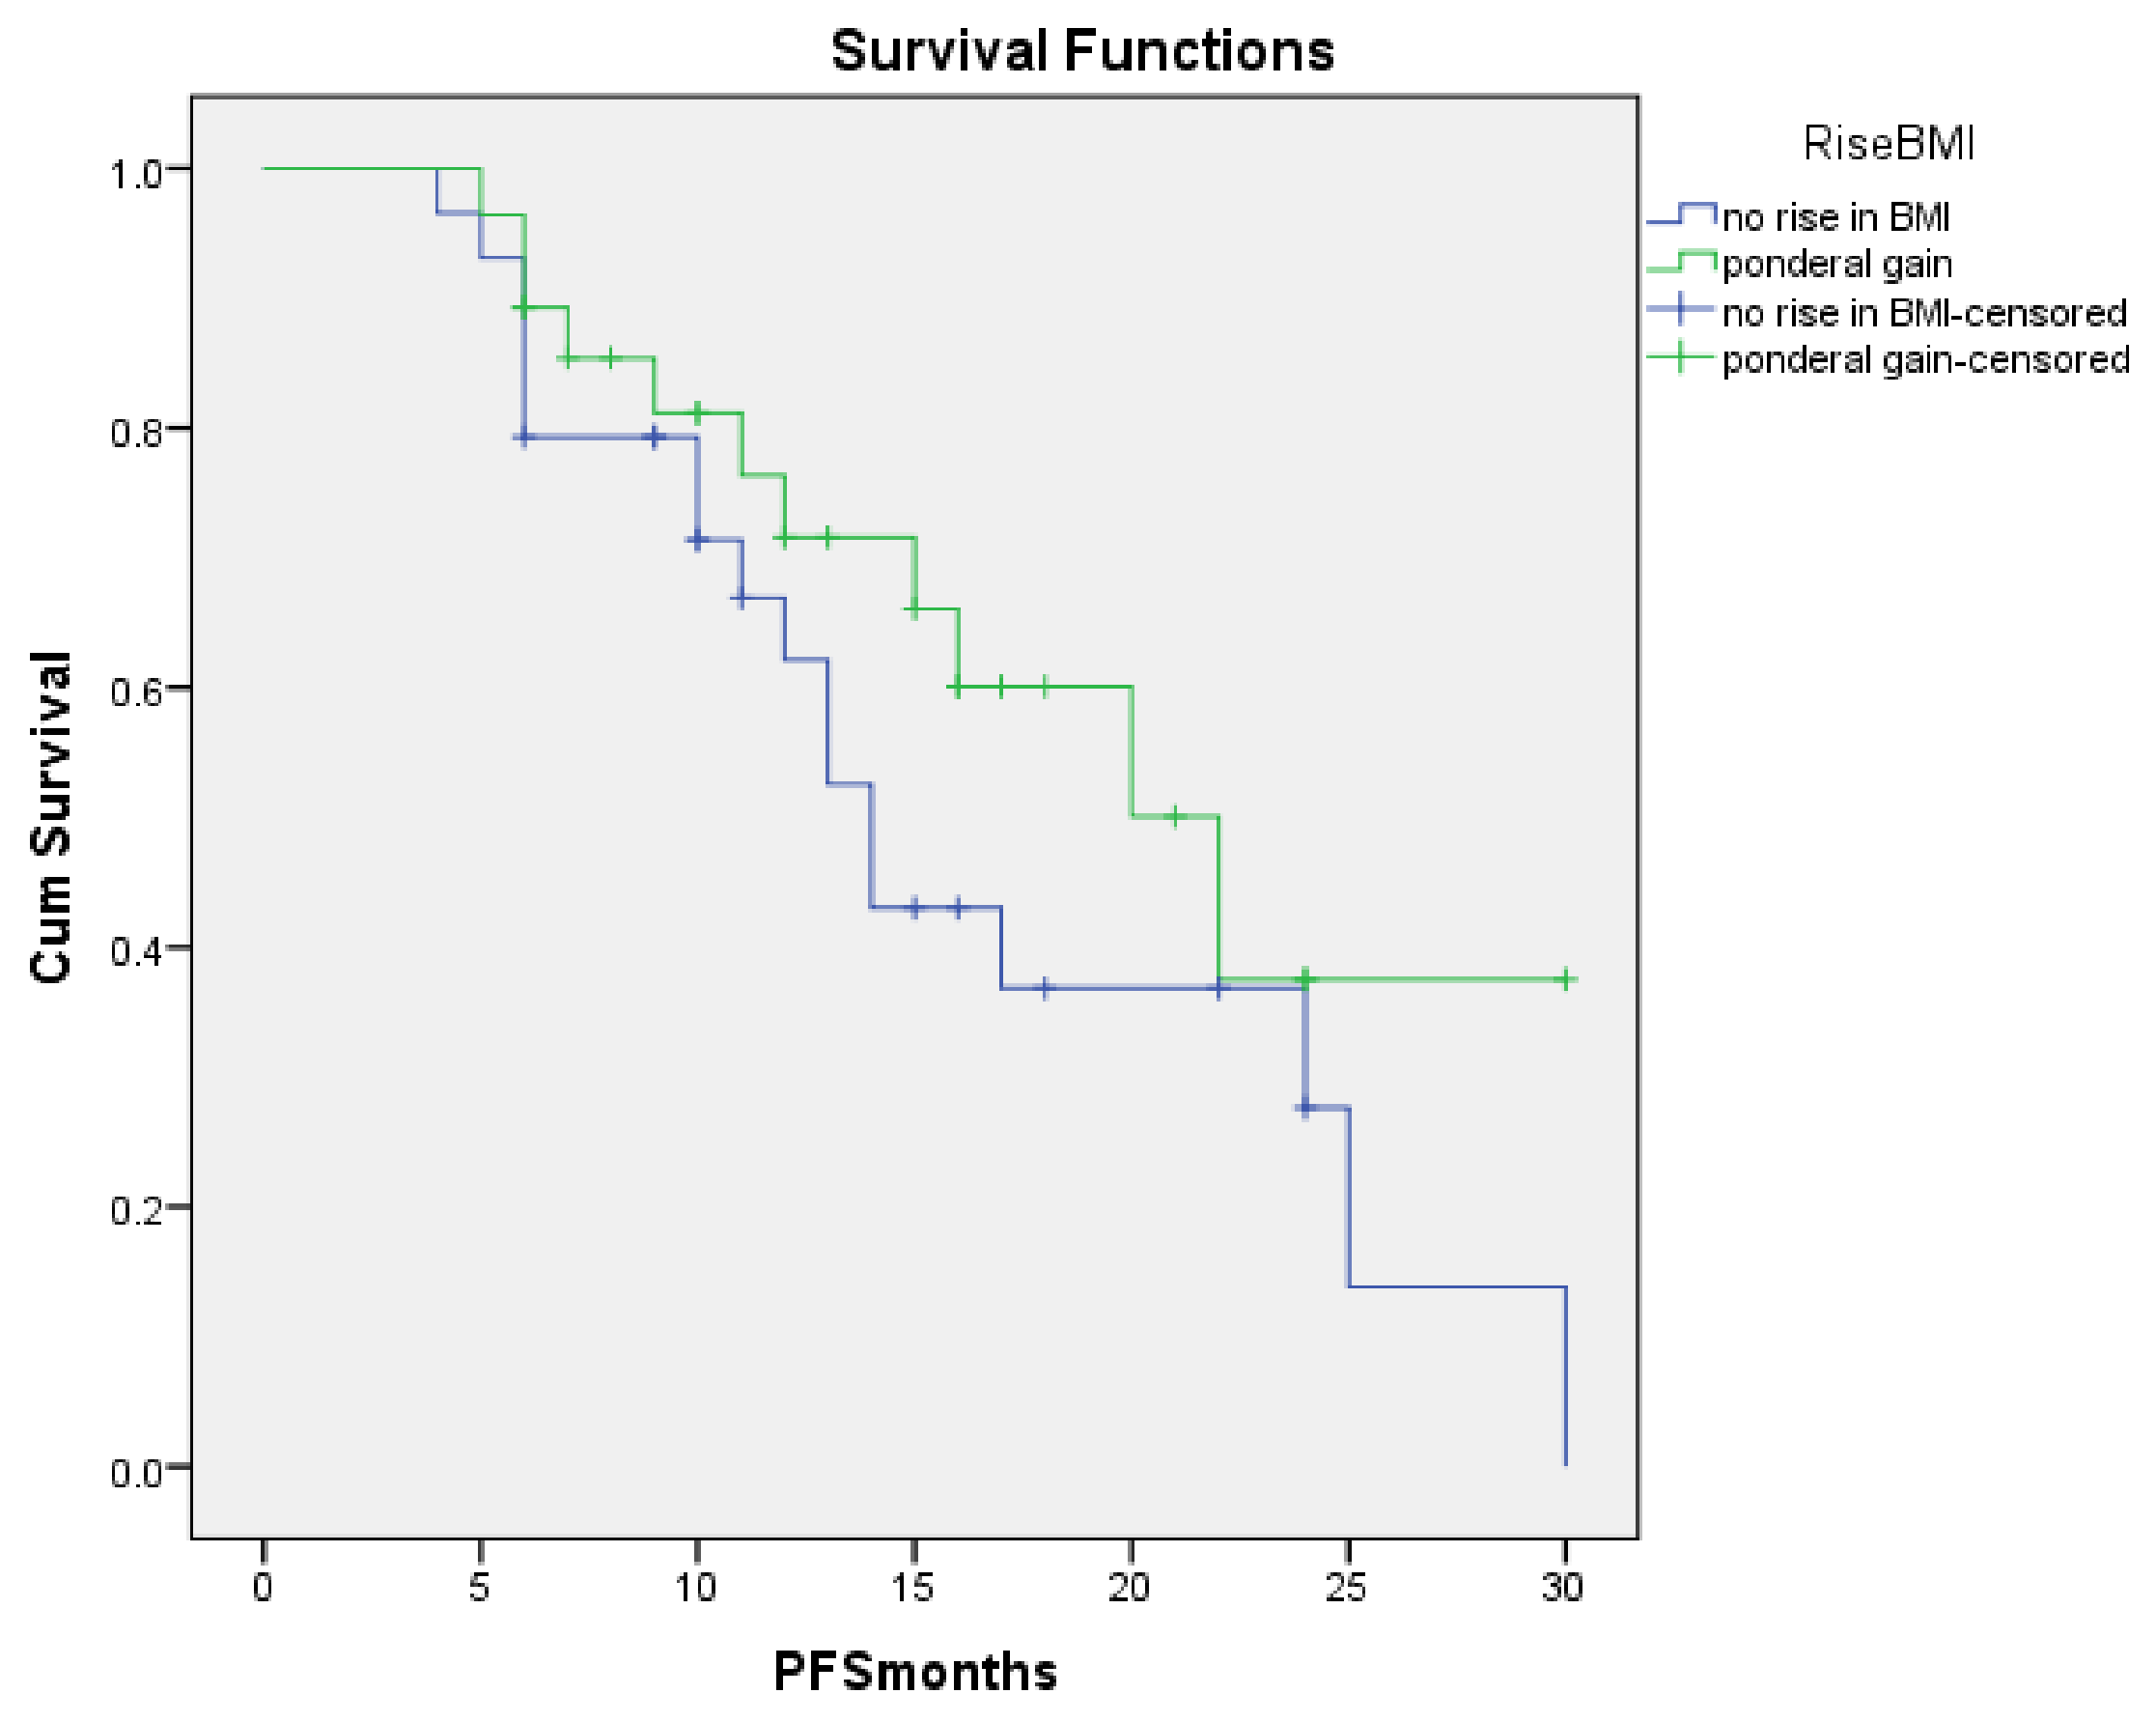
| Proportion of weight groups | |
| Underweight | 6 (10.52%) |
| Normal | 26 (45.61%) |
| Overweight/obese | 25 (43.85%) |
| ECOG | |
| ECOG = 2 | 5 (8.77%) |
| ECOG = 1 | 12 (21.05%) |
| ECOG = 0 | 40 (70.17%) |
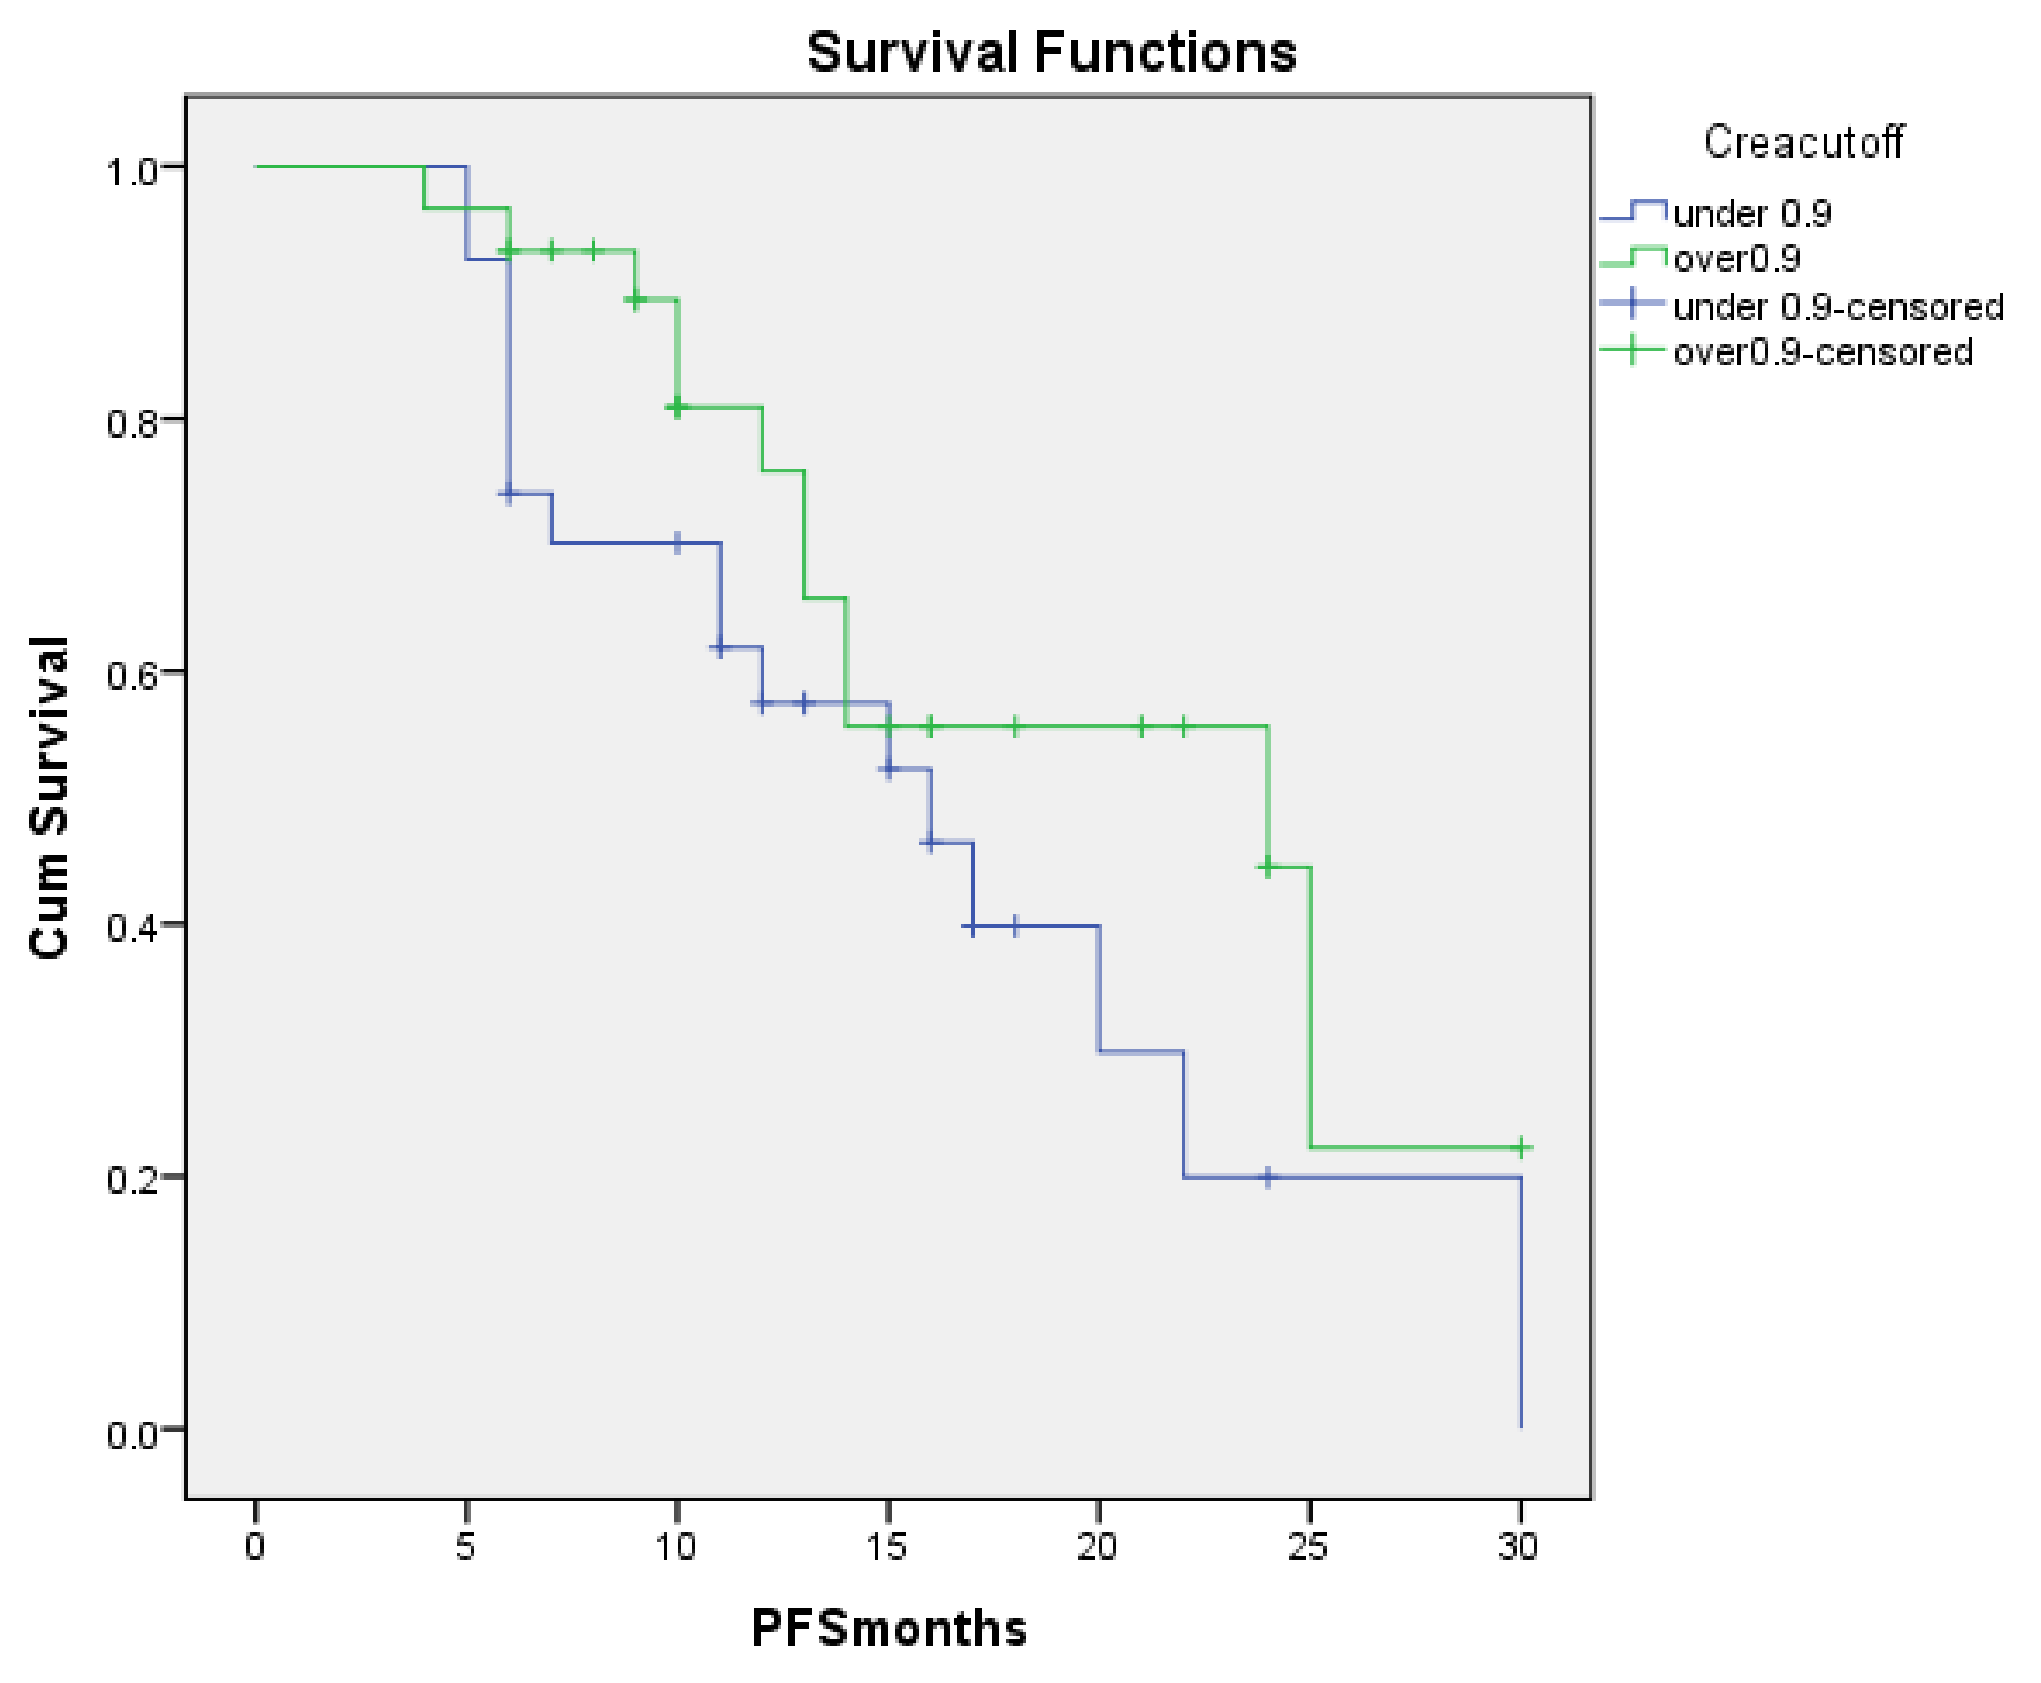
| Creatinine | |
| Mean creatinine level [Range] | 0.93 [0.52–1.74] |
| Creatinine over 0.9 | 27 (47.4%) |
| Creatinine under 0.9 | 30 (52.6%) |
| BMI values | |
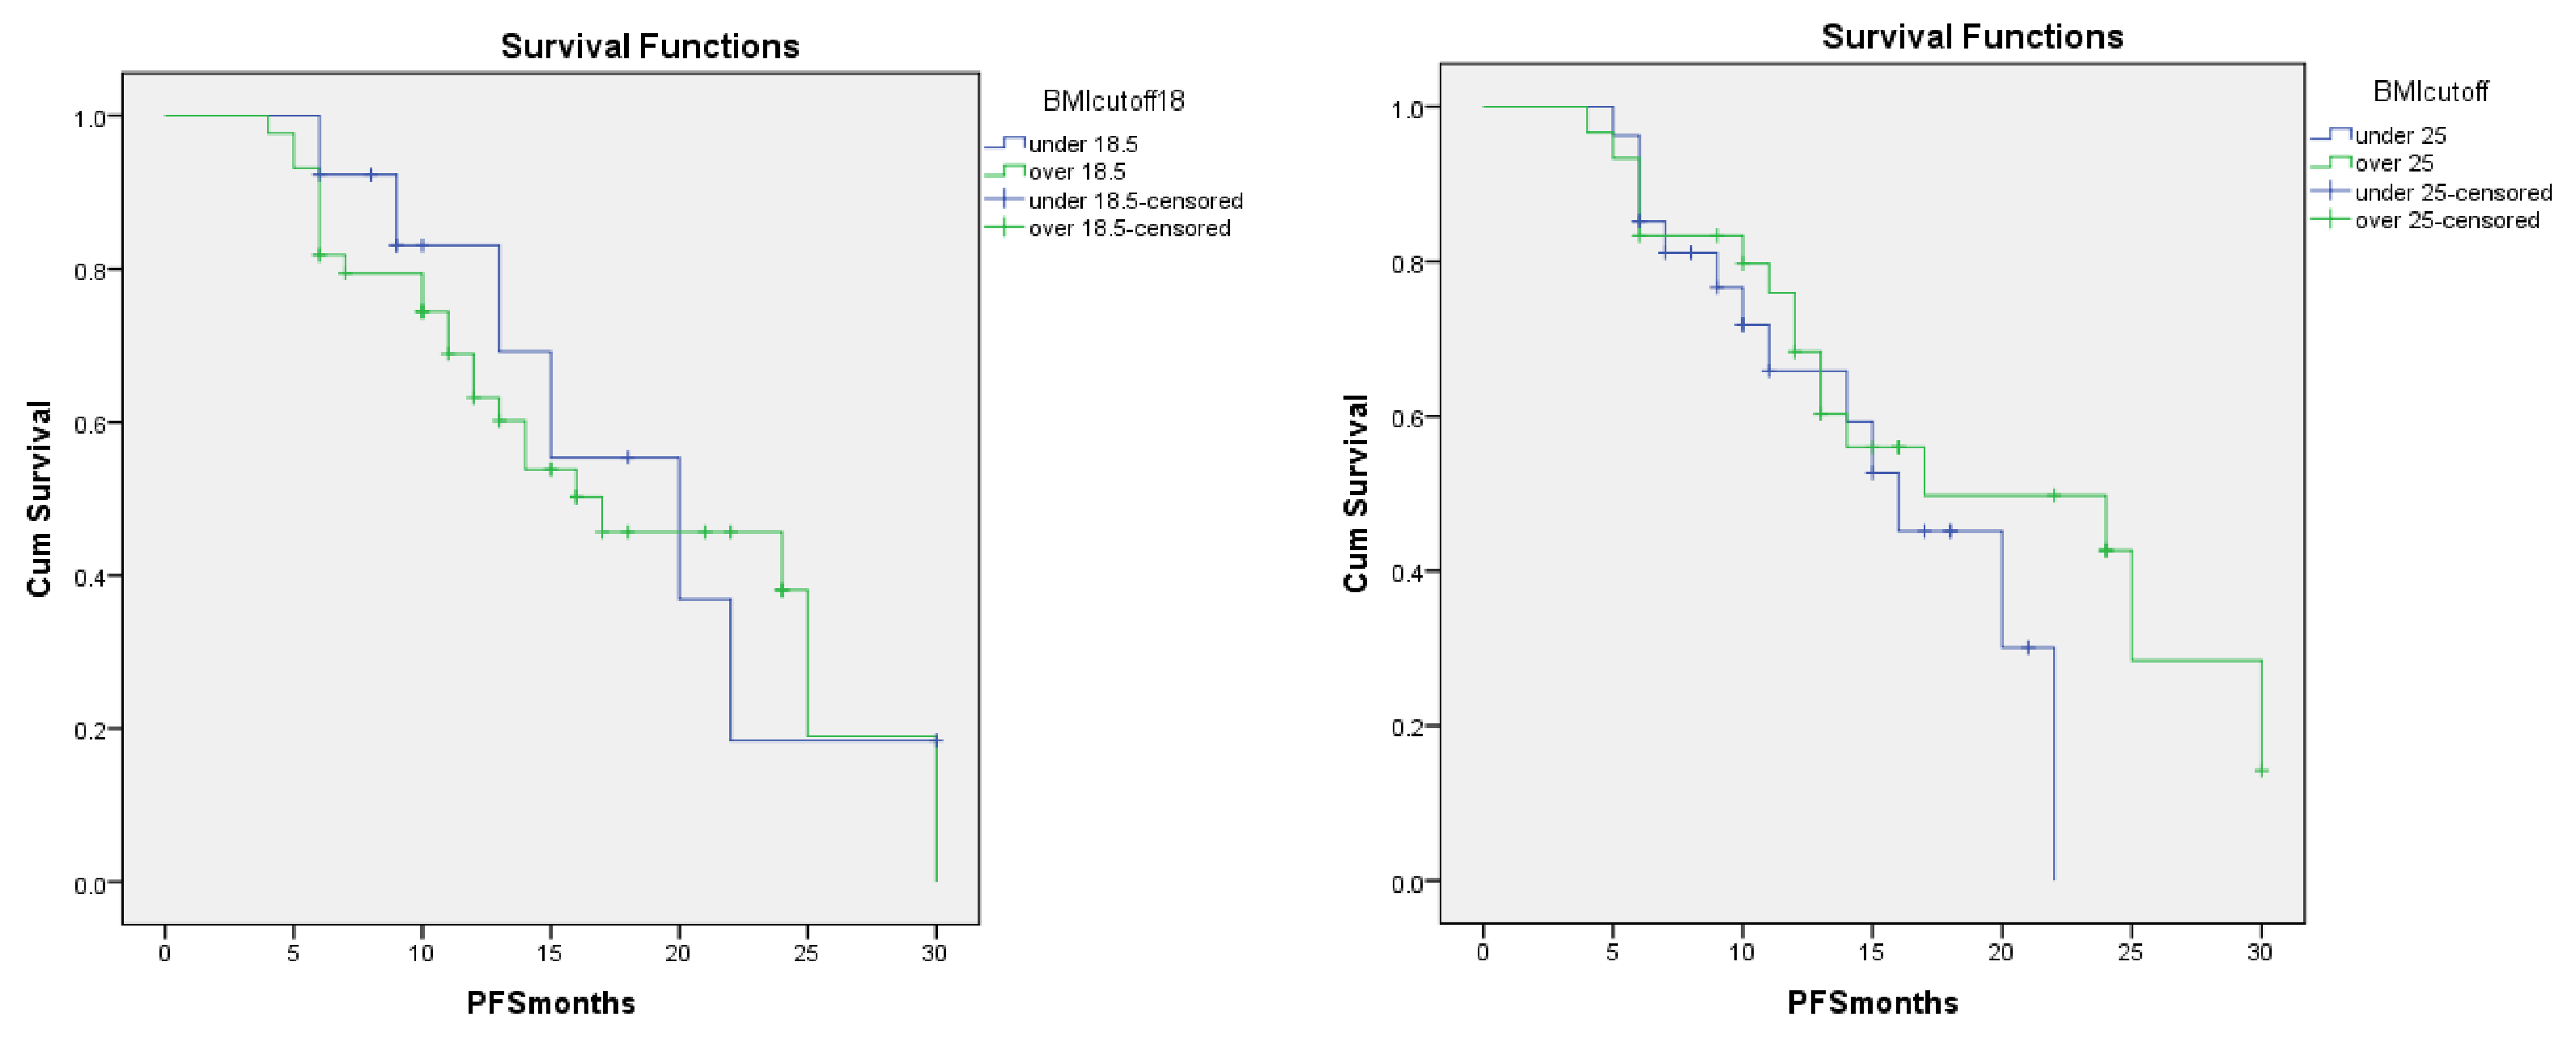
| BMI under 18.5 | 6 (10.6%) |
| BMI over 18.5 | 51 (89.4% |
| BMI under 25 | 27 (47.4%) |
| BMI over 25 | 30 (52.6%) |
Publisher’s Note: MDPI stays neutral with regard to jurisdictional claims in published maps and institutional affiliations. |
© 2020 by the authors. Licensee MDPI, Basel, Switzerland. This article is an open access article distributed under the terms and conditions of the Creative Commons Attribution (CC BY) license (http://creativecommons.org/licenses/by/4.0/).
Share and Cite
Nitipir, C.; Orlov-Slavu, C.; Alecu, L.; Slavu, I.; Pantea-Stoian, A.; Celmare, I.D.; Olaru, M.; Calu, V.; Suceveanu, A.-I.; Mazilu, L.; et al. Possible Influence of Weight Gain and Creatinine Levels in Predicting Response to Nivolumab: A Multicenter Analysis. Metabolites 2020, 10, 510. https://doi.org/10.3390/metabo10120510
Nitipir C, Orlov-Slavu C, Alecu L, Slavu I, Pantea-Stoian A, Celmare ID, Olaru M, Calu V, Suceveanu A-I, Mazilu L, et al. Possible Influence of Weight Gain and Creatinine Levels in Predicting Response to Nivolumab: A Multicenter Analysis. Metabolites. 2020; 10(12):510. https://doi.org/10.3390/metabo10120510
Chicago/Turabian StyleNitipir, Cornelia, Cristina Orlov-Slavu, Lucian Alecu, Iulian Slavu, Anca Pantea-Stoian, Ionela Daniela Celmare, Mihaela Olaru, Valentin Calu, Andra-Iulia Suceveanu, Laura Mazilu, and et al. 2020. "Possible Influence of Weight Gain and Creatinine Levels in Predicting Response to Nivolumab: A Multicenter Analysis" Metabolites 10, no. 12: 510. https://doi.org/10.3390/metabo10120510