Orientation Independent and Dependent Subgrain Growth during Iso-Thermal Annealing of High-Purity and Commercial Purity Aluminium


1
Hydro Aluminium Rolled Products AS, Weidemanns gate 8, N-3080 Holmestrand, Norway
2
NTNU, Department of Materials Science and Engineering, Norwegian University of Science and Technology, N-7491 Trondheim, Norway
*
Author to whom correspondence should be addressed.
Metals 2019, 9(10), 1032; https://doi.org/10.3390/met9101032
Submission received: 23 July 2019
/
Revised: 5 September 2019
/
Accepted: 19 September 2019
/
Published: 23 September 2019
Abstract
:The orientation dependence on recovery has been studied in cold-rolled and annealed polycrystalline high-purity aluminium (99.99 wt%), binary Al-0.25Mn and commercial purity aluminium. The growth mechanisms were found to be independent of the alloy system and the microchemistry only influences the coarsening kinetics. Orientation-dependent subgrain growth, mainly studied in high-purity aluminium and measured in lamellar bands of uniform orientation, occurs in three distinct ways, depending of the size of the local orientation gradients. Following the evolution in average subgrain size and boundary misorientation by detailed electron backscatter diffraction (EBSD) characterization during annealing, it was found that the rate of subgrain growth in Cube- and Goss-oriented grains were faster than in the typical deformation texture components, particularly after an incubation time when discontinuous subgrain growth occurs. In commercial purity aluminium, general orientation-independent subgrain growth is faster than the orientation-dependent growth because more growth occurs in regions near high-angle grain boundaries separating differently oriented lamellar bands. It appears as if subgrains misoriented by more than 3.5° have a growth advantage over less misoriented subgrains, typically in the interior of lamellar bands. While the average boundary misorientations are decreasing, the individual boundary misorientations are increasing.

1. Introduction
Softening of deformed metals typically takes place by recovery (i.e., dislocation annihilation and notably, subgrain growth), recrystallization and grain growth. These phenomena have been extensively studied, particularly during the late 80s and 90s due to the introduction of the electron backscatter diffraction (EBSD) technique for scanning electron microscope (SEM) characterization. This at-the-time new method made detailed studies of the substructure possible with far better statistics than previously achieved by transmission electron microscopy (TEM) and led to an improved description of the softening mechanisms, including the development of several softening models [1,2,3]. However, this area of aluminium metallurgy is still not fully understood.
Humphreys and Hatherly [4] describe how high stacking fault energy metals, like aluminium, have mobile dislocations that make recovery a very important softening reaction. The kinetics of this thermodynamically irreversible transformation is influenced by several factors that are controlled by the chemical composition and the thermo-mechanical processing. Obvious factors are the degree of deformation and the annealing temperature, but the rate of recovery is also influenced, e.g., by texture and the local orientation relationships [5,6]. Even more important is the effect from elements in solid solution. Solute atoms have a pinning effect on grain boundaries, which change the mobility during recrystallization and grain growth [7,8,9]. This effect is not exclusive for grain boundaries but subgrain boundary mobilities (misorientation < 15°) are also reduced by elements like Si and Fe in solid solution [5,10,11,12,13,14].
Huang and Humphreys investigated the effect of solutes on grain boundary mobility during recrystallization and grain growth [7], with the objective to quantify the effects of solute drag on boundary mobility, which is of great importance when trying to accurately describe the recrystallization behaviour of deformed aluminium. To our knowledge, a similarly extensive study on the effect of solute elements on recovery and recrystallization does not exist. However, in order to understand and model the recovery behaviour in recycled alloys, generally with larger variations in the microchemistry, the early stages of annealing are of great importance [2,15]. Previous work has mostly focused on the recovery kinetics, in which, for example, sub-boundary mobilities and potential recrystallization nuclei have been studied in Al-Si and Al-Mn alloys [5,10,11,12].
During annealing of deformed aluminium, the subgrain structure will coarsen. Using electron backscattered diffraction (EBSD) and orientation image mapping (OIM), the sizes and misorientations of thousands of subgrains can be measured [16]. The rate of recovery is generally orientation-dependent, e.g., the fast recovery of Cube-oriented regions is well known. EBSD is a useful method for extensive studies of the orientation dependence of subgrain growth. Nevertheless, studies have so far been limited, especially in polycrystalline materials. Hence, it is of interest to investigate the early stages of subgrain growth with respect to orientation in detail.
In the present work, a comprehensive study of the subgrain growth behaviour in high-purity aluminium (99.99 wt%), a binary Al-0.25Mn alloy and commercial purity aluminium is presented. These aspects have been extensively investigated experimentally, with an emphasis on characterizing orientation-dependent subgrain growth. Using a novel characterization method, subgrain growth during annealing at various temperatures was followed in reconstructed subgrain maps captured by EBSD [17]. The present work is partly motivated by the increased use of recycled-based industrial alloys whose microchemistry pose challenges for current softening models that are based on simplified subgrain growth mechanisms. High purity aluminium, a high purity binary single-phase alloy and commercial purity aluminium where chosen for the experiments to possibly detect differences in the subgrain growth mechanisms. As a reference, and to avoid possible effects from solute and as a reference for solute containing alloys, high purity aluminium was chosen as the main alloy for the orientation-dependent investigations. Taking advantage of the coarse-grained nature of the undeformed state of this material, large regions of typical deformation textures were available for EBSD characterization. Through extensive post-processing of the EBSD data, size and average boundary misorientation of subgrains within specific texture components like Cu, S, Brass, Goss and Cube could be followed during annealing at elevated temperatures.
The outline of the paper is as follows. In the experimental part, the alloys studied and how they are processed are presented, together with a short description of the methodology for reconstruction of sub-grain maps from EBSD scans without using dedicated software [17]. The results of the detailed studies of orientation-dependent and orientation-independent sub-grain growth in the different alloys are then presented, followed by careful analyses and discussions of the different results. Some of the results presented here have previously been presented in a conference paper [18].
Recovery, possibly followed by recrystallization, are common phenomena during thermo-mechanical processing of aluminium alloys (e.g., extrusion and rolling) and thus, are important for the final grain structure and texture. However, although these phenomena have been extensively studied for decades, they are not fully understood, and robust and reliable models which can be used to predict and control the final grain structure, texture and related properties are mainly missing. It is hoped that the present work can contribute to a better understanding of the underlying mechanisms controlling softening phenomena and sub-grain growth, in particular in aluminium alloys, and thus serve as a basis for the development of more sophisticated recovery and softening models.
2. Materials and Methods
Three different Al-based materials have been investigated, i.e., high purity aluminium (HP Al), a high-purity Al-Mn alloy (Al-0.25Mn alloy) and commercial purity aluminium (CP Al). The composition of the materials, as obtained by Spark Optical Emission Spectroscopy (ARL 4460, Thermo Fischer Scientific, Waltham, MA, USA), are given in Table 1, and how they were processed is described in the following.
As for the high purity variants, two different Al-based materials were used (cf. Table 1). One was 99.99% aluminium (HP Al) and the other one was a binary alloy containing 0.25 wt% Mn (Al-0.25Mn). For the latter, a pre-alloy was made by mixing 99.99% pure Al and 99.9% pure Mn in the ratio 10:1. The pre-alloy was then melted in vacuum at a temperature of 1309 °C in a 99.7% pure Al2O3 sintered pot. The actual alloy was mixed in a melting pot made from graphite clay coated with Al2O3, burned at 1200 °C, and finally coated with boron-nitride.
The two high purity variants were cast by directional solidification and machined into rolling slab ingots measuring 70 × 75 × 200 mm. The ingots were homogenized at 635 °C for 16 h and subsequently quenched in water. Next, the ingots were cold rolled in several passes with lubricated rolls to a total reduction of 95%, resulting in a thickness of 1 mm and a strain ε = 3.0. Due to the directional solidification process, the materials were found to be very coarse-grained even after deformation. This is an advantage with respect to characterizing the relationship between orientation and subgrain growth kinetics but also makes the materials less suitable for direct comparison with industrially processed alloys.
Commercial purity aluminium (CP Al) was obtained from Hydro Aluminium Sunndal and contained nominally 0.15 wt% Fe and 0.05 wt% Si, with the exact composition also given in Table 1. From the billets measuring 220 mm in diameter, rolling ingots were machined with dimensions L = 200 mm, W = 80 mm and H = 30 mm, which first had to be homogenized. Homogenization is necessary in order to decrease the level of micro-segregations and spherodize the constituent, iron-rich particles. The CP Al material was soaked at 540 °C for 24 h before being log-cooled to 450 °C and held there for 36 h before final quenching.
For all materials, samples were then cut from the sheets and annealed for different times up to 106 s in oil baths at different temperatures in the range from 180 °C to 375 °C. The softening behaviour was monitored by Vickers hardness measurements in the TD-RD plane (TD: transverse direction; RD: rolling direction), while EBSD measurements were performed in the ND-RD plane (ND: normal direction). Sample preparation included mechanical grinding and polishing with final electrolytic polishing done with a 20% HClO4 ethanol solution, either for 15 s at −30 °C and 20 V or for 8 s at room temperature (RT) and 30 V. At T = 180 °C, EBSD investigations were performed in a Zeiss Ultra 55 Field Emission SEM (Carl Zeiss Microscopy GmbH, Oberkochen, Germany). For all other temperatures, a Hitachi SU6600 Variable Pressure Schottky Field Emission SEM (Hitachi, Tokyo, Japan) equipped with a NORDIF UF-1000 EBSD (Trondheim, Norway) detector and NORDIF 1.4.0 software (Trondheim, Norway) was used. Indexing was done with EDAX TSL Orientation Imaging Microscopy (OIM) Data Collection 5 (EDAX Inc., Draper UT, USA), while post-processing was done with EDAX TSL OIM Analysis 6.1 software (EDAX Inc., Draper, UT, USA).
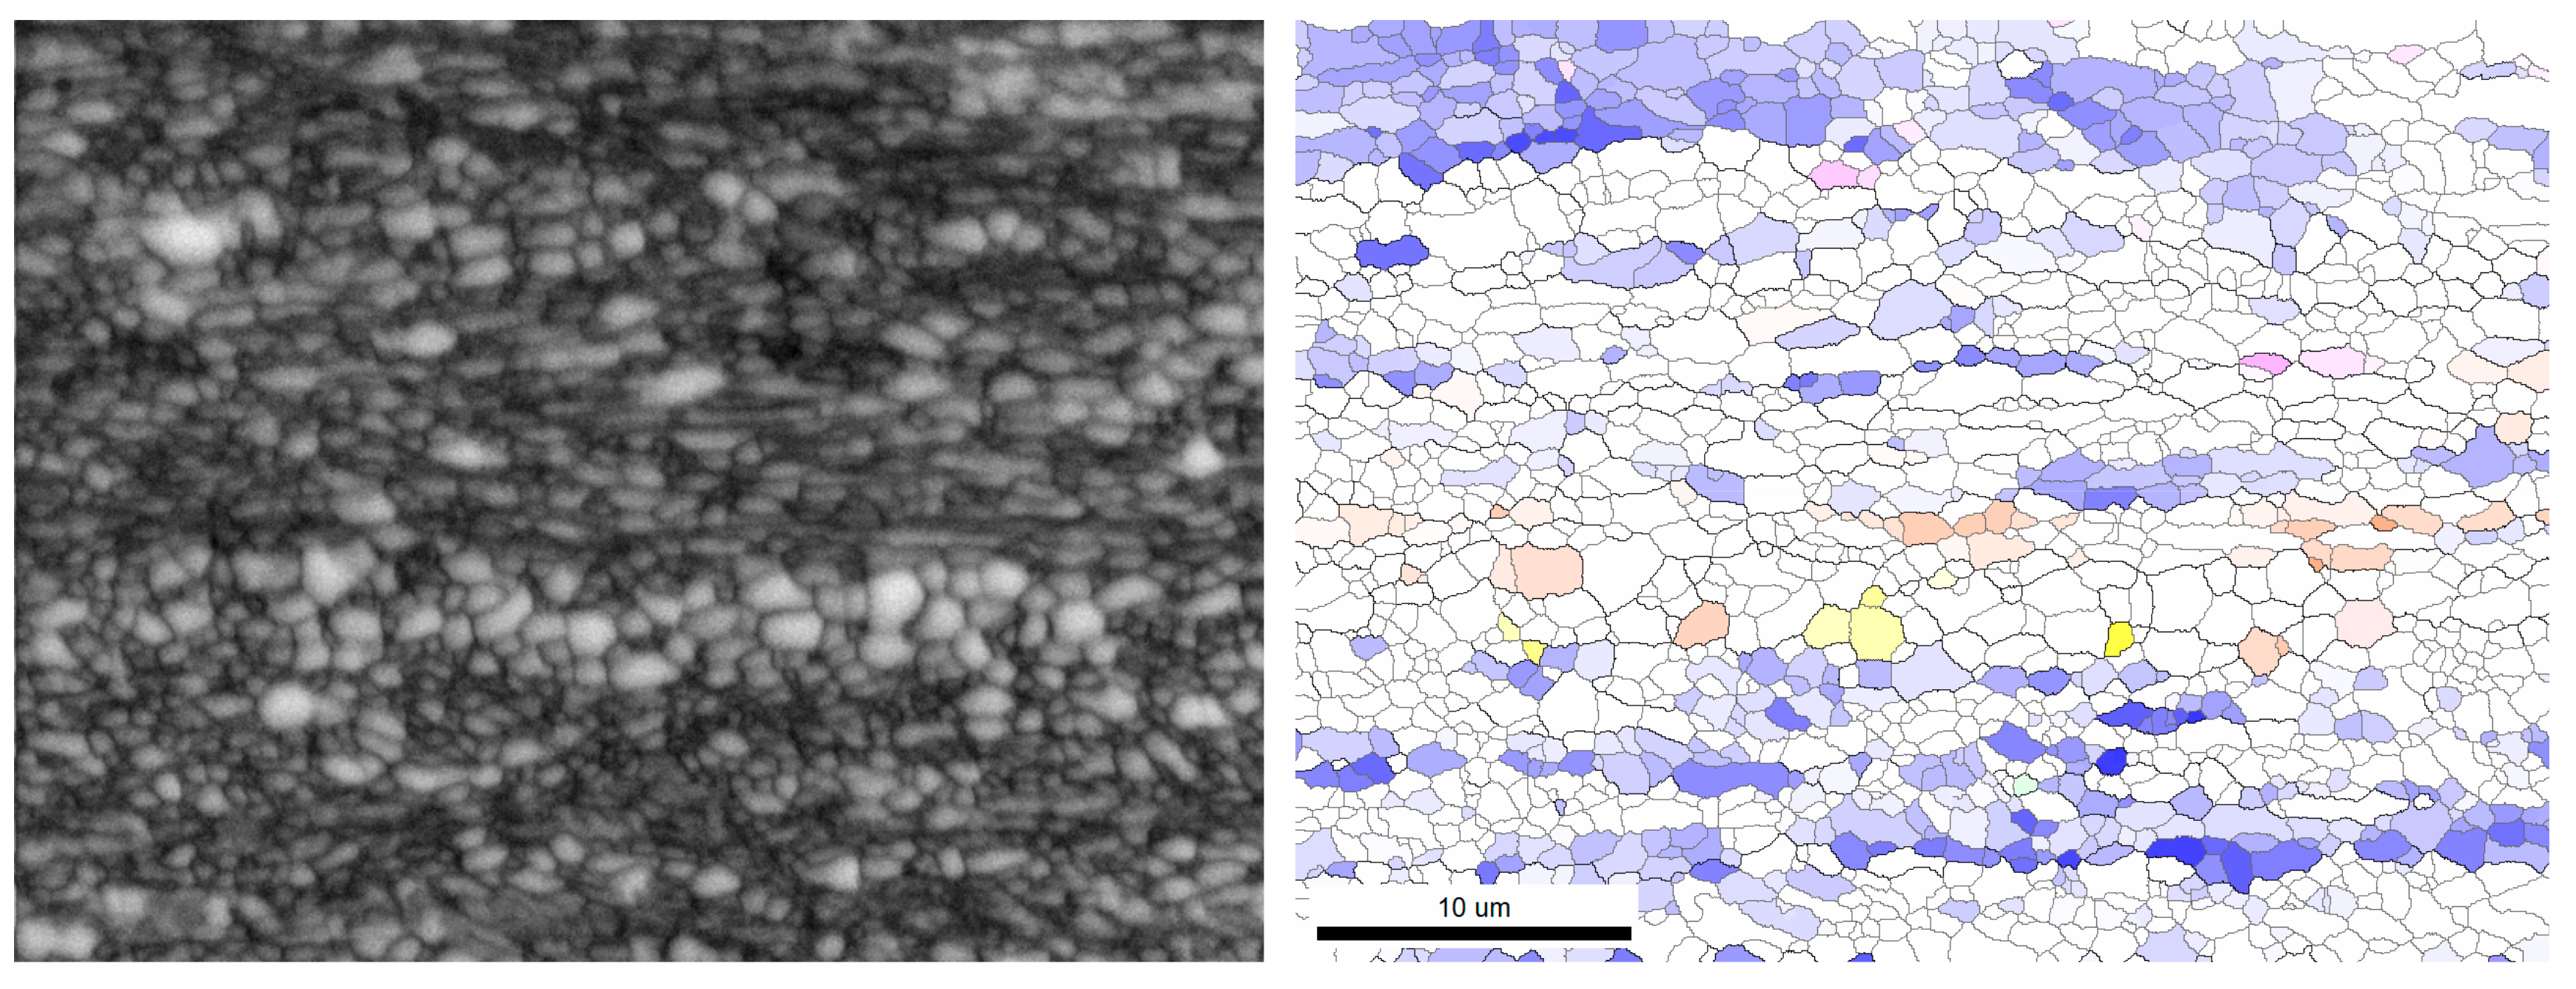
Subgrains less than 0.1 µm with misorientations of 0.7° can be accurately studied with SEM/EBSD, but a challenge is to find a method to close commonly present incomplete subgrain boundaries [5,19]. In the present work, a novel sub-grain reconstruction methodology is used, previously introduced by Bunkholt et al. [17], and explained therein. The method is exemplified in Figure 1 for the HP Al material and shows that accurate subgrain size and average sub-boundary misorientation measurements are possible. For a more detailed description of the sub-structure reconstruction methodology, it is referred to in Reference [17].
The reconstructed as-deformed sub-grain structure for the CP Al material together with the colour coding used throughout this paper for the orientation micrographs are presented in Figure 2. Reflecting an initial grain-size of 134 μm, the as-deformed microstructure in this case consists of a few bands with near ideal orientations, some transition bands, and is quite heterogeneous. There are several bands that are only a few sub-grains wide, and in fact there is a Cu band which is only one sub-grain in width.
Extensive EBSD characterization clearly demonstrated that both the macrostructure as well as the microstructure were very heterogeneous, resulting in different microstructural characteristics even within the same texture component and sample. However, based on more than 60 scans as a function of time and temperature, it was possible to describe the subgrain growth behaviour with respect to size and average boundary misorientation in Cu {112}<111>, S {123}<634>, Brass {011}<211>, Goss {110}<001> and Cube {100}<001> orientated subgrains.
3. Results
The softening behaviour at different temperatures was captured by hardness measurements, and the softening curves for the three alloys are presented in Figure 3. In the Al4N (HP Al) material (Figure 3a), recovery and recrystallization took place simultaneously at 220 °C and above. Below this temperature, extended recovery was observed and accompanied by an increase in hardness after short annealing times. The recrystallization behaviour was very heterogeneous, as exemplified by the two data sets obtained at 220 °C predicting both extended recovery (open triangles) and recovery followed by recrystallization (closed triangles). Similarly, at 240 °C there are two curves which seemingly depict fast recrystallization but on closer inspection, the hardness value at 1000 s is more appropriate for an extended recovery process. The reason for this behaviour lies partially with the coarse columnar grain structure after casting, resulting in few high-angle grain boundaries (HAGB) that may act as nucleation cites for recrystallization. However, once nucleation actually commences, growth is expected to be very rapid because the low solute content should only have a weak drag-effect on the boundaries, and a microstructure very heterogeneous in nature results [18]. Due to this somewhat unusual recrystallization behaviour, it was possible to study recovery in bands of certain textures even at 240 °C. The HP Al material did not contain any precipitates after annealing.
The softening behaviour of the Al-0.25Mn material (Figure 3b) is more consistent than that of the HP Al material. Above 250 °C, recovery is succeeded by more homogenous recrystallization. Still, at 265 °C and 275 °C, the measurements are not entirely consistent, and a higher hardness is sometimes found at the higher temperature after similar annealing times. This is, however, most likely attributed to the coarseness and orientation of the banded structure after deformation which gives rise to a heterogeneous microstructure. Recovery is the only softening reaction observed at 250 °C, although annealing was not done beyond 104 s, and the curve reveals that some initial hardening on annealing is also taking place in this alloy. Mn stays in solution during annealing at all temperatures.
The softening behaviour of CP Al at different temperatures after cold rolling to strains of ε = 2.6 are shown in Figure 3c. Black curves refer to samples homogenized at 600 °C in a previous work [20], while red curves are from samples homogenized at 540 °C. The absolute hardness values are shifted to lower values by roughly 2−4 HV. However, the softening kinetics at 250 °C do not seem to be influenced significantly by the homogenization temperature.
Figure 4 illustrates the evolution of subgrain sizes and average boundary misorientations for HP Al during annealing at 200 °C and 220 °C, respectively. The as-deformed microstructures of both Cu and S were challenging to characterize using the boundary reconstruction and only three scans were found, all resulting in subgrain sizes that were unusually large, and lager than after annealing. Hence, through back extrapolation, the average subgrain sizes of S and Cu were estimated to be ~0.8 µm in both orientations., while the initial subgrain sizes of Brass and Cube were found to be 1.10 µm and 0.95 µm, respectively. Goss was not observed in the as-deformed sample. The average boundary misorientation values obtained for Cu and S from the as-deformed sample seemed representative and are therefore used, being 4.1° and 3.5°, respectively. While Brass was found to have the lowest misorientation at 3.2°, Cube was found to have the largest misorientation of 6.5°.
Subgrain growth was found to be fastest in Cube-oriented regions at all temperatures, while growth was also rapid in Goss. Regions of Cube and Goss orientations were limited to narrow bands and were more sporadic than the more common deformation textures Cu, S and Brass. Comparing all the orientations, the growth rates were quite similar in the initial stages of recovery, although marginally weaker in Cu, S and Brass (the rapid growth of Brass at 200 °C in Figure 4 was not seen at any other temperature). However, at later stages, a transition from continuous growth to a discontinuous growth process was observed, where both some Cube and Goss grains grew significantly faster than others, and the transition took place earlier in Cube than in Goss. The average boundary misorientation in Cube grains was found to vary from 6.5° to a maximum of 8.5° after annealing for 1 × 10⁶ s at 180 °C. An increase of the misorientations during annealing was generally observed, however, the increase seemed independent of temperature. Goss exhibited a similar behaviour, but the average boundary misorientation varied between 4.0° and 5.6°.
Growth rate of subgrains with the Brass orientation was intermediate between that of Cube/Goss and S/Cu and only slightly faster than Cu and S. The weakest subgrain growth was found in the S and Cu orientations with no pronounced difference between the two. Although an increase in misorientation after short annealing times was usually observed in Cu, after longer times, the misorientation was similar to the initial one or slightly lower. In S, there was a small but continuous increase, and the average boundary misorientation after long annealing times was typically larger by 1.5°.
Reconstructed subgrain maps clearly reveal contrasting evolution of the subgrain structures with C/S/Brass and Cube/Goss orientations upon annealing. In Cu/S/Brass, represented by S in Figure 5, subgrains grow continuously and have uniform size even after long annealing times. However, for Cube/Goss, illustrated by a near-Cube region in Figure 5, what appears to be a bimodal size distribution (Figure 5c) develops. After an incubation period, the subgrain structure rapidly evolves by growth of a large selection of subgrains. This discontinuous growth results in a more heterogeneous microstructure (Figure 5d).
The analyses so far show only a weak correlation between subgrain size and average boundary misorientation. In all texture components, the minimum misorientation increases with increasing subgrain size, while the minimum subgrain size increases marginally with increasing misorientations. The majority of subgrains with S and Brass orientations have misorientations less than 8° but the largest subgrains do not necessarily have the largest misorientations. In fact, most subgrains larger than 1 µm are those with misorientations between 2° and 5°. Cube-oriented subgrains, on the other hand, do show a correlation between size and misorientation. Although the subgrains are not larger than in S or Brass, subgrains in Cube-oriented regions that are larger than 2 µm all have misorientations in the range 10–45°.
The subgrain growth behaviour in the Al-0.25Mn alloy, presented in Figure 6, is very much similar to HP Al. Just a few texture components were observed, and annealing was only done at 275 °C. The subgrain sizes after deformation were similar in S and Brass, with 1.16 μm and 1.13 μm, respectively. In contrast to what was previously found in HP Al, the size of subgrains with Cube orientation was found to be the smallest at only 0.82 μm. The average boundary misorientations in the as-deformed state of Cube- and S-oriented subgrains were 6.25° and 4.16° respectively, and almost identical to those in the HP Al material. The measurement of Brass is probably not representative (outlier).
In terms of subgrain growth, the same observations are made in Al-0.25Mn as in HP Al. Growth is significantly faster for near-Cube-oriented subgrains and discontinuous growth is already indicated after 1000 s. Hence, growth of Cube subgrains evolves similarly in HP Al and Al-0.25Mn, as does growth of subgrains with Brass orientation. For subgrains with S orientation on the other hand, growth results in a decrease of the average boundary misorientations of ~0.5°/μm. The evolution of the misorientations for Brass-oriented subgrains is similar to that observed in HP Al at the lowest temperatures. As already mentioned, subgrains with S-orientation somehow become less misoriented with annealing, which is opposite of what occurred in HP Al.
A similar analysis has also been made for commercial purity aluminium (CP Al). Due to a much finer grain size after casting in the commercial purity CP Al material, it was more challenging to find adequate areas for orientation-dependent subgrain characterization, and the results are thus more limited.
The results from both orientation-dependent and orientation-independent investigations are presented in Figure 7. As seen in Figure 7, after deformation, subgrains with S orientation measuring 1.07 μm were found to have the smallest size, closely followed by Cu- and Cube-oriented subgrains. Brass subgrains were significantly larger at 1.41 μm. However, within the first 10 s of annealing, the grain sizes varied a lot more than can be attributed to actual growth. This clearly shows the heterogeneity of the microstructure after deformation. Still, there is a growth trend for all orientations except Cube, which always have subgrains around 1.25 μm. A distinction cannot be made of the growth rates observed in Cu, S and Brass, it is equally slow for subgrains with all three orientations. In Figure 7b the misorientations are also seen to scatter, probably as a result of the heterogeneous microstructure. Brass-oriented subgrains have the lowest initial misorientation of 4°, while subgrains with Cu and S orientations are nearly identical at around 4.5°. The misorientations increase similarly for Cu- and S-oriented subgrains and the increase is weaker than for subgrains with Brass orientation. The misorientations of Cube-oriented subgrains are 2° larger than for Cu- and S-oriented subgrains after deformation, though it cannot be concluded whether the misorientations are increasing or decreasing with annealing. OIMs (not shown) do indicate larger misorientations in this commercial purity aluminium (CP Al) as compared to the high purity alloys due to less ideal orientations for the various microstructures.
Looking at the orientation-independent data (averaged over several reconstructed subgrain maps) presented in Figure 7c,d, the results appear to scatter less with annealing time, but the error bars clearly show that microstructural variations are not avoided by scanning over several orientations. The average subgrain growth rate is stronger than any of the growth rates observed for individual orientations and the subgrain size increases from 0.93 μm to 1.52 μm. Average boundary misorientations are decreasing marginally from 5.5° to 5°.
4. Discussion
In the discussion we will start with a few comments about the subgrain growth kinetics and their possible dependency on alloy composition and microchemistry, and then move to the orientation-independent and orientation sub-grain growth results, which is the main focus of this paper. Although the recovery kinetics are alloy-dependent (Figure 3), the subgrain growth mechanisms seem to be independent of the alloy system. It is noted that this is an observation for the special alloys considered in this work (i.e., two high purity materials (HP Al and an Al-Mn alloy) and commercial purity aluminium (CP Al)). It is not obvious why this is the case and of course it cannot be concluded that this will be the case for aluminium alloys in general, typically with more alloying elements. The microchemistry, whether in terms of solute drag and/or precipitates, will also in general affect the subgrain growth kinetics (i.e., boundary mobility) and thus the recovery kinetics. However, this has not been a focus of this work, and the results from the alloys considered here do not give a basis to draw any clear conclusions about this issue and is therefore not discussed any further here.
4.1. Orientation-Independent Sub-Grain Growth
Subgrain growth is found to be more rapid when studied in orientation-independent scans than in orientation-dependent scans, although the overall growth is still relatively weak. As already mentioned, the average subgrain size after deformation was smaller in the orientation-independent scans, probably because of a much finer grain size before deformation. After short annealing times, neighbouring subgrains to HAGBs separating differently oriented bands are larger than subgrains in the centre of bands due to a higher stored energy close to HAGBs [21]. Strong orientation gradients at the HAGBs yield favourable conditions for recovery, particularly at HAGBs separating bands with orientations close to the rolling texture components and bands with other orientations [22,23]. This, in addition to giving rise to highly mobile HAGBs, leads to the formation of recrystallization nuclei by strain-induced boundary migration (SIBM) [24]. Thus, the presence of HAGBs and high stored energy regions is probably why more recovery by subgrain growth is observed in the orientation-independent annealing experiment (Figure 7c) compared to any of the orientation-dependent cases (Figure 7a).
Figure 8 gives a graphical presentation of the subgrain size distribution evolution in the HP Al material. After 105 s of annealing at 250 °C (grey curve), the peak at low values and tail toward larger sizes observed after deformation (red curve) is mirrored about a vertical axis to give a peak for large values and a tail toward the lower sizes. This change come about through a slightly bimodal transition period at intermediate annealing times. The bimodal distribution indicates that a considerable amount of subgrains experience favourable growth conditions and is not similar with discontinuous subgrain growth. The growth process is clearly not homogenous and continuous and there seems to be a size advantage for large subgrains. However, the large fraction of fast growing subgrains cannot be accounted for by only extraordinarily large subgrains, and Gundlach et al. [25] has shown by 3-dimensional X-ray Diffraction (3DXRD) that size alone is not implicit with faster growth. Huang and Humphreys [12] observed a situation where general, slow, and continuous growth in combination with rapid growth of a few remarkably large subgrains was occurring and led to a bimodal size distribution. The large subgrains were found to be more misoriented than their neighbours, suggesting a misorientation advantage for growth. The mobility is a function of the misorientations and it is well known that larger mobilities are observed with increasing misorientation [12].
However, when looking at a plot of average boundary misorientation versus subgrain size, as in Figure 9, a misorientation advantage is only observed to a limited extent. The graph also includes “subgrains” with misorientations larger than 15° because a subgrain with a high-angle boundary on one side is here still considered a subgrain, although the average misorientation is significantly larger. A large fraction of the “subgrains” are actually proper grains with only high-angle boundaries, and the term crystallite is used when referring to both subgrains and grains as one. Growth is uniformly distributed along the misorientation axis and it is obvious that a large average boundary misorientation is not a requirement for subgrain growth. Only for the smallest misorientations is growth negligible, and above ~3.5° growth seems to be frequent and fast, irrespective of misorientation.
The orientation-independent measurements of subgrains reveal a relatively large average boundary misorientation after deformation. Upon annealing and subgrain growth, the misorientations were seemingly decreasing (Figure 10a), which is atypical for subgrain growth in the presence of orientation gradients, as found here. The size distributions revealed that growth was heterogeneous and orientation gradients, usually strongest near HAGBs, give higher growth rates. Subgrains that have boundaries with average or large misorientations (>3.5°) are coarsening faster than less misoriented subgrains and it is likely that the misorientations are actually increasing. The average misorientation still gives the impression that the misorientations are decreasing, which is interpreted as a result of less growth of subgrains with the smallest misorientations that are typically found in the centre of orientation bands where there are weak orientation gradients and also low boundary misorientations.
The decreasing average boundary misorientations found for subgrain growth in orientation-independent microstructures were illustrated in Figure 7d. Although the decrease was rather weak with relatively large scatter, a clear trend is shown by Figure 10a when the misorientations are plotted against the average subgrain size. In terms of available literature, most misorientation evolution data is orientation-dependent and will be discussed next. However, at nearly the same strain and annealing temperature, Furu et al. [26] observed an increase from 3° to 7°, while Sæter [13] found an increase from 3.3° to 4.5°. In this work, a weak decrease from 5.5° to 5° is observed. Apparently, the above discussed decreasing misorientations contradicts the literature and theory by Humphreys and Hatherly [4]. The CP Al material is highly polycrystalline with an average grain size of 134.1 µm before deformation and obviously there are both short- and long-range orientation gradients present after deformation and annealing, as illustrated by Figure 10b. According to Humphreys and Hatherly [4], the misorientations should increase during annealing and subgrain growth of a sample with orientation gradients, i.e., as reported by Furu et al. [26] and Sæter [13]. Only when there are no orientation gradients can the misorientation decrease, which have been shown both by vertex model computer simulations and experimentally in single crystals of Goss orientation [4,12].
However, what is perceived as a decrease of the mean misorientation of the sub-boundaries can be an effect of coarsening of boundaries with misorientation larger than 3.5° (Figure 9) reducing the number, and total length, of these boundaries, as compared to less misoriented boundaries. As shown in Figure 7, during annealing small and more misoriented subgrains tend to grow faster than those with larger misorientations. From Figure 8, it is particularly the total length of boundaries with misorientation larger than 6° which decreases.
4.2. Orientation-Dependent Sub-Grain Growth
For all texture components considered in the work, continuous subgrain growth was observed, and with quite similar growth rates in the initial stages of annealing. Still, Cube and Goss, mainly present in narrow bands, exhibited a more rapid subgrain growth than subgrains in the wider bands with Cu, S and Brass orientation. In general, Cube and Goss are less stable during deformation and commonly surrounded by large orientation gradients which will enhance their growth rate [4,5,23,27]. The fastest growth takes place in the presence of an orientation gradient and is generally accompanied by increasing average subgrain misorientations. In contrast, growth is weaker and misorientations decrease in the absence of any orientation gradients [4]. In the present work, during annealing, the misorientations were observed to increase in Cube, Goss and Brass (240 °C) and a transition from continuous growth to faster, discontinuous growth took place. For Cu-, S- and Brass-orientated subgrains, mainly present in wide bands, growth was weaker and took place only by continuous growth, usually with no change or a weak decrease of the average boundary misorientation. S-oriented grains were an exception, where at all temperatures, a weak but consistent increase (1.5°) was observed. To our knowledge, such an increase has not previously been documented in polycrystalline materials [5,23,27]. However, weak and continuous growth is consistent with growth in the absence of an orientation gradient.
4.3. The Local Orientation Gradient
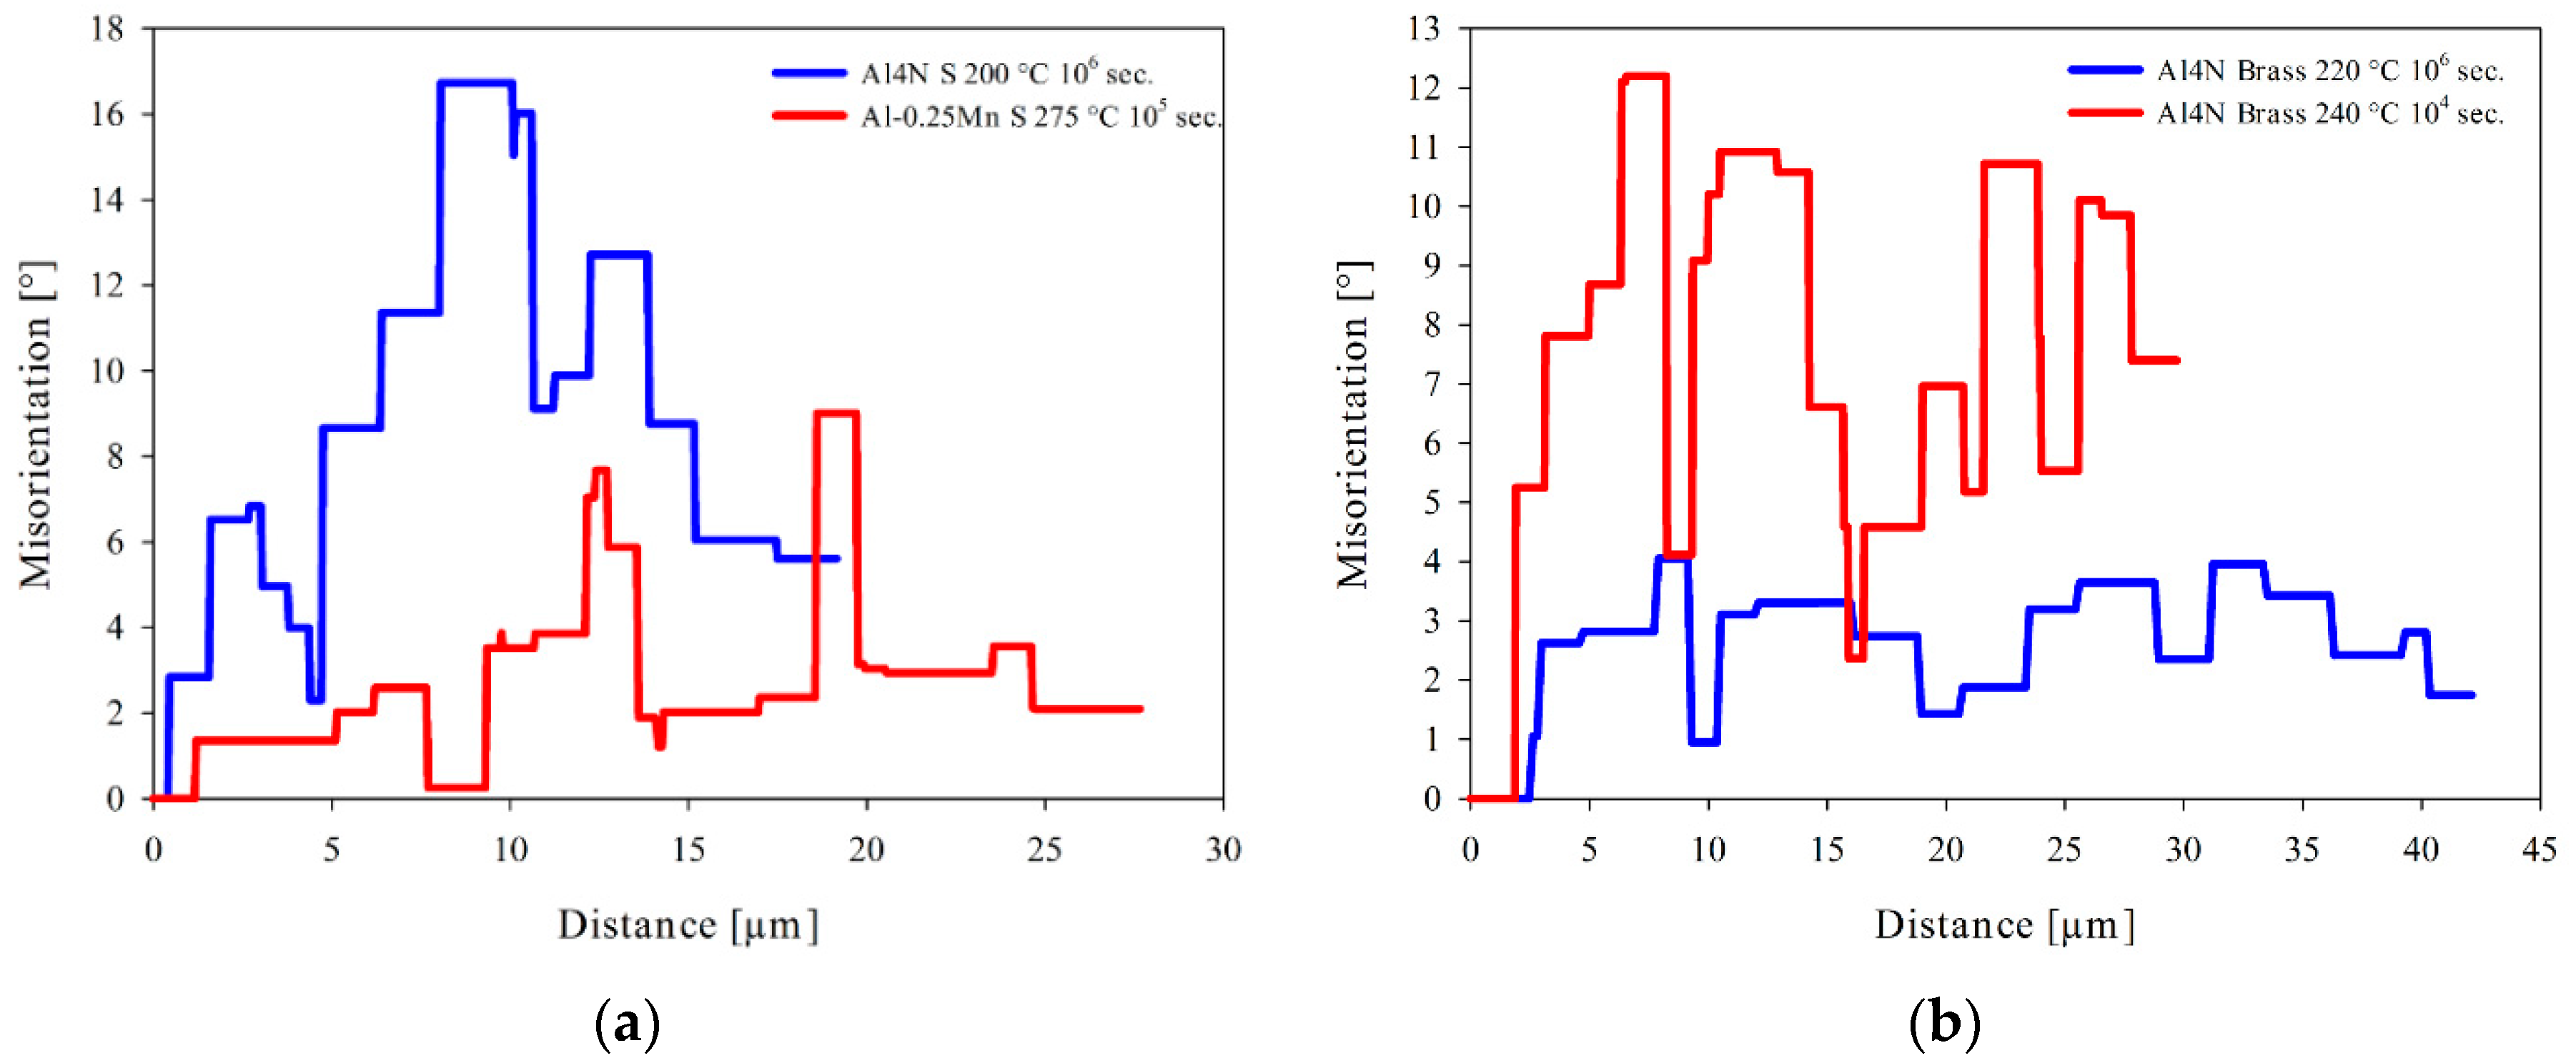
Decreasing misorientations and a bimodal size distribution for subgrains with Brass and S orientations is associated with very low orientation gradients. According to Humphreys and Hatherly [4], what decides the misorientation evolution is the presence of local orientation gradients. Though, in similar Goss-oriented single crystals having allegedly no orientation gradients, Humphreys and co-workers have made contradicting findings. Decreasing misorientations were seen by Huang and Humphreys [12] from 3.7° to 2.9°. However, in an earlier paper on the same single crystal material, at only a slightly larger strain (75% versus 70% plane strain compression in a channel die), Ferry and Humphreys [28] actually found increasing misorientations from 2.3° after deformation to 3.5° after annealing for 235 h at 300 °C. It is clearly stated in Huang and Humphreys [12] how the two materials displayed similar annealing responses since neither had any orientation gradients, though the contrasting behaviour of the mean boundary misorientations is not mentioned. Still, by plotting some randomly selected orientation profiles from S and Brass, as in Figure 11, the theory of Humphreys and Hatherly [4] seems to hold. Where increasing misorientations are found (S in HP Al and Brass at 240 °C in HP Al), the gradients are larger than when the misorientations are decreasing (S in Al-0.25Mn and Brass at 220 °C in HP Al). A rough estimate from Figure 11 of the critical orientation gradient indicates a value of ~0.5°/µm.
No distinct alloy dependency of subgrain growth was revealed. Recovery by subgrain growth is, however, highly orientation-dependent. There is a positive correlation between the stored energy and recovery kinetics and orientation gradients, respectively. However, an even stronger correlation is found between the orientation gradients and the recovery kinetics. For those orientations where there are large orientation gradients after deformation, subgrain growth is also fast. This is the case for Cube- and Goss-oriented structures, where high-angle boundaries are more mobile and the subgrains become more misoriented upon growth. For subgrains with Cu, S and Brass orientations, the coarsening kinetics are nearly independent of the size of orientation gradients and so are the fraction of HAGBs. Instead, there is a change in the growth mechanism when the orientation gradients are about 0.5°/µm, as discussed in the previous section. Above this, critical value growth is homogenous and the misorientations are increasing during annealing. Below this value, subgrain growth results in a temporal period where the size distribution is bimodal, possibly due to a size advantage and the misorientations are decreasing.
Subgrains with Cube orientations, and to some extent Goss orientation, exhibits quite unique growth behaviour. Cube-oriented subgrains were always found to be rather disoriented and equiaxed after deformation and a large fraction of the boundaries would normally be of high-angle character, resulting in large average boundary misorientations and orientation gradients, as Figure 12 illustrates for HP Al. Interestingly, the rate of subgrain growth follows the degree of orientation gradients found in the differently oriented bands. Although not very apparent in the early stages, growth of Cube- and Goss-oriented subgrains is faster than for subgrains with deformation texture orientations. A transition to rapid growth was only observed for Cube- and Goss-oriented subgrains and occurred earlier in Cube than Goss. Looking at Figure 12, the order in which the orientation gradients are decreasing is from Cu to S to Brass but does not match the growth rates perfectly. The growth rate of subgrains with Brass orientation is slightly faster than for subgrain with Cu and S orientation when the misorientations are decreasing, despite weaker orientation gradients. Goss show distinctly larger orientation gradients while in Cube, the largest orientation gradients are found, in good agreement with the particularly rapid growth kinetics and the onset of this. After annealing, the orientation gradients are seen to increase in Goss, Cu and S, while in Brass they remain on a somewhat similar level—as the evolution of the boundary misorientations also indicate. Thus, with the exception of Brass, the orientation gradients and the growth kinetics are strongly correlated, as well as the evolution of the misorientations with annealing.
Coarsening of Cube-oriented subgrains occurs in two steps. Growth is initially slow but becomes much faster after an incubation time in which a bimodal size distribution develops. This could be the result of a size advantage, i.e., that fast recovery leads to some large Cube-subgrains with an overcritical size, which grow faster than smaller ones. However, Figure 13 also shows a correlation between misorientation and growth in Cube regions. There are some similarities with discontinuous subgrain growth, as described by Huang and Humphreys [12], although the requirement for a lack of orientation gradients is hardly fulfilled. However, in a similar way to discontinuous growth, it appears as if initially, more misoriented crystallites only need minor alterations during the incubation time to become disoriented by more than 15° and thereby grow faster than less misoriented subgrains. Hence, there is an obvious misorientation advantage related to growth, just as Huang and Humphreys [12] found for growth in an orientation gradient with increasing misorientations in similar material. From the as-deformed state (black dots), the largest subgrains are also highly misoriented and Cube subgrain growth is thus a result of selective growth caused by a combination of large size and large misorientation. Looking more closely at Figure 13, the true subgrains, i.e., those subgrains with misorientation smaller than 15°, are more misoriented in the “large subgrain size” case (Figure 13a), an indication of larger orientation gradients, and these subgrains have also grown more than the true subgrains in the “small subgrain size” case (Figure 13b).
Turning attention to the deformation texture components Cu, S and Brass, growth is generally weak and less than a factor 2. The first case discussed here is the most frequently observed, i.e., growth in a large orientation gradient accompanied by increasing misorientations. As shown in Figure 14, the majority of subgrains with deformation texture orientations are less than 2 μm in diameter with misorientations smaller than 8°. Compared to the as-deformed state (black dots), the most obvious effect of annealing is a shift to larger subgrain sizes for subgrains with misorientations between 2–10°. As opposed to the orientation-independent growth and growth of Cube-oriented subgrains, HAGBs do not enhance growth significantly for subgrains with Cu or S (or Brass) orientations. Growth is very homogenous and there is no sign of a bimodal size distribution for Cu or S (for Brass-oriented subgrains, when the misorientations were decreasing with growth, growth was very much bimodal during a transition period, which will be discussed later). The largest subgrains after annealing are those close to the mean average boundary misorientation but neither a size nor a misorientation advantage is apparent.
That HAGBs have little impact on the growth kinetics is obvious in Figure 15. Two different regions with completely different fraction HAGBs, one has five times as many as the other, are compared with respect to both size and misorientation distribution after annealing. Both show near identical distributions after 105 s annealing at 250 °C, something which was also observed for Brass after annealing, irrespective of increasing or decreasing misorientations. The subgrain size is only 16% larger in the high fraction HAGB case. Despite the large difference in HAGB fraction, Figure 16 shows that there is clearly no misorientation advantage during growth and, interestingly, the misorientation gradients in the two cases are similar. Because subgrain growth is complex, the orientation gradients alone will not suffice to explain why similar growth kinetics are observed irrespective of the HAGB fraction, but it is yet another indication that they play a major role for the recovery mechanisms.
5. Conclusions
The present work has been concerned with experimental investigations of orientation-dependent and orientation-independent sub-grain growth in three Al-based materials, i.e., poly-crystalline high purity aluminium (HP Al), commercial purity aluminium (CP Al) and a high purity binary Al-0.25Mn alloy. It clearly shows that the subgrain growth behaviour is complex, diverse and challenging to characterize. Nonetheless, the present work has clearly identified the local orientation gradient as an important factor to understand subgrain growth.
For orientation-dependent subgrain growth, mainly studied in high-purity aluminium (HP Al) and measured in broad lamellar bands of Cu, S, Brass, Goss and Cube orientations, growth was found to occur in three distinct ways depending on the size of the local orientation gradients. For the largest orientation gradients, as found in Cube- and Goss-oriented subgrain structures, which are also the most misoriented, growth is slightly faster than for the other orientations, and changes from initially slow and continuous to rapid and more discontinuous after an incubation period. For subgrain structures with Cu, S and Brass orientations and orientation gradients larger than ~0.5°/μm, growth during annealing is homogenous with a uniform size distribution and increasing average boundary misorientations during annealing. In S- and Brass-oriented subgrain structures, with orientation gradients smaller than ~0.5°/μm, growth results in a temporary bimodal size distribution, possibly due to a size advantage of large subgrains, and decreasing average boundary misorientations. The evolution of the boundary misorientations and the rate of subgrain growth were not correlated.
Orientation-independent subgrain growth, investigated in commercial purity aluminium (CP Al) only, was found to be faster than orientation-dependent, indicating faster kinetics near HAGBs separating differently oriented lamellar bands, consistent with the findings that subgrains misoriented by more than 3.5° have a growth advantage over less misoriented subgrains, typically found in the interior of lamellar bands.
The subgrain growth behaviour in the Al-0.25Mn alloy was found to be much like that in HP Al. Although variations in the microchemistry influence the subgrain growth kinetics, the same growth mechanisms seem to operate in all three materials.
Author Contributions
S.B. performed all the experimental work, including implementation of the sub-grain reconstruction methodology and analysis of the experimental results and also drafted the manuscript. K.M. and E.N. contributed to conceptualization and design of experiments and discussions of the results and writing and editing of the manuscript.
Funding
This research received no external funding.
Conflicts of Interest
The authors declare no conflict of interest.
References
- Saeter, J.A.; Forbord, B.; Vatne, H.E.; Nes, E. Modelling recovery and recrystallization, applied to back-annealing of aluminium sheet alloys. In Proceedings of the 6th International Conference on Aluminum Alloys (ICAA6), Toyohashi, Japan, 5–10 July 1998; pp. 113–126. [Google Scholar]
- Verdier, M.; Brechet, Y.; Guyot, P. Recovery of AlMg alloys: Flow stress and strain-hardening properties. Acta Mater. 1998, 47, 127–134. [Google Scholar] [CrossRef]
- Humphreys, F.J. A unified theory of recovery, recrystallization and grain growth, based on the stability and growth of cellular microstructures 1. The basic model. Acta Mater. 1997, 45, 4231–4240. [Google Scholar] [CrossRef]
- Humphreys, F.J.; Hatherly, M. Recrystallization and Related Annealing Phenomena, 2nd ed.; Elsevier: Amsterdam, The Netherlands, 2004. [Google Scholar]
- Barou, F.; Maurice, C.; Feppon, J.M.; Driver, J. Sub-grain boundary mobilities during recovery of binary Al-Mn alloys. Int. J. Mater. Res. 2009, 100, 516–521. [Google Scholar] [CrossRef]
- Brough, I.; Humphreys, F.J. Evaluation and application of a fast EBSD detector. Mater. Sci. Technol. 2010, 26, 636–639. [Google Scholar] [CrossRef]
- Huang, Y.; Humphreys, F.J. The effect of solutes on grain boundary mobility during recrystallization and grain growth in some single-phase aluminium alloys. Mater. Chem. Phys. 2012, 132, 166–174. [Google Scholar] [CrossRef]
- Hersent, E.; Marthinsen, K.; Nes, E. The Effect of Solute Atoms on Grain Boundary Migration: A Solute Pinning Approach. Metall. Mater. Trans. A-Phys. Metall. Mater. Sci. 2013, 44A, 3364–3375. [Google Scholar] [CrossRef]
- Hersent, E.; Marthinsen, K.; Nes, E. On the Effect of Atoms in Solid Solution on Grain Growth Kinetics. Metall. Mater. Trans. A-Phys. Metall. Mater. Sci. 2014, 45A, 4882–4890. [Google Scholar] [CrossRef]
- Abtahi, S.; Sjolstad, K.; Marthinsen, K.; Nes, E. Modelling Subgrain Growth During Annealing of Deformed Aluminium Alloys. In Recrystallization and Grain Growth, Proceedings of the First Joint International Conference, 27–31 August 2001; Gottstein, G., Molodov, D.A., Eds.; Springer: Berlin, Germany, 2001; pp. 251–256. [Google Scholar]
- Godfrey, A.; Jensen, D.J.; Hansen, N. Recrystallisation of channel die deformed single crystals of typical rolling orientations. Acta Mater. 2001, 49, 2429–2440. [Google Scholar] [CrossRef]
- Huang, Y.; Humphreys, F.J. Subgrain growth and low angle boundary mobility in aluminium crystals of orientation {110}{001}. Acta Mater. 2000, 48, 2017–2030. [Google Scholar] [CrossRef]
- Saeter, J.A. Sub-Structure Evolution and Strengthening in Cold Rolled and Aneealed Aluminium Alloys. Ph.D. Thesis, Norwegian University of Science and Technology, Trondheim, Norway, 1997. [Google Scholar]
- Bunkholt, S.; Nes, E.; Marthinsen, K. The effect of iron and the precipitation behavior of iron during annealing of a cold deformed commercial purity aluminium alloy. Mater. Charact. 2017, 129, 18–23. [Google Scholar] [CrossRef]
- Humphreys, F.J. A unified theory of recovery, recrystallization and grain growth, based on the stability and growth of cellular microstructures 2. The effect of second-phase particles. Acta Mater. 1997, 45, 5031–5039. [Google Scholar] [CrossRef]
- Humphreys, F.J. Characterisation of fine-scale microstructures by electron backscatter diffraction (EBSD). Scr. Mater. 2004, 51, 771–776. [Google Scholar] [CrossRef]
- Bunkholt, S.; Marthinsen, K.; Nes, E. Subgrain Structures Characterized by Electron Backscatter Diffraction (EBSD). In Aluminium Alloys 2014-ICAA14; Marthinsen, K., Holmedal, B., Li, Y., Eds.; Trans Tech Publications: Zürich, Switzerland, 2014; Volume 794–796, pp. 3–8. [Google Scholar]
- Bunkholt, S.; Marthinsen, K.; Nes, E. Orientation dependent subgrain growth during isothermal annealing of high-purity aluminium. In Proceedings of the 13th International Conference on Aluminum Alloys (ICAA13), Pittsburgh, PA, USA, 3–7 June 2012; pp. 1713–1718. [Google Scholar]
- Humphreys, F.J. Reconstruction of grains and subgrains from electron backscatter diffraction maps. J. Microsc. 2004, 213, 247–256. [Google Scholar] [CrossRef] [PubMed]
- Sande, G. Softening Behaviour of Selected Commercially Pure Aluminium Model Alloys. Master’s Thesis, Norwegian University of Science and Technology (NTNU), Trondheim, Norway, 2012. [Google Scholar]
- Liu, W.C.; Zhai, P.P. Characterization of microstructures near grain boundary in hot deformed AA 3104 aluminum alloy. Mater. Charact. 2011, 62, 81–89. [Google Scholar] [CrossRef]
- Engler, O.; Vatne, H.E.; Nes, E. The roles of oriented nucleation and oriented growth on recrystallization textures in commercial purity aluminium. Mater. Sci. Eng. A-Struct. Mater. Prop. Microstruct. Process. 1996, 205, 187–198. [Google Scholar] [CrossRef]
- Xing, Q.; Huang, X.; Hansen, N. Recovery of heavily cold-rolled aluminum: Effect of local texture. Metall. Mater. Trans. A-Phys. Metall. Mater. Sci. 2006, 37A, 1311–1322. [Google Scholar] [CrossRef]
- Humphreys, F.J. Nucleation in recrystallization. In Recrystallization and Grain Growth, Pts 1 and 2; Bacroix, B., Driver, J.H., LeGall, R., Maurice, C., Penelle, R., Regle, H., Tabourot, L., Eds.; Annecy, France, 30 August–3 September, 2004; Trans Tech Publications: Zürich, Switzerland, 2004; Volume 467–470, pp. 107–116. [Google Scholar]
- Gundlach, C.; Pantleon, W.; Lauridsen, E.M.; Margulies, L.; Doherty, R.D.; Poulsen, H.F. Direct observation of subgrain evolution during recovery of cold-rolled aluminium. Scr. Mater. 2004, 50, 477–481. [Google Scholar] [CrossRef]
- Furu, T.; Orsund, R.; Nes, E. Subgrain growth in heavily deformed aluminium-experimental investigation and modeling treatment. Acta Metall. Mater. 1995, 43, 2209–2232. [Google Scholar] [CrossRef]
- Sukhopar, O.; Kuzmina, M.; Gottstein, G. Investigation of the substructure evolution within grains of different orientation during recrystallization in a commercial Al alloy. Adv. Mater. Res. 2012, 409, 71–76. [Google Scholar] [CrossRef]
- Ferry, M.; Humphreys, F.J. Discontinuous subgrain growth in deformed and annealed {110}<001> aluminium single crystals. Acta Mater. 1996, 44, 1293–1308. [Google Scholar] [CrossRef]
Figure 1.
Image quality map (left) and reconstructed orientation map with fully closed high- and low-angle boundaries (right). This particular example is from high purity aluminium (HP Al) annealed for 100 s at 220 °C. The colours refer to specific texture components, according to the colour coding given in Figure 2b.

Figure 2.
(a) Reconstructed subgrain structure for the as-deformed state of the commercial purity aluminium (CP Al) material. (b) Colour coding for the different texture orientations considered in this work.
Figure 2.
(a) Reconstructed subgrain structure for the as-deformed state of the commercial purity aluminium (CP Al) material. (b) Colour coding for the different texture orientations considered in this work.

Figure 3.
Softening curves of HP Al (a), Al-0.25Mn (b) and commercial purity CP Al (c). Notice both extended recovery and recrystallization at 220 °C and 240 °C for HP Al. The as-deformed state is given at t = 1 s.
Figure 3.
Softening curves of HP Al (a), Al-0.25Mn (b) and commercial purity CP Al (c). Notice both extended recovery and recrystallization at 220 °C and 240 °C for HP Al. The as-deformed state is given at t = 1 s.

Figure 4.
The evolution in average subgrain size (a,c) and boundary misorientation (b,d) during annealing of HP Al at 200 °C and at 220 °C, respectively. The as-deformed state is given at t = 1 s. Error bars reflect the scattering between several scans, while no error bar refers to an average value from one EBSD scan (with up to 1000 grains).

Figure 5.
Reconstructed maps of the subgrain structure in HP Al illustrating continuous growth of S-oriented subgrains and the transition from slow to rapid discontinuous growth of near-Cube-oriented subgrains. (a) S, as-deformed, (b) S, 200 °C, 105 s, (c) Cube, 220 °C, 103 s, (d) Cube, 220 °C, 105 s.

Figure 6.
Subgrain growth (a) and evolution of average boundary misorientations (b) during annealing of Al-0.25Mn at 275 °C.
Figure 6.
Subgrain growth (a) and evolution of average boundary misorientations (b) during annealing of Al-0.25Mn at 275 °C.

Figure 7.
Evolution of subgrain size and average boundary misorientation in special orientations and bulk (mixed orientations) during annealing of CP Al at 250 °C after (ε = 2.6). (a) Orientation-dependent subgrain diameter (b) Orientation-dependent average boundary misorientation. (c) Orientation-independent subgrain diameter. (d) Orientation-independent average boundary misorientation.


Figure 8.
Size (a) and average boundary misorientation (b) distributions of subgrains with mixed orientations (orientation-independent) in CP Al.
Figure 8.
Size (a) and average boundary misorientation (b) distributions of subgrains with mixed orientations (orientation-independent) in CP Al.

Figure 9.
Average misorientation of individual subgrains and grains plotted against mean equivalent circle diameter for subgrains in CP Al with several orientations after deformation (black points) and after 105 s annealing at 250 °C (grey points).
Figure 9.
Average misorientation of individual subgrains and grains plotted against mean equivalent circle diameter for subgrains in CP Al with several orientations after deformation (black points) and after 105 s annealing at 250 °C (grey points).

Figure 10.
(a) Average boundary misorientation versus average subgrain size in CP Al when subgrain growth is followed independently of orientation. (b) Misorientation profile for CP Al samples after 105 s of annealing at 250 °C.
Figure 10.
(a) Average boundary misorientation versus average subgrain size in CP Al when subgrain growth is followed independently of orientation. (b) Misorientation profile for CP Al samples after 105 s of annealing at 250 °C.

Figure 11.
Characteristic orientation profiles in subgrain structures with S (a) and Brass (b) orientations resulting in different evolution of subgrain misorientations during coarsening.
Figure 11.
Characteristic orientation profiles in subgrain structures with S (a) and Brass (b) orientations resulting in different evolution of subgrain misorientations during coarsening.

Figure 12.
Misorientation gradients of various texture components from HP Al parallel to the ND-direction in the investigated RD-ND sections in as-deformed and annealed state. (a) As deformed. (b) Annealed at an elevated temperature for more than 24 h. (ND: Normal direction; RD: rolling direction).
Figure 12.
Misorientation gradients of various texture components from HP Al parallel to the ND-direction in the investigated RD-ND sections in as-deformed and annealed state. (a) As deformed. (b) Annealed at an elevated temperature for more than 24 h. (ND: Normal direction; RD: rolling direction).

Figure 13.
Average misorientation of individual grains plotted against mean equivalent circle diameter, d, for Cube (red)-oriented subgrains and grains after 105 s annealing at 220 °C. Black dots refer to as-deformed state. (a) “Large subgrain size” case; d = 5.25 μm. (b) “Small subgrain size” case; d = 2.62 μm.

Figure 14.
Average misorientation of individual grains plotted against mean equivalent circle diameter for Cu- (purple) (a) and S (blue)-oriented subgrains (b) and grains after 106 s annealing at 180 °C and 105 s annealing at 200 °C, respectively. Black dots are superimposed for comparison with the as-deformed state.

Figure 15.
Comparison of size (a) and average boundary misorientation (b) distributions of subgrains with Cu orientation in CP Al after annealing for 105 s at 250 °C. The average subgrain size of the HAGB case is 16% larger and has 5 times as many high-angle grain boundaries.
Figure 15.
Comparison of size (a) and average boundary misorientation (b) distributions of subgrains with Cu orientation in CP Al after annealing for 105 s at 250 °C. The average subgrain size of the HAGB case is 16% larger and has 5 times as many high-angle grain boundaries.

Figure 16.
Size versus misorientation plot (a) and orientation gradients (b) in the ND direction of ND-RD sections from CP Al samples with Cu-oriented subgrains annealed for 105 at 250 °C, where the average subgrain size of the HAGB case is only 16% larger but has 5 times as many high-angle grain boundaries.


Table 1.
Chemical composition of the three alloys used (wt%).
| Alloy | Al | Mn | Si | Fe | Cu | Mg | Zn | V | N |
|---|---|---|---|---|---|---|---|---|---|
| HP (Al4N) | 99.9900 | - | 0.0011 | 0.0005 | 0.0017 | 0.0003 | - | - | <0.00005 |
| Al 0.25Mn | 99.7407 | 0.2493 | 0.0011 | 0.0005 | 0.0017 | 0.0003 | - | - | <0.00005 |
| CP Al | 99.7308 | 0.0025 | 0.0670 | 0.1458 | 0.0008 | 0.0025 | 0.0050 | 0.0105 | - |
© 2019 by the authors. Licensee MDPI, Basel, Switzerland. This article is an open access article distributed under the terms and conditions of the Creative Commons Attribution (CC BY) license (http://creativecommons.org/licenses/by/4.0/).
Share and Cite
MDPI and ACS Style
Bunkholt, S.; Nes, E.; Marthinsen, K. Orientation Independent and Dependent Subgrain Growth during Iso-Thermal Annealing of High-Purity and Commercial Purity Aluminium. Metals 2019, 9, 1032. https://doi.org/10.3390/met9101032
AMA Style
Bunkholt S, Nes E, Marthinsen K. Orientation Independent and Dependent Subgrain Growth during Iso-Thermal Annealing of High-Purity and Commercial Purity Aluminium. Metals. 2019; 9(10):1032. https://doi.org/10.3390/met9101032
Chicago/Turabian StyleBunkholt, Sindre, Erik Nes, and Knut Marthinsen. 2019. "Orientation Independent and Dependent Subgrain Growth during Iso-Thermal Annealing of High-Purity and Commercial Purity Aluminium" Metals 9, no. 10: 1032. https://doi.org/10.3390/met9101032
Note that from the first issue of 2016, this journal uses article numbers instead of page numbers. See further details here.