Generalized Stacking Fault Energies of Aluminum Alloys–Density Functional Theory Calculations


1
Faculty of Mathematics and Natural Sciences, School of Exact Sciences, Cardinal Stefan Wyszynski University in Warsaw, Woycickiego 1/3 building 21, 01-938 Warsaw, Poland
2
Faculty of Materials Science and Engineering, Warsaw University of Technology, Woloska 141, 02-507 Warsaw, Poland
3
Faculty of Mechanical Engineering, Bialystok University of Technology, Wiejska 54C, 15-351 Białystok, Poland
*
Author to whom correspondence should be addressed.
Metals 2018, 8(10), 823; https://doi.org/10.3390/met8100823
Submission received: 19 September 2018
/
Revised: 10 October 2018
/
Accepted: 11 October 2018
/
Published: 12 October 2018
Abstract
:Generalized stacking fault energies of aluminum alloys were calculated using density functional theory. Stacking fault energy of aluminum alloys was correlated with the d-electrons number of transition metal alloying elements. The tendency to twinning is also modified by the presence of the alloying element in the deformation plane. Our results suggest that Al alloys, with such elements as Zr, Nb, Y, Mo, Ta, and Hf, are expected to exhibit a strong work hardening rate due to emission of the partial dislocations.
1. Introduction
High strength and ductile low-density materials are required for lightweight design in the future. The high strength of alloys might be caused by the nanostructure of the materials [1]. Nanocrystalline materials (NCMs) usually exhibit high tensile strength due to grain-size hardening, but this is achieved at the expense of ductility and toughness [2]. Ductility of NCMs can be increased by partial dislocations emission and deformation twins [3]. Karim poor et al. have demonstrated that for the nanocrystalline, Co, ductility increases due to mechanical twinning [4]. Deformation twins are widely observed in low stacking fault energy metals, i.e., Cu and Cu-based alloys [2,5]. High stacking fault energy metals are deformed by full dislocation emission, and ductility is low due to the extremely low rate of accumulation of dislocations in the nanosized grains [6]. This is because, for a grain size below a certain critical value, dislocation accumulation is impossible [7]. Aluminum has high stacking fault energy (SFE). As such, aluminum shows a tendency to cross-slip dislocations and has a relatively small work hardening rate [8].
Tadmor and Bernstein showed that the tendency to partial dislocation emission and twinning in a face-centered cubic (fcc) lattice depended on stacking fault energy (SFE), unstable stacking fault energy (USFE), and unstable twinning energy (UTE), which may be modified by alloying elements. However, experimental measurement of USFE and UTE is impossible [9]. Practical realization of this idea requires atomic-scale calculations of the generalized stacking fault energies (GSFE) for the specified alloy. Such estimates can be currently obtained using computational methods [10,11].
GSFE calculations have been performed for Ni-, Al-, Cu-, Mg-based alloys and elements, where improved partial dislocation emission, and deformations by twins have been found [10,12,13,14]. Experimental research has confirmed the predictions made by GSFE calculations [15,16,17].
GSFEs for the principal components of aluminum alloys series 1xxx (Si), 2xxx (Cu, Mg), 4xxx (Si), 5xxx (Mg), 6xxx (Mg, Si), and 7xxx (Mg, Cu, Zn) have been reported [12,18,19]. SFEs of Al alloys with Sr, Sc, Y, Ge, Fe, Ti, Li, Si, Mg, Cu, and Zn have also been calculated as a function of temperature [20] Mechanical properties of Al-Sc [21], Al-Zn [22], Al-Cu-Mn-Mg-Zn-Fe [23], and Al-Zn-Cu-Zr [8] alloys have recently been investigated. GSFE has not been calculated for Al alloys with elements, such as Sc, Zr, Mn, Fe.
In the present study, we used density functional theory calculations to analyze the possible effect of alloying elements on GSFE of aluminum alloys. This study presents the results of GSFE calculations for other metallic and non-metallic elements in the aluminum matrix. Arelationship between SFE and thenumber of d-electrons in transition metals was found. Recent progress in experimental studies on aluminum alloys shows that the deformation mode may be effectively managed by alloying elements [17,24]. The elements, which significantly promote partial dislocation emission and deformations twins in Al alloys, were selected. GSFE calculations of aluminum alloys may be useful for material design.
2. Materials and Methods
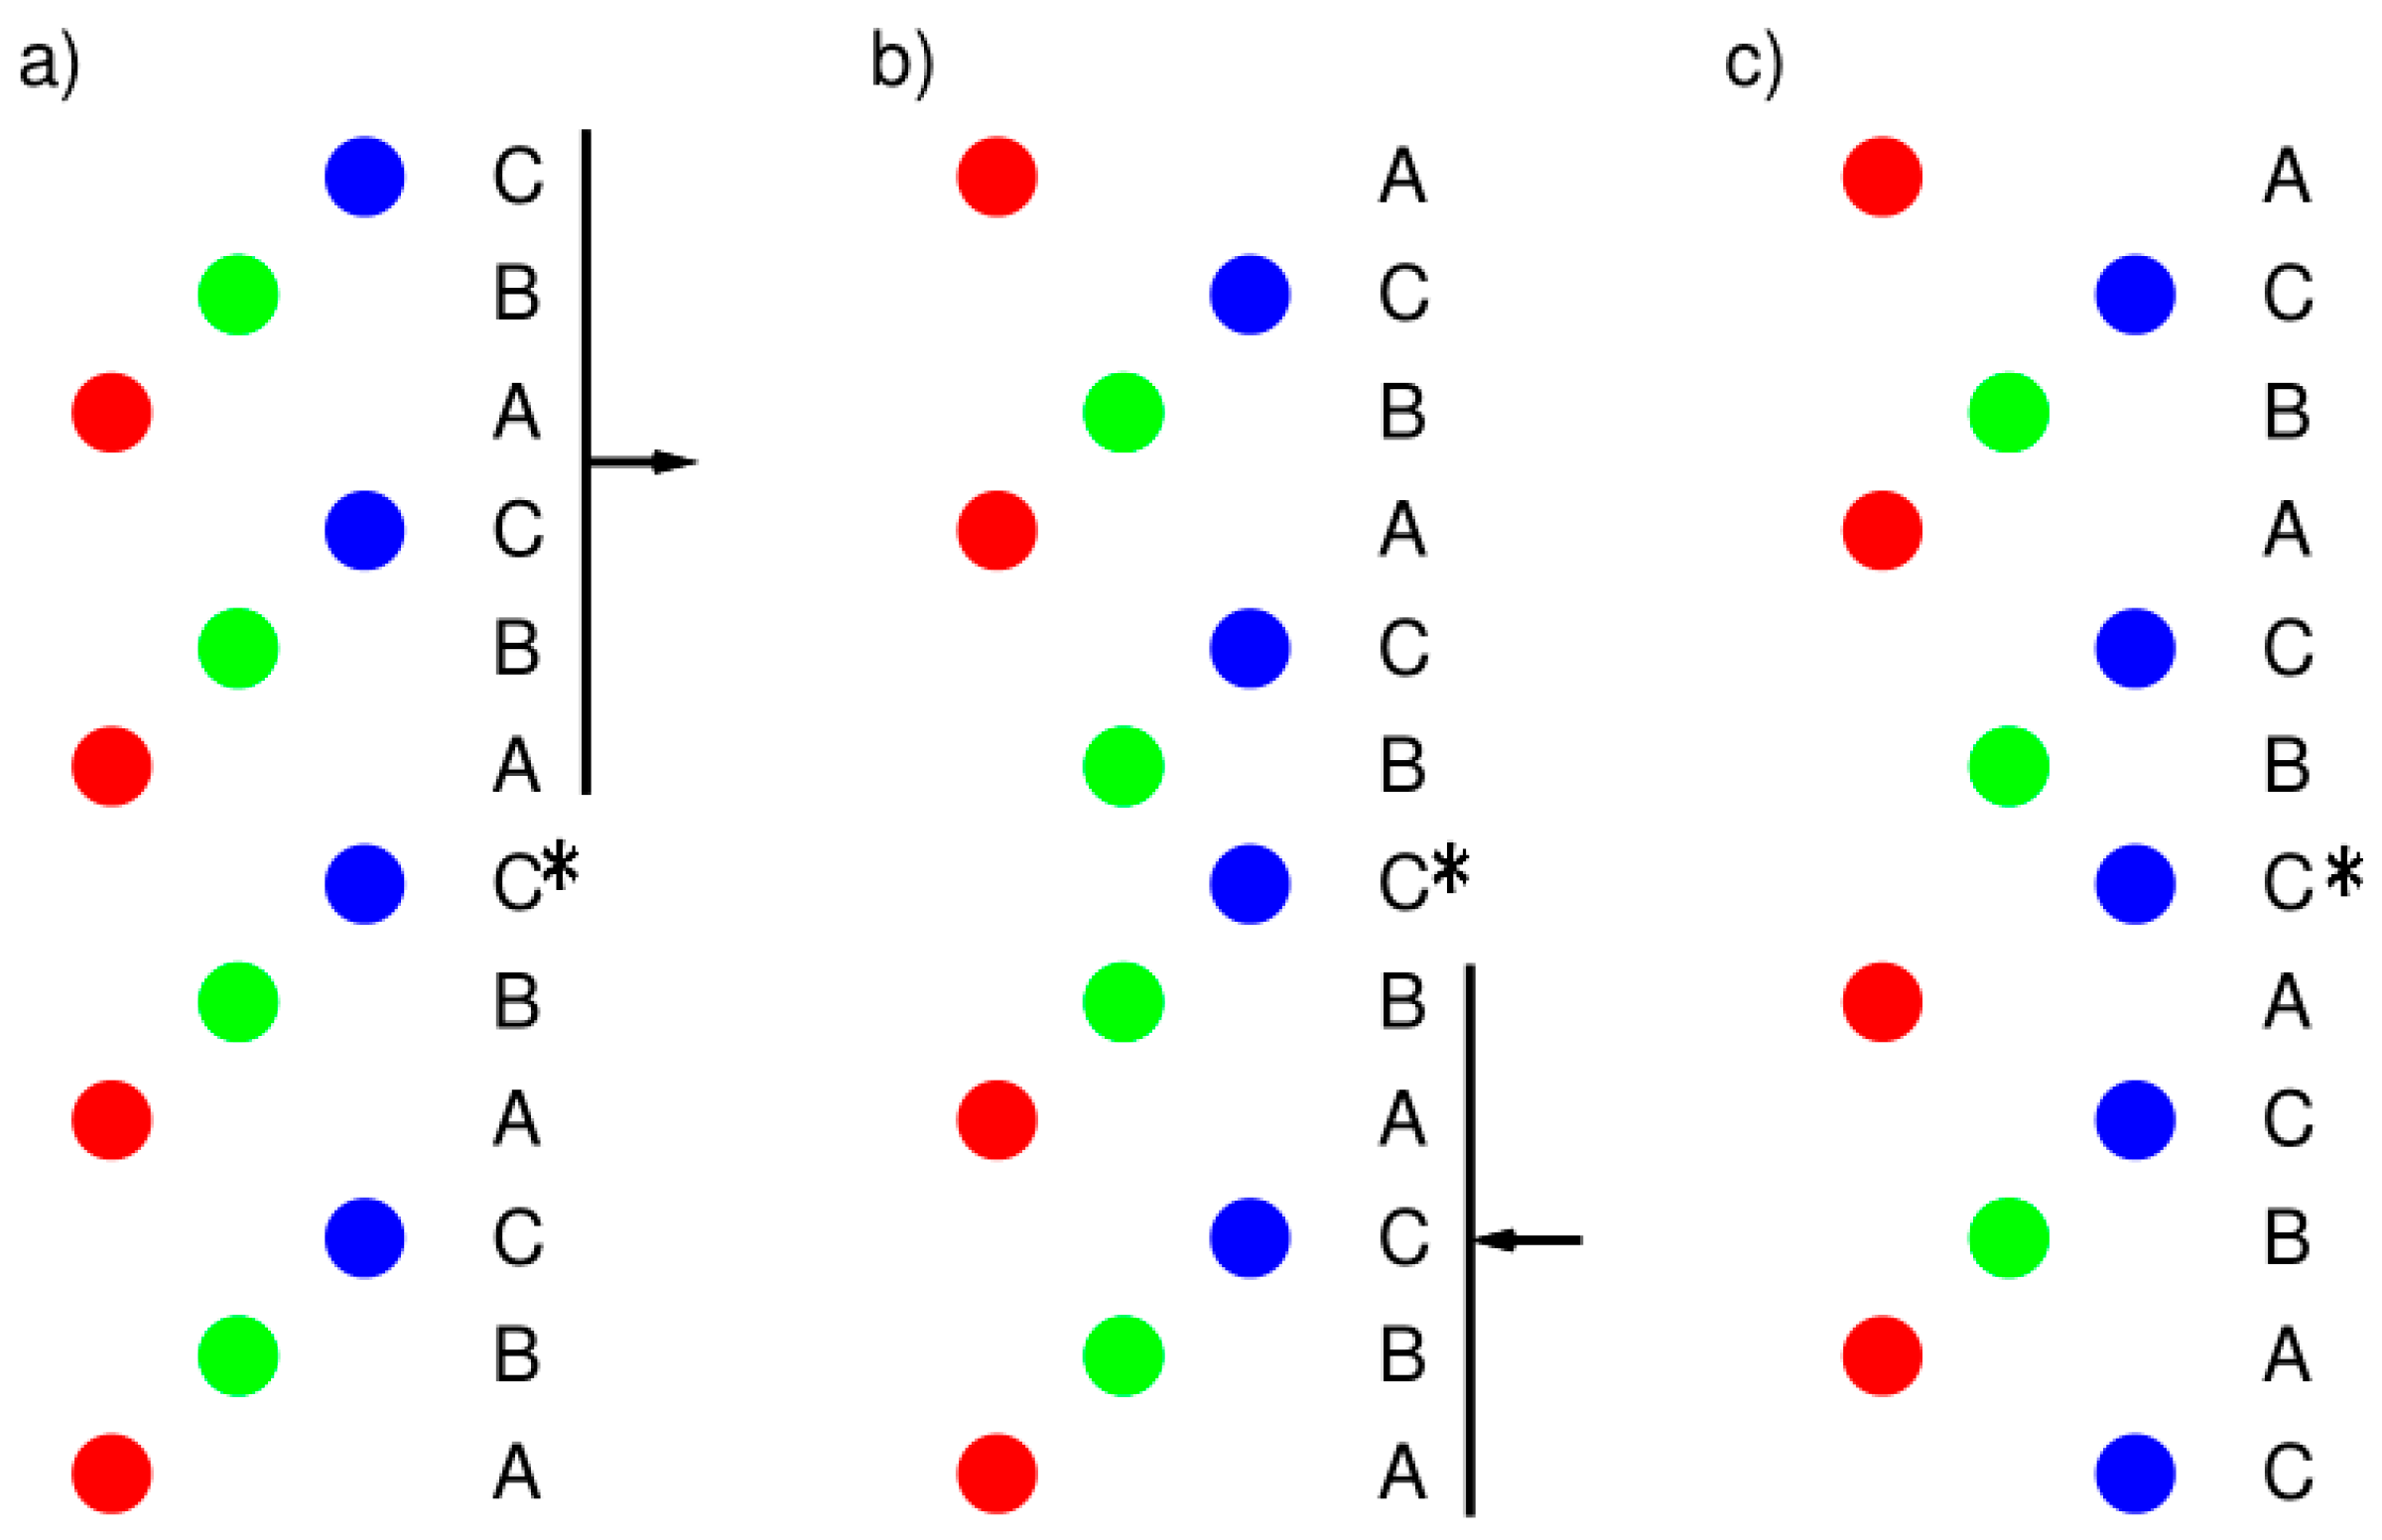
Calculations were based on density functional theory (DFT) as implemented in the Vienna Ab-initio Simulation Package (VASP) [25,26]. GSFE calculations were performed using projector augmented wave potentials and generalized gradient approximation, with the electron exchange-correlation described by Perdew-Burke-Ernzerhof (PBE) parameterization [27,28]. Fermi smearing of electronic occupancy with 0.2 eV and plane-wave cut-off energy of 400 eV were used. The Monkhorst-Pack scheme was used to sample the Brillouin zone with an 8 × 8 × 1 k-point mesh. The ionic relaxation was terminated when energy convergence was greater than 10−4 eV. GSF energies were computed by using a periodic supercell consisting of twelve (111) planes with a 2 × 2 slab geometry which gives 48 atoms in a system. Energies were calculated for configurations obtained by displacing one part of the crystal on the other along a ‹112› direction on a (111) plane. GSFE was calculated by displacing parts of the model in two operations. In the first process, one-half of the crystal was displaced (1–6 layers of a supercell). In the second step, the second part of the crystal was displaced in the opposite direction (8–12 layers of a supercell) (see Figure 1). Calculations of GSFE were carried out for Al and systems with one atom of Al in the slip plane being replaced by the alloying element. Taking into account the size of a supercell, the concentration of alloying elements was about 2% and about 25% in the slip plane. GSFEs may have been overestimated, in comparison to real materials, due to the high concentration of the alloying elements in the slip plane. More detailed calculations considering different impurity concentration (a supercell with 3 × 3 and a 4 × 4 slab geometry in the slip plane) are necessary in the future. The vacuum space (6 Å), and relaxation of atom positions perpendicular to free surface were applied. Cell shape and volume were kept constant during relaxation.
3. Results and Discussion
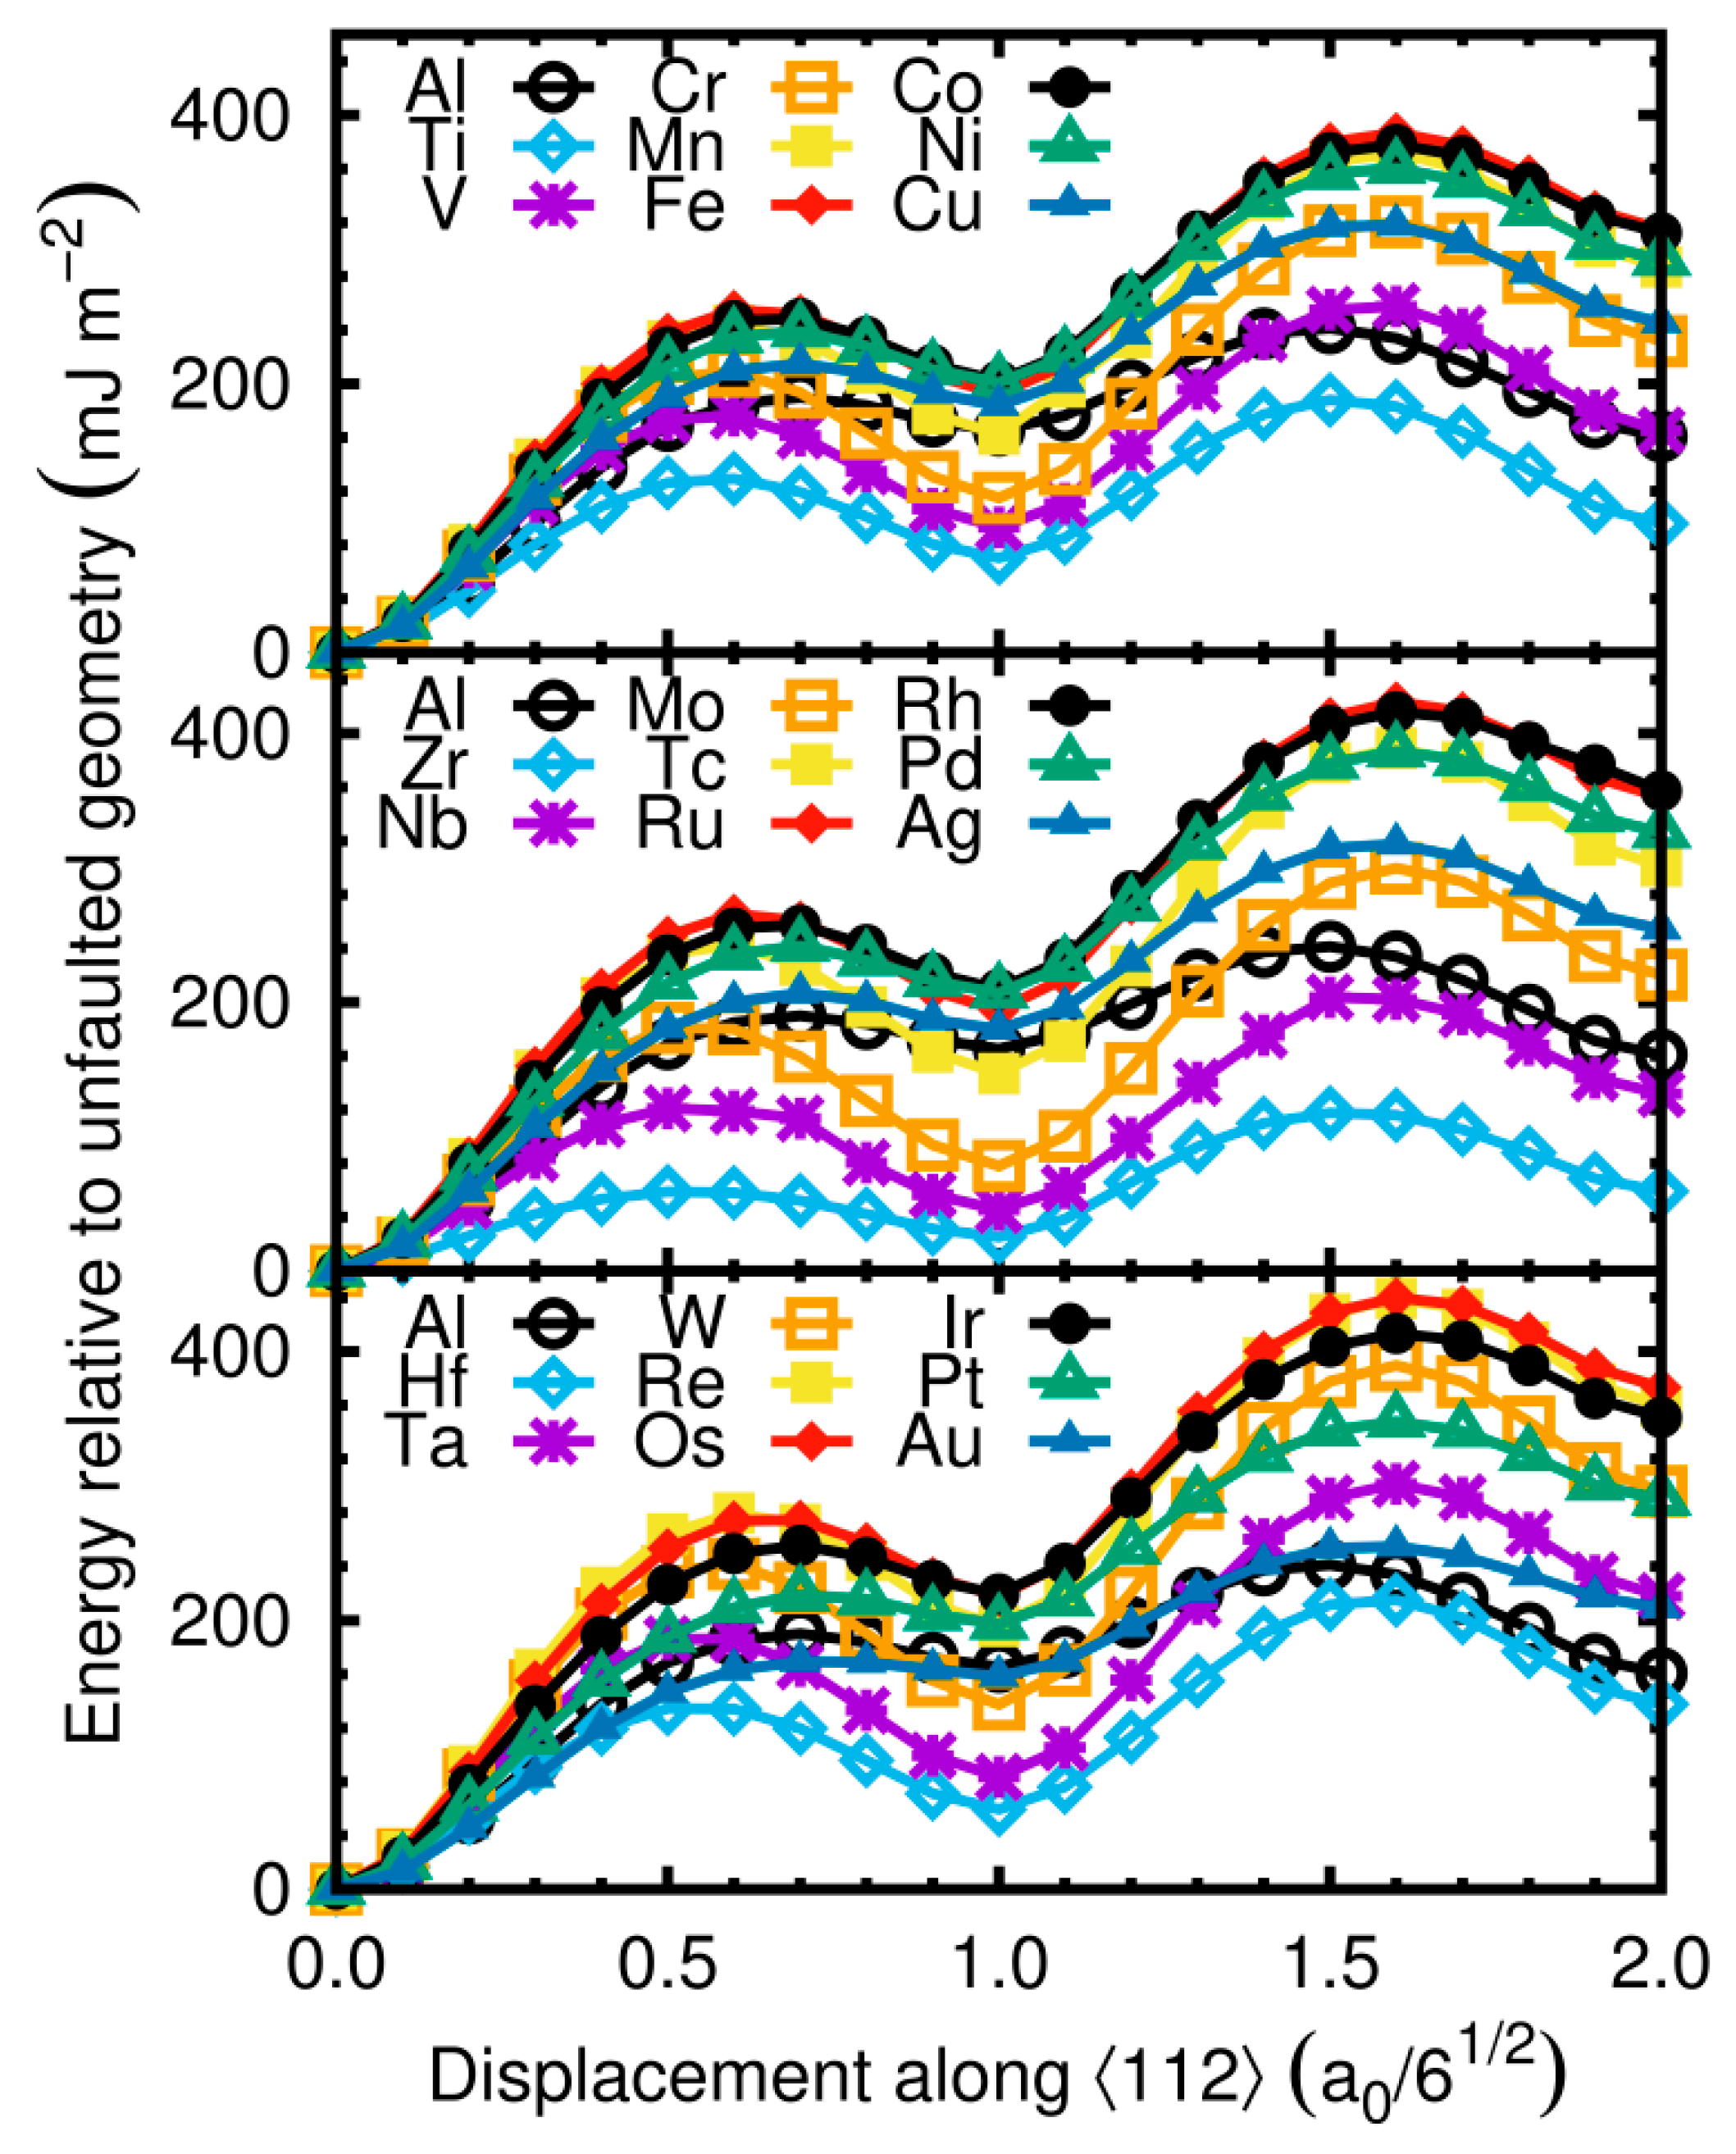
Obtained values of GSFE are plotted in Figure 2 as a function of displacement along the ‹112› direction.
The first maximum on the energy plot determined USFE, and the next minimum is the intrinsic SFE at displacement equal to a0/61/2. The second maximum on the GSFE curve is UTE, and the following minimum defined the twin formation energy (TE). It should be noted that SFE and TE could be determined experimentally while USFE and UTE can only be obtained by atomistic scale calculations. The unstable energies (USFE and UTE) are the maximum energies on the GSFE curve, which were required to shift one part of the crystal on to the remaining one. The curves indicated that the alloying Al, at the analyzed concentration, changed the GSFE. Results of computations are summarized in Table 1 which lists computed values of USFE, SFE, UTE, TE, ratios of SFE/USFE and UTE/USFE.
Results for Mg, Ga, Zn, Si, and Cu alloys have been previously reported [13]. The SFE of Al is calculated as 162 mJ/m2. SFE is reduced by a series of non-transition metals: Na, Mg, Li, Si, Ga, Ge, and Te. The lowest value of SFE, in alloyed Al by the analyzed non-transition metals, is 20 mJ/m2 (Te). USFE and UTEdecreased by all analyzed non-transition metals, except Mg.
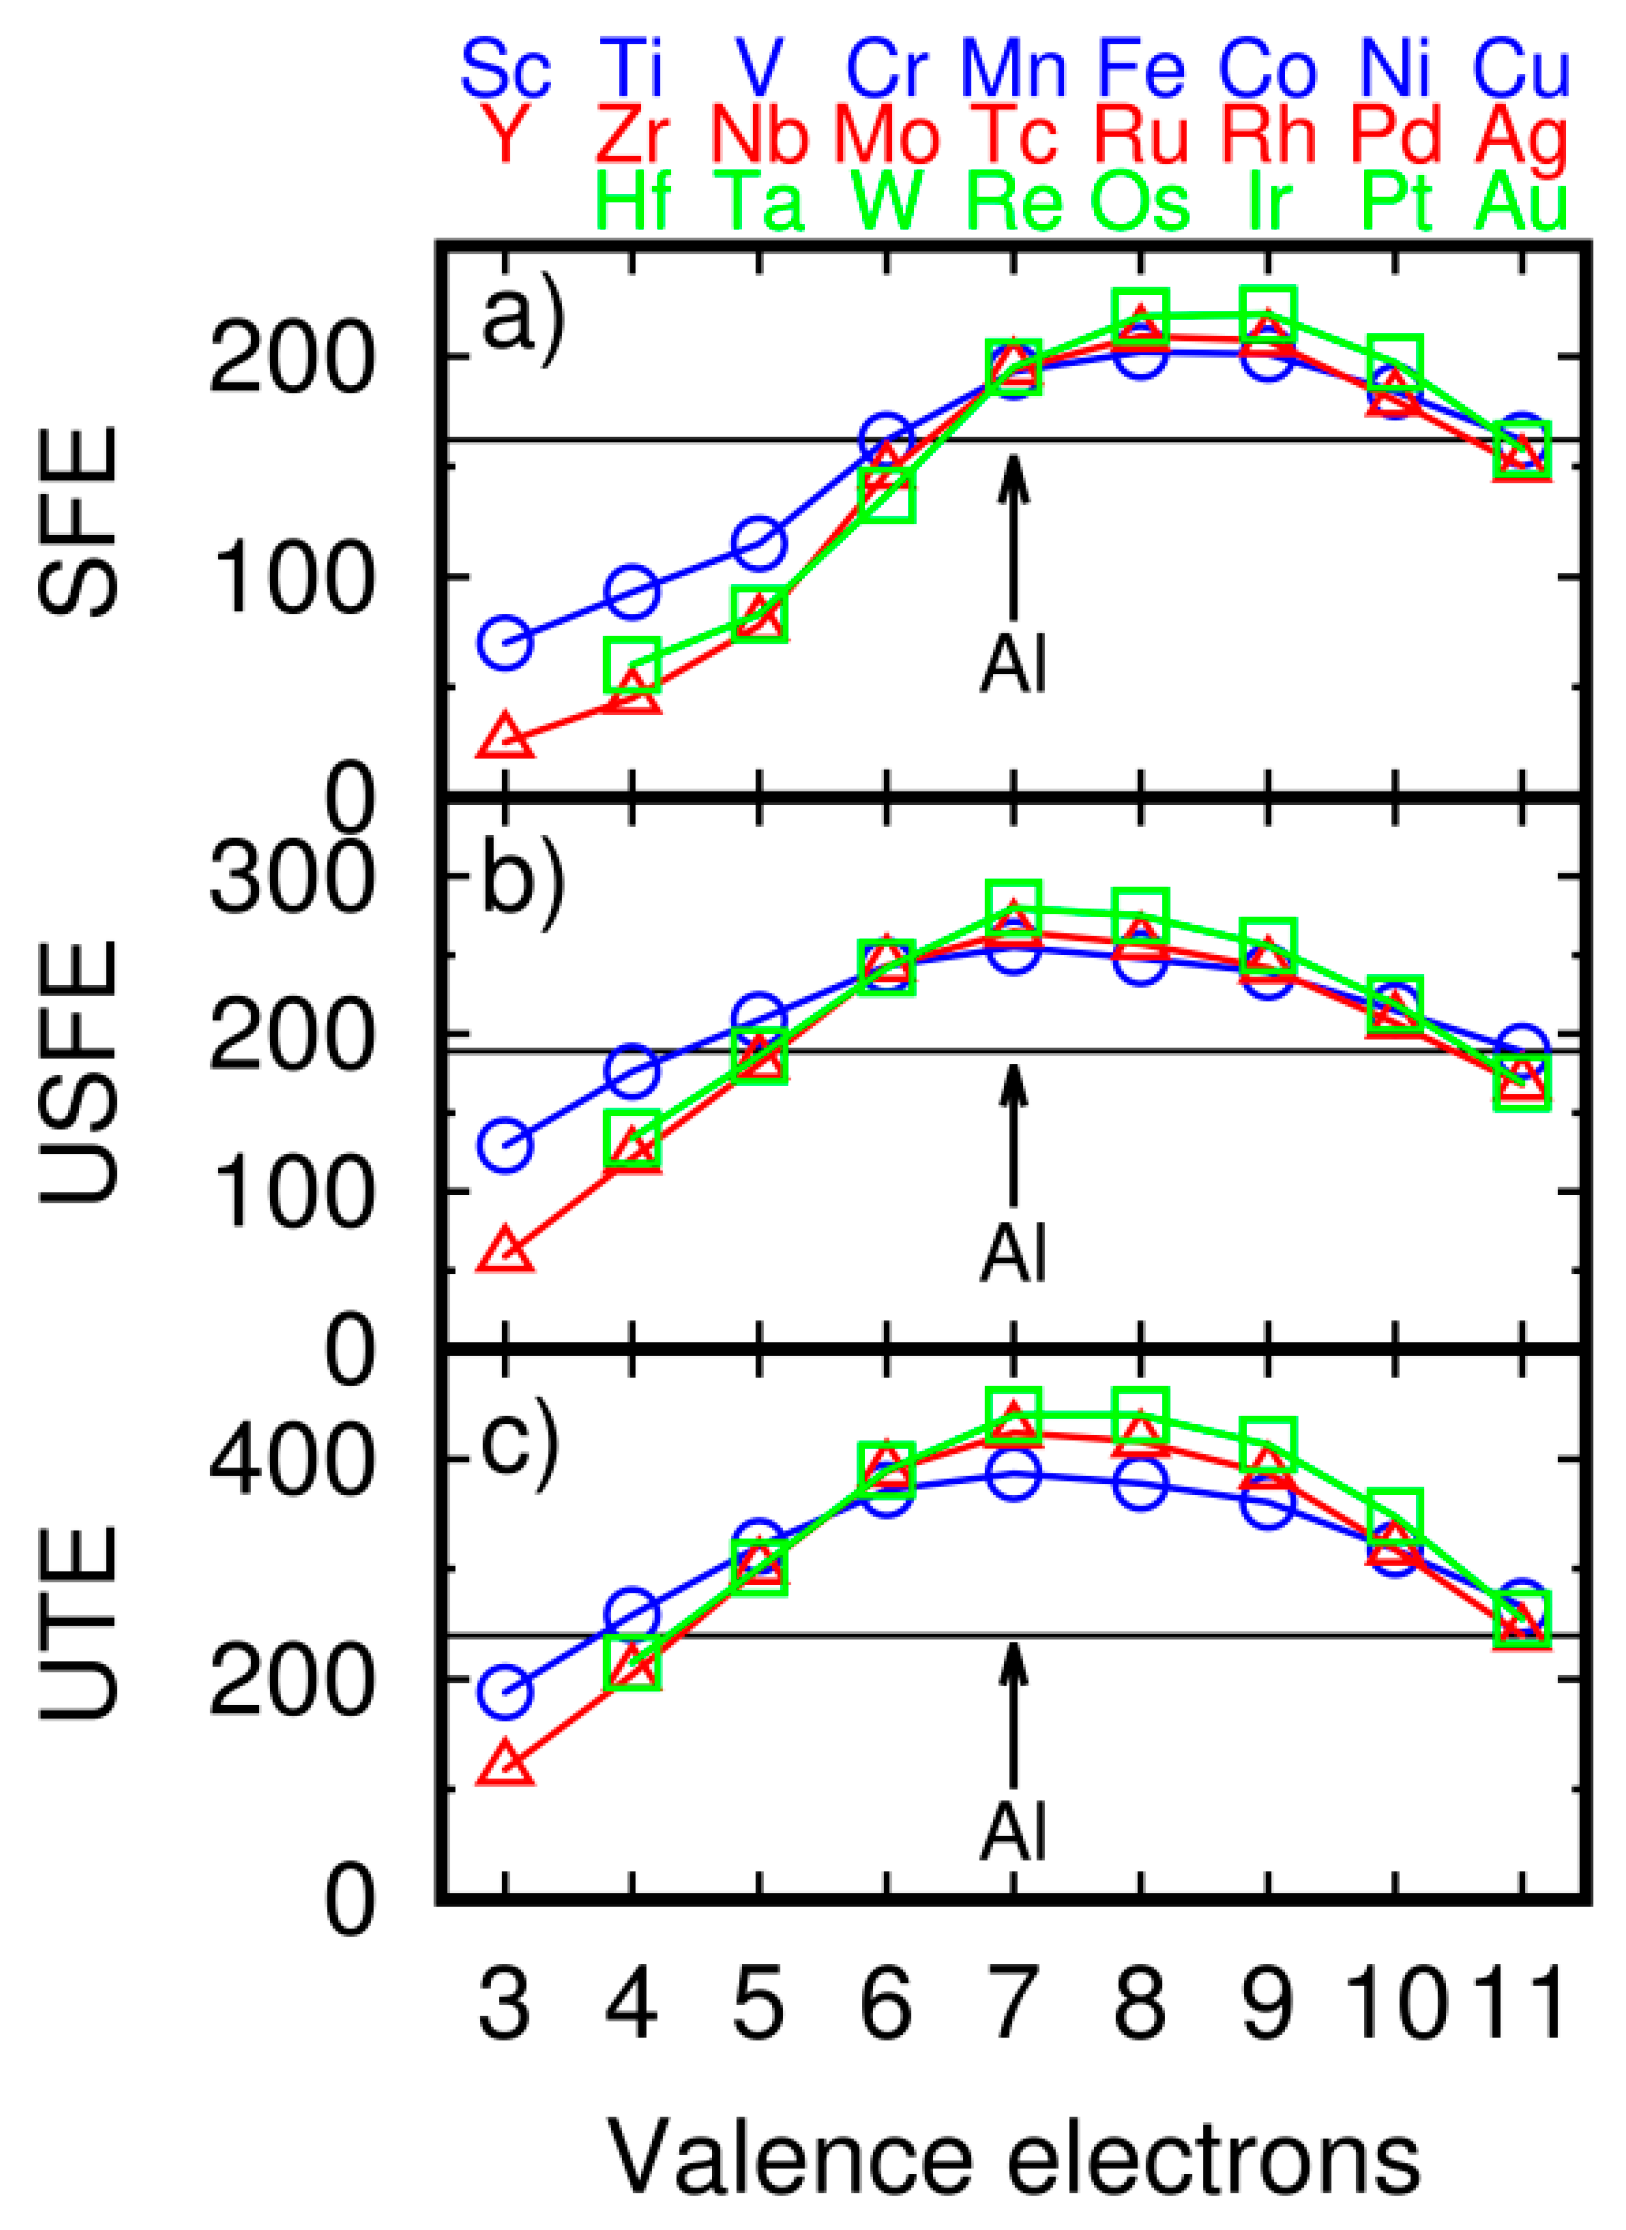
The main goal of this study was focused on fault formation in alloying Al by transition metals. The results of SFE calculations for transition metals are presented in Figure 3a where the black line indicates the SFE of pure Al.
SFE was reduced by adding transition metal alloys: 3d (Sc, Ti, V, and Cu), 4d (Y, Zr, Nb, Mo, and Ag), and 5d (Hf, Ta, W, and Au). The lowest energies are for elements from the beginning of transition metals series (Ti, Zr, and Hf). The lowest value of SFE equal 25 mJ/m2 is for Y. Liu et al. have found that SFE is lower by Y and Sc [20] The highest energies are for elements close to the middle of the series (Fe, Ru, and Os). SFE revealed a specific parabolic trend. For the addition of alloy with a small number of valence electrons, SFE was lower for the Al alloy than for pure Al. The lowest value is for Y with three valence electrons. SFE increased with the increasing number of valence electrons. For metals with six valence electrons, SFE is close to the value of Al. Maximum energy is observed for impurity additions with eight and nine valence electrons, and the trend reduced for metals with ten and eleven valence electrons. We also observed the specific trend on the other two analyzed values: USFE (Figure 3b) and UTE (Figure 3c). However, the maximum is shifted to the elements with alower number of valence electrons than in the case of SFE. The maximum of USFE is observed for the addition of alloys with seven valence electrons (Mn, Tc, and Re). The minimum of USFE is observed for the alloying Al with a low number of valence electrons. The trend of UTE is similar to the one for USFE. The maximum is observed for the addition of alloys with seven valence electrons.
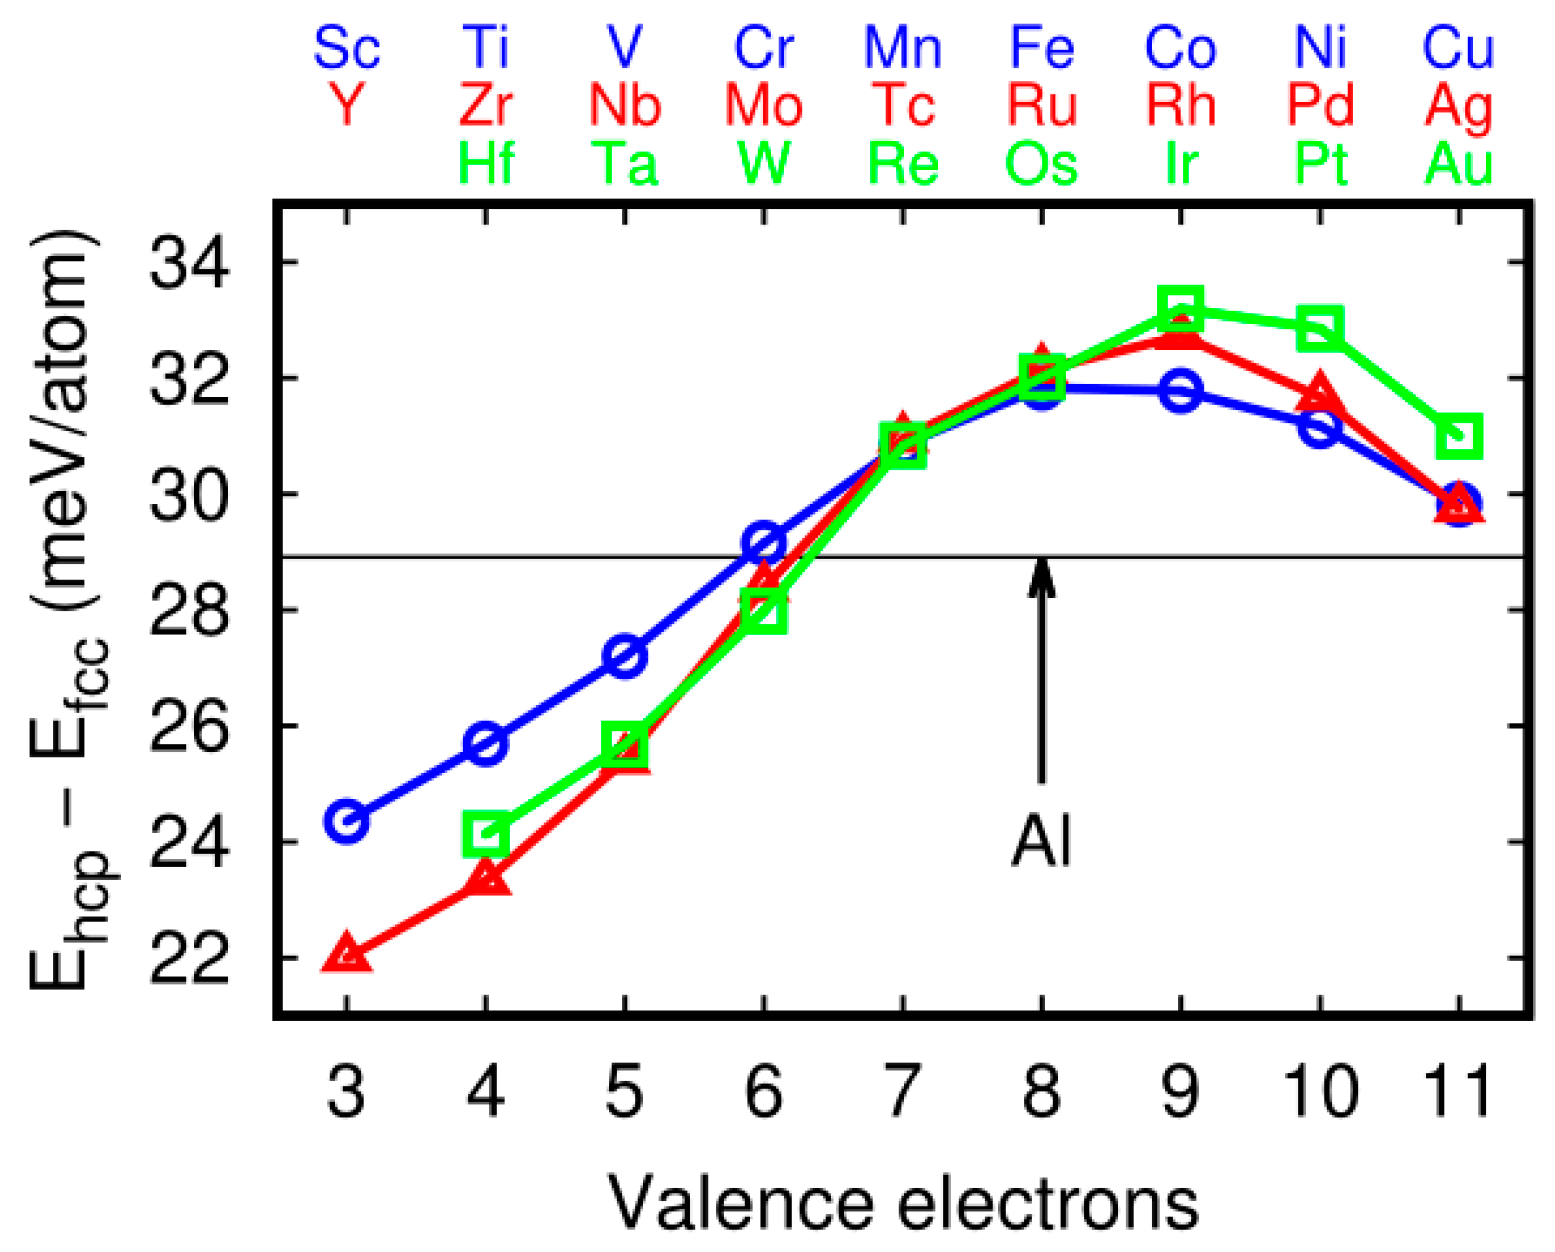
As mentioned above, SFE exhibited a specific trend (Figure 3a). To explain the trend we performed additional calculations. As presented on Figure 1b, around the stacking fault there was a …BCBC… atom arrangement, and that arrangement was anhexagonal-close packed (hcp)-likesequence. We compared the energy difference between Al and Al-transition metal alloys in thefcc and hcp structures. In both cases (fcc and hcp) the supercell with 48 atoms and 12 layers was used. In fcc ABCABC (see the structure on Figure 1a) and in hcp–BCBCBC atom sequences were used. In the sixth layer the impurity atom was substituted. Hcp–fcc energy difference in Al is about 29 meV/atom. If hcp–fcc energy difference for selected alloy is lower than 29 meV/atom, it means that the impurity stabilizes hcp structure. When comparing the Figure 3a and Figure 4 we see that the trend is very similar. The impurity, which decrease the hcp–fcc energy difference (Y, Sc, Ti, Hf, Zr, Ta, Nb, V, W), also decrease the SFE. The accuracy of the relationshipis visible for metals with six valence electrons (Cr, Mo and W), in which energies are close to Al line (Figure 3a and Figure 4). The SFE of the Al-Cr alloy is a little bit above the SFE of pure Al, as in the case of hcp–fcc stability of the Al-Cr system. However, for full filled d-shell atoms (Cu, Ag, and Au) the relationship is not exact. Energy difference is above the Al line, but SFE is lower for Al-X (X = Cu, Ag, Au) than for the Al.
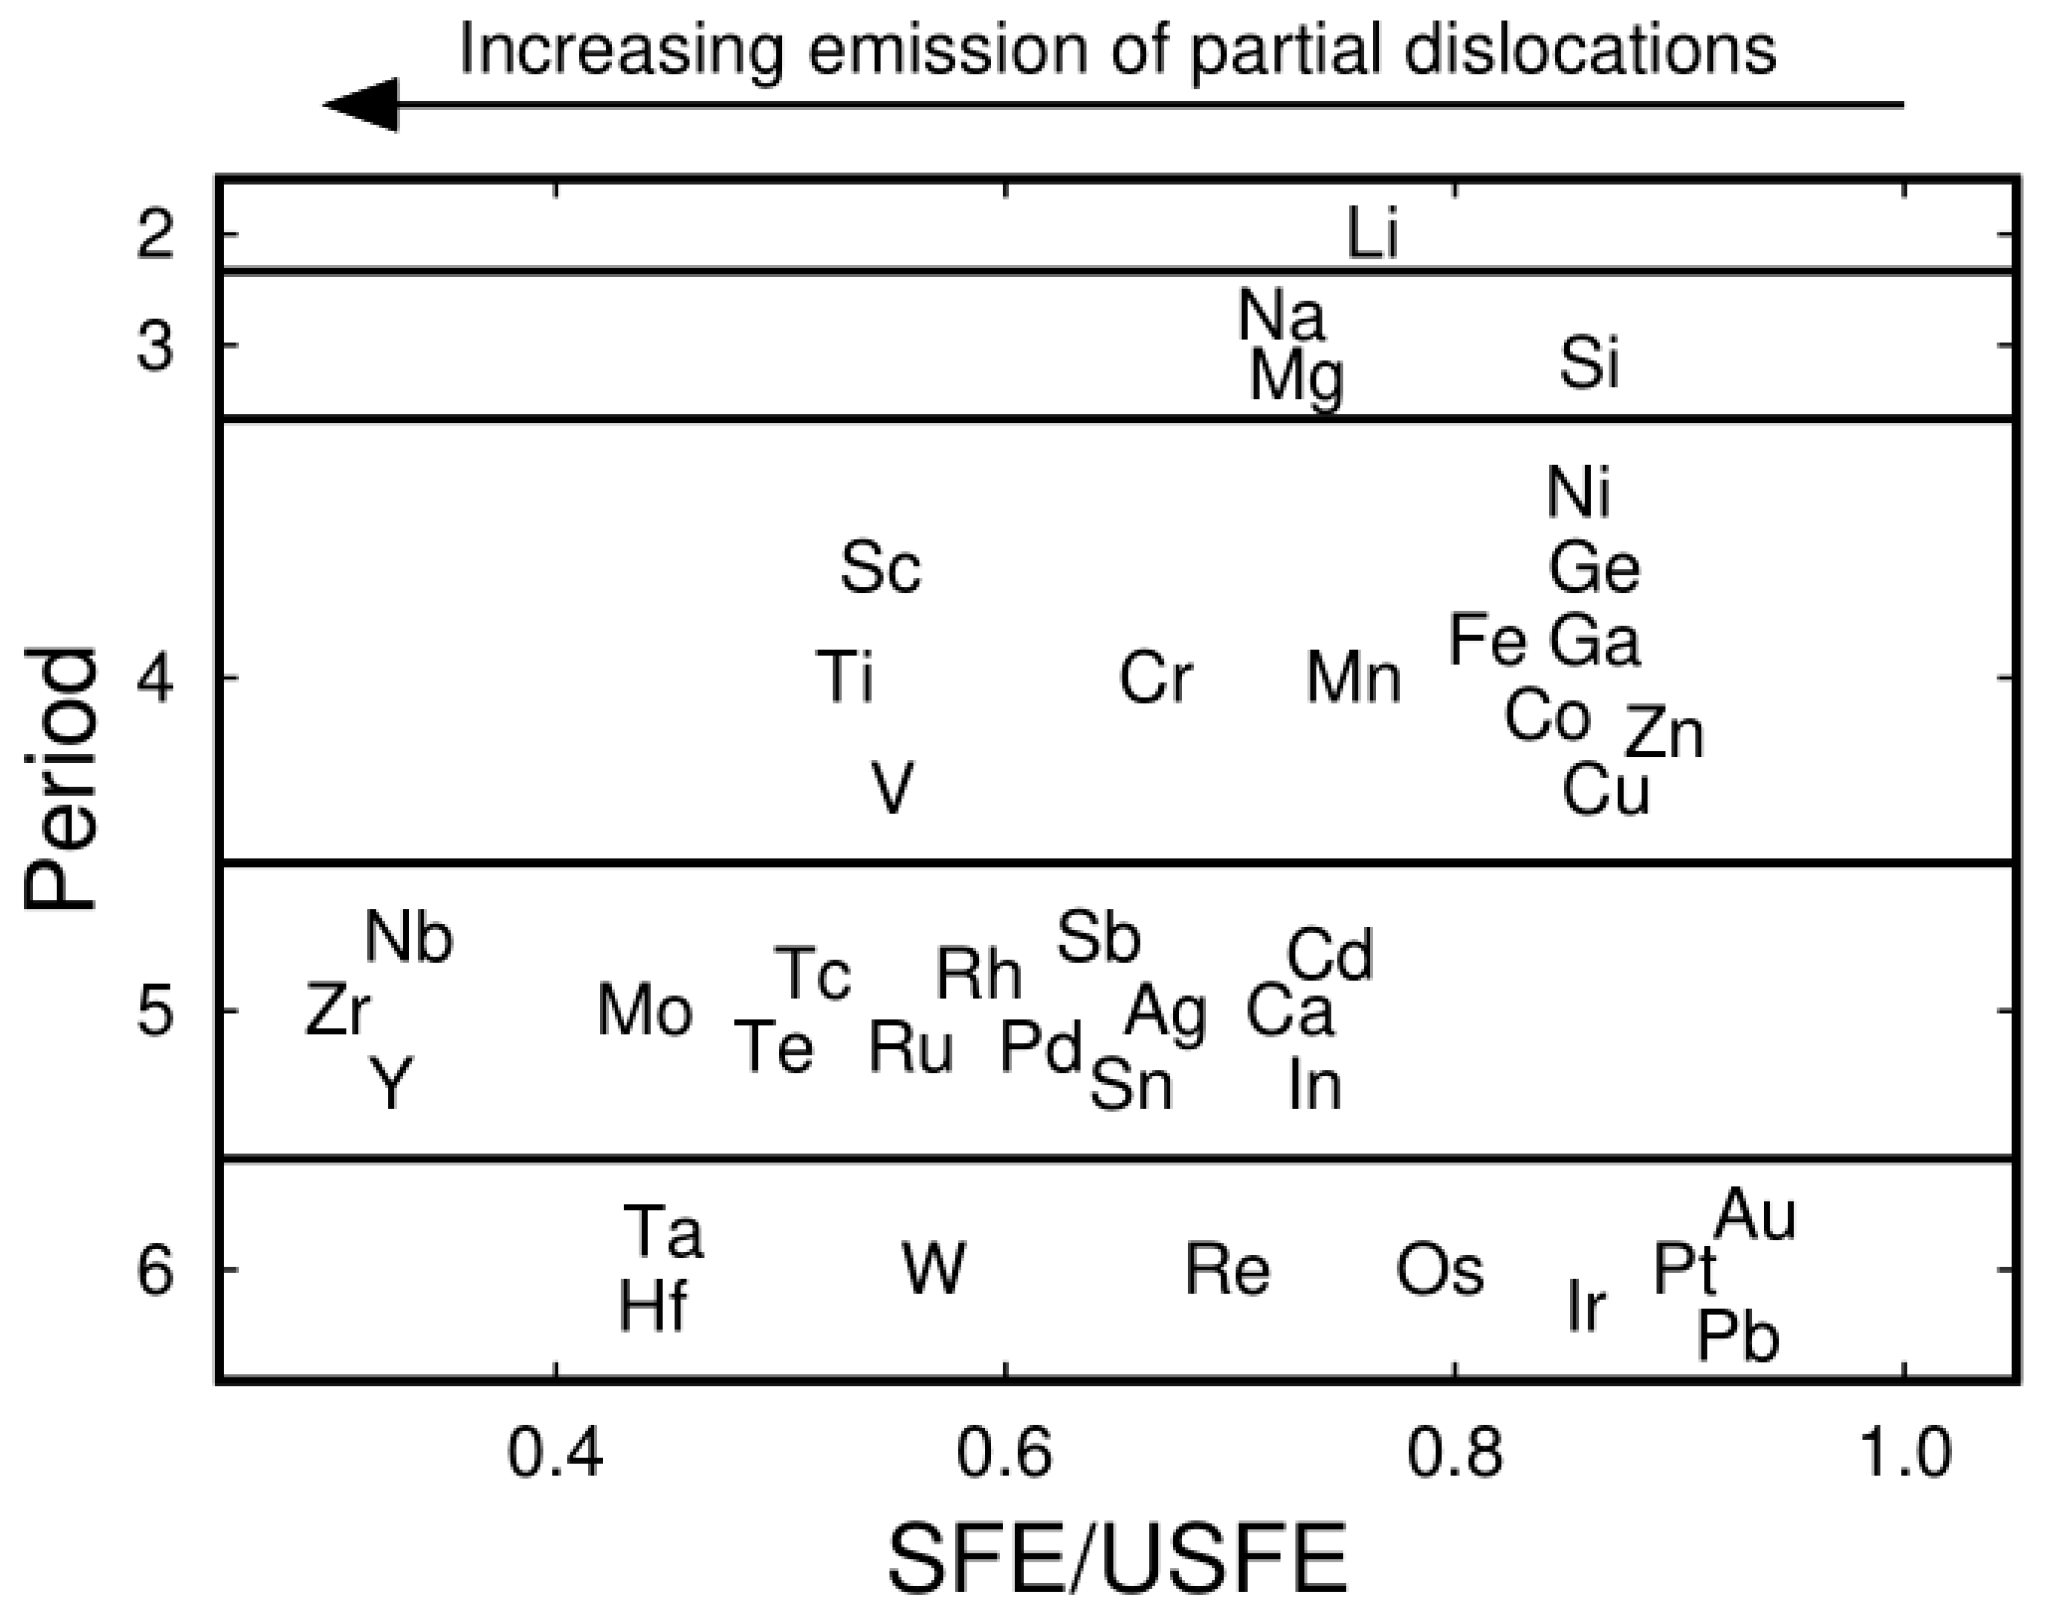
The deformation mechanism and twinning tendency expect to depend on the values of SFE/USFE and UTE/USFE [29,30], respectively. SFE/USFE value close to 1.0 imply that deformation by full dislocation emission is preferred. If this parametersis lower than 1.0, then partial dislocations are observed. Twins tendency increases with decreasing UTE/USFE ratio. The ratios of SFE/USFE are included in Table 1. The results obtained in this study are presented in Figure 5 in the context oftendency to the emission of partial dislocations.
The value of SFE/USFE for Al is 0.862. Alloy addition, which decreased the value, promoted partial dislocation emissions of alloying Al. The overwhelming majority of analyzed elements decrease the SFE/USFE ratio, except Si, Pd, Ag, Pt, Au, and all analyzed post-transition metals: Cd, In, Sn, Sb, and Pb. The SFE/USFE ratio is presented in Figure 5. It can be seen that alloy additions are ordered in almost the same way as in the periodic table. The elements from the beginning of the period reduce the SFE/USFE ratio to very low values, i.e., Zr to 0.376, which is a very low value in comparison to Al (0.862). It can be noted that the fifth-period elements: Y, Zr, and Nb reduce the SFE/USFE ratio to the lowest values, thus preventing the cross-slip of dislocations. The obtained results showed that alloying with i.e. Sc, Y, Ti, Zr, Hf, V, Nb, and Ta is expected to bring a significant increase in the tendency to the formation of partial dislocations. As in the cases of SFE, USFE, and UTE, the SFE/USFE ratio are the lowest one for the alloying Al by transition metals with a low number of valence electrons. Thisis another specific trend observed in the Al alloys. The tendency to twinning is analyzed by the UTE/USFE ratio (see Table 1 and Figure 6).
It can be seen that there is no noticeable trend for the UTE/USFE ratio. The lowest values were for Na and Mg. The twinning tendency of Al-Mg alloys has already been confirmed by experimental results. Velsco and Hodge have found that the fraction of twinned grains increases from 40% to 70% in magnetron sputtered thick films (>10 μm) of Al and Al-5.3%wt. Mg alloy, respectively [24]. Lipinska at all. found that the mechanism of grain refinement in Al-0.57%wt. Mg-0.43%wt. Si alloy is distinctly different from that in pure aluminum, with the grain rotation being more prominent than the grain subdivision due to lower stacking fault energy and the reduced mobility of full dislocations in the alloy [29,31]. Other experimental work has found that Mg and Si concentration in Al impact on the deformation mechanism and grain size in aluminum alloys [15,17,30,32]. A recent study on Al/Ti composites has showed that the Al/Ti interphase boundaries significantly promoted the generation of dislocation during high-pressure torsion deformation [33]. This agrees with our prediction that Ti is one of the most promising elements from the point of view of twin ability of Al alloys (Figure 6).
4. Conclusions
All analyzed transition metal alloy additions increased the UTE/USFE ratio. In our previous study of GSFE for Mg alloys, it has been found that the UTE/USFE ratio for Mg and Mg alloys was mainly in the range of 1.20 to 1.33 [14]. In the case of Al alloys, the range is from 1.2 to 2.0. However, most of the elements increased the UTE/USFE ratio above the value of non-alloyed Al. Some specific trends were observed in alloying Al. The SFE, USFE, and UTE of alloying Al were correlated with the number of valence electrons of alloy addition. Furthermore, the SFE/USFE ratio was also correlated with the number of valence electrons. Our systematic calculations showed that transition metals with a low number of d-shell electrons decreased significantly the SFE of Al alloys. This may reveal new Al alloys synthesis with promising properties.
Supplementary Materials
The following are available online at https://www.mdpi.com/2075-4701/8/10/823/s1, Figure S1: The geometry of the (111) plane in fcc structure is shown. ABC layers of atoms are marked by red, green and blue circles, respectively. Black arrows indicate the direction and length of the partial dislocation slip. The red arrow shows the full dislocation slip.
Author Contributions
M.M. designed and performed the calculations. M.M., Z.P. and K.J.K. analyzed the results and wrote the paper.
Funding
This research was funded by NANOMET Project financed under the European Funds for Regional Development (Contract No. POIG.01.03.01-00-015/08).
Acknowledgments
Calculations were performed on Interdisciplinary Centre for Mathematical and Computational Modelling supercomputers (Grant no. G63-12). The VASP calculations have been done during my stay at WUT (MM).
Conflicts of Interest
The authors declare no conflict of interest.
References
- Islamgaliev, R.K.; Nesterov, K.M.; Bourgon, J.; Champion, Y.; Valiev, R.Z. Nanostructured Cu-Cr alloy with high strength and electrical conductivity. J. Appl. Phys. 2014, 115, 1–5. [Google Scholar] [CrossRef]
- Youssef, K.; Sakaliyska, M.; Bahmanpour, H.; Scattergood, R.; Koch, C. Effect of stacking fault energy on mechanical behavior of bulk nanocrystalline Cu and Cu alloys. Acta Mater. 2011, 59, 5758–5764. [Google Scholar] [CrossRef]
- Tian, Y.Z.; Wu, S.D.; Zhang, Z.F.; Figueiredo, R.B.; Gao, N.; Langdon, T.G. Strain hardening behavior of a two-phase Cu-Ag alloy processed by high-pressure torsion. Scr. Mater. 2011, 65, 477–480. [Google Scholar] [CrossRef]
- Karimpoor, A.A.; Erb, U.; Aust, K.T.; Palumbo, G. High strength nanocrystalline cobalt with high tensile ductility. Scr. Mater. 2003, 49, 651–656. [Google Scholar] [CrossRef]
- Bhatia, M.A.; Rajagopalan, M.; Darling, K.A.; Tschopp, M.A.; Solanki, K.N. The role of Ta on twinnability in nanocrystalline Cu–Ta alloys. Mater. Res. Lett. 2017, 5, 48–54. [Google Scholar] [CrossRef]
- Bufford, D.; Liu, Y.; Zhu, Y.; Bi, Z.; Jia, Q.X.; Wang, H.; Zhang, X. Formation Mechanisms of High-density Growth Twins in Aluminum with High Stacking-Fault Energy. Mater. Res. Lett. 2013, 1, 51–60. [Google Scholar] [CrossRef] [Green Version]
- Koch, C.C. Optimization of strength and ductility in nanocrystalline and ultrafine grained metals. Scr. Mater. 2003, 49, 657–662. [Google Scholar] [CrossRef]
- Liu, B.; Zhou, X.; Hashimoto, T.; Zhang, X.; Wang, J. Machining introduced microstructure modification in aluminium alloys. J. Alloy. Compd. 2018, 757, 233–238. [Google Scholar] [CrossRef]
- Tadmor, E.B.; Bernstein, N. A first-principles measure for the twinnability of FCC metals. J. Mech. Phys. Solids. 2004, 52, 2507–2519. [Google Scholar] [CrossRef]
- Siegel, D.J. Generalized stacking fault energies, ductilities, and twinnabilities of Ni and selected Ni alloys. Appl. Phys. Lett. 2005, 87, 121901–121903. [Google Scholar] [CrossRef]
- Laksana, T.; Fu, W.; Chen, H.; Zhang, C.; Yang, Z. First-principles calculations of generalized-stacking-fault-energy of Co-based alloys. Comput. Mater. Sci. 2016, 121, 86–96. [Google Scholar] [CrossRef]
- Muzyk, M.; Pakiela, Z.; Kurzydlowski, K.J. Ab initio calculations of the generalized stacking fault energy in aluminium alloys. Scr. Mater. 2011, 64, 916–918. [Google Scholar] [CrossRef]
- Li, W.; Lu, S.; Hu, Q.-M.M.; Kwon, S.K.; Johansson, B.; Vitos, L. Generalized stacking fault energies of alloys. J. Phys. Condens. Matter 2014, 26, 265005. [Google Scholar] [CrossRef] [PubMed]
- Muzyk, M.; Pakiela, Z.; Kurzydlowski, K.J. Generalized stacking fault energy in magnesium alloys: Density functional theory calculations. Scr. Mater. 2012, 66, 219–222. [Google Scholar] [CrossRef]
- Kawasaki, M.; Alhajeri, S.N.; Xu, C.; Langdon, T.G. The development of hardness homogeneity in pure aluminum and aluminum alloy disks processed by high-pressure torsion. Mater. Sci. Eng. A 2011, 529, 345–351. [Google Scholar] [CrossRef]
- Cabibbo, M. Microstructure strengthening mechanisms in different equal channel angular pressed aluminum alloys. Mater. Sci. Eng. A 2013, 560, 413–432. [Google Scholar] [CrossRef]
- Zhong, H.; Rometsch, P.A.; Cao, L.; Estrin, Y. The influence of Mg/Si ratio and Cu content on the stretch formability of 6xxx aluminium alloys. Mater. Sci. Eng. A 2015, 651, 688–697. [Google Scholar] [CrossRef]
- Zhao, D.; Løvvik, O.M.; Marthinsen, K.; Li, Y. Impurity effect of Mg on the generalized planar fault energy of Al. J. Mater. Sci. 2016, 51, 6552–6568. [Google Scholar] [CrossRef] [Green Version]
- Zhao, D.; Martin, O.; Marthinsen, K.; Li, Y. Combined effect of Mg and vacancy on the generalized planar fault energy of Al. J. Alloy. Compd. 2017, 690, 841–850. [Google Scholar] [CrossRef]
- Liu, L.H.; Chen, J.H.; Fan, T.W.; Liu, Z.R.; Zhang, Y.; Yuan, D.W. The possibilities to lower the stacking fault energies of aluminum materials investigated by first-principles energy calculations. Comput. Mater. Sci. 2015, 108, 136–146. [Google Scholar] [CrossRef]
- Houtny, D.; Skulina, D.; Pantělejev, L.; Lenczowski, B.; Palm, F.; Nick, A.; Stief, P.; Dantan, J.; Etienne, A.; Siadat, A. Processing of Al-Sc aluminum alloy using SLM technology. Procedia CIRP 2018, 74, 44–48. [Google Scholar] [CrossRef]
- Jia, H.; Jin, S.; Li, Y. Formation of S3{110} incoherent twin boundaries through geometrically necessary boundaries in an Al-8Zn alloy subjected to one pass of equal channel angular pressing. J. Alloy. Compd. 2018, 762, 190–195. [Google Scholar] [CrossRef]
- Teymoory, P.; Zarei-Hanzaki, A.; Farabi, E.; Monajati, H.; Abedi, H.R. Grain Refinement through Shear Banding in Severely Plastic Deformed A206 Aluminum Alloy. Adv. Eng. Mater. 2018, 20, 1–12. [Google Scholar] [CrossRef]
- Velasco, L.; Polyakov, M.N.; Hodge, A.M. Influence of stacking fault energy on twin spacing of Cu and Cu-Al alloys. Scr. Mater. 2014, 83, 33–36. [Google Scholar] [CrossRef]
- Kresse, G.; Furthmüller, J. Efficiency of ab-initio total energy calculations for metals and semiconductors using a plane-wave basis set. Comput. Mater. Sci. 1996, 6, 15–50. [Google Scholar] [CrossRef]
- Kresse, G.; Furthmüller, J. Efficient iterative schemes for ab initio total-energy calculations using a plane-wave basis set. Phys. Rev. B Condens. Matter Mater. Phys. 1996, 54, 11169–11186. [Google Scholar] [CrossRef]
- Joubert, D. From ultrasoft pseudopotentials to the projector augmented-wave method. Phys. Rev. B Condens. Matter Mater. Phys. 1999, 59, 1758–1775. [Google Scholar] [CrossRef]
- Perdew, J.P.; Burke, K.; Ernzerhof, M. Generalized gradient approximation made simple. Phys. Rev. Lett. 1996, 77, 3865–3868. [Google Scholar] [CrossRef] [PubMed]
- Lipinska, M.; Olejnik, L.; Pietras, A.; Rosochowski, A.; Bazarnik, P.; Golinski, J.; Brynk, T.; Lewandowska, M. Microstructure and mechanical properties of friction stir welded joints made from ultra fine grained aluminium 1050. Mater. Des. 2015, 88, 22–31. [Google Scholar] [CrossRef] [Green Version]
- Moradi, M.; Aval, J.H.; Jamaati, R.; Amirkhanlou, S.; Ji, S. Microstructure and texture evolution of friction stir welded dissimilar aluminum alloys: AA2024 and AA6061. J. Manuf. Process. 2018, 32, 1–10. [Google Scholar] [CrossRef]
- Lipinska, M.; Chrominski, W.; Olejnik, L.; Golinski, J.; Rosochowski, A.; Lewandowska, M. Ultrafine-Grained Plates of Al-Mg-Si Alloy Obtained by Incremental Equal Channel Angular Pressing: Microstructure and Mechanical Properties. Metall. Mater. Trans. A 2017, 48, 4871–4882. [Google Scholar] [CrossRef] [Green Version]
- Rezayat, M.; Parsa, M.H.; Mirzadeh, H.; Cabrera, J.M. Microstructural investigation of Al-Mg/B4C composite deformed at elevated temperature. J. Alloy. Compd. 2018, 763, 643–651. [Google Scholar] [CrossRef]
- Sun, Y.; Aindow, M.; Hebert, R.J.; Langdon, T.G.; Lavernia, E.J. High-pressure torsion-induced phase transformations and grain refinement in Al / Ti composites. J. Mater. Sci. 2017, 52, 12170–12184. [Google Scholar] [CrossRef]
Figure 1.
Schematic explanation of the model used in the computations: (a) Initial configuration separated from the rest by a “vacuum slab” 0.6 nm thick; (b) configuration imposed by the first displacement operation—layers numbered 1–6 in the upper part; (c) configuration imposed by the second displacement operation—layers numbered 1–5 in the lower part. The asterisks indicate the position of the atom that was replaced by the alloying element. The supercell for calculations was created by duplication twice along of the surface plane lattice vectors to generate a 2 × 2 supercell. One atom of Al was replaced by an alloying element for generalized stacking fault energy calculations. (The schematic view of the slip plane is in supplementary material—Figure S1).

Figure 2.
Generalized stacking fault energies(GSFEs) of selected aluminum-transition metal alloys. 3d, 4d and 5d elements are plotted from the bottombox to the top box, respectively. GSFEs of thesystem without the alloying element (Al) are shown on each plot for comparison.
Figure 2.
Generalized stacking fault energies(GSFEs) of selected aluminum-transition metal alloys. 3d, 4d and 5d elements are plotted from the bottombox to the top box, respectively. GSFEs of thesystem without the alloying element (Al) are shown on each plot for comparison.

Figure 3.
(a) Stacking fault energy (SFE), (b) unstable stacking fault energy (USFE), and (c) unstable twinning energy (UTE) of aluminum-transition metal alloys. The black line on each plot is a value of considered energy of pure Al. The circle, triangle and square denote 3d, 4d and 5d elements, respectively. All energies are in mJ/m2.

Figure 4.
Stability of hexagonal-close packed hcp vs. face-centered cubic (fcc)aluminum—transition metals alloys. The supercell contained 47 Al atoms and one impurity atom. In the case of the fcc structure, the atoms were arranged as shown on Figure 1a. In the case of the hcp structure, a BCBCBC… atom arrangement was used. The supercell volume and shape was identical in hcp and fcc cases (48 atoms). The black line indicates energy difference between hcp and fcc structures of Al. Transition metals impact edon hcp–fcc stability in the Al alloys. Y, Sc, Ti, Hf, Zr, Ta, Nb, V, W, and Mo decreasing the stability of Al-fcc vs. hcp ones. The shape of the curve was very similar to stacking fault energies (Figure 3a). The same transition metal impurity, which decreased the fcc stability, decreased the stacking fault energy of the Al alloys, except Cu, Ag and Au.

Figure 5.
Stacking fault energy (SFE) to unstable stacking fault energy (USFE) ratio for analyzed aluminum alloys. The position of the analyzed alloy indicates SFE/USFE value.
Figure 5.
Stacking fault energy (SFE) to unstable stacking fault energy (USFE) ratio for analyzed aluminum alloys. The position of the analyzed alloy indicates SFE/USFE value.

Figure 6.
Unstable twinning energy (UTE) to unstable stacking fault energy (USFE) ratio for analyzed aluminum alloys. The positionof the analyzed alloy indicates the UTE/USFE value.
Figure 6.
Unstable twinning energy (UTE) to unstable stacking fault energy (USFE) ratio for analyzed aluminum alloys. The positionof the analyzed alloy indicates the UTE/USFE value.


Table 1.
Calculated values of unstable stacking fault energy (USFE), stacking fault energy (SFE) and unstable twining energy (UTE) for Al and their alloys. Results for Al alloys with Mg, Ga, Zn, Si and Cu are from our previous calculations [12]. The most reduced SFE/USFE and UTE/USFE values are underlined. All energies are in mJ/m2.
| Al+ | Al | Li | Na | Mg | Si | Ga | |||
| USFE | 189 | 176 | 128 | 199 | 161 | 171 | |||
| SFE | 162 | 134 | 93 | 145 | 140 | 139 | |||
| UTE | 239 | 225 | 156 | 239 | 219 | 215 | |||
| TE | 161 | 129 | 78 | 135 | 141 | 148 | |||
| SFE/USFE | 0.862 | 0.763 | 0.723 | 0.730 | 0.870 | 0.813 | |||
| UTE/USFE | 1.265 | 1.282 | 1.213 | 1.200 | 1.360 | 1.257 | |||
| Al+ | Sc | Ti | V | Cr | Mn | Fe | Co | Ni | Cu |
| USFE | 129 | 176 | 209 | 243 | 255 | 248 | 239 | 215 | 189 |
| SFE | 70 | 93 | 115 | 162 | 193 | 202 | 201 | 184 | 162 |
| UTE | 188 | 258 | 321 | 372 | 387 | 378 | 361 | 318 | 266 |
| TE | 96 | 165 | 232 | 287 | 315 | 312 | 292 | 245 | 191 |
| SFE/USFE | 0.544 | 0.529 | 0.550 | 0.667 | 0.755 | 0.814 | 0.841 | 0.855 | 0.857 |
| UTE/USFE | 1.453 | 1.463 | 1.532 | 1.529 | 1.517 | 1.522 | 1.510 | 1.480 | 1.407 |
| Al+ | Y | Zr | Nb | Mo | Tc | Ru | Rh | Pd | Ag |
| USFE | 59 | 121 | 181 | 243 | 265 | 257 | 242 | 207 | 168 |
| SFE | 25 | 45 | 78 | 147 | 194 | 209 | 207 | 180 | 150 |
| UTE | 118 | 204 | 300 | 389 | 424 | 416 | 387 | 318 | 240 |
| TE | 59 | 132 | 220 | 301 | 353 | 357 | 326 | 254 | 182 |
| SFE/USFE | 0.429 | 0.376 | 0.432 | 0.606 | 0.730 | 0.814 | 0.855 | 0.870 | 0.892 |
| UTE/USFE | 2.000 | 1.683 | 1.657 | 1.604 | 1.596 | 1.618 | 1.598 | 1.537 | 1.428 |
| Al+ | Hf | Ta | W | Re | Os | Ir | Pt | Au | |
| USFE | 134 | 186 | 242 | 280 | 275 | 256 | 219 | 169 | |
| SFE | 60 | 83 | 137 | 195 | 218 | 219 | 197 | 158 | |
| UTE | 215 | 301 | 390 | 440 | 440 | 413 | 348 | 255 | |
| TE | 138 | 218 | 296 | 359 | 373 | 351 | 290 | 209 | |
| SFE/USFE | 0.443 | 0.448 | 0.568 | 0.698 | 0.794 | 0.858 | 0.902 | 0.934 | |
| UTE/USFE | 1.601 | 1.619 | 1.609 | 1.571 | 1.601 | 1.616 | 1.590 | 1.504 | |
| Al+ | Zn | Cd | In | Sn | Sb | Pb | Ge | Te | |
| USFE | 185 | 146 | 122 | 101 | 68 | 58 | 130 | 23 | |
| SFE | 159 | 136 | 111 | 90 | 66 | 53 | 112 | 20 | |
| UTE | 236 | 191 | 159 | 148 | 110 | 102 | 183 | 45 | |
| TE | 167 | 152 | 135 | 123 | 88 | 98 | 123 | 38 | |
| SFE/USFE | 0.859 | 0.930 | 0.906 | 0.889 | 0.971 | 0.926 | 0.862 | 0.859 | |
| UTE/USFE | 1.276 | 1.305 | 1.305 | 1.465 | 1.622 | 1.764 | 1.404 | 1.939 |
© 2018 by the authors. Licensee MDPI, Basel, Switzerland. This article is an open access article distributed under the terms and conditions of the Creative Commons Attribution (CC BY) license (http://creativecommons.org/licenses/by/4.0/).
Share and Cite
MDPI and ACS Style
Muzyk, M.; Pakieła, Z.; Kurzydłowski, K.J. Generalized Stacking Fault Energies of Aluminum Alloys–Density Functional Theory Calculations. Metals 2018, 8, 823. https://doi.org/10.3390/met8100823
AMA Style
Muzyk M, Pakieła Z, Kurzydłowski KJ. Generalized Stacking Fault Energies of Aluminum Alloys–Density Functional Theory Calculations. Metals. 2018; 8(10):823. https://doi.org/10.3390/met8100823
Chicago/Turabian StyleMuzyk, Marek, Zbigniew Pakieła, and Krzysztof J. Kurzydłowski. 2018. "Generalized Stacking Fault Energies of Aluminum Alloys–Density Functional Theory Calculations" Metals 8, no. 10: 823. https://doi.org/10.3390/met8100823
Note that from the first issue of 2016, this journal uses article numbers instead of page numbers. See further details here.