Tailoring of Microstructures and Tensile Properties in the Solidification of Al-11Si(-xCu) Brazing Alloys
by

Bruno Monti Carmelo Donadoni
1, 
Leonardo Fernandes Gomes
1,
Amauri Garcia
2 and
José Eduardo Spinelli
1,* 1
Department of Materials Engineering, Federal University of São Carlos, São Carlos, SP 13565-905, Brazil
2
Department of Manufacturing and Materials Engineering, University of Campinas—UNICAMP, Campinas, SP 13083-860, Brazil
*
Author to whom correspondence should be addressed.
Metals 2018, 8(10), 784; https://doi.org/10.3390/met8100784
Submission received: 12 September 2018
/
Revised: 23 September 2018
/
Accepted: 28 September 2018
/
Published: 30 September 2018
Abstract
:Ternary Al-11wt %Si-(xwt %)Cu alloys are highly recommended as commercial filler metals for aluminum brazing alloys. However, very little is known about the functional inter-relations controlling the solidified microstructures characterizing processes such as torch and furnace brazing. As such, we evaluated two commercial brazing alloys, which are the Al-11wt %Si-3.0wt %Cu and Al-11wt %Si-4.5wt %Cu alloys: Cu contents typically trend in between the suitable alloying spectrum. We analyzed the effects of solidification kinetics over features such as the dendrite arm spacing and the spacing between particles constituting the eutectic mixture. Also, tensile properties were determined as a function of the dendrite microstructure dimensions. The parameters concerned for translating the solidification kinetics were either the cooling rate, or growth velocity related to the displacement of the dendrite tip, or the eutectic front. The relevant scaling laws representing the growth of these brazing alloys are outlined. The experimental results demonstrated that a 50% increase in Cu alloying (from 3.0 to 4.5 wt %) could be operated in order to obtain significant variations in the dendritic length-scale of the microstructure across the produced parts. Overall, the microstructures were constituted by an α-Al dendritic matrix surrounded by a ternary eutectic consisting of α-Al + Al2Cu + Si. The scale measurements committed to the Al2Cu eutectic phase pointed out that the increase in Cu alloying has a critical role on refining the ternary eutectic.

1. Introduction
Over a wide range of mechanical and thermal applications, multicomponent alloys pertaining to Al–Si systems are most commonly fabricated through processes such as foundry, brazing, and welding [1]. The binary Al–Si alloys present a microstructure consisting of a primary phase, aluminum, or silicon, and a eutectic mixture of these two elements [2]. Silicon is added to aluminum alloys to promote good wear resistance, high heat transfer coefficient, and low thermal expansion coefficient. The addition of Cu to Al–Si alloys is widely used in automotive engine components, such as engine blocks, cylinder heads, and pistons, because of the good castability and fluidity of Al–Si–Cu alloys [1].
Al–Si–Cu ternary alloys are becoming increasingly important in the aerospace and automotive industries, due to their low relative weight and good mechanical strength at relatively high temperatures, and good resistance to abrasion and weldability. In general, Al–Si–Cu ternary alloys have higher mechanical strength than Al–Si alloys and higher corrosion resistance than Al–Cu alloys [3,4,5]. The increase in demand for materials with properties such as those of the Al–Si–Cu alloys, established the need to control the microstructure with more rigorous specifications. Therefore, good control of the solidification process is essential, since its influence can be noted even in the finished product [3,6]. According to Zeren et al. [7] more research efforts are necessary for a better understanding of the mechanisms responsible for strength variations in Al–Si–xCu alloys.
The solidification process and the intrinsic characteristics of the alloy to be solidified have a direct influence on the microstructure formation, which determines the final properties of a casting. The obtained casting parts exhibit mechanical characteristics that depend on inherent aspects occurring during solidification, such as: grain size, the scale of the phases forming the microstructure such as dendrite arm spacings and interphase spacings, the size and distribution of such phases, chemical composition heterogeneities, inclusions, and porosity. The understanding of solidification of aluminum alloys has fundamental importance for planning of manufacturing processes, since it allows a better understanding of the factors affecting microstructure, and consequently, the product quality [8,9,10,11,12,13].
For the manufacturing of castings with predefined local properties, a widely used process is foundry technology (metal/mold casting processes). The cooling rate related to the process of heat transfer from the casting into the mold is an aspect acting in parallel, which conditions the change of the size and distribution of individual components within the resulting microstructure. The kind of crystallizing phases and the process of nucleation and growth of grains are influenced by the cooling rate. Affecting the mechanical properties, particularly for the reduction of plastic deformation in Al–Si–Cu alloys, the presence of copper also induces the formation of intermetallic phases, such as Al2Cu [14]. Additionally, intermetallic phases can be crystallized due to the presence of impurities such as Fe in these alloys, degrading the mechanical properties of castings [14]. Commercial alloys such as 384.0 and A384.0 series, Al9Si3Cu(Fe) and ENAC 46000 are recommended for the die casting processes, and these alloys are in the range of between 10.5 to 12.0 wt % Si, and 3.0 to 4.5 wt % Cu [15].
Ceschini et al. [16] performed a study on the production of cast specimens of Al-10wt %Si-2wt %Cu alloy under controlled solidification conditions. The aim was to have samples that were associated with two values of secondary dendrite arm spacing (SDAS), of about 10 μm and 50 μm. The effect of the cooling rate and different Fe and Mn contents on the microstructure was evaluated, and consequently, the tensile and the fatigue properties of the Al-10wt %Si-2wt %Cu casting alloy were determined. The results showed that the cooling rate affected not only the SDAS values, but also the shape of the eutectic Si particles, and the size and volume fraction of the intermetallic compounds. A reduction of SDAS induced higher ultimate tensile strength (UTS) and elongation (EL) to the failure to be obtained. The highest UTS and EL reached 374 MPa and 12.1% for the alloy containing 0.5 wt % Fe and SDAS of 10 μm. On the contrary, in the samples with smaller SDAS, the EL degraded with increasing Fe and Mn contents, due to the larger volume fraction of Fe-rich intermetallic compounds [16]. Wang et al. [17] proposed an alternative Al-13wt %Si-5wt %Cu-0.8wt %Fe alloy fabricated by metal/mold casting followed by a T6 solid solution heat treatment. The UTS and EL values reached 336 MPa and 0.72%, respectively. Even though obvious correlations between such properties and the microstructural features have been declared, no functional correlations have been proposed.
By seeking available functional types of correlations between mechanical strength and dendritic spacing, one could refer to the research developed by Okayasu et al. [18]. These authors reported excellent tensile properties for twin roll and Ohno continuous casting of Al-10.6wt %Si-2.5wt %Cu alloy samples, that is, UTS and EL at around 375 MPa and 10%, respectively. These properties have been associated with the fine round α-Al phase and tiny eutectic structures. A clear Hall–Petch relation has been derived, relating the yield tensile strength to the SDAS: σy=0.2 = 6.1(SDAS)−1/2 + 48.5, where σy (MPa) and SDAS (µm).
Another important process technique is the joining process of aluminum alloys. Al–Si–Cu ternary alloys are also included among the alloys used for brazing [15]. Brazing of aluminum alloys is considered to be difficult due to the low melting temperature of Al alloys and the high affinity of Al to oxygen. As a reliable and economical method for the bonding of aluminum alloys, brazing with Al–Si alloys has been adopted among a variety of joining techniques. Commercial aluminum brazes such as BAlSi-3 and BAlSi-4, with silicon contents between 7 and 13 wt % Si, have demonstrated some success in joining some Al alloys if the corrosion–chemical and mechanical strength aspects are considered. The working temperatures of these Al brazing alloys must be above 590 °C, due to the fact that these Al brazes having melting temperatures in the range of 575–610 °C. Hence, an important goal of the aluminum industry is the development of low-melting-point filler metals [19]. The interaction between the joint components and growth of the intermetallic compounds at the joint interface can be prevented by shorter brazing cycles/lower brazing temperature [20].
The solidification path of any typical aluminum alloy is modified by the addition of major and minor alloying elements, and these have a significant impact on the final microstructure [21]. With copper addition to the Al–Si alloy, the solute is rejected from both of the eutectic constituents. The equilibrium melting point changes locally from a low value at the interface in the direction of the higher liquidus temperature for the alloy, caused by solute segregation ahead of the eutectic interface. The melt in this boundary layer is constitutionally undercooled, when the actual temperature of the melt is less than the equilibrium liquidus temperature. Other changes might be expected by modifying the equilibrium liquidus temperature. This includes variations in the surface tension affecting the wetting angle between the nuclei present in the boundary solid layer and the melt, and changes in the chemical driving force for nucleation. Fundamentally, significant changes can be expected in the nucleation behavior of the Al–Si eutectic due to ternary solute segregation [22]. Kaya and Aker [23], for instance, demonstrated, through experimental data, that the Si flakes forming an Al–Si eutectic alloy could change with alloying elements. Additions of Cu, Co, Ni, Sb, and Bi to an Al-12.6% Si eutectic alloy resulted in finer Si flakes.
A study was carried out by Chang et al. [19], where Al-10.8wt %Si-10wt %Cu, and Al-9.6wt %Si-20wt %Cu filler metals were used for the brazing of 6061 aluminum alloy at 560 °C. The results demonstrated that the addition of 10 wt % of copper into the Al-12wt %Si filler metal lowered the solidus temperature from 586 °C to 522 °C, and the liquidus temperature from 592 °C to 570 °C. With the increase in copper content to 20 wt % into the Al-12wt %Si filler metal, the liquidus temperature decreased from 592 °C to 535 °C. The highest value obtained for the shear strength referred to the 6061 Al alloy brazed with the Al-10.8wt %Si-10wt %Cu filler metal, which reached 67 MPa for a 60 min brazing time. According to these authors, the higher hardness of the 6061 aluminum alloy subtract near the butt joint interface after brazing with Al–Si–Cu filler metal could be associated with the formation of Al2Cu intermetallic compounds, due to the fact that copper diffuses towards the 6061 Al alloy [19].
To further optimize the brazing processes associated with the aforementioned Al alloy, the development of a better understanding of the solidification characteristics of Al–Si–Cu alloys could assist with optimization of the brazing process parameters. The aim of the present work was to perform a detailed characterization of the microstructure of an Al-11wt %Si alloy with additions of 3.0 and 4.5 wt % of copper (Cu), directionally solidified (DS) under transient heat flow conditions. This means describing the morphologies, dimensions, and representative features of the eutectic phases for a wide range of solidification cooling rates. Both dendritic and eutectic length-scales of the microstructure were assessed. Correlations between the tensile properties, hardness, the dendritic arm spacing, and the spacing between particles constituting the eutectic were also investigated. Finally, advanced X-ray Diffraction (XRD) and Scanning Electron Microscopy with Energy Dispersive Spectroscopy (SEM-EDS) techniques were performed to determine the main characteristics of the eutectic phases formed along the length of the DS castings.
2. Experimental Procedure
2.1. Experiment to Follow Solidification Kinetics
The Al-11wt %Si-3.0wt %Cu and Al-11wt %Si-4.5wt %Cu alloy castings were generated using a transient directional solidification system. A quantity of 1200 g of commercial purity Al, Si, and Cu was firstly melted in a dense high purity graphite crucible by induction heating up to 750 °C in order to melt the Al and homogenize the other elements by diffusion. Then, the temperature was reduced to 700 °C and held for 30 min before the directional solidification procedure. A detailed description of processing by transient directional solidification is given elsewhere [24,25]. Iron (Fe) was found to be the main impurity in the tested samples, which remained inside the suitable commercial Fe wt % spectrum of 0.205 ± 0.065. Detailed descriptions of extraction of samples from the DS castings for metallography and mechanical tests are given elsewhere [12].
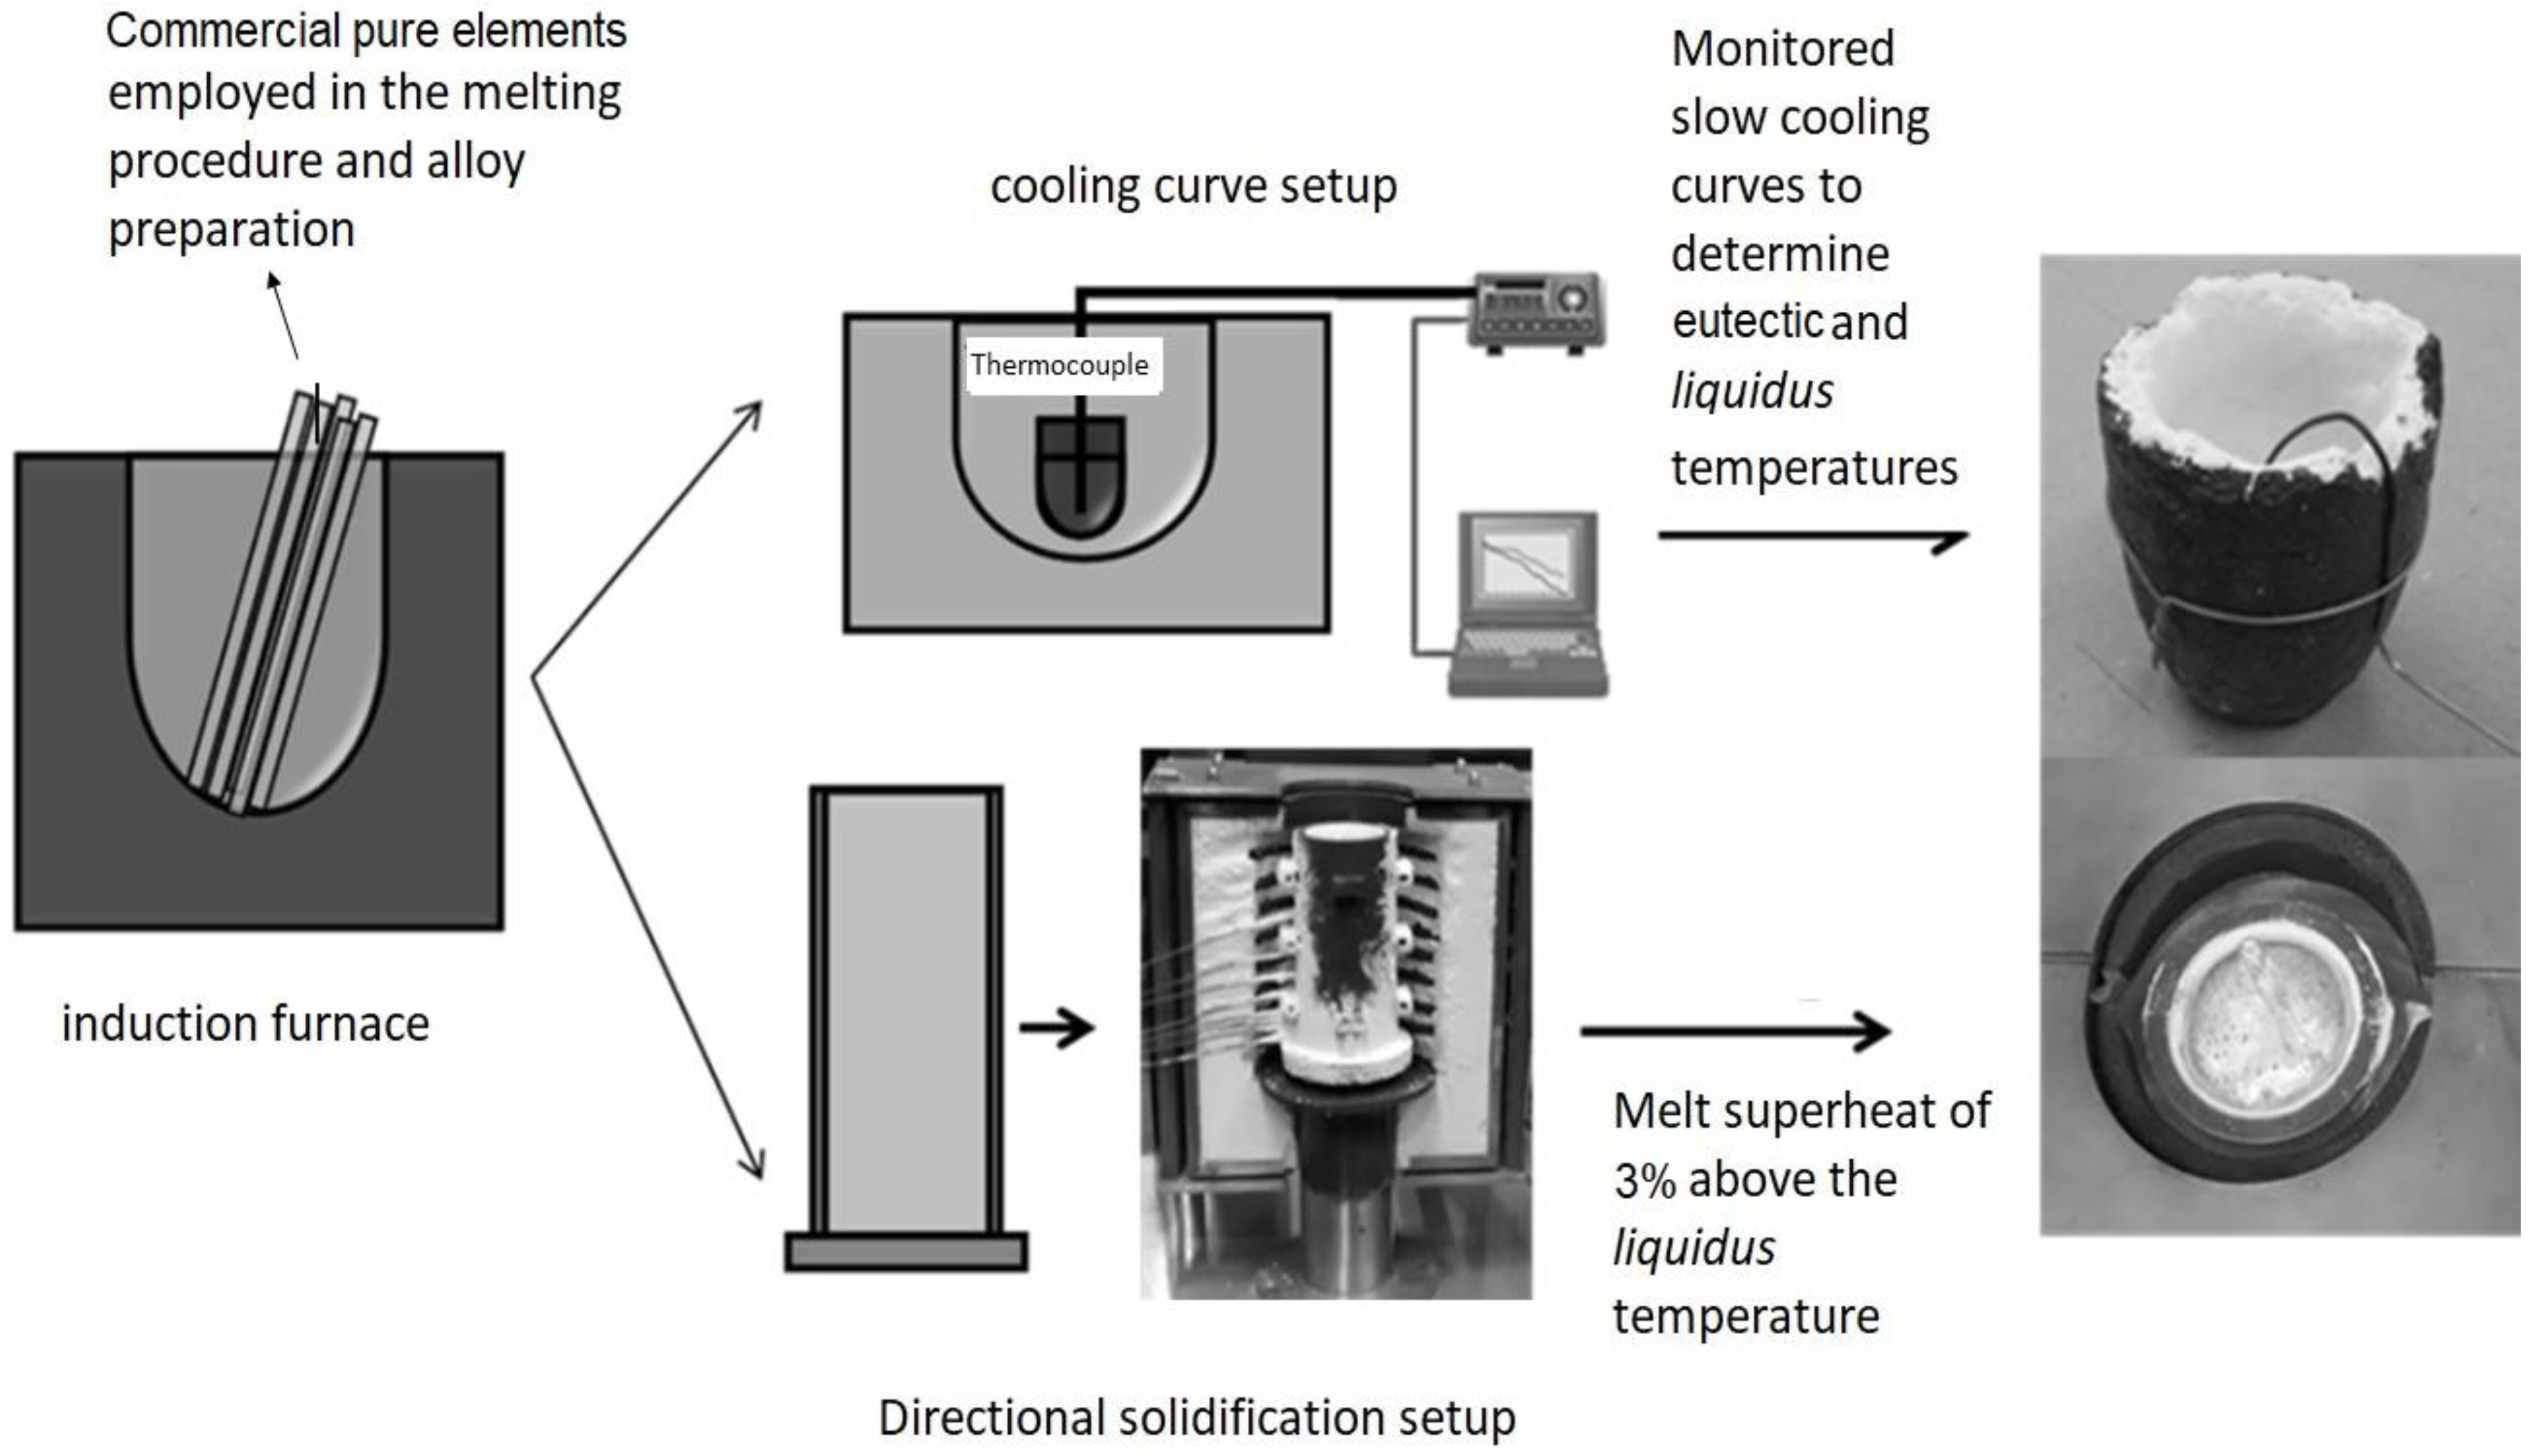
Liquidus and eutectic temperatures were determined for the two Al–Si–Cu based alloys through experiments in which the alloy was slowly cooled in a well-insulated crucible, thus permitting the transformation temperatures to be determined, as illustrated in Figure 1.
The Al alloys were first melted in an induction furnace. After that, the molten alloy was poured into two cavities; that is, either a crucible dedicated to the determination of cooling curves or a split mold inserted into the solidification system. A remelting operation of the alloy was run inside the mold since radial electrical wiring heated up the cylindrical stainless steel split mold (see Figure 1). When the melt temperature achieved 3% above the liquidus temperature, the furnace windings were disconnected, and at the same time, the external water flow at the bottom of the container began the cooling down procedure, thus permitting the onset of solidification.
The solidification system permits the placing of a number of fine K-type thermocouples along the length of the casting. Eight thermocouples were strategically spaced between each other until they were 96 mm from the cooled bottom of the casting. The frequency of temperature data acquisition was 1 Hz on each thermocouple. Postmortem examination regarding the determination of exact positions of the thermocouple tips was carried out.
2.2. Microstructural Characterization and Tensile Tests
The macrostructure of each directionally solidified (DS) casting was revealed after assessing and grinding the whole longitudinal middle section surface with #600 grid paper. The etching solution used was composed of 95 mL of distilled water, 2.5 mL of HNO3, 1.5 mL of HCl, and 1 mL of HF, which was applied for a couple of seconds.
Longitudinal and transverse samples at various positions from the cooled bottom of the DS castings were mounted (i.e., 3 mm, 8 mm, 13 mm, 18 mm, 23 mm, 33 mm, 48 mm, 68 mm, and 88 mm), polished, and etched with a solution of 0.5% HF in water over 20 s, and then examined using an optical microscope (Olympus Co., Tokyo, Japan). The length-scale of the dendritic matrix was characterized by the primary (λ1), secondary (λ2), and tertiary (λ3) dendritic arm spacings. Forty measurements were performed for each microstructural spacing of each selected position when a certain alloy composition is considered.
One of the targets of the present study was to correlate the dendrite spacing with the tensile properties measured in uniaxial tensile tests of the examined ternary Al–Si–Cu alloys. In order to obtain these measurements, several specimens were extracted along the length of the DS alloy castings. Each specific position chosen for tensile tests allowed three specimens to be extracted so that the average tensile properties regarding strength and ductility and their standard deviations could be determined. These specimens were subjected to tensile tests according to specifications of the ASTM Standard E 8M/04 at a strain rate of about 3 × 10⁻³ s−1. Microhardness tests were performed on the transversal sections of the DS samples, using a test load of 1000 g and a dwell time of 10 s. The adopted Vickers microhardness (Hardness tester, Shimadzu, Kyoto, Japan) was the average of at least 10 indentation tests on each sample.
The sizes of the eutectic phases were examined through a scanning electron microscope (SEM). Back-scattered electron (BSE) examinations were carried on deep etched samples (HCl over three minutes). The instrument used was a Philips SEM (XL-30 FEG, FEI, Hillsboro, OR, USA) equipped with an energy dispersive X-ray spectrometer (EDS). An analysis of the SEM images allowed the measurements of the spacing of the Al2Cu particles, λAl2Cu as well those between the eutectic Si particles, λSi. Measurements of the eutectic-related spacings, λAl2Cu and λSi, were performed using the line intercept method [13,23]. Considering that the Al–Si eutectic has an anomalous structure, approximately 20–30 minimum spacing, λm, and maximum spacing, λM, values were measured in the various positions along the length of the DS castings in order to obtain the average λSi. The average spacing λSi is the arithmetic average between λm and λM.
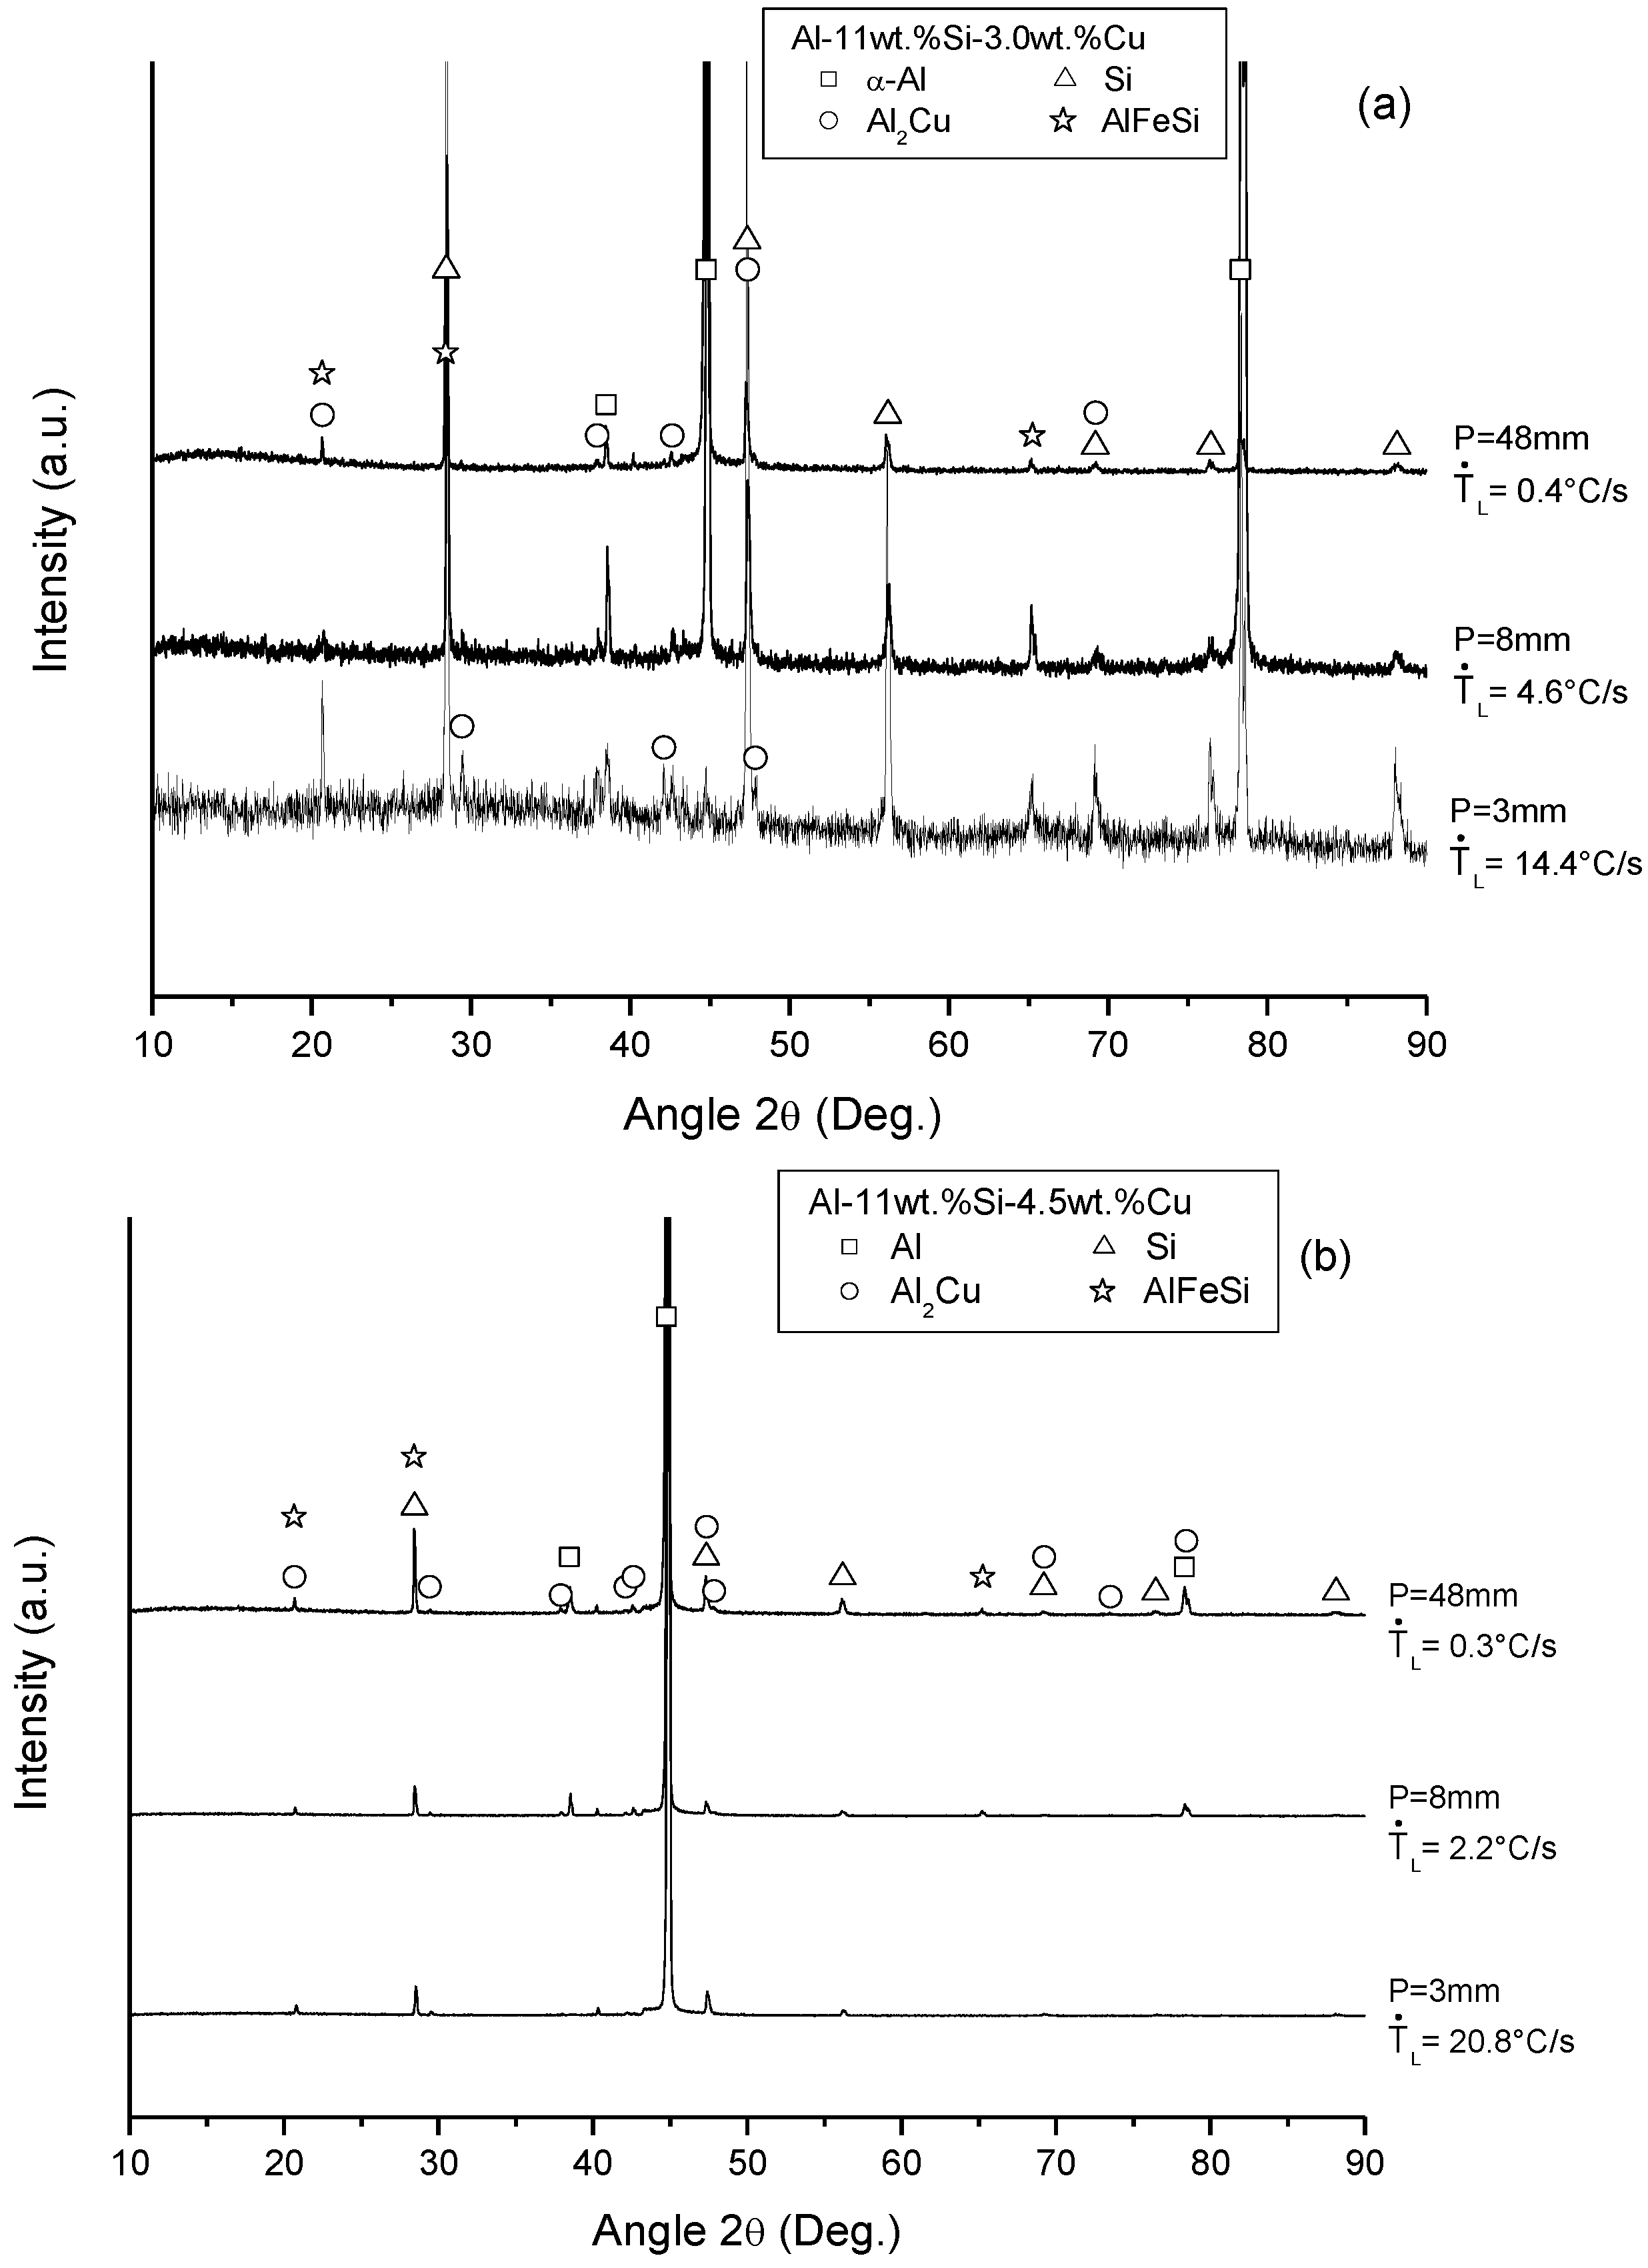
The X-ray diffraction (XRD) patterns of phases formed along the length of the Al–Si–Cu alloy castings were acquired by a Siemens D5000 diffractometer (Siemens, Munich, Germany) with a 2-theta range from 20° to 90°, CuKα radiation and a wavelength, λ, of 0.15406 nm.
3. Results and Discussion
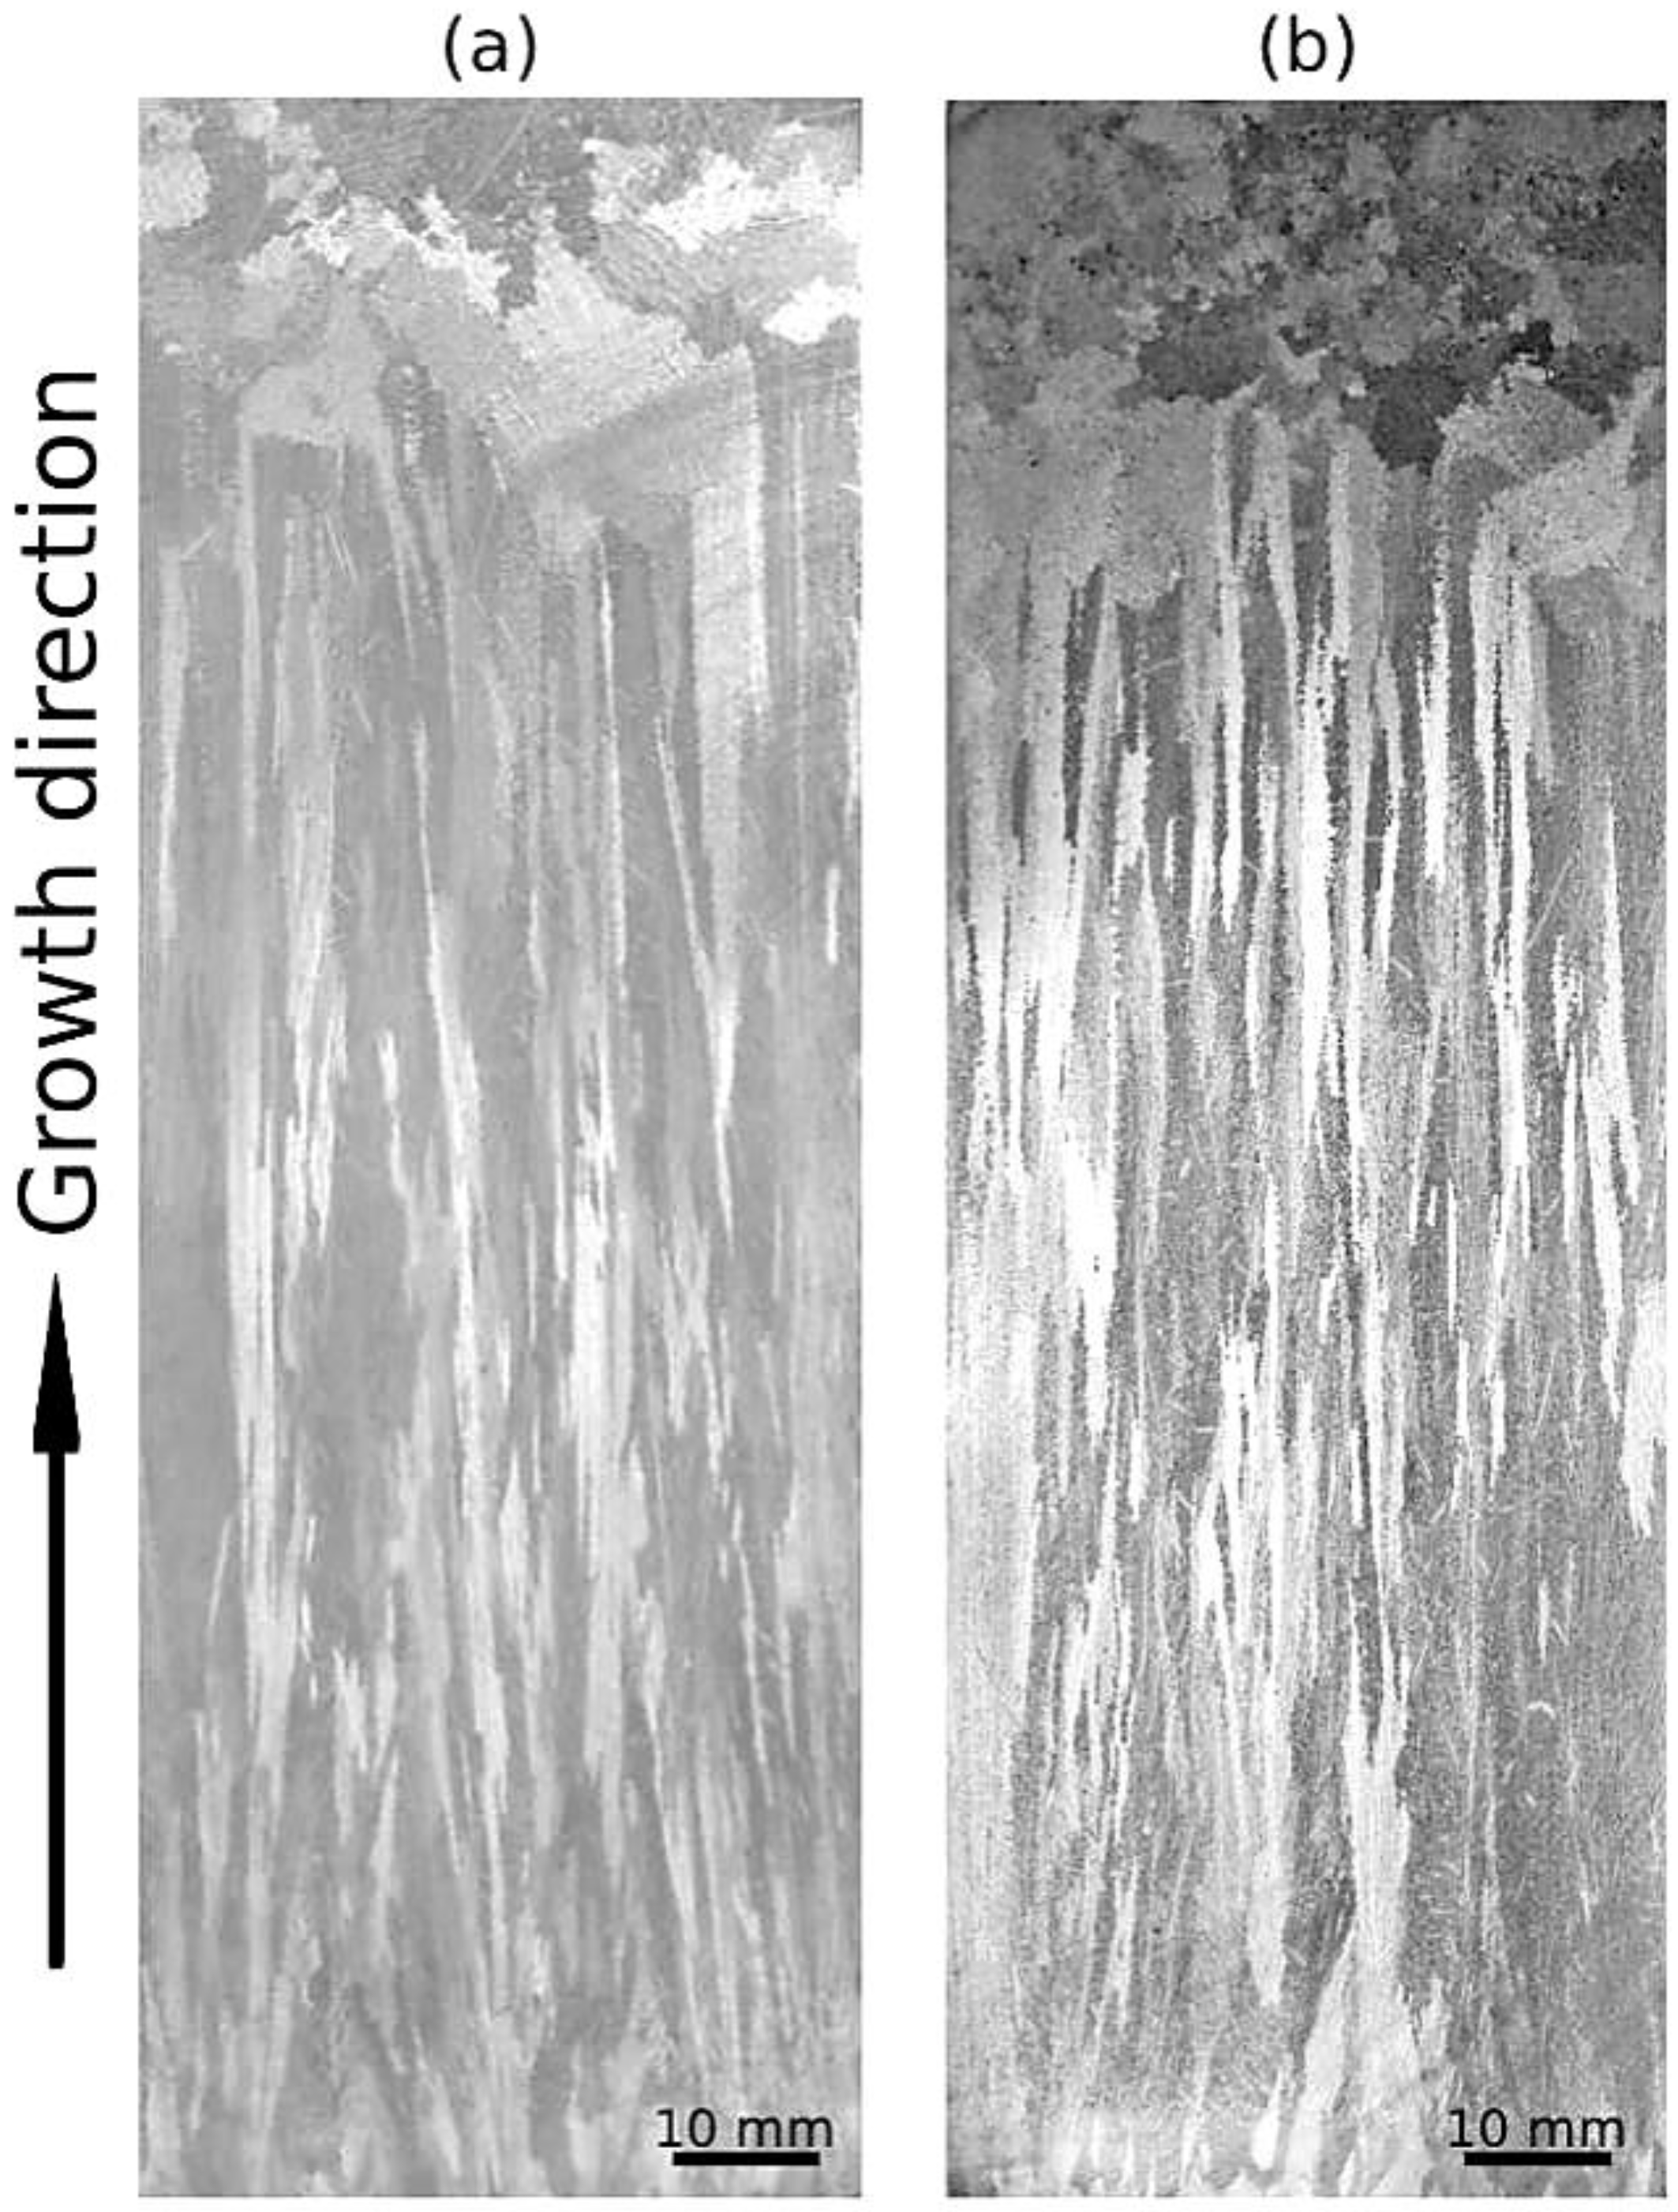
The as-cast macrostructures depicted in Figure 2 revealed the prevalence of very fine columnar grains after chemical etching of the DS Al-11wt %Si-3.0 and -4.5wt %Cu alloy castings. Such macro-morphologies prevailed along the entire length of the casting with a few equiaxed grains produced at the very top of the castings. These structures enabled a wide-ranging examination of the fabricated castings, with emphasis on the formed dendritic arrangements. The longitudinal sections could be assessed for the growth of secondary dendrite branches, whereas the cross sections along the length of the DS bodies were useful for the determination of either primary or tertiary dendritic spacing. The growth of well-aligned columnar structures also signifies that the heat flow during solidification remained unidimensionally driven.
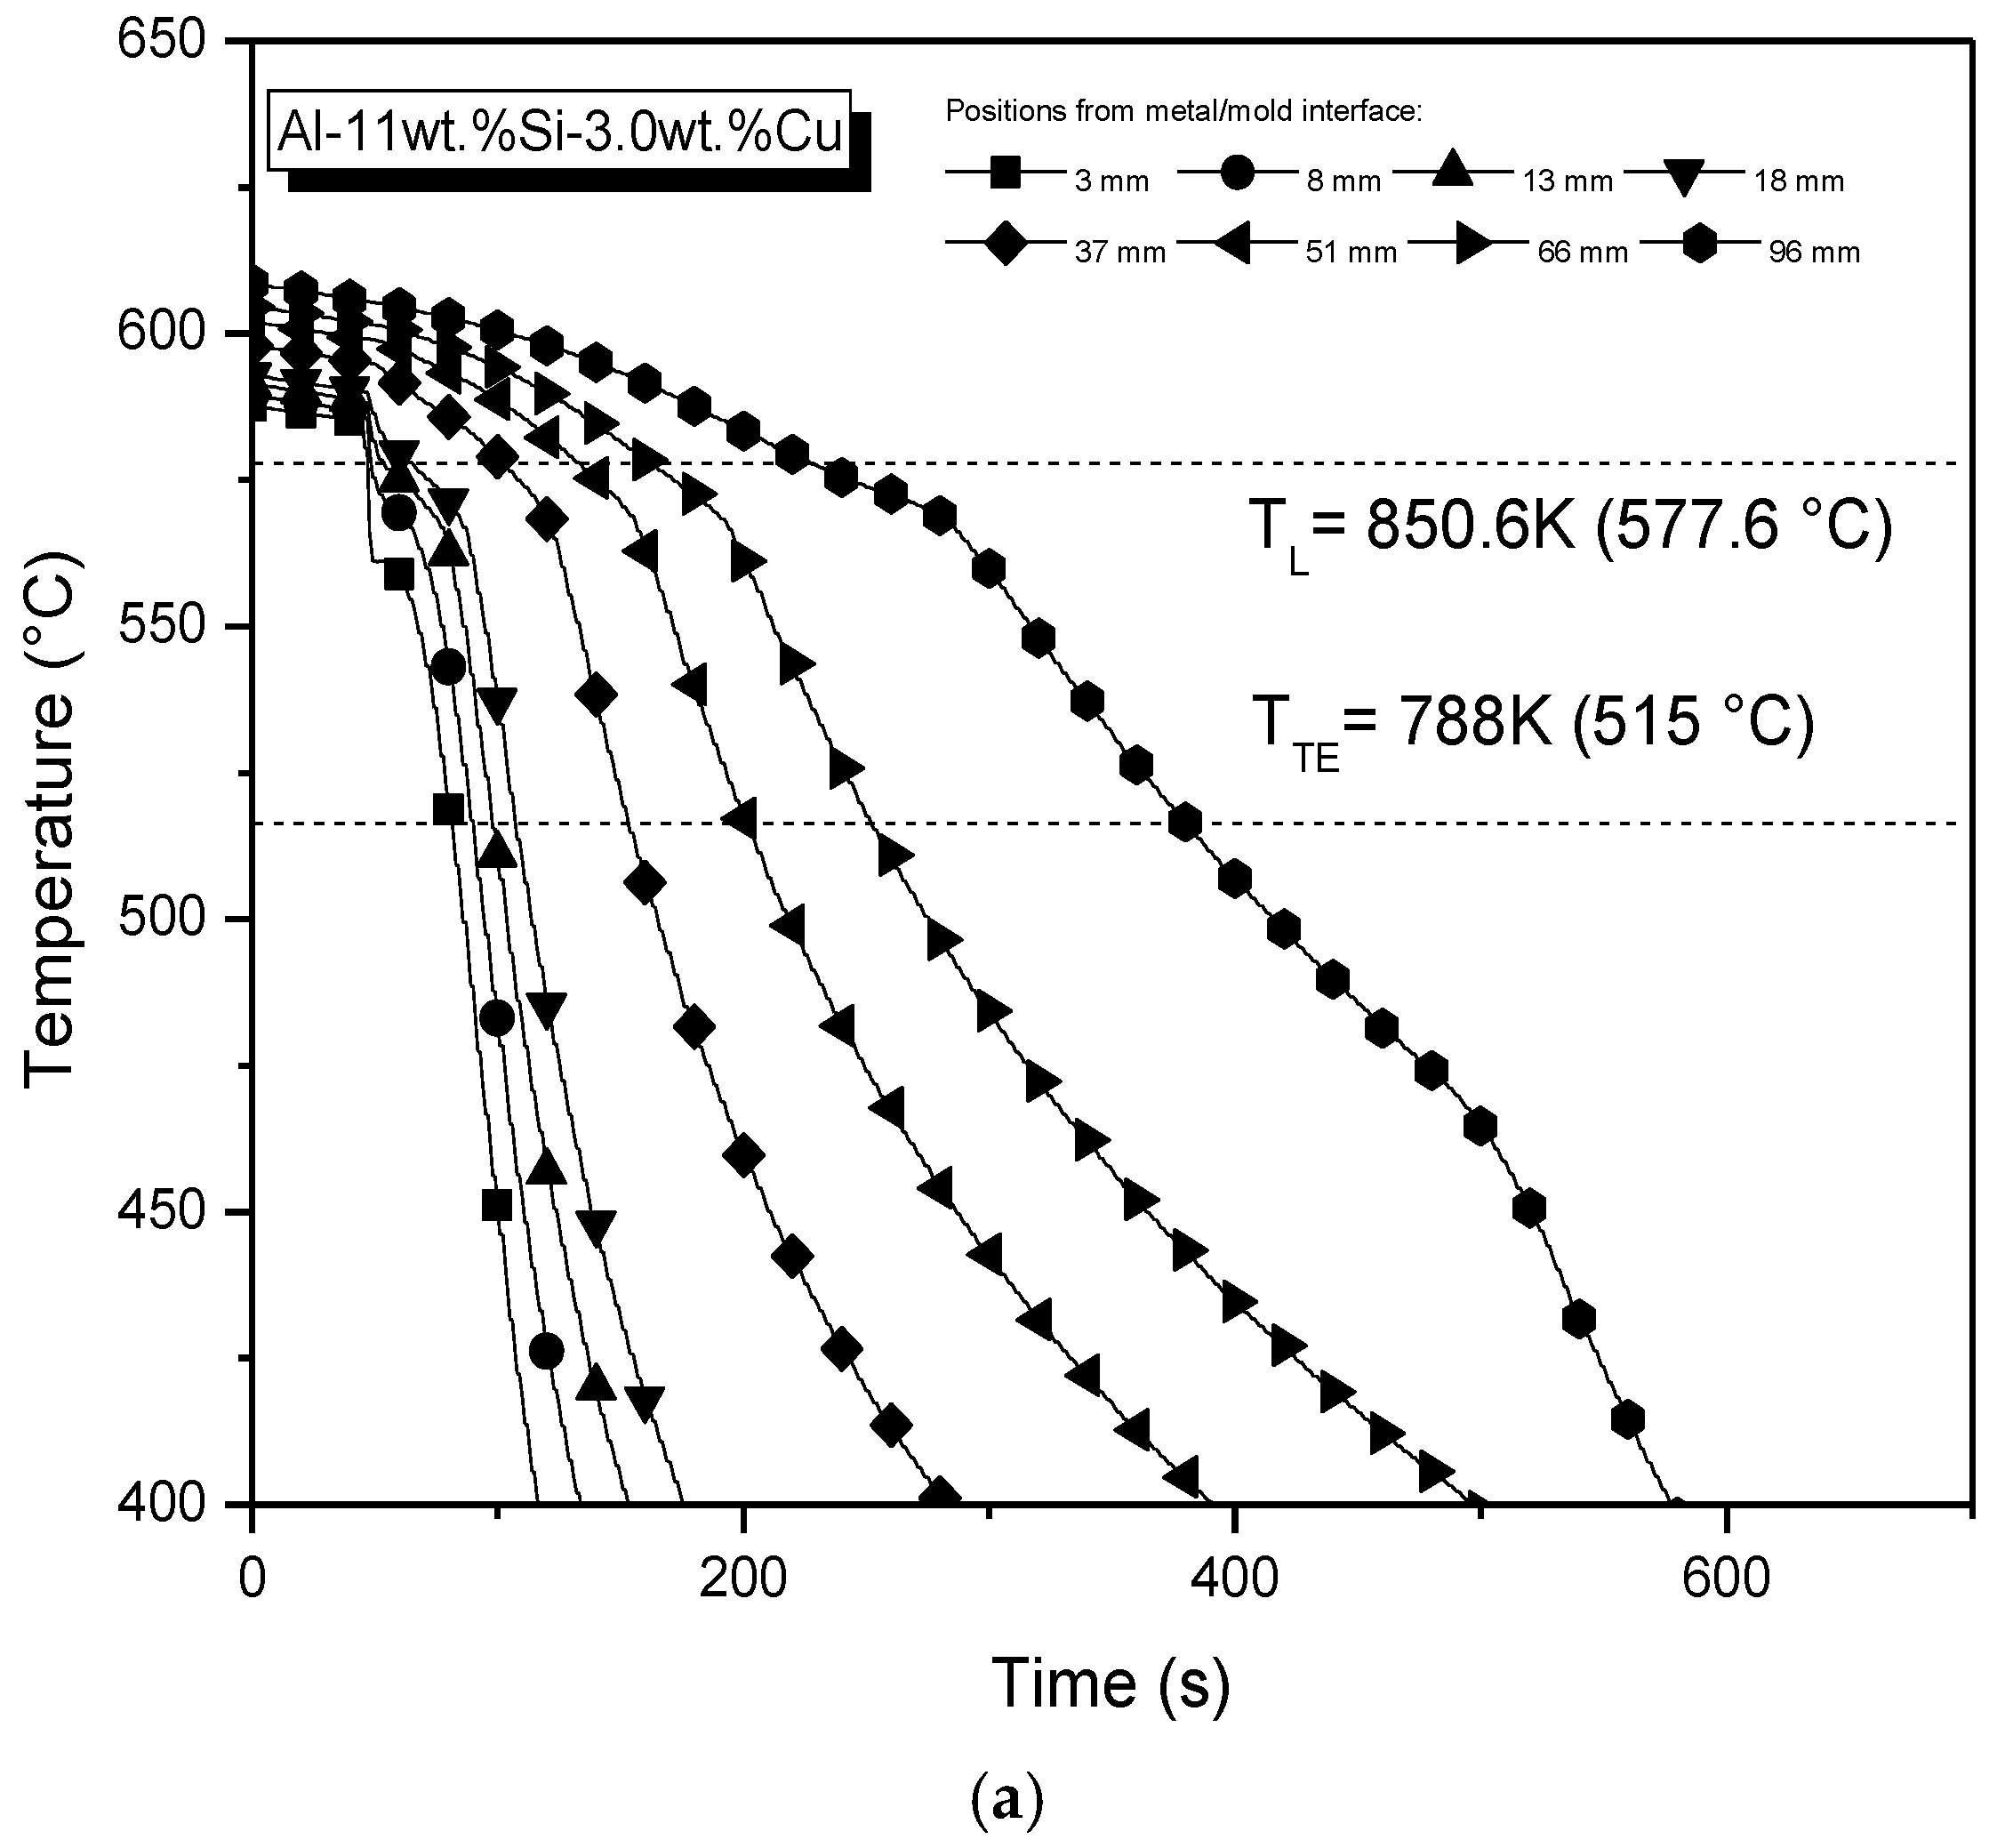
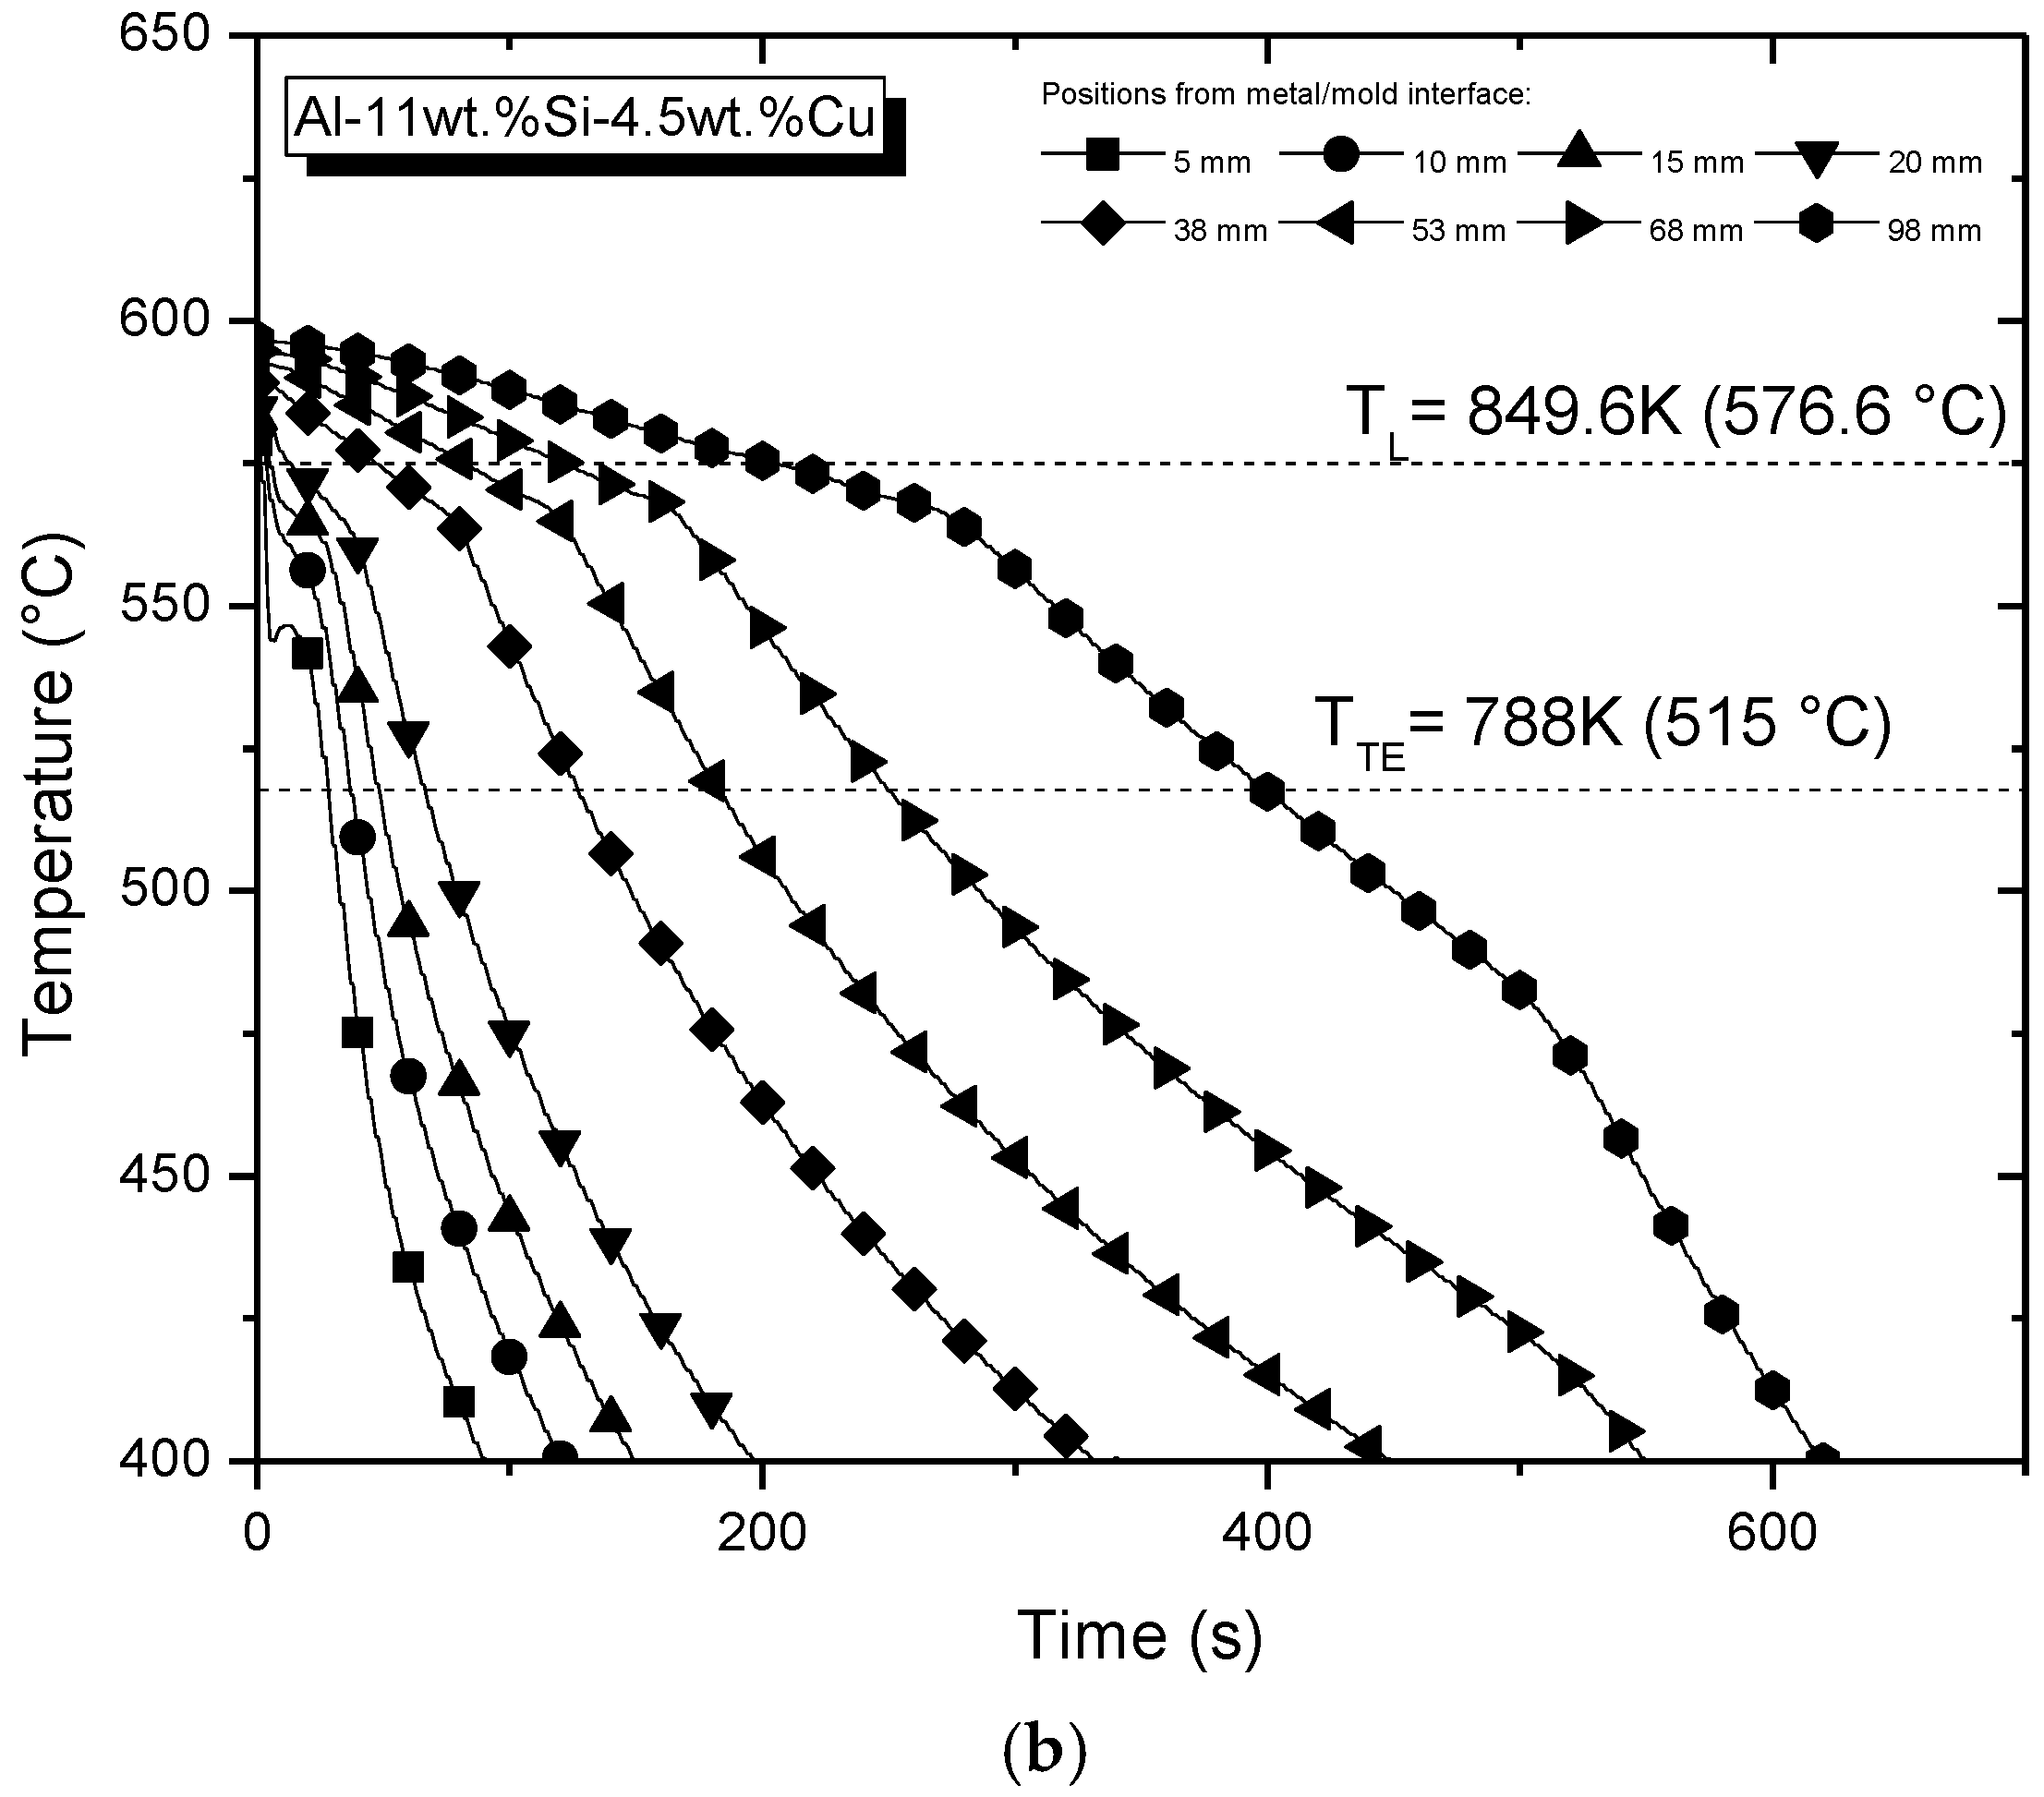
From the start of the water flow in the directional solidification experiment and considering the recording of experimental data, Figure 3 shows the variations of temperature that occurred for each thermocouple within the castings. It is worth noting that for thermocouples near the water-cooled surface, temperature changes quickly, whereas variation was much slower for positions monitored farther from the bottom cooled surface. The proper evaluation of these cooling curves provided the experimental variations of solidification cooling rates and growth velocities, as is presented next.
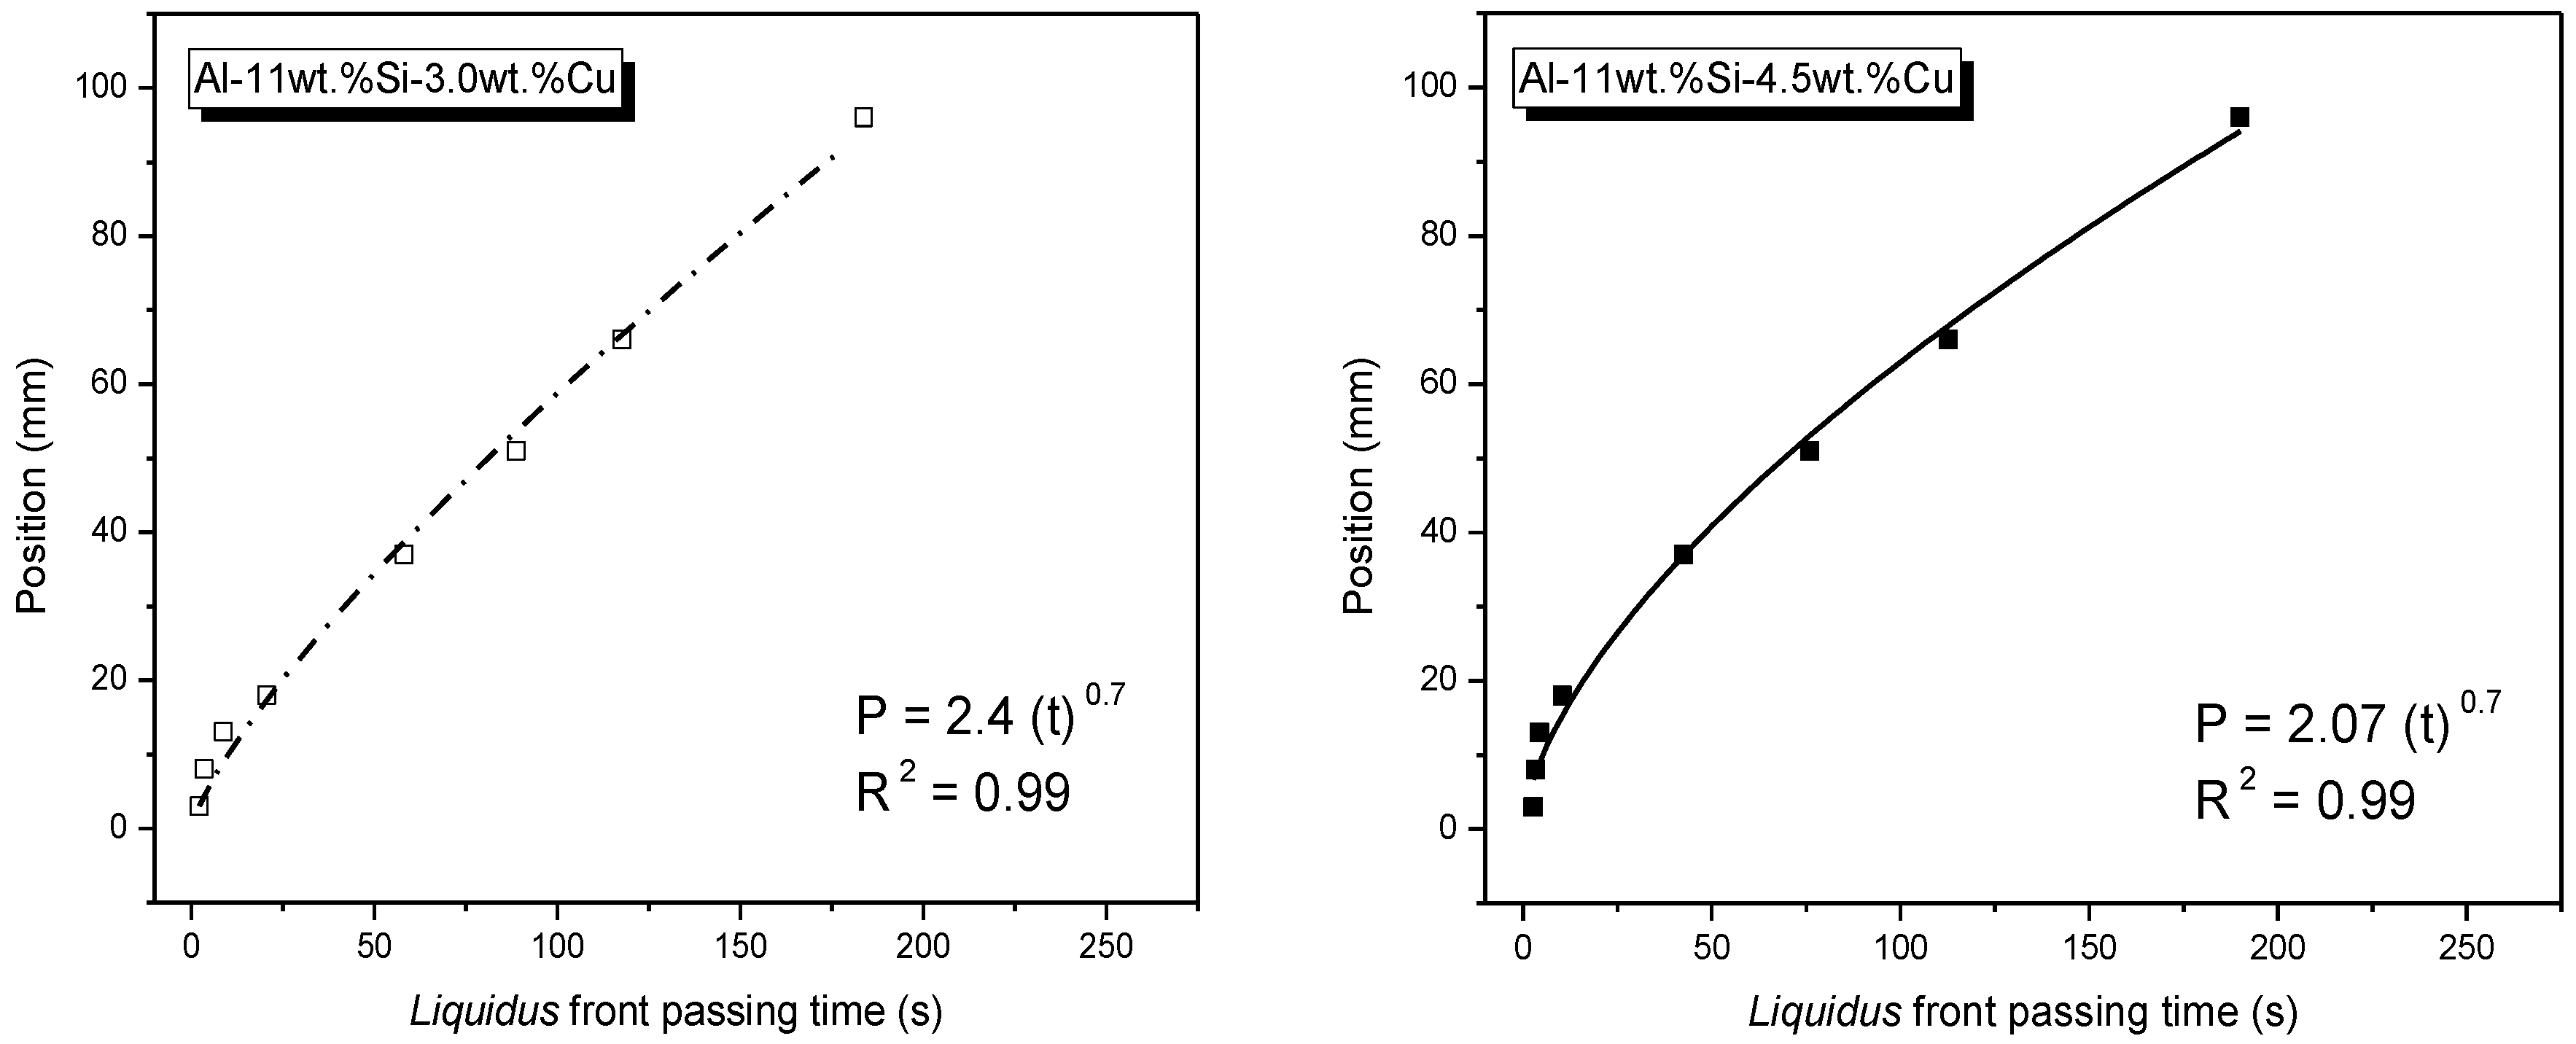
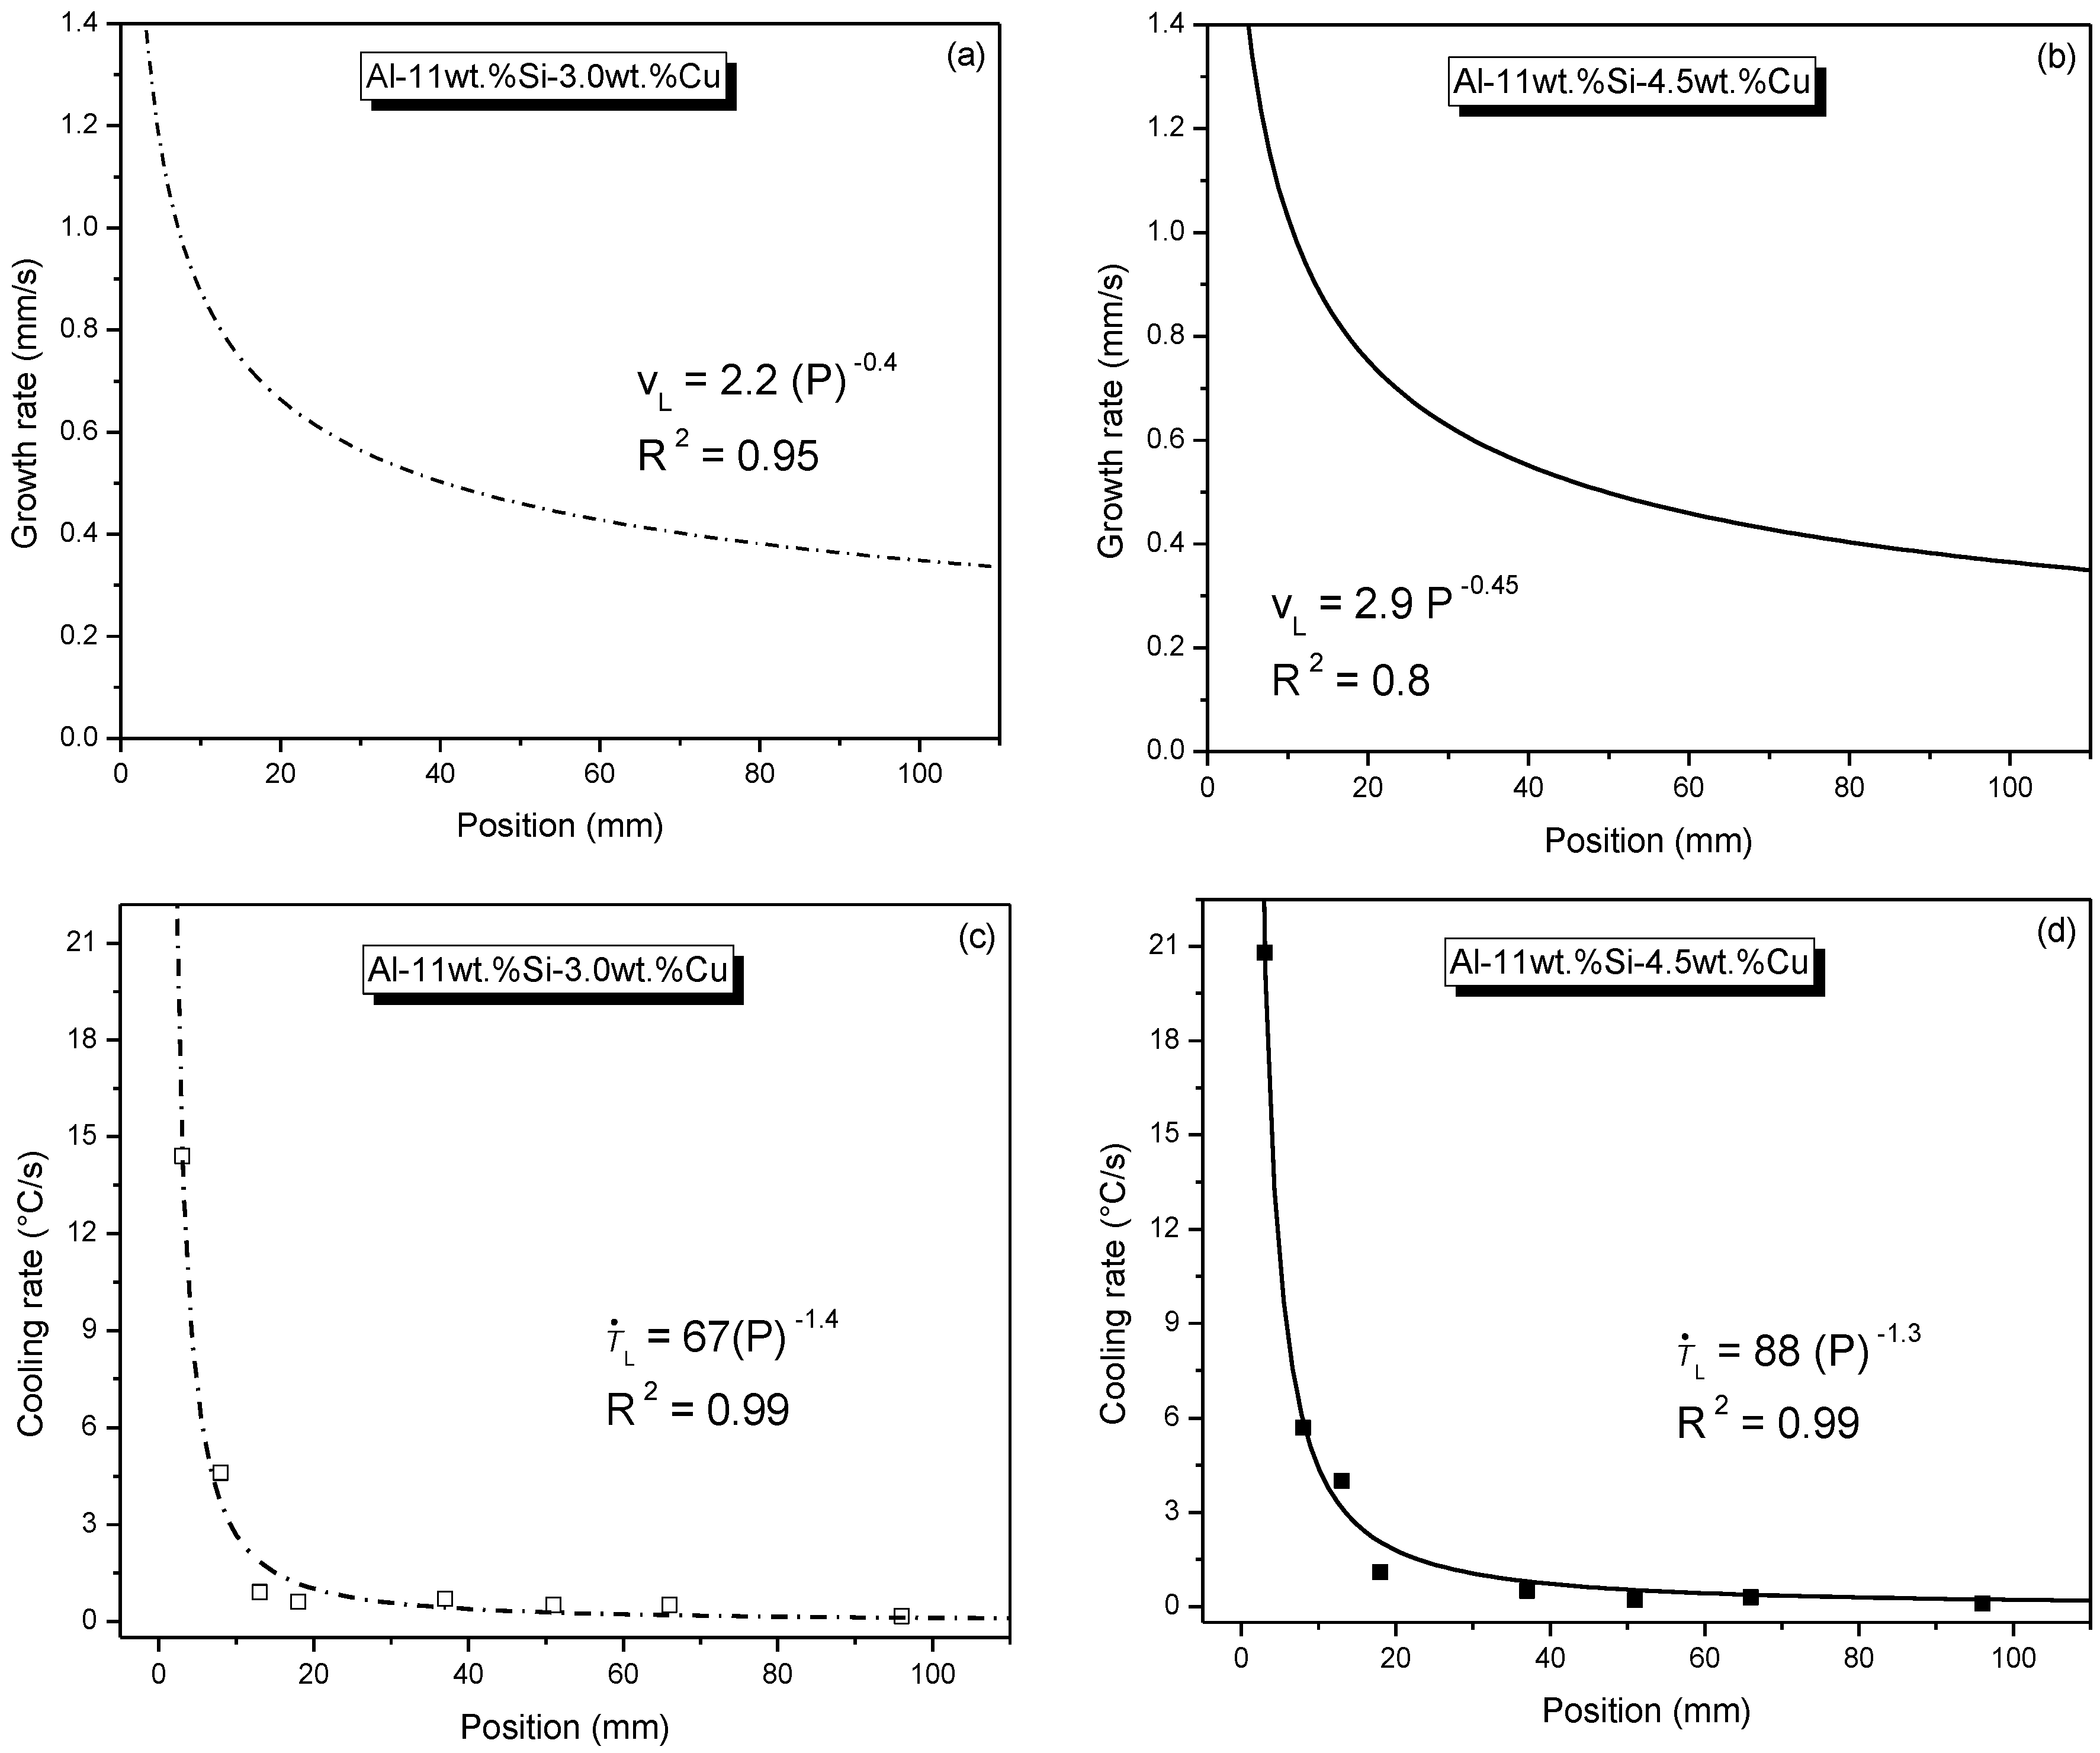
Figure 4 shows the time evolutions of the liquidus front along the lengths of both the Al-11wt %Si-3.0wt %Cu and Al-11wt %Si-4.5wt %Cu alloy castings during cooling. These plots were generated by the previous information on the liquidus temperatures of each alloy, and by monitoring their transit on each of the engaged thermocouples at various positions (P) along the length of the casting. As a consequence of these plots, growth velocities (vL) experimental tendencies in Figure 5a,b were established for both evaluated alloys. These vL values are direct results of the time-derivatives of the experimental functions in Figure 4. vL represents the rate of displacement of the liquidus isotherm (vL). There is no significant change between the vL plots of both examined alloys. Analogously, rates of displacements of the Al–Si binary eutectic (vBE) and of the Al–Si–Al2Cu ternary eutectic (vTE) could be obtained from the cooling curve analyses of both alloys. The calculation of such velocities is very important, since their magnitude is directly related to the eutectic scales and the morphology developed from each eutectic reaction.
The determination of the tip cooling rate, ṪL, as a function of position (P) in the casting was carried out by computing the time-derivative of each cooling curve (dT/dt) right after the passage of the liquidus isotherm by each thermocouple. A large spectrum of cooling rates can be seen in Figure 5c,d. Further, when comparing the cooling-down regimes of both alloys it can be observed that the alloy containing higher Cu content is associated with higher levels of cooling rates. Although the Cu contents here lie inside the commercial spectrum of braze Al fillers, the levels of the cooling rates of each alloy differ from each other.
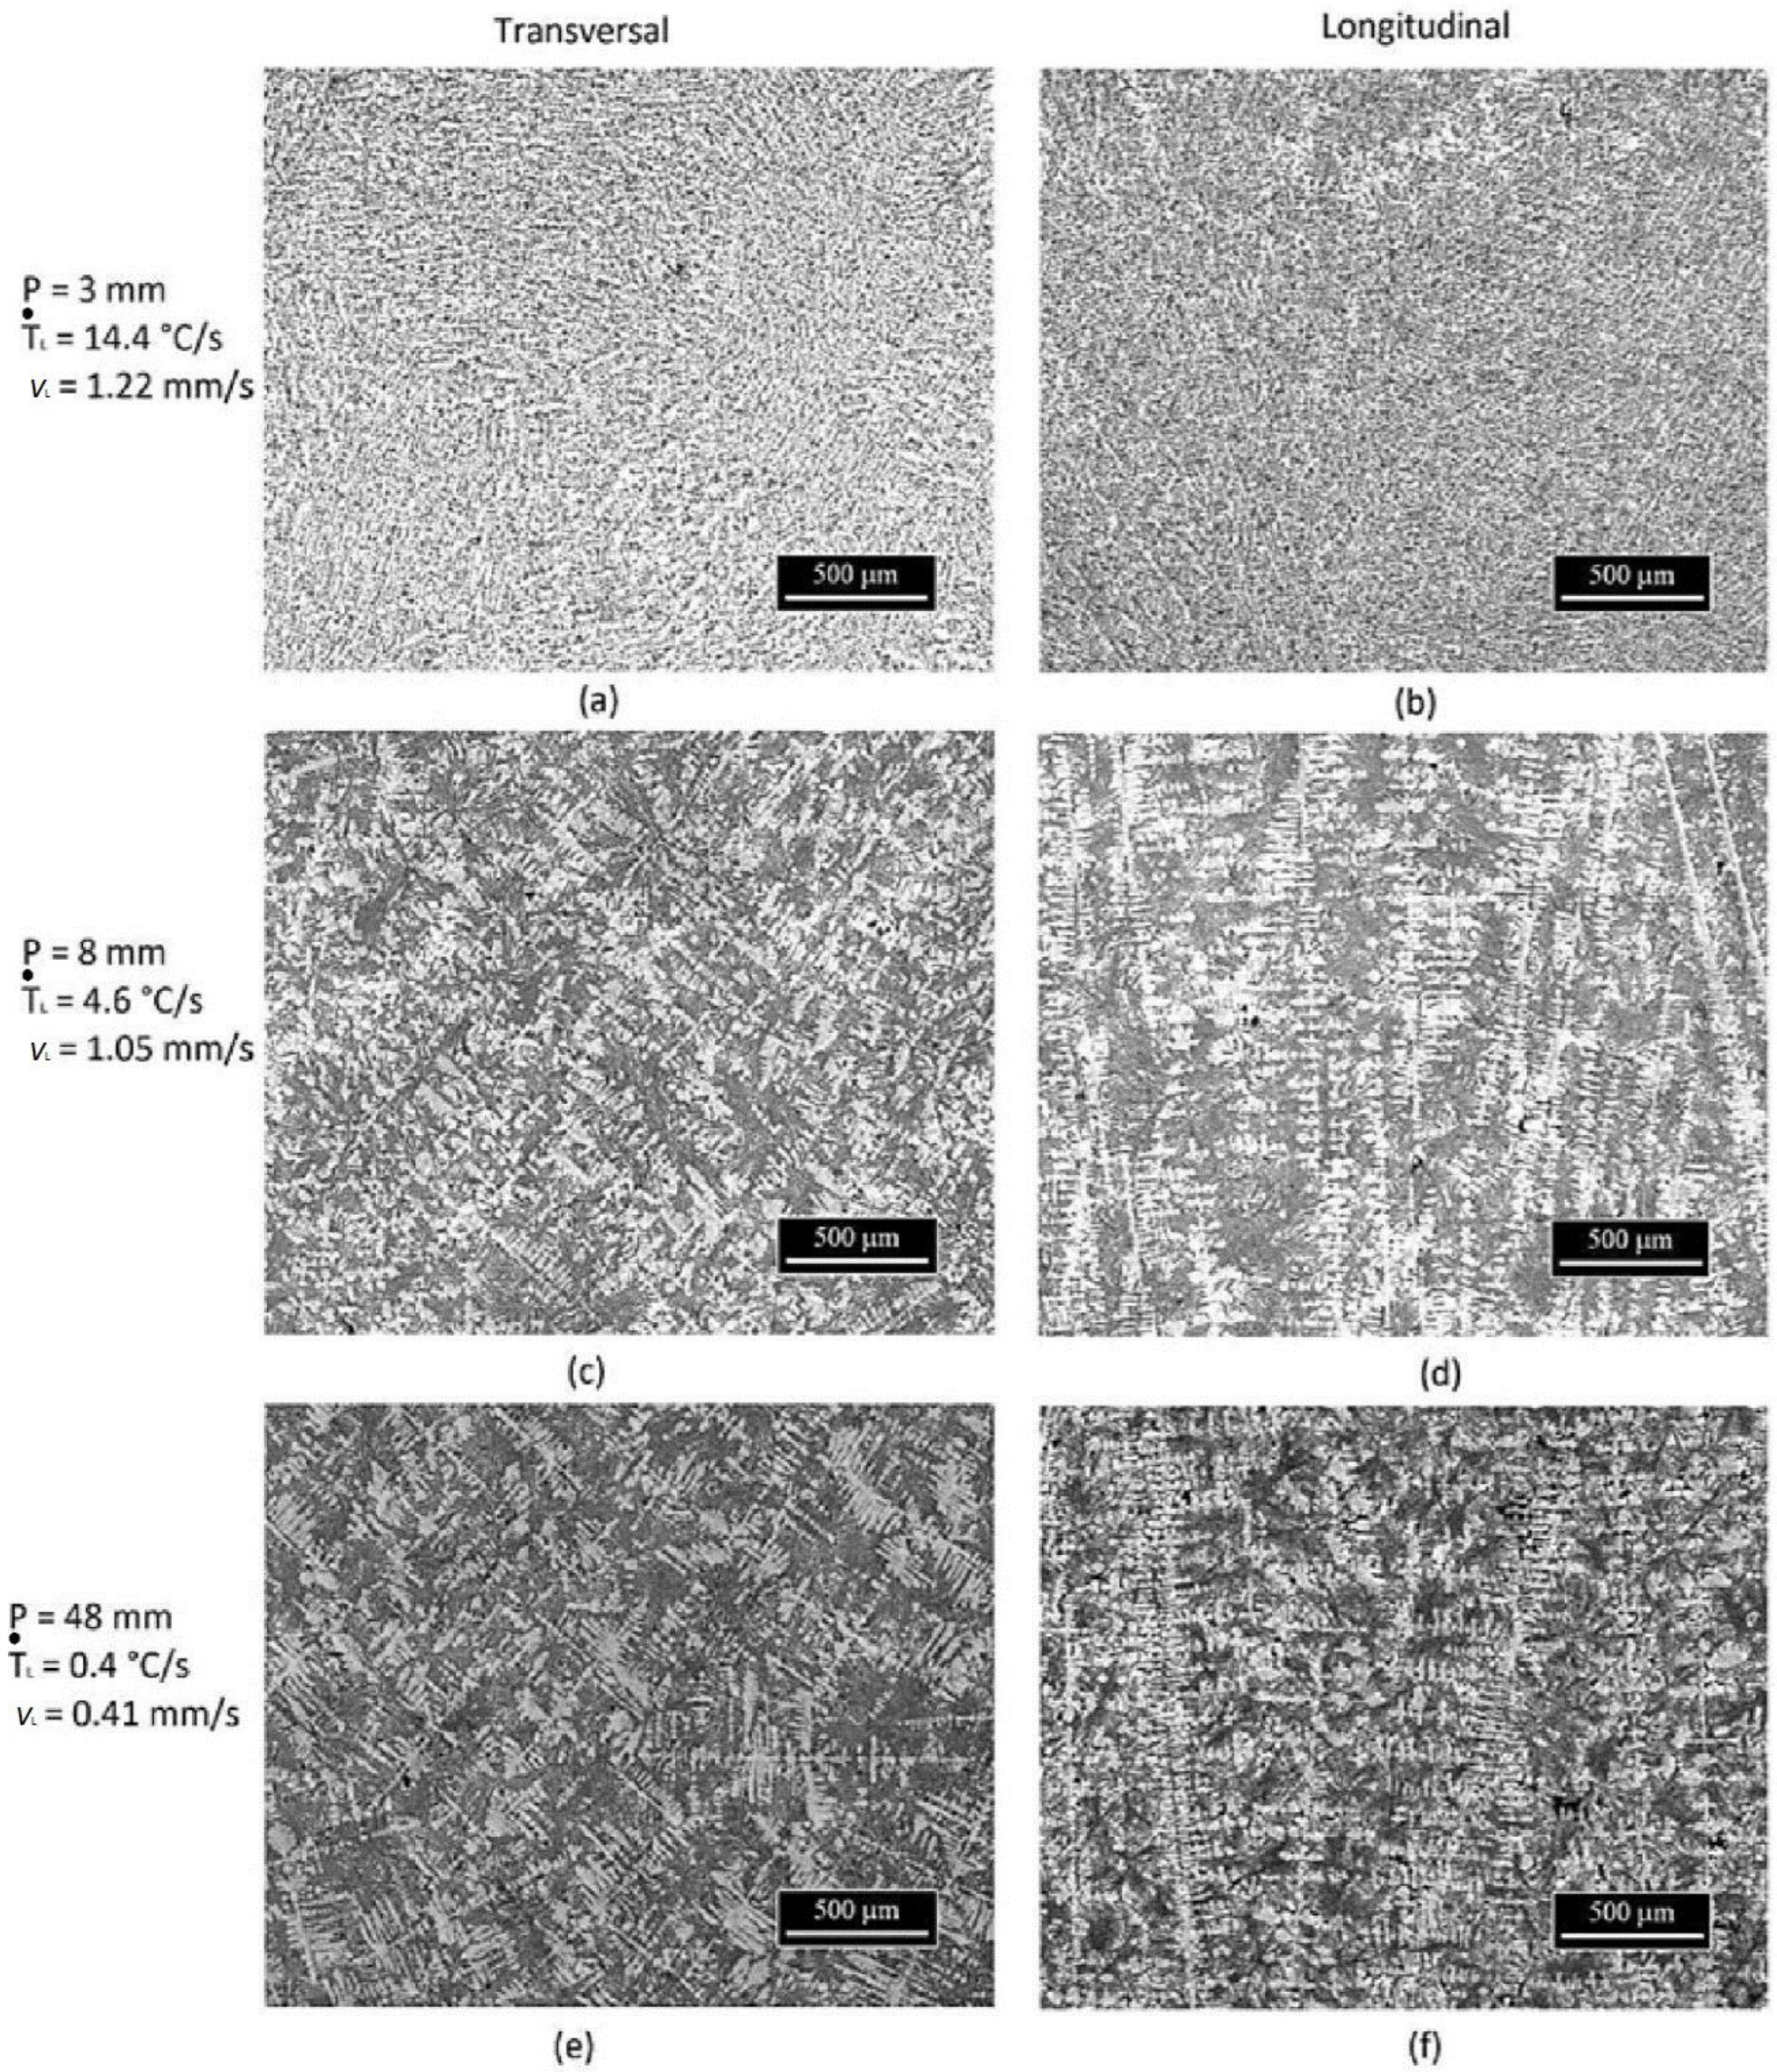
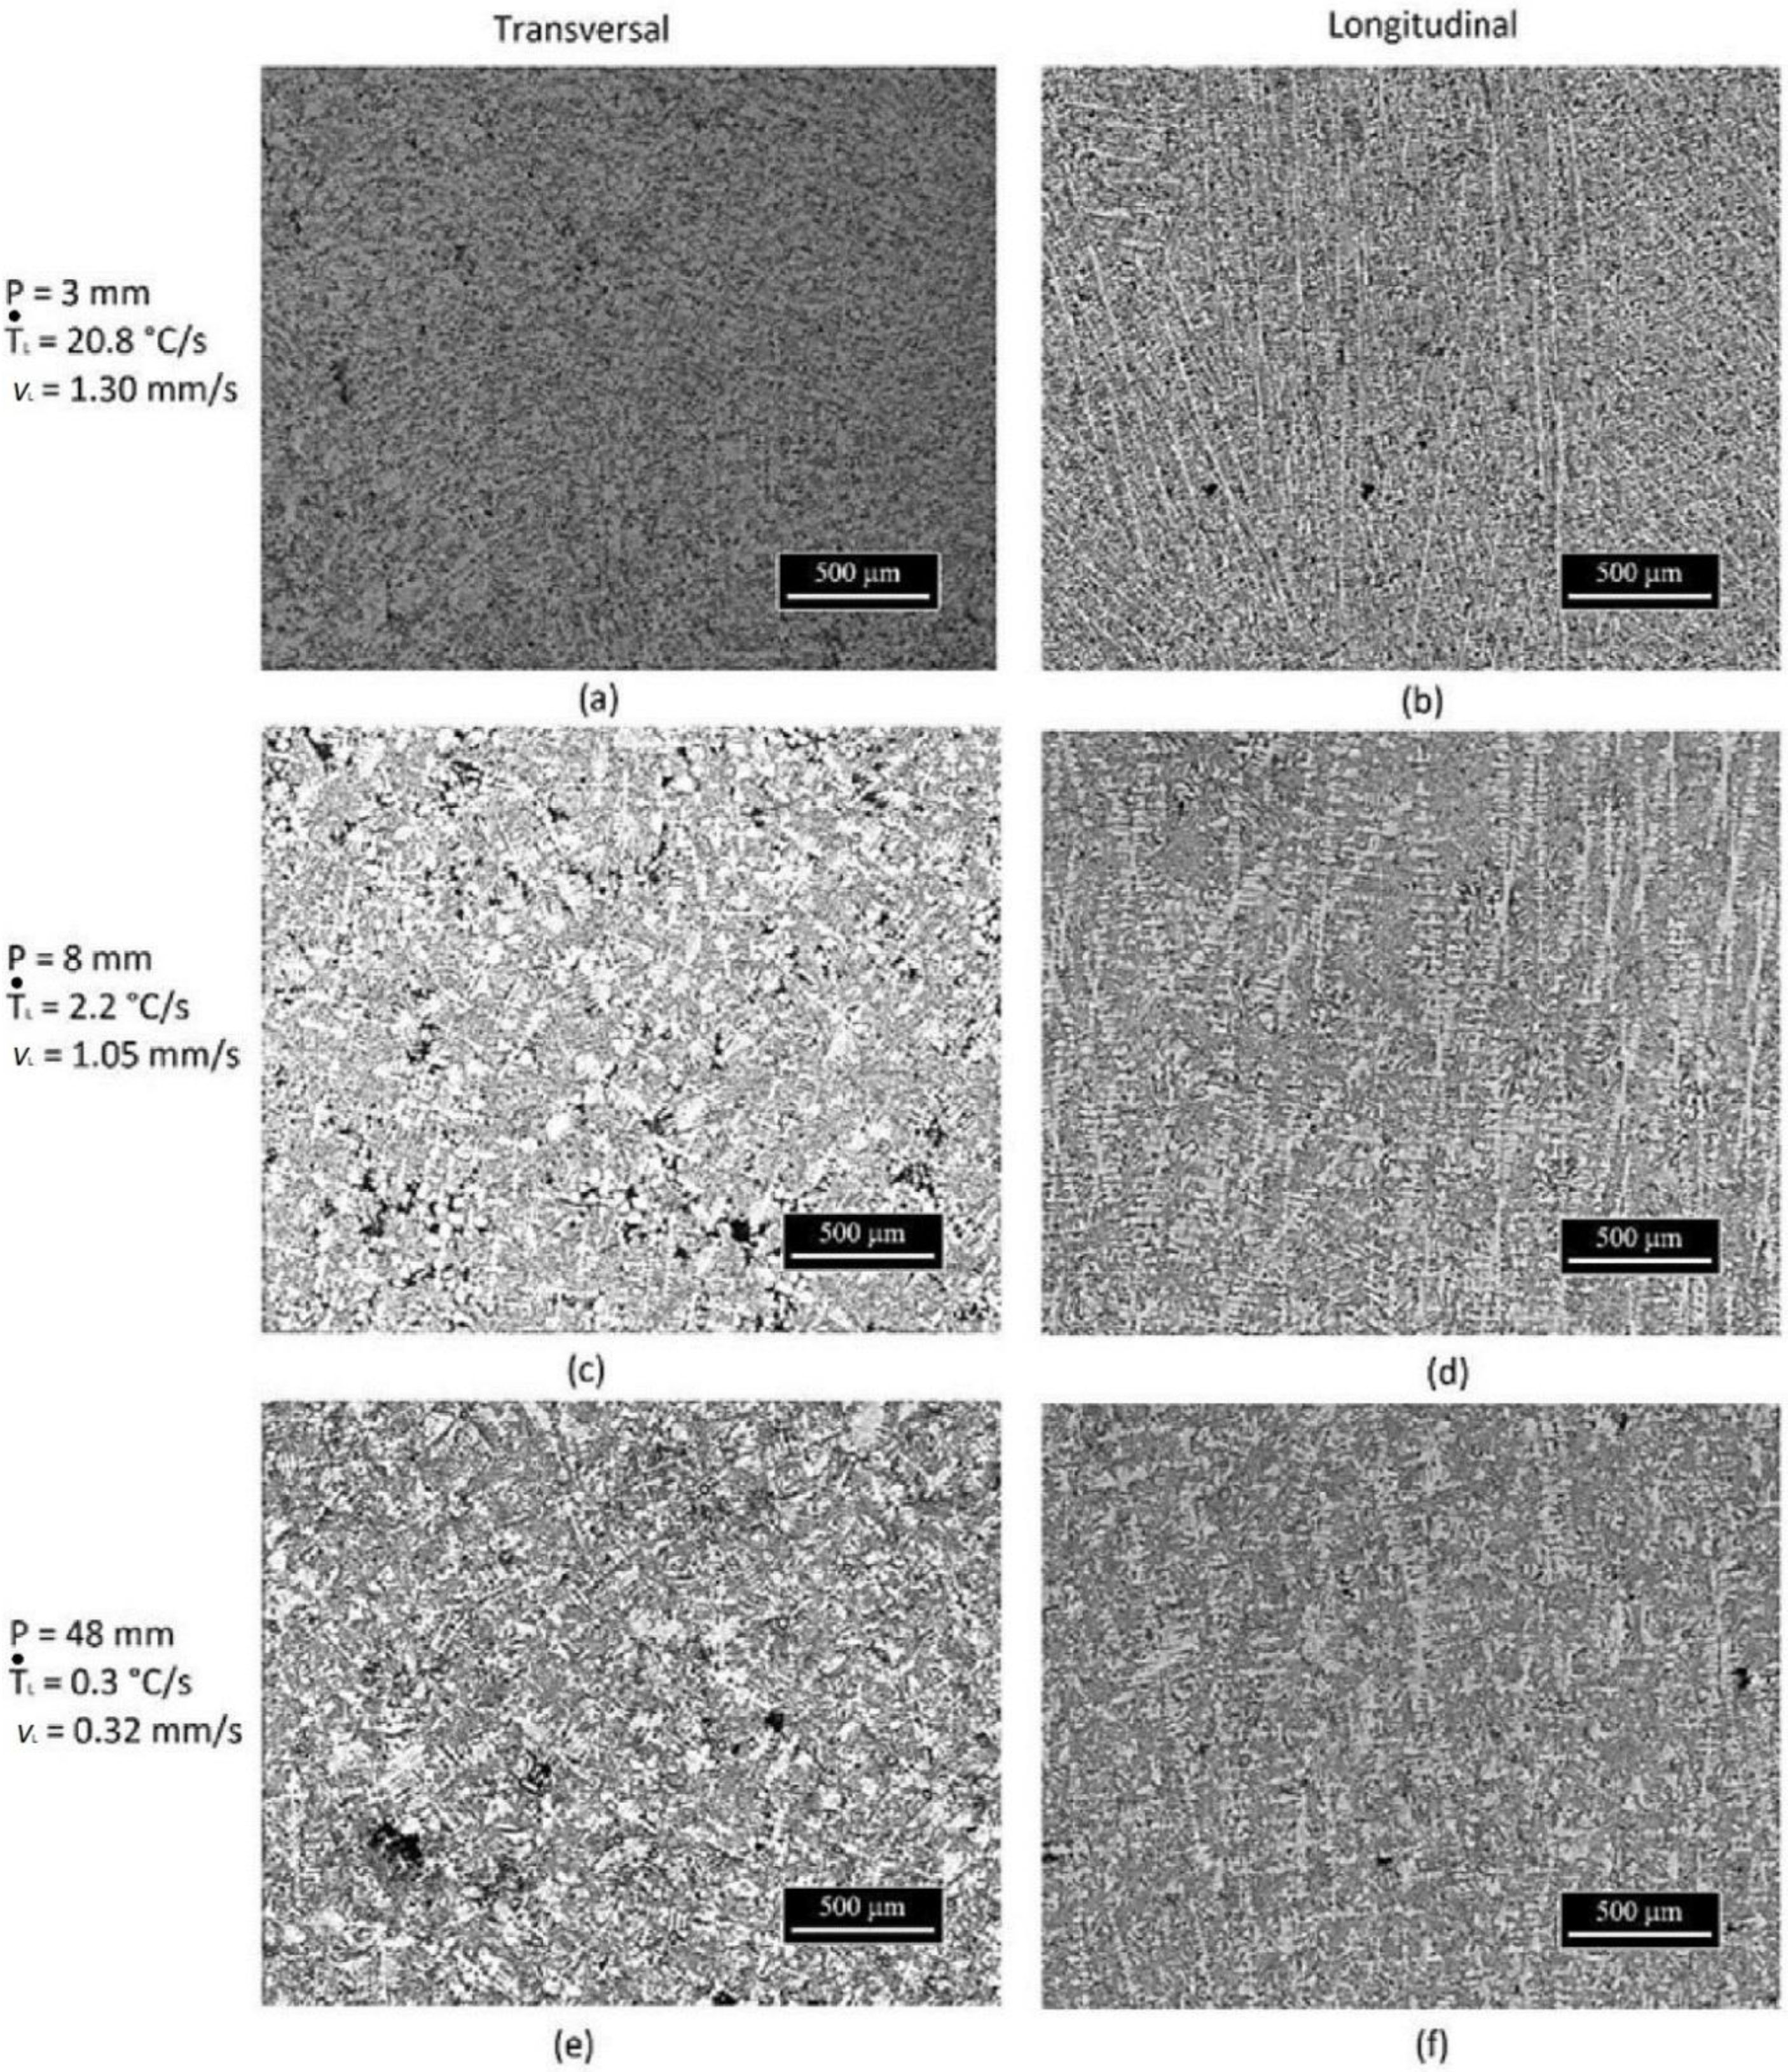
Figure 6 and Figure 7 present the optical micrographs of the Al-11wt %Si-3.0 and 4.5wt %Cu braze alloy samples. In the micrographs, the aluminium-rich dendrites can be seen being enveloped by the products of the eutectic reactions; that is, the Al–Si eutectic and the Al–Si–Al2Cu ternary eutectic. The micrographs refer to different positions along the length of the DS castings. Very fine to large length-scales of the formed dendritic structures can be observed. This is explained due to the wide range of experimental solidification cooling rates experienced across the fabricated DS castings.
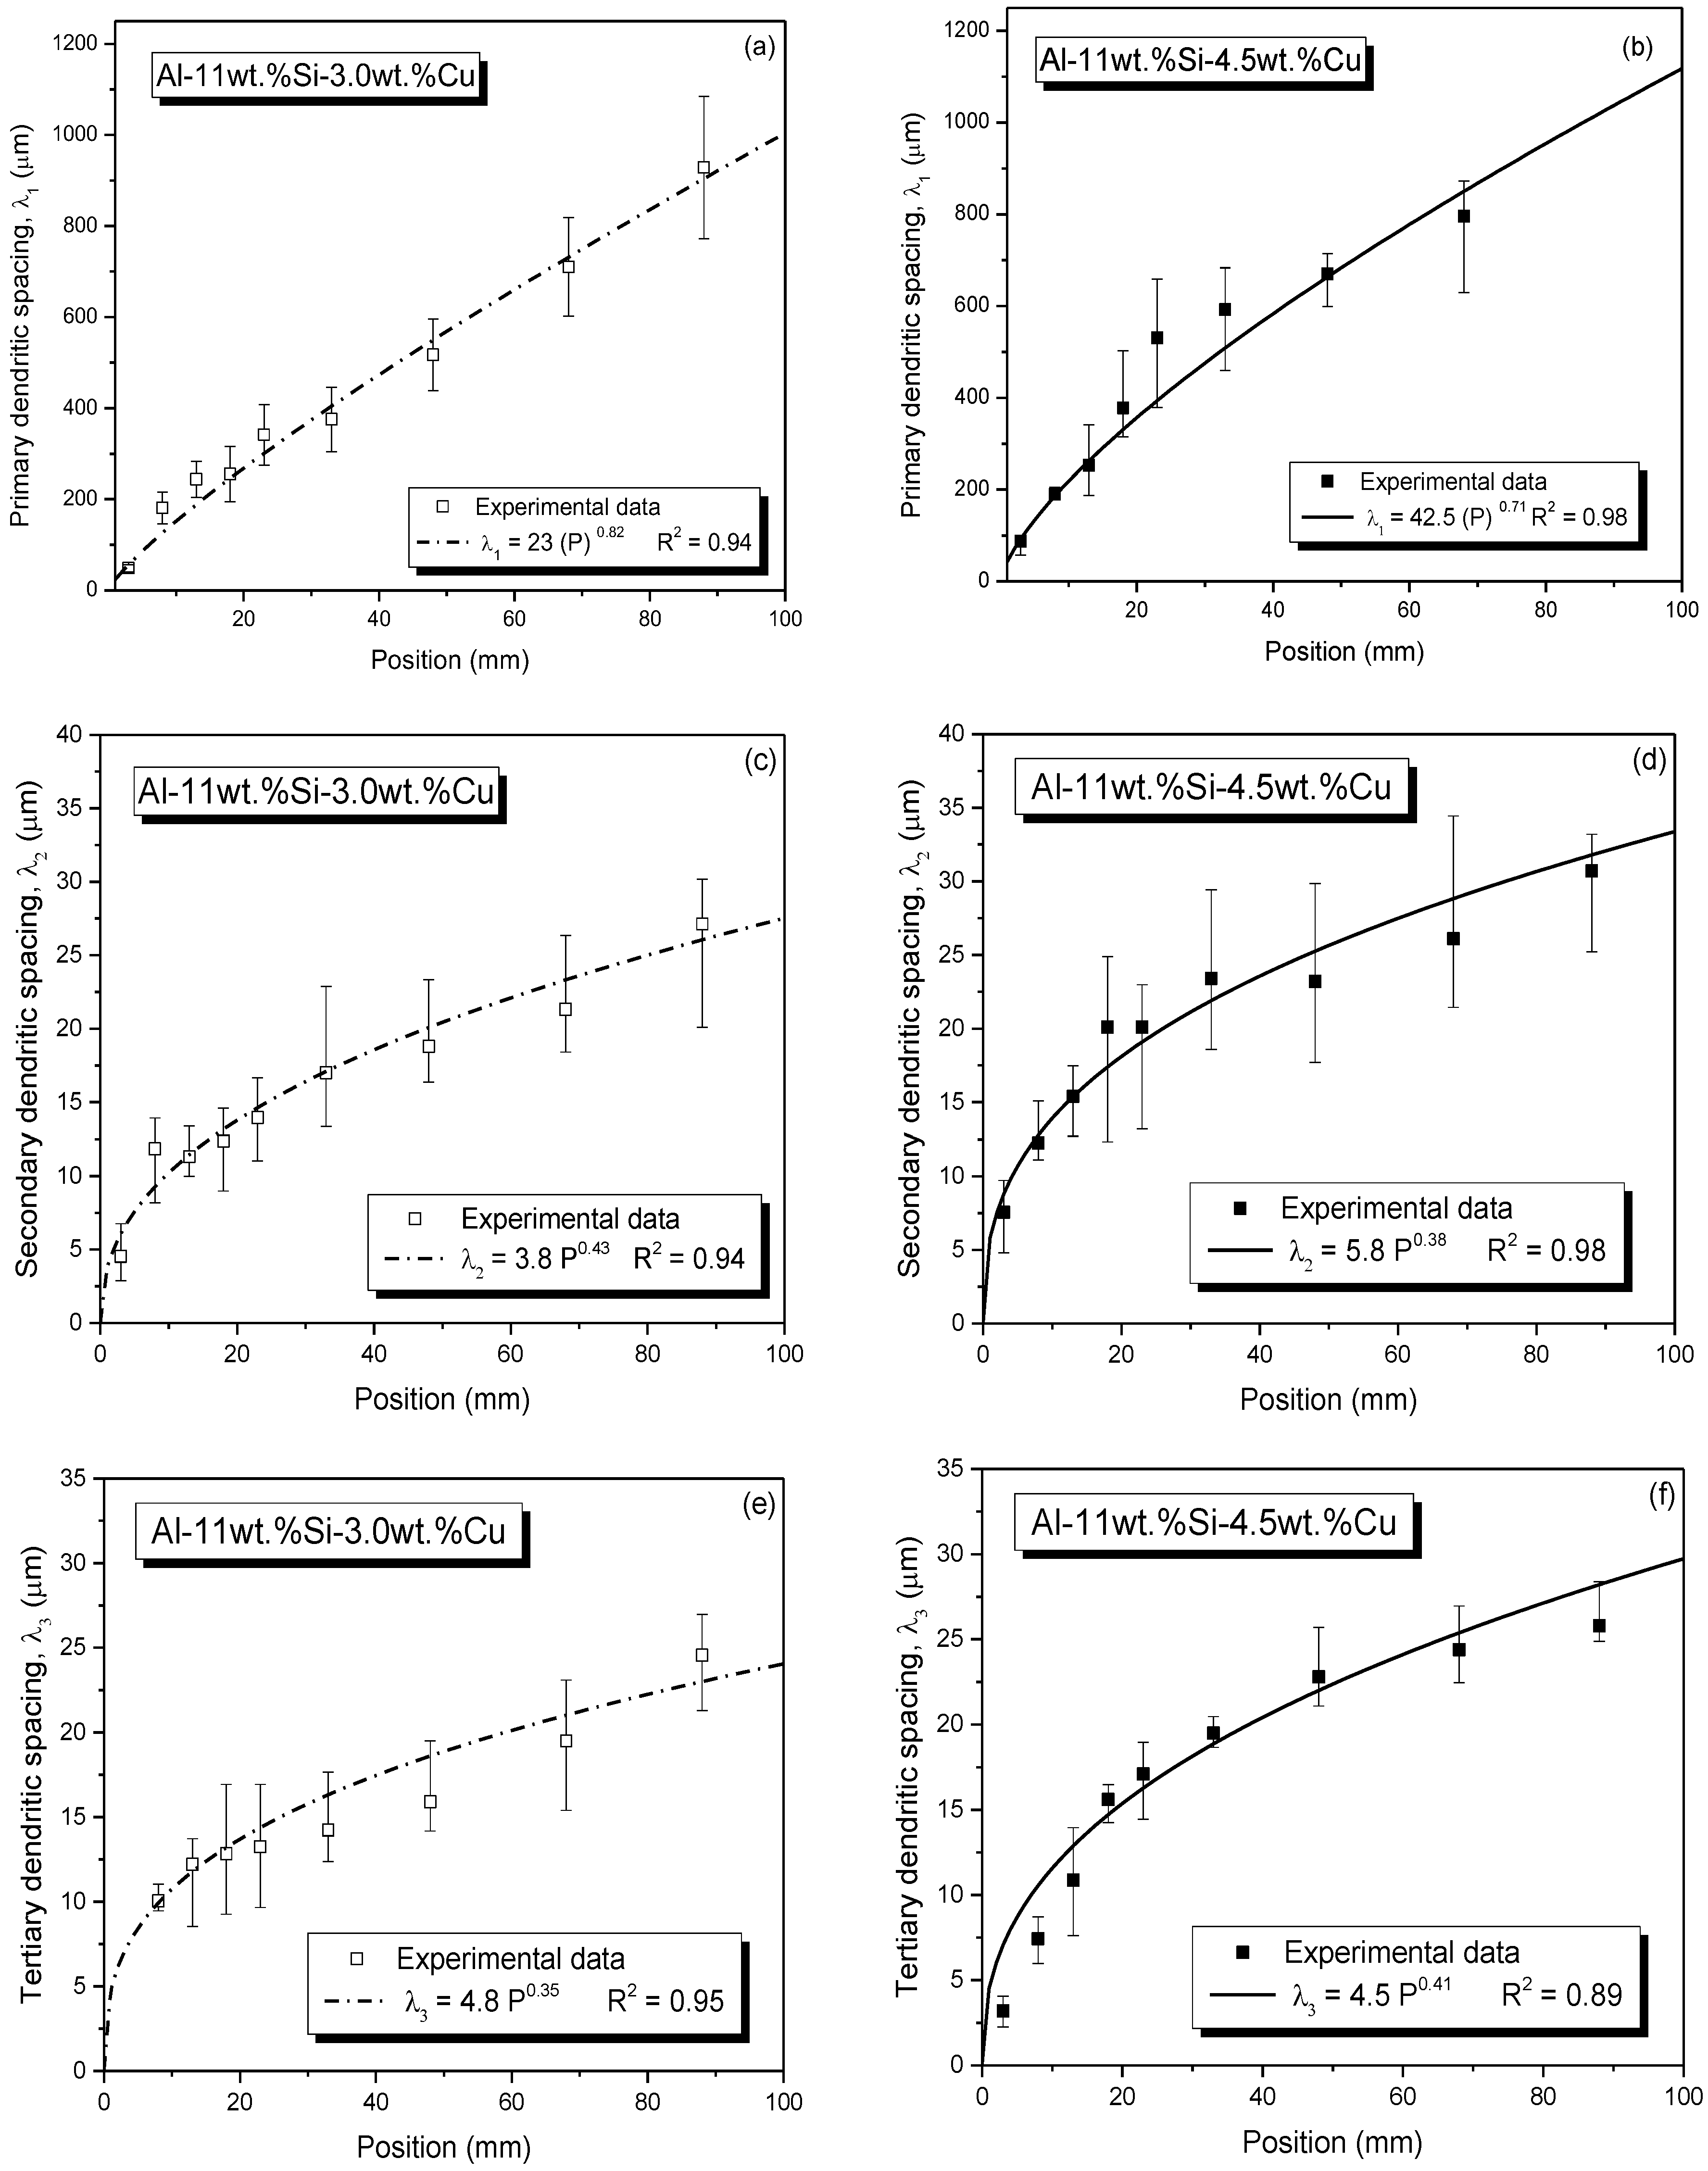
Figure 8 shows the magnitude modifications that occurred in the microstructural spacing values for the various positions along the length of the DS castings. Large dendritic variations in scale could be noted. For example, the mean primary dendrite arm spacing, λ1, varied from 45 μm to 930 μm in the samples extracted along the length of the Al-11wt %Si-3.0wt %Cu alloy casting. The secondary dendritic spacing, λ2, varied from 7.5 μm to 30 μm as a function of the relative position across the Al-11wt %Si-4.5wt %Cu alloy casting.
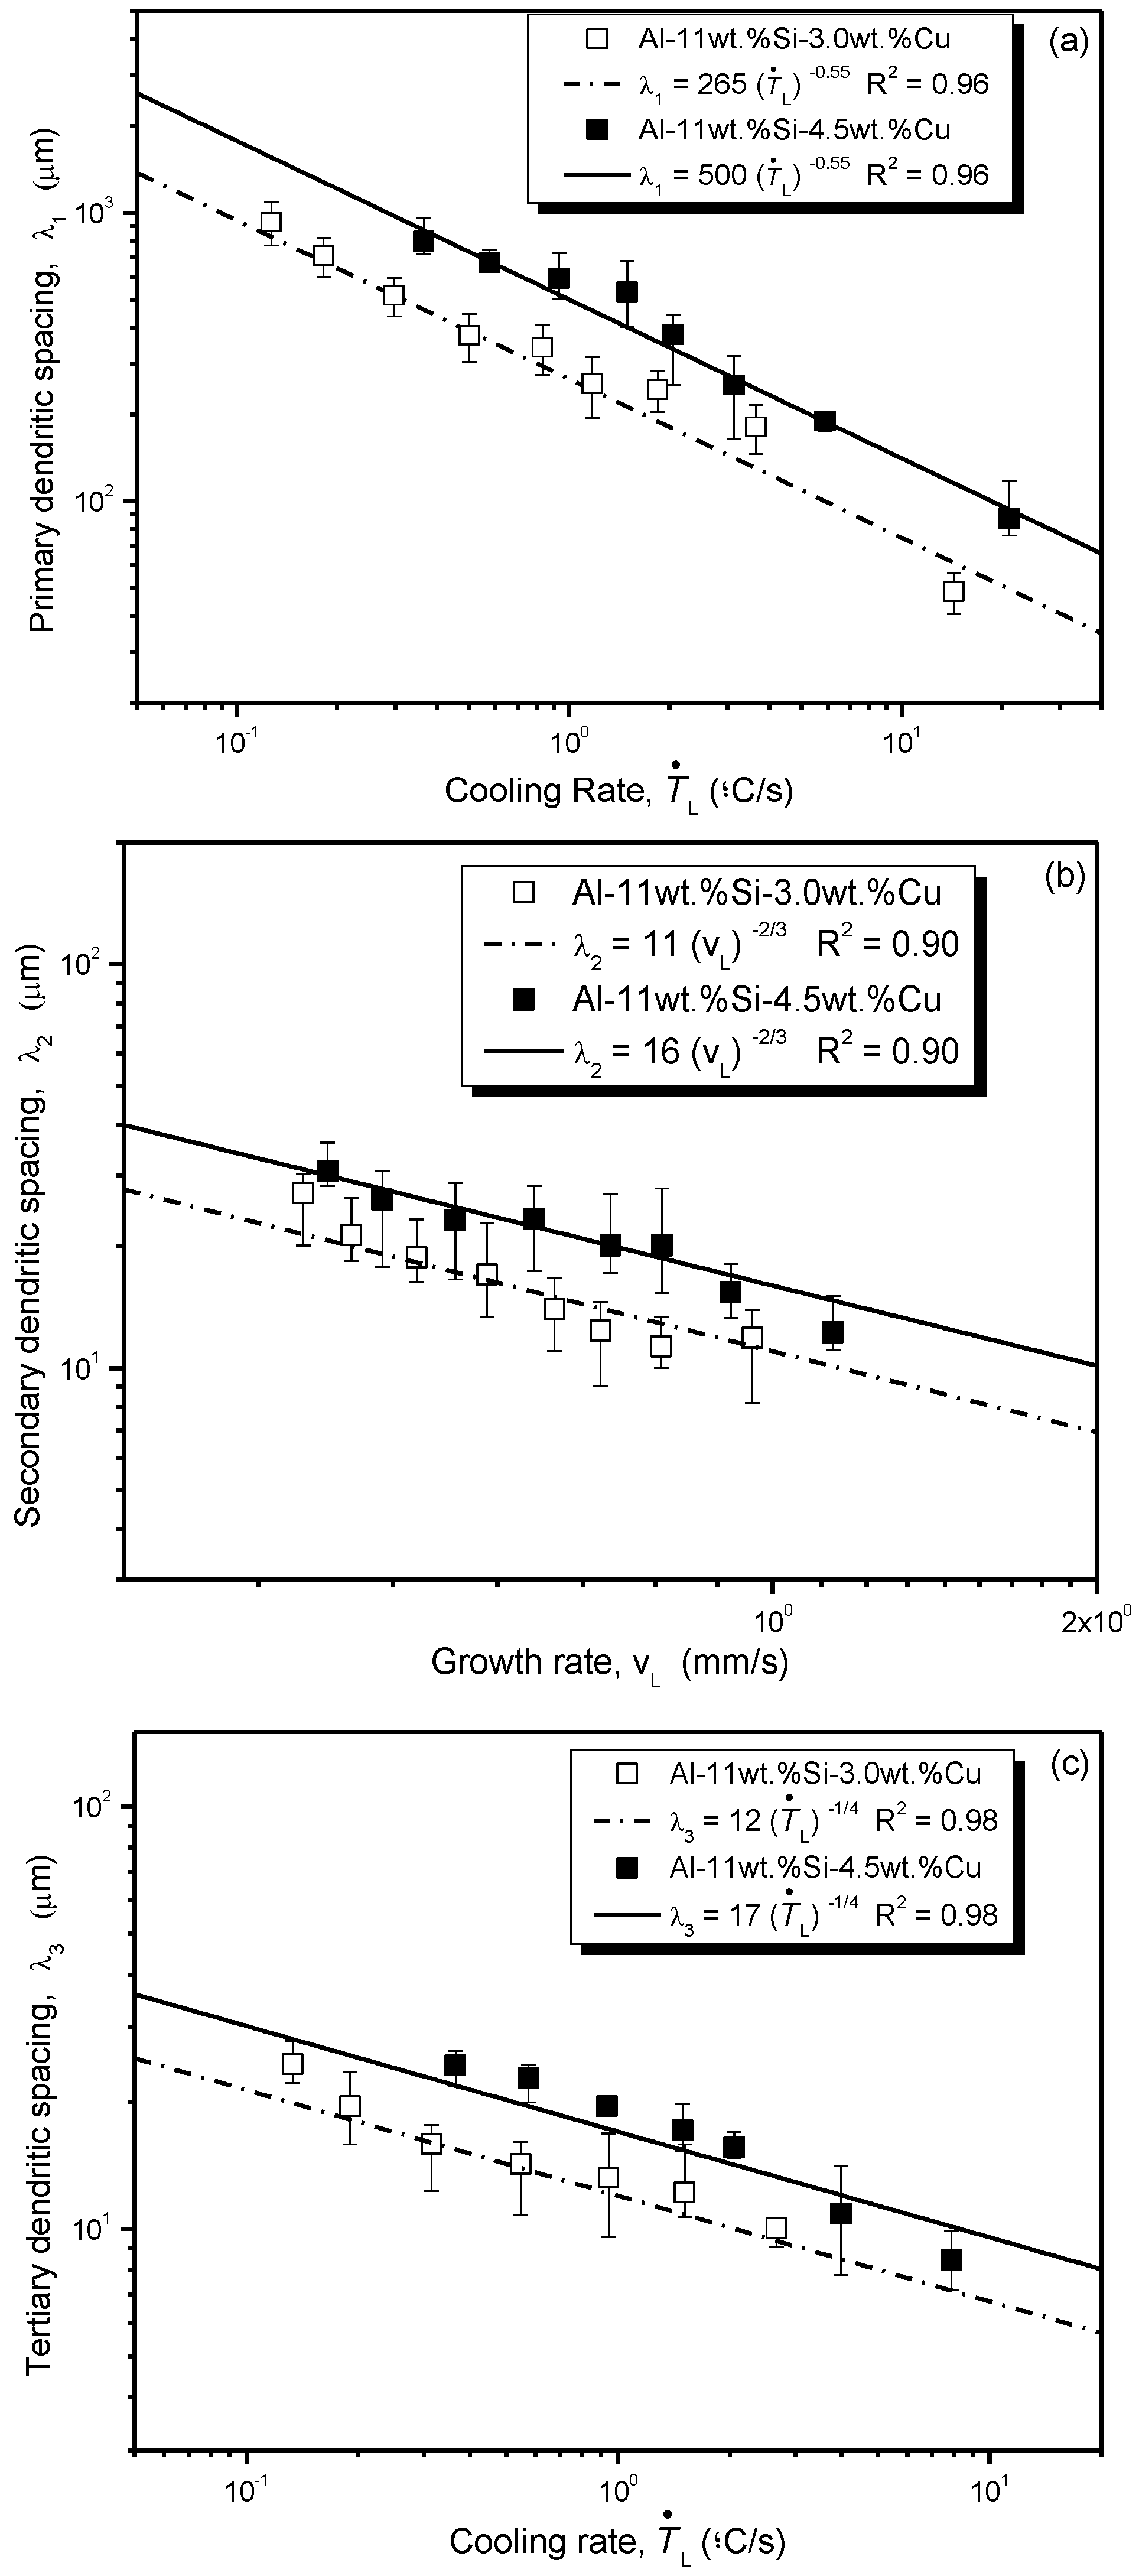
Figure 9 depicts the mean experimental values, along with the standard variation, of primary (λ1), secondary (λ2), and tertiary (λ3) dendritic spacings as a function of cooling rate (primary, tertiary), and growth rate (secondary). Power function fittings were suitably derived to represent the experimental scatter of each alloy. Analyzing the experimental tendencies in the graphs of Figure 9, it can be inferred that the 50% increase in the Cu alloying (from 3.0 to 4.5 wt %) had significant impacts on λ1, λ2, and λ3. This means increases in λ1, λ2, and λ3 by 88%, 45%, and 42% respectively, for the alloy containing 4.5 wt % of Cu, as compared to the other alloy composition. The multipliers of the experimental equations varied when compared with the experimental tendencies of the two evaluated alloys for a particular microstructural parameter. However, the representative exponents referring to each microstructural parameter were preserved regardless of the considered alloy. A −2/3 power law characterizes the experimental variations of λ2 with vL, while a −0.55 exponent is able to represent the two tendencies for λ1.
Circulating between the dendrites is a liquid rich in solute. The dendritic array is formed by lateral instabilities of higher order, which are the secondary and tertiary branches developed from the primary stems. The higher order tertiary formations are those that are located closer to the interdendritic portions, which are prone to commence the eutectic reaction. It appears that such proximity with the eutectic mixture may affect the growth of tertiary branches, which becomes less sensitive to the cooling rate variations, resulting in a relationship λ3 = constant ṪL−1/4.
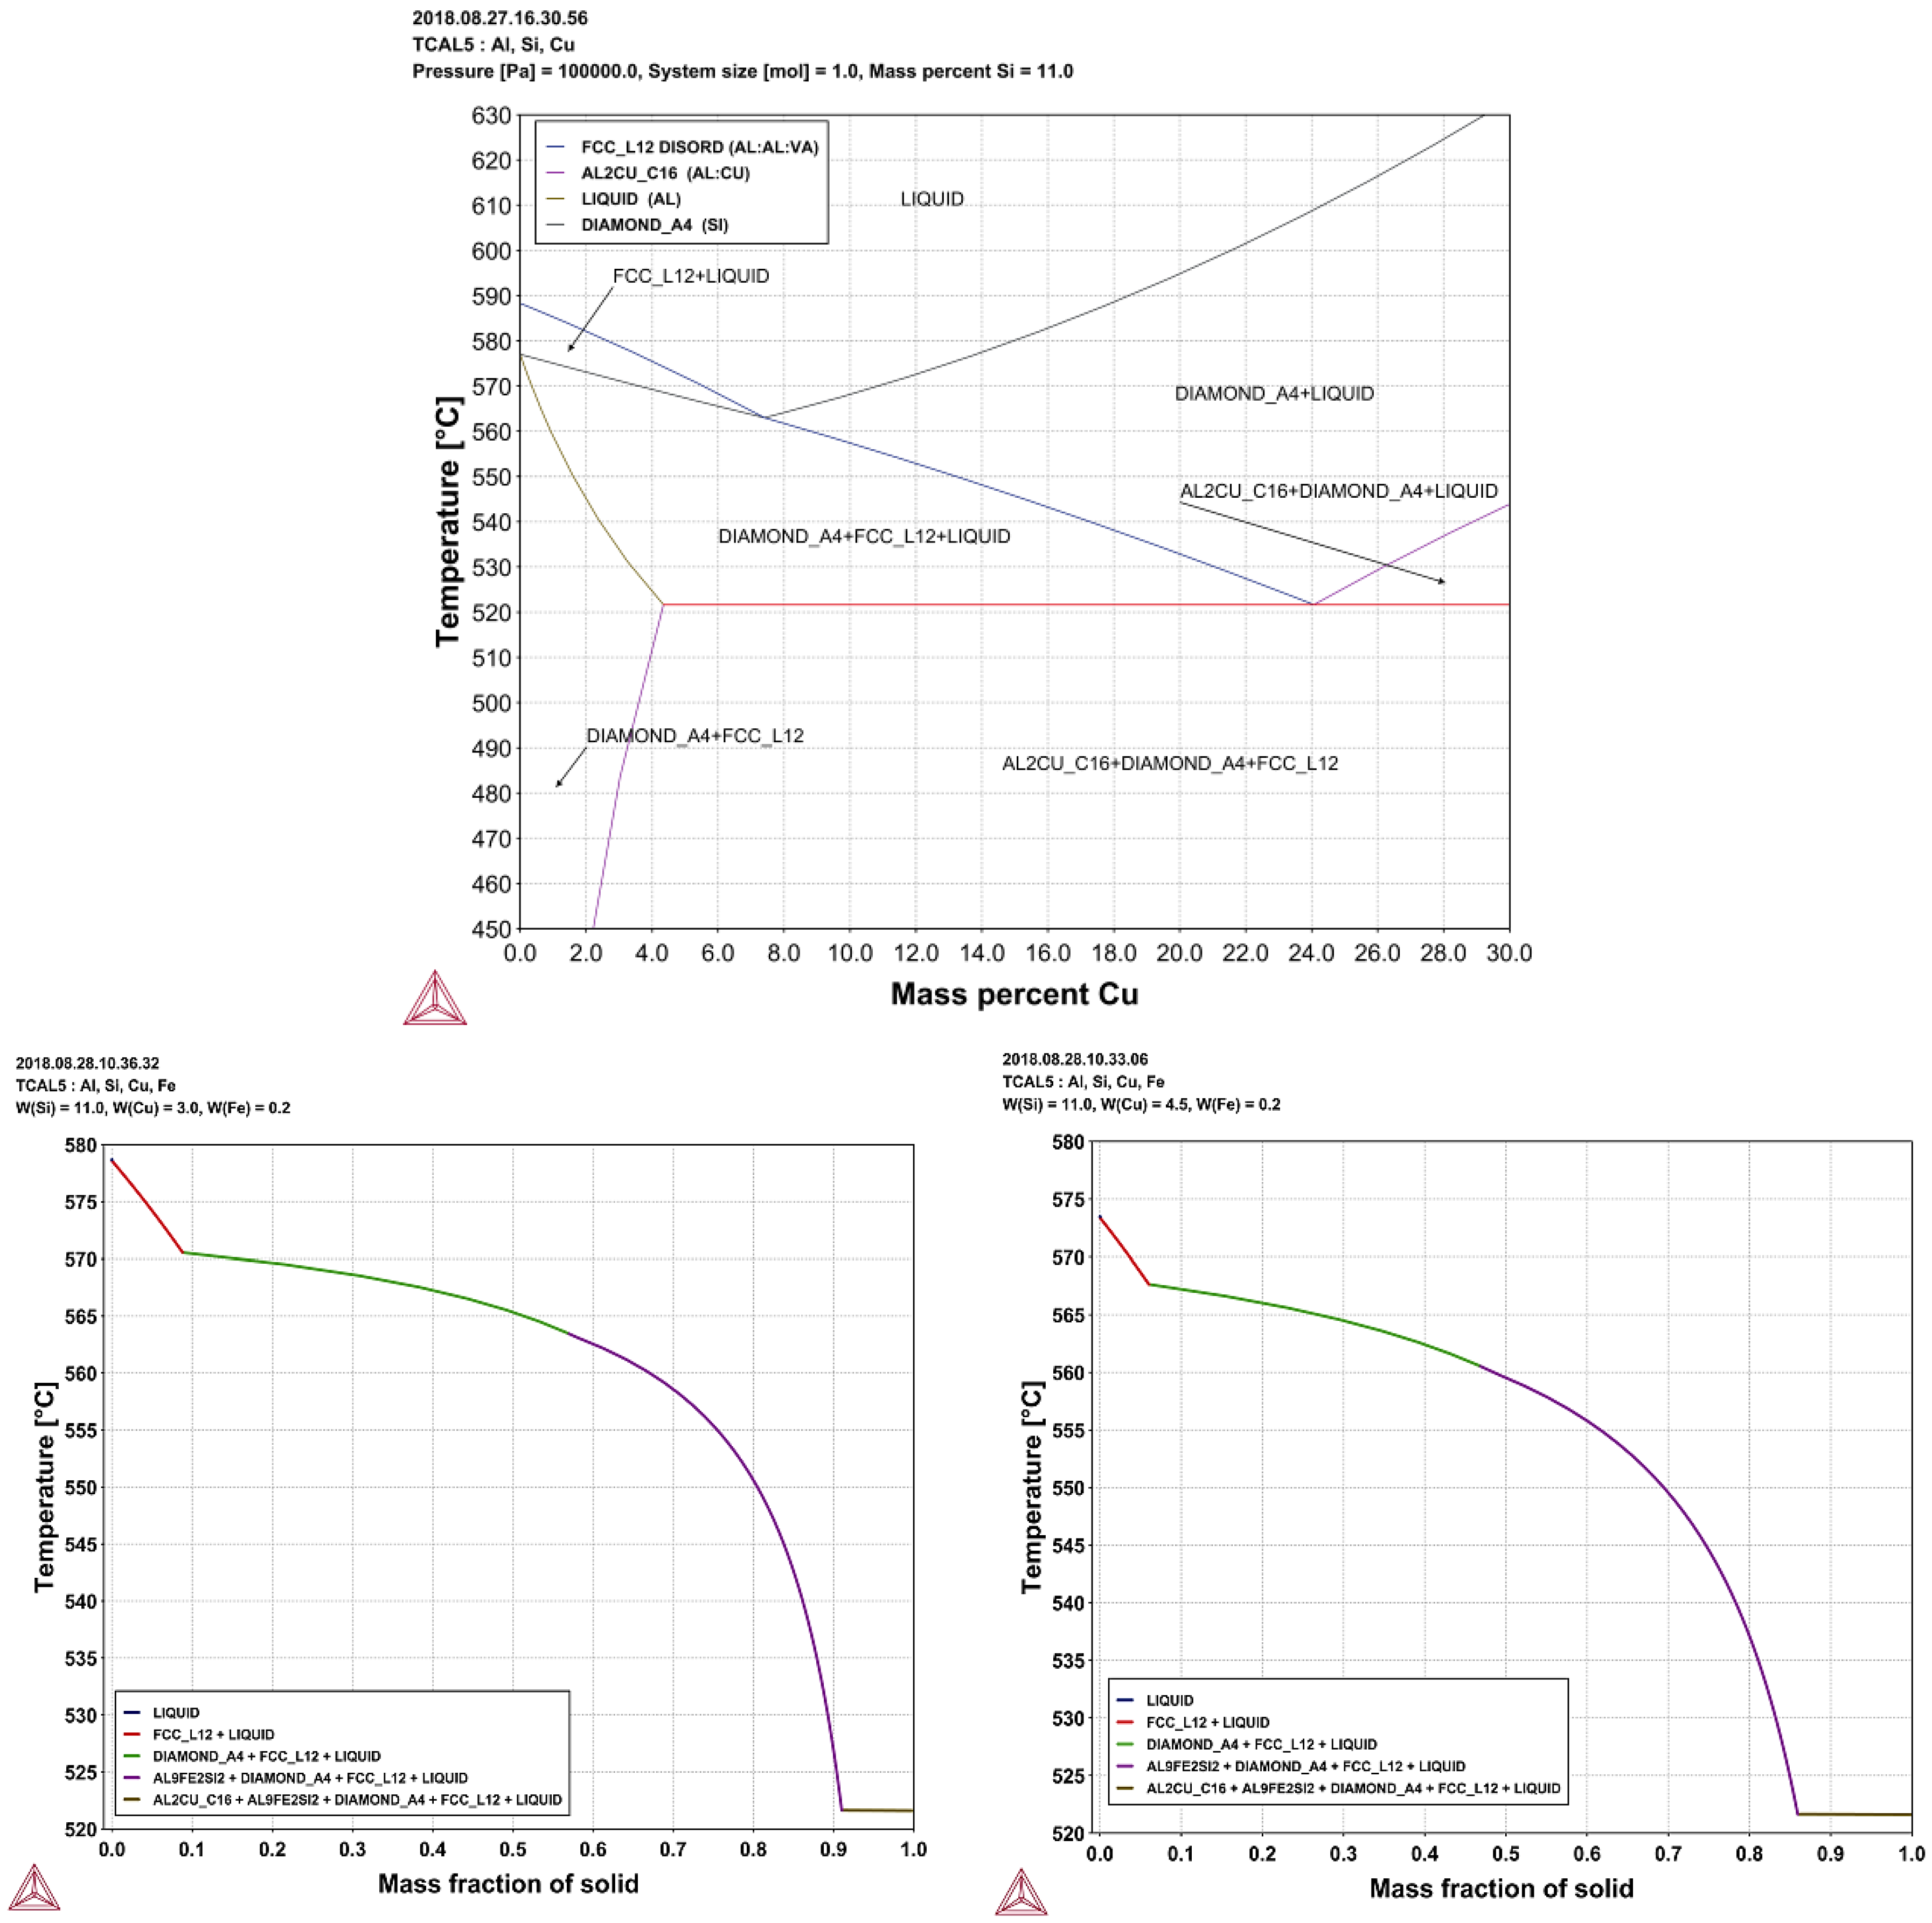
The solidification paths of the Al–Si–Cu braze alloys were computed using the Thermo-Calc software (Thermo-Calc Software AB, Solna, Sweden). This was possible by using the assumption of Scheil conditions and the TCAL5 Al-based Alloys Database. Figure 10 shows the isopleth simulation relative to the Al-11Si-xCu system, considering then a parameterization of 11wt %Si. The solidification evolutions of these alloys were also calculated, as can be seen in the bottom plots of Figure 10. In this case, an impurity level of 0.2 wt % Fe was considered in the alloys composition to permit more realistic sequences of precipitation to be estimated. According to Thermo-Calc results, the eutectic reaction may occur at 522 °C for both Al-11wt %Si-3.0 and -4.5wt %Cu alloys. The products of this reaction are: α-Al + AlFeSi + Si + Al2Cu. A comparison of the graphs at the bottom of Figure 10 shows that a mass fraction of 9% is associated with the eutectic structure for the alloy containing 3.0 wt % Cu, whereas it is 14% for the Al-11wt %Si-4.5wt %Cu alloy.
The following precipitations (fractions %) occurred for the Al-11wt %Si-3.0 and -4.5wt %Cu alloys respectively: 9% and 6% of α-Al, followed by nearly 50% and 41% of the solid fraction of Si; after that, the growth of 32% and 39% of solid fractions related to the AlFeSi phase, before the eutectic reaction occurring in the remaining liquid. Accumulation of the proportions of α-Al with that for the binary eutectic Si resulted in ~60% for the Al-11wt %Si-3.0wt %Cu alloy, while less than 50% of the fraction of these phases is associated with the Al-11wt %Si-4.5wt %Cu alloy. Such a combination of mass fractions remains important since—according to Okayasu [18]—fine α-Al phases and tiny silicon structures may provide superior tensile and fatigue properties.
The phases within the directionally solidified alloy samples have been identified by XRD patterns, as can be seen in Figure 11. The XRD spectra corresponding to different cooling rates along the length of the castings reveal the occurrence of four different phases, which are α-Al, Al2Cu, and Si and AlFeSi. The presence of the Fe-bearing phase was next confirmed through SEM analysis of the microstructures, as seen in Figure 12, Figure 13, Figure 14 and Figure 15.
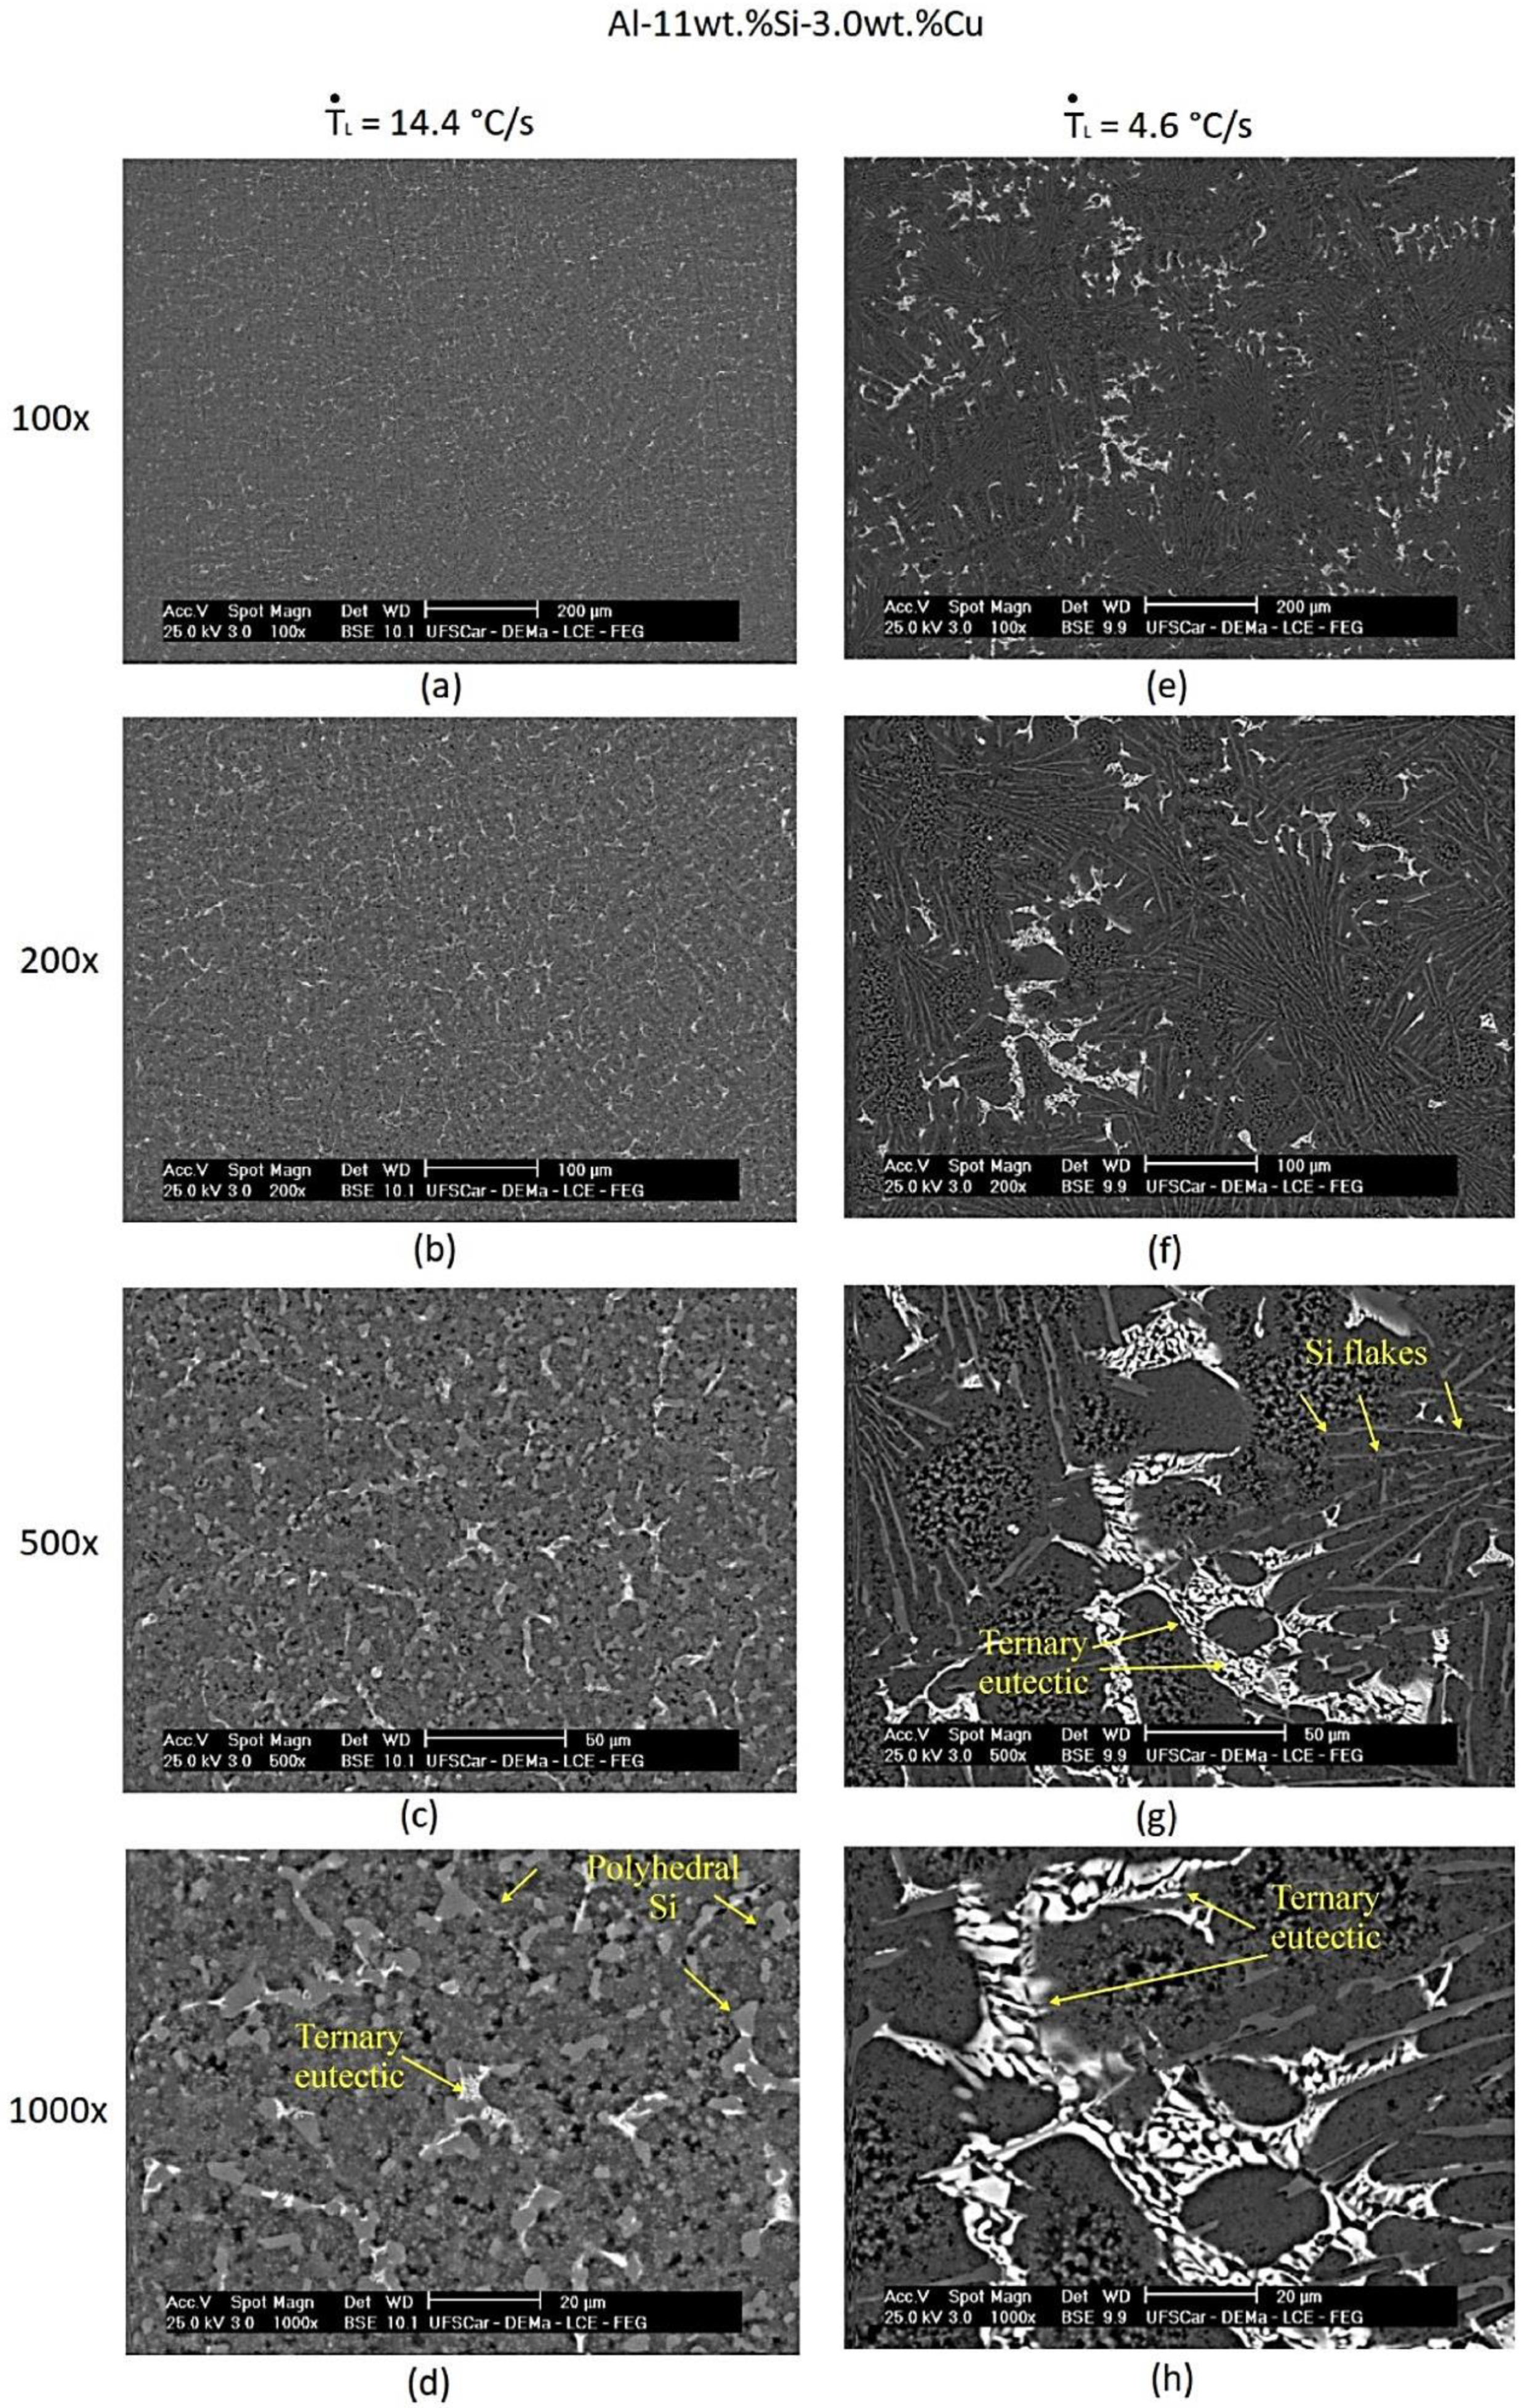
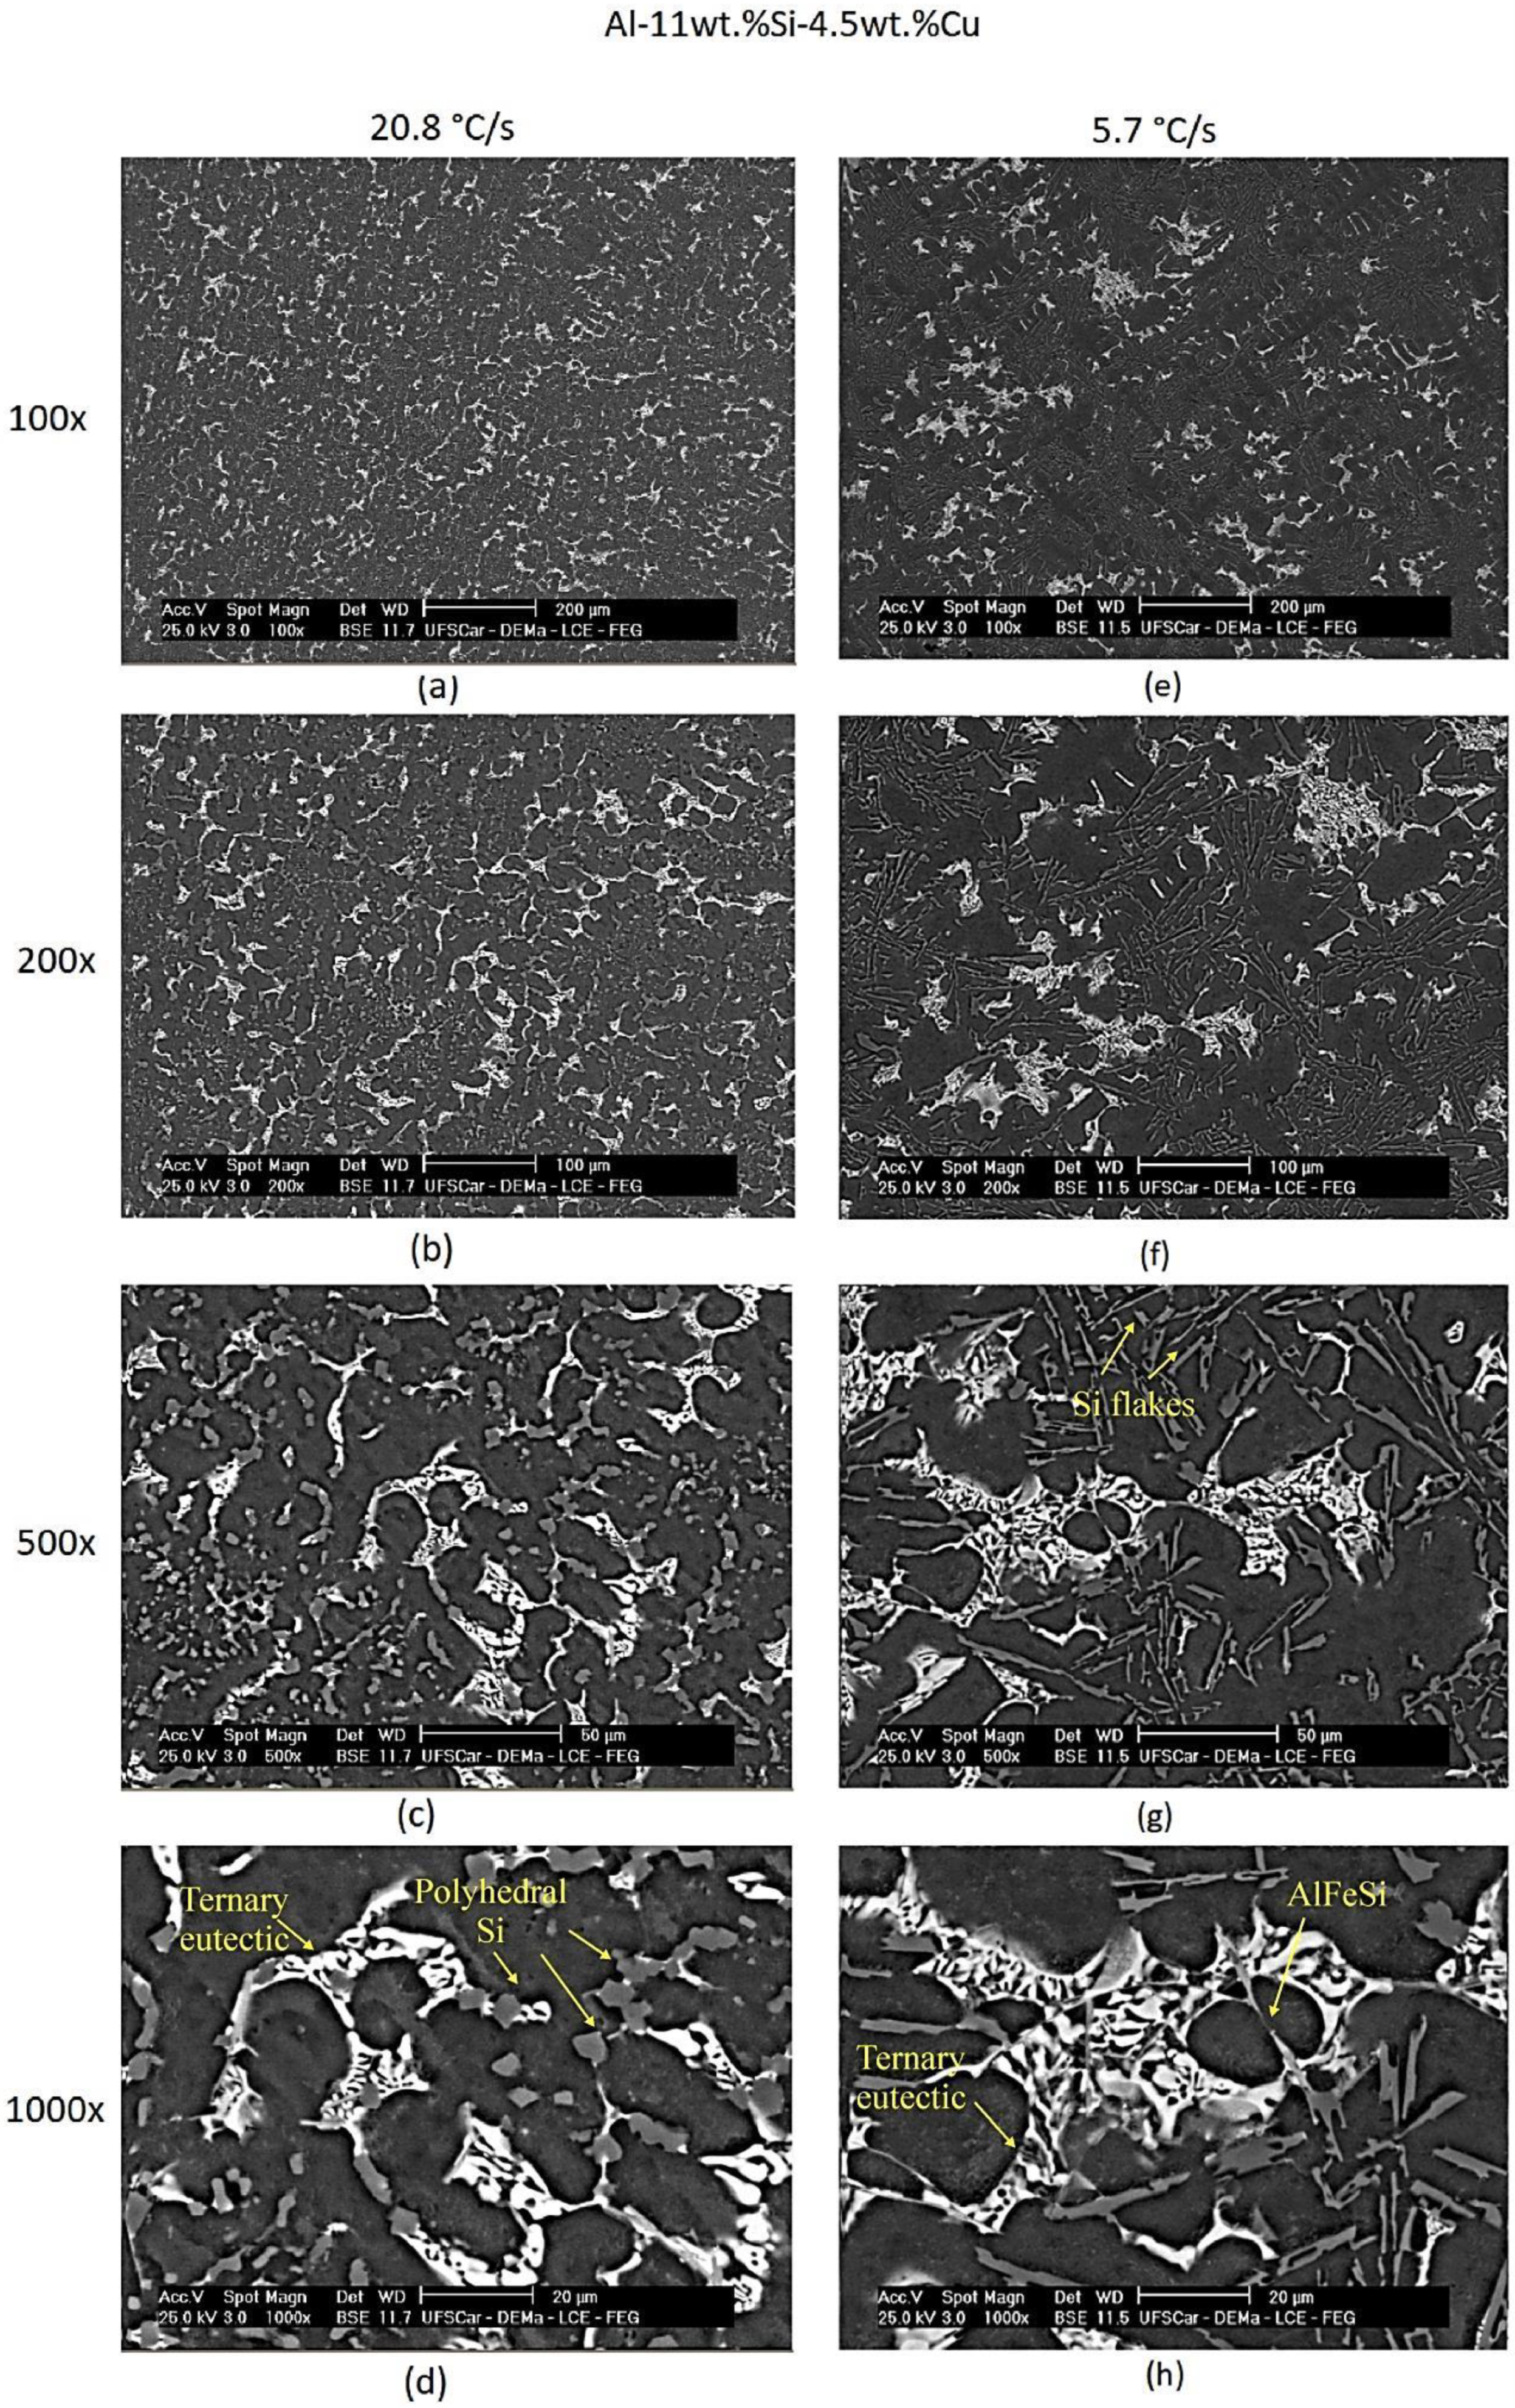
Backscattered electron (BSE) images using SEM, as well as EDS mapping and EDS point analyses, were undertaken to characterize the secondary phases (morphology and chemistry) in the Al–Si–Cu alloy castings. The images in Figure 12 and Figure 13 indicate that the microstructure contains binary Al–Si eutectic (gray color areas) and ternary eutectic structures consisting of Al + Si + Al2Cu (brighter areas in the images). It can be clearly seen that both eutectics change appreciably in scale as a function of the concerned cooling rate sample as characterized by the images at the left (fast cooling) and right (intermediate cooling) sides of Figure 12 and Figure 13.
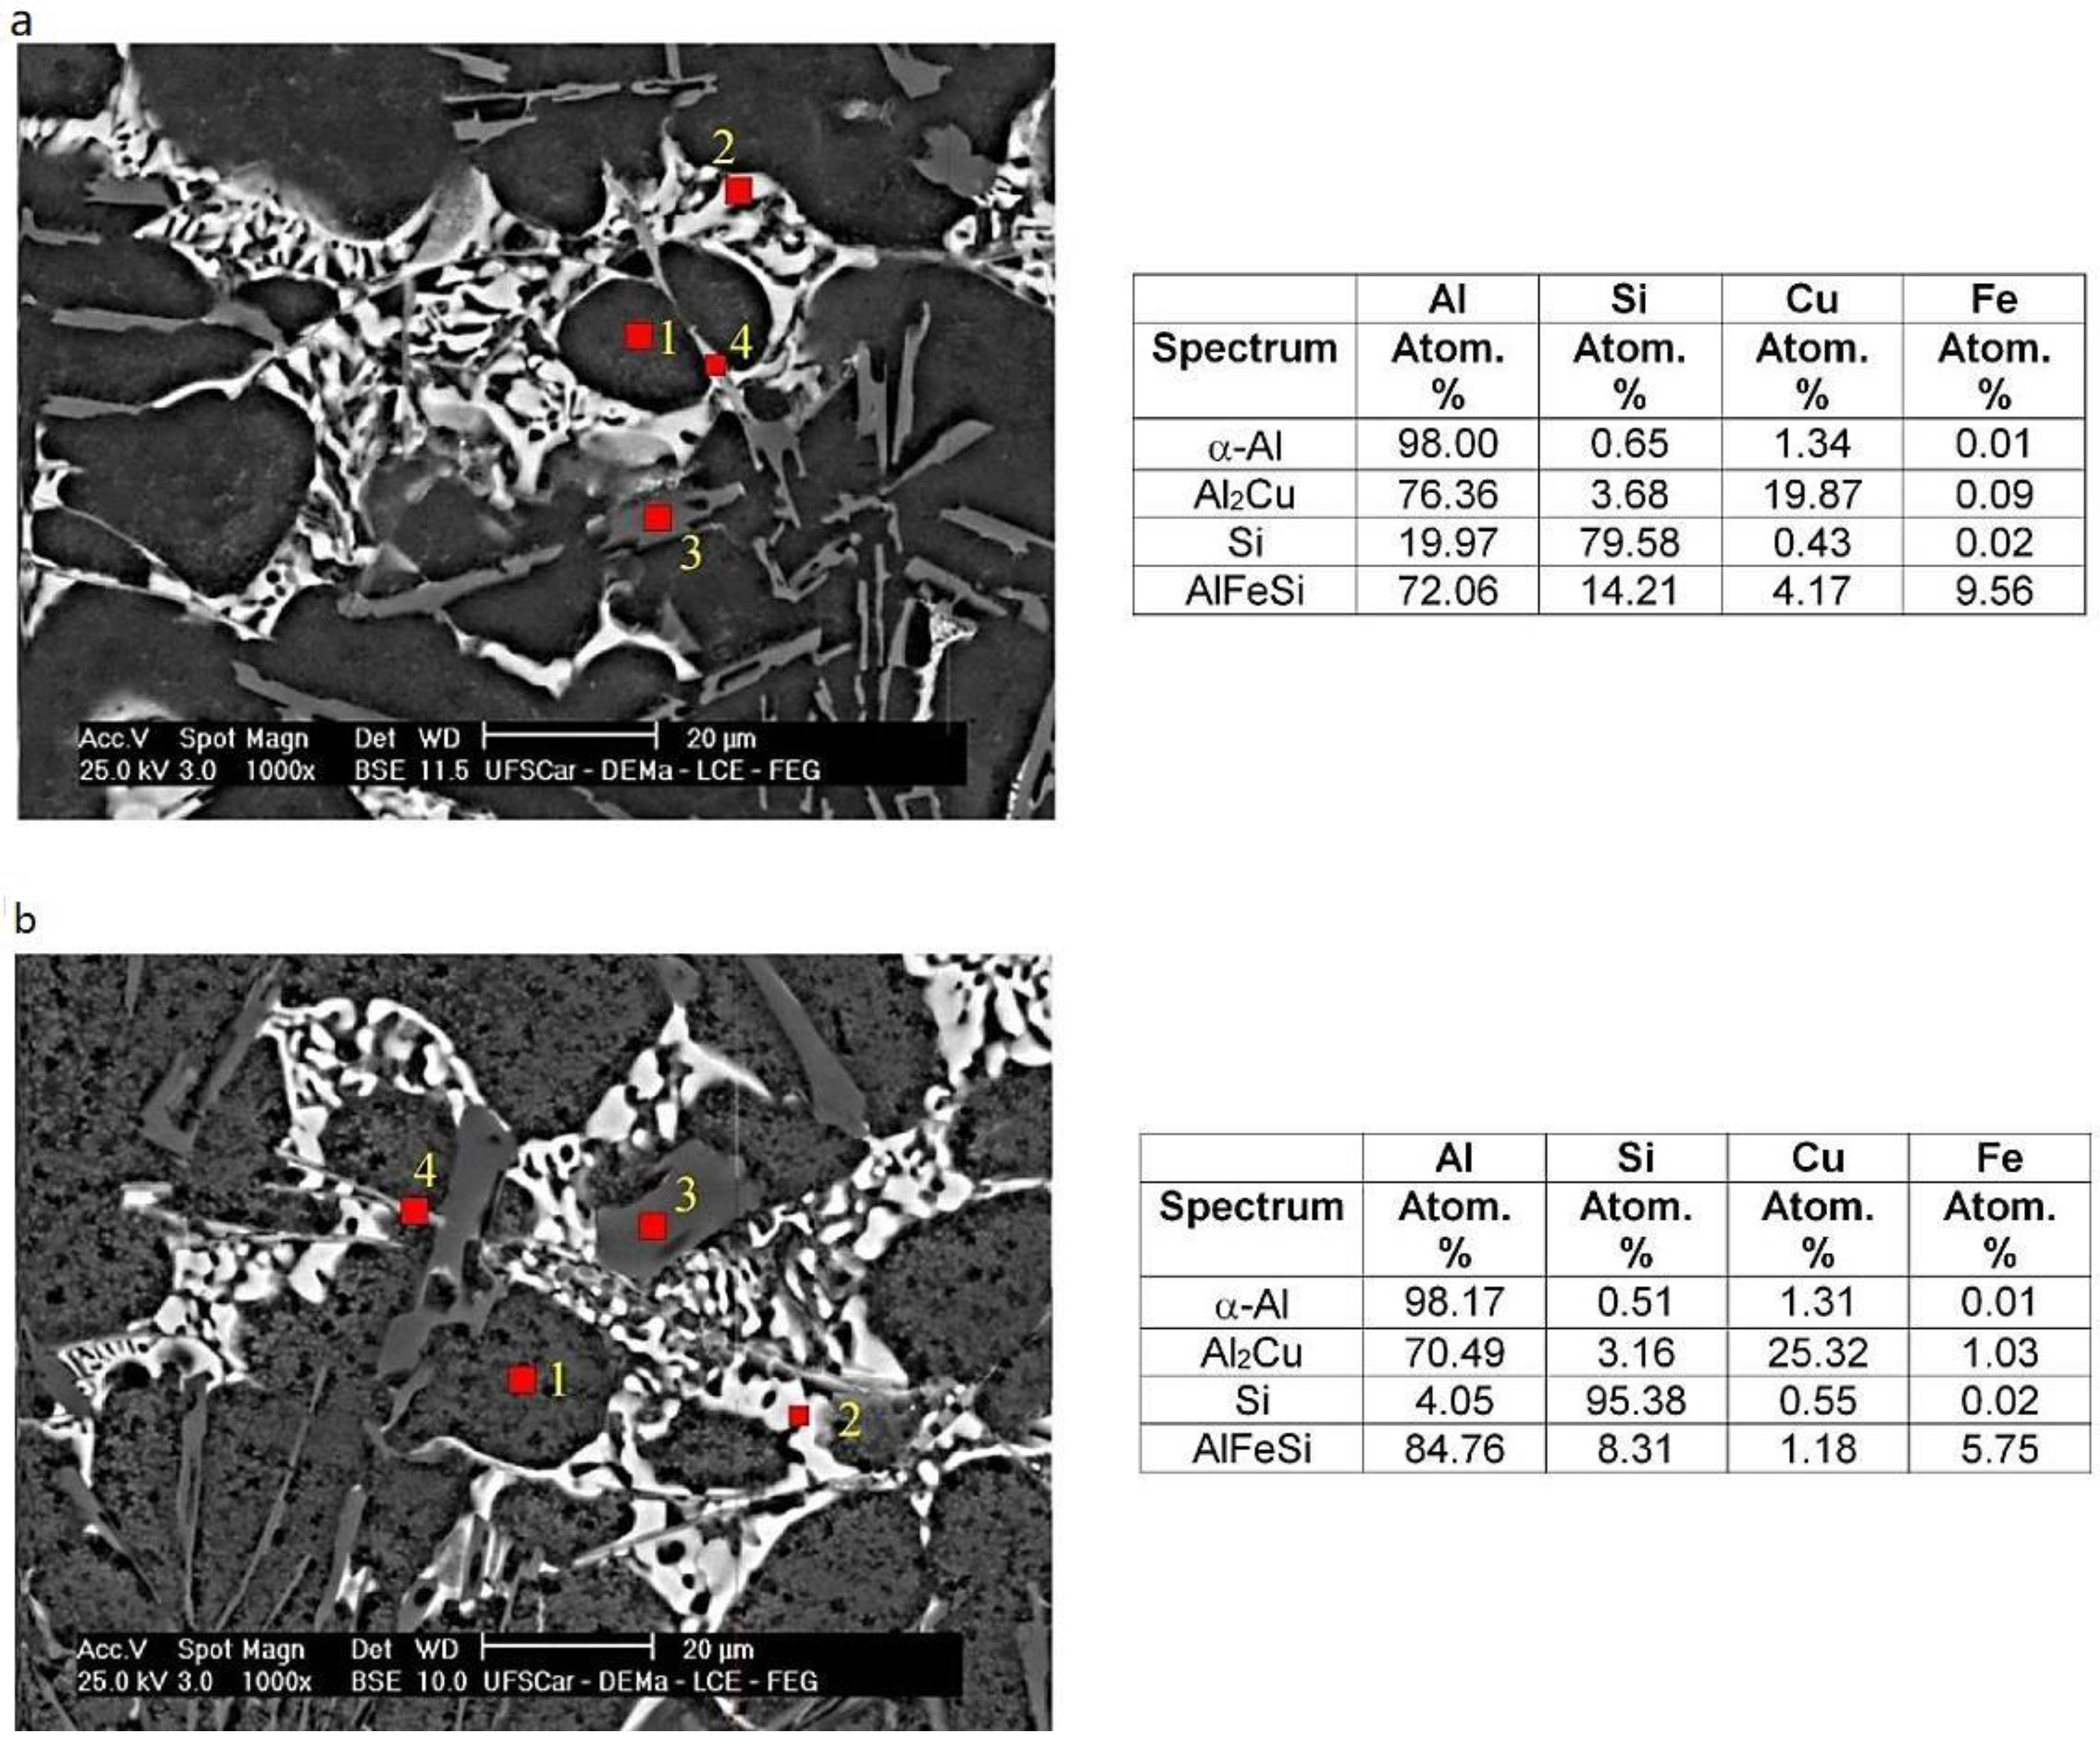
Higher magnification backscattered electron images were used to identify the growth of the Fe-bearing intermetallic needles, as indicated by arrows in Figure 13. Compositional analysis of these particles using EDS showed that the phases were: 1. α-Al; 2. Al2Cu; 3. Si; 4. AlFeSi. The detailed quantitative chemical composition analyses of solid phases for two different cooling rate samples of the Al-11wt %Si-4.5wt %Cu alloy are given in Figure 15. These particles can be considered to be coarse enough to permit an accurate determination of their compositions.
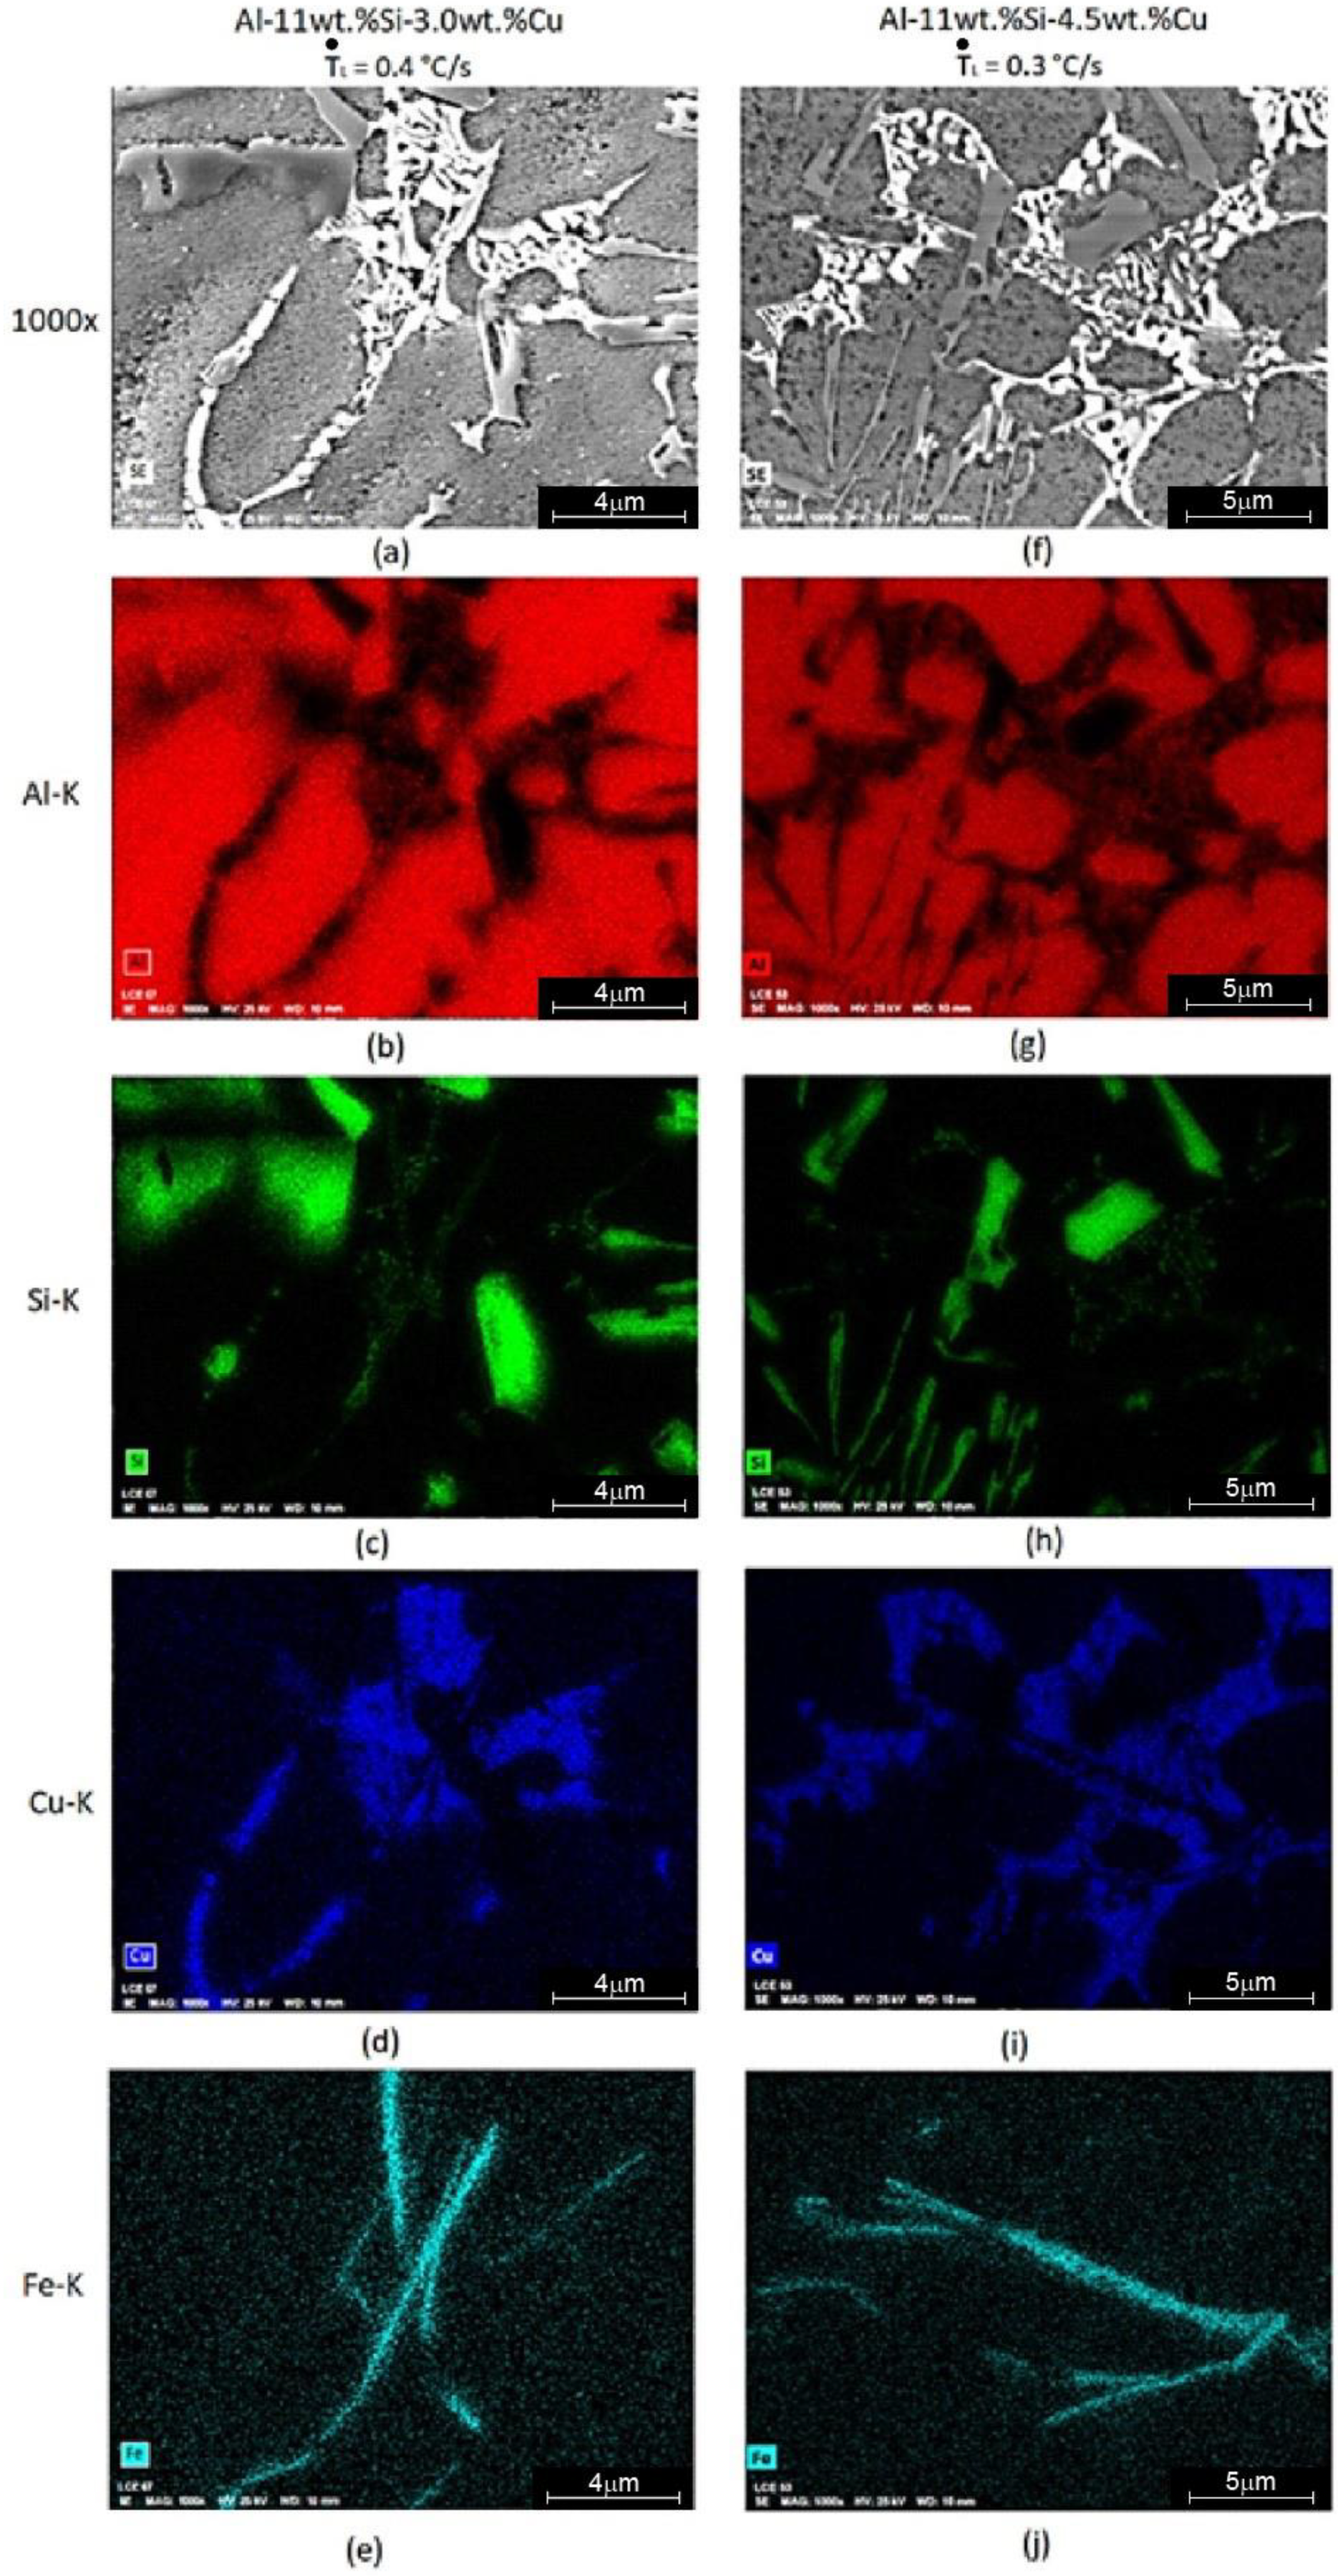
Samples related to the slow-cooled regions of the DS castings were chosen to be subjected to examination through elemental SEM-EDS mapping, as can be seen in Figure 14. The final distribution of the elements can be seen within the phases and constituents. The red contrast for Al showed a high intensity within the α-Al dendrite branches, as expected, while the green for Si was concentrated in both the binary and the ternary eutectic Si phase. Spots concentrated in Fe were noted in the fourth EDS mapping in the bottom images of Figure 14.
In the fast-cooled samples of Figure 12 and Figure 13, the morphology of the binary eutectic Si phase is polyhedral-like. However, for all the other samples related to lower cooling rates, the morphology of the eutectic Si is flake-like as can be seen in Figure 12, Figure 13, Figure 14 and Figure 15. The formation of polyhedral silicon particles in hypoeutectic Al–Si based alloys has not been commonly reported in the open literature.
In the present investigation, the Si precipitates although inhibited from growing in the samples, solidified under faster conditions. Under a fast regime of solidification, the liquid becomes enriched in Si, which remains constrained in between the primary stems. As the temperature declines, such particles may grow preferentially in the areas surrounding the Al2Cu particles, that is, the previous Cu-enriched zones. As a consequence, a flake-like morphology may not be attained since the growth is interrupted forming polyhedral Si particles. The preferential grown polyhedral silicon particles in fast-cooled samples are located neighbouring the Al2Cu particles, as can be seen in Figure 12d and Figure 13d. These morphologies in the Al-11wt %Si-3.0wt %Cu and Al-11wt %Si-4.5wt %Cu alloys were shown to be associated with cooling rates of 14.4 K/s and 20.8 K/s respectively, i.e., for a relative position in the casting of P = 3 mm.
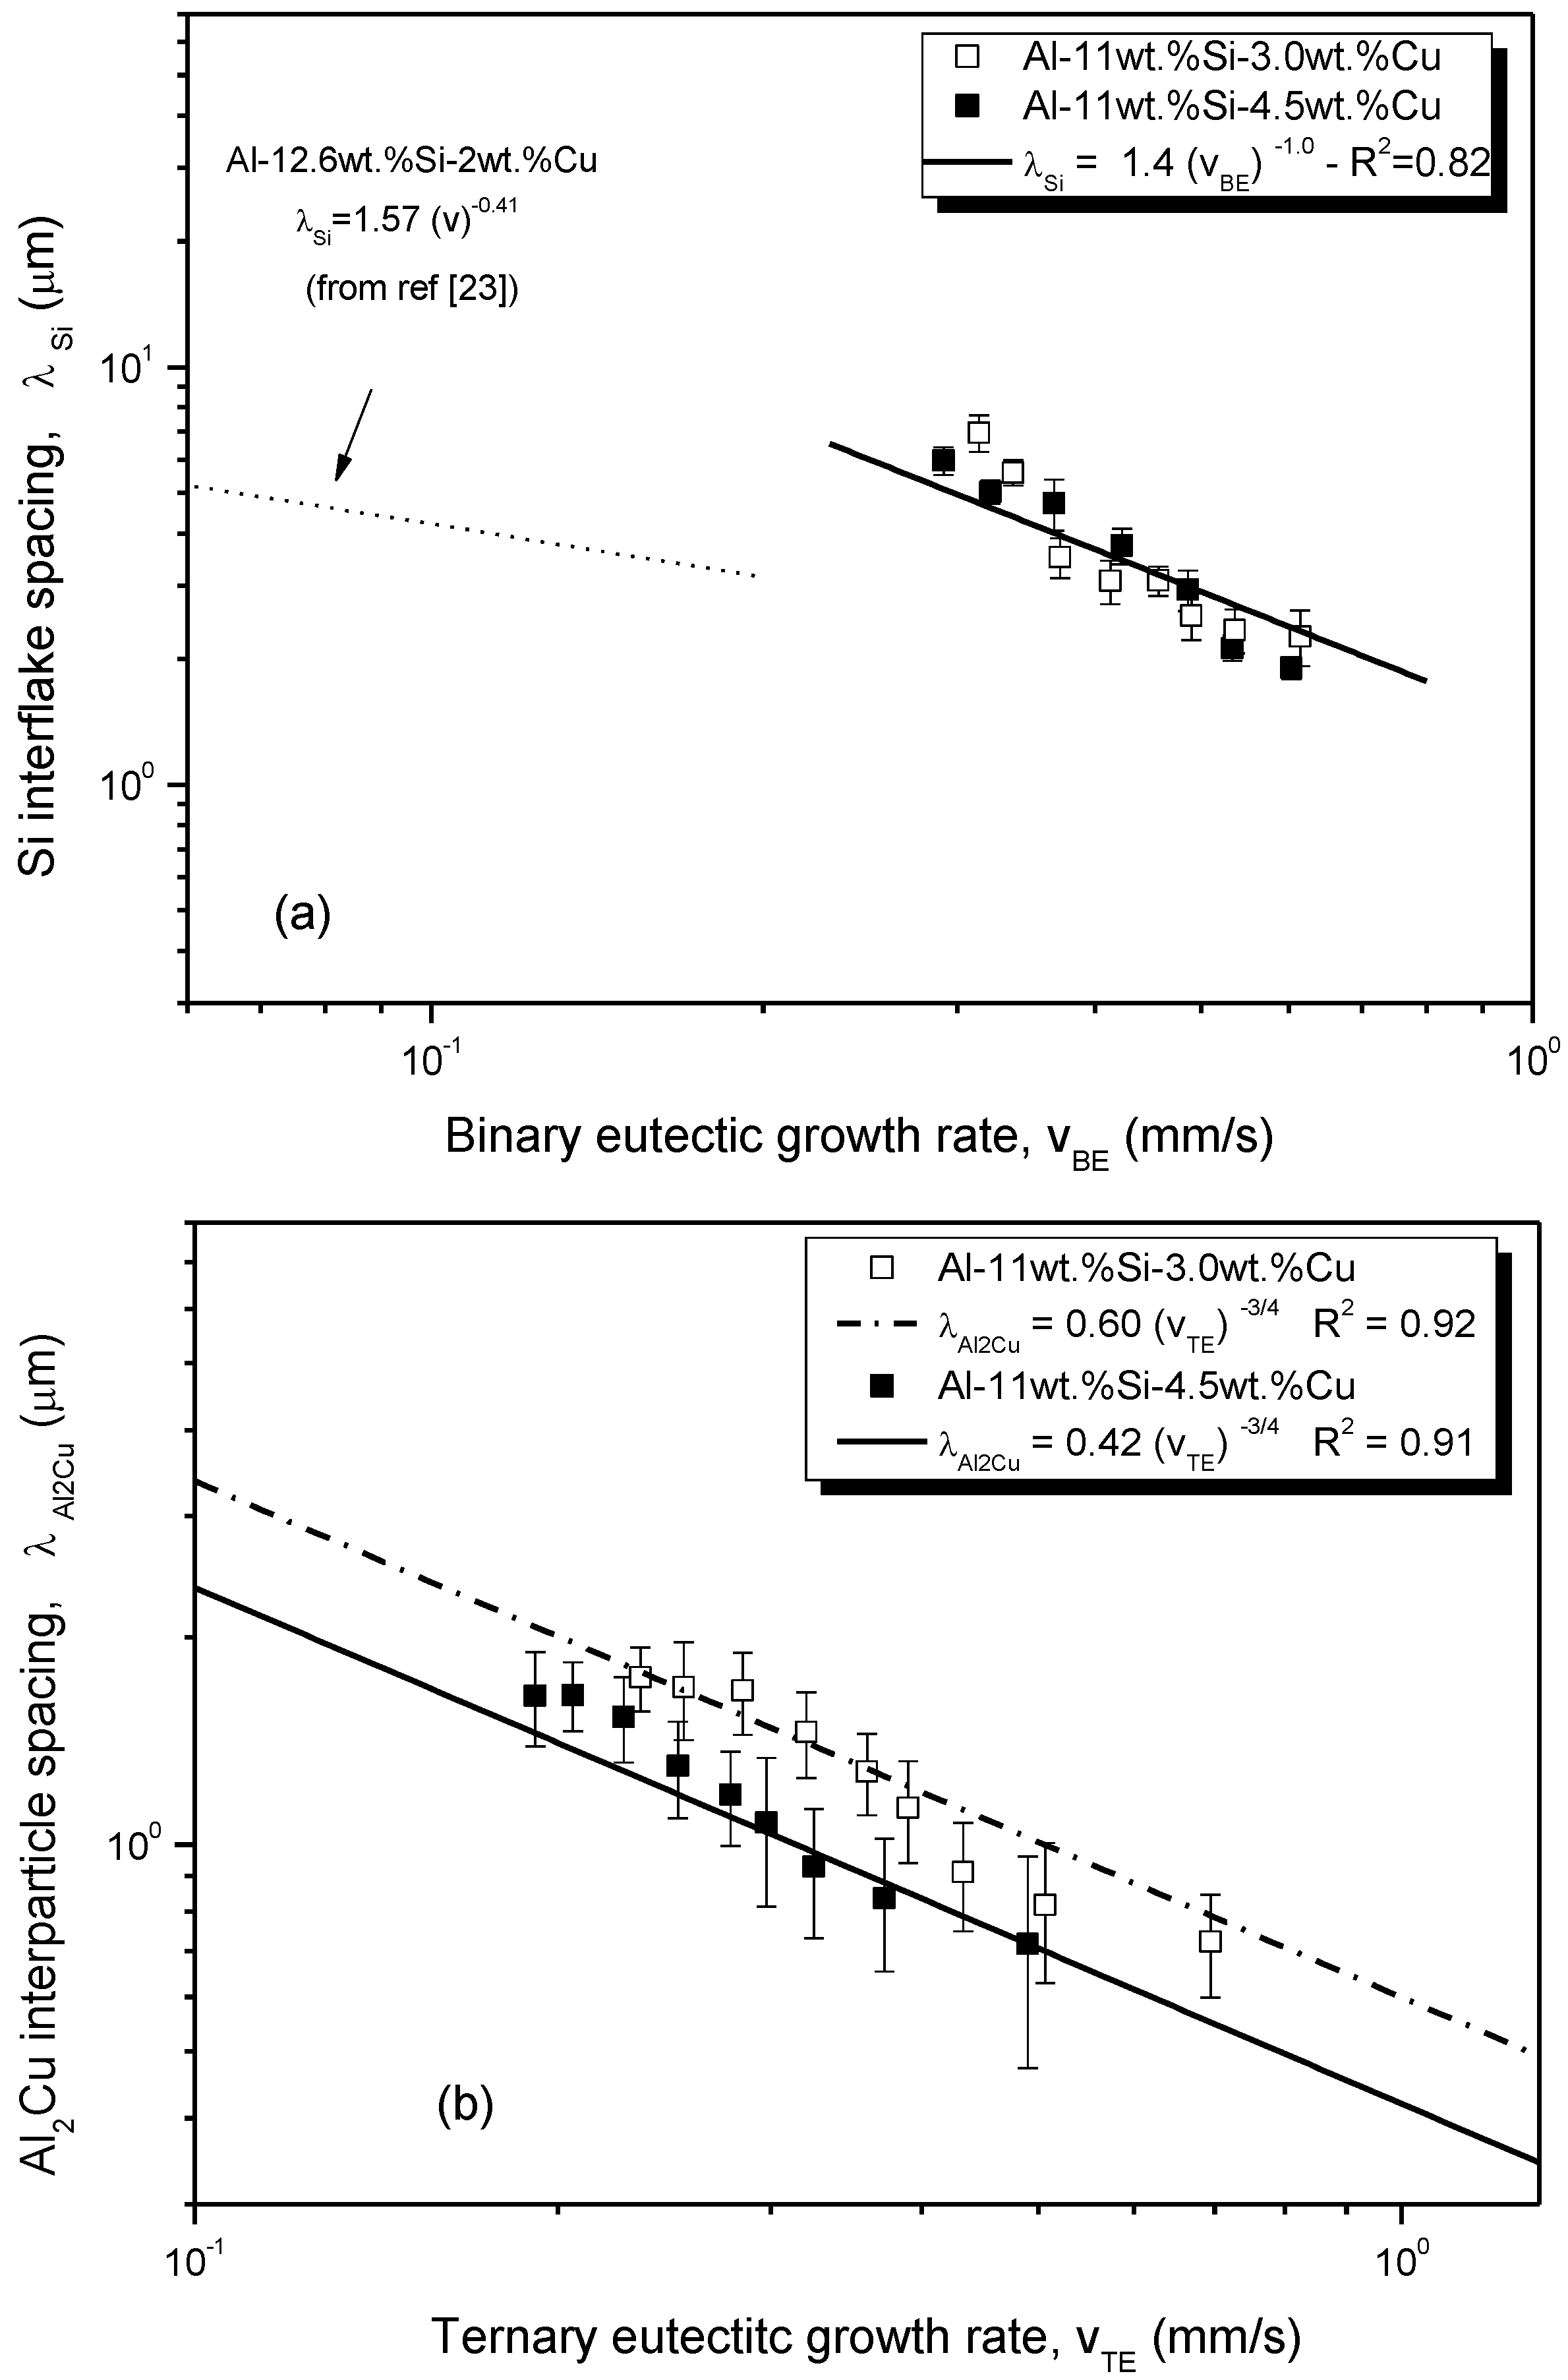
The experimental evolutions of the Si spacing, λSi, and the Al2Cu spacing, λAl2Cu, as a function of binary eutectic growth velocity, vBE, and as a function of the ternary eutectic growth velocity, vTE, were experimentally determined, and are plotted in Figure 16. Experimental growth laws in the form of power functions were established.
The binary Al–Si eutectic was characterized through the experimental evolution of λSi as a function of the eutectic growth velocity, as can be seen in Figure 16a. Figure 16a also synthesizes the experimental tendency (dot line) from the study by Kaya [23] (steady-state solidification of the Al-12.6wt %Si-2.0wt %Cu alloy) as a function of growth rate. It can be seen that the experimental eutectic growth law, derived in the present study, shows a higher slope if compared to the experimental tendency of the stationary regime. This demonstrates that the unsteady-state growth of eutectic Si in ternary Al–Si–Cu alloys seems to remain more sensitive to the variations in the solidification thermal parameters.
It was seen that a lower Al2Cu spacing characterizes the alloy with higher Cu content as compared to those of the other alloy (i.e., alloying of 3.0 wt % Cu). This is because the multiplier of the experimental equations in Figure 16b decreases from 0.60 to 0.42 with increase in the alloy Cu content, while preserving the same exponent for both experimental equations.
The exponents of the reported eutectic growth laws as a function of the growth rate were found to be close to −1/2 [26,27] rather than −3/4, as can be observed in the present results of Figure 16b. The −1/2 exponent is well established for the regular eutectic growth in binary Al–Cu alloys. The power growth law λ2v = constant is that which was originally proposed by Jackson and Hunt for the growth of regular eutectics [26].
However, it is important to remember that the microstructure of the referred ternary eutectic is formed by a three-phase mixture of silicon and Al2Cu in an α-Al matrix. As such, two major factors appear to contribute to the higher sensitivity of the variations in the growth rate rendered by a higher exponent: (i.) the thermal instability induced by the unsteady-state regime of heat flow extraction during the growth of the Al2Cu eutectic phase, and (ii.) the solute-driven unsteadiness due to the buildup of Si rejected during the growth of the AlSi eutectic.
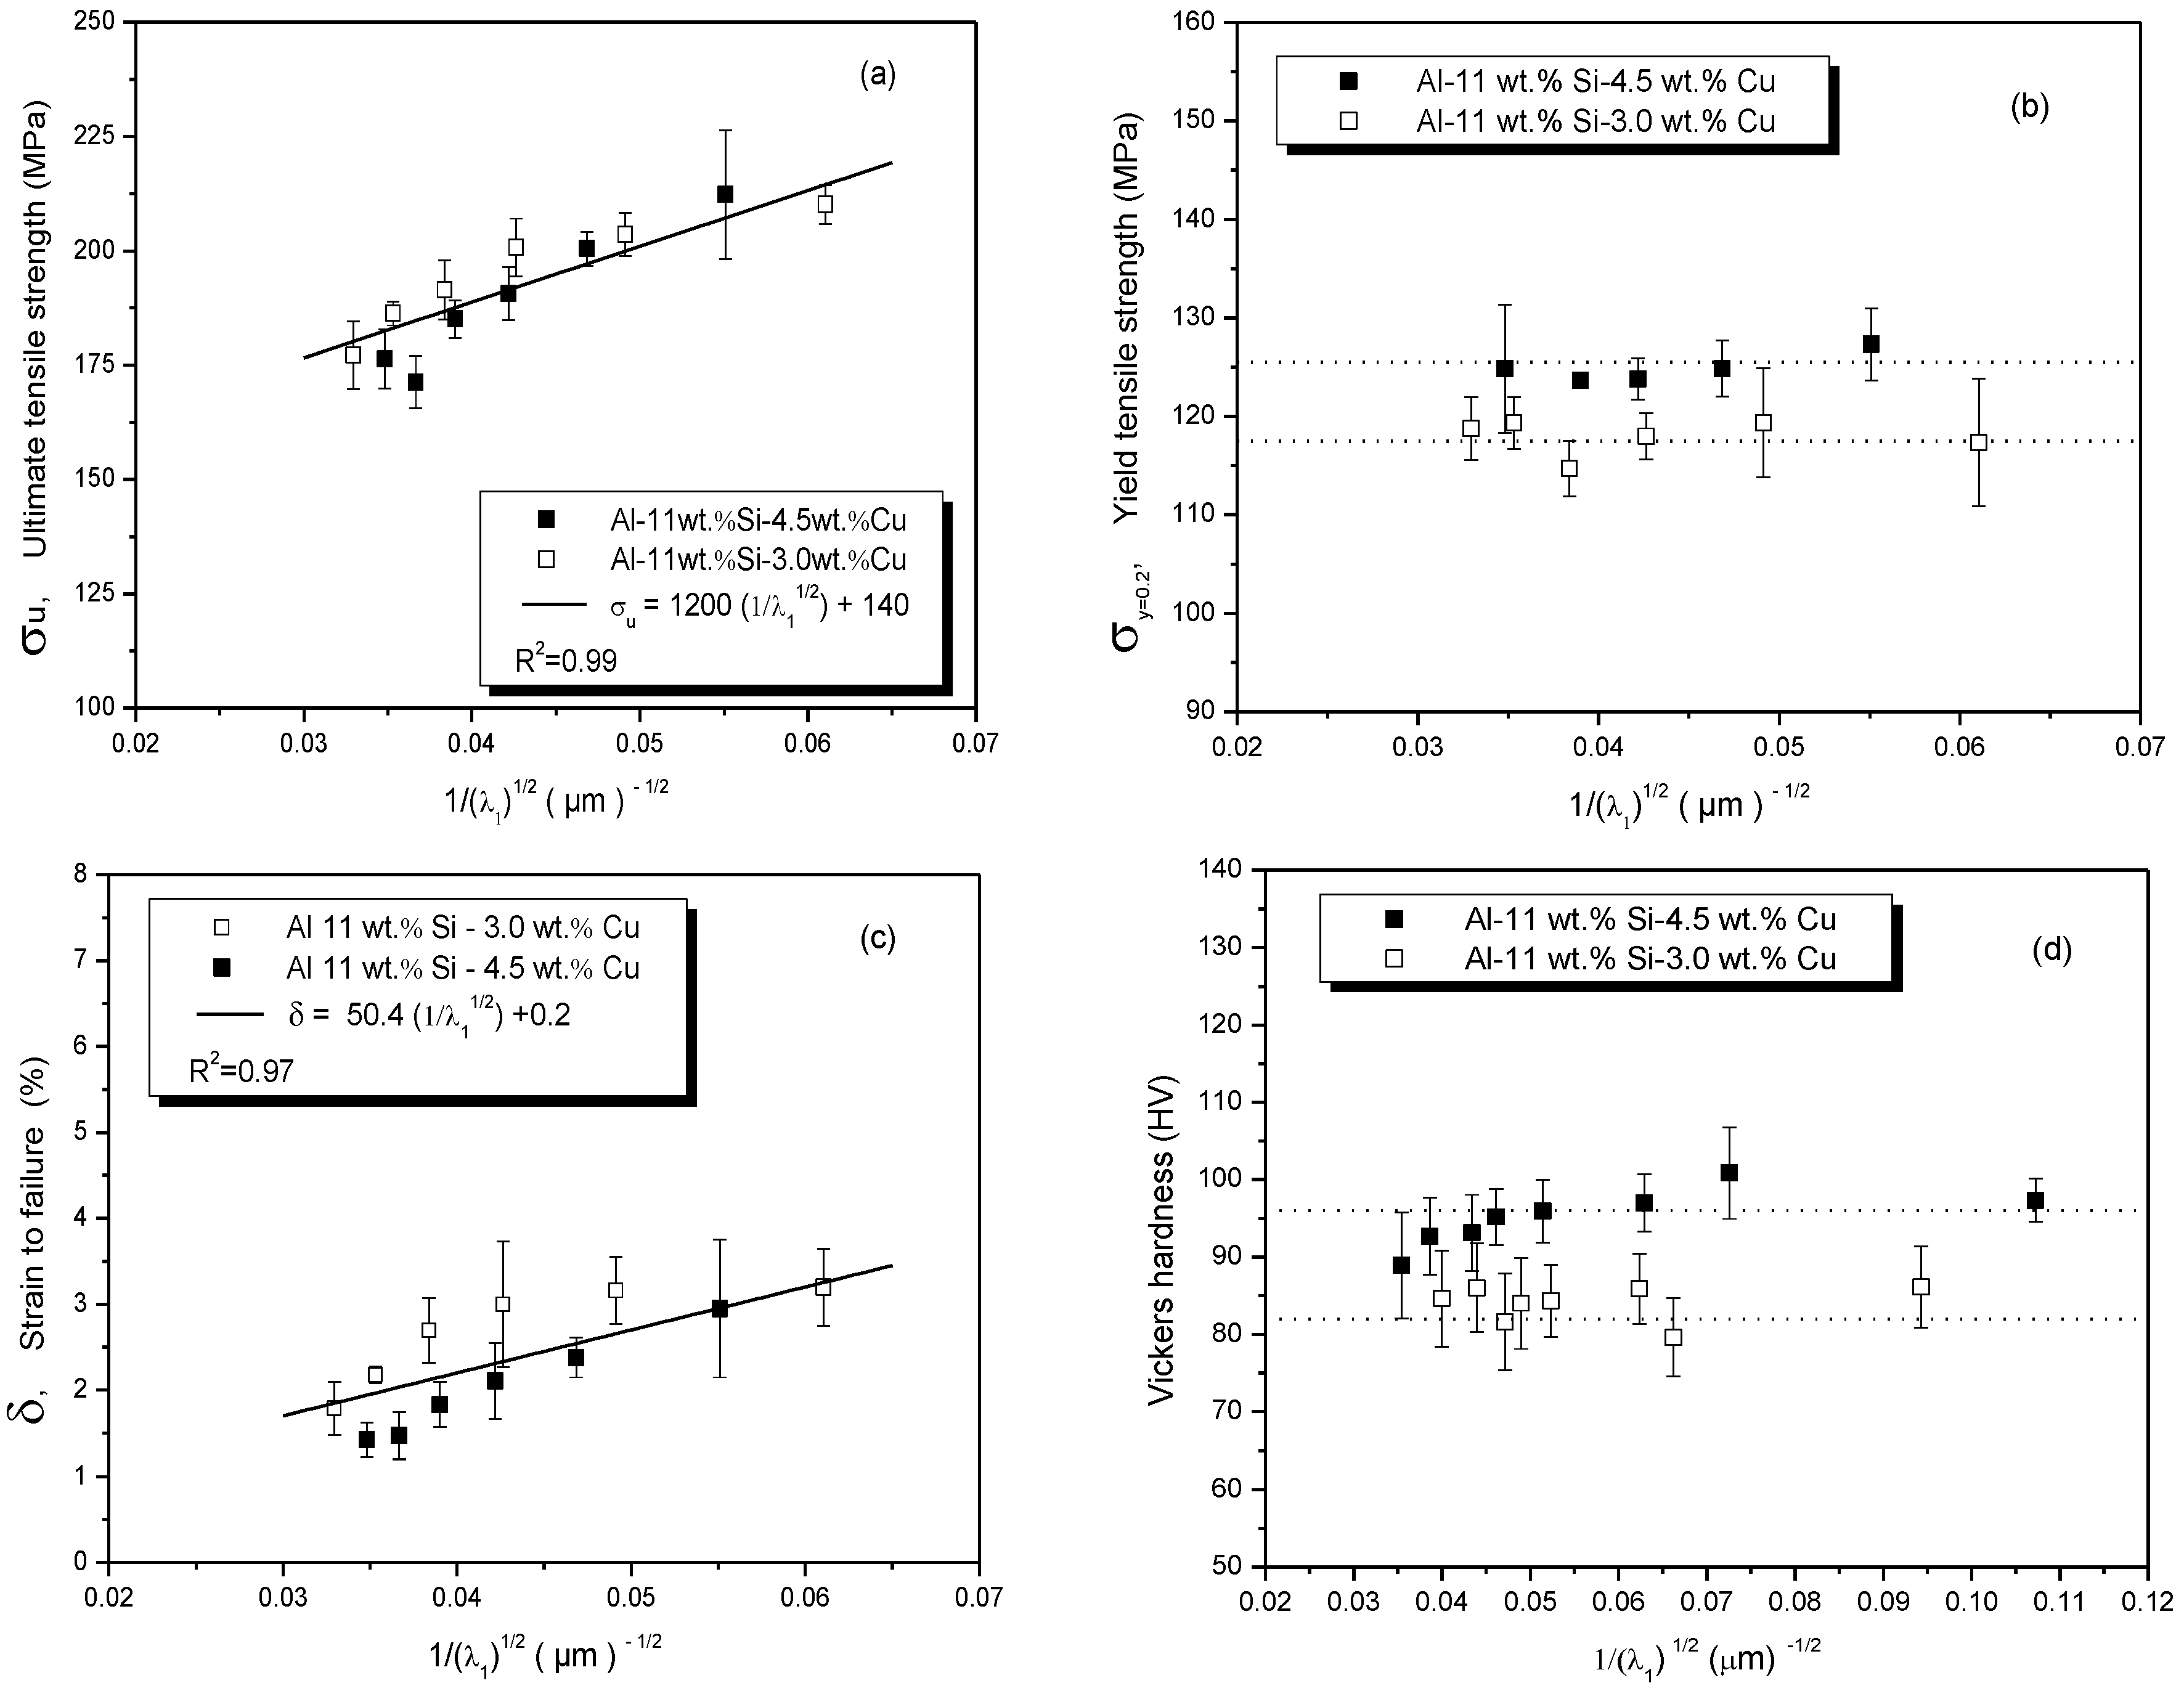
The evolutions of the experimental tensile mechanical properties versus the primary dendritic spacing are shown in Figure 17 for: (a) σu—ultimate tensile strength, (b) σy=0.2—yield strength, (c) δ—elongation-to-fracture, and (d) HV—Vickers hardness. Hall–Petch-type correlations were adopted to represent some of the experimental scatters.
Some aspects related to the Al-11wt %Si-3.0wt %Cu alloy may be synthetized. The combined mass fraction of α-Al + Si is ~60%, the ternary eutectic is 9% in fraction, and the eutectic spacing is higher in of about 43%, as compared to the other alloy. In contrast, the Al-11wt %Si-4.5wt %Cu alloy is characterized by ~47% of mass fraction of α-Al + Si, and 14% of the mass fraction of the ternary eutectic, as typified by a smaller eutectic spacing. Based on the mentioned data, it is possible that these changes in the different microstructure characteristics balance each other out, resulting in a similar evolution of the ultimate tensile strength and the strain-to-failure, as observed in Figure 17. Single Hall–Petch-type formulations are proposed in these cases to represent both alloys. σu and δ increase with decreasing λ1 along the length of the DS Al–Si–Cu alloy castings. This is because lower spacings contribute to a more extensive distribution of the second phases. If these hard particles are better distributed throughout the microstructure, higher strength values can be expected.
The variations in λ1 were shown to be not significant to change for both the yield tensile strength and the hardness. These properties are associated with lower stresses, as compared to σu and δ. In the case of σy, only the start of plastic deformation is achieved. Hardness indentations, in turn, exhibit relatively low plastic deformation. Under such lower stresses, the Al-11wt %Si-4.5wt %Cu alloy properties (σy=0.2 and HV) are higher, as can be seen in Figure 17b,d. This is explained by the higher proportions of Fe-bearing intermetallic particles and interdendritic fine scale ternary eutectic, as compared to those related to the Al-11wt %Si-3.0wt %Cu alloy.
4. Conclusions
The following conclusions can be drawn from the present experimental investigation:
- The solidification microstructures of the Al-11wt %Si-3.0 and 4.5wt %Cu braze alloy samples were shown to be characterized by aluminum-rich dendrites enveloped by the products of the eutectic reactions; that is, the Al–Si eutectic and the Al–Si–Al2Cu ternary eutectic.
- The fraction of phases forming the Al-11wt %Si-3.0 and -4.5wt %Cu alloys changed, respectively: from 9% to 6% of α-Al, followed by nearly 50% and 41% of the solid fraction of Si; after that, the growth of 32% and 39% of the solid fraction related to the AlFeSi phase before the eutectic reaction occurred in the remaining liquid. Accumulating the proportions of α-Al with that for the binary eutectic Si resulted in ~60% for the Al-11wt %Si-3.0wt %Cu alloy, while less than 50% of fraction of these phases was associated with the Al-11wt %Si-4.5wt %Cu alloy.
- Large dendritic variations in scale were shown to occur from the bottom to the top of the directionally solidified castings of both examined alloys, associated with a wide range of experimental solidification growth rates and cooling rates. This permitted the establishment of power function growth laws relating the primary (λ1), secondary (λ2), and tertiary (λ3) dendritic spacings as a function of the cooling rate (primary, tertiary) and the growth rate (secondary):
where λ1;2;3 (µm), vL (mm/s), and ṪL (K/s). This means that an increase in Cu alloying of 50% (from 3.0 to 4.5 wt %) was shown to be associated with an increase in λ1, λ2, and λ3 by 88%, 45%, and 42%, respectively, for a given value of ṪL or vL.Al-11wt %Si-3.0wt %Cu Al-11wt %Si-4.5wt %Cu λ1 = 265 ṪL−1/2 λ1 = 500 ṪL−1/2 λ2 = 11 vL−2/3 λ2 = 16 vL−2/3 λ3 = 12 ṪL−1/4 λ3 = 17 ṪL−1/4, - The experimental evolutions of the Si spacing, λSi, and the Al2Cu spacing, λAl2Cu, as a function of binary eutectic growth velocity, vBE, and as function of the ternary eutectic growth velocity, vTE, were experimentally determined, and experimental growth laws in the form of power functions established:
where λSi;Al2Cu (µm); vBE;TE (mm/s).Al-11wt %Si-3.0wt %Cu Al-11wt %Si-4.5wt %Cu λSi = 1.4 vBE−1.0 λSi = 1.4 vBE−1.0 λAl2Cu = 0.60 vTE−3/4 λAl2Cu = 0.42 vTE−3/4 - The experimental evolutions of ultimate tensile strength (σu) and the elongation-to-fracture (δ) were shown to be affected by the length scale of the dendritic phase, and they were related to λ1 by a single Hall–Petch-type correlation for both examined alloys; Al-11wt %Si-3.0wt %Cu, and Al-11wt %Si-4.5wt %Cu:σu = 1220 (1/λ1½) + 140where σu (MPa) and δ (%).δ = 50.4 (1/λ1½) + 0.2
Author Contributions
B.M.C.D. completed his Master’s degree on solidification in ternary Al-Si-Cu alloys. L.F.G. contributed to the SEM analysis. J.E.S. contributed to the supervision and funding acquisition; and A.G. contributed to the final analysis and revision of the writing.
Acknowledgments
The authors are grateful to FAPESP (São Paulo Research Foundation, Brazil: grant 2017/12741-6) and CNPq—National Council for Scientific and Technological Development, for their financial support.
Conflicts of Interest
The authors declare no conflict of interest.
References
- Choi, S.W.; Kim, Y.M.; Lee, K.M.; Cho, H.S.; Hong, S.K.; Kim, Y.C.; Kang, C.S.; Kumai, S. The effects of cooling rate and heat treatment on mechanical and thermal characteristics of Al–Si–Cu–Mg foundry alloys. J. Alloys Compd. 2014, 617, 654–659. [Google Scholar] [CrossRef]
- Cerri, E.; Evangelista, E.; Spigarelli, S.; Cavaliere, P.; Dericcardis, F. Effects of thermal treatments on microstructure and mechanical properties in a thixocast 319 aluminum alloy. Mater. Sci. Eng. A 2000, 284, 254–260. [Google Scholar] [CrossRef]
- Costa, T.A.; Dias, M.; Gomes, L.G.; Rocha, O.L.; Garcia, A. Effect of solution time in T6 heat treatment on microstructure and hardness of a directionally solidified Al-Si-Cu alloy. J. Alloys Compd. 2016, 683, 485–494. [Google Scholar] [CrossRef]
- Ponweiser, N.; Richter, K.W. New investigation of phase equilibria in the system Al-Cu Si. J. Alloys Compd. 2012, 512, 252–263. [Google Scholar] [CrossRef] [PubMed]
- Costa, T.A.; Moreira, A.L.; Moutinho, D.J.; Dias, M.; Ferreira, I.L.; Spinelli, J.E.; Rocha, O.L.; Garcia, A. Growth direction and Si alloying affecting directionally solidified structures of Al–Cu–Si alloys. Mater. Sci. Technol. 2015, 31, 1103–1112. [Google Scholar] [CrossRef]
- Kurz, W.; Fisher, D.J. Fundamentals of Solidification, 4th ed.; Trans Tech Publications Ltd.: Aedermannsdorf, Switzerland, 1992; pp. 1–16. ISBN 0-87849-522-3. [Google Scholar]
- Zeren, M.; Karakulak, E.; Gümüs, S. Influence of Cu addition on microstructure and hardness of near-eutectic Al-Si-xCu-alloys. Trans. Nonferrous Met. Soc. China 2011, 21, 1609–1702. [Google Scholar] [CrossRef]
- Garcia, A. Solidificação: Fundamentos e Aplicações, 2nd ed.; Editora da Unicamp: Campinas, Brazil, 2007; pp. 1–399. ISBN 978-85-268-0782-2. [Google Scholar]
- Silva, B.L.; Garcia, A.; Spinelli, J.E. Complex eutectic growth and Bi precipitation in ternary Sn-Bi-Cu and Sn-Bi-Ag alloys. J. Alloys Compd. 2017, 691, 600–605. [Google Scholar] [CrossRef]
- Elliot, R. Eutectic solidification. Int. Metals. Rev. 2013, 22, 161–186. [Google Scholar] [CrossRef]
- Tiller, W.A. Liquid Metals and Solidification, 1st ed.; ASM: Cleveland, OH, USA, 1958; pp. 276–318. [Google Scholar]
- Reyes, R.V.; Bello, T.S.; Kakitani, R.; Costa, T.A.; Garcia, A.; Cheung, N.; Spinelli, J.E. Tensile properties and related microstructures aspects of hypereutectic Al-Si alloys directionally solidified under different melt superheats and transient heat flow conditions. Mater. Sci. Eng. A 2017, 685, 235–243. [Google Scholar] [CrossRef]
- Kaya, H.; Çadirli, E.; Gündüz, M.; Ulgen, A. Effect of the temperature gradient, growth rate, and the interflake spacing on the microhardness in the directionally solidified Al-Si eutectic alloy. J. Mater. Eng. Perform. 2003, 12, 544–551. [Google Scholar] [CrossRef]
- Hajkowski, J.; Ignaszak, Z. Experimental and simulation tests on the impact of the conditions of casting solidification from AlSi9Cu3 alloy on their structure and mechanical properties. Arch. Foundry Eng. 2018, 18, 167–175. [Google Scholar] [CrossRef]
- Bray, J.W. ASM Handbook Volume 2: Properties and Selection: Nounferrous Alloys and Special-Purpose Materials, 10th ed.; ASM Intl.: Cleveland, OH, USA, 1990; p. 148. ISBN 0-87170-378-5. [Google Scholar]
- Ceschini, L.; Boromei, I.; Morri, A.; Seifeddine, S.; Svensson, I.L. Microstructure, tensile and fatigue properties of the Al-10%Si-2%Cu alloy with different Fe and Mn content cast under controlled conditions. J. Mater. Process. Technol. 2009, 209, 5669–5679. [Google Scholar] [CrossRef]
- Wang, E.R.; Hui, X.D.; Wang, S.S.; Zhao, Y.F.; Chen, G.L. Improved mechanical properties in cast Al–Si alloys by combined alloying of Fe and Cu. Mater. Sci. Eng. A 2010, 527, 7878–7884. [Google Scholar] [CrossRef]
- Okayasu, M.; Ohkura, Y.; Takeuchi, S.; Takasu, S.; Ohfuji, H.; Shiraishi, T. A study of the mechanical properties of an Al–Si–Cu alloy (ADC12) produced by various casting processes. Mater. Sci. Eng. A 2012, 543, 185–192. [Google Scholar] [CrossRef]
- Chang, S.Y.; Tsao, L.C.; Li, T.Y.; Chaung, T.H. Joining 6061 aluminum alloy with Al–Si–Cu filler metals. J. Alloys Compd. 2009, 488, 174–180. [Google Scholar] [CrossRef]
- Muhrat, A.; Puga, H.; Barbosa, J. Low-temperature brazing of titanium using Al-based filler alloys. Adv. Mater. Sci. Eng. 2018, 2018, 4570120. [Google Scholar] [CrossRef]
- Djurdjevic, M.B.; Vicario, I. Description of hypoeutectic Al-Si-Cu alloys based on their known chemical compositions. Rev. Metal. 2013, 49, 340–350. [Google Scholar] [CrossRef] [Green Version]
- Darlapudi, A.; Mcdonald, S.D.; Stjohn, D.H. The influence of ternary Cu additions on the nucleation of eutectic grains in a hypoeutectic Al-10 wt % Si alloy. J. Alloys Compd. 2015, 646, 699–705. [Google Scholar] [CrossRef]
- Kaya, H.; Aker, A. Effect of alloying elements and growth rates on microstructure and mechanical properties in the directionally solidified Al-Si-X alloys. J. Alloys Compd. 2017, 694, 145–154. [Google Scholar] [CrossRef]
- Canté, M.V.; Spinelli, J.E.; Cheung, N.; Garcia, A. The correlation between dendritic microstructure and mechanical properties of directionally solidified hypoeutectic Al-Ni alloys. Met. Mater. Int. 2010, 16, 39–49. [Google Scholar] [CrossRef]
- Rosa, D.M.; Spinelli, J.E.; Ferreira, I.L.; Garcia, A. Cellular growth during transient directional solidification of Pb–Sb alloys. J. Alloys Compd. 2006, 422, 227–238. [Google Scholar] [CrossRef]
- Jackson, K.A.; Hunt, J.D. Lamellar and rod eutectic growth. Trans. Metall. Soc. AIME 1966, 236, 1129–1142. [Google Scholar] [CrossRef]
- Morando, C.; Fornaro, O. Morphology and phase formation during the solidification of Al-Cu-Si and Al-Ag-Cu ternary eutectic systems. Mater. Res. 2018, 21, E20170930. [Google Scholar] [CrossRef]
Figure 1.
Overall sketches showing two adopted techniques dealing with the molten Al-11Si(-xCu) alloys in the present research, which are: the determination of cooling curves and consequently liquidus/eutectic temperatures, and an assembly of the directional solidification system with insertion of thermocouples within a split stainless steel mold.

Figure 2.
Directionally solidified (DS) macrostructures characterizing: (a) Al-11wt %Si-3wt %Cu and (b) Al-11wt %Si-4.5wt %Cu alloy castings.
Figure 2.
Directionally solidified (DS) macrostructures characterizing: (a) Al-11wt %Si-3wt %Cu and (b) Al-11wt %Si-4.5wt %Cu alloy castings.

Figure 3.
Experimental cooling curves considering different positions along the length of the (a) Al-11wt %Si-3.0wt %Cu and (b) Al-11wt %Si-4.5wt %Cu alloy castings. Each mentioned position refers to a thermocouple inserted within the DS casting.
Figure 3.
Experimental cooling curves considering different positions along the length of the (a) Al-11wt %Si-3.0wt %Cu and (b) Al-11wt %Si-4.5wt %Cu alloy castings. Each mentioned position refers to a thermocouple inserted within the DS casting.


Figure 4.
Experimental time-dependent (t) displacements of the liquidus isotherm along the casting length (P) of the Al-11Si-xCu alloys. R2 is the coefficient of determination.
Figure 4.
Experimental time-dependent (t) displacements of the liquidus isotherm along the casting length (P) of the Al-11Si-xCu alloys. R2 is the coefficient of determination.

Figure 5.
Experimental variations of (a,b) growth rate and (c,d) tip cooling rate during unsteady state directional solidification of the ternary Al-11Si-xCu alloys. R2 is the coefficient of determination.
Figure 5.
Experimental variations of (a,b) growth rate and (c,d) tip cooling rate during unsteady state directional solidification of the ternary Al-11Si-xCu alloys. R2 is the coefficient of determination.

Figure 6.
Optical microstructures representing different positions (P) along the casting length; that is, different cooling rates during solidification of the Al-11wt %Si-3.0wt %Cu alloy: (a,b) P = 3 mm, (c,d) P = 8 mm and (e,f) P = 48 mm.
Figure 6.
Optical microstructures representing different positions (P) along the casting length; that is, different cooling rates during solidification of the Al-11wt %Si-3.0wt %Cu alloy: (a,b) P = 3 mm, (c,d) P = 8 mm and (e,f) P = 48 mm.

Figure 7.
Optical microstructures representing different positions along the casting length, that is, different cooling rates during solidification of the Al-11wt %Si-4.5wt %Cu alloy: (a,b) P = 3 mm, (c,d) P = 8 mm and (e,f) P = 48 mm.
Figure 7.
Optical microstructures representing different positions along the casting length, that is, different cooling rates during solidification of the Al-11wt %Si-4.5wt %Cu alloy: (a,b) P = 3 mm, (c,d) P = 8 mm and (e,f) P = 48 mm.

Figure 8.
Primary (a,b), secondary (c,d), and tertiary (e,f) dendrite arm spacing variations across the length of the Al-11Si-xCu braze alloy castings.
Figure 8.
Primary (a,b), secondary (c,d), and tertiary (e,f) dendrite arm spacing variations across the length of the Al-11Si-xCu braze alloy castings.

Figure 9.
Experimental variations characterizing: (a) primary dendrite arm spacing, λ1, vs. cooling rate, (b) secondary dendrite arm spacing, λ2, vs. growth rate, and (c) tertiary dendrite arm spacing, λ3, vs. cooling rate of the Al-11wt %Si-xwt %Cu alloys. R2 is the coefficient of determination.
Figure 9.
Experimental variations characterizing: (a) primary dendrite arm spacing, λ1, vs. cooling rate, (b) secondary dendrite arm spacing, λ2, vs. growth rate, and (c) tertiary dendrite arm spacing, λ3, vs. cooling rate of the Al-11wt %Si-xwt %Cu alloys. R2 is the coefficient of determination.

Figure 10.
Partial pseudo-binary Al-11wt %Si-xCu phase diagram, and graphs of temperature versus the solid fraction (solidification paths), computed by the Thermo-Calc software for alloys containing 0.2 wt % Fe.
Figure 10.
Partial pseudo-binary Al-11wt %Si-xCu phase diagram, and graphs of temperature versus the solid fraction (solidification paths), computed by the Thermo-Calc software for alloys containing 0.2 wt % Fe.

Figure 11.
X-ray diffraction (XRD) patterns of the (a) Al-11wt %Si-3.0 and (b) -4.5wt %Cu alloy samples solidified at different cooling rates.
Figure 11.
X-ray diffraction (XRD) patterns of the (a) Al-11wt %Si-3.0 and (b) -4.5wt %Cu alloy samples solidified at different cooling rates.

Figure 12.
Transverse scanning electron microscopy (SEM) microstructures related to distinct magnifications and cooling rates (i.e., (a–d): 14.4 °C/s and (e–h): 4.6 °C/s) during directional solidification of the Al-11wt %Si-3.0wt %Cu alloy.
Figure 12.
Transverse scanning electron microscopy (SEM) microstructures related to distinct magnifications and cooling rates (i.e., (a–d): 14.4 °C/s and (e–h): 4.6 °C/s) during directional solidification of the Al-11wt %Si-3.0wt %Cu alloy.

Figure 13.
Transverse SEM microstructures related to distinct magnifications and cooling rates (i.e., (a–d): 20.8 °C/s and (e–h): 5.7 °C/s) during directional solidification of the Al-11wt %Si-4.5wt %Cu alloy.
Figure 13.
Transverse SEM microstructures related to distinct magnifications and cooling rates (i.e., (a–d): 20.8 °C/s and (e–h): 5.7 °C/s) during directional solidification of the Al-11wt %Si-4.5wt %Cu alloy.

Figure 14.
SEM images in the SE signal of the (a,f) Al–Si–Cu alloy samples along the casting length at different positions from the cooled bottom surface, and respective X-ray elemental mappings through energy dispersive X-ray spectrometry (EDS): Al–K (b,g), Si–K (c,h), Cu–K (d,i) and Fe–K (e,j).
Figure 14.
SEM images in the SE signal of the (a,f) Al–Si–Cu alloy samples along the casting length at different positions from the cooled bottom surface, and respective X-ray elemental mappings through energy dispersive X-ray spectrometry (EDS): Al–K (b,g), Si–K (c,h), Cu–K (d,i) and Fe–K (e,j).

Figure 15.
Representative SEM microstructures and EDS microprobe measurements (at. %) related to the positions (P) (a) 8 mm, and (b) 48 mm from the cooled bottom of the Al-11wt %Si-4.5wt %Cu alloy.
Figure 15.
Representative SEM microstructures and EDS microprobe measurements (at. %) related to the positions (P) (a) 8 mm, and (b) 48 mm from the cooled bottom of the Al-11wt %Si-4.5wt %Cu alloy.

Figure 16.
Experimental variations characterizing: (a) Si interflake spacing, λSi, vs. eutectic growth velocity and (b) Al2Cu inter-particle spacing vs. eutectic growth velocity of the Al-11wt %Si-xwt %Cu alloys. R2 is the coefficient of determination.
Figure 16.
Experimental variations characterizing: (a) Si interflake spacing, λSi, vs. eutectic growth velocity and (b) Al2Cu inter-particle spacing vs. eutectic growth velocity of the Al-11wt %Si-xwt %Cu alloys. R2 is the coefficient of determination.

Figure 17.
(a) Ultimate, (b) yield tensile strength, (c) elongation, and (d) Vickers hardness as a function of the primary dendritic spacing for the Al-11wt %Si-xwt %Cu alloys. R2 is the coefficient of determination.
Figure 17.
(a) Ultimate, (b) yield tensile strength, (c) elongation, and (d) Vickers hardness as a function of the primary dendritic spacing for the Al-11wt %Si-xwt %Cu alloys. R2 is the coefficient of determination.

© 2018 by the authors. Licensee MDPI, Basel, Switzerland. This article is an open access article distributed under the terms and conditions of the Creative Commons Attribution (CC BY) license (http://creativecommons.org/licenses/by/4.0/).
Share and Cite
MDPI and ACS Style
Donadoni, B.M.C.; Gomes, L.F.; Garcia, A.; Spinelli, J.E. Tailoring of Microstructures and Tensile Properties in the Solidification of Al-11Si(-xCu) Brazing Alloys. Metals 2018, 8, 784. https://doi.org/10.3390/met8100784
AMA Style
Donadoni BMC, Gomes LF, Garcia A, Spinelli JE. Tailoring of Microstructures and Tensile Properties in the Solidification of Al-11Si(-xCu) Brazing Alloys. Metals. 2018; 8(10):784. https://doi.org/10.3390/met8100784
Chicago/Turabian StyleDonadoni, Bruno Monti Carmelo, Leonardo Fernandes Gomes, Amauri Garcia, and José Eduardo Spinelli. 2018. "Tailoring of Microstructures and Tensile Properties in the Solidification of Al-11Si(-xCu) Brazing Alloys" Metals 8, no. 10: 784. https://doi.org/10.3390/met8100784
Note that from the first issue of 2016, this journal uses article numbers instead of page numbers. See further details here.