Thixoforming of an Fe-Rich Al-Si-Cu Alloy—Thermodynamic Characterization, Microstructural Evolution, and Rheological Behavior


Materials and Manufacturing Department, Faculty of Mechanical Engineering, University of Campinas—UNICAMP, Campinas, SP 13083-860, Brazil
*
Author to whom correspondence should be addressed.
Metals 2018, 8(5), 332; https://doi.org/10.3390/met8050332
Submission received: 28 February 2018
/
Revised: 20 April 2018
/
Accepted: 20 April 2018
/
Published: 9 May 2018
(This article belongs to the Special Issue Semi-Solid Processing of Alloys and Composites)
Abstract
:Thixoforming depends on three factors: (a) the thermodynamic stability of the solid-to-liquid transformation in the presence of temperature fluctuations; (b) the size and morphology of the solid particles in the liquid in the semisolid state; and (c) the rheology of the semisolid slurry during formation. In this study, these parameters were characterized for an Al-Si-Cu alloy with a high Fe content (B319+Fe alloy). Fe is usually found in raw metal produced by recycling, and its removal increases processing costs. This study is an attempt to use this lower-cost alloy for the thixoforming route. Thermodynamic analysis was performed by numerical simulation (under Scheil conditions) and the application of the differentiation method (DM) to differential scanning calorimetry (DSC) curves recorded during heating cycles up to 700 °C at 5, 10, 15, 20, and 25 °C/min. The processing window was evaluated by comparing the results of the DM and those of the analysis of open-die thixoforged samples after isothermal heat treatment at 575, 582, 591, and 595 °C for 0, 30, 60, and 90 s. The microstructural and rheological behavior of the semisolid slurry was analyzed at 591 and 595 °C for all four soak times. Isothermal heat treatment caused the refinement and spheroidization of the solid phase. Good agreement between the predicted thermodynamic behavior and the microstructural behavior of the thixoformed B319+Fe alloy samples was observed. Although the alloy exhibited a coarse microstructure, it was microstructurally and rheologically stable at all temperatures and for all the soak times studied, indicating that B319+Fe is a promising raw material for thixoforming.
1. Introduction
Semisolid materials (SSM) processing is the formation of metallic alloys in the semisolid state and can be an advantageous alternative to conventional metal forming and casting operations [1,2]. SSM processing can be performed by cooling liquid metal to the semisolid state in a range of operations called rheocasting [3] or by heating solid metal to the semisolid condition in a range of operations called thixoforming [4].
Thixoforming is carried out at approximately 0.3–0.6 liquid fractions and consists essentially of three main consecutive steps: (a) controlled heating from the solid to the semisolid condition at a specific heating rate until the desired thixoforming temperature is reached; (b) isothermal treatment at the chosen processing temperature for a specific soak time; and (c) formation of the semisolid slurry into a die with the pre-form (near-net-shape) or form (net-shape) of the final product [5].
It is crucial in thixoforming that (a) the solid particles in the liquid have a refined, spheroidal microstructure and (b) the solid-liquid mixture is stable. The former requirement ensures that the semisolid slurry has a thixotropic rheology, which is responsible for the advantageous smooth, laminar die-filling characteristic of SSM processing [6,7,8,9]. The raw-metal microstructure, heating rate, processing temperature, soak time, and shear rate during formation play a crucial role in the microstructure and, consequently, the rheology of the semisolid slurry. A stable solid-liquid mixture, i.e., a controllable microstructure, rheology, and liquid fraction in the presence of temperature variations during formation, ensures that SSM processing is reproducible. Achieving this stable mixture requires certain thermodynamic characteristics, which in turn depend on the chemical composition of the alloy and the kinetics of the thixoforming process. An alloy possessing these characteristics is said to be thixoformable [10,11,12].
Although SSM technology has been in use for approximately 40 years, the range of alloys used in thixoforming processes is still limited mainly to the aluminum alloys A356 and A357 [13]. The Semisolid Processing Group in the Faculty of Mechanical Engineering at the State University of Campinas (UNICAMP) has undertaken several research efforts to increase the number of potential alloys that can be used in SSM processing. These include studies of systems such as Al-Si, Al-Si-Cu, Al-Si-Mg, and Fe-C-Si using many pre-processing routes, including electromagnetic and ultrasound stirring and equal channel angular pressing (ECAP) [14,15,16,17,18,19,20]. The present study represents a new attempt to expand the range of raw materials suitable for SSM processing and focuses on Al alloys with high levels of Fe, an element usually found in alloys produced using recycled metal and whose removal increases processing costs [21,22]. The study analyses the suitability for thixoforming of an Al-Si-Cu alloy with a high level of Fe. The differentiation method (DM) [23,24] is used, and the microstructure and rheology of the semisolid slurry are analyzed. As the focus of the study is the processing of this alloy; the mechanical properties and microstructure of the final thixoformed product are not discussed here but will form the subject of a future study.
2. Experimental Procedure
The chemical composition of the Al-Si-Cu-Fe alloy studied here is shown in Table 1 and was determined with an Anacon BILL optical emission spectrometer (OES) (Anacon, São Paulo, Brazil). The alloy has the same chemical composition as commercial B319 alloy except for the Fe content, which is greater than the maximum permitted for this grade (1.2 wt.%) [25]. It is therefore referred to here as “B319+Fe”. The alloy was melted and poured in a semi-continuous casting system consisting of a refrigerated copper mold (30 mm D × 180 mm L). Grain refinement was achieved by adding an Al-5.0 wt.%Ti-1.0 wt.%B master alloy until the liquid alloy had a Ti content of 0.2 wt.%, and then applying magnetic stirring to the solidifying ingots with an 8 kW 14 G induction coil around the casting die.
Thermal analysis to determine the experimental fl vs. T curve for the alloy was performed with a NETZSCH STA 409C DSC system (Netzsch, Bayern, Germany). The STA 409C has a resolution of 720,000 digits, a data acquisition rate of 20 data s−1, and a sensitivity of 710 mV, giving a measurement accuracy of more than 0.5 °C. The cylindrical DSC sample (max. 5 mm D × 3 mm H) weighs approximately 20 mg. The sample was heated to 700 °C at 5, 10, 15, 20, and 25 °C/min. The heat flow rate (here called HFR) and temperature were monitored with thermocouples so that HFR vs. T curves could be generated. All DSC tests were carried out using the same specimen to prevent differences in the chemical composition along the billet from influencing the results. Prior to data acquisition, the DSC sample was heated to 700 °C and then cooled to room temperature at the lowest rate (5 °C/min), to also guarantee chemical homogeneity along the specimen. The differentiation method (DM) [23] was applied to the DSC data to determine the temperatures corresponding to the solidus, liquidus, main eutectic knee, and limits of the thixoforming working window. To this end, the HFR data were differentiated with respect to temperature, giving the variation in HFR with temperature during the heating process (dHFR/dT vs. T curves). The fl vs. T relationship was determined with NETZSCH Protheus® thermal analysis software (V4.8.3, Netzsch, Bayern, Germany) by applying the corrected Flynn method [24] of integration of partial areas under the DSC curves. The use of the corrected Flynn method is justified by the presence of tertiary phases on the DSC curves. Origin® software (V8.0951, OriginLab Corporation, Northampton, MA, USA) was used for direct differentiation of the fl vs. T curve to obtain the dfl/dT (sensitivity) vs. T curve.
Thermodynamic simulation was performed with Thermo-Calc® (V5.01.61, Foundation for Computacional Thermodynamics, Stockolm, Sweden) to generate the fl vs. T curve for the alloy under non-equilibrium Scheil conditions [26]. The results of this simulation were used as a reference for the experimental curves. The percentages of Al, Cu, Mg, Fe, and Ti were considered in the simulation. The TTAL5 database was used.
Thermal treatment to analyze the microstructural evolution of the B319+Fe alloy in the semisolid state was performed using cylindrical samples (20 mm D × 30 mm H) taken from the as-cast ingots. The samples were heated to approximately 550 °C at an initial heating rate of 100 °C/min and then further heated to 575, 582, 591, or 595 °C at a rate of approximately 18–22 °C/min. After being kept at the holding temperature for 0, 30, 60, or 90 s, the samples were immediately quenched in water. Temperature was monitored with a thermocouple placed within a hole drilled at the upper flat surface of the cylinder. The thermocouple tip matched the geometrical center of the sample (10 mm D × 15 mm H). A Norax 8 kHz 25 kW induction furnace (NoraxCanada, Montreal, QC, Canada) with a temperature accuracy within ±2 °C was used.
Microstructural homogeneity along the transversal section of the ingots was achieved in approximately 80% of the correspondent length. Approximately 10% of the length presented coarser grains, due to the lower heat flow in the center of the ingot, and 10% (borders) presented smaller grains due to contact with the refrigerated surface during casting. Therefore, micrographs used in this work were taken from this intermediate homogeneous region between the center and borders.
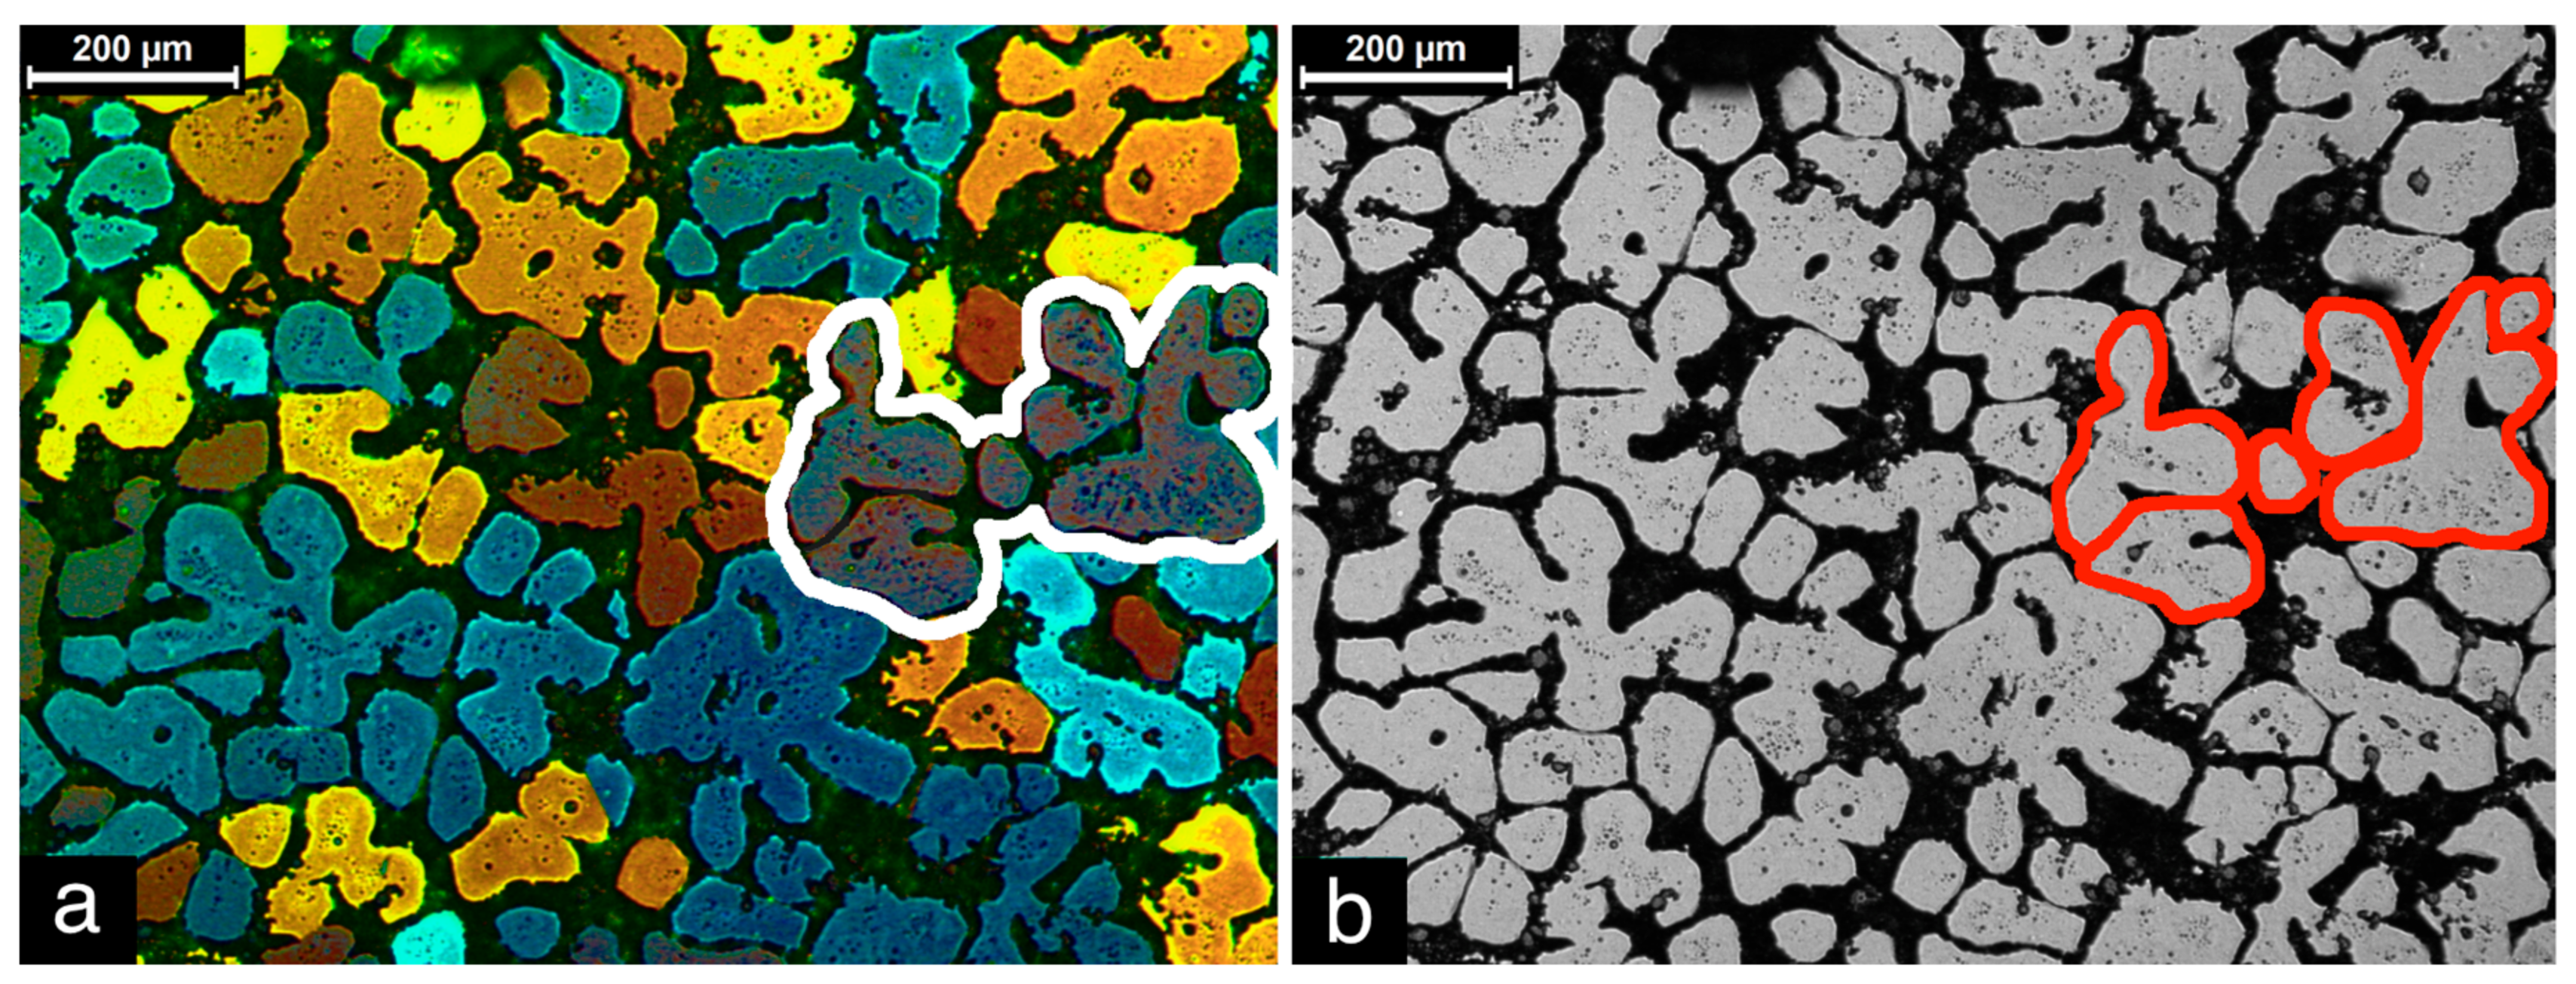
The microstructures of the as-cast and heat-treated samples were characterized by conventional black and white (B&W) and polarized-light color microscopy using a Leica DM ILM optical microscope (Leica Microsystems, Wetzlar, Germany). For color microscopy, the samples were etched electrolytically in 1.8% HBF4 at 0.6 A and 30 V for 180 s under stirring. Polarizing filters were used to obtain color images of the grains so that grains with the same crystal orientation had similar colorings. Observations were performed in the longitudinal direction of the ingots. Each primary phase observed separately in a conventional B&W micrograph is referred to here as a “globule”. It is assumed that adjacent globules with the same coloring in a polarized optical micrograph possess the same interconnected “skeleton” structure in three dimensions (3D). This structure is in turn represented by the grain observed in the two-dimensional (2D) images [27]. A single grain is outlined in white in Figure 1a and the corresponding six globules are outlined in red in Figure 1b. A complete explanation of the relationship between grain and globule can be found in an earlier work [28].
Grain size (GS) and globule size (GLS) were determined using the Heyn intercept method [29]. The shape factor (circularity, C) was calculated using Image-J® 1.40 g software (V1.40, National Institutes of Health, Bethesda, MD, USA) and the equation C = (4πA)/P2, where A is the area and P the perimeter (C = 1: sphere; C → 0: needle). Particles smaller than 10 μm were not considered in the calculation. Statistical distributions for the microstructural parameters were determined because of the large standard errors. The statistical populations (n) analyzed were approximately n = 80 for Gs and GLs and n = 300 for circularity. The standard error was obtained by dividing the standard deviation by √n for each parameter.
The phases in the alloy were identified using secondary electron (SE), backscattered electron (BSE), and energy-dispersive spectroscopy (EDS) scanning electron microscopy (SEM). The size of polyhedral α-Fe particles (Ps) present in the microstructure was considered to be the maximum Feret diameter (measured using Image-J® 1.40 g software). This is the normal distance between two parallel tangents touching the particle outline and is also known as the maximum caliper diameter. The fraction of the polyhedral α-Fe phase (fP) was also estimated as the ratio of the area occupied by these particles to the total area of the respective optical microscopy images (using Image-J® 1.40 g software). The statistical populations analyzed for the polyhedral α-Fe phase were approximately n = 150 for Ps and n = 4 for fP. The “frozen” liquid fraction after quenching was estimated as the ratio of the area occupied by the microstructure surrounding primary-phase globules to the total area of the respective optical microscopy images (using Image-J® 1.40 g software). The statistical population for these measurements was n = 5.
Compression tests were performed on the alloy in the semisolid state using an instrumented mechanical press, which also works as a compression rheometer [30]. The thixoforming samples (30 mm D × 30 mm H) were taken from the as-cast billets and heated to the semisolid state in the same manner and under the same conditions as in the thermal treatment experiments. After the target temperature had been reached and the holding time had elapsed, an engineering strain of 0.8 was imposed at a strain rate of approximately 4.2 s−1. The output data from the mechanical press were used to calculate the engineering stress (σ in MPa) vs. engineering strain (e) curve as well as the apparent viscosity (μ in Pa.s) vs. shear rate ( in s−1) curve based on the following equations [1,31]:
where F is the load, h and h0 are the instantaneous and initial heights of the sample, respectively, V is the constant volume of the sample, and t is the time.
3. Results and Discussion
3.1. Microstructural Characterization
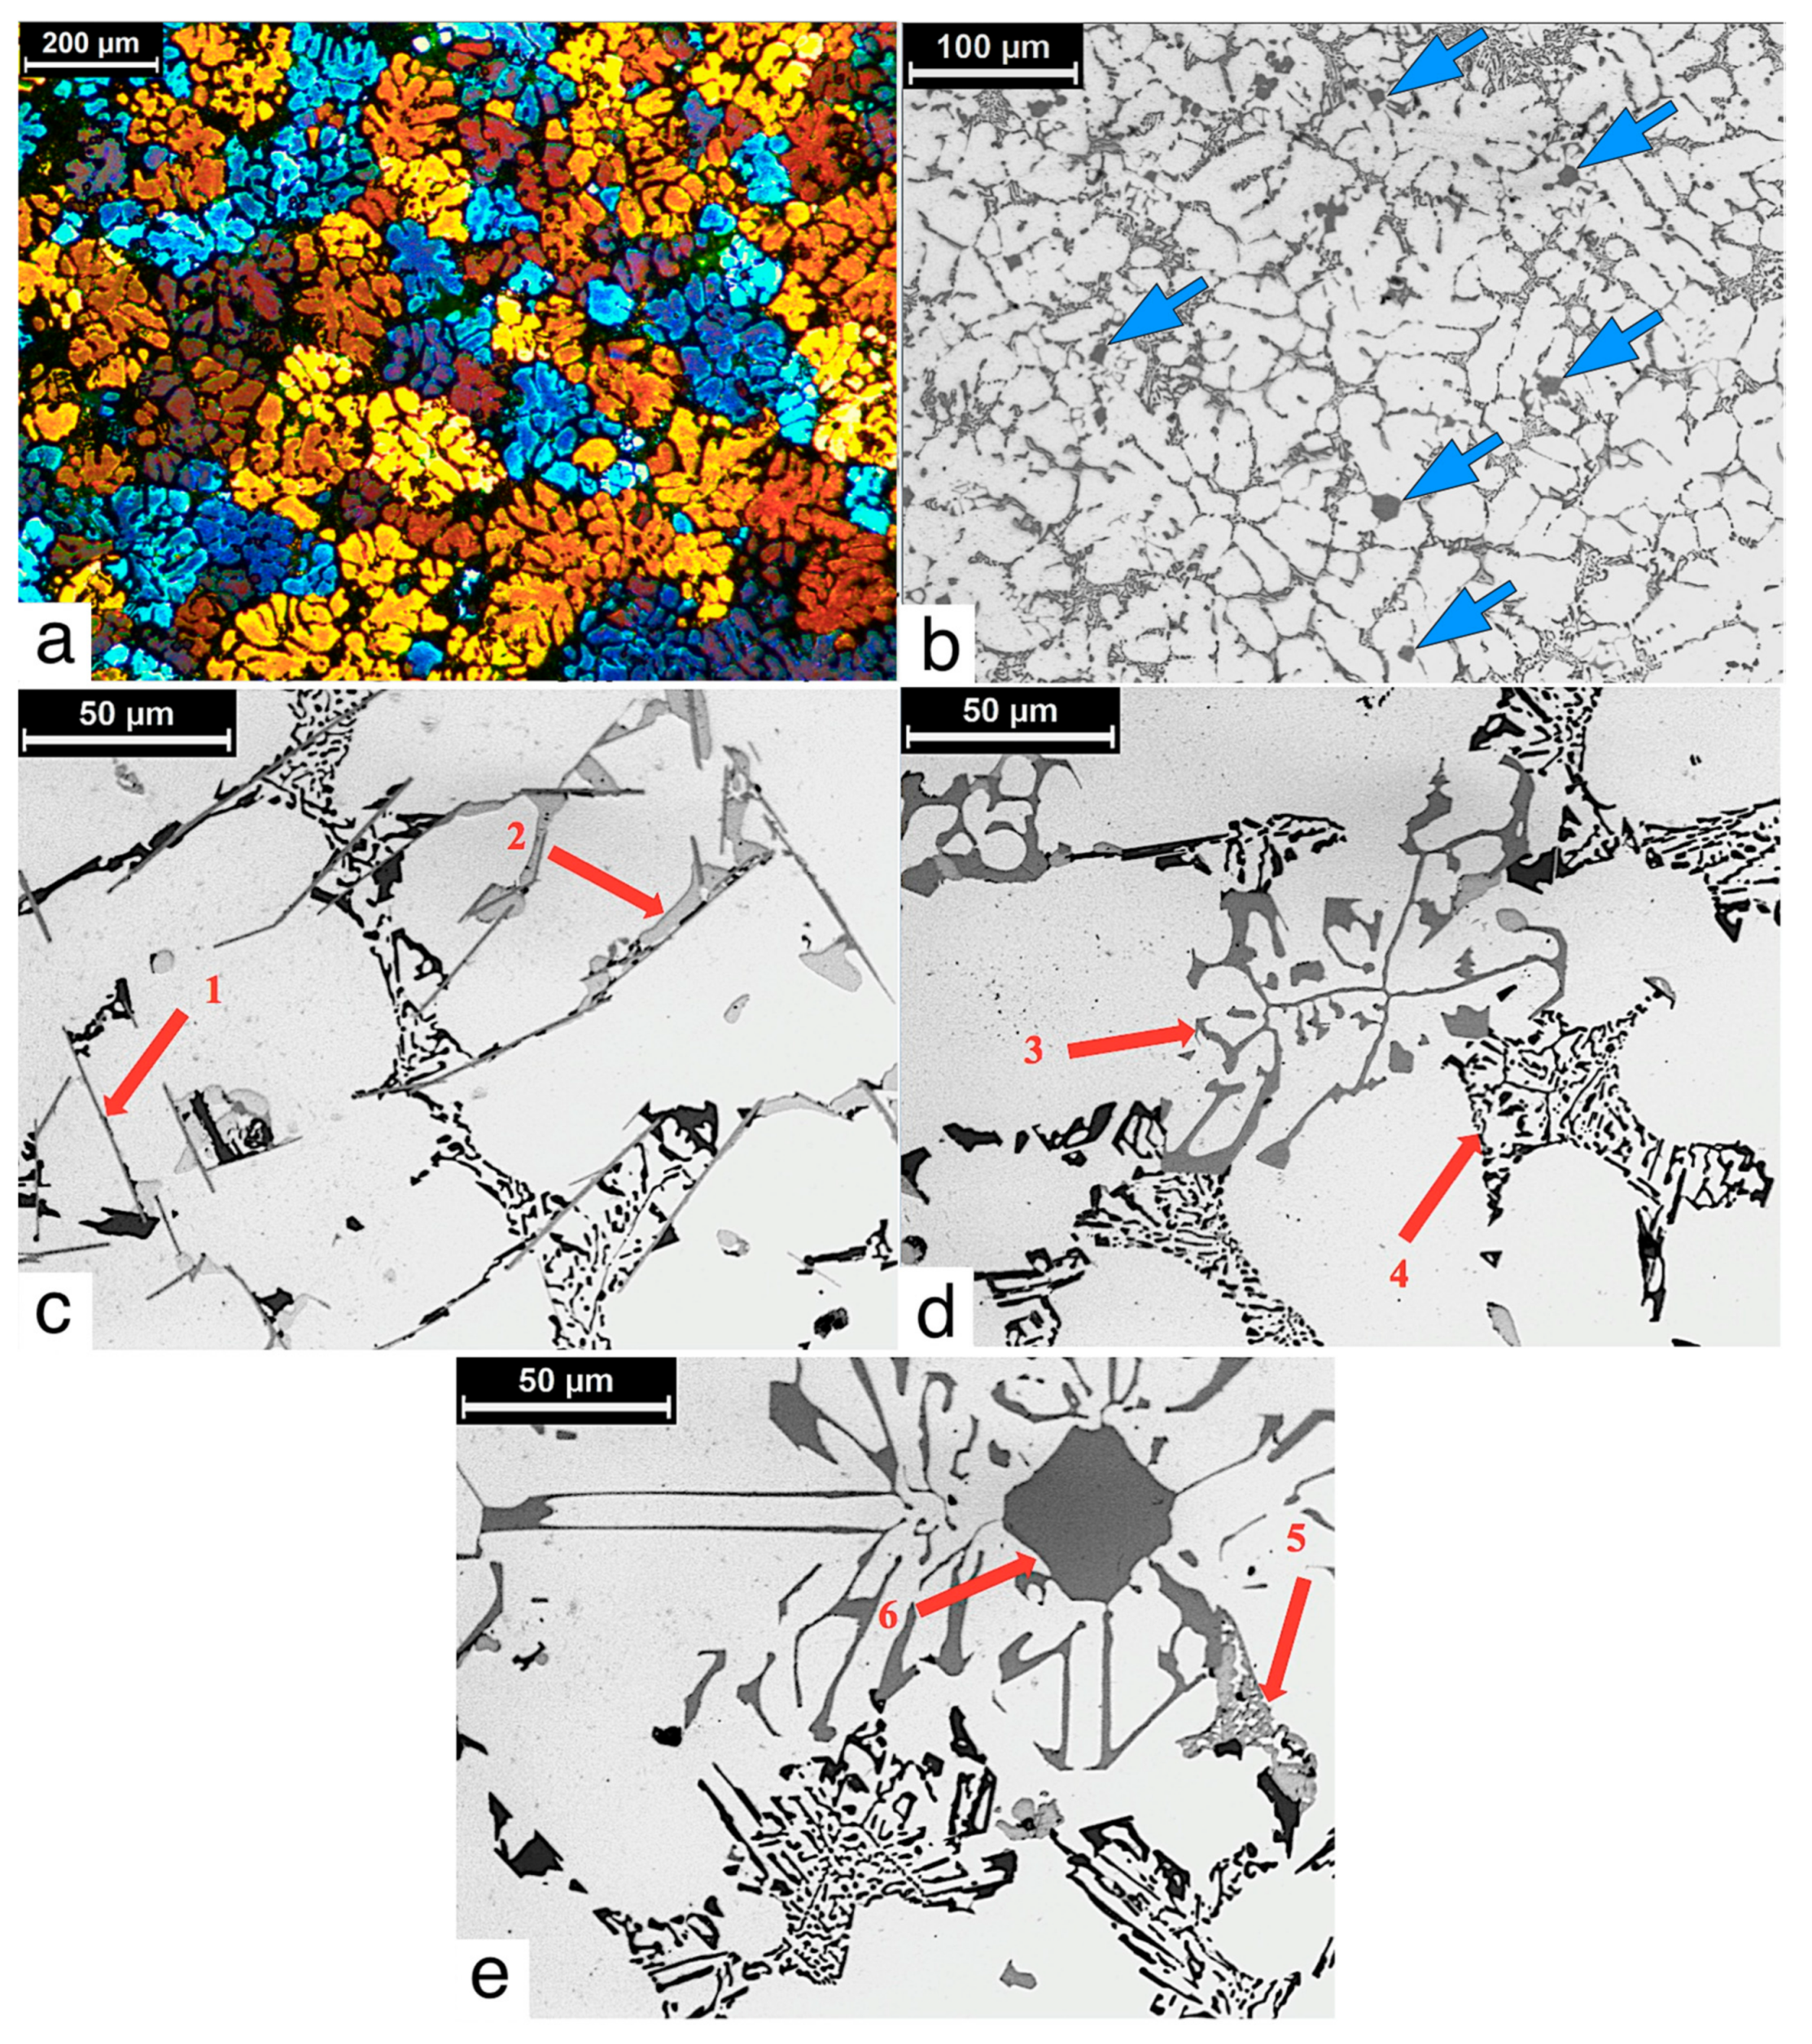
The microstructure of the as-cast B319+Fe alloy is shown in Figure 2 as a reference for the heat-treated conditions. Figure 2a shows grains, and Figure 2b globules. The microstructure is essentially formed by a dendritic-like Al-rich primary phase and an intergranular Si-rich main eutectic. The latter is shown in detail in Figure 2d (arrow 4). Several tertiary eutectic compounds are found in the interdendritic space, such as the acicular β-Al5FeSi phase (Figure 2c, arrow 1), platelets of the θ-Al2Cu(Si) phase (Figure 2c, arrow 2), preferentially nucleated around β-phase, and clusters of the Cu-rich Al-Al2Cu-Si phase (Figure 2e, arrow 5) [21,32,33,34,35]. Also, the complex Al15(FeMnCr)3Si2 compound (known as α-Fe phase) is present in the form of both Chinese script (Figure 3d, arrow 3) and polyhedral (Figure 3e, arrow 6) morphologies [22,36,37,38]. The latter morphology is found in abundance in the microstructure of the B319+Fe alloy. These coarse polyhedral particles are indicated by blue arrows in Figure 2b.
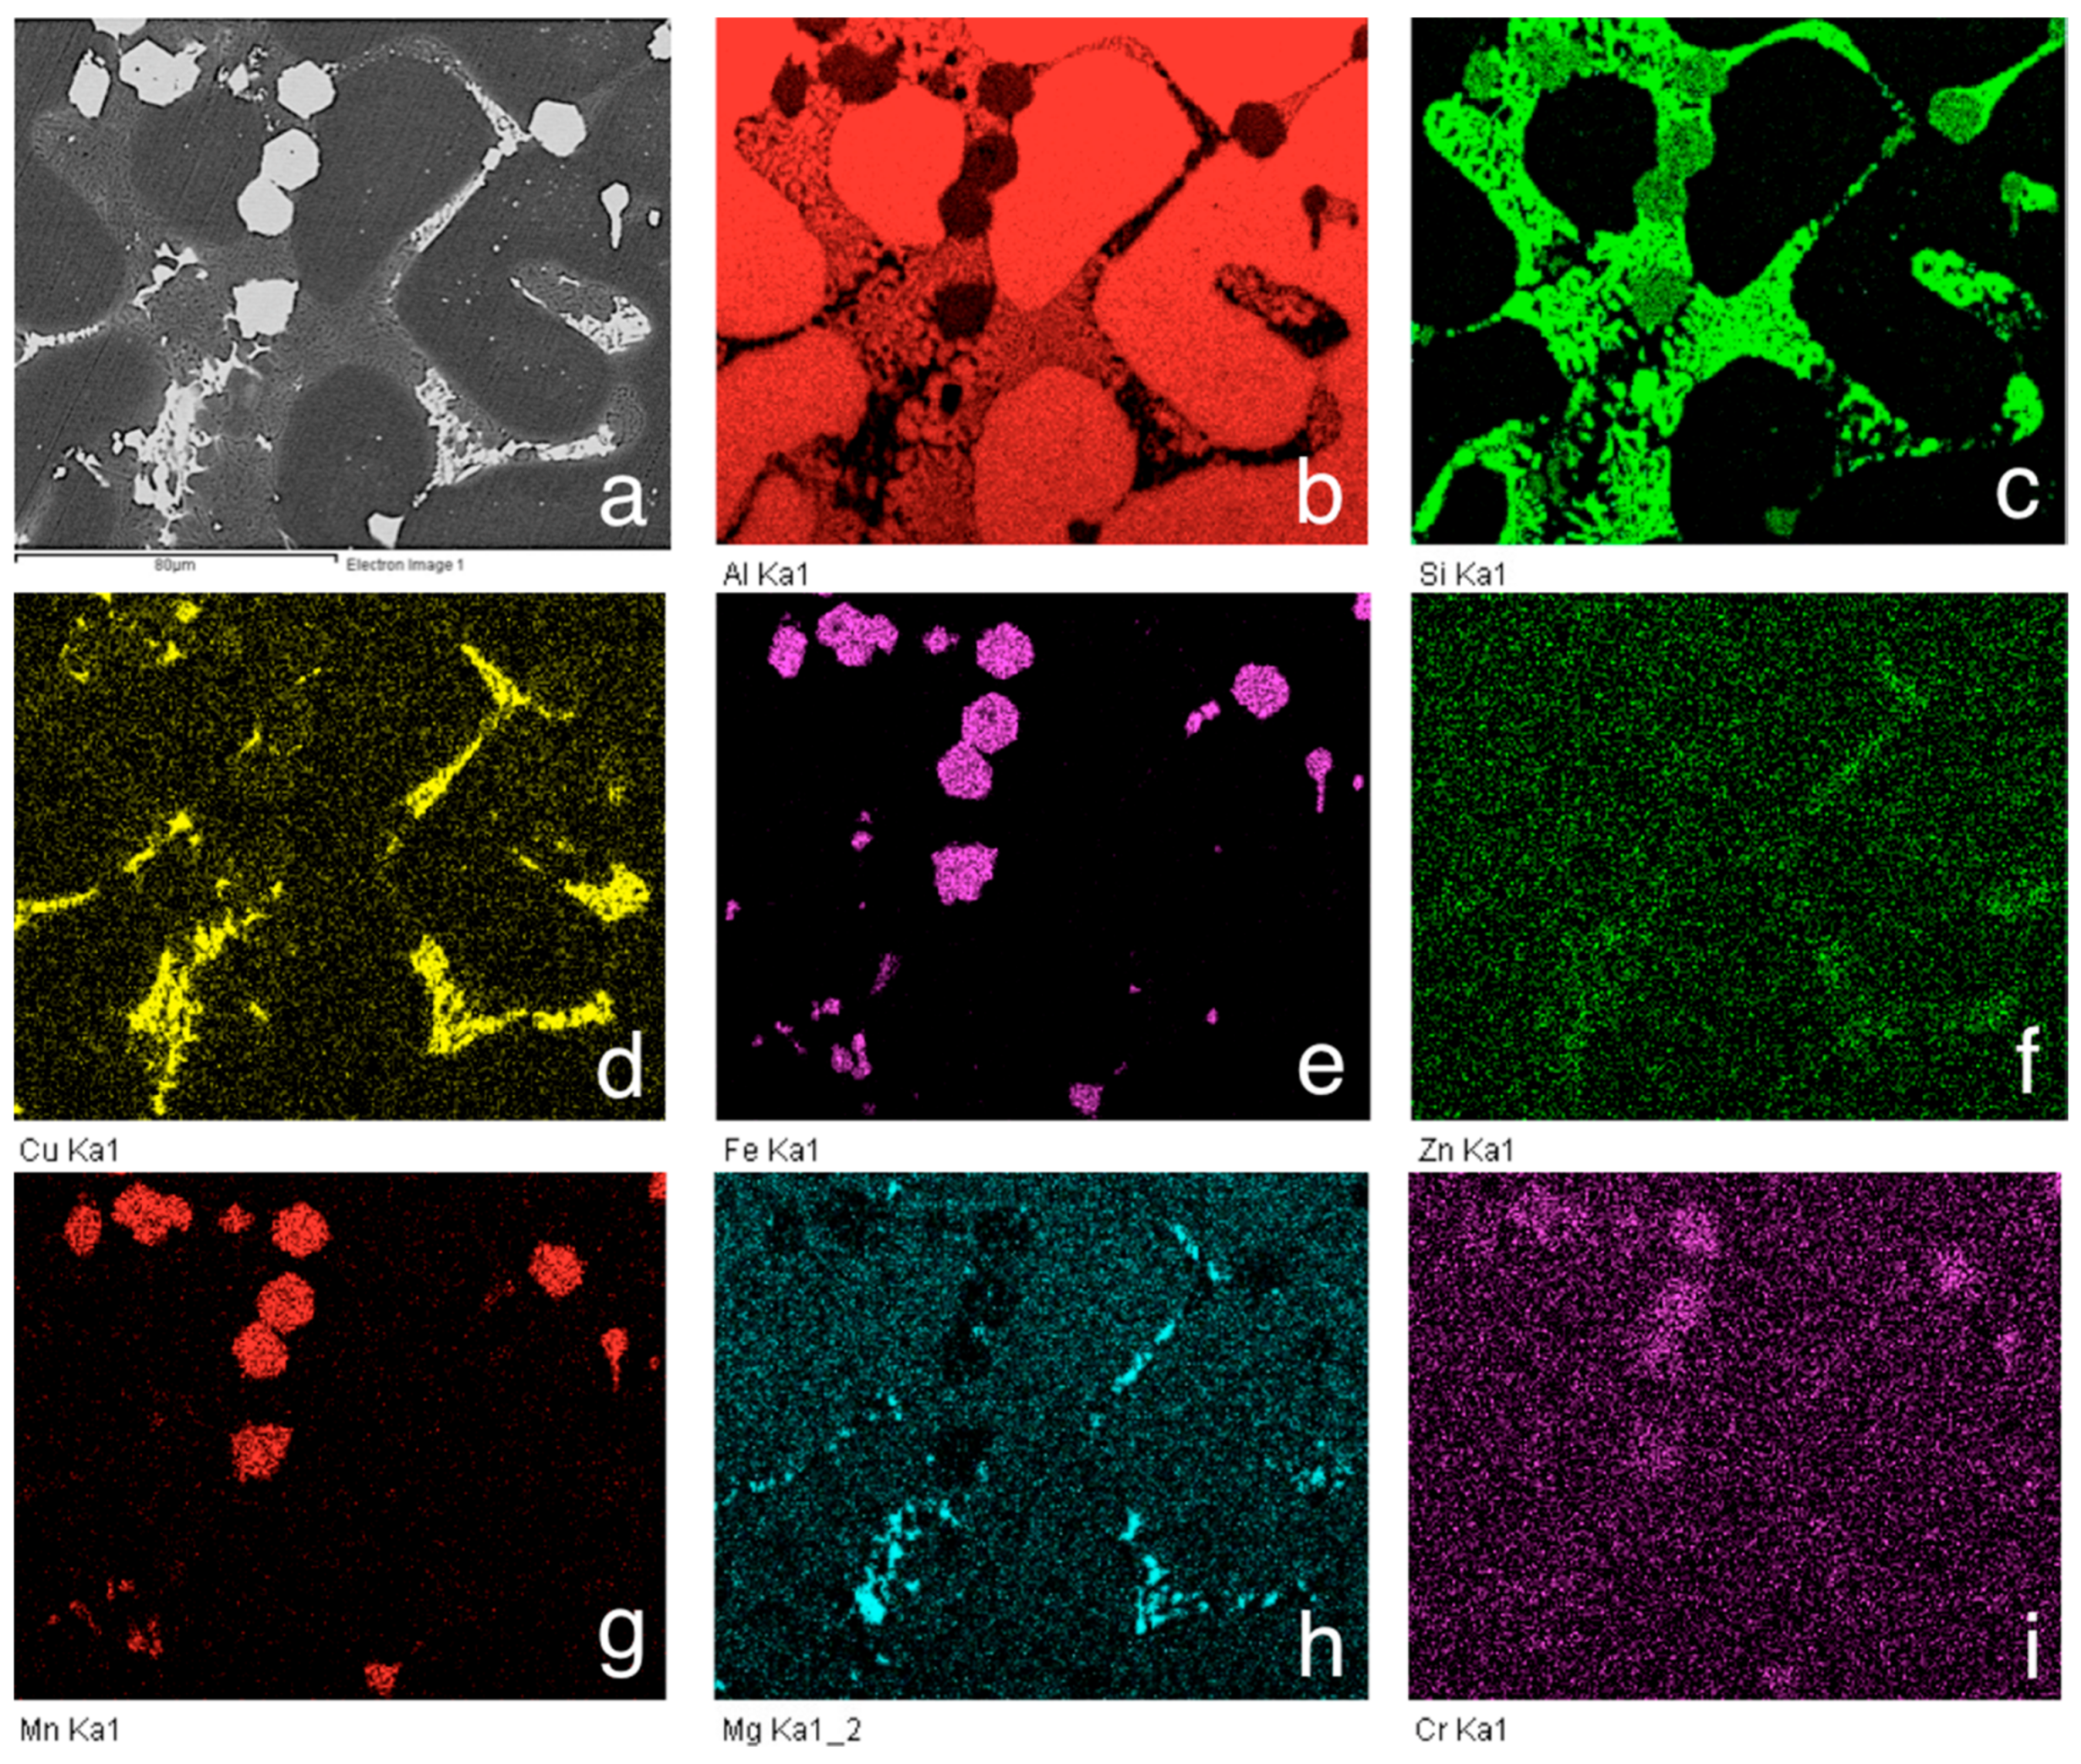
Chemical identification of these phases is shown in Table 2, based on the points shown in Figure 3. The distribution of elements along the microstructure is shown in Figure 4. The region of reference (Figure 4a) (produced by backscattered electron (BSE) SEM) is analyzed in terms of Al (Figure 4b), Si (Figure 4c), Cu (Figure 4d), Fe (Figure 4e), Zn (Figure 4f), Mn (Figure 4g), Mg (Figure 4h), and Cr (Figure 4i) (SEM with energy-dispersive spectroscopy (EDS)).
Punctual analysis of the Al-rich primary phase (points A in Figure 3), approx. 98 at. % Al, is consistent with the expected composition for this solid solution. Al-Si main eutectic (points B in Figure 3) also presents an Al-to-Si ratio of ~0.7, which is compatible with the eutectic region presenting narrow Si particles distributed in the Al-rich matrix.
The Al-to-Cu ratio of ~2.2 for point D (Figure 3) is coherent with the stoichiometric relation expected for the θ-Al2Cu(Si) phase, i.e., Al-to-Cu ratio of 2.0. Likewise, the Al-to-Si ratio of ~8, Al-to-Fe ratio of ~6, and Fe-to-Si ratio of ~1.2 found for the polygonal particles (point C in Figure 3) are consistent with the stoichiometric relation expected for the α-Fe phase, i.e., the Al-to-Si ratio of 7.5, Al-to-Fe ratio of 5.0, and Fe-to-Si ratio of 1.5. Manganese, eventually present in the α-Fe, was also found in the polygonal particles, but at a smaller fraction (Al-to-Mn ratio of ~12.7) than theoretically expected (Al-to-Mn ratio of 5.0). Chromium is also found in this phase, but at an extremely small fraction. It can be seen (Figure 4e,g) that practically all of the Fe and Mn content in the alloy is concentrated in the α-Fe polygonal particles.
Punctual analysis of the Chinese script component (point E) also indicates that it may exist in the α-Fe phase, due to the presence of Mn and Cr. However, the Al-to-Si,Fe ratios in this phase are higher than expected for both α-Fe and β phases, probably due to the limited dimension of this structure compared with the electronic beam reach, leading to Al-rich primary phase scanning in the same measurement. For the same reason, an analysis of the narrow acicular β-Al5FeSi phase was not performed.
The means ± standard errors of the microstructural parameters for the as-cast condition were: GS = 146 ± 4 μm, GLS = 39 ± 1 μm, GS/GLS = 3.8 ± 0.1, C = 0.39 ± 0.01, Ps = 17.0 ± 0.7 μm (α-Fe polyhedrons size), and fP = 0.019 ± 0.008 (α-Fe polyhedrons fraction).
3.2. Thermodynamic Characterization using Calculation of Phase Diagrams (CALPHAD) Simulation
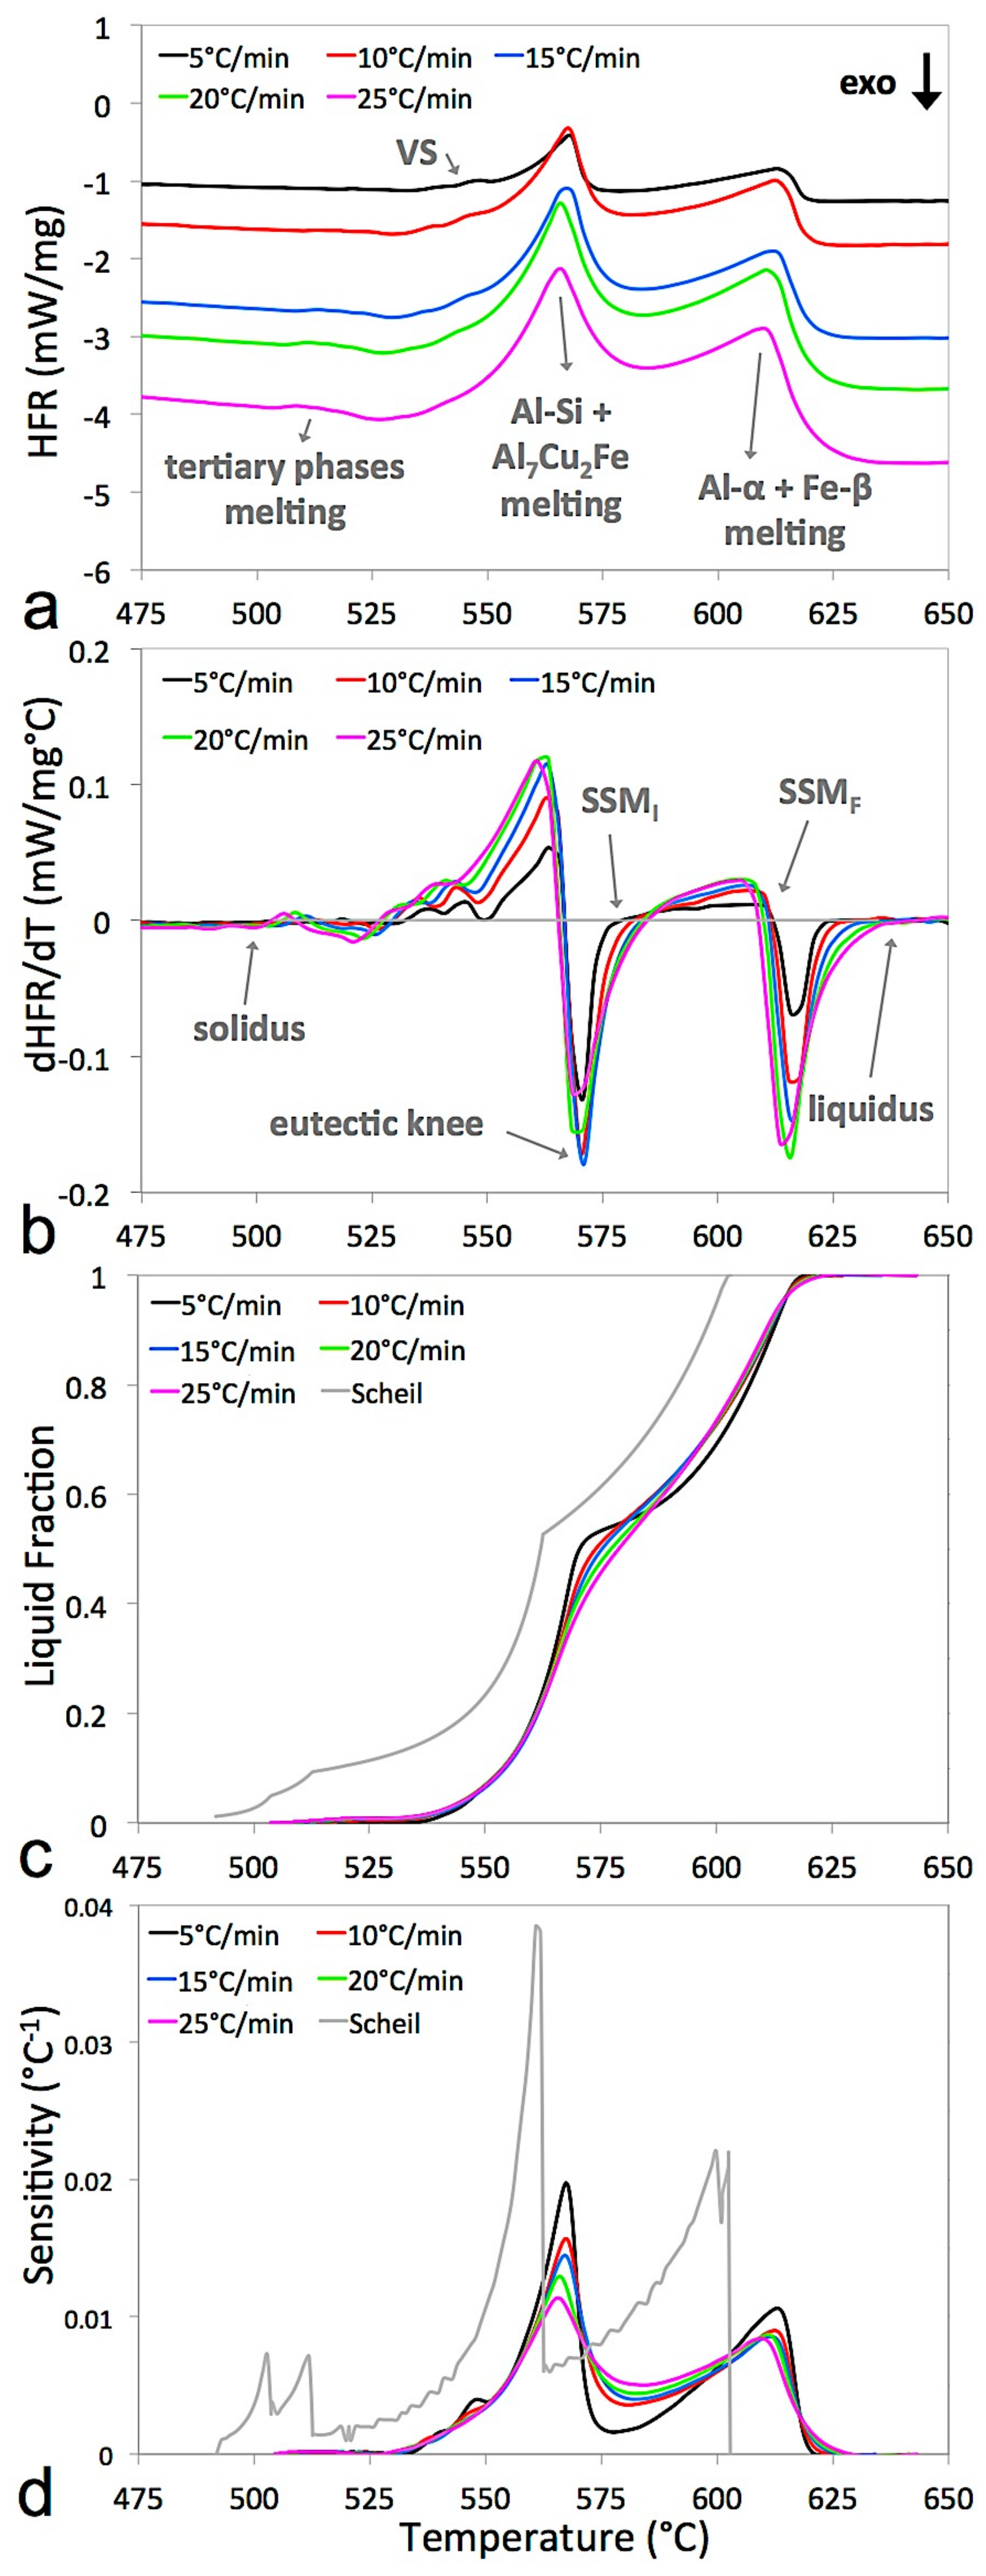
Figure 5 presents the DSC heat flow rate (HFR) vs. T curves (Figure 5a) and the corresponding derivative of HFR with relation to temperature (dHFR/dT) vs. T curves (Figure 5b), liquid fraction (fl) vs. T curves (Figure 5c), and sensitivity (dfl/dT) vs. T curves (Figure 5d) for the B319+Fe alloy for all DSC heating conditions analyzed. The fl vs. T and dfl/dT vs. T curves for the Scheil condition are shown for reference (grey curves in Figure 5c,d, respectively). The phase transformations during the melting of the B319+Fe alloy predicted by the Scheil curve are as follows: starting at 492 °C (the solidus), the melting of the tertiary eutectic phases formed by (1) Al5Cu2Mg8Si6, (2) Al2Cu, and (3) Al7Cu2Fe, which melt completely by 520 °C, occur when fl = 0.10. This is followed by melting of the (4) main Si-rich eutectic, which is responsible for the knee-like shape in the fl vs. T curve (564 °C and fl = 0.53). Subsequently, the melting of the (5) Fe-rich AlFeSi β-phase particles (601 °C and fl = 0.97) and, finally, the melting of the (6) Al-rich α phase indicate the total melting of the alloy at 603 °C (the liquidus).
The DSC curves (Figure 5a) clearly show two endothermic peaks, one probably related to the melting of both the Al-rich α phase and the β-Al-Fe-Si phase (the intense peak at higher temperature ranges) and another probably related to the melting of both the Si-rich eutectic phase and the tertiary phase with a higher melting range, Al7Cu2Fe (the intense peak at lower temperature ranges). A third discrete peak is also identifiable at the extreme left of the curve related to one of the (or the superposition of several) remaining tertiary phases. These peaks are identified by arrows in Figure 5a.
The hypothesis of multiple phases melting at the first and third DSC peaks is justified by the proximity of the temperature ranges predicted by the Scheil conditions for the phase transformations considered here (α-Al + β-Al-Fe-Si and Al5Cu2Mg8Si6 + Al2Cu, respectively). The superposition in the second peak (Al-Si eutectic + Al7Cu2Fe) is not only supported by the Scheil prediction but also clearly visible in the DSC curves in the form of waves on the left of this peak indicated by an arrow and VS (visible superposition) in Figure 5a.
The DSC derivative curves (Figure 5b) are used in the DM to identify the temperatures of interest in the thixoformability analysis of the B319 alloy: the solidus, liquidus, working window (TSSMI and TSSMF), and eutectic knee. These temperatures are indicated by arrows in Figure 5b. The superposition of phases in the second peak seen in the DSC curves (Figure 5a) is also visible in the differentiated curves (Figure 5b). This is to be expected as these patterns are inherited from the original curve.
The faster the heating rate, the softer the knee corresponding to the eutectic transformation in the fl vs. T curves (Figure 5c). This smoothing is a result of the delay in the phase transformations and the increase in the temperature range in which these occur as the distance from the equilibrium conditions increases [23]. The sensitivity curves (Figure 5d) also tend to become less pronounced as the heating rate increases. The peaks in the curves decrease and extend over a wider temperature range as the distance from equilibrium increases. This graphical behavior is inherited from the original fl vs. T curves.
Using the temperatures of the eutectic knee and thixoforming interval obtained by the DM (Figure 5b), the respective liquid fractions (fl Knee, fl SSMI and fl SSMF) were identified on the fl vs. T curves (Figure 5c). To establish an adequate working window, the maximum sensitivity (dfl/dTmax) in the proposed interval (between TSSMI and TSSMF) was determined from the sensitivity graphs (Figure 5d). This information was then used to assess the thermodynamic stability and determine whether the 0.03 °C−1 criterion was met [10]. The resulting data are shown in Table 3 and were used to plot the semisolid range, working window, and knee point for the B319+Fe alloy in terms of temperature (Figure 6a) and liquid fraction (Figure 6b) for all of the heating rates analyzed. The following remarks can be made in relation to Figure 5 and Figure 6 and Table 3:
(a) Semisolid interval. There is an increase of 24.3 °C in the semisolid interval as the heating rate increases (Figure 6a). At 5 °C/min, ΔTs-l = 118.2 °C and at 25 °C/min ΔTs-l = 142.5 °C. This trend is a result of the delaying and extending of the melting reaction as kinetic effects become stronger. Furthermore, higher heating rates result in a larger driving force (superheating) for melting, making the reaction start sooner, i.e., faster curves have lower solidus points than slower ones, resulting in larger semisolid intervals [23]. The main factor responsible for the enlargement of the semisolid interval is the increase in the liquidus temperature (ΔTliquidus = 17.5 °C between heating rates of 5 and 25 °C/min), followed by the smaller decrease in the solidus temperature (ΔTsolidus = −6.8 °C between heating rates of 5 and 25 °C/min). This result shows that the delaying effect of the melting reaction (resulting in a higher liquidus) plays a greater role in enlarging the semisolid range than the larger driving force (lower solidus) observed with the rise in the heating rate.
The Scheil condition is nearer equilibrium than any of the experimental heating rates. Then, the simulated Scheil curve lies on the left of the experimental curves and presents the smallest semisolid interval (ΔTs-l = 111.0 °C), respecting the above-discussed trend of progressive delaying in the temperature range due to kinetic effects.
(b) Eutectic knee. Despite the changes in the shape of the curves caused by kinetic effects, the temperature corresponding to the knee remains almost unaltered (Figure 6a) and has a mean value (± standard error) of Tknee = 570.8 ± 0.13 °C. However, because of the delayed/extended melting reaction and smoothing of the knee, the fl vs. T curves around the knee (Figure 6c) move progressively toward higher temperatures (right) as the heating rate increases. This effect causes the knee liquid fraction to be reduced by 0.11 as the heating rate increases from 5 °C/min (fl Knee = 0.51) to 25 °C/min (fl Knee = 0.40). The Scheil curve, which is nearer equilibrium than any of the experimental curves, is shown on the extreme left of the graph near the curves corresponding to the lowest heating rates.
(c) Thixoforming working window. For all of the conditions analyzed, the sensitivity values in Table 3 are below the 0.03 °C−1 limit, so the original SSM working window suggested by the DM was maintained. The thixoforming interval for the B319+Fe alloy becomes slightly smaller as the heating rate increases, decreasing by 7.0 °C (32.0 °C to 25.0 °C) between the lowest and highest heating rates. This result contrasts with the trend for the total semisolid interval to increase with the increasing heating rate (item (a) above). A possible explanation for this is that the melting range increases at the beginning of the reaction (decrease in solidus) and the end of the reaction (increase in liquidus) whereas the phase transformations between these points occur closer together. The Scheil curve (condition nearer equilibrium than any of the experimental curves) also follows the above-discussed trend, presenting the larger thixoforming interval (36.0 °C). This result is also due to the abrupt drop of sensitivity above the knee for this condition, which in turn is a consequence of the sharp knee shape on the numerical fl curve, leading the TSSMI (point of minimum sensitivity) to be remarkably closer to the knee and contributing to the working window enlargement.
A remark should be made concerning the equivalence between the DSC and sensitivity curves: the liquid fraction (dimensionless) is obtained by the integration of the DSC curve with relation to the temperature. Since the DSC data represents the heat flow rate, HFR (dimension = heat × time−1), a direct integration of HFR would result in a first-order integral with dimension = heat × time−1 × temperature. To transform this integral into the liquid fraction, a base line is set under/above the endothermic/exothermic region of the HFR curve where the melting/solidification occur and is subtracted from the curve to disregard the noisy HFR. Furthermore, normalization from 0 (solidus) to 1 (liquidus) precedes this step to enable the analysis of the liquid as a fraction.
Then, the DSC vs. T curve represents the derivative of the fl vs. T curve, after the reverse algebraic operations of normalization and subtraction of a defined base line. In turn, the sensitivity (dimension = temperature−1) is obtained via direct derivation of the liquid fraction with relation to the temperature, i.e., dfl/dT. Therefore, both HFR and sensitivity represent derivatives of the fl with relation to T, with different values in the y-axis due to the algebraic operations used to obtain the fl from HFR data. As a consequence, both HFR and sensitivity curves present the same graphical behavior with respect to the x-axis and differ in the y-axis only by a certain constant value.
3.3. Evaluation of the Thixoforming Processing Window
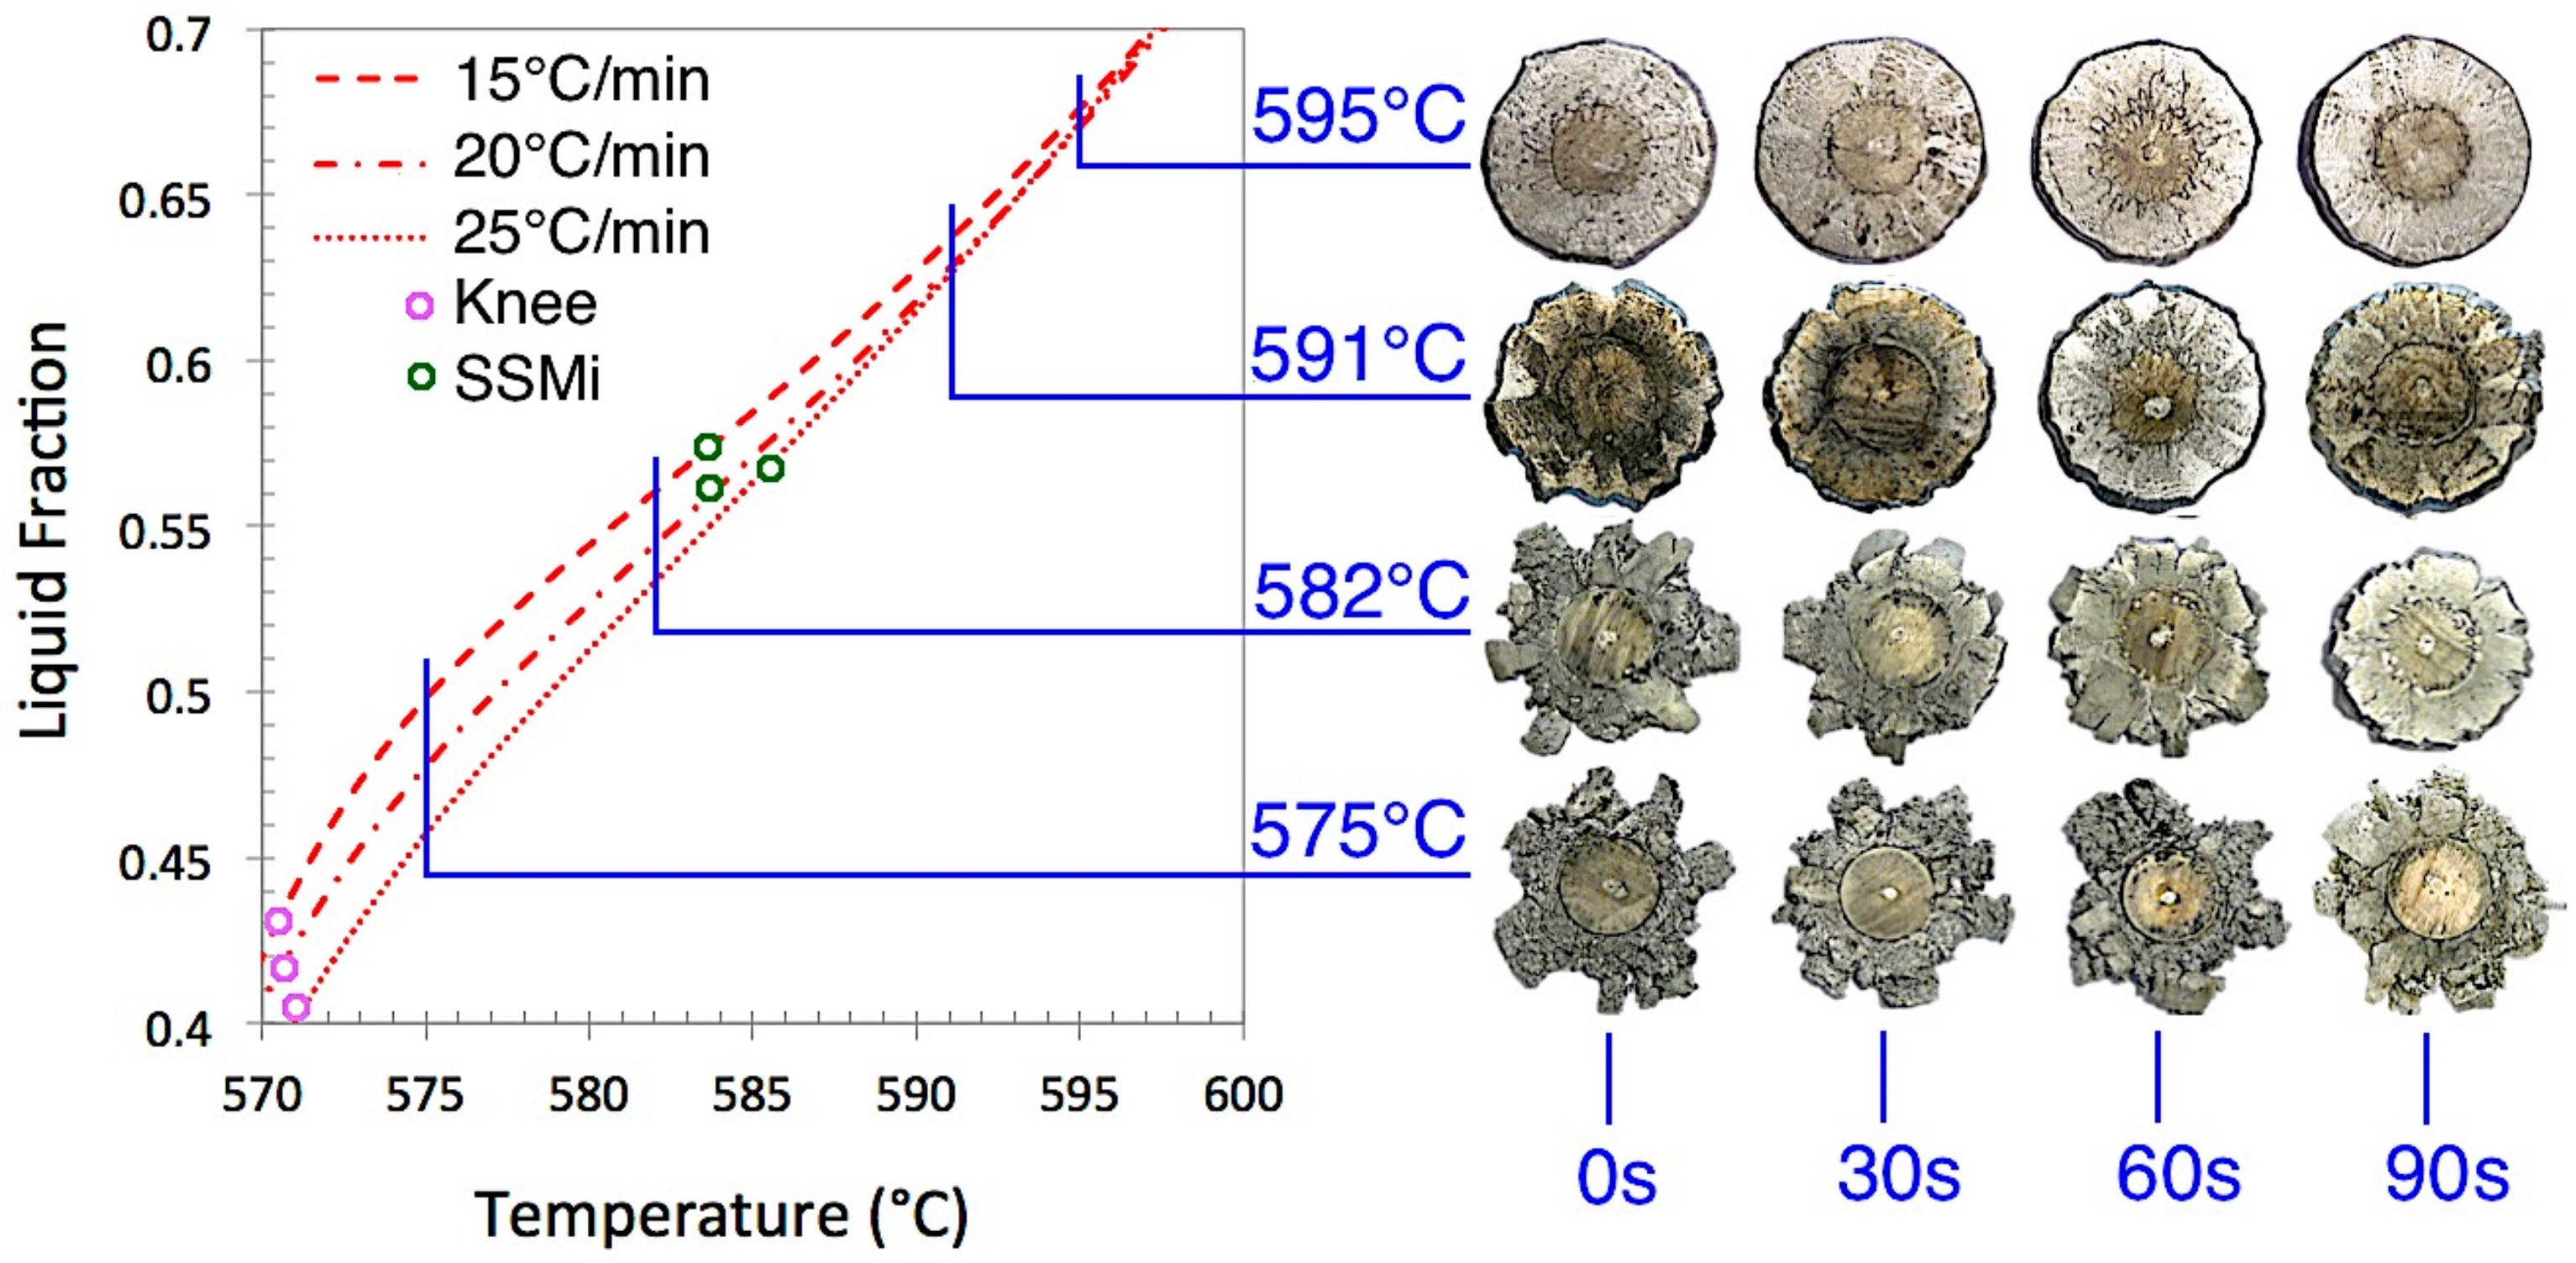
Based on the results discussed in Section 3.2, four temperatures were tested to evaluate the thixoformability of the B319+Fe alloy: 575, 582, 591, and 595 °C. These temperatures are highlighted in the magnified fl vs. T curves of the B319+Fe alloy in Figure 7. Only heating rates of 15, 20, and 25 °C/min are shown because these are close to the final heating rate used in the thermal treatments (18–22 °C/min). The eutectic knee (purple) and lower limit of the SSM working window (green) are also highlighted on the curves. Thixoformed (compressed) disks after isothermal heat treatment at each of these four temperatures for 0, 30, 60, and 90 s are shown to the right of the graph.
The lowest temperature (575 °C) is below the suggested SSM working window and is also extremely close to the knee for the experimental conditions analyzed. In contrast, the second-lowest temperature, 582 °C, is in the intermediate region between the knee and the lower limit for SSM processing (TSSMI) and is thus still in the zone that is theoretically unstable for SSM processing. Finally, the two remaining temperatures (591 and 595°C) are within the interval suggested by the DM (TSSMI and TSSMF) for all cycles, where the sensitivity values are lowest (S < 0.01 °C−1), allowing easy control of SSM processing.
The liquid fraction for the four temperatures tested is presented in Table 4, taken directly from the Scheil curve and DSC curves for 15 to 25 °C/min and represented by the area surrounding primary phase globules in an optical micrograph of the heat-treated and subsequently quenched samples. According to previous work [7], secondary particle growth during quenching should be ignored for the microstructural measurements of Gs and GLs shown here as secondary particle growth has been reported to be negligible (<4 μm) in relation to the magnitude of the particles analyzed here for the liquid fraction prior to quenching and the estimated cooling rate during quenching in this study (<0.7 and ~130 °C/s, respectively).
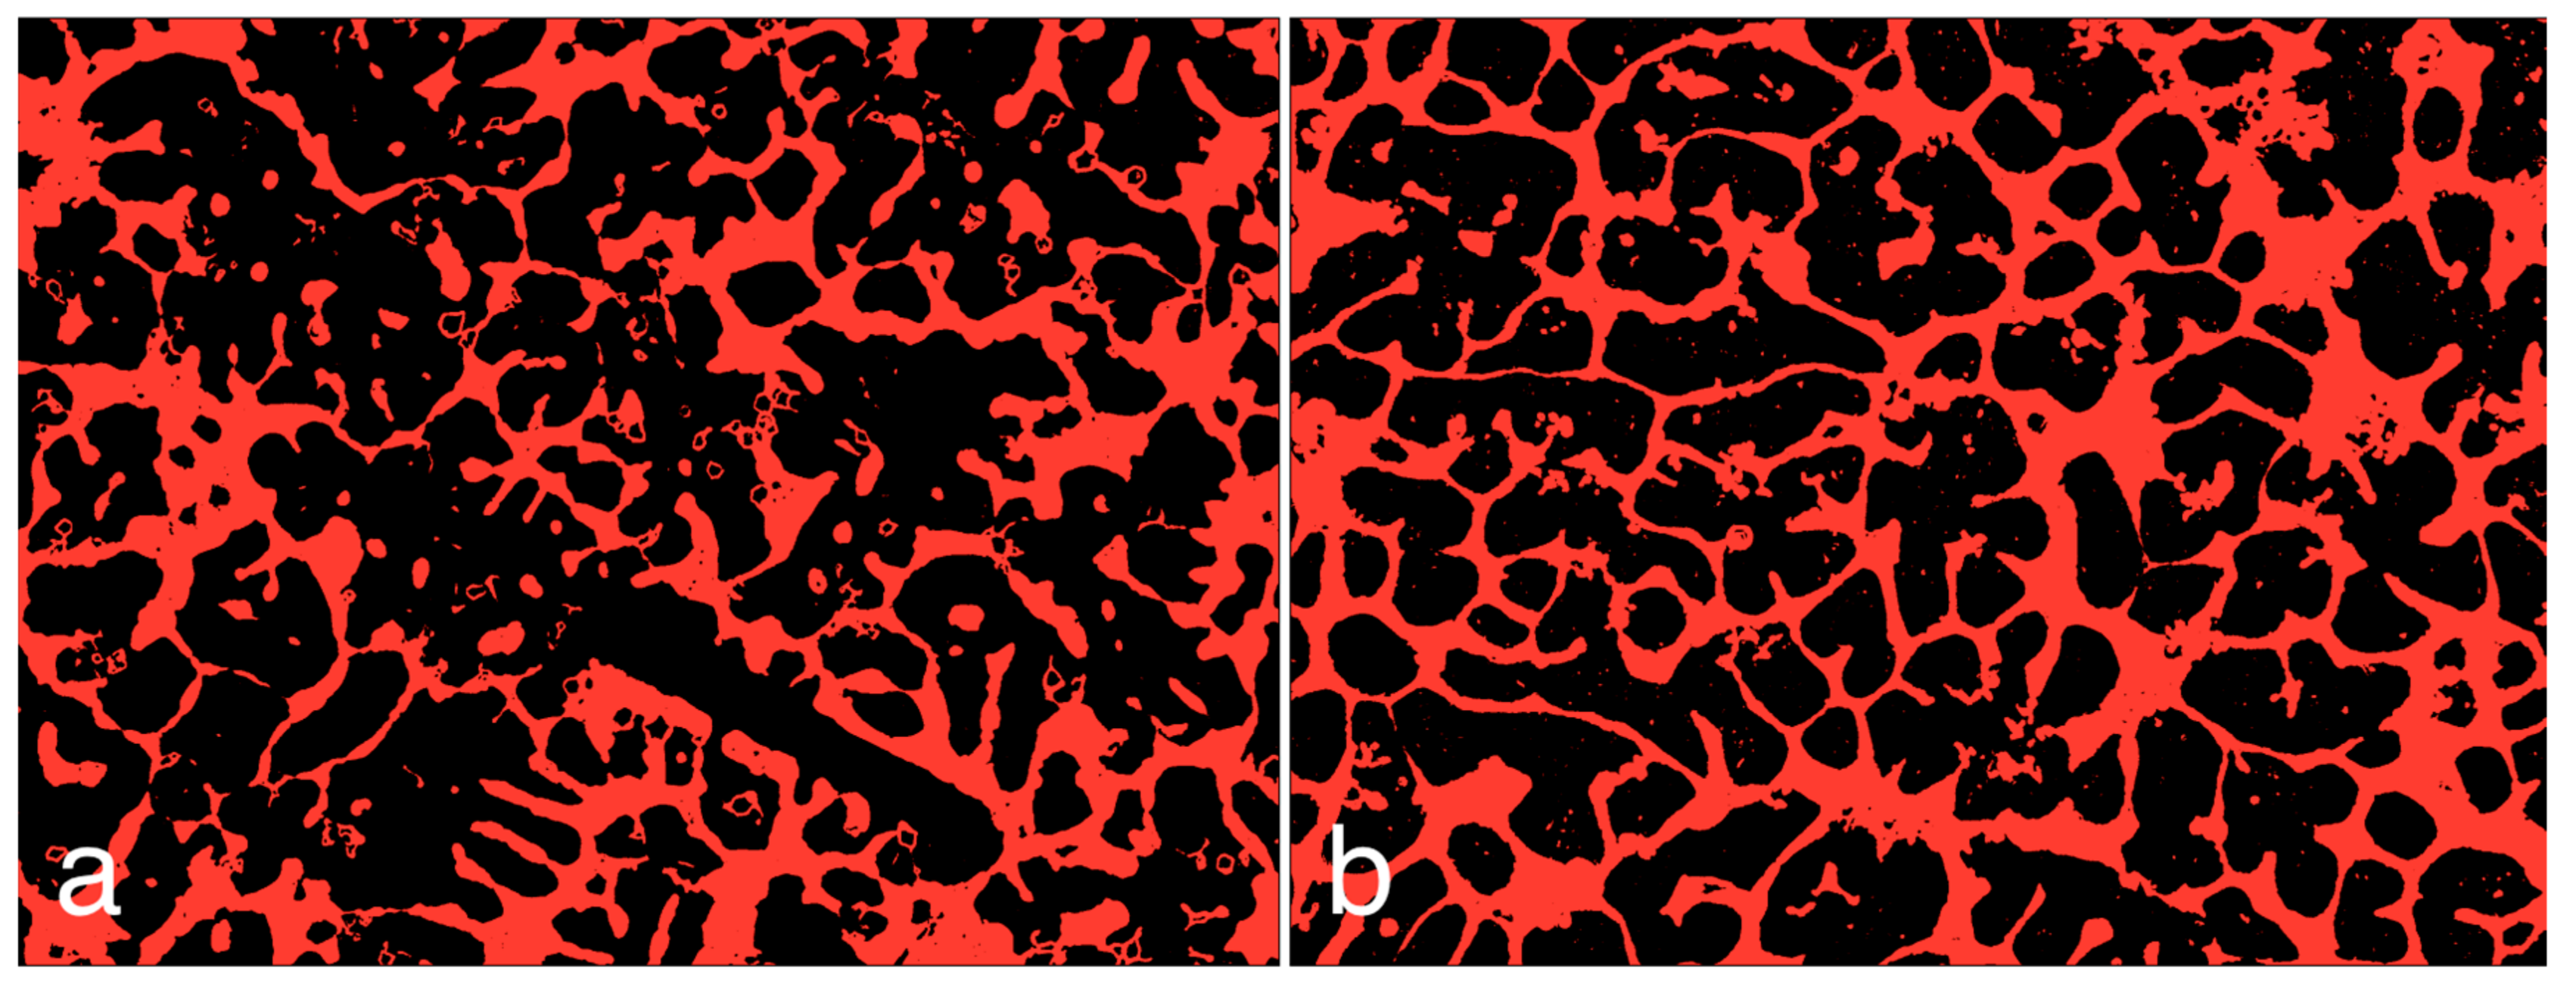
However, the liquid fraction measured via %area in the micrographs varies at most 0.04 from 575 °C to 595 °C, in contrast to the variation of 0.23 predicted for the Scheil condition, 0.21–0.18 for DSC at 15–25 °C/min. Figure 8 highlights the similarity in fl measured via micrographs showing the areas corresponding to primary phase globules (black) and assumed “frozen” liquid (red) for two extreme conditions of heat treatment, 575 °C-0 s (Figure 8a) and 595 °C-90 s (Figure 8b).
Since the predicted liquid fraction (Scheil and DSC) and the appearance of the thixoformed disks are evidently different amongst the tested temperatures (from brittle and asymmetric at lower temperatures to more homogeneous, compact, and symmetric at higher temperatures), the liquid fraction for these temperatures during forming cannot be similar, which indicates that a relevant secondary growth occurred during quenching and that the analysis of the liquid fraction directly from the microstructures does not represent the accurate “frozen” liquid fraction at the four temperatures of partial melting.
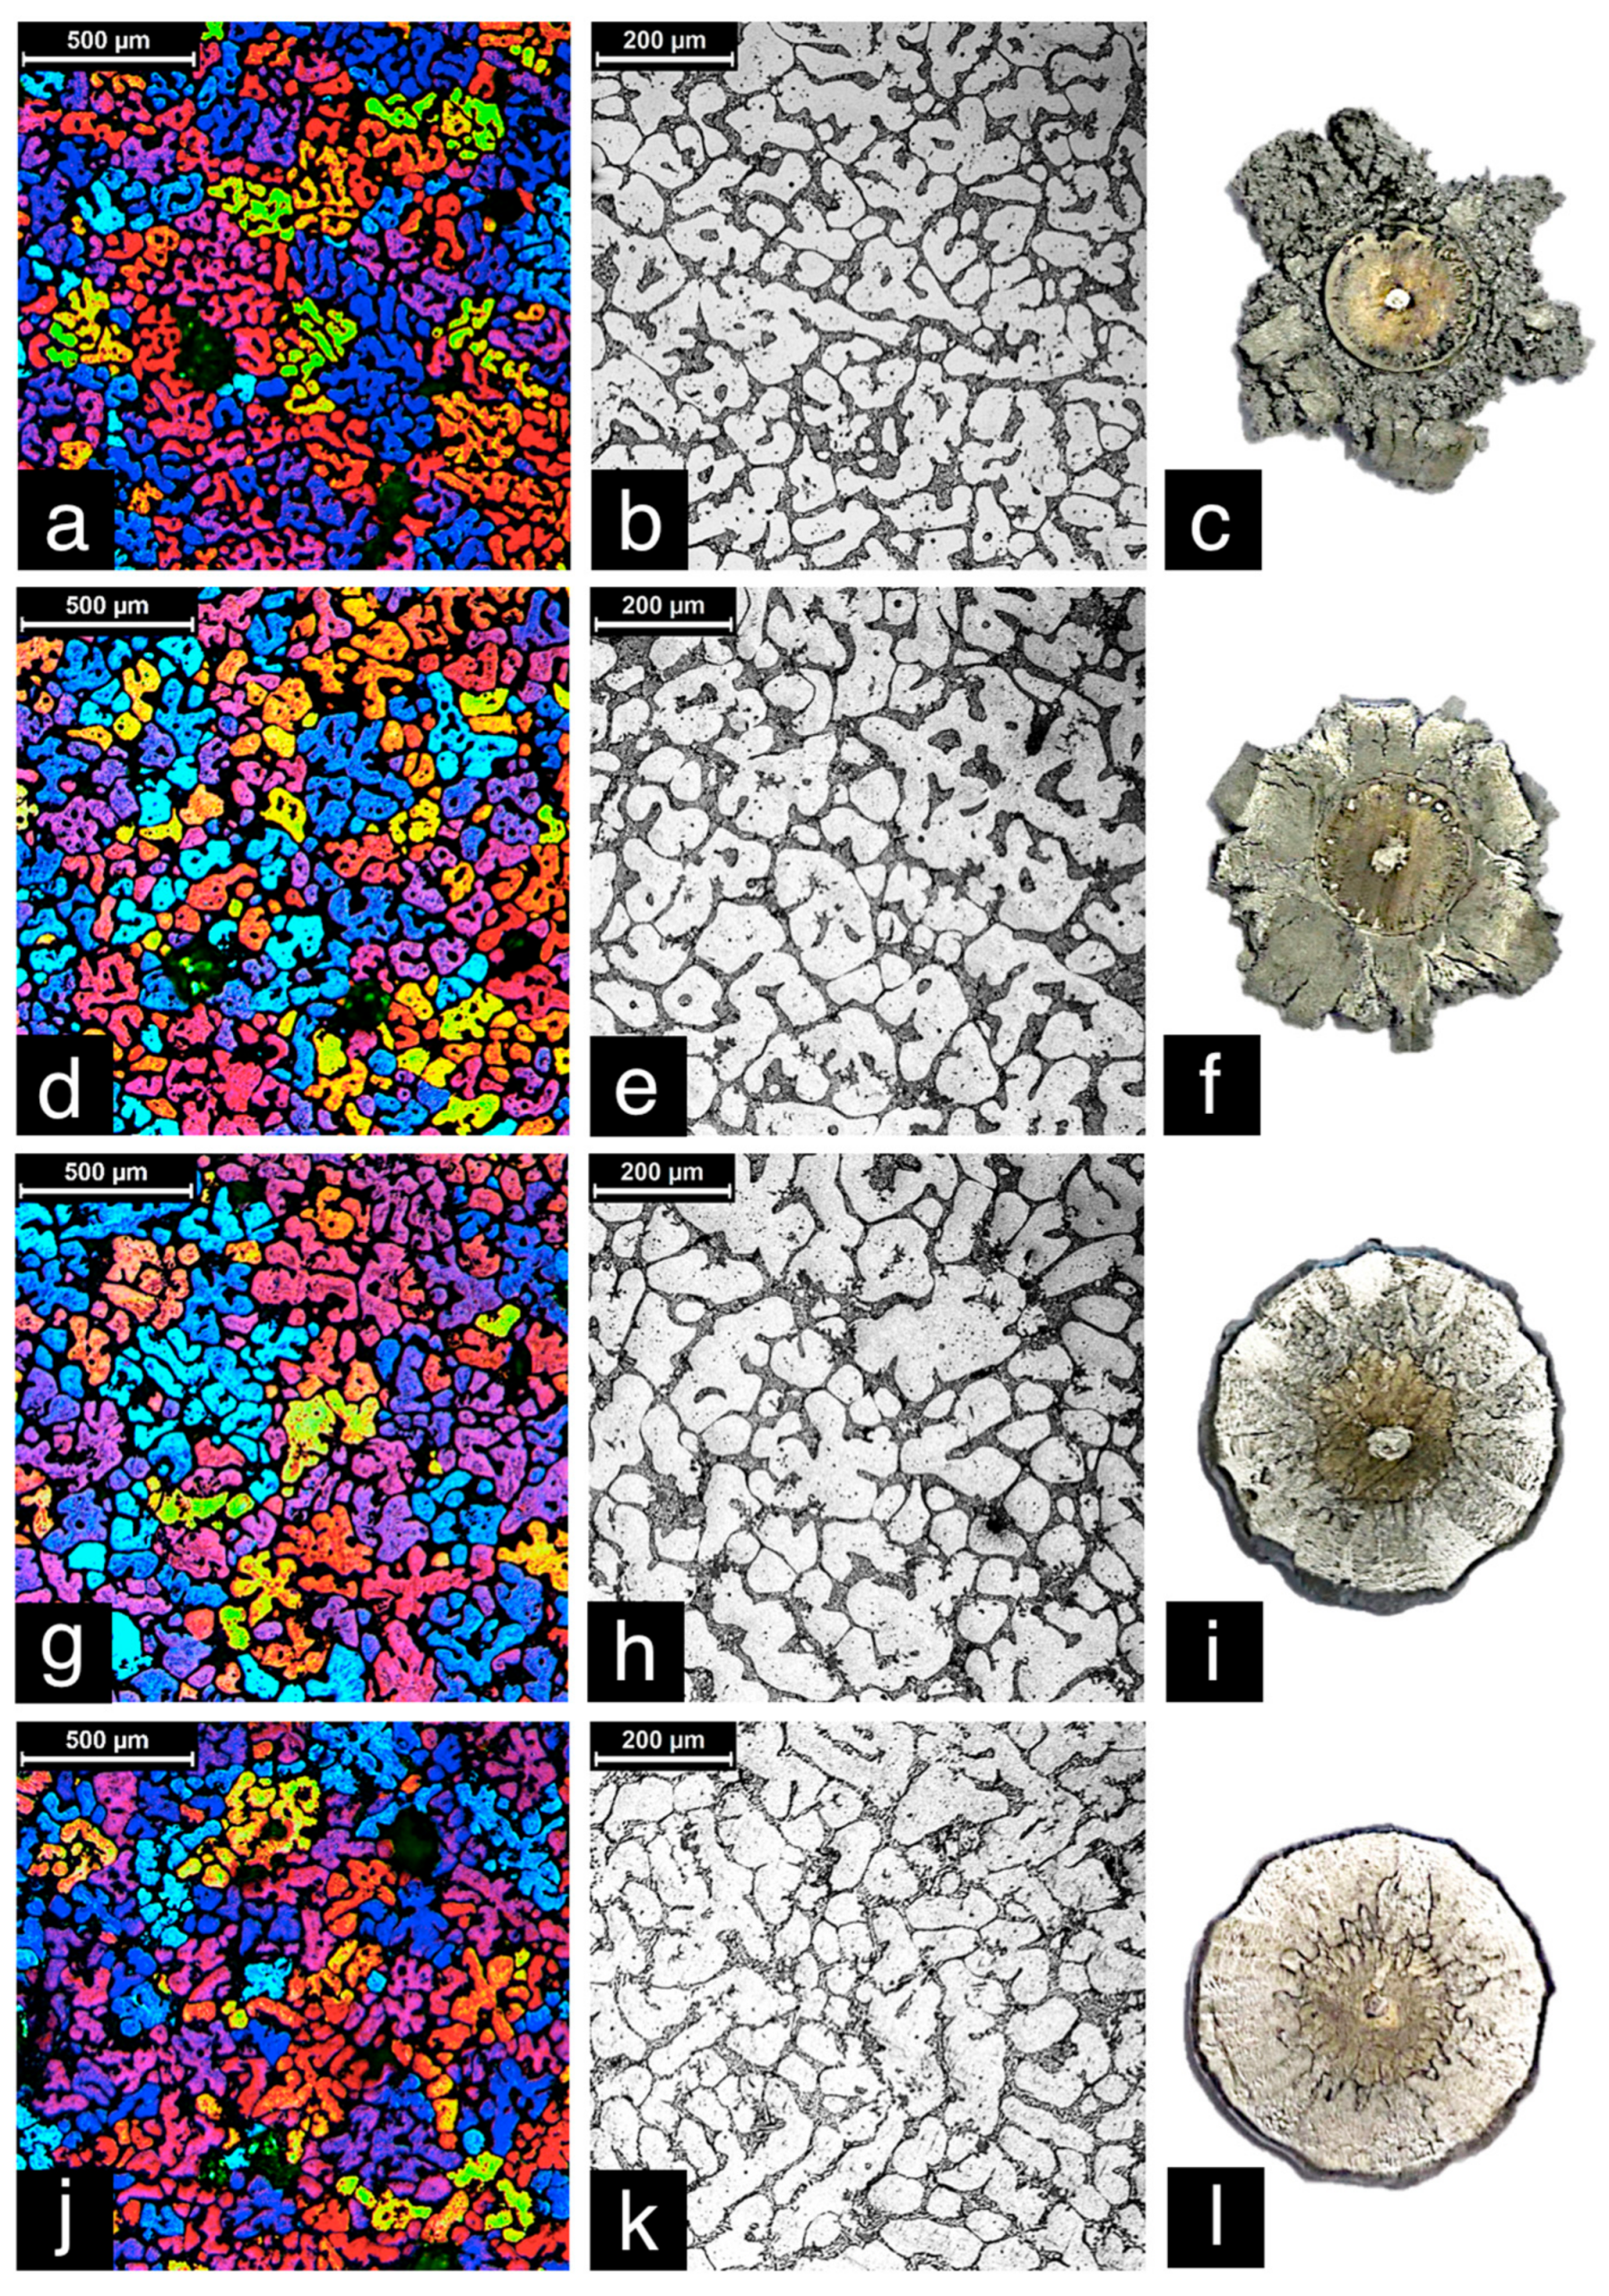
Figure 9 shows the microstructure (grains—color micrographs; globules—B&W micrographs) of samples heat-treated isothermally for 60 s at each of these temperatures (575 °C—Figure 9a,b; 582 °C—Figure 9d,e; 591 °C—Figure 9g,h; 595 °C—Figure 9j,k) and the corresponding thixoformed disks (Figure 9c,f,i,l). A soak time of 60 s was chosen because this is usually sufficient to allow diffusion to take place and a reasonable overview of the microstructural evolution in the semisolid state to be obtained [20]. Table 4 shows the mean values of the microstructural parameters for these conditions.
In general, the microstructures are similar for all of the heat treatments when a 60-s soak time is used (Figure 9 and Table 5). The differences in the appearance of the disks are probably caused by the different liquid fractions present at each temperature: the low liquid fraction at the two lowest temperatures (575 °C and 582 °C) leads to inadequate flow of the semisolid slurry during compression, resulting in disks with a brittle appearance after thixoforming (even after 90 s of isothermal heat treatment). At 575 °C the effect of the low liquid fraction is compounded by the possible presence of sharp particles in the eutectic phase, resulting in completely asymmetric disks. The two highest temperatures (591 °C and 595 °C) yielded more homogeneous, symmetric, compact thixoformed disks, probably because the semisolid slurry flowed more smoothly between the die. These two soak temperatures were therefore chosen for the analysis. Interestingly, the results reveal good agreement between the thermodynamic behavior predicted by the DM (based on the DSC curves) and the data obtained from semisolid forging of the B319+Fe alloy, i.e., only the two highest temperatures (591 °C and 595 °C) are considered good options for SSM processing by both approaches.
3.4. Microstructural Evolution During Isothermal Heat Treatment
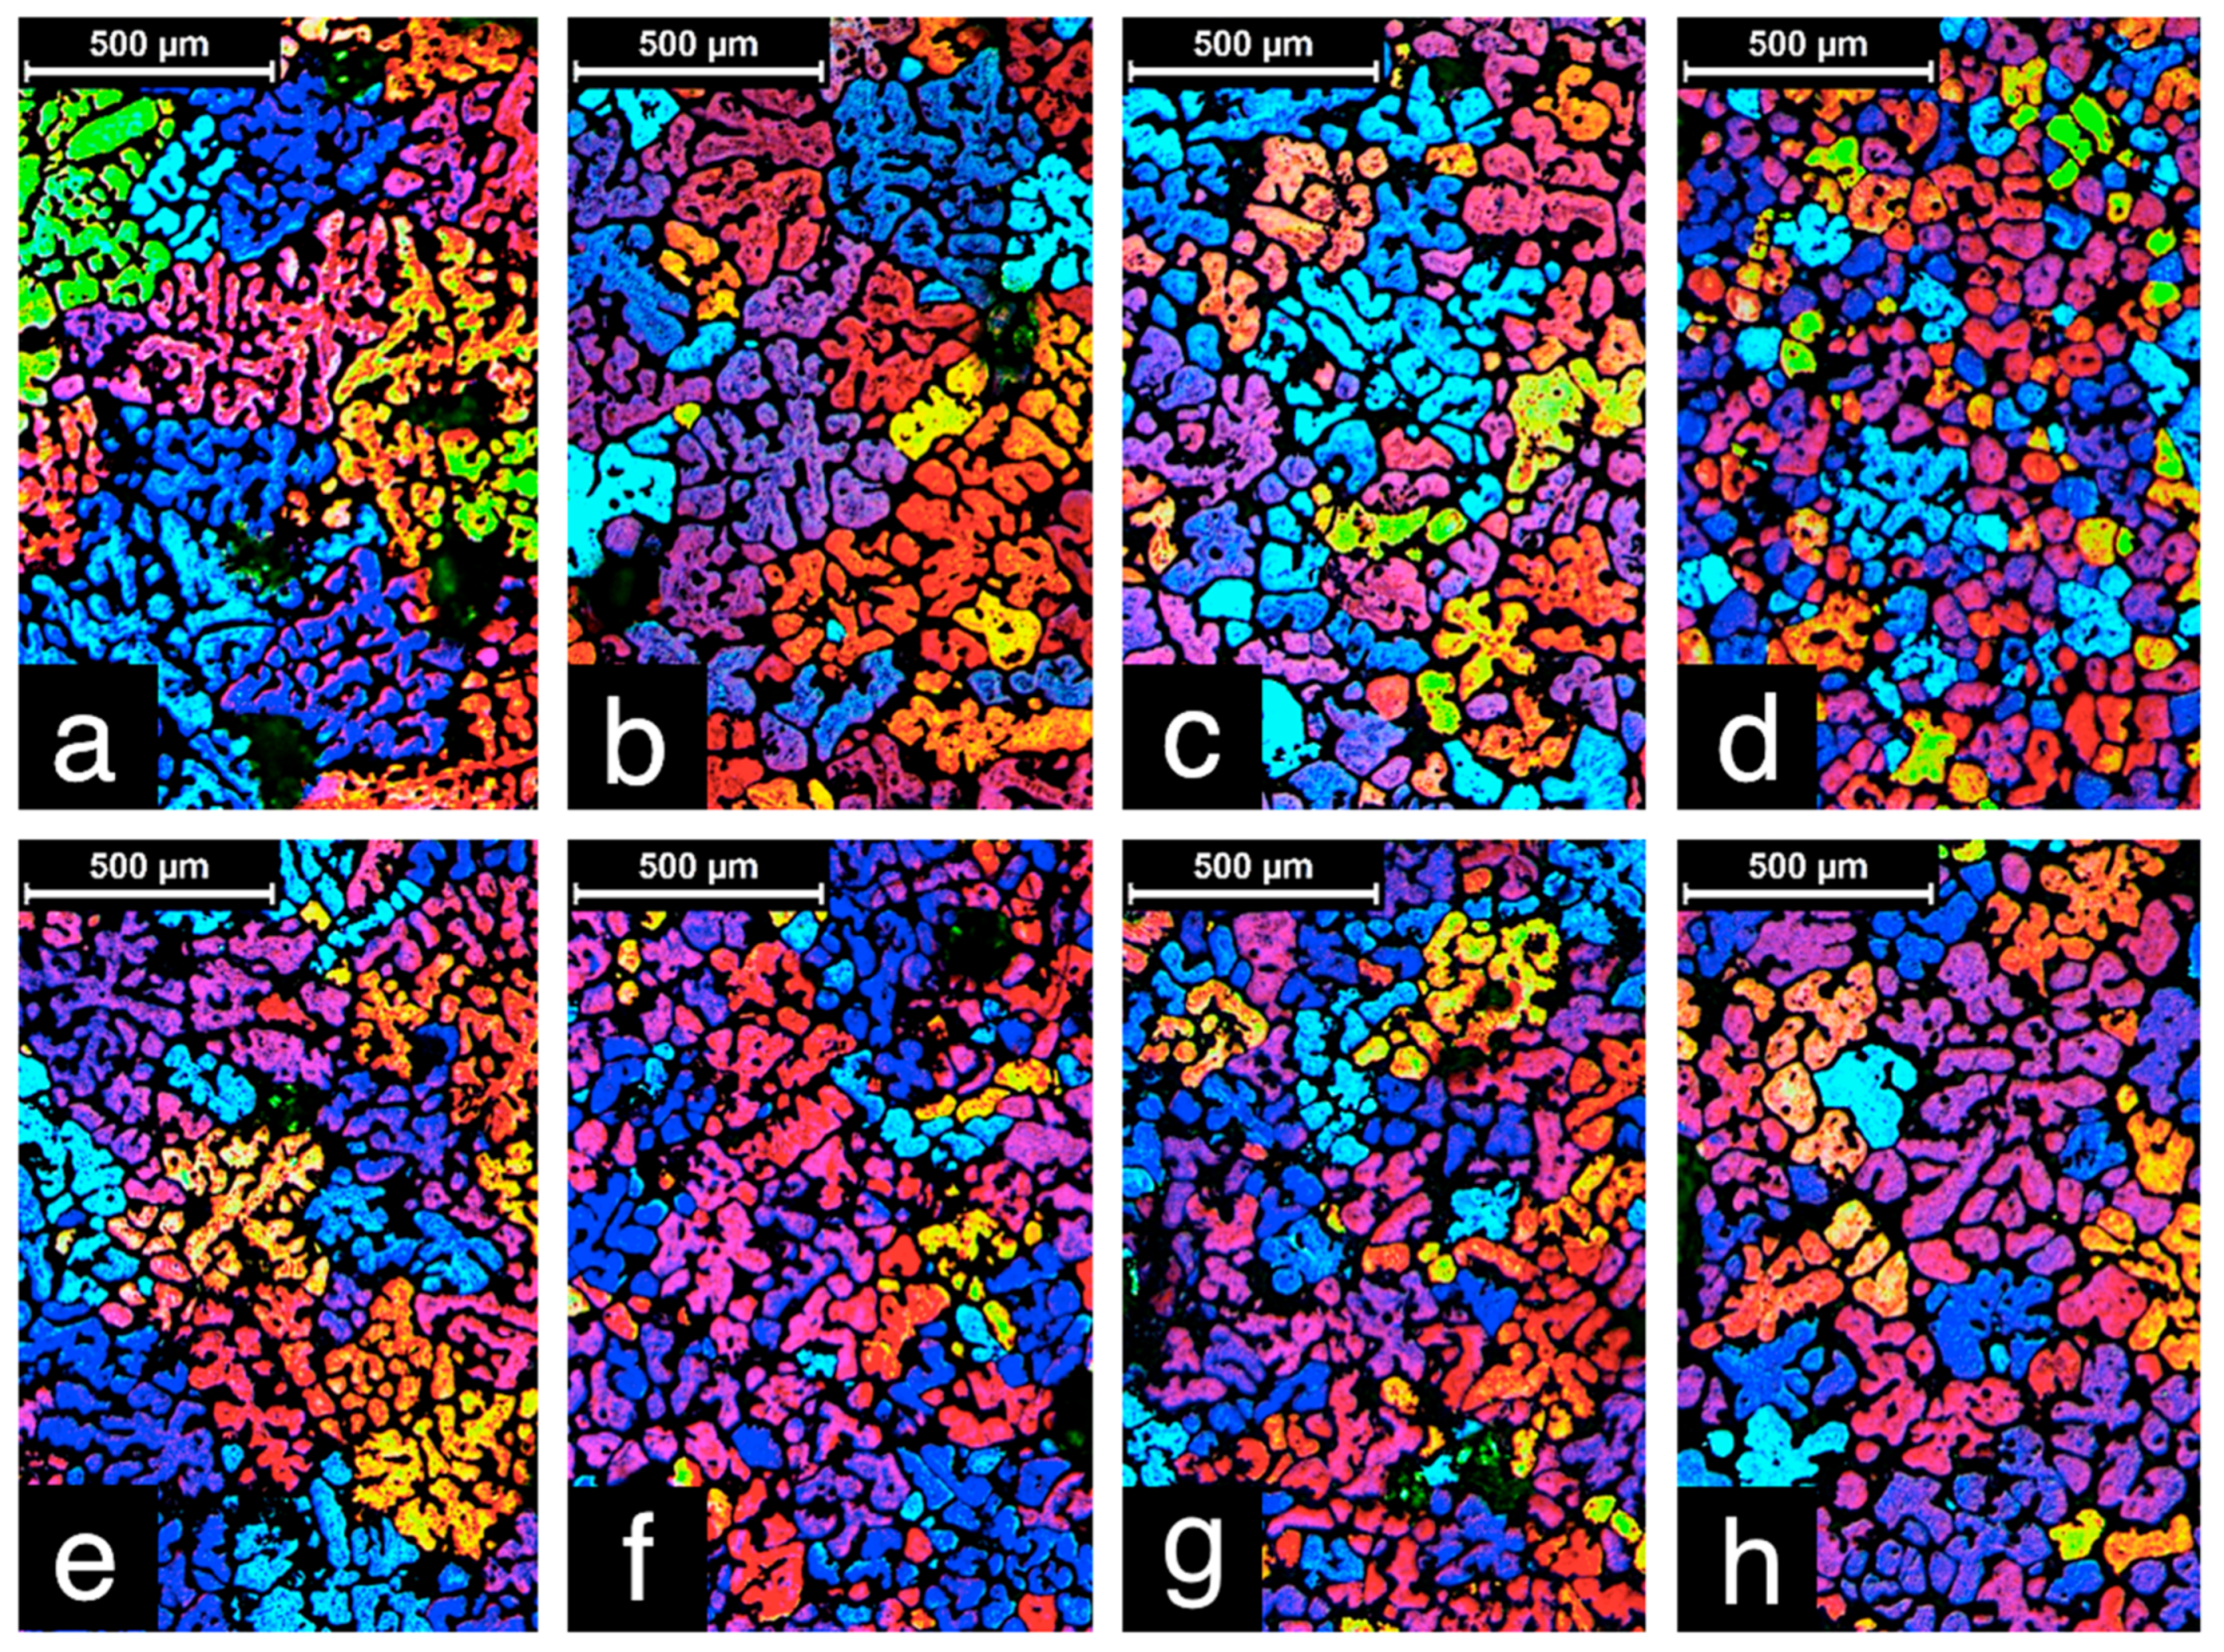
Figure 10 and Figure 11 show grains and globules, respectively, in the B319+Fe alloy after heating to 591 (Figure 10a–d) and 595 °C (Figure 10e–h) (i.e., the semisolid state) and soaking for 0, 30, 60, and 90 s (respectively) followed by water quenching. The polyhedral α-Fe particles in the alloy are highlighted in red in Figure 11. The mean values of the microstructural parameters are given in Table 5 for all of the analyzed conditions.
The colored micrographs (Figure 10) show a significant amount of α-Al phase particles with similar colors close to each other, indicating a high level of three-dimensional connection amongst the globules. When no soaking is applied (Figure 10a,e), a coarse dendritic-like morphology inherited from the original cast microstructure (Figure 2) is evident. As the soak time increases (30–90 s) (Figure 10b–d,f–h), progressively greater grain refinement is observed, resulting in a visible reduction in GS (Table 6). Grain refinement occurs because of the breakdown of the dendritic arms following the dissolution of thinner particles caused by Ostwald ripening during partial melting [30]. An exception to this trend is the 595 °C-90 s condition (Figure 10h), in which the long soak time at a high temperature allowed extensive coarsening (either by coalescence or Ostwald ripening), leading to exaggerated grain growth [39,40,41,42].
As observed for the grain analysis, the conventional B&W micrographs (Figure 11) show progressive, discrete refinement and spheroidization of the α-Al phase globules with increasing soak time. Spheroidization can also be observed from the circularity measurements in Table 6 and is due to the tendency for the surface-area-to-volume ratio of the particles to decrease as a result of atomic diffusion during coarsening. Particle refinement is a consequence of the same phenomenon discussed in connection with the results for grains. Again, the 595 °C-90 s condition is an exception, with larger globules caused by excessive heating (Figure 11h).
Neighboring globules become increasingly interconnected as the soak time increases. This is expected since the distance between neighboring particles decreases progressively and in some cases even becomes zero as a direct consequence of coarsening. Interconnected particles are particularly visible for the 90-s soak time (Figure 11d,h). Interconnectivity between the solid particles is undesirable because it contributes to the formation of a cohesive network that hampers the flow of the semisolid metal [20].
Another feature observed in the micrographs is the increase in the thickness of the liquid film between the solid particles as the soak time and temperature increase. A higher liquid fraction is a direct effect of increasing temperature and leads to a thicker liquid film throughout the entire microstructure. Furthermore, the formation of large agglomerates along with smaller particles in the microstructure as a result of Ostwald ripening (which is enhanced with the increase in soak time and temperature) promotes not only thickening of the liquid film but also segregation of the liquid, leading to regions with liquid “pockets” [43], as clearly seen for the 595 °C-90 s condition (Figure 11h). The ratio Gs/GLs (Table 6) gives an indication of the degree of connection between α-phase globules, i.e., the complexity of the three-dimensional dendritic “skeleton”. The decrease in this parameter with increasing soak time for both temperatures is a consequence of grain refinement, which makes the dimensions of the grains increasingly similar to those of the globules (GT/GLT → 1).
Up to this point, the microstructural evolution of the B319+Fe alloy has been discussed in relation to soak time (from 0 to 90 s). Analysis in terms of temperature shows that the higher of the two heat treatment temperatures studied (591 °C and 595 °C) leads to slightly more refined grains and globules, with the exception of the 595 °C-90 s condition, which produces the exaggerated coarsening already discussed. Circularity values are similar for both temperatures. Gs/GLs is higher at 595 °C than at 591 °C, indicating that globule refinement increases more quickly with increasing temperature than grain refinement does, i.e., superficial “corrosion” of globules (because of the formation of liquid) occurs more quickly than total separation from the main dendritic arms as the temperature increases. This is expected since superficial “corrosion” requires less energy than the total separation of the dendritic arm.
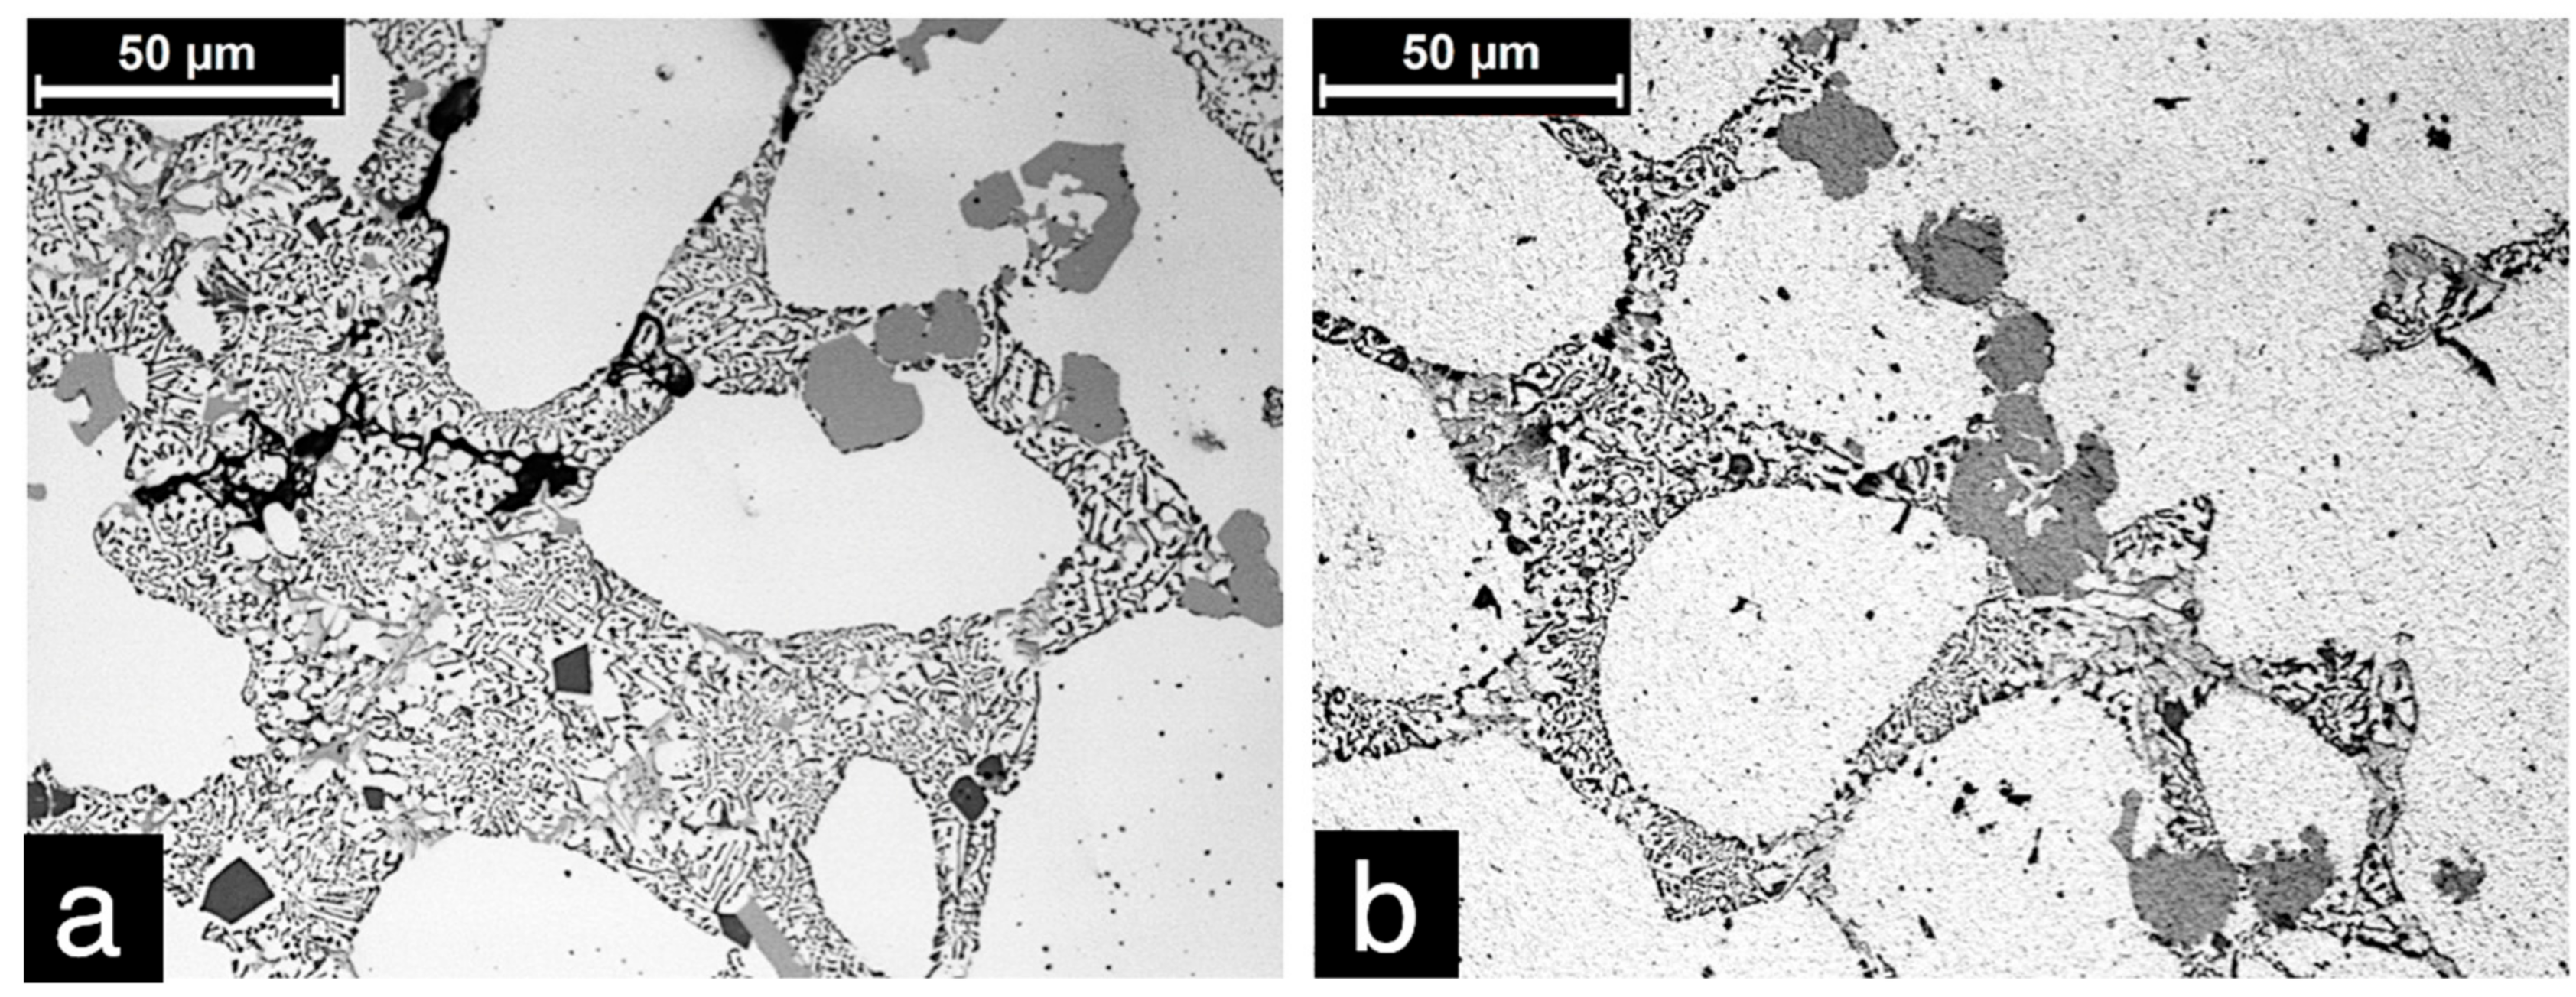
The amount, distribution, morphology, and size of the Al15(FeMnCr)3Si2 particles (Figure 11 and columns Ps and fP in Table 6) in the B319+Fe alloy are similar for all of the soak times and temperatures analyzed, indicating that they are thermodynamically stable. Figure 12 shows these particles for two extreme heat treatment conditions (575 °C-0 s and 595 °C-90 s). The similarity between the particles at each extreme of the time/temperature range can be clearly seen.
The α-Fe phase is usually formed at the expense of the β-Al-Fe-Si phase in the presence of Mn. When the ratio of Fe content to Mn content is less than 2, all of the β phase is expected to be replaced by the polygonal compound [39]. The B319+Fe alloy analyzed here has an Fe-to-Mn ratio of ~4, so only part of the β phase should be replaced by the α-Fe phase. This agrees with the fact that both phases are observed in the as-cast microstructure of the alloy (Section 2).
The two distinct morphologies of the α-Fe phase observed in the as-cast microstructure of the B319+Fe alloy (Chinese script and polyhedrons) are formed at different stages of solidification. The Chinese script, or skeleton-like, α-Fe phase nucleates as a secondary phase at the grain boundaries of the already-solidified α-Al phase. The “arms” of the skeleton shape develop according to the direction in which the solute flows in the surrounding liquid, giving the characteristic Chinese script morphology. The polyhedral morphology is formed by the nucleation of the α-Fe phase directly from the liquid before the α-Al phase in regions with a higher solute concentration [22,37,38,39]. The rounder shape is formed because of the higher thermodynamic stability of a lower ratio of surface energy to volume energy. Thus, the α-Fe phase polyhedrons can be expected to be stable since they melt at a much higher temperature than those used in the isothermal heat treatments.
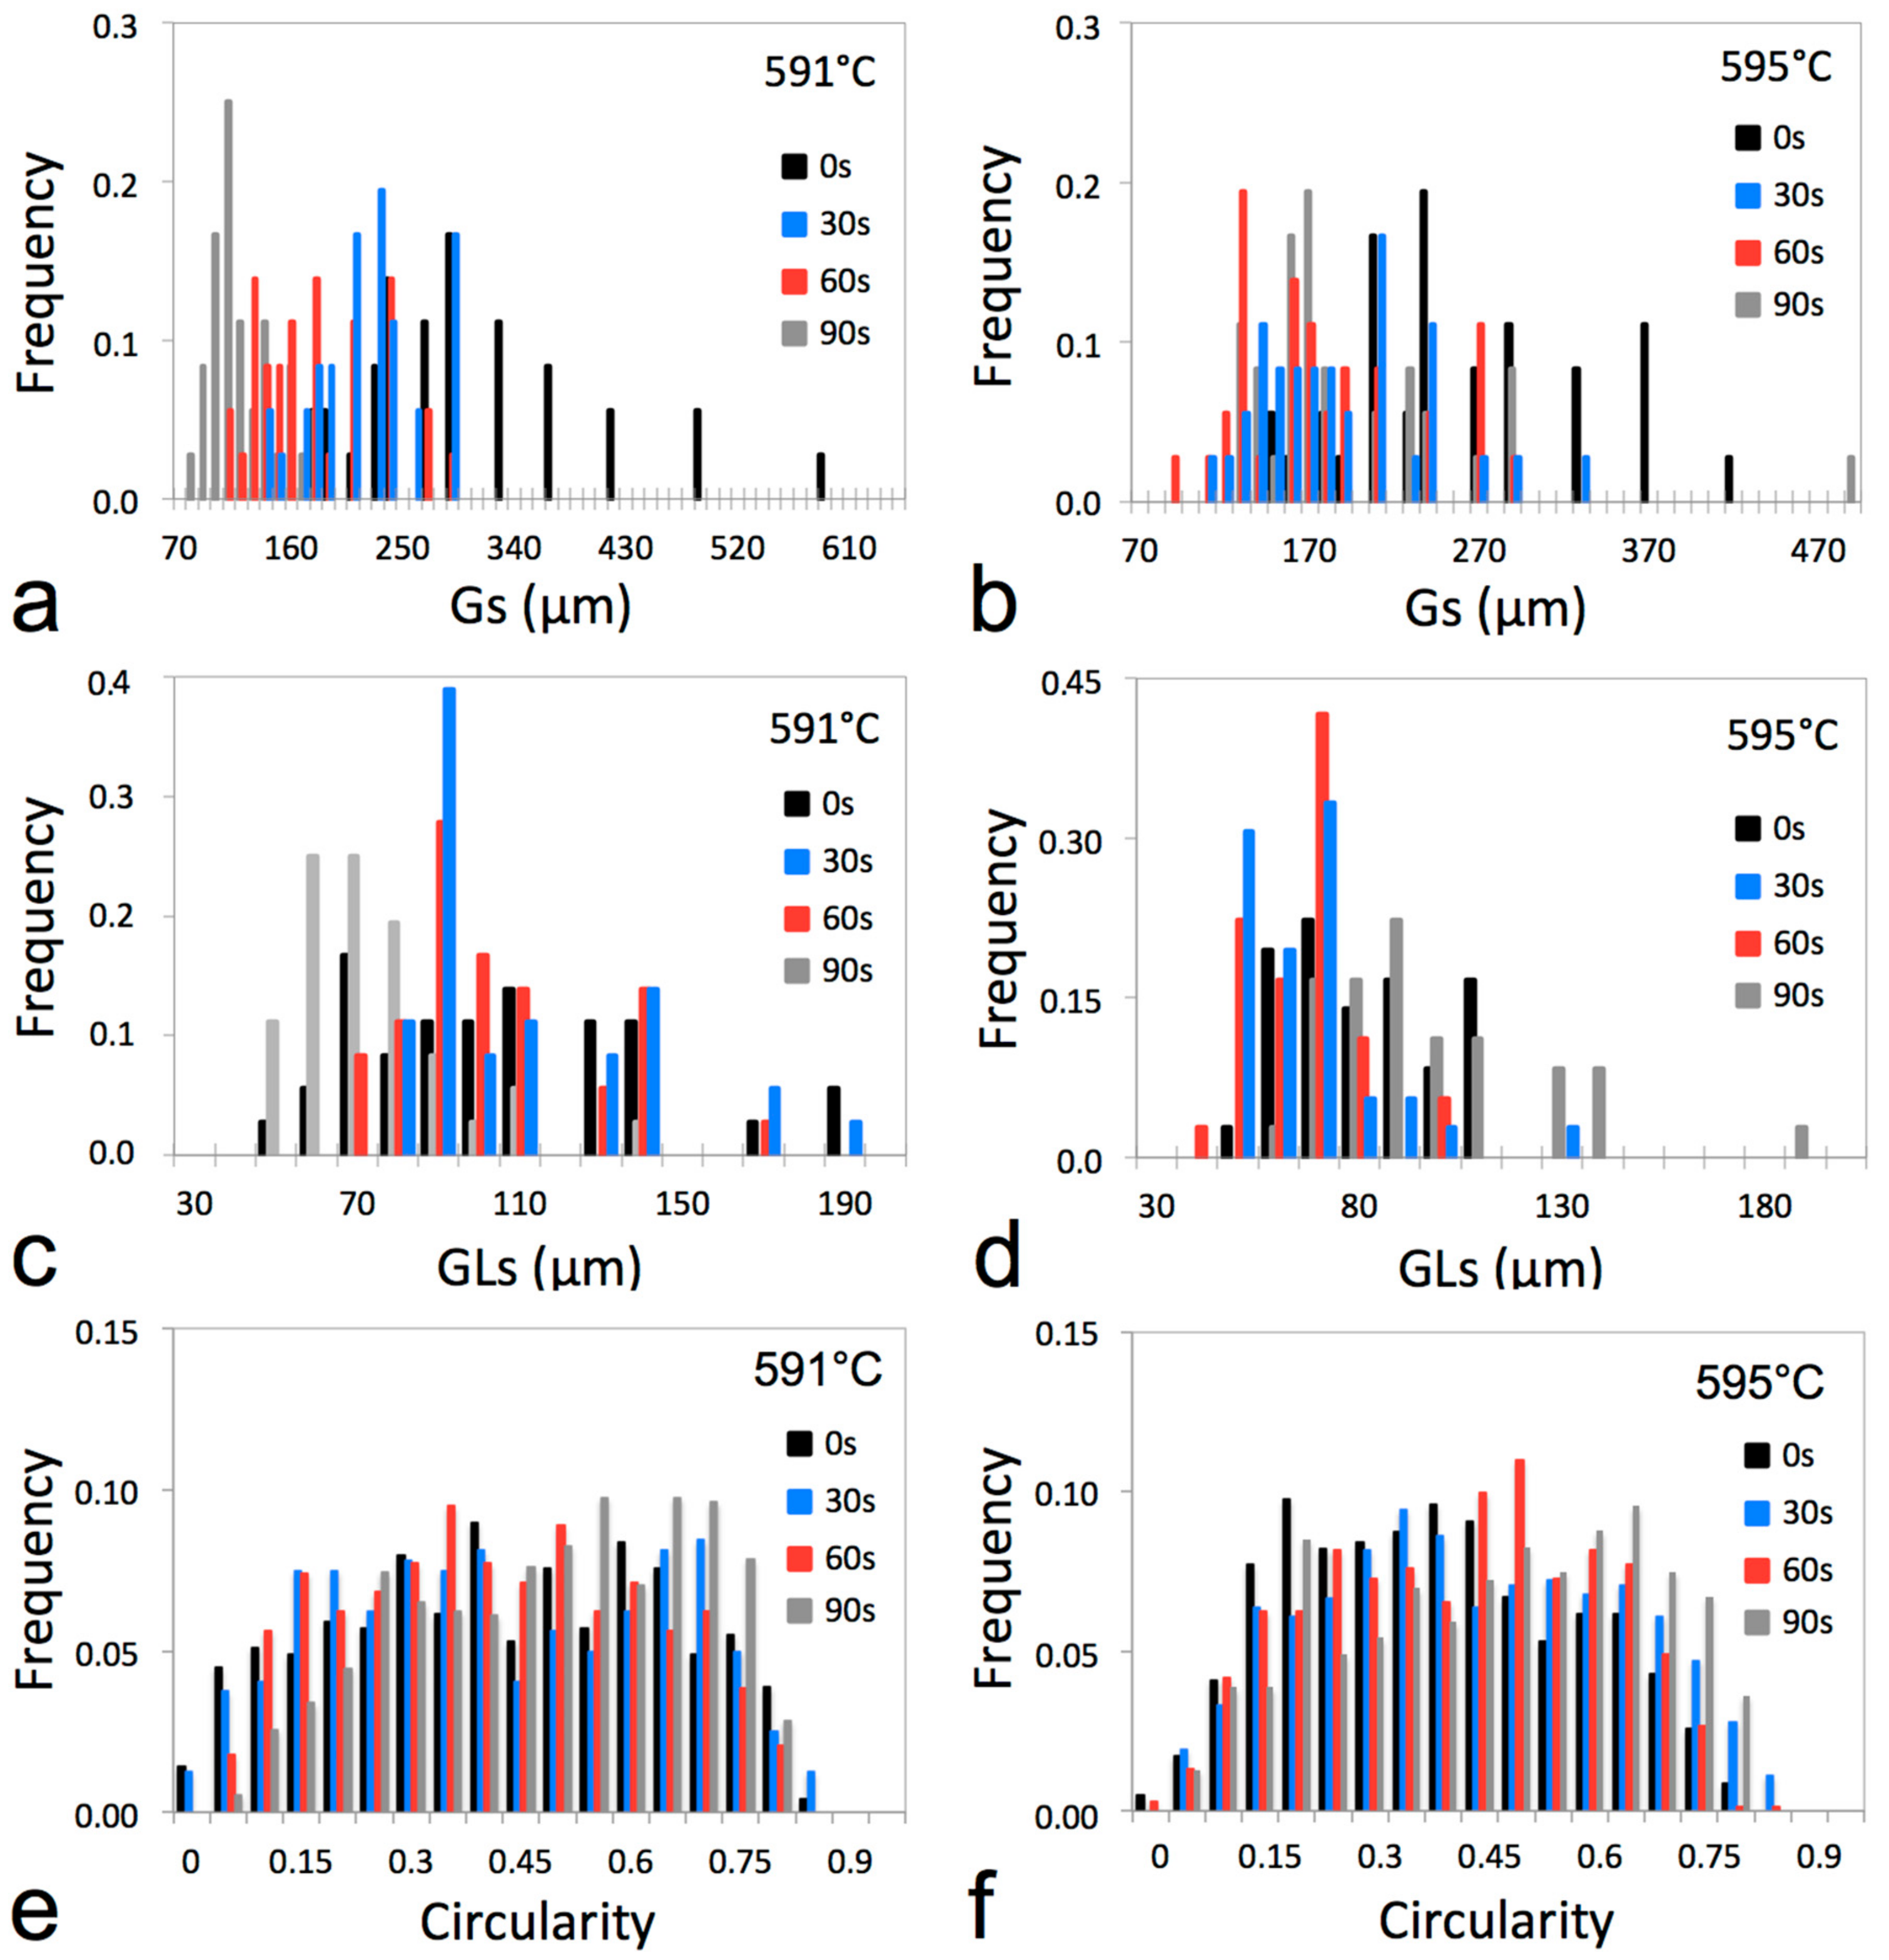
Quantitative analysis of Gs, GLs, and C for the B319+Fe alloy under the conditions studied suffers from inaccuracy because of the high standard errors of the measurements. Considering (a) the large statistical population sizes used for each parameter (n, given in Section 2) and (b) the high values of the resulting standard errors (obtained using the standard deviation and n, as described in Section 2), the variations can be considered to be the result not of inadequate statistical sample sizes but rather of the dispersive nature of the variables analyzed. The Ostwald ripening mechanism, which is responsible for the formation of large agglomerates and smaller particles, makes the microstructure extremely heterogeneous, contributing to the spread of the measurements. Gs, GLs, and C are therefore presented in the form of probability distributions in Figure 13a,b, Figure 13c,d, and Figure 13e,f, respectively, for temperatures of 591 °C (left) and 595 °C (right). The mean values of Gs/GLs were obtained by an algebraic operation and thus cannot be represented as a statistical distribution.
The parameters Gs (Figure 13a,b) and GLs (Figure 13c,d) have similar distributions, with a maximum frequency at smaller values. The maximum of the Gs distribution tends to be displaced to lower values as the soak time increases, reflecting the trend in Table 6. At 591 °C (Figure 13a) the progressive narrowing of the distribution of Gs as the duration of the isothermal treatment increases is particularly apparent, indicating that a longer soak time promotes a more homogeneous microstructure. At 595 °C (Figure 13b) a significant change in distribution is only seen when a soak time of 0 s (black columns) is compared with the other conditions, indicating that soaking for more than 30 s does not significantly affect Gs at this higher temperature. The distribution of GLs (Figure 13c,d) also tends to be displaced to lower values with increased soak time. At 591 °C (Figure 13c) a significant reduction and narrowing of the distribution is observed only after 90 s of isothermal treatment (grey columns). However, at 595 °C (Figure 13d) this displacement and narrowing occurs earlier, after 30–60 s (blue and red columns), indicating the role played by temperature in increasing diffusion. Contrasting with the trend observed up to this point, the distribution of GLs for the 595 °C-90 s condition (the grey columns in Figure 13d) is more spread out and extends to higher values, showing again that prolonged exposure of the microstructure to a high temperature leads to the excessive growth of α-phase particles, as discussed earlier. For some conditions, the Gs and GLs distributions become slightly bimodal, with a discrete second maximum located to the right of the main maximum. This is a clear indication of the presence of large agglomerates along with smaller particles in the microstructure because of Ostwald ripening. In general, circularity behaves like a statistical random variable (Figure 13e,f). For some heat treatment conditions, there is a discrete transition to a bimodal distribution, indicating again the simultaneous presence of individual (convex) and interconnected (concave) particles in the microstructure (Figure 11). After 90 s of isothermal treatment at both temperatures (grey columns in Figure 13e,f), the maximum clearly moves to higher values of circularity, showing that soak time helps to increase spheroidization.
Suitable grain sizes for semisolid slurries produced by conventional casting are usually of the order of ~70–150 μm [1,2], below those observed here (~130–280 μm). For thixoforming, the solid globules in the liquid should have a refined, spheroidal microstructure to allow the specific interaction between particles under shear that confers thixotropic characteristics on the semisolid slurry. As the present study is only the first stage in the evaluation of the suitability of B319+Fe alloy for use in SSM processing, the alloy was produced using a relatively cheap, conventional production process. This resulted in an initial, coarse microstructure that was present (albeit transformed by diffusion) after all heat treatments. Other forms of raw-material production should therefore be tested for this alloy to ensure adequate refinement and spheroidization.
Another essential characteristic for thixoforming is that the microstructure is stable, i.e., the size and shape of the remaining globules must remain unchanged over a range of soak times in the semisolid state. This characteristic is important because industrial processes are time-controlled rather than temperature-controlled: thixoforming operations use induction-heating furnaces that provide a set power for a fixed time to achieve the required temperature [20]. Significant changes in the microstructure during reheating and partial melting will therefore change the semisolid rheological behavior, adversely affecting the reproducibility of the process. Although the microstructure of the B319+Fe alloy studied here is coarse, the results show that it is stable for all of the soak times studied, indicating that this alloy is a promising raw material for thixoforming if adequate grain refinement is performed before processing.
3.5. Rheological Behavior in the Semisolid State
Figure 14 shows the engineering stress vs. engineering strain (Figure 14a,b) and apparent viscosity vs. shear rate (Figure 14c,d) curves of B319+Fe alloy samples subjected to isothermal heat treatment at 591 °C (left) and 595 °C (right) for 0, 30, 60, and 90 s. As the heat-treated alloy has a coarse dendritic-like microstructure, three regions can be identified in the curves in Figure 14: (a) a region of dendritic stability—the beginning of thixoforging consists of the compression of a highly interconnected dendritic network. As the formation progresses, the solid structure becomes more interconnected and intricate, leading to an increase in stress and apparent viscosity until a peak is observed in the latter (μmax in Figure 14c,d), when maximum interconnectivity is achieved; (b) a region of dendritic instability—the dendritic structure can no longer withstand the pressure applied and the dendritic arms break. The progressive movement of the particles causes the apparent viscosity to decrease. The stress continues to increase until it reaches a maximum (σmax in Figure 14a,b) and all of the dendritic “skeleton” has collapsed; (c) an unrestricted flow region—broken particles flow “freely” through the liquid, producing a higher shear rate and, consequently, a rapid decrease in the apparent viscosity, which in turn results in smaller values of stress as the strain continues to increase. After the decrease, only a small change in apparent viscosity is observed as the shear rate increases; the midpoint (in time) of the unrestricted flow region, i.e., the interval extending from the maximum stress to the end of the test (the last measurement on the right of the graph), is generally considered a representative value of the apparent viscosity of the thixotropic slurry. The tests performed here were stopped when a strain of 0.8 was reached for all samples; had the strain been increased further, a fourth region would be seen in the curves, in which the liquid would be fully expelled to the outer radius of the thixoforming disk, leading to a central region of the sample with an extremely high solid fraction. This situation would result in a rapid rise in stress and apparent viscosity until the end of the test, as if solid metal were being formed.
Table 7 shows the rheological parameters of the heat-treated samples at three moments during the thixoforming tests: the points of maximum apparent viscosity (μmax) and maximum stress (σmax) and the point that is representative of the unrestricted flow region. In Figure 14, the apparent viscosity and stress values for a given temperature are similar for soak times of 0, 30, and 60 s (black, blue, and red curves), while for a soak time of 90 s (grey curves) they are somewhat smaller. Thixoforming at 595 °C results in slightly smaller values of maximum stress and apparent viscosity (Figure 14b,d) than thixoforming at 591 °C (Figure 14a,c), which agrees with the higher liquid fraction of the alloy at 595 °C and consequent reduced viscosity and strength of the slurry. These results indicate that the liquid fraction (which is directly related to temperature) is more effective in changing the rheological behavior of the B319+Fe alloy than the slight changes in microstructure caused by different soak times. It should be borne in mind, as mentioned earlier (Section 3.4), that these changes were analyzed using mean values with large standard errors, i.e., distributions with large spreads, which were reflected in the homogeneous rheology of the semisolid slurry.
The maximum apparent viscosity obtained by thixoforging the B319+Fe alloy was of the order of 105 Pa.s. This compares favorably with values considered suitable for this kind of process in the literature, i.e., 104–106 Pa.s [1,2]. Thus, although the microstructure of the alloy is coarse (Section 3.4), its influence over rheology seems to be less than that of other processing parameters, such as the liquid fraction, higher values of which facilitate the movement of solid particles in the slurry. The rheological stability, i.e., the homogeneous flow of the thixotropic slurry during thixoforming after heat treatment under different conditions (temperatures and soak times), shows again that this alloy may be easy to control in the semisolid state and could thus potentially be a suitable raw material for use in SSM processing.
Coarse particles are known to be detrimental to the rheology of the semisolid slurry. However, the effect of the Fe-rich precipitates on the rheological behavior of the B319+Fe alloy cannot be evaluated because the amount, distribution, size, and morphology of these particles were similar for all isothermal treatments applied (Section 3.4). If these precipitates do indeed have a detrimental effect, then they affect all of the heat treatments similarly. Further investigation of this issue would require a comparison of the rheological results presented here with those for conventional B319 alloy (with a lower Fe content).
4. Conclusions
The suitability for thixoforming of an Al-Si-Cu alloy with a high Fe content (here referred to as B319+Fe) was analyzed. The results reveal good agreement between the thermodynamic behavior predicted by the DM and the data obtained from semisolid forging of samples of the alloy. Although the alloy has a coarse microstructure, its rheological behavior is appropriate for thixoforming, indicating that the microstructure only plays a secondary role in determining viscosity when enough liquid is present in the slurry to enhance the flow. The microstructural and rheological stability of the alloy at the temperatures and soak times studied here also make it a promising raw material for thixoforming. The similar amount, distribution, size, and morphology of Fe-rich precipitates after the various isothermal treatments indicate that these compounds are thermodynamically stable in the temperature range analyzed, but also prevent an evaluation of their effect on the rheological behavior of the alloy.
Author Contributions
G.L.B., performed most part of this investigation in her PhD that include the raw material preparation, thermodynamic, microstructure and rheological characterization. She performed the experimental procedure as well as the data acquisition and analysis and wrote the initial version of this paper. C.T.W.P. help with the experimental procedure regarding the rheological analysis as well as the microstructure characterization. E.J.Z. was responsible for conceptualization, methodology, formal analysis, validation, funding acquisition, as well as project administration and the final writing and reviewing.
Funding
This research was funded by [Sao Paulo Research Foundation (Fapesp) and Nation Scientific Council (CNPq)] grant numbers [2015/22143-3 and PQ 306896-2013-3].
Acknowledgments
The authors would like to thank the Brazilian research funding agencies FAPESP (São Paulo Research Foundation—Projects 2013/09961-3 and 2015/22143-3), CNPq (National Council for Scientific and Technological Development—Project CNPq PQ 304921-2017-3), and CAPES (Federal Agency for the Support and Improvement of Higher Education) for providing financial support for this study. The authors are also indebted to the Faculty of Mechanical Engineering at the University of Campinas for the practical support very kindly provided.
Conflicts of Interest
The authors declare no conflict of interest. The founding sponsors had no role in the design of the study; in the collection, analyses, or interpretation of data; in the writing of the manuscript, and in the decision to publish the results.
References
- Kirkwood, D.H.; Suéry, M.; Kapranos, P.; Atkinson, H.V.; Young, K.P. Semisolid Processing of Alloys, 1st ed.; Springer: Berlin/Heidelberg, Germany, 2010; p. 172. ISBN 978-3-642-00706-4. [Google Scholar]
- Flemings, M.C. Behavior of metal alloys in the semisolid state. Metall. Trans. A 1991, 22, 957–981. [Google Scholar] [CrossRef]
- Zoqui, E.J. Alloys for semisolid processing. In Comprehensive Materials Processing, 1st ed.; Hashmi, S., Ed.; Elsevier: Amsterdam, The Netherlands, 2014; Volume 5, pp. 163–190. ISBN 978-0-08-096533-8. [Google Scholar]
- Atkinson, H.V. Modelling the semisolid processing of metallic alloys. Prog. Mater. Sci. 2005, 50, 341–412. [Google Scholar] [CrossRef]
- Jung, H.K.; Kang, C.G. Reheating process of cast and wrought aluminum alloys for thixoforging and their globularization mechanism. J. Mater. Process. Tech. 2000, 104, 244–253. [Google Scholar] [CrossRef]
- Chen, Y.; Wei, J.; Zhao, Y.; Zheng, J. Microstructure evolution and grain growth behavior of Ti14 alloy during semisolid isothermal process. Trans. Nonferr. Metal. Soc. 2011, 21, 1018–1022. [Google Scholar] [CrossRef]
- Reisi, M.; Niroumand, B. Growth of primary particles during secondary cooling of a rheocast alloy. J. Alloys Compd. 2009, 475, 643–647. [Google Scholar] [CrossRef]
- Lashkari, O.; Ghomashchi, R. The implication of rheology in semisolid metal processes: An overview. J. Mater. Process. Tech. 2007, 182, 229–240. [Google Scholar] [CrossRef]
- Perez, M.; Barbé, J.C.; Neda, Z.; Bréchet, Y.; Salvo, L. Computer simulation of the microstructure and rheology of semisolid alloys under shear. Acta Mater. 2000, 48, 3773–3782. [Google Scholar] [CrossRef]
- Liu, D.; Atkinson, H.V.; Jones, H. Thermodynamic prediction of thixoformability in alloys based on the Al–Si–Cu and Al–Si–Cu–Mg systems. Acta Mater. 2005, 53, 3807–3819. [Google Scholar] [CrossRef]
- Uggowitzer, P.P.J.; Uhlenhaut, D.I. Metallurgical aspects of SSM processing. In Thixoforming: Semi-Solid Metal Processing, 1st ed.; Hirt, G., Kopp, R., Eds.; Wiley-VCH: Weinheim Germany, 2009; pp. 31–42. [Google Scholar] [CrossRef]
- Zoqui, E.J.; Benati, D.M.; Proni, C.T.W.; Torres, L.V. Thermodynamic evaluation of the thixoformability of Al–Si alloys. CALPHAD 2016, 52, 98–109. [Google Scholar] [CrossRef]
- Chiarmetta, G. Why Thixo? In Proceedings of the 6th International Conference on Semi-Solid Processing of Alloys and Composites, Turin, Italy, 27–29 September 2000; pp. 15–21. [Google Scholar]
- Zoqui, E.J.; Gracciolli, J.I.; Lourençato, L.A. Thixo-formability of the AA6063 alloy: Conventional production processes versus electromagnetic stirring. J. Mater. Process. Tech. 2008, 198, 155–161. [Google Scholar] [CrossRef]
- Proni, C.T.W.; Torres, L.V.; Haghayeghi, R.; Zoqui, E.J. ECAP: An alternative route for producing AlSiCu for use in SSM processing. Mater. Charact. 2016, 118, 252–262. [Google Scholar] [CrossRef]
- Paes, M.; Zoqui, E.J. Semisolid behavior of new Al–Si–Mg alloys for thixoforming. Mater. Sci. Eng. A 2005, 406, 63–73. [Google Scholar] [CrossRef]
- Nadal, R.L.; Roca, A.S.; Fals, H.D.C.; Zoqui, E.J. Mechanical properties of thixoformed hypoeutectic gray cast iron. J. Mater. Process. Tech. 2015, 226, 146–156. [Google Scholar] [CrossRef]
- Haghayeghi, R.; Zoqui, E.J.; Timelli, G. Enhanced refinement and modification via self-inoculation of Si phase in a hypereutectic aluminium alloy. J. Mater. Process. Tech. 2018, 252, 294–303. [Google Scholar] [CrossRef]
- Roca, A.S.; Fals, H.D.C.; Pedron, J.A.; Zoqui, E.J. Thixoformability of hypoeutectic gray cast iron. J. Mater. Process. Tech. 2012, 212, 1225–1235. [Google Scholar] [CrossRef]
- Campo, K.N.; Zoqui, E.J. Thixoforming of an ECAPed Aluminum A356 Alloy: Microstructure Evolution, Rheological Behavior, and Mechanical Properties. Metall. Mater. Trans. A 2016, 4, 1–11. [Google Scholar] [CrossRef]
- Irizalp, S.G.; Saklakoglu, N. Effect of Fe-rich intermetallics on the microstructure and mechanical properties of thixoformed A380 aluminum alloy. Eng. Sci. Tech. Int. J. 2014, 17, 58–62. [Google Scholar] [CrossRef]
- Evolution of Phases in a Recycled Al-Si Cast Alloy During Solution Treatment. Available online: https://www.intechopen.com/books/scanning-electron-microscopy/evolution-of-phases-in-a-recycled-al-si-cast-alloy-during-solution-treatment (accessed on 8 March 2018).
- Brollo, G.L.; Proni, C.T.W.; Paula, L.C.; Zoqui, E.J. An alternative method to identify critical temperatures for semisolid materials process applications using differentiation. Thermochim. Acta 2017, 651, 22–33. [Google Scholar] [CrossRef]
- Brollo, G.L.; Paula, L.C.; Proni, C.T.W.; Zoqui, E.J. Analysis of the thermodynamic behavior of A355 and B319 alloys using the Differentiation Method. Thermochim. Acta 2018, 659, 121–135. [Google Scholar] [CrossRef]
- NADCA Standards for Semi-Solid and Squeeze Casting Processes; Section 3; North American Die Casting Association: Arlington Heights, IL, USA, 2006.
- Nafisi, S.; Emadi, D.; Ghomashchi, R. Semi solid metal processing: The fraction solid dilemma. Mater. Sci. Eng. A 2009, 507, 87–92. [Google Scholar] [CrossRef]
- Kazakov, A.A.; Luong, N.H. Characterization of semisolid materials structure. Mater. Charact. 2001, 46, 155–161. [Google Scholar] [CrossRef]
- Zoqui, E.J.; Shehata, M.T.; Paes, M.; Kao, V.; Es-Sadiqi, E. Morphological evolution of SSM A356 during partial remelting. Mater. Sci. Eng. A 2002, 325, 38–53. [Google Scholar] [CrossRef]
- ASTM International E112-13. Standard Test Methods for Determining Average Grain Size. Available online: https://www.astm.org/Standards/E112.htm (accessed on 8 March 2018).
- Proni, C.T.W.; Zoqui, E.J. The effect of heating rate on the microstructural breakdown required for thixoformability. Int. J. Mater. Res. 2017, 108, 228–236. [Google Scholar] [CrossRef]
- Laxmanan, V.; Flemings, M.C. Deformation of semi-solid Sn-15 Pct Pb alloy. Metall. Trans. A 1980, 11A, 1927–1937. [Google Scholar] [CrossRef]
- Warmuzek, M. Metallographic Techniques for Aluminum and Its Alloys. In Metallography and Microstructures, 1st ed.; Voort, G.F.V., Ed.; ASM International: Materials Park, OH, USA, 2004; Volume 9, pp. 711–775. ISBN 978-0-87170-706-2. [Google Scholar]
- Prados, E.F.; Sordi, V.L.; Ferrante, M. The effect of Al2Cu precipitates on the microstructural evolution, tensile strength, ductility and work-hardening behaviour of a Al–4 wt.% Cu alloy processed by equal-channel angular pressing. Acta Mater. 2013, 61, 115–125. [Google Scholar] [CrossRef]
- Tabibian, S.; Chakaluk, E.; Constantinescu, A.; Szmytka, F.; Oudin, A. TMF–LCF life assessment of a Lost Foam Casting A319 aluminum alloy. Int. J. Fatigue 2013, 53, 75–81. [Google Scholar] [CrossRef]
- Jorstad, J.L.; Pan, Q.Y.; Apelian, D. Solidification microstructure affecting ductility in semi-solid-cast products. Mater. Sci. Eng. A 2005, 413–414, 186–191. [Google Scholar] [CrossRef]
- Gao, T.; Hu, K.; Wang, L.; Zhang, B.; Liu, X. Morphological evolution and strengthening behavior of a-Al(Fe,Mn)Si in Al–6Si–2Fe–xMn alloys. Results Phys. 2017, 7, 1051–1054. [Google Scholar] [CrossRef]
- Warng, P.S.; Liauh, Y.J.; Lee, S.L.; Lin, J.C. Effects of Be addition on microstructures and mechanical properties of B 319.0 alloys. Mater. Chem. Phys. 1998, 53, 195–202. [Google Scholar] [CrossRef]
- Martinez, R.; Russier, V.; Couzinier, J.P.; Guillot, I.; Cailletaud, G. Modeling of the influence of coarsening on viscoplastic behavior of a 319 foundry aluminum alloy. Mater. Sci. Eng. A 2013, 559, 40–48. [Google Scholar] [CrossRef]
- Tzimas, E.; Zavaliangos, A. Materials selection for semisolid processing. Mater. Manuf. Process. 1999, 14, 217–230. [Google Scholar] [CrossRef]
- Wang, N.; Zhou, Z.; Lu, G. Microstructural Evolution of 6061 Alloy during Isothermal Heat Treatment. J. Mater. Sci. Technol. 2011, 27, 8–14. [Google Scholar] [CrossRef]
- Modigelli, M.; Pola, A. Modeling of shear induced coarsening effects in semi-solid alloys. Trans. Nonferr. Metal. Soc. 2010, 20, 1696–1701. [Google Scholar] [CrossRef]
- Werz, T.; Baumann, M.; Wolfram, U.; Kril, C.E., III. Particle tracking during Ostwald ripening using time-resolved laboratory X-ray microtomography. Mater. Charact. 2014, 90, 185–195. [Google Scholar] [CrossRef]
- Jiang, J.; Wang, Y.; Atkinson, H.V. Microstructural coarsening of 7005 aluminum alloy semisolid billets with high solid fraction. Mater. Charact. 2014, 90, 52–61. [Google Scholar] [CrossRef]
Figure 1.
Micrograph of the B319+Fe alloy. (a) Polarized light optical micrograph highlighting grains (a single grain is outlined in white); (b) conventional B&W optical micrograph highlighting globules (six globules of the same grain are outlined in red).
Figure 1.
Micrograph of the B319+Fe alloy. (a) Polarized light optical micrograph highlighting grains (a single grain is outlined in white); (b) conventional B&W optical micrograph highlighting globules (six globules of the same grain are outlined in red).

Figure 2.
Micrographs of the as-cast B319+Fe alloy. (a) Polarized light optical micrograph highlighting grains; conventional B&W optical micrographs highlighting (b) globules and α-Fe polyhedral particles (blue arrows), (c) acicular β-Al5FeSi phase (arrow 1) and plates of the θ-Al2Cu phase (arrow 2) nucleated around β phase, (d) Chinese script α-Fe (Al15(MnFeCr)3Si2) phase (arrow 3) and Al-Si eutectic (arrow 4), (e) clusters of the Al-Al2Cu-Si phase (arrow 5) and polyhedrons of the α-Fe (Al15(MnFeCr)3Si2/Al15(MnFe)3Si2) phase (arrow 6).

Figure 3.
SE-SEM micrographs of the as-cast B319+Fe alloy showing points used for punctual chemical analysis: α-Al (points A), Al-Si eutectic (points B), α-Al15(MnFeCr)3Si2 particles (points C), θ-Al2Cu/Al-Al2Cu-Si clusters (points D), Chinese script α-Al15(MnFeCr)3Si2 (point E).
Figure 3.
SE-SEM micrographs of the as-cast B319+Fe alloy showing points used for punctual chemical analysis: α-Al (points A), Al-Si eutectic (points B), α-Al15(MnFeCr)3Si2 particles (points C), θ-Al2Cu/Al-Al2Cu-Si clusters (points D), Chinese script α-Al15(MnFeCr)3Si2 (point E).

Figure 4.
SEM micrographs of the as-cast B319+Fe alloy. (a) Backscattered electron (BSE) scanning electron micrograph showing zoomed-in α-Fe polyhedral particles (white polygons); energy-dispersive spectroscopy (EDS) scanning electron micrograph of the same region shown in (a), revealing the distribution of Al (b), Si (c), Cu (d), Fe (e), Zn (f), Mn (g), Mg (h), and Cr (i).

Figure 5.
HFR (a), dHFR/dT (b), fl (c), and dfl/dT (d) vs. T curves for the B319+Fe alloy at several heating rates. The values predicted by numerical simulation under the Scheil conditions are shown for reference (grey curves). The arrows indicate phase transformations and temperatures of interest identified by the differentiation method (DM). The VS arrow indicates a “visible superposition” of phase transformations in the DSC curves.

Figure 6.
Key thixoforming parameters for B319+Fe alloy at different heating rates: temperature (a) and liquid fraction (b). The values predicted by numerical simulation are shown for reference (leftmost column in each chart).
Figure 6.
Key thixoforming parameters for B319+Fe alloy at different heating rates: temperature (a) and liquid fraction (b). The values predicted by numerical simulation are shown for reference (leftmost column in each chart).

Figure 7.
fl vs. T curves (in red) derived from DSC data for B319+Fe alloy at heating rates of 15, 20, and 25 °C/min. The four temperatures chosen for the thixoforming tests (575, 582, 591, and 595 °C) are indicated by horizontal blue lines. Thixoformed disks after isothermal heat treatment at these temperatures for 0, 30, 60, and 90 s are shown to the right of the graph. The eutectic knee (purple circles) and lower limit of the SSM working window (green circles) are also highlighted on the curves.

Figure 8.
Micrograph highlighting globules (black area) and “frozen” liquid (red area) for B319+Fe alloy after heat treatments using two extreme combinations of temperature and soak time: 575 °C-0 s (a) and 595 °C-90 s (b).
Figure 8.
Micrograph highlighting globules (black area) and “frozen” liquid (red area) for B319+Fe alloy after heat treatments using two extreme combinations of temperature and soak time: 575 °C-0 s (a) and 595 °C-90 s (b).

Figure 9.
Micrographs showing the microstructure of semisolid B319+Fe alloy (grains—color; globules—B&W) heat-treated isothermally for 60 s at 575 °C (a,b), 582 °C (d,e), 591 °C (g,h), and 595 °C (j,k), and the respective thixoformed disks (c,f,i,l).
Figure 9.
Micrographs showing the microstructure of semisolid B319+Fe alloy (grains—color; globules—B&W) heat-treated isothermally for 60 s at 575 °C (a,b), 582 °C (d,e), 591 °C (g,h), and 595 °C (j,k), and the respective thixoformed disks (c,f,i,l).

Figure 10.
Colored micrographs showing grains in semisolid B319+Fe alloy after isothermal heat treatment at 591 °C (a–d) and 595 °C (e–h) for 0 (a,e), 30 (b,f), 60 (c,g), and 90 s (d,h).
Figure 10.
Colored micrographs showing grains in semisolid B319+Fe alloy after isothermal heat treatment at 591 °C (a–d) and 595 °C (e–h) for 0 (a,e), 30 (b,f), 60 (c,g), and 90 s (d,h).

Figure 11.
B&W micrographs showing globules in semisolid B319+Fe alloy after isothermal heat treatment at 591 °C (a–d) and 595 °C (e–h) for 0 s (a,e), 30 s (b,f), 60 s (c,g), and 90 s (d,h). Polyhedral α-Fe particles are highlighted in red.
Figure 11.
B&W micrographs showing globules in semisolid B319+Fe alloy after isothermal heat treatment at 591 °C (a–d) and 595 °C (e–h) for 0 s (a,e), 30 s (b,f), 60 s (c,g), and 90 s (d,h). Polyhedral α-Fe particles are highlighted in red.

Figure 12.
Al15(FeMnCr)3Si2 particles in the B319+Fe alloy after heat treatments using two extreme combinations of temperature and soak time: 575 °C-0 s (a) and 595 °C-90 s (b).
Figure 12.
Al15(FeMnCr)3Si2 particles in the B319+Fe alloy after heat treatments using two extreme combinations of temperature and soak time: 575 °C-0 s (a) and 595 °C-90 s (b).

Figure 13.
Distributions of B319+Fe alloy grain size (a,b), globule size (c,d) and circularity (e,f) measured after isothermal heat treatment (at 591 °C and 595 °C, respectively) for 0, 30, 60, and 90 s.
Figure 13.
Distributions of B319+Fe alloy grain size (a,b), globule size (c,d) and circularity (e,f) measured after isothermal heat treatment (at 591 °C and 595 °C, respectively) for 0, 30, 60, and 90 s.

Figure 14.
Engineering stress vs. engineering strain (a,b) and apparent viscosity vs. shear rate (c,d) curves measured during thixoforming (open-die forging) of B319+Fe alloy after heat treatment at 591 °C and 595 °C for 0, 30, 60, and 90 s. The maximum apparent viscosity, maximum stress, and unrestricted flow region are highlighted for a soak time of 60 s in all curves for illustrative purposes.


Table 1.
Chemical composition of the B319+Fe alloy studied here as measured by OES and the expected range (min-max) for a conventional B319 alloy in the literature [25].
Table 1.
Chemical composition of the B319+Fe alloy studied here as measured by OES and the expected range (min-max) for a conventional B319 alloy in the literature [25].
| Element | Content (wt.%) | ||
|---|---|---|---|
| Literature (min.) | Measured | Literature (max.) | |
| Si | 5.5 | 6.48 ± 0.140 | 6.5 |
| Cu | 3.0 | 3.53 ± 0.090 | 4.0 |
| Fe | 0.0 | 1.30 ± 0.021 | 1.2 |
| Mg | 0.1 | 0.21 ± 0.003 | 0.5 |
| Zn | 0.0 | 0.91 ± 0.016 | 1.0 |
| Mn | 0.0 | 0.35 ± 0.016 | 0.8 |
| Sn | - | 0.04 ± 0.017 | - |
| Ni | 0.0 | 0.03 ± 0.003 | 0.5 |
| Cr | - | 0.02 ± 0.001 | - |
| Res * | 0.0 | 0.12 ± 0.003 | 0.5 |
| Al (Bal.) | 84.8 | 87.0 ± 0.146 | 91.4 |
* The sum of residual elements.
Table 2.
MEV-EDS chemical composition of the points presented in Figure 3.
Table 2.
MEV-EDS chemical composition of the points presented in Figure 3.
| Phase | Point | Element (at.%) * | |||||||
|---|---|---|---|---|---|---|---|---|---|
| Mg | Al | Si | Cr | Mn | Fe | Cu | Zn | ||
| α-Al | A1 | - | 98.33 | 0.82 | - | - | - | 0.35 | 0.28 |
| A2 | - | 98.15 | 0.95 | - | - | - | 0.41 | 0.29 | |
| Eutectic (Al-Si) | B1 | - | 40.98 | 58.04 | - | - | - | 0.70 | 0.28 |
| B2 | - | 36.09 | 63.23 | - | - | - | 0.68 | - | |
| Polyhedrons α-Al15(MnFeCr)3Si2 | C1 | - | 71.63 | 9.72 | 0.72 | 5.57 | 11.66 | 0.70 | - |
| C2 | - | 71.37 | 9.47 | 0.74 | 5.65 | 11.81 | 0.73 | - | |
| θ-Al2Cu/ Al-Al2Cu-Si | D1 | 0.92 | 66.99 | 2.04 | - | - | - | 29.79 | - |
| D2 | 1.47 | 66.30 | 2.66 | - | - | 0.36 | 28.90 | - | |
| Chinese Script α-Al15(MnFeCr)3Si2 | E | - | 82.46 | 7.39 | 0.23 | 2.58 | 6.65 | 0.69 | - |
* Residual elements also present in some structures are Ni (max. 0.29 at.%), Ti (max. 0.22 at.%), and V (max. 0.24 at.%).
Table 3.
Key thixoforming parameters obtained by the DM for B319+Fe alloy at different heating rates. The values predicted by numerical simulation (Scheil conditions) are shown for reference.
Table 3.
Key thixoforming parameters obtained by the DM for B319+Fe alloy at different heating rates. The values predicted by numerical simulation (Scheil conditions) are shown for reference.
| Rate (°C/min) | Tsolidus (°C) | TKnee (°C) | TSSMI (°C) | TSSMF (°C) | Tliquidus (°C) | flKnee | flSSMI | flSSMF | dfl/dTmax (°C−1) |
|---|---|---|---|---|---|---|---|---|---|
| Scheil | 492.0 | 564.0 | 564.0 | 600.0 | 603.0 | 0.53 | 0.53 | 0.95 | 0.0023 |
| 5 | 507.8 | 571.0 | 581.0 | 613.0 | 626.0 | 0.51 | 0.55 | 0.92 | 0.0012 |
| 10 | 507.8 | 570.3 | 582.8 | 612.9 | 630.3 | 0.45 | 0.57 | 0.92 | 0.00085 |
| 15 | 505.9 | 570.9 | 583.3 | 610.9 | 633.4 | 0.43 | 0.57 | 0.89 | 0.00085 |
| 20 | 503.3 | 570.8 | 583.3 | 610.8 | 641.0 | 0.40 | 0.54 | 0.90 | 0.00083 |
| 25 | 501.0 | 571.0 | 586.0 | 611.0 | 643.5 | 0.40 | 0.57 | 0.90 | 0.00083 |
Table 4.
Liquid fraction of B319+Fe alloy samples heat-treated for 0–90 s at four temperatures and subsequently water quenched.
Table 4.
Liquid fraction of B319+Fe alloy samples heat-treated for 0–90 s at four temperatures and subsequently water quenched.
| Temperature (°C) | Liquid Fraction | |||||
|---|---|---|---|---|---|---|
| Scheil (0 s) 1 | DSC 2 (0 s) 1 | Micrograph Area Fraction 3 | ||||
| 0 s | 30 s | 60 s | 90 s | |||
| 575 | 0.61 | 0.46–0.50 | 0.40 | 0.41 | 0.42 | 0.35 |
| 582 | 0.68 | 0.53–0.56 | 0.43 | 0.35 | 0.40 | 0.41 |
| 591 | 0.78 | 0.63–0.64 | 0.42 | 0.40 | 0.43 | 0.35 |
| 595 | 0.85 | 0.67–0.68 | 0.44 | 0.42 | 0.38 | 0.37 |
1 Scheil and DSC curves represent continuous heating (0 s of hold time); 2 Liquid fraction for the heating rate range of 25 °C/min (lower fl) to 15 °C/min (higher fl); 3 Standard error for micrograph area fraction was max. ±0.01 for all measurements.
Table 5.
Microstructural parameters of B319+Fe alloy samples heat-treated for 60 s at four temperatures.
Table 5.
Microstructural parameters of B319+Fe alloy samples heat-treated for 60 s at four temperatures.
| Temperature (°C) | Microstructure | |||
|---|---|---|---|---|
| Gs (μm) | GLs (μm) | Gs/GLs | Circularity | |
| 575 | 153 ± 32 | 86 ± 15 | 1.8 ± 0.5 | 0.39 ± 0.18 |
| 582 | 146 ± 23 | 95 ± 17 | 1.5 ± 0.3 | 0.45 ± 0.19 |
| 591 | 186 ± 49 | 108 ± 23 | 1.7 ± 0.6 | 0.41 ± 0.20 |
| 595 | 183 ± 52 | 69 ± 10 | 2.7 ± 0.8 | 0.41 ± 0.19 |
Table 6.
Microstructural parameters of B319+Fe alloy after isothermal heat treatment in the semisolid state using different temperatures and soak times.
Table 6.
Microstructural parameters of B319+Fe alloy after isothermal heat treatment in the semisolid state using different temperatures and soak times.
| Condition | Gs (μm) | GLs (μm) | Gs/GLs | Circularity | Ps (μm) | fP | |
|---|---|---|---|---|---|---|---|
| 591 °C | 0 s | 285 ± 64 | 112 ± 36 | 2.6 ± 1.0 | 0.45 ± 0.009 | 21.5 ± 1.0 | 0.020 ± 0.008 |
| 30 s | 228 ± 44 | 115 ± 25 | 2.0 ± 0.6 | 0.45 ± 0.010 | 21.5 ± 0.9 | 0.027± 0.003 | |
| 60 s | 186 ± 49 | 109 ± 23 | 1.7 ± 0.6 | 0.44 ± 0.010 | 23.0 ± 1.1 | 0.025 ± 0.003 | |
| 90 s | 128 ± 26 | 75 ± 12 | 1.7 ± 0.4 | 0.51 ± 0.007 | 18.0 ± 0.5 | 0.029 ± 0.004 | |
| 595 °C | 0 s | 263 ± 68 | 89 ± 19 | 3.0 ± 1.0 | 0.41 ± 0.007 | 14.7 ± 0.6 | 0.023 ± 0.003 |
| 30 s | 186 ± 40 | 68 ± 12 | 2.7 ± 0.8 | 0.46 ± 0.007 | 18.2 ± 0.7 | 0.026 ± 0.003 | |
| 60 s | 183 ± 52 | 69 ± 10 | 2.7 ± 0.8 | 0.44 ± 0.007 | 17.1 ± 0.6 | 0.022 ± 0.003 | |
| 90 s | 192 ± 49 | 103 ± 23 | 1.9 ± 0.6 | 0.49 ± 0.010 | 19.1 ± 1.0 | 0.022 ± 0.003 | |
Table 7.
Rheological parameters at the point of maximum apparent viscosity (beginning of dendritic breakdown) and point of maximum stress (end of dendritic breakdown) and in the unrestricted flow region (representative point) for heat-treated samples of B319+Fe alloy during thixoforming.
Table 7.
Rheological parameters at the point of maximum apparent viscosity (beginning of dendritic breakdown) and point of maximum stress (end of dendritic breakdown) and in the unrestricted flow region (representative point) for heat-treated samples of B319+Fe alloy during thixoforming.
| Point | Condition | μ (105 Pa.s) | (s−1) | σ (MPa) | e | t (s) | |
|---|---|---|---|---|---|---|---|
| μmax | 591 °C | 0 s | 1.78 | 2.11 | 1.27 | 0.26 | 0.076 |
| 30 s | 1.73 | 2.25 | 1.36 | 0.28 | 0.085 | ||
| 60 s | 1.72 | 2.05 | 1.13 | 0.23 | 0.067 | ||
| 90 s | 1.59 | 2.08 | 1.05 | 0.22 | 0.064 | ||
| 595 °C | 0 s | 1.49 | 1.95 | 0.89 | 0.20 | 0.057 | |
| 30 s | 1.48 | 1.96 | 0.88 | 0.20 | 0.058 | ||
| 60 s | 1.55 | 2.06 | 1.02 | 0.24 | 0.068 | ||
| 90 s | 1.44 | 1.96 | 0.82 | 0.19 | 0.053 | ||
| σmax | 591 °C | 0 s | 0.87 | 4.07 | 1.93 | 0.46 | 0.15 |
| 30 s | 0.85 | 4.06 | 1.85 | 0.47 | 0.14 | ||
| 60 s | 0.84 | 4.07 | 1.90 | 0.47 | 0.15 | ||
| 90 s | 0.92 | 3.57 | 1.66 | 0.43 | 0.13 | ||
| 595 °C | 0 s | 0.74 | 3.72 | 1.40 | 0.43 | 0.14 | |
| 30 s | 0.81 | 3.58 | 1.49 | 0.44 | 0.14 | ||
| 60 s | 0.72 | 4.13 | 1.62 | 0.46 | 0.15 | ||
| 90 s | 0.89 | 3.19 | 1.21 | 0.36 | 0.10 | ||
| Unrestricted Flow (midpoint) | 591 °C | 0 s | 0.30 | 6.10 | 1.59 | 0.60 | 0.22 |
| 30 s | 0.32 | 6.38 | 1.87 | 0.62 | 0.23 | ||
| 60 s | 0.35 | 6.04 | 1.66 | 0.57 | 0.20 | ||
| 90 s | 0.32 | 5.78 | 1.39 | 0.56 | 0.19 | ||
| 595 °C | 0 s | 0.19 | 6.21 | 1.02 | 0.60 | 0.21 | |
| 30 s | 0.24 | 6.07 | 1.19 | 0.57 | 0.20 | ||
| 60 s | 0.26 | 6.00 | 1.30 | 0.60 | 0.23 | ||
| 90 s | 0.18 | 6.33 | 0.86 | 0.56 | 0.19 | ||
© 2018 by the authors. Licensee MDPI, Basel, Switzerland. This article is an open access article distributed under the terms and conditions of the Creative Commons Attribution (CC BY) license (http://creativecommons.org/licenses/by/4.0/).
Share and Cite
MDPI and ACS Style
Brollo, G.L.; Proni, C.T.W.; Zoqui, E.J. Thixoforming of an Fe-Rich Al-Si-Cu Alloy—Thermodynamic Characterization, Microstructural Evolution, and Rheological Behavior. Metals 2018, 8, 332. https://doi.org/10.3390/met8050332
AMA Style
Brollo GL, Proni CTW, Zoqui EJ. Thixoforming of an Fe-Rich Al-Si-Cu Alloy—Thermodynamic Characterization, Microstructural Evolution, and Rheological Behavior. Metals. 2018; 8(5):332. https://doi.org/10.3390/met8050332
Chicago/Turabian StyleBrollo, Gabriela Lujan, Cecília Tereza Weishaupt Proni, and Eugênio José Zoqui. 2018. "Thixoforming of an Fe-Rich Al-Si-Cu Alloy—Thermodynamic Characterization, Microstructural Evolution, and Rheological Behavior" Metals 8, no. 5: 332. https://doi.org/10.3390/met8050332
Note that from the first issue of 2016, this journal uses article numbers instead of page numbers. See further details here.