
How Can Synchrotron Radiation Techniques Be Applied for Detecting Microstructures in Amorphous Alloys?

Abstract
:
1. Introduction
2. Experimental Section
3. Results and Discussion


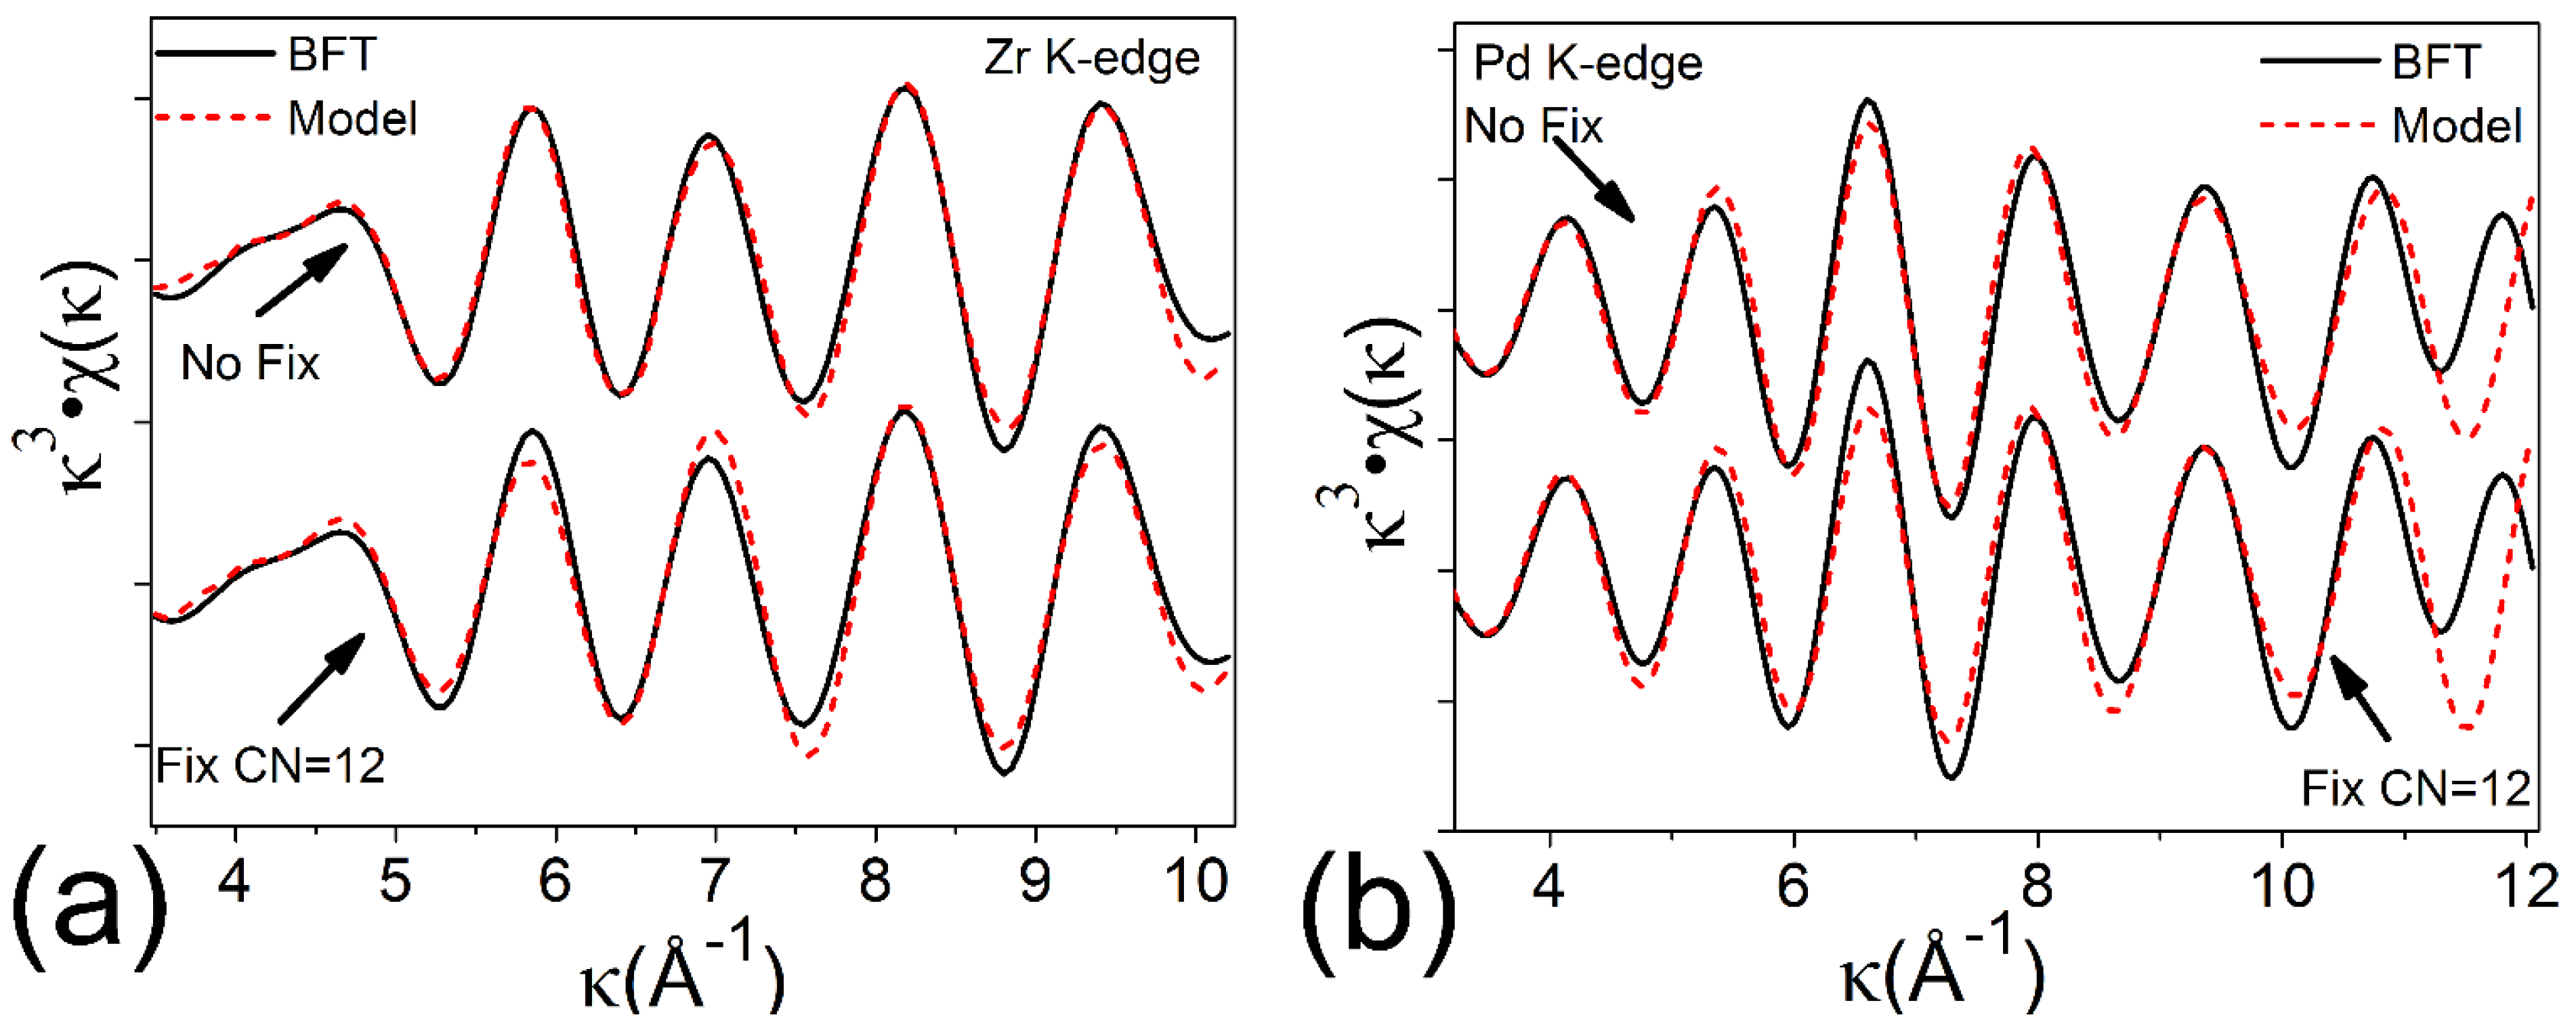
| Absorption Edge | Fitting Condition | R (Å) ± 0.02 | CN ± 0.1 | σ2 (Å) ± 0.001 | E0 Shift (eV) ± 0.01 | ||||
|---|---|---|---|---|---|---|---|---|---|
| ZrZr | ZrPd | ZrZr | ZrPd | ZrZr | ZrPd | ZrZr | ZrPd | ||
| Zr K-edge | CN unfixed | 3.10 | 3.00 | 6.0 | 2.9 | 0.038 | 0.014 | 1.20 | −11.80 |
| CN fixed | 3.10 | 3.01 | 8.8 | 3.2 | 0.045 | 0.015 | 24.01 | −23.34 | |
| - | - | PdPd | PdZr | PdPd | PdZr | PdPd | PdZr | PdPd | PdZr |
| Pd K-edge | CN unfixed | 2.74 | 2.95 | 2.8 | 17.1 | 0.013 | 0.068 | −9.72 | −4.62 |
| CN fixed | 2.71 | 2.90 | 2.7 | 9.3 | 0.015 | 0.078 | −21.72 | −22.58 | |

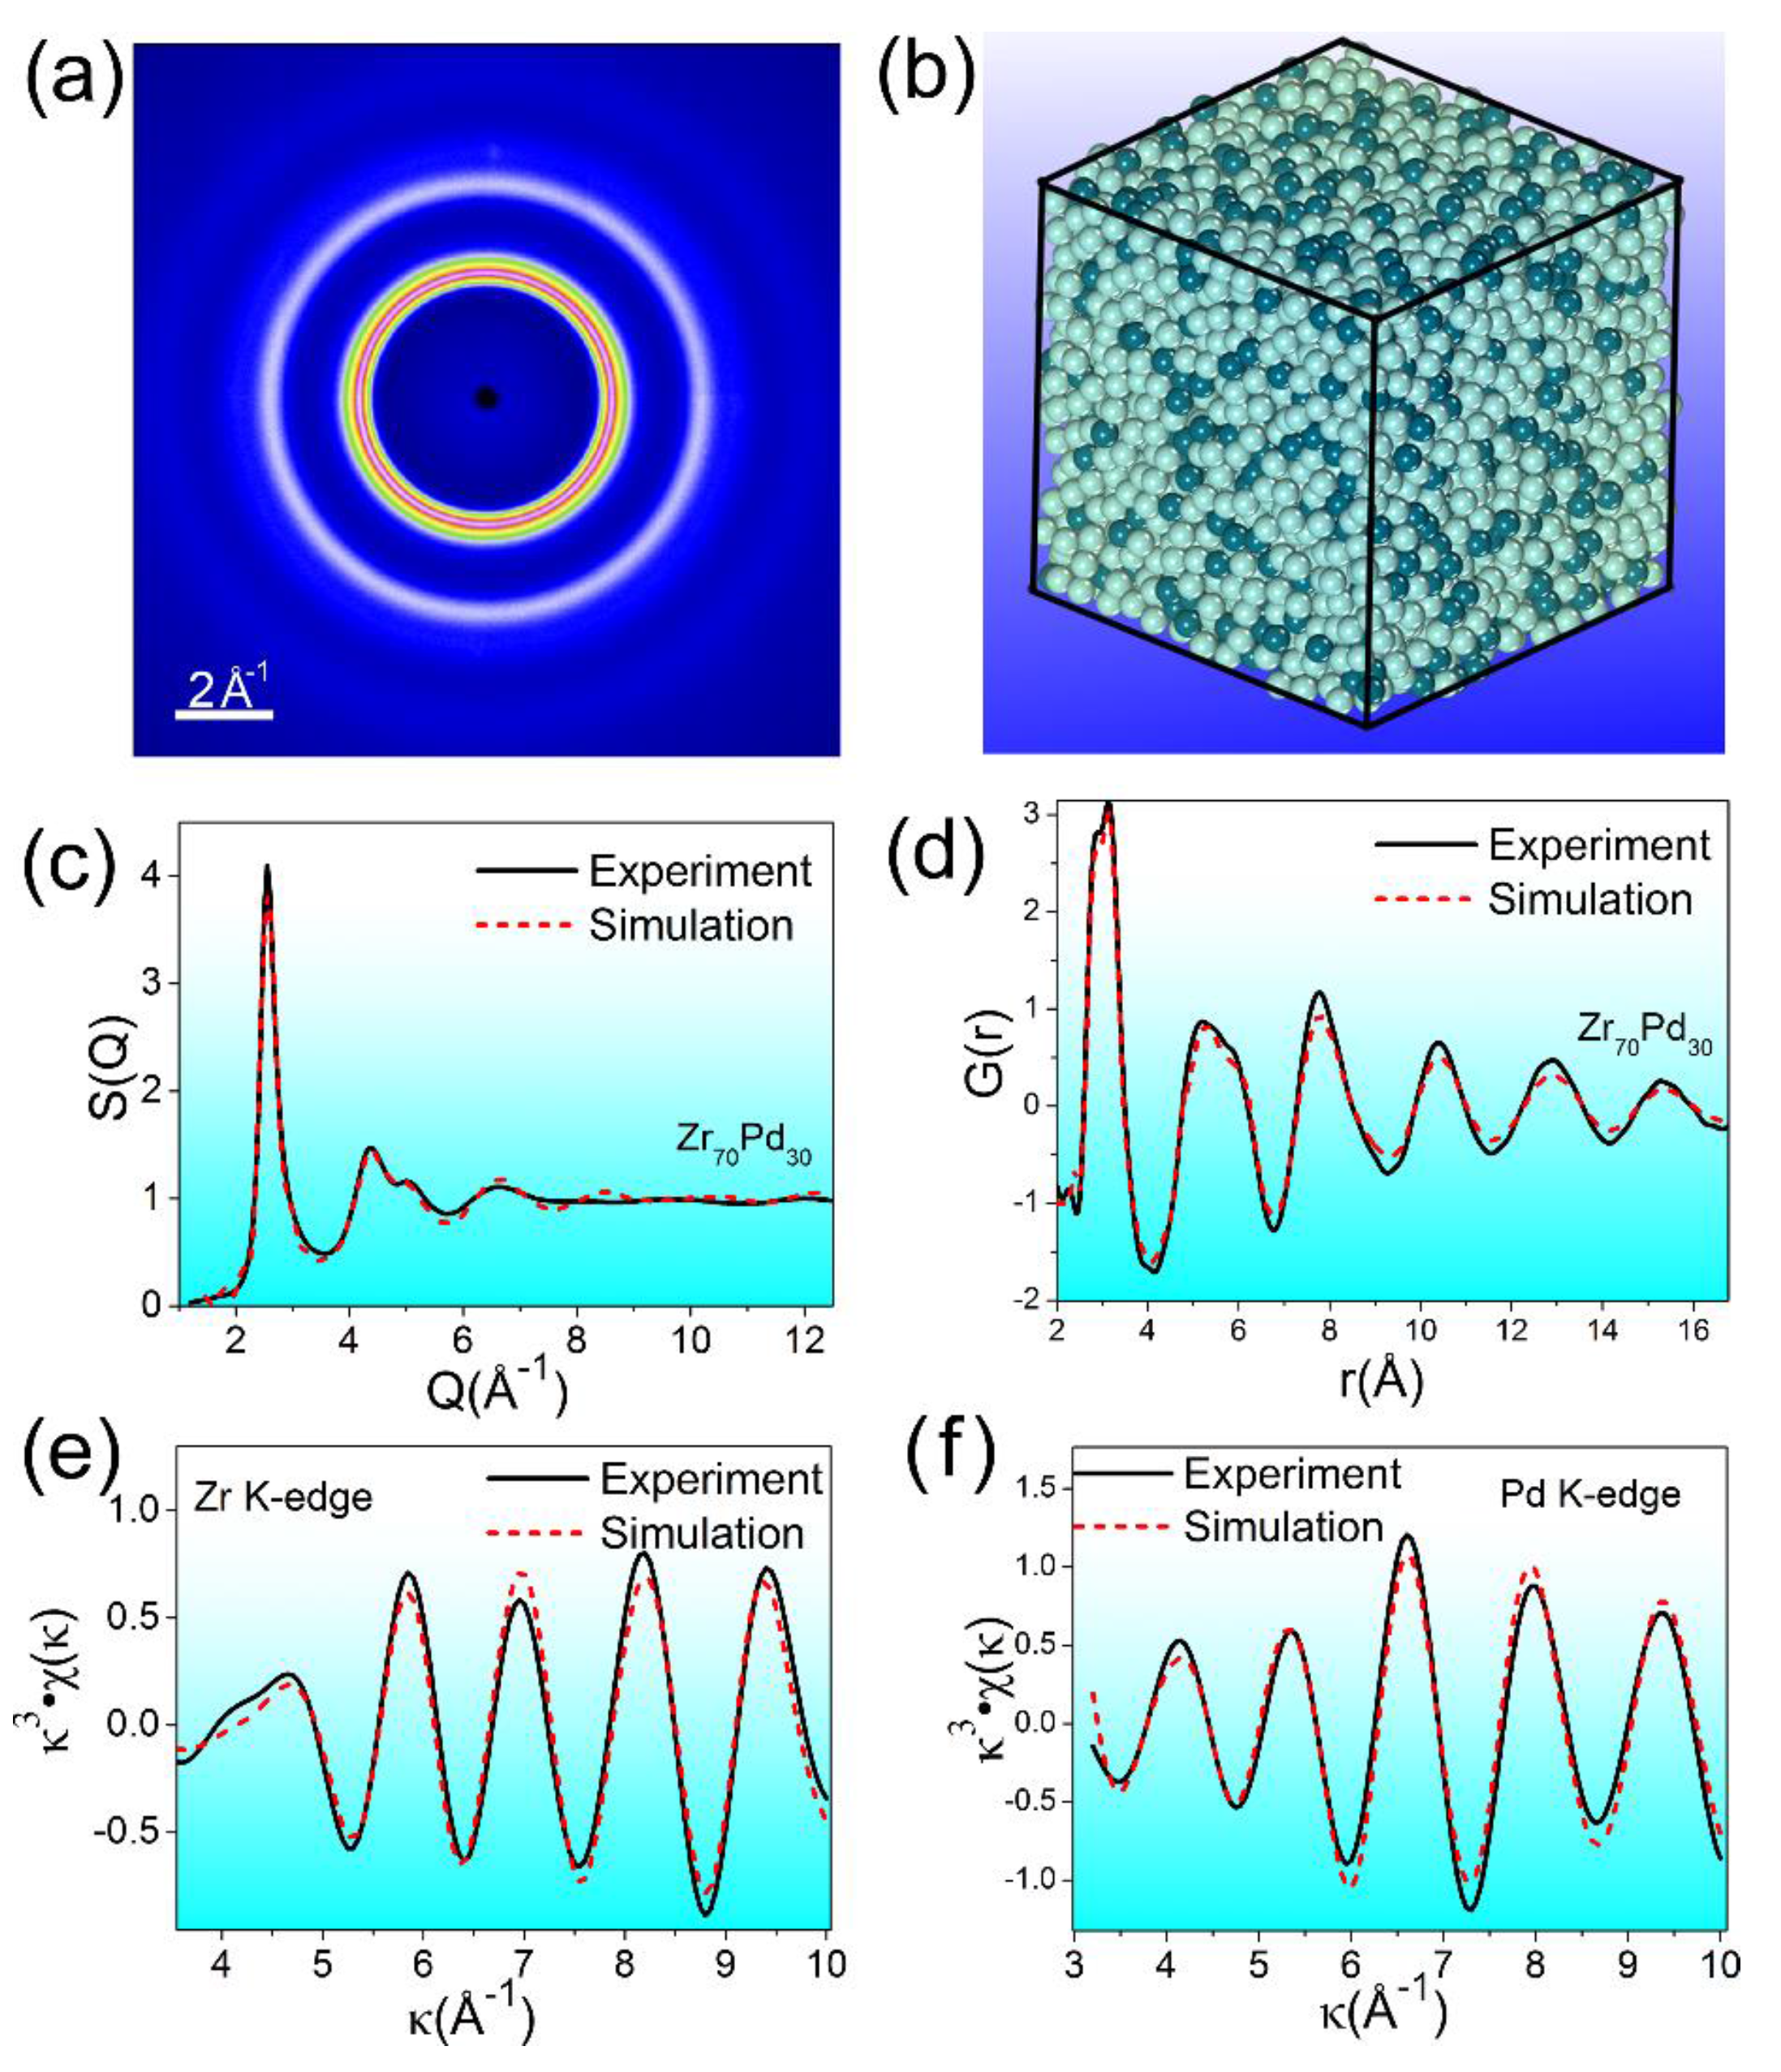
| Atomic Pairs | Atomic-Pair Distances (Å) ± 0.02 | ||
|---|---|---|---|
| Zr70Pd30 MG | SGAR | Crystalline Alloy | |
| Zr–Zr | 3.20 | 3.20 | 3.23 |
| Zr–Pd | 2.90 | 2.97 | 3.06 |
| Pd–Pd | 2.76 | 2.74 | 3.31 |
| Pd–Zr | 2.90 | 2.97 | 3.06 |


4. Conclusions
Acknowledgments
Author Contributions
Conflicts of Interest
References
- Cohen, M.H.; Turnbull, D. Metastability of amorphous structures. Nature 1964, 203, 964. [Google Scholar] [CrossRef]
- Finney, J.L. Modeling the structures of amorphous metals and alloys. Nature 1977, 266, 309–314. [Google Scholar] [CrossRef]
- Doye, J.P.K.; Wales, D.J. The structure and stability of atomic liquids: From clusters to bulk. Science 1996, 271, 484–487. [Google Scholar] [CrossRef]
- Tan, H.; Zhang, Y.; Ma, D.; Feng, Y.P.; Li, Y. Optimum glass formation at off-eutectic composition and its relation to skewed eutectic coupled zone in the La based La-Al-(Cu,Ni) pseudo ternary system. Acta Mater. 2003, 51, 4551–4561. [Google Scholar] [CrossRef]
- Sheng, H.W.; Luo, W.K.; Alamgir, F.M.; Bai, J.M.; Ma, E. Atomic packing and short-to-medium-range order in metallic glasses. Nature 2006, 439, 419–425. [Google Scholar] [CrossRef] [PubMed]
- Hirata, A.; Guan, P.F.; Fujita, T.; Hirotsu, Y.; Inoue, A.; Yavari, A.R.; Sakurai, T.; Chen, M.W. Direct observation of local atomic order in a metallic glass. Nat. Mater. 2011, 10, 28–33. [Google Scholar] [CrossRef] [PubMed]
- Wu, Z.W.; Li, M.Z.; Wang, W.H.; Liu, K.X. Hidden topological order and its correlation with glass-forming ability in metallic glasses. Nat. Commun. 2015. [Google Scholar] [CrossRef] [PubMed]
- Bernal, J.D. Geometrical approach to the structure of liquids. Nature 1959, 183, 141–147. [Google Scholar]
- Gaskell, P.H. A new structural model for transition metal-metalloid glasses. Nature 1978, 276, 484–485. [Google Scholar] [CrossRef]
- Miracle, D.B. A structural model for metallic glasses. Nat. Mater. 2004, 3, 697–702. [Google Scholar] [CrossRef] [PubMed]
- Pfeiffer, F.; Weitkamp, T.; Bunk, O.; David, C. Phase retrieval and differential phase-contrast imaging with low-brilliance X-ray sources. Nat. Phys. 2006, 2, 258–261. [Google Scholar] [CrossRef]
- Lefebvre, S.; Quivy, A.; Bigot, J.; Calvayrac, Y.; Bellissent, R. A neutron diffraction determination of short-range order in a Ni63.7Zr36.3 glass. J. Phys. F 1985, 15, L99–L103. [Google Scholar] [CrossRef]
- Luo, W.K.; Sheng, H.W.; Alamgir, F.M.; Bai, J.M.; He, J.H.; Ma, E. Icosahedral Short-Range Order in Amorphous Alloys. Phys. Rev. Lett. 2004. [Google Scholar] [CrossRef]
- Yang, L.; Xia, J.H.; Wang, Q.; Dong, C.; Chen, L.Y.; Ou, X.; Liu, J.F.; Jiang, J.Z.; Klementiev, K.; Saksl, K.; et al. Design of Cu8Zr5-based bulk metallic glasses. Appl. Phys. Lett. 2006. [Google Scholar] [CrossRef]
- Sadoc, J.F.; Dixmier, J. Structural investigation of amorphous CoP and NiP alloys by combined X-ray and neutron scattering. Mater. Sci. Eng. 1978, 23, 187–192. [Google Scholar] [CrossRef]
- Saksl, K.; Franz, H.; Jovari, P.; Klementiev, K.; Welter, E.; Ehnes, A.; Saida, J.; Inoue, A.; Jiang, J.Z. Evidence of icosahedral short-range order in Zr70Cu30 and Zr70Cu29Pd1 metallic glasses. Appl. Phys. Lett. 2003, 8333, 3924–3926. [Google Scholar] [CrossRef]
- Yang, L.; Guo, G.Q. Structural origin of the high glass-forming ability in Gd doped bulk metallic glasses. Appl. Phys. Lett. 2010. [Google Scholar] [CrossRef]
- Yang, L.; Guo, G.Q.; Chen, L.Y.; Wei, S.H.; Jiang, J.Z.; Wang, X.D. Atomic structure in Al-doped multicomponent bulk metallic glass. Scr. Mater. 2010, 63, 879–882. [Google Scholar] [CrossRef]
- Saida, J.; Kasai, M.; Matsubara, E.; Inoue, A. Stability of glassy state in Zr-based glassy alloys correlated with nano icosahedral phase formation. Ann. Chim. Sci. Mater. 2002, 27, 77–89. [Google Scholar] [CrossRef]
- Saida, J.; Matsushita, M.; Inoue, A. Direct observation of icosahedral cluster in Zr70Pd30 binary glassy alloy. Appl. Phys. Lett. 2002, 79, 412–414. [Google Scholar] [CrossRef]
- Xu, D.H.; Duan, G.; Johnson, W.L. Unusual glass-forming ability of bulk amorphous alloys based on ordinary metal copper. Phys. Rev. Lett. 2004. [Google Scholar] [CrossRef]
- Takagi, T.; Ohkubo, T.; Hirotsu, Y.; Murty, B.S.; Hono, K.; Shindo, D. Local structure of amorphous Zr70Pd30 alloy studied by electron diffraction. Appl. Phys. Lett. 2001, 79, 485–487. [Google Scholar] [CrossRef]
- Liss, K.D.; Bartels, A.; Schreyer, A.; Clemens, H. High energy X-rays: A tool for advanced bulk investigations in materials science and physics. Textures Microstruct. 2003, 35, 219–252. [Google Scholar] [CrossRef]
- Hammersley, A.P.; Svensson, S.O.; Hanfland, M.; Fitch, A.N.; Häusermann, D. Two-dimensional detector software: From real detector to idealised image or two-theta scan. High Press. Res. 1996, 14, 235–248. [Google Scholar] [CrossRef]
- Faber, T.E.; Ziman, J.M. A theory of the electrical properties of liquid metals. Philos. Mag. 1965, 11, 153–173. [Google Scholar] [CrossRef]
- Klementev, K.V. Extraction of the fine structure from X-ray absorption spectra. J. Phys. D 2001, 34, 209–217. [Google Scholar] [CrossRef]
- Yang, L.; Guo, G.Q.; Chen, L.Y.; Huang, C.L.; Ge, T.; Chen, D.; Liaw, P.K.; Saksl, K.; Ren, Y.; Zeng, Q.S.; et al. Atomic-Scale Mechanisms of the Glass-Forming Ability in Metallic Glasses. Phys. Rev. Lett. 2012. [Google Scholar] [CrossRef]
- McGreevy, R.L.; Pusztai, L. Reverse Monte Carlo Simulation: A new technique for the determination of disordered structures. Mol. Simul. 1988, 1, 359–367. [Google Scholar] [CrossRef]
- Yang, L.; Guo, G.Q.; Jiang, J.Z.; Chen, L.Y.; Wei, S.H. “Soft” atoms in Zr70Pd30 metal-metal amorphous alloy. Scr. Mater. 2010, 63, 883–886. [Google Scholar] [CrossRef]
- Takahara, Y.; Narita, N. Local electronic structures and chemical bonds in Zr-based metallic glasses. Mater. Trans. 2004, 45, 1172–1176. [Google Scholar] [CrossRef]
- Huang, L.; Wang, C.Z.; Hao, S.G.; Kramer, M.J.; Ho, K.M. Atomic size and chemical effects on the local order of Zr2M (M = Co, Ni, Cu, and Ag) binary liquids. Phys. Rev. B 2010. [Google Scholar] [CrossRef]
- Wang, S.Y.; Kramer, M.J.; Xu, M.; Wu, S.; Hao, S.G.; Sordelet, D.J.; Ho, K.M.; Wang, C.Z. Experimental and ab initio molecular dynamics simulation studies of liquid Al60Cu40 alloy. Phys. Rev. B 2009. [Google Scholar] [CrossRef]
- Miracle, D.B.; Sanders, W.S.; Senkov, O.N. The influence of efficient atomic packing on the constitution of metallic glasses. Philos. Mag. 2003, 83, 2409–2428. [Google Scholar] [CrossRef]
© 2015 by the authors; licensee MDPI, Basel, Switzerland. This article is an open access article distributed under the terms and conditions of the Creative Commons Attribution license (http://creativecommons.org/licenses/by/4.0/).
Share and Cite
Guo, G.-Q.; Wu, S.-Y.; Luo, S.; Yang, L. How Can Synchrotron Radiation Techniques Be Applied for Detecting Microstructures in Amorphous Alloys? Metals 2015, 5, 2048-2057. https://doi.org/10.3390/met5042048
Guo G-Q, Wu S-Y, Luo S, Yang L. How Can Synchrotron Radiation Techniques Be Applied for Detecting Microstructures in Amorphous Alloys? Metals. 2015; 5(4):2048-2057. https://doi.org/10.3390/met5042048
Chicago/Turabian StyleGuo, Gu-Qing, Shi-Yang Wu, Sheng Luo, and Liang Yang. 2015. "How Can Synchrotron Radiation Techniques Be Applied for Detecting Microstructures in Amorphous Alloys?" Metals 5, no. 4: 2048-2057. https://doi.org/10.3390/met5042048