Article

Constitutive Relationship Modeling and Characterization of Flow Behavior under Hot Working for Fe–Cr–Ni–W–Cu–Co Super-Austenitic Stainless Steel

1
Department of Materials Science and Engineering, National Cheng Kung University, Tainan 701, Taiwan
2
New Materials Research and Development Department, China Steel Corporation, Kaohsiung 812, Taiwan
3
Department of Chemical and Materials Engineering, National University of Kaohsiung, Kaohsiung 811, Taiwan
*
Author to whom correspondence should be addressed.
Metals 2015, 5(3), 1717-1731; https://doi.org/10.3390/met5031717
Submission received: 4 August 2015 / Revised: 9 September 2015 / Accepted: 15 September 2015 / Published: 18 September 2015

Abstract

:
The hot deformation behavior of a Fe–22Cr–25Ni–3.5W–3Cu–1.5Co super-austenitic stainless steel was investigated using isothermal compression tests with a wide range of temperatures (1173–1373 K) and strain rates (0.1–10 s−1). The results showed that all the flow curves gradually turned to balanced stress state without notable peak stress characteristics during the entire deformation, which indicated that the dynamic recovery behavior played a main restoration mechanism in the steel. Modeling constitutive equations relating to the temperature, strain rate and flow stress were proposed to determine the materials constants and activation energy necessary for deformation. In order to give the precise predicted values of the flow behavior, the influence of strain was identified using polynomial functions. The relationship of flow stress, temperature and strain rate was represented by the Zener-Hollomon parameter including the Arrhenius term. The predicted results validated that the developed constitutive equations can describe high temperature flow behavior well. Furthermore, a modified Zener-Hollomon parameter map of the studied steel was developed to clarify the restoration mechanism based on the constitutive modeling data and microstructural observation.

1. Introduction

Super-austenitic stainless steels (SASSs) have unique high temperature strength, good weldability and superior corrosion resistance in comparison with general austenitic stainless steel grades, and such excellent properties mainly rely on the features of their chemical compositions. Current commercial SASSs are usually constituted of high alloyed addition of chromium (Cr), nickel (Ni), molybdenum (Mo) and other alloying elements in austenite [1,2,3,4,5]. Additions of these elements impart a remarkable improvement in oxidation resistance, microstructural stability and high temperature strength at elevated temperatures. Therefore, SASSs have been widely used as important structural materials for application in engineering fields such as chemical, petrochemical, oceanic, nuclear industries and so on in recent decades [1,2,3,4,6,7], it can be said that SASS applications successfully provide a bridge between cheap austenitic stainless steels and relatively expensive special superalloys [8].
For the purpose of facilitating the development of SASSs, understanding of the hot deformation mechanism is a very important issue because of its outstanding high temperature strength. The dynamic restoration processes during plastic deformation at high temperature are quite complex and strongly influenced by initial microstructure, deformation conditions and chemical composition. Compared to conventional austenitic stainless steels, SASSs have higher stacking fault energy (SFE), and the dynamic restoration is driven mainly by the dynamic recovery (DRV) process owing to its higher content of alloying elements, which leads to poorer hot plasticity and workability [9,10]. As observed in past studies, a significant positive correlation of Cr, Ni and Mo elements has been found with the SFE in austenitic grades of stainless steels (e.g., 34 mJ·m−2 of AISI 305, 78 mJ·m−2 of AISI 316, 94 mJ·m−2 of AISI 310S and 164 mJ·m−2 of AISI 904L) [9,11]. Along with the increase in the SFE, steels are very susceptible to hot cracking during hot deformation, especially edge cracking due to the sluggishness of the dynamic recrystallization process (DRX) [7,12].
In earlier studies on the hot deformation behavior of some SASSs, the DRV and DRX behaviors, microstructural evolution and the constitutive relationship between stress, strain and deformation conditions have been investigated. For instance, Ebrahimi et al. [13] showed that the DRX behavior for the composition of a Fe–16Cr–25Ni–6Mo SASS was obviously retarded by segregation of substitutionals at the grain boundary. In the research results of Pu et al. [14] and Momeni et al. [15], the competition behavior between dynamic precipitation (including the intermetallic sigma phase and complex carbides) and the DRX process was verified for SASSs composed of Fe–24Cr–22Ni–7Mo and Fe–28Cr–33Ni–3.5Mo, respectively. Moreover, the activation energy for deformation in SASSs was also quite high in the range of 469–656 kJ·mol−1, this would lead to a significant delay in the dynamic restoration process at elevated temperatures [13,14,16]. These studies indicated distinctly that the diversification of hot deformation behavior is strongly influenced by the complex chemical compositions of high alloyed systems. However, the basic understanding of an alloy system different from Mo-containing Fe–Cr–Ni SASSs, especially in regard to the high temperature property, was still lacking and has received little attention up to the present time [17,18]. For industrial hot deformation processing, optimal working parameters (such as deformation temperature, strain rate and strain) are the key factors for successful development of new steels. Therefore, the investigation of flow behavior is an essential approach for determining the process parameters and suitable hot working techniques for actual production procedures. Over the past few years, a large number of predictive models have been proposed to describe the dynamic deformation behavior of metals. They are usually classified into two groups: physical models and phenomenological models [19,20,21,22,23]. Compared with phenomenological models, physical models are associated with basic physical variables, grain size and dislocation density, which can precisely predict the microstructural evolution with deformation mechanisms of strain hardening, recovery, recrystallization and grain boundary mobility. However, a greater number of mechanisms described by physical models means more complicated physical quantities have to identify though large amounts of experimental results.
In order to immediately describe the correlation between the flow behavior of steel and various forming process parameters, the phenomenological constitutive model involving the Arrhenius term first proposed by Jonas et al. [23] has been widely adopted in practice because of its simplicity and reliability for engineering applications. This model also has been successfully applied in various metallic materials (e.g., SASSs [16,18], Ni–Ti shape memory alloys [24], and in Al–Zn–Mg–Cu alloys [25]), and a good correlation between the predicted and experimental flow behavior was found in the data. Therefore, the main objective of the present paper is to characterize the influence of strain, strain rate and deformation temperature on the compressive flow behavior for a new ternary alloy Fe–Cr–Ni SASS system combined with elements of tungsten (W), cobalt (Co) and copper (Cu). After analyzing the characteristics of the high temperature deformation behavior, the experimental stress-strain data gathered from the compression tests were used to establish an appropriate mathematical model. The proper strain compensation was incorporated for the purpose of describing the relationships among the flow stress, strain rate and temperature by the hyperbolic sine-type law in the form of an Arrhenius-type equation. In addition, a Zener-Hollomon parameter map was generated to evaluate the dynamic mechanism of the studied steel in accordance with microstructural characteristics.

2. Experimental Material and Methods

The material used in this investigation is a Fe–22Cr–25Ni–3.5W–3Cu–1.5Co super-austenitic stainless steel whose chemical composition is as follows (wt. %): 0.07C, 0.19Si, 0.49Mn, 0.23N, 22.2Cr, 24.4Ni, 3.39W, 2.9Cu, 1.47Co and Fe (balance). The thermo-mechanical simulation compression specimens were machined from a 20-mm-thickness, rolled, annealed steel plate. They were cylindrical specimens with 8 mm in diameter and 12 mm in height (Φ 8 × 12 mm). In order to ensure uniform deformation of steel, graphite and tantalum foils combined with nickel lubricant were used to reduce the friction, heat dissipation and mutual welding between the specimen and the anvil. A thermo-mechanical simulation compression test was carried out on a computer-controlled Gleeble-3800 thermal-mechanical simulator (Dynamic Systems Inc., Poestenkill, NY, USA) at three different temperatures (1173 K, 1273 K and 1373 K), and at three different strain rates (0.1 s−1, 1 s−1 and 10 s−1). Before the compression, the specimens were heated to 1473 K with a heating rate of 10 K·s−1 and held for 3 min to archive homogenization of both composition and microstructure. Subsequently, the specimens were cooled to individual deformation temperatures with a cooling rate of 5 K·s−1 and held for 0.5 min to eliminate the temperature gradient. A spot-welded R-type thermocouple at the longitudinal central part of the specimen surface was used to measure the variation in temperature. When the specimens were compressed to a true strain of 0.8, they were immediately quenched to preserve the microstructure so as not to induce the static recrystallization (SRX) and/or post dynamic recrystallization (PDRX) after hot deformation [26]. In order to analyze the dynamic mechanism under different deformation conditions, the deformed specimens were sectioned parallel to the compression axis at the center. After standard metallographic procedures (mechanical grounding and polishing), the cut surfaces were then etched with aqua regia in pure water to reveal the microstructure characterization.

3. Results and Discussion
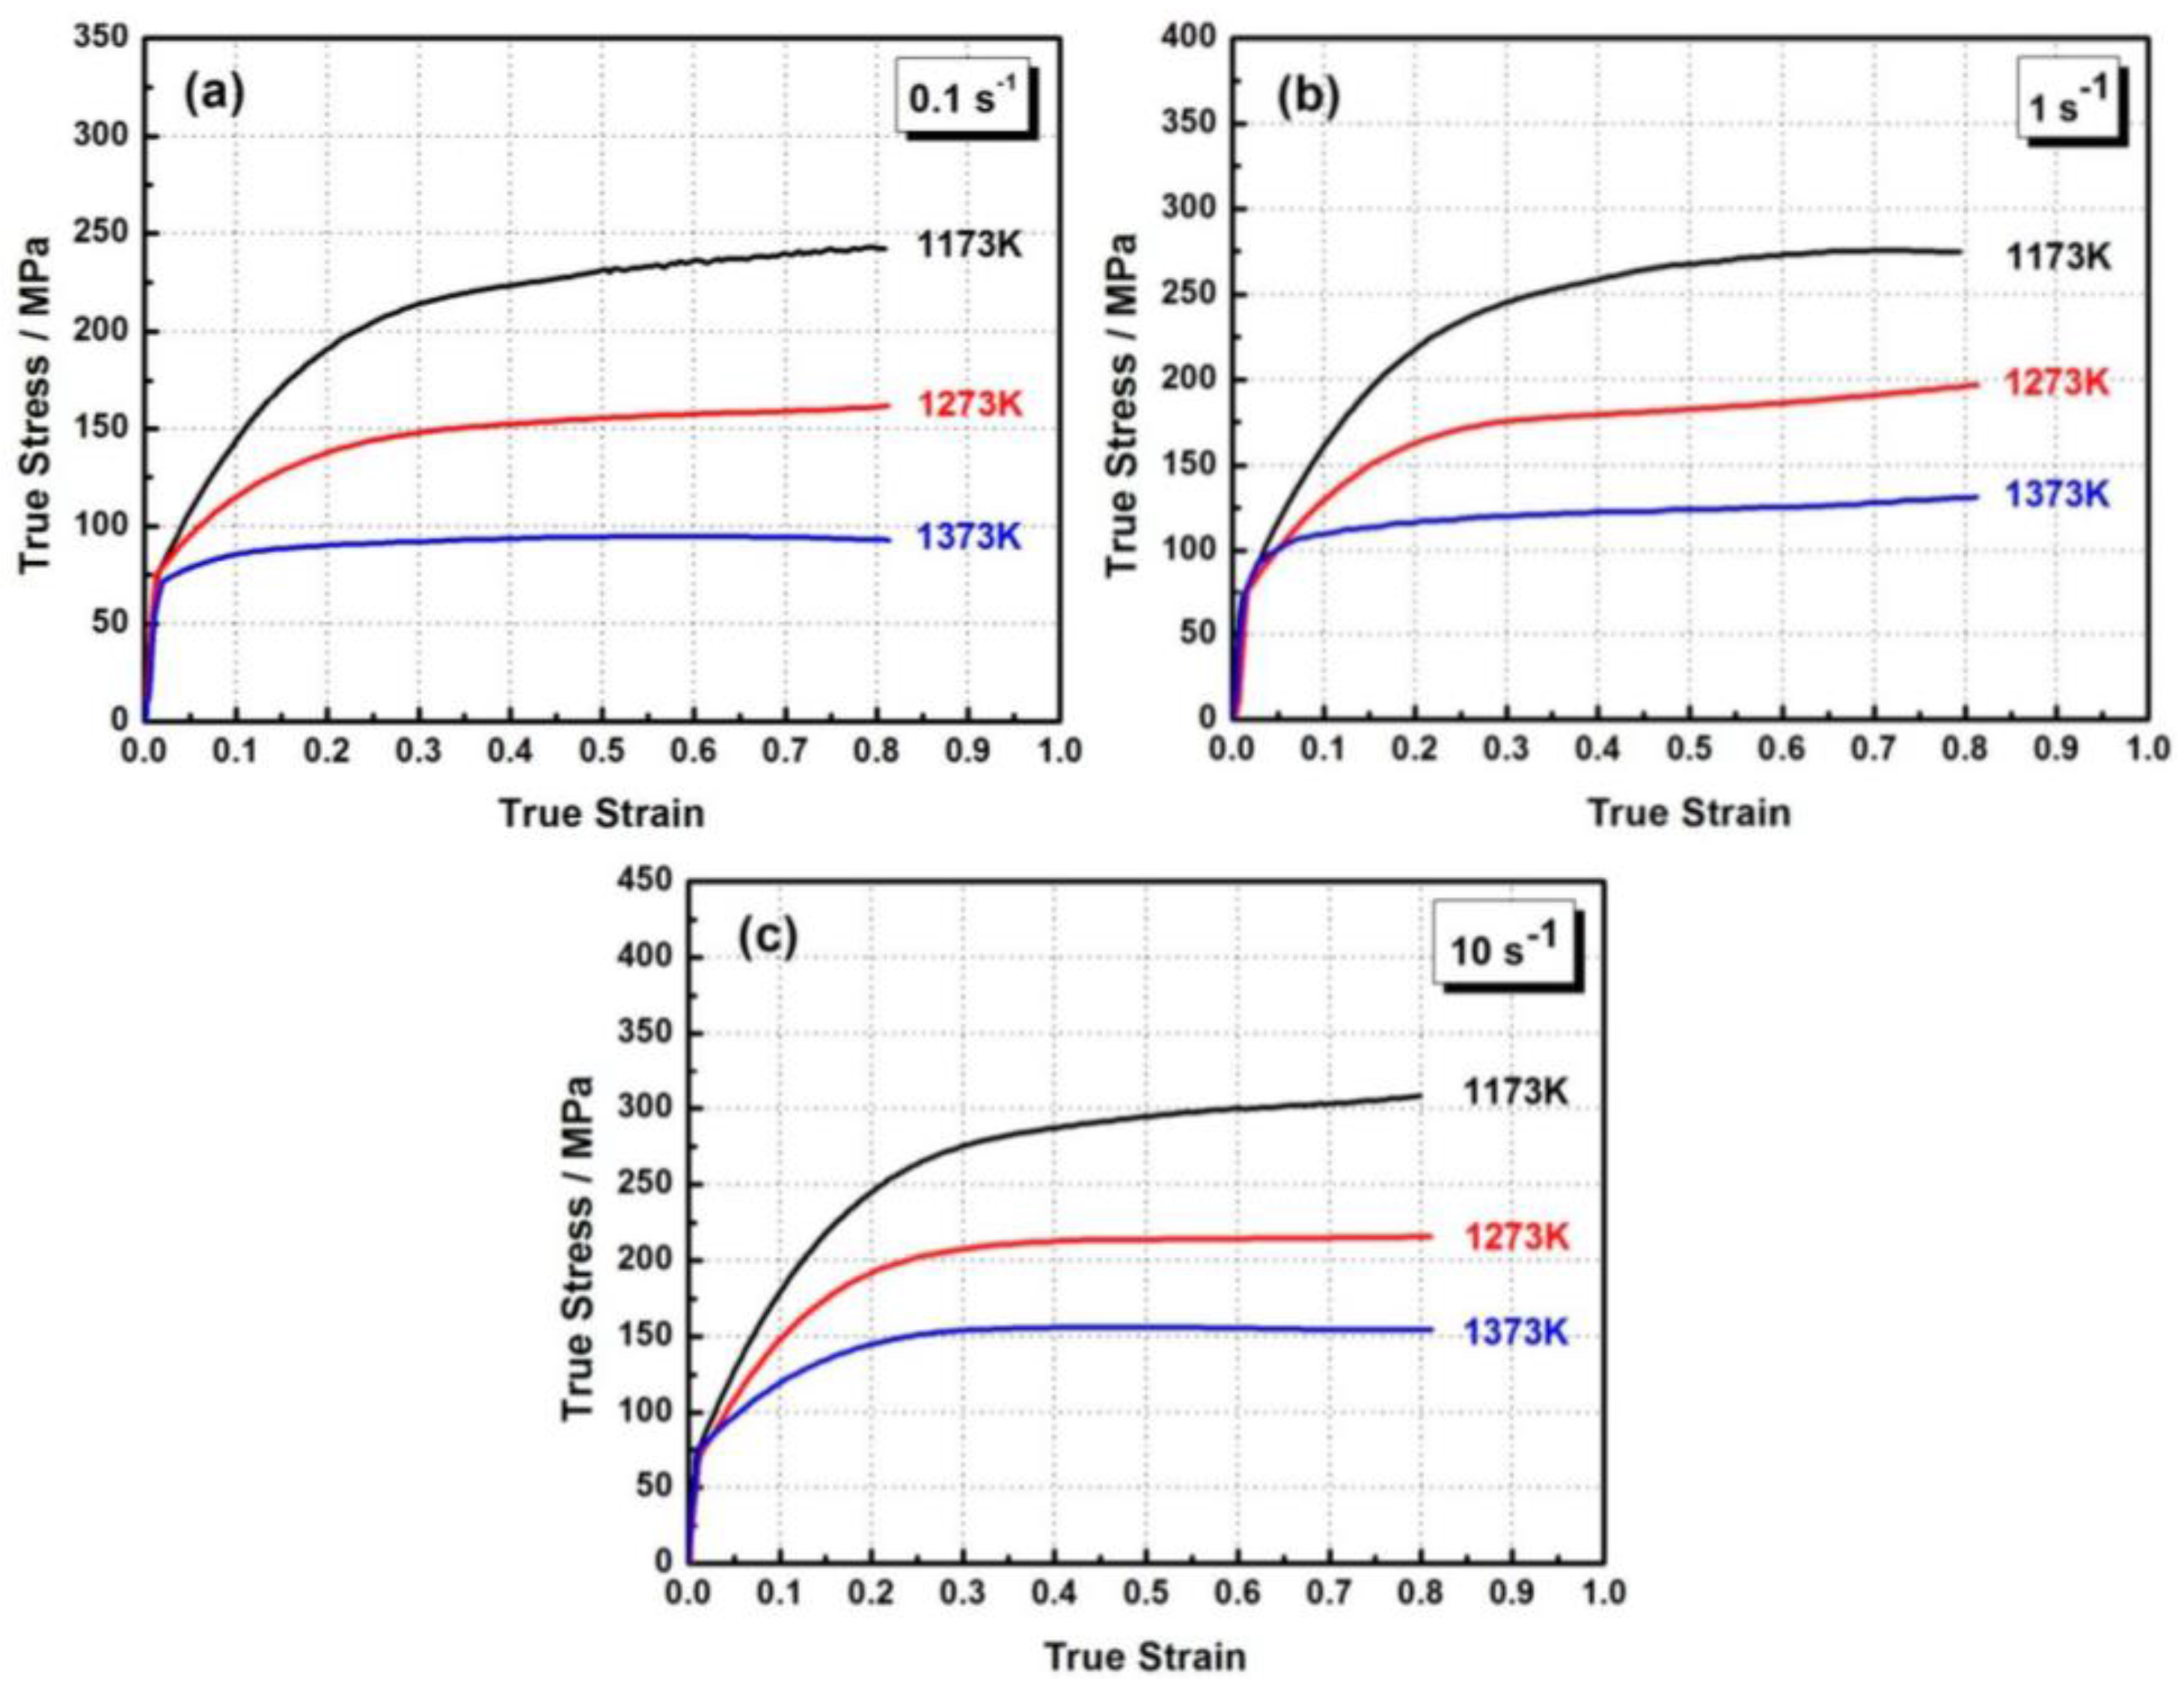
3.1. Flow Behavior

Figure 1 shows the true stress-strain curves at various temperatures and strain rates. It can be observed that the flow stress is heavily dependent on the testing temperatures, strain rates and strains. Obviously, the flow stress level rises with decreasing temperature at the same strain rate and increases with increasing strain rate at the same temperature. It can be seen that almost all of the flow curves in this figure exhibit similar characteristics, i.e., the flow stress increases rapidly through a predominance of work hardening (WH), and when the strain reaches certain value, all of the curves return to a balanced stress state gradually without notable peak flow stresses and flow softening.
As can be seen, the WH plays a significant role in the initial compressed stage, and the dislocation structure becomes entangled and impedes the dislocations movement, thereby increasing flow stress, which is more pronounced at higher strain rates and lower temperatures [27]. Subsequently, the flow stress increment becomes smaller and smaller, which is justified, considering that the thermally activated nature of the dynamic restoration process (i.e., DRV and DRX) becomes more and more predominant and then starts to offset or partially offset the effect of WH [28]. However, most of the flow curves still exhibit gradual increases in stress at large strains even though the restoration process has already taken place. Comparing these curves with one another in detail, two types of curve variation tendencies can be generalized as follows: the flow curve presents a slight increase in stress with the increasing of the strain, which is a result of the unfinished dynamic balance of the WH and restoration processes due to multiplication of dislocation is still in progress (i.e., 1173 K and 0.1/10 s−1, 1273 K and 0.1–1 s−1, 1373 K and 1 s−1), and another one is giving expression to a steady stress state as a new dynamic equilibrium between hardening and softening (i.e., 1173 K and 1 s−1, 1273 K and 10 s−1, 1373 K and 0.1/10 s−1). It is worth mentioning that the pseudo steady-state flow also caused subsequent gradual strain hardening as a result of a continuous dynamic recrystallization (CDRX) effect [29]. But in the present results of flow curves, it indicates that the DRV behavior should be the main restoration mechanism of the studied steel because the CDRX usually takes place in severe plastic deformation conditions above a true strain of 3 [26].
Figure 1. Representative true stress-strain curves of the studied steel under different deformation temperatures with strain rates (a) 0.1 s−1; (b) 1 s−1; and (c) 10 s−1.
Metals 05 01717 g001
Thus, it can be concluded that the DRX process for the studied steel under the presented deformation conditions is very slow and insufficient. The reason for this phenomenon may be the fact that the high alloying in austenite enhances the SFE, which in turn promotes softening through a DRV process [9,10,30]. Moreover, the dislocations become more mobile and are able to climb and cross-slip during steel deformation at elevated temperatures, then the annihilation and reorganization of the dislocations are more easily activated. Hence, the critical dislocation density for the DRX is hard to archive due to fact that the dislocations are difficult to entangle and accumulate at large strains. On the other hand, the complicated interatomic forces between the Fe, Cr, Ni, W, Co and Cu atoms in such a higher alloying content of SASS may be another adverse factor affecting the movement of the dislocations.

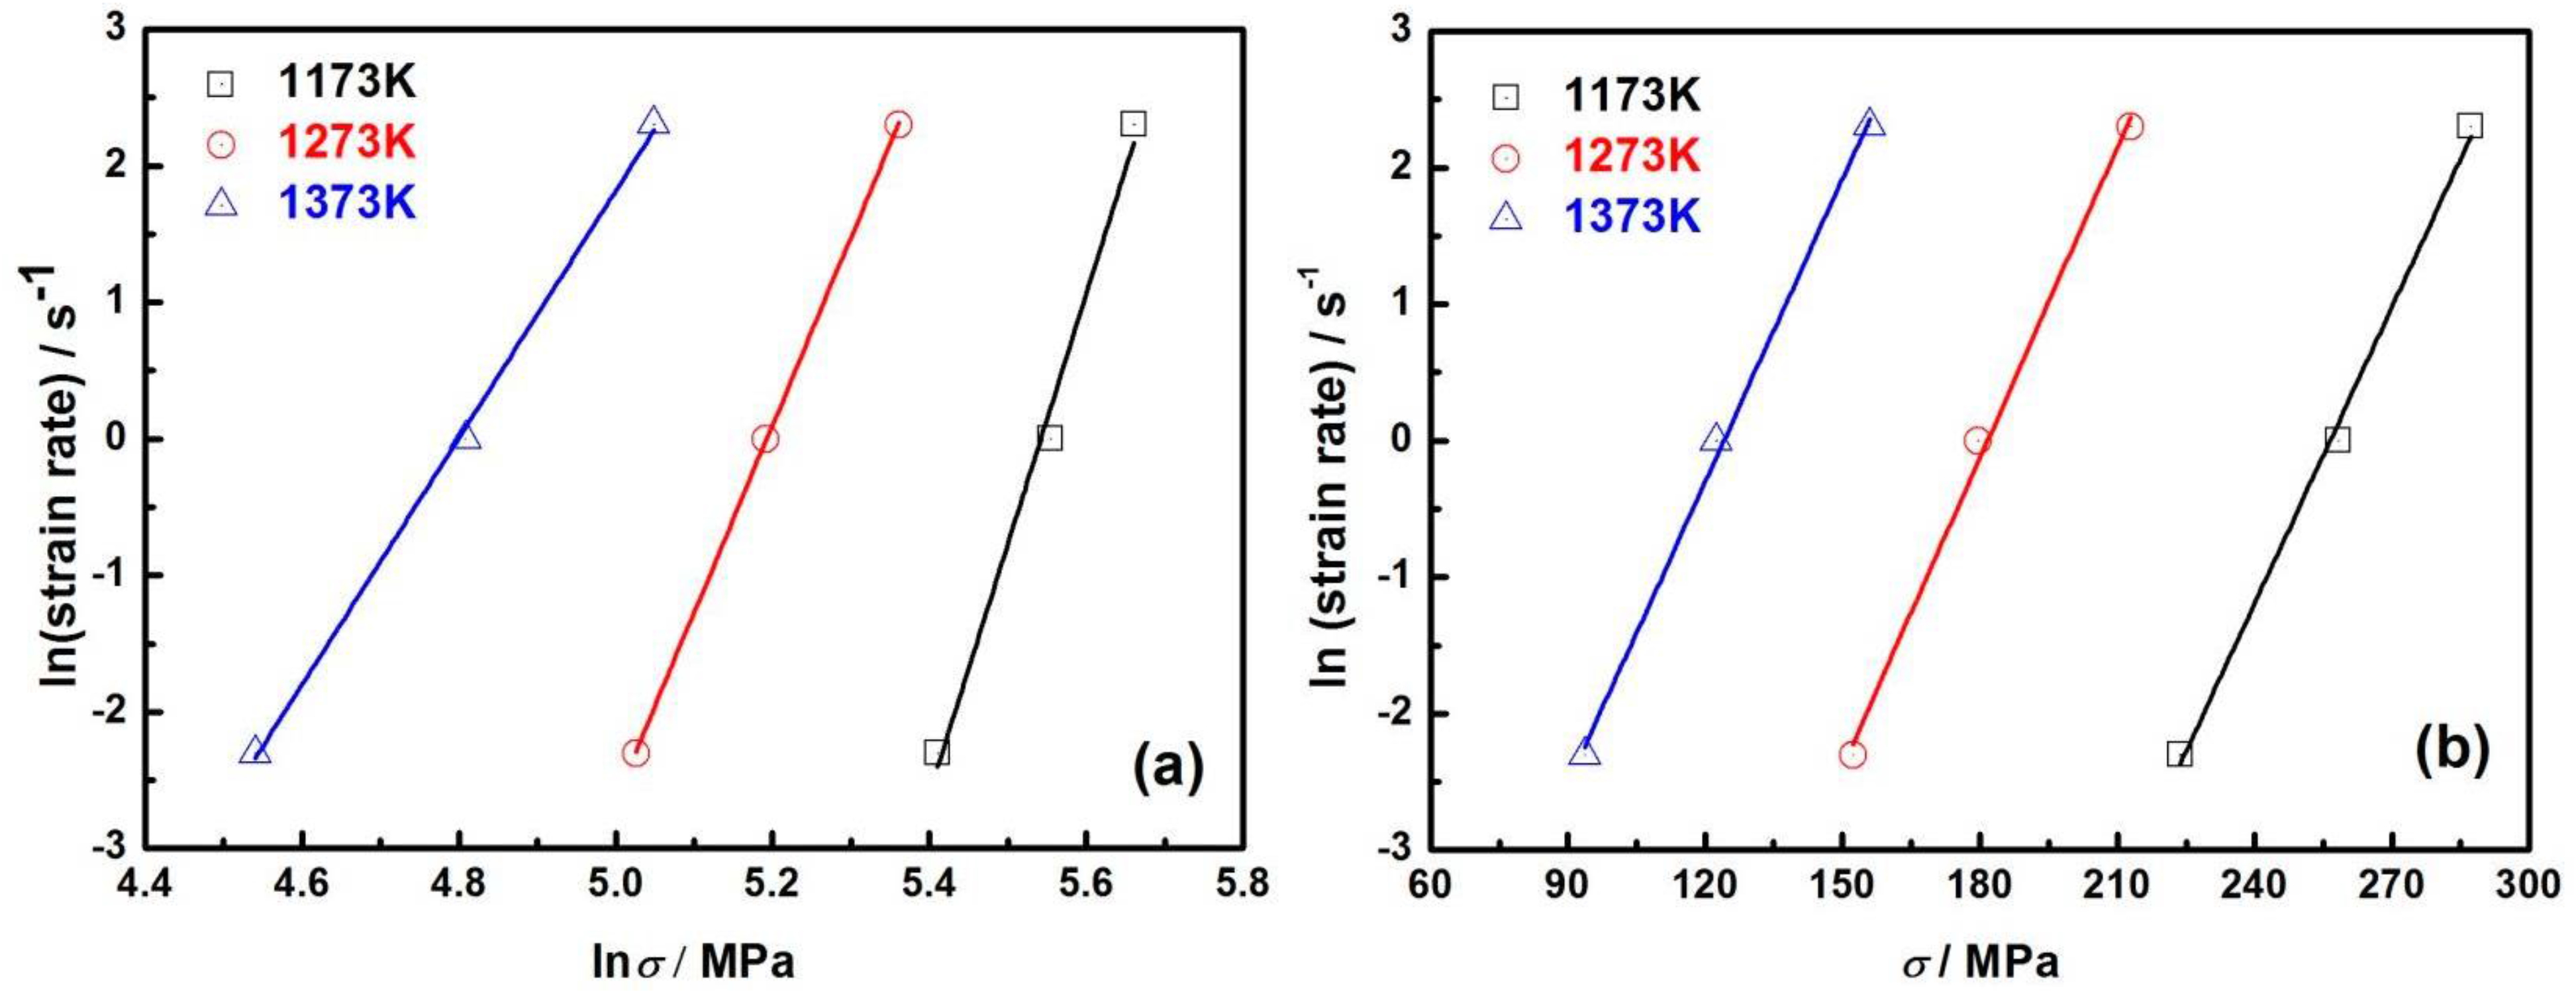
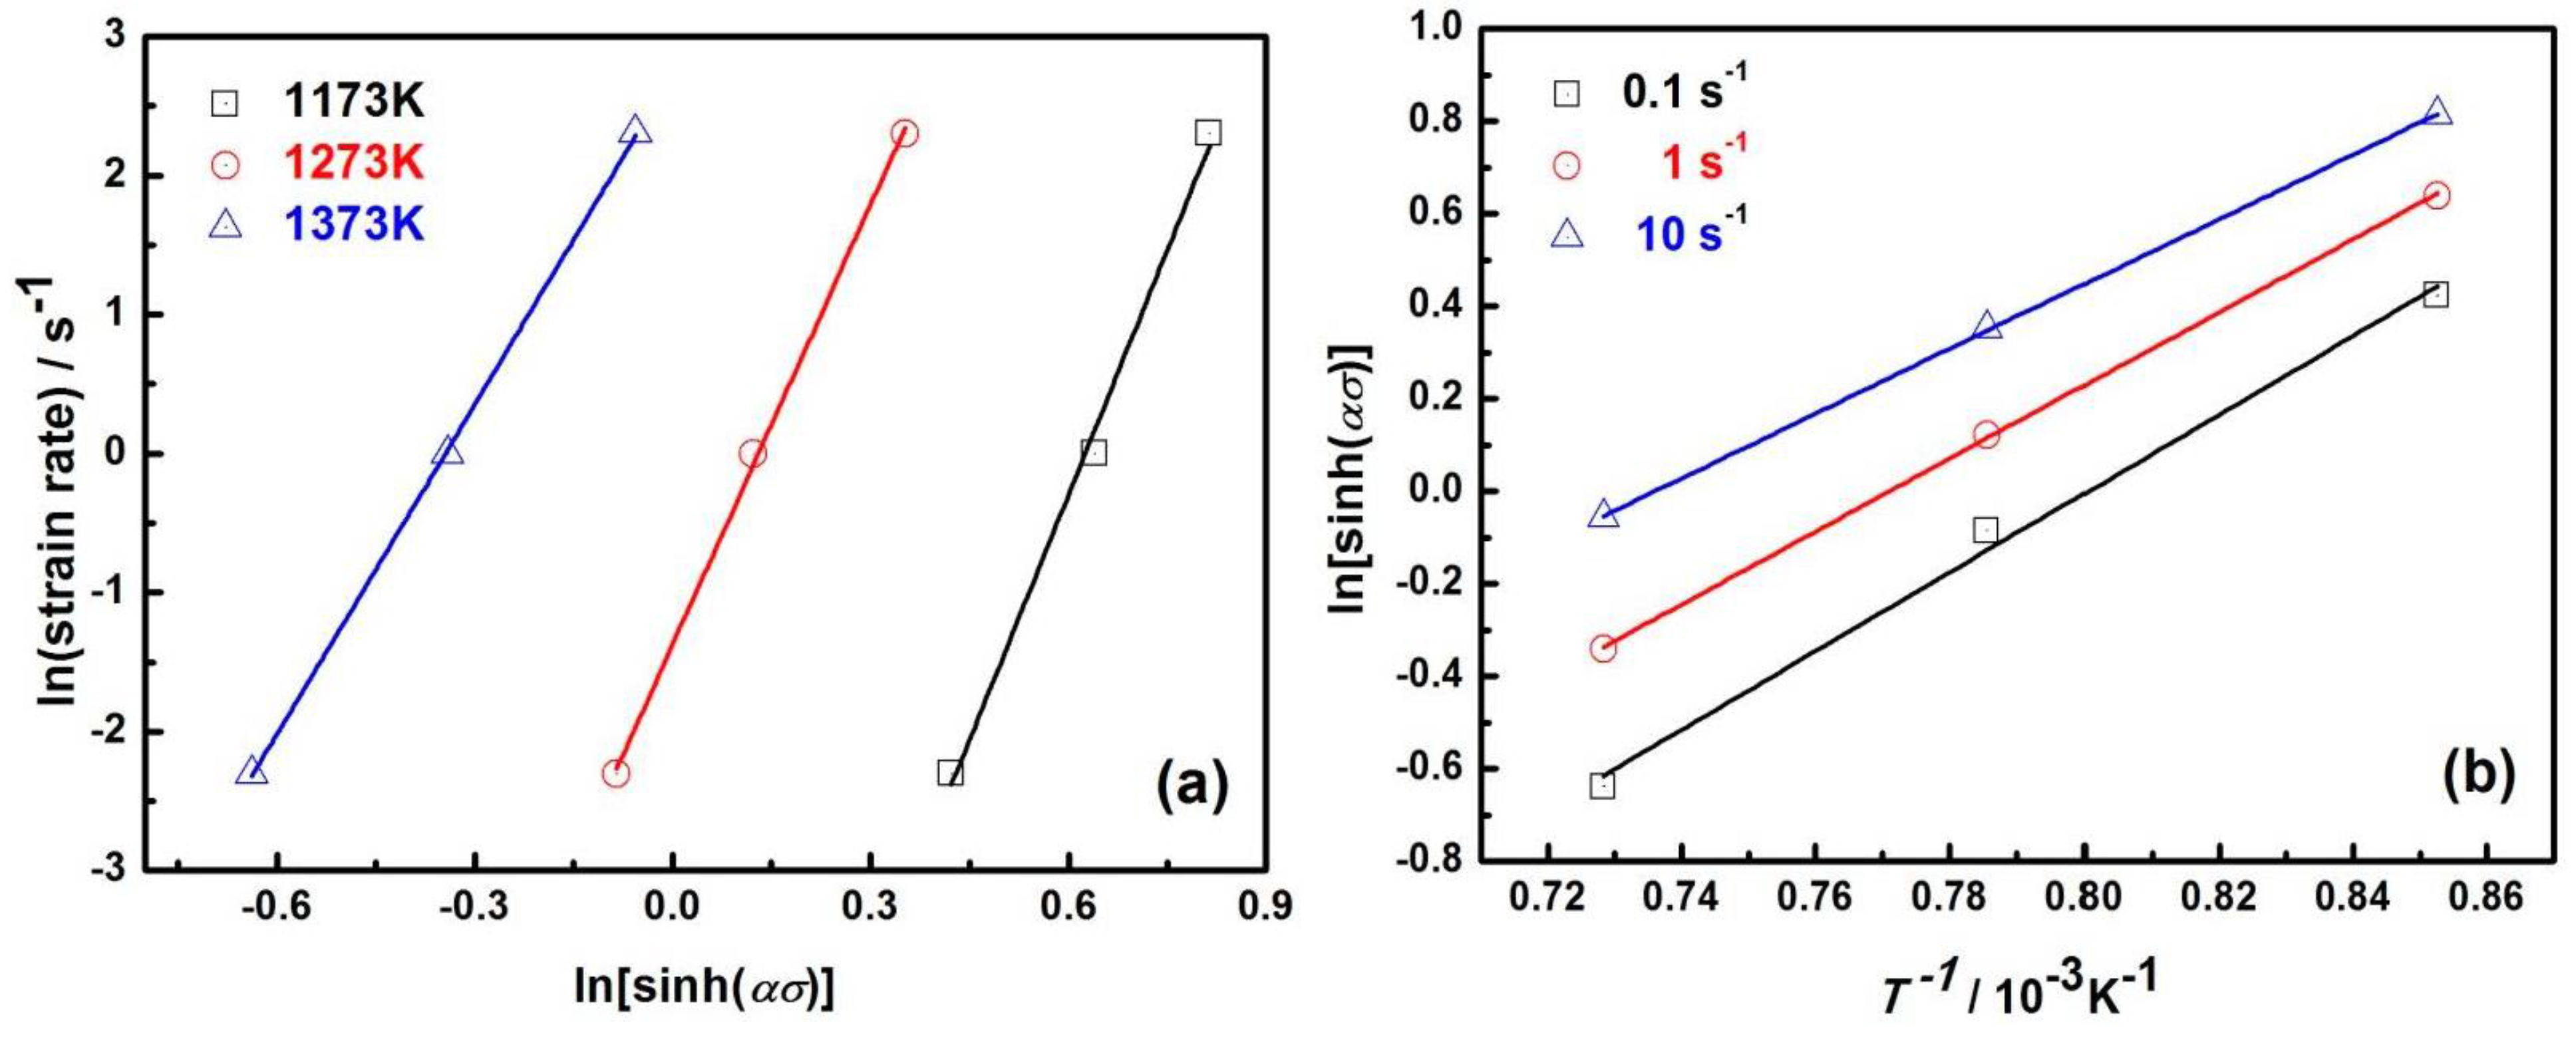
3.2. Constitutive Flow Curves Equations

Constitutive equations have been used frequently to analyze and simulate the flow behavior of steels and alloys. In this regard, the hyperbolic law in an Arrhenius-type equation expresses the relationships among flow stress, temperature and strain rate, particularly at high deformation temperatures [31,32], it is identified by Equation (1).
ε ˙ = F ( σ ) exp ( Q / R T )
where ε ˙ is the strain rate (s−1); σ is the flow stress (MPa) for a given strain; Q is the activation energy of hot deformation (kJ·mol−1); R is the gas constant (8.314 J·mol−1·K−1), T is the absolute temperature (K), and F(σ) is the stress function. Basically, F(σ) has three expressions according to the stress levels [32,33]:
F(σ) = A1σn1 (for low stress level, ασ < 0.8)
F(σ) = A2exp(βσ) (for high stress level, ασ > 1.2)
F(σ) = A[sinh(ασ)]n (for all stress level)
in which, A1, A2, A, n1, n, α, β are the material constants.
Equations (1)–(4) are employed first to calculate the material constants from the flow stress data obtained under various deformation conditions. The following are the extraction procedures of material constants at a specific true strain of 0.4 in this case.
For the lower and higher stress levels, taking natural logarithms on both sides of Equation (1), the following two equations can give respectively:
ln ε ˙ = ln A 1 + n 1 ln σ ( Q / R T )
ln ε ˙ = ln A 2 + βσ ( Q / R T )
According to Equations (5) and (6), n 1 = ln ε ˙ / ln σ and β = ln ε ˙ / σ , the relationship between the flow stress and strain rate at all deformation temperatures was obtained in the ln σ ln ε ˙ and σ ln ε ˙ plots, and the values of n1 and β can be calculated under different temperatures using the linear fitting method from Figure 2a,b, respectively. It can be seen that the lines at different temperatures are almost parallel and that the slopes varied by the scattering of the experimental data points. This indicates that the correlation of the flow stress and the strain rate is affected slightly with temperature. Because the slope of the lines is approximately the same, the mean values of all the slope rates can be taken as material constants n1 and β, which were found to be 13.692 and 0.074 MPa−1, respectively. Then, the value of another material constant α = β/n1 = 0.005 MPa−1.
Figure 2. Relationships between (a) lnσ and ln ε ˙ and (b) σ and ln ε ˙ at different deformation temperatures.
Metals 05 01717 g002
For all the stress levels (including low and high stress levels), Equations (1) and (4) can be written as the follows by taking the natural logarithms:
ln ε ˙ = ln A + n ln [ sinh ( ασ ) ] ( Q / R T )
In this equation, for the two independent variables of given strain rate and temperature conditions, differentiating Equation (7) can be rewritten as:
Q = R { ln ε ˙ / ln [ sinh ( ασ ) ] } T { ln [ sinh ( ασ ) ] / ( 1 / T ) } ε ˙
After substituting the values of flow stress, strain rate and deformation temperature into Equation (8), the correlations of ln [ sinh ( ασ ) ] ln ε ˙ , and 1/T − ln[sinh(ασ)] can be presented, as shown in Figure 3a,b respectively. On this basis, the value of material constant n, which is derived from the average slopes in the plot of ln [ sinh ( ασ ) ] ln ε ˙ , is 10.066. Then, activation energy Q is 652.73 kJ·mol−1 in the studied steel, as determined by the mean slope of the fitting lines in the 1/T − ln[sinh(ασ)] plot.
Figure 3. Relationships between (a) ln[sinh(ασ)] and ln ε ˙ at different deformation temperatures; (b) T−1 and ln[sinh(ασ)] at different strain rates.
Metals 05 01717 g003
Further, the Zener-Hollomon parameter (Z) presents the combined influences of temperature and strain rate in an exponent-type equation. It can characterize the deformation resistance and can be defined as Equation (9) as follows:
Z = ε ˙ exp ( Q / R T )
On substituting α, n, Q and other deformation variables into hyperbolic sine modeling Equations (1), (4) and (9), then the value of A at a particular strain can be estimated. The values of all variables at the true strain of 0.4 are listed in Table 1, and the Zener-Hollomon parameter for the studied steel can be represented as follows:
Z = ε ˙ exp ( Q ( 0.4 ) / R T ) = A ( 0.4 ) [ sinh ( α ( 0.4 ) σ ) ] n ( 0.4 )
Table 1. The values of all the variables at the true strain of 0.4 for the hyperbolic sine model.
α (MPa−1)β (MPa−1)n1nQ (kJ·mol−1) A
0.0050.07413.69210.066652.732.124 × 1026

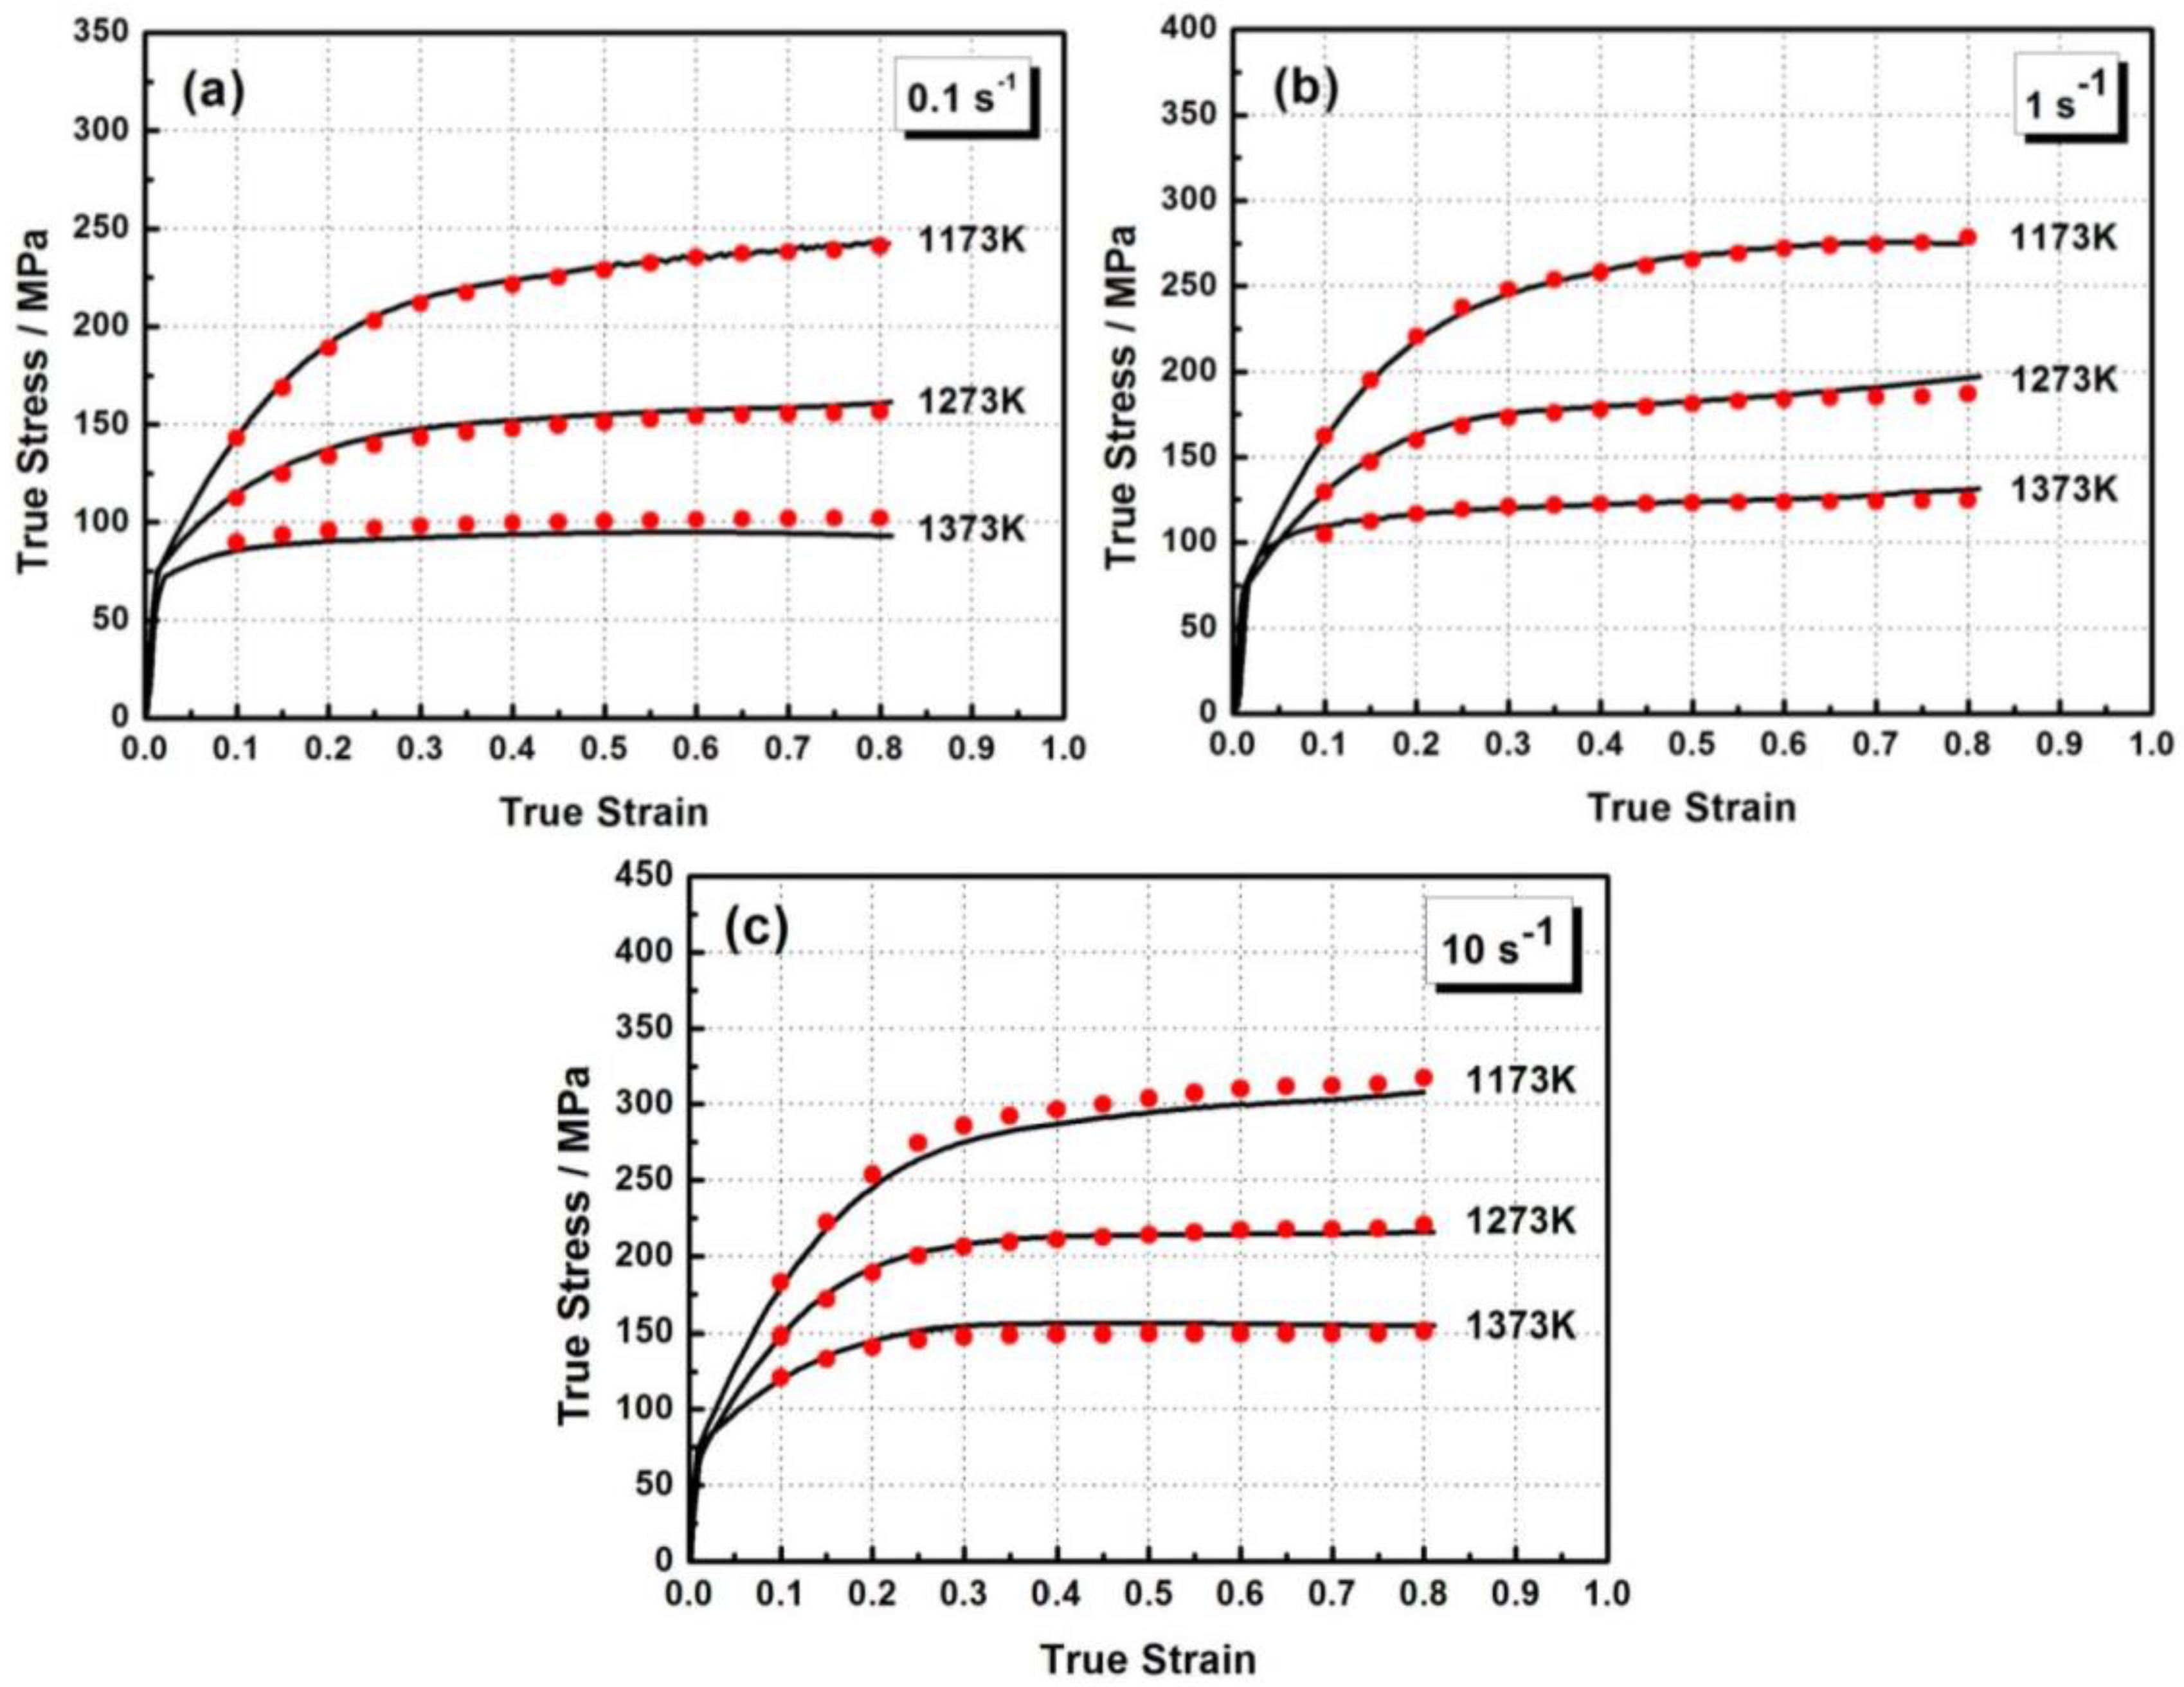
3.3. Verification of the Developed Constitutive Model with Strain Compensation

From Equation (7), it can be found that the influence of strain on the material constants is obviously neglected. As has been thoroughly discussed [30,34,35], the effect of strain compensation on stress should be taken into account in order to accurately predict the flow behavior of the studied steel, so it is necessary to establish the constitutive equation compensated for strain. The variable coefficients (including α, β, n, Q, and A) for different strain values from 0.1–0.8 with an interval of 0.05 were expressed in a series of constitutive equations. These values were then employed to fit the polynomial functions (Figure 4), and the variations could be represented as good correlations by a fifth order polynomial, as shown in Equations (11)–(15). Also, the polynomial fitting results are provided in Table 2.
α = B0 +B1ε + B2ε2 + B3ε3 + B4ε4 + B5ε5
β = C0 +C1ε + C2ε2 + C3ε3 + C4ε4 + C5ε5
n = D0 +D1ε + D2ε2 + D3ε3 + D4ε4 + D5ε5
Q = E0 +E1ε + E2ε2 + E3ε3 + E4ε4 + E5ε5
lnA = F0 +F1ε + F2ε2 + F3ε3 + F4ε4 + F5ε5
Table 2. The polynomial fitting results of constants and coefficients of α , β , n , Q , and ln A .
αValueβValuenValueQValuelnAValue
B00.011C00.201D020.820E0366.971F031.416
B1−0.056C1−1.573D1−122.340E11727.233F1183.033
B20.205C26.529D2520.308E2−5021.468F2−538.010
B3−0.379C3−13.180D3−1063.531E38758.577F3917.189
B40.346C412.967D41062.198E4−6905.828F4−710.467
B5−0.124C5−4.975D5−415.579E51661.322F5170.838
In the results shown in Figure 4d, it is apparent that variations in the Q values were found ranging from 496.89 kJ·mol−1 to 745.43 kJ·mol−1 under different strain amounts. These values are much higher than those for self-diffusion barrier energy in γ-iron (Q 280 kJ·mol−1). Compared with other reported Mo-containing SASS values, such as Fe–20Cr–25Ni–4.5Mo (Qmax 443 kJ mol−1), Fe–25Cr–22Ni–7Mo (Qmax 469 kJ·mol−1), Fe–16Cr–25Ni–6Mo (Qmax 484 kJ·mol−1), Fe–20Cr–18Ni–6Mo (Qmax 577 kJ·mol−1), and Fe–25Cr–30Ni–3Mo (Qmax 656 kJ·mol−1) [13,14,16,18,36], the activation barrier in the steel under observation in this study is significantly high, and the hot deformation is rather difficult. In particular, the variations in the Q values presents a rising trend with increases in strain and begins to decline until the true strain is reached at 0.75. It is well known that the activation energy value for hot deformation is a function of alloying composition. Such characteristics indicate that the thermal diffusion ability of the atoms was quite weak in this kind of Fe–Cr–Ni–W–Cu–Co alloy system, and the dislocation movements were also very difficult. Because the DRX restoration process was strongly dependent on the diffusion of atoms, grain or subgrain boundary migration and dislocation density, these results also explained why all the flow curves gradually reverted to a balanced stress state without notable peak flow stresses and flow softening.
Figure 4. The variation of coefficients (a) α; (b) β; (c) n; (d) Q; and (e) lnA with true strain by polynomial fitting.
Metals 05 01717 g004
The Zener-Hollomon parameters in a wide strain range of 0.1–0.8 are given by substituting the coefficients (α, β, n, Q, and A) in Equation (10). Furthermore, the flow stress can be written as a function of the Zener-Hollomon parameter to predict the flow behavior of the studied steel at different true strains (εt), and the correlation is expressed in Equation (16) as:
σ = ( 1 / α ( ε t ) ) ln { ( Z ( ε t ) / A ( ε t ) ) 1 / n ( ε t ) + [ ( Z ( ε t ) / A ( ε t ) ) 2 / n ( ε t ) + 1 ] 1 / 2 }
In order to verify the above-developed constitutive model with strain compensation, a comparison between the experimental curves and predicted values was carried out, the results of which are shown in Figure 5. The predicted flow stresses follow the experimental curves well for the entire range of strains.
Figure 5. The comparisons between the experimental curves (lines) and predicted values (circles) of the studied steel under different deformation temperatures with strain rates (a) 0.1 s−1; (b) 1 s−1; and (c) 10 s−1.
Metals 05 01717 g005
To further evaluate the accuracy of the predicted values for the improved constitutive equations, two standard statistical parameters (average absolute relative error (AARE) and correlation coefficient (R)) are employed [37,38], which are defined as Equations (17) and (18) respectively:
A A R E = 1 N i = 1 N | ( σ e i σ p i ) / σ e i |
R = N i = 1 ( σ e i σ ¯ e ) ( σ p i σ ¯ p ) / N i = 1 ( σ e i σ ¯ e ) 2 N i = 1 ( σ p i σ ¯ p ) 2
where N is the number of data; σ e i is the experimental value of flow curve; σ p i is the predicted value from the constitutive model, and σ ¯ e and σ ¯ p are the average values of σ e i and σ p i , respectively. As shown in Table 3, the AARE-values for all deformation conditions were found to be less than 6.758%, and all of the R-values are calculated to be as least 0.912. The results of the above verifications reflect the good predictability for the developed constitutive equations and also offer a more accurate application of the metal forming simulations of the steel under consideration in this study.
Table 3. Standard statistical parameter (average absolute relative error (AARE) and correlation coefficient (R)) values corresponding to different deformation conditions.
Strain Rate (s−1)Temperature (K)AARE (%)R
0.111730.8650.999
12730.6990.998
13733.2360.999
111732.6380.999
12731.9110.992
13731.0770.994
1011736.7580.962
12731.6690.912
13733.4750.994

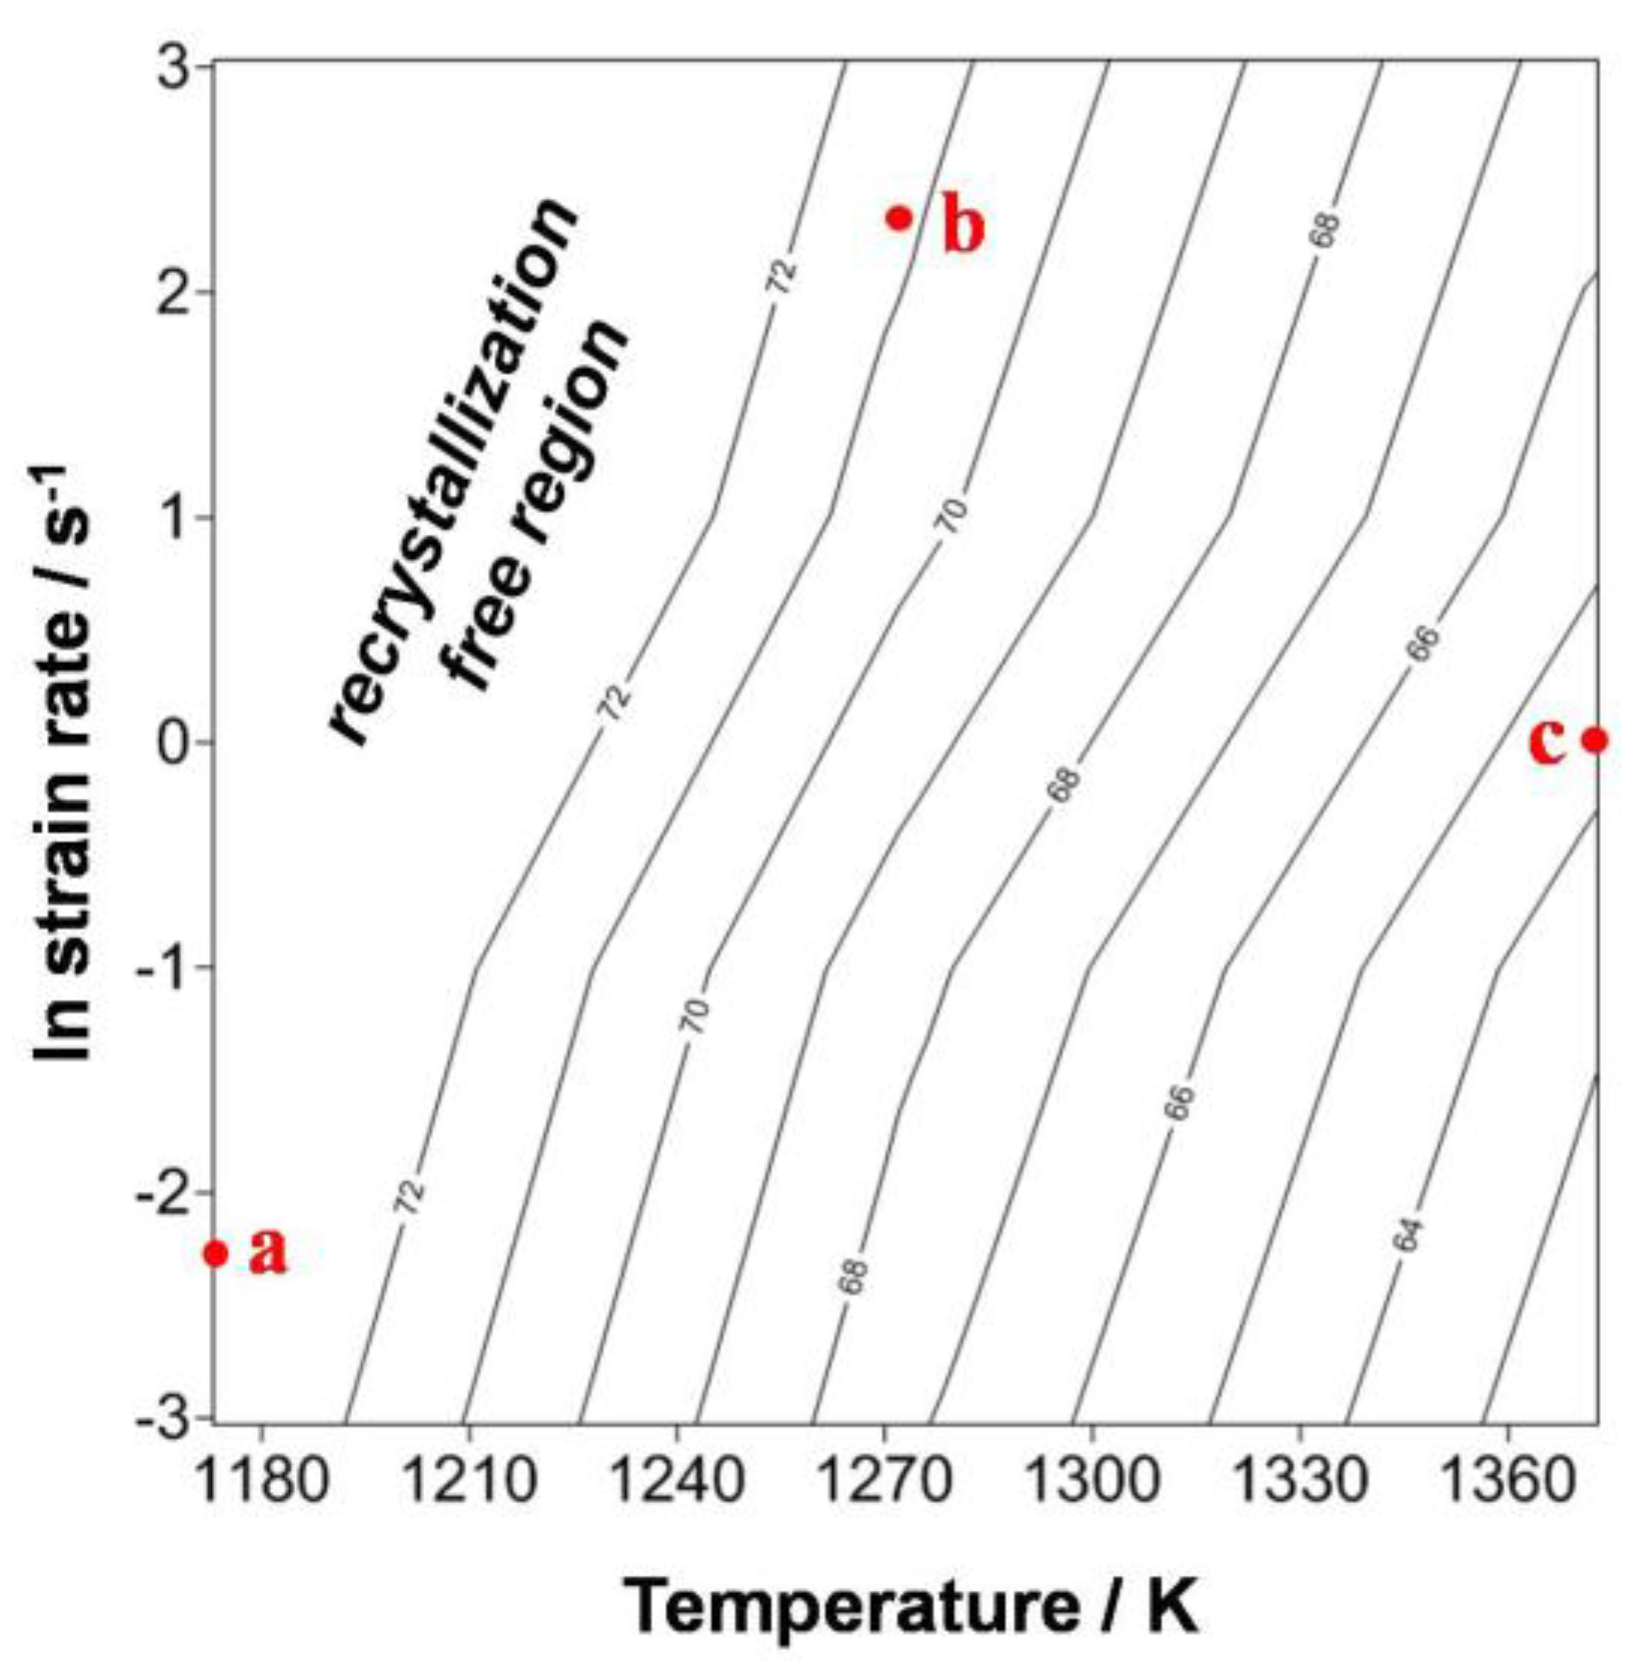
3.4. Relationship between the Dynamic Restoration Condition and the Zener-Hollomon Parameter

For SASSs, it is quite imperative to clarify the dynamic mechanisms of hardening and softening in pursuit of desired processing parameters. It is known that the occurrence of a dynamic restoration phenomenon (recovery or recrystallization) is controlled by deformation conditions and that the restoration process will bring about a reduction in deformation resistance. The variations in the Q values clearly indicate that the deformation resistance of the studied steel was very high and that it was difficult to soften during deformation. However, the developed constitutive models are not enough to prove the restoration mechanisms directly from the flow stress curves. Hence, in order to evaluate the actual dynamic mechanism of the studied steel, the Zener-Hollomon (Z) parameter modified by strain compensation was applied and associated with microstructural observation.
In Figure 6, the Z parameter can be measured at a true strain of 0.8 from Equation (9), depending on the variations in the temperatures, strain rates and activation energy values. The numbers on the contours in the map represent the values of the Z parameter expressed as exponents. As seen from this figure, the exponent-type Z parameter increases with decreasing temperatures and increasing strain rates. According to the results of the microstructure analysis, the two regimes for different dynamic mechanisms can be easily found on the map. In the specimen deformed with an exponent-type Z parameter higher than 72 (marked as point a in blank region), it can be seen that the pre-existing grain boundaries started to serrate, but there are no obvious recrystallized grains to be found, as shown in Figure 7a. However, other deformed specimens with exponent-type Z parameters lower than 72 (marked as points b and c) exhibited different recrystallized levels, as shown in Figure 7b,c. Evidently, for the steel studied in this research, the restoration mechanism could be clarified by the critical value of the exponent-type Z parameter (lnZc), i.e., the lower the lnZ is, the higher degree of recrystallization, and the larger the recrystallization grain size will be. However, a mixed necklace structure of partially recrystallized and pancake-like grains was still exhibited in the lower lnZ region (Figure 7c), which demonstrates directly why no notable peak flow stresses and flow softening occurred on the stress-strain curves because the recrystallization process in the studied steel was inhomogeneous and severely delayed. Therefore, the suitable hot working conditions in an actual production procedure should be considered at lower strain rate regions (<0.1 s−1) and/or higher temperatures (>1373 K). Meanwhile the extremely high temperatures (i.e., incipient melting or solidus temperature) must be avoided carefully so as not to induce the detrimental phenomena (e.g., intergranular cracking and hot shortness).
Figure 6. The exponent-type Zener-Hollomon parameter map under different deformation conditions at a true strain of 0.8. The micrographs of the designated points a, b and c are shown in Figure 7.
Metals 05 01717 g006
Figure 7. Microstructure of a specimen deformed at (a) 1173 K, with a strain rate of 0.1 s−1 (point marked as a in Figure 6); (b) 1273 K, with a strain rate of 10 s−1 (point marked as b in Figure 6) and (c) 1373 K, with a strain rate of 1 s−1 (point marked as c in Figure 6).
Metals 05 01717 g007

4. Conclusions

The flow behavior and constitutive analysis of Fe–22Cr–25Ni–3.5W–3Cu–1.5Co steel were investigated by means of hot compression tests in the temperature ranges of 1173–1373 K and strain rate ranges of 0.1–10 s−1. The main conclusions can be summarized as follows:
  • All flow stress curves gradually returned to a balanced stress state without notable peak stress characteristics and flow softening. Most of the flow curves presented a slight increase in stress with the increasing of the strain, which was a result of the unfinished dynamic balance of the work hardening and restoration processes.
  • The constitutive model of the studied steel was developed on an Arrhenius-type equation to predict the flow behavior under specific deformation conditions. The material constants and deformation activation energy (including α, β, n, Q, and A) were incorporated with strain compensation with fifth order polynomial fitting, and the results indicated good correlation and generalization.
  • The comparison between the experimental and predicted values exhibited a high precision and good reliability with regard to the constitutive equations according to the mean error. The absolute average relative error (AARE) values for all of the deformation conditions were below 6.8% and all the correlation coefficient (R) values were found to be above 0.9.
  • From the exponent-type Zener-Hollomon parameter map and corresponding observation of the microstructure, the critical ln Z values for the occurrence of the dynamic restoration processes at large strains were determined. A lower ln Z value could give rise to higher levels of recrystallization and increment of grain size.

Acknowledgments

The authors would like to gratefully acknowledge the support on this research by the China Steel Corporation. Also, the technical support provided by Mao-Chun Chen, Steel and Aluminum R & D Department of China Steel Corporation are highly appreciated.

Author Contributions

L.-C. Yang mainly performed the present study and wrote the paper. Y.-T. Pan, I.-G. Chen and D.-Y. Lin provide advice and recommendations on the research and polishing of the paper.

Conflicts of Interest

The authors declare no conflict of interest.

References

  1. Lee, T.H.; Kim, S.J.; Jung, Y.C. Crystallographic details of precipitates in Fe–22Cr–21Ni–6Mo–(N) superaustenitic stainless steels aged at 900 °C. Metall. Mater. Trans. A 2000, 31, 1713–1723. [Google Scholar] [CrossRef]
  2. Fonda, R.W.; Lauridsen, E.M.; Ludwig, W.; Tafforeau, P.; Spanos, G. Two-dimensional and three-dimensional analyses of sigma precipitates and porosity in a superaustenitic stainless steel. Metall. Mater. Trans. A 2007, 38, 2721–2726. [Google Scholar] [CrossRef]
  3. Wang, S.H.; Wu, C.C.; Chen, C.Y.; Yang, J.R.; Chiu, P.K.; Fang, J. Cyclic deformation and phase transformation of 6Mo superaustenitic stainless steel. Met. Mater. Int. 2007, 13, 275–283. [Google Scholar] [CrossRef]
  4. Koutsoukis, T.; Redjaimia, A.; Fourlaris, G. Phase transformations and mechanical properties in heat treated superaustenitic stainless steels. Mater. Sci. Eng. A 2013, 561, 477–485. [Google Scholar] [CrossRef]
  5. Muller, C.; Chumbley, L.S. Fracture toughness of heat-treated superaustenitic stainless steel. J. Mater. Eng. Perform. 2010, 19, 714–720. [Google Scholar] [CrossRef]
  6. Phillips, N.S.L.; Chumbley, L.S.; Gleeson, B. Phase transformations in cast superaustenitic stainless steels. J. Mater. Eng. Perform. 2009, 18, 1285–1293. [Google Scholar] [CrossRef]
  7. Bradaskja, B.; Pirnar, B.; Fazarinc, M.; Fajfar, P. Deformation behavior and microstructural evolution during hot compression of AISI 904L. Steel Res. Int. 2011, 82, 346–351. [Google Scholar] [CrossRef]
  8. Zambon, A.; Ferro, P.; Bonollo, F. Microstructural, compositional and residual stress evaluation of CO2 laser welded superaustenitic AISI 904L stainless steel. Mater. Sci. Eng. A 2006, 424, 117–127. [Google Scholar] [CrossRef]
  9. Mataya, M.C.; Nilsson, E.R.; Brown, E.L.; Krauss, G. Hot working and recrystallization of as-cast 317L. Metall. Mater. Trans. A 2003, 34, 3021–3041. [Google Scholar] [CrossRef]
  10. Mataya, M.C.; Nilsson, E.R.; Brown, E.L.; Krauss, G. Hot working and recrystallization of as-cast 316L. Metall. Mater. Trans. A 2003, 34, 1683–1703. [Google Scholar] [CrossRef]
  11. Schramn, R.E.; Reed, R.P. Stacking fault energies of seven commercial austenitic steels. Metall. Trans. A 1975, 6, 1345–1351. [Google Scholar] [CrossRef]
  12. Han, Y.; Liu, G.W.; Zou, D.N.; Liu, R.; Qiao, G.J. Deformation behavior and microstructural evolution of as-cast 904L austenitic stainless steel during hot compression. Mater. Sci. Eng. A 2013, 565, 342–350. [Google Scholar] [CrossRef]
  13. Ebrahimi, G.R.; Keshmiri, H.; Momeni, A.; Mazinani, M. Dynamic recrystallization behavior of a superaustenitic stainless steel containing 16% Cr and 25% Ni. Mater. Sci. Eng. A 2011, 528, 7488–7493. [Google Scholar] [CrossRef]
  14. Pu, E.; Zheng, W.; Ziang, J.; Song, Z.; Li, J. Hot deformation characteristic and processing map of superaustenitic stainless steel S32654. Mater. Sci. Eng. A 2014, 598, 174–182. [Google Scholar] [CrossRef]
  15. Momeni, A.; Dehghani, K.; Keshmiri, H.; Ebrahimi, G.R. Hot deformation behavior and microstructural evolution of a superaustenitic stainless steel. Mater. Sci. Eng. A 2010, 527, 1605–1611. [Google Scholar] [CrossRef]
  16. Mirzaei, A.; Hanzaki, A.Z.; Haghdadi, N.; Marandi, A. Constitutive description of high temperature flow behavior of Sanicro-28 super-austenitic stainless steel. Mater. Sci. Eng. A 2014, 589, 76–82. [Google Scholar] [CrossRef]
  17. Han, Y.; Qiao, G.; Sun, Y.; Zou, D. Modeling the constitutive relationship of Cr20Ni25Mo4Cu superaustenitic stainless steel during elevated temperature. Mater. Sci. Eng. A 2012, 539, 61–67. [Google Scholar] [CrossRef]
  18. Zou, D.N.; Liu, R.; Han, Y.; Zhang, W.; Wu, K.; Liu, X.H. On dynamic recrystallization under hot working of superaustenitic stainless steel. Mater. Sci. Technol. 2014, 30, 411–417. [Google Scholar] [CrossRef]
  19. Liang, R.; Khan, A.K. A critical review of experimental results and constitutive models for BCC and FCC metals over a wide range of strain rates and temperatures. Int. J. Plast. 1999, 15, 963–980. [Google Scholar] [CrossRef]
  20. Bernard, P.; Bag, S.; Huang, K.; Logé, R.E. A two-site mean field model of discontinuous dynamic recrystallization. Mater. Sci. Eng. A 2011, 528, 7357–7367. [Google Scholar] [CrossRef]
  21. Momeni, A.; Ebrahimi, G.R.; Jahazi, M.; Bocher, P. Microstructure evolution at the onset of discontinuous dynamic recrystallization: A physics-based model of subgrain critical size. J. Alloys Compd. 2014, 587, 199–210. [Google Scholar] [CrossRef]
  22. Beltran, O.; Huang, K.; Logé, R.E. A mean field model of dynamic and post-dynamic recrystallization kinetics, grain size and flow stress. Comput. Mater. Sci. 2015, 102, 293–303. [Google Scholar] [CrossRef]
  23. Jonas, J.J.; Sellars, C.M.; McTegart, W.J. Strength and structure under hot-working conditions. Int. Metall. Rev. 1969, 14, 1–24. [Google Scholar] [CrossRef]
  24. Shamsolhodaei, A.; Hanzaki, A.Z.; Ghambari, M.; Moememi, S. The high temperature flow behavior modeling of NiTi shape memory alloy employing phenomenological and physical based constitutive models: A comparative study. Intermetallics 2014, 53, 140–149. [Google Scholar] [CrossRef]
  25. Zhou, M.; Lin, Y.C.; Deng, J.; Jiang, Y.Q. Hot tensile deformation behaviors and constitutive model of an Al–Zn–Mg–Cu alloy. Mater. Des. 2014, 59, 141–150. [Google Scholar] [CrossRef]
  26. Sakai, T.; Belyakov, A.; Kaibyshev, R.; Miura, H.; Jonas, J.J. Dynamic and post-dynamic recrystallization under hot, cold and severe plastic deformation conditions. Prog. Mater. Sci. 2014, 60, 130–207. [Google Scholar] [CrossRef]
  27. Haghdadi, N.; Hanzaki, A.Z.; Abedi, H.R. The flow behavior modeling of cast A356 aluminum alloy at elevated temperatures considering the effect of strain. Mater. Sci. Eng. A 2012, 535, 252–257. [Google Scholar] [CrossRef]
  28. Quan, G.Z.; Shi, Y.; Wang, Y.X.; Kang, B.S.; Ku, T.W.; Song, W.J. Constitutive modeling for the dynamic recrystallization evolution of AZ80 magnesium alloy based on stress-strain data. Mater. Sci. Eng. A 2011, 528, 8051–8059. [Google Scholar] [CrossRef]
  29. Doherty, R.D.; Hugues, D.A.; Humphreys, F.J.; Jonas, J.J.; Jenson, D.J.; Kassner, M.E.; King, W.E.; McNelley, T.R.; McQueen, H.J.; Rollett, A.D. Current issues in recrystallization: A review. Mater. Sci. Eng. A 1997, 238, 219–274. [Google Scholar] [CrossRef]
  30. Samantaray, D.; Mandal, S.; Bhaduri, A.K.; Venugopal, S.; Sivaprasad, P.V. Analysis and mathematical modeling of elevated temperature flow behavior of austenitic stainless steels. Mater. Sci. Eng. A 2011, 528, 1937–1943. [Google Scholar] [CrossRef]
  31. Khamei, A.A.; Dehghani, K. Modeling the hot-deformation behavior of Ni60 wt. %–Ti40 wt. % intermetallic alloy. J. Alloys Compd. 2010, 490, 377–381. [Google Scholar] [CrossRef]
  32. Liu, J.T.; Chang, H.B.; Wu, R.H.; Hsu, T.Y.; Ruan, X.Y. Investigation on hot deformation behavior of AISI T1 high-speed steel. Mater. Charact. 2000, 45, 175–186. [Google Scholar] [CrossRef]
  33. Sellars, C.M.; McTegart, W.J. On the mechanism of hot deformation. Acta Metall. 1966, 14, 1136–1138. [Google Scholar] [CrossRef]
  34. Lin, Y.C.; Chen, M.S.; Zhang, J. Modeling of flow stress of 42CrMo steel under hot compression. Mater. Sci. Eng. A 2009, 499, 88–92. [Google Scholar] [CrossRef]
  35. Xiao, Y.H.; Guo, C.; Guo, X.Y. Constitutive modeling of hot deformation behavior of H62 brass. Mater. Sci. Eng. A 2011, 528, 6510–6518. [Google Scholar] [CrossRef]
  36. Han, Y.; Wu, H.; Zhang, W.; Zou, D.; Liu, G.; Qiao, G. Constitutive equation and dynamic recrystallization behavior of as-cast 254SMO super-austenitic stainless steel. Mater. Des. 2015, 69, 230–240. [Google Scholar] [CrossRef]
  37. Mandal, S.; Rakesh, V.; Sivaprasad, P.V.; Venugopal, S.; Kasiviswanathan, K.V. Constitutive equations to predict high temperature flow stress in a Ti-modified austenitic stainless steel. Mater. Sci. Eng. A 2009, 500, 114–121. [Google Scholar] [CrossRef]
  38. Srinivasulu, S.; Jain, A. A comparative analysis of training methods for artificial neural network rainfall-runoff models. Appl. Soft Comput. 2006, 6, 295–306. [Google Scholar] [CrossRef]

