
Role of Grain Size and Recrystallization Texture in the Corrosion Behavior of Pure Iron in Acidic Medium


Department of Materials Science and Engineering, Delft University of Technology, Mekelweg 2, 2628 CD Delft, The Netherlands
*
Author to whom correspondence should be addressed.
†
These authors contributed equally to this work.
Metals 2023, 13(2), 388; https://doi.org/10.3390/met13020388
Submission received: 15 December 2022
/
Revised: 9 February 2023
/
Accepted: 10 February 2023
/
Published: 14 February 2023
(This article belongs to the Section Corrosion and Protection)
Abstract
:This work investigates the role of grain size and recrystallization texture in the corrosion behavior of pure iron in 0.1 M sulfuric acid solution. Annealing heat treatment was applied to obtain samples with different average grain sizes (26, 53 and 87 µm). Optical microscopy, X-ray diffraction and electron backscatter diffraction techniques were used to characterize the microstructure. The EBSD data analysis showed ferrite phase with no inclusions and very low geometrically necessary dislocation density, indicating strain-free grains constituting all samples. The crystallographic texture analysis of the samples revealed that the 26 µm grain size sample had a high volume fraction of {111} oriented grains parallel to the sample surface, while other samples exhibited nearly random crystallographic texture. The electrochemical results from potentiodynamic polarization and electrochemical impedance spectroscopy showed a decrease in corrosion resistance from 87 µm to 53 µm grain size sample and then an increase for the 26 µm grain size sample. This increase was attributed to the dominant effect of recrystallization texture on the corrosion behavior of the sample. The cathodic hydrogen evolution reaction kinetics was found to play a decisive role in the corrosion behavior of iron.
Keywords:
grain size; crystallographic texture; iron; corrosion; hydrogen evolution reaction; EIS; EBSD1. Introduction
The processing of metals and alloys for structural applications is widely researched to achieve superior mechanical properties through microstructure modifications. These processing techniques employ plastic deformation and heat treatment to primarily refine the grain size or achieve a preferential crystallographic orientation of grains. The effects of grain size [1,2,3] and crystallographic orientation [4,5,6] on the mechanical properties of ferrous materials have been studied extensively and have been established in the literature. However, a unanimous agreement on the effect of grain size and crystallographic orientation on corrosion resistance of ferrous materials is lacking.
Corrosion studies investigating the effect of grain size have been summarized in the recent reviews of Wang et al. [7], Miyamoto et al. [8] and Ralston et al. [9]. Their reviews highlight the lack of consensus in literature between grain refinement and corrosion resistance of ferrous alloys. The ambiguities arise because the processing techniques used to refine the grain size simultaneously influence other microstructural features such as crystallographic texture, dislocation density and segregation of alloying elements and impurities. These features inevitably influence the corrosion behavior and complicate the understanding of grain size-corrosion behavior relationship. Wang et al. [10,11] reported a higher corrosion resistance for nanocrystalline iron samples than for coarse-grained samples in acidic sulfate and 0.1 M HCl solutions. However, they attributed the improved corrosion resistance to the preferential {110} orientation of grains instead of the grain size differences. Jinlong et al. [12] found that the cryo-rolled iron sample, with a smaller grain size, had a lower corrosion resistance than the cold-rolled sample in 0.5 M H2SO4 solution. They attributed this result to a higher dislocation density of the cryo-rolled sample without considering a possible role of grain size difference between the samples.
Another key factor in the corrosion studies is the choice of solution environment, which can either promote active corrosion or passivation of metals. A recent corrosion study on low alloyed steels showed opposite corrosion behaviors, depending on the environment [13]. The corrosion resistance decreased with the reduction in grain size (from 24 to 4 µm), when tested in 3.5 wt.% NaCl solution and, oppositely, the resistance followed an increasing trend in 0.1 M NaHCO3 solution. This observation was explained by a higher grain boundary density of the fine-grained sample that acted as active sites for corrosion (in NaCl solution) and for passivation (in NaHCO3 solution). Similarly, the grain orientation-dependent corrosion behavior of iron displays contrasting trends in different environments. A higher corrosion resistance of {100} orientation than {111} and {110} orientations parallel to the sample surface was reported in borate buffer (pH = 8.4) [14] and acetate buffer (pH = 6) [15] solutions. These observations were linked to the low packing density of {100} planes, which resulted in higher oxide formation tendency and a thicker passive film in passivating environments. However, in 0.05 M H2SO4 solution (pH = 1), the corrosion resistance followed the sequence {110} > {111} > {100} [16]. The same trend had also been stated for low carbon steel in aqueous sulfuric acid (pH = 2.3) [17]. These corrosion trends in acid environment were attributed to the faster cathodic hydrogen evolution reaction kinetics on {100} orientation relative to other grain orientations parallel to the sample surface. To sum up, establishing a direct relation between a single microstructural feature such as grain size and corrosion resistance is not trivial. It is necessary to use controlled metal processing techniques to disentangle and investigate the role of each microstructural feature in a comprehensive and systematic way.
In this work, we investigate the role of grain size and recrystallization texture in the corrosion behavior of pure iron under active corrosion condition in 0.1 M H2SO4 solution. Accordingly, we designed annealing heat treatments to achieve one sample with grains having pronounced recrystallization texture and two samples of almost random crystallographic texture, but having a large difference in the grain size. Using a combination of EBSD and XRD techniques, we confirm the microstructure design in the three samples and ensure that other microstructural features are similar across the samples. The electrochemical behavior of the samples, characterized by electrochemical impedance spectroscopy and potentiodynamic polarization, shows a decrease in corrosion resistance with the reduction in grain size for the random textured samples. Furthermore, the sample with recrystallization texture shows an improved corrosion resistance, despite having the smallest grain size among the studied samples. We explain and discuss these corrosion behaviors by considering the corrosion characteristics of the microstructural features.
2. Experimental Details
2.1. Material Processing
A cold-rolled sheet of ARMCO iron (A K Steel, Breda, The Netherlands) was used as the starting material. Samples of dimensions 10 mm × 5 mm × 2 mm were laser-machined from the sheet. The chemical analysis of the samples was performed by wavelength dispersive spectroscopy (WDS) using a JEOL JXA 8900R microprobe with 10 keV beam energy and 100 nA beam current. The chemical composition of the samples is listed in Table 1. The Fe content in the samples exceeds 99.5 wt.%.
The as-received samples were heat-treated in a Bähr DIL 805 A/D dilatometer to obtain a set of three samples with different average grain sizes. The samples were heated to the annealing temperature at a rate of 10 °C/s. Annealing temperatures of 700 °C, 950 °C, and 1100 °C were selected. This selection was based on the expectations that annealing at 700 °C leads to the recrystallization of the deformed microstructure. Hence, we expect here that the prior deformation texture changes into a different, yet also very intense texture, known as recrystallization texture, characterized by grains with <111>//ND (normal direction) [18,19,20]. On the other hand, annealing at 950 °C, and 1100 °C ensures ferrite-to-austenite and backward transformation. Upon the BCC/FCC transformations, following the description of Young et al. [21] and Kurdjumov and Sachs [22], known as YKS orientation relationship, the transformation pertains to a <211>90° scheme. This amounts to 24 possible variants, and it is expected to result in final microstructure with a random crystallographic texture. Furthermore, the holding time of our annealing treatment routes is quite big for the austenitic variants to undergo grain growth and also change the topology. This means that, during the cooling, the FCC variants will not go back to the original BCC orientations, e.g., see the recent study of Kestens et al. [23], since the topology has changed. As for the grain size, 1100 °C annealing enables higher growth rates and thereby larger austenite grain sizes than at 950 °C, resulting in a coarser ferrite microstructure. The samples were annealed for 10 min and then quenched to room temperature with a helium gas flow. A schematic representation of the heat treatment cycle is shown in Figure 1. The samples are accordingly named Fe-700, Fe-950, and Fe-1100.
2.2. Microstructure Characterization
The microstructure of the samples was characterized by optical microscopy, electron backscatter diffraction (EBSD) and X-ray diffraction (XRD). The samples underwent sequential sanding from P80 to P4000 grit SiC paper. This step was followed by polishing using an alcohol-based diamond slurry with particle sizes 3 µm and then 1 µm. For the EBSD measurements, an extra step of polishing with colloidal silica suspension was carried out. The samples were ultrasonically cleaned in isopropanol and dried with airflow. The optical images of the samples were taken using a Keyence VHX-1000 digital microscope. The polished surface of samples was etched with a 2% Nital solution. Optical microscopy was later also used to study the sample microstructure after electrochemical tests. The classical X-ray diffraction experiments in Bragg–Brentano geometry were performed using a Bruker D8 Advance diffractometer with Cu K radiation ( = 0.154060 nm). The samples are in ferrite phase (see Supplementary Material Figure S1). EBSD was performed using a JEOL JSM 6500F FEG-SEM microscope with an EDAX/TSL detector. An area of 1.44 mm2 was scanned in each sample with a 17 mm working distance and 1 µm step size. The data post-processing and analysis were carried out using TSL-OIM v7.3 software and MATLAB with MTEX toolbox [24,25]. The grains were identified using a threshold misorientation of 5°. The average grain size of the samples was determined as the diameter of a circular area equal to the average grain area [26]. The grain boundaries were classified as low-angle grain boundaries and high-angle grain boundaries if the misorientation angle was below or above 15°, respectively. The geometrically necessary dislocations (GND) density of the samples was calculated from Kernel Average Misorientation (KAM) as explained elsewhere [27,28]. The crystallographic texture of Fe-700 sample was assessed using the EBSD data. For Fe-950 and Fe-1100 samples, additional XRD measurements were performed due to statistical limitations arising from fewer number of grains in their EBSD scan area. The macro-texture measurements were performed on a Bruker D8 Discover X-ray diffractometer equipped with Eulerian cradle and parallel beam geometry. A Co K ( = 0.178897 nm) radiation was used for the experiments. The {1 1 0}, {2 0 0}, and {2 1 1} pole figures were measured for the samples. In both EBSD and XRD techniques, analysis was performed on the sheet plane of the sample consisting of the rolling direction (RD) and the transverse direction (TD).
2.3. Electrochemical Characterization
For electrochemical experiments, the samples were embedded in epoxy resin and abraded to reveal the metal surface on the rear end for electrical connection. The sanding and polishing steps, as mentioned earlier, were followed before each electrochemical experiment run. The edges of the samples bordering the embedding resin were covered by a sealant (Electrolube Bloc Lube Red) to prevent crevice corrosion during the measurements.
The corrosion behavior of the samples was investigated by electrochemical impedance spectroscopy (EIS) and potentiodynamic polarization in deaerated 0.1 M H2SO4 solution (pH = 1.1) at room temperature. The solution was deaerated by purging N2 gas through 100 mL of solution for one hour before the electrochemical measurements. The electrochemical tests were performed with a Bio-Logic VSP-300 potentiostat using a custom three-electrode cell set-up: Ag/AgCl (Satd. KCl) as the reference electrode, stainless steel mesh as the counter electrode, and the sample acting as the working electrode. The open-circuit potential (OCP) of the system was measured for one hour before the tests, at which a steady state was achieved. The EIS scan was performed with a 10 mV excitation amplitude in the frequency range from 30 kHz to 0.01 Hz. The EIS data analysis and fitting were performed with ZView v3.5h software. The potentiodynamic polarization scan was carried out in the range from −250 mV to +250 mV vs. OCP at a rate of 0.167 mV/s. The data collection and Tafel extrapolation for corrosion current density calculation were performed using the EC-Lab v11.34 software. A Keyence VHX-1000 digital microscope was used to measure the exposed sample surface area. Each electrochemical test was repeated at least three times on the samples to ensure reproducibility of the results.
3. Results
3.1. Microstructure Analysis
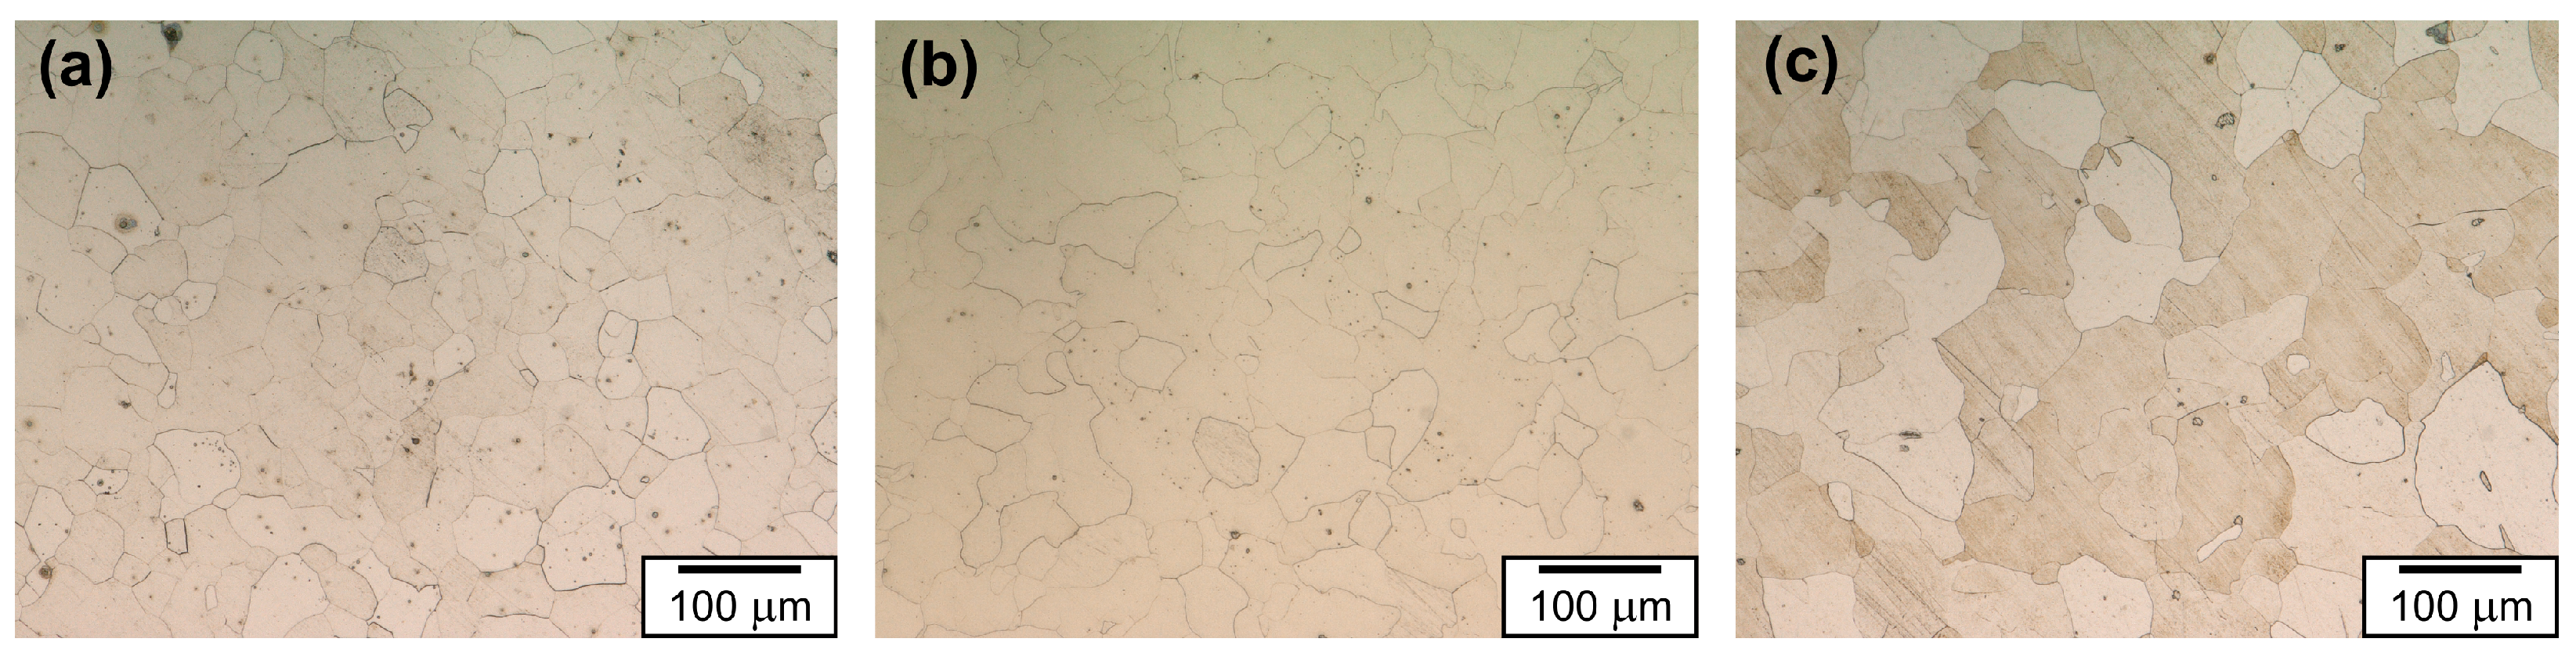
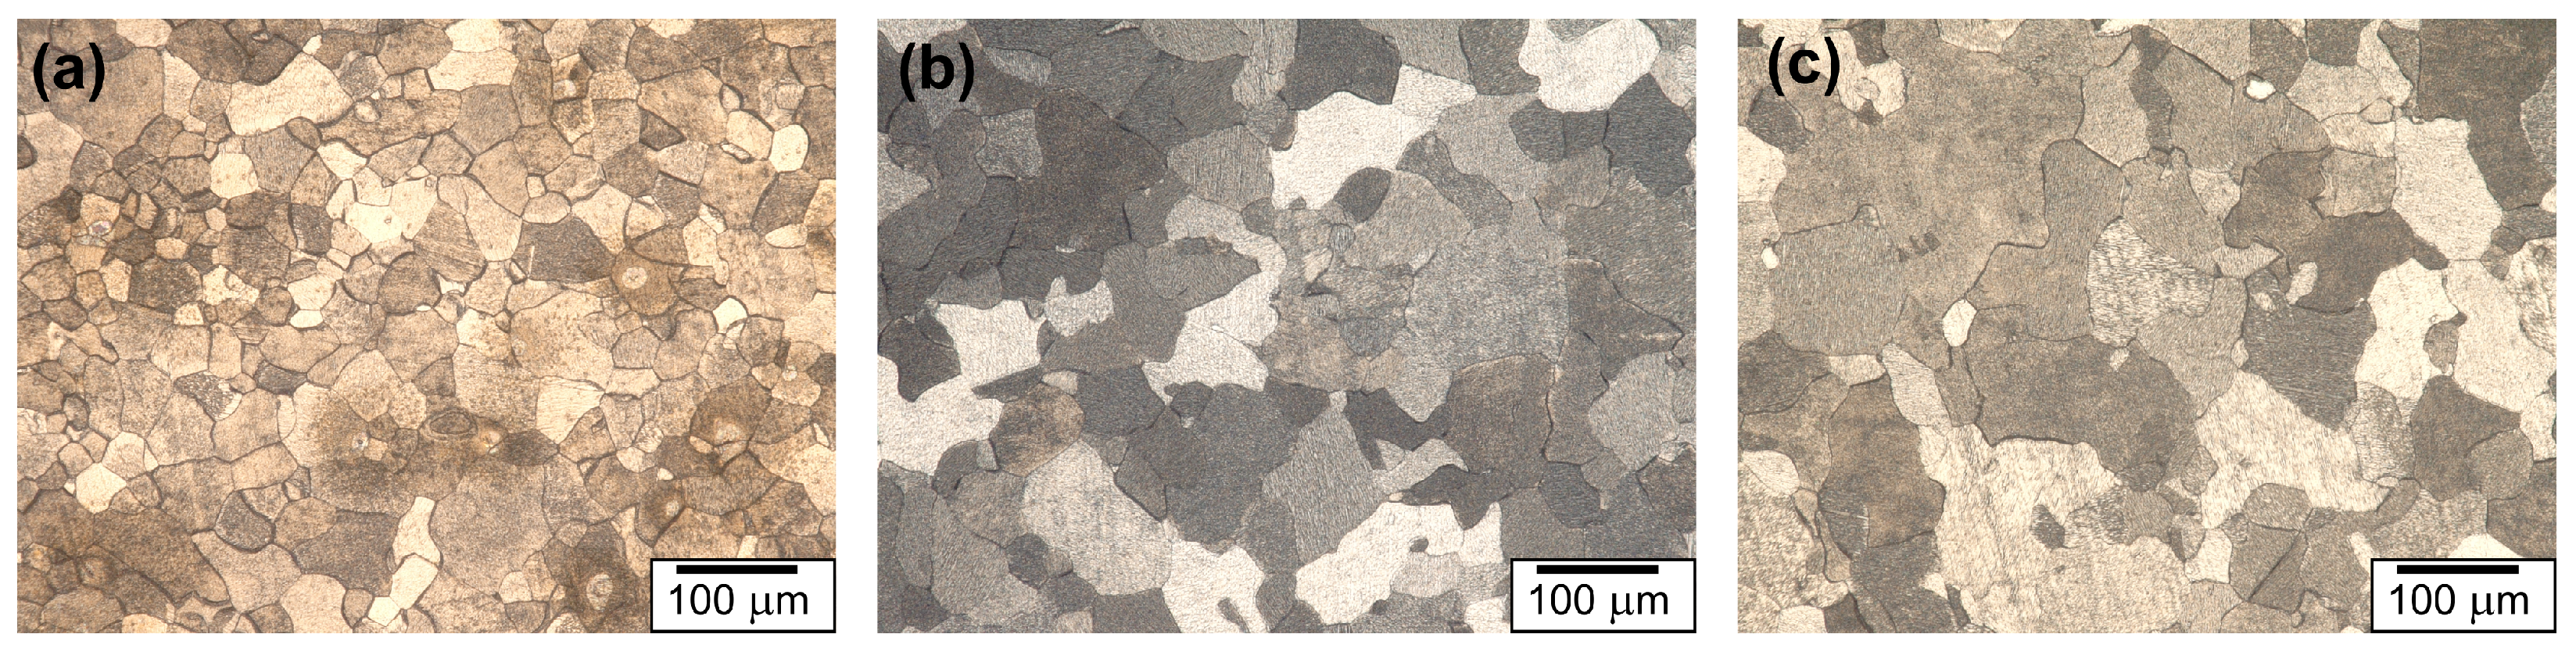
Figure 2 shows the optical images of samples after etching. The samples have a single ferrite phase. The black dots observed in the images are due to sample handling during etching. The grain size of the samples increases with an increase in the annealing temperature.
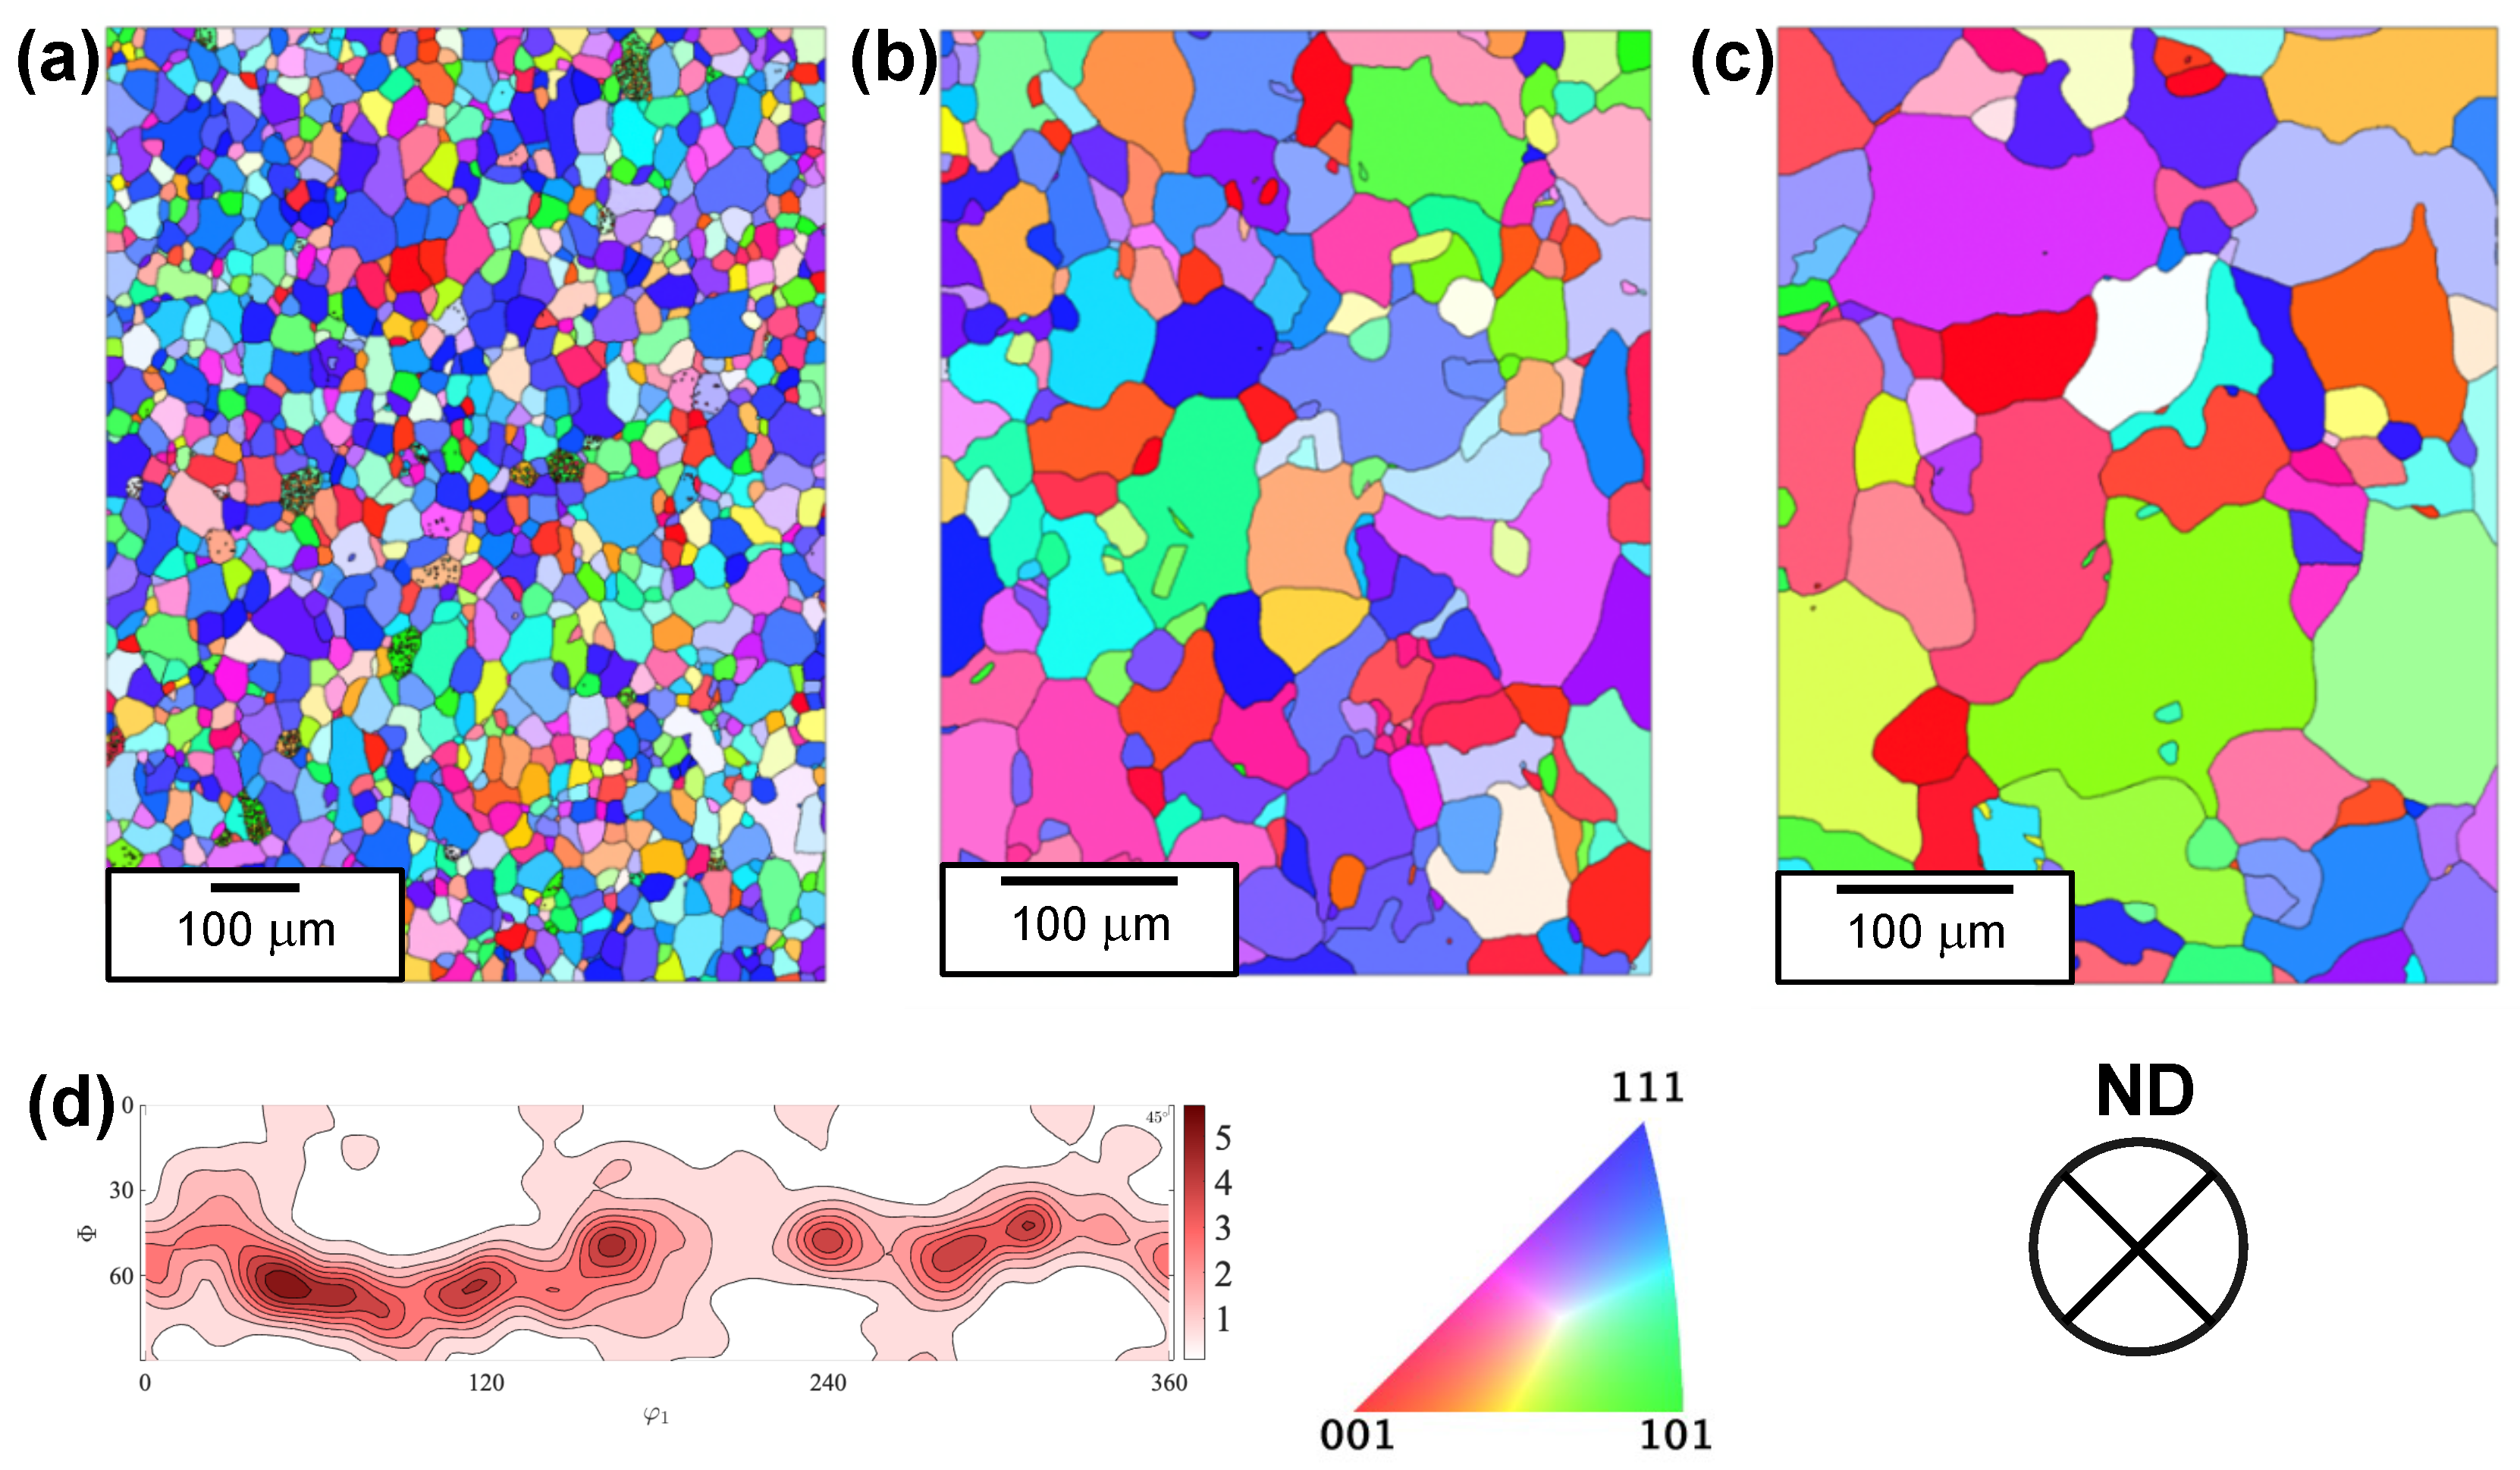
Figure 3 shows spatially resolved crystal orientations of the three samples, as analyzed by EBSD, and color-coded in accordance with the inverse pole figure (IPF)// normal direction (ND). The corroding surface of all samples is investigated here. The Fe-700 sample exhibits fine equiaxed grains following annealing, while Fe-950 and Fe-1100 samples exhibit coarser grains because of their higher annealing temperatures. The Fe-700 sample shows a preferential orientation of grains close to <111> // normal direction (ND). This texture is known as -fiber texture. It is the expected outcome of recrystallization in cold-rolled iron during the annealing heat treatment [18,19,20]. The Fe-950 and Fe-1100 samples do not show preferential occurrence of any crystallographic orientation, possibly due to their higher annealing temperatures, leading to full austenitization and loss of prior existing texture. Additional microstructure parameters obtained from the EBSD data are summarized in Table 2. The average grain size of samples increases with annealing temperature, and consequently, the grain boundary density follows the opposite trend. The grain boundaries in the samples have been classified as low-angle and high-angle using a threshold misorientation of 15°. The high-angle grain boundaries constitute a dominant share of the grain boundary density in all samples. The geometrically necessary dislocation density (GND) of the Fe-950 and Fe-1100 samples are close, while it is a bit higher for the Fe-700 sample. It seems that the GND diminishes for larger grain sizes, which is reasonable since the same trend is observed for the grain boundary density. Figure 3d shows the 2 = 45° section of an orientation distribution function (ODF) plot for Fe-700 sample, quantified from the measured EBSD data. The Euler angles notation follows the (ZXZ) rotations, known as Bunge convention [29]. The plot shows a high density of iso-intensity lines in the region between = 50° and 60°, which indicates a dominant volume fraction of grains close to {111} orientation parallel to the sheet plane of the sample. This confirms the desired outcome of our heat treatment to achieve a sample with preferential crystallographic orientation.
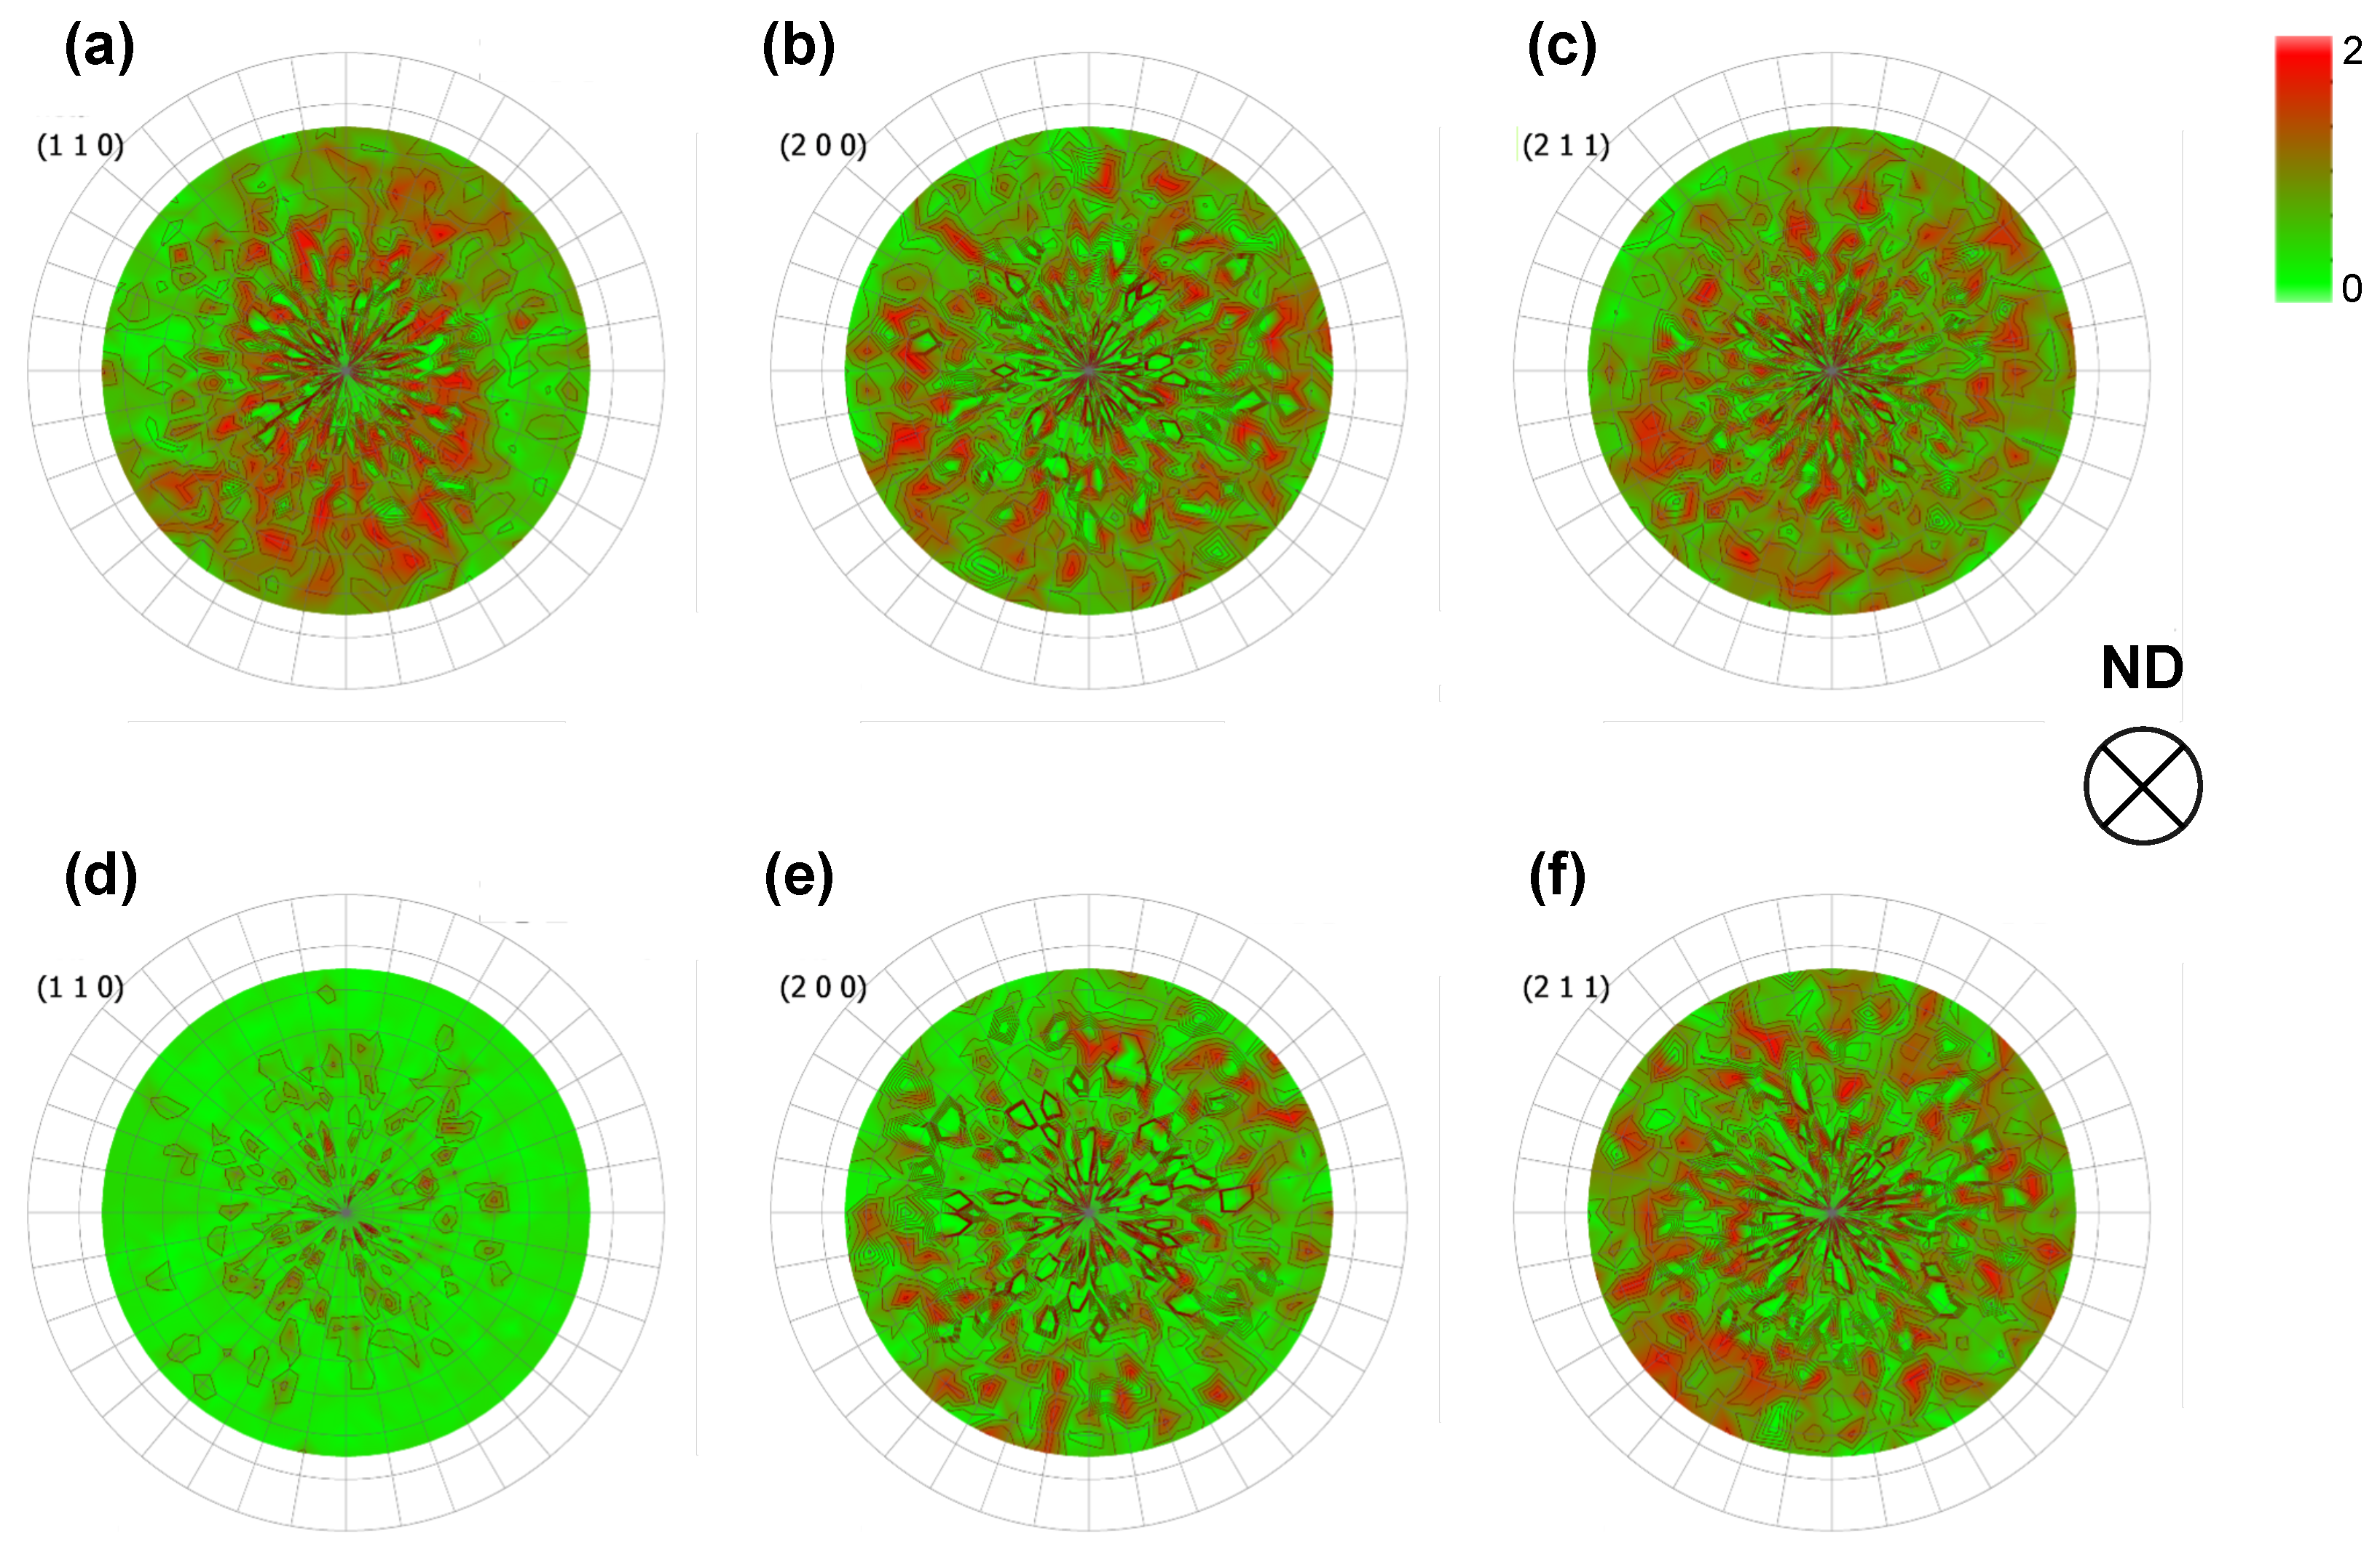
Due to a fewer number of grains in the EBSD maps of Fe-950 and Fe-1100 samples, we resort to macro-texture analysis by XRD to analyze their crystallographic orientation of grains. Figure 4 shows the pole figures obtained by XRD for Fe-950 and Fe-1100 samples. Although the pole figures exhibit scattered regions with some concentrated intensities, it is clear that there are no particular preferences associated with a crystallographic texture. Most importantly for our study, none of the pole figures show concentrated intensities at the center, which indicates that there is no particular preference of the planes parallel to the corroding surface. This validates our annealing treatment to be appropriate and sufficient in avoiding texture memory effects, insofar as the microstructures are characterized by a nearly random crystallographic texture. Therefore, it can be concluded that, for samples Fe-950 and Fe-1100, we are dealing with rather randomly textured samples varying primarily in grain size.
3.2. Electrochemical Behavior Analysis
Electrochemical Impedance Spectroscopy (EIS)—Figure 5 a,b show the Nyquist and the Bode plots of the samples obtained from the EIS measurements in deaerated 0.1 M H2SO4 solution, respectively. In the Nyquist plot, the samples exhibit a slightly depressed capacitive semi-circle in the high to mid-frequency range followed by an inductive loop observed at low frequencies. The capacitive semi-circle is associated with the electrical double layer at the metal–electrolyte interface. The inductive loop observed at low frequencies is attributed to the relaxation of adsorbed species on the sample surface. These adsorbed species could be Fe (I) and Fe(II) intermediates, based on similar studies in sulfuric acid solution [30,31,32]. The diameter of the capacitive semi-circle is a measure of the charge–transfer resistance of the sample. The diameter of the semi-circles among the samples follows the sequence Fe-1100 > Fe-700 > Fe-950. The Bode phase plot shows a single time constant in all samples. The EIS data were fitted with an equivalent electrical circuit [33,34] as shown in Figure 5c. It comprises solution resistance (R1), charge transfer resistance (R2), constant phase element (CPE) of electrical double layer, adsorption resistance (R3) and adsorption inductance (L). The CPE impedance () is given by:
is the CPE constant, is the angular frequency, and n is the CPE exponent, ranging from 0 (pure resistor) to 1 (pure capacitor). The values of the circuit elements obtained after fitting over three measurement repetitions are summarized in Table 3. The Chi-squared values of the fittings are in the order of 10−4 for all samples. The values of n coefficient are below 1, which is an indication of a non-ideal capacitor behavior. This is related to the possible irregularities of the surface and possible absorbed species mentioned earlier. There are no significant differences in the CPE values between the samples. The major variations are observed in the charge transfer resistance (R2). This resistance is a measure of corrosion resistance and follows the sequence Fe-1100 > Fe-700 > Fe-950 in our samples.
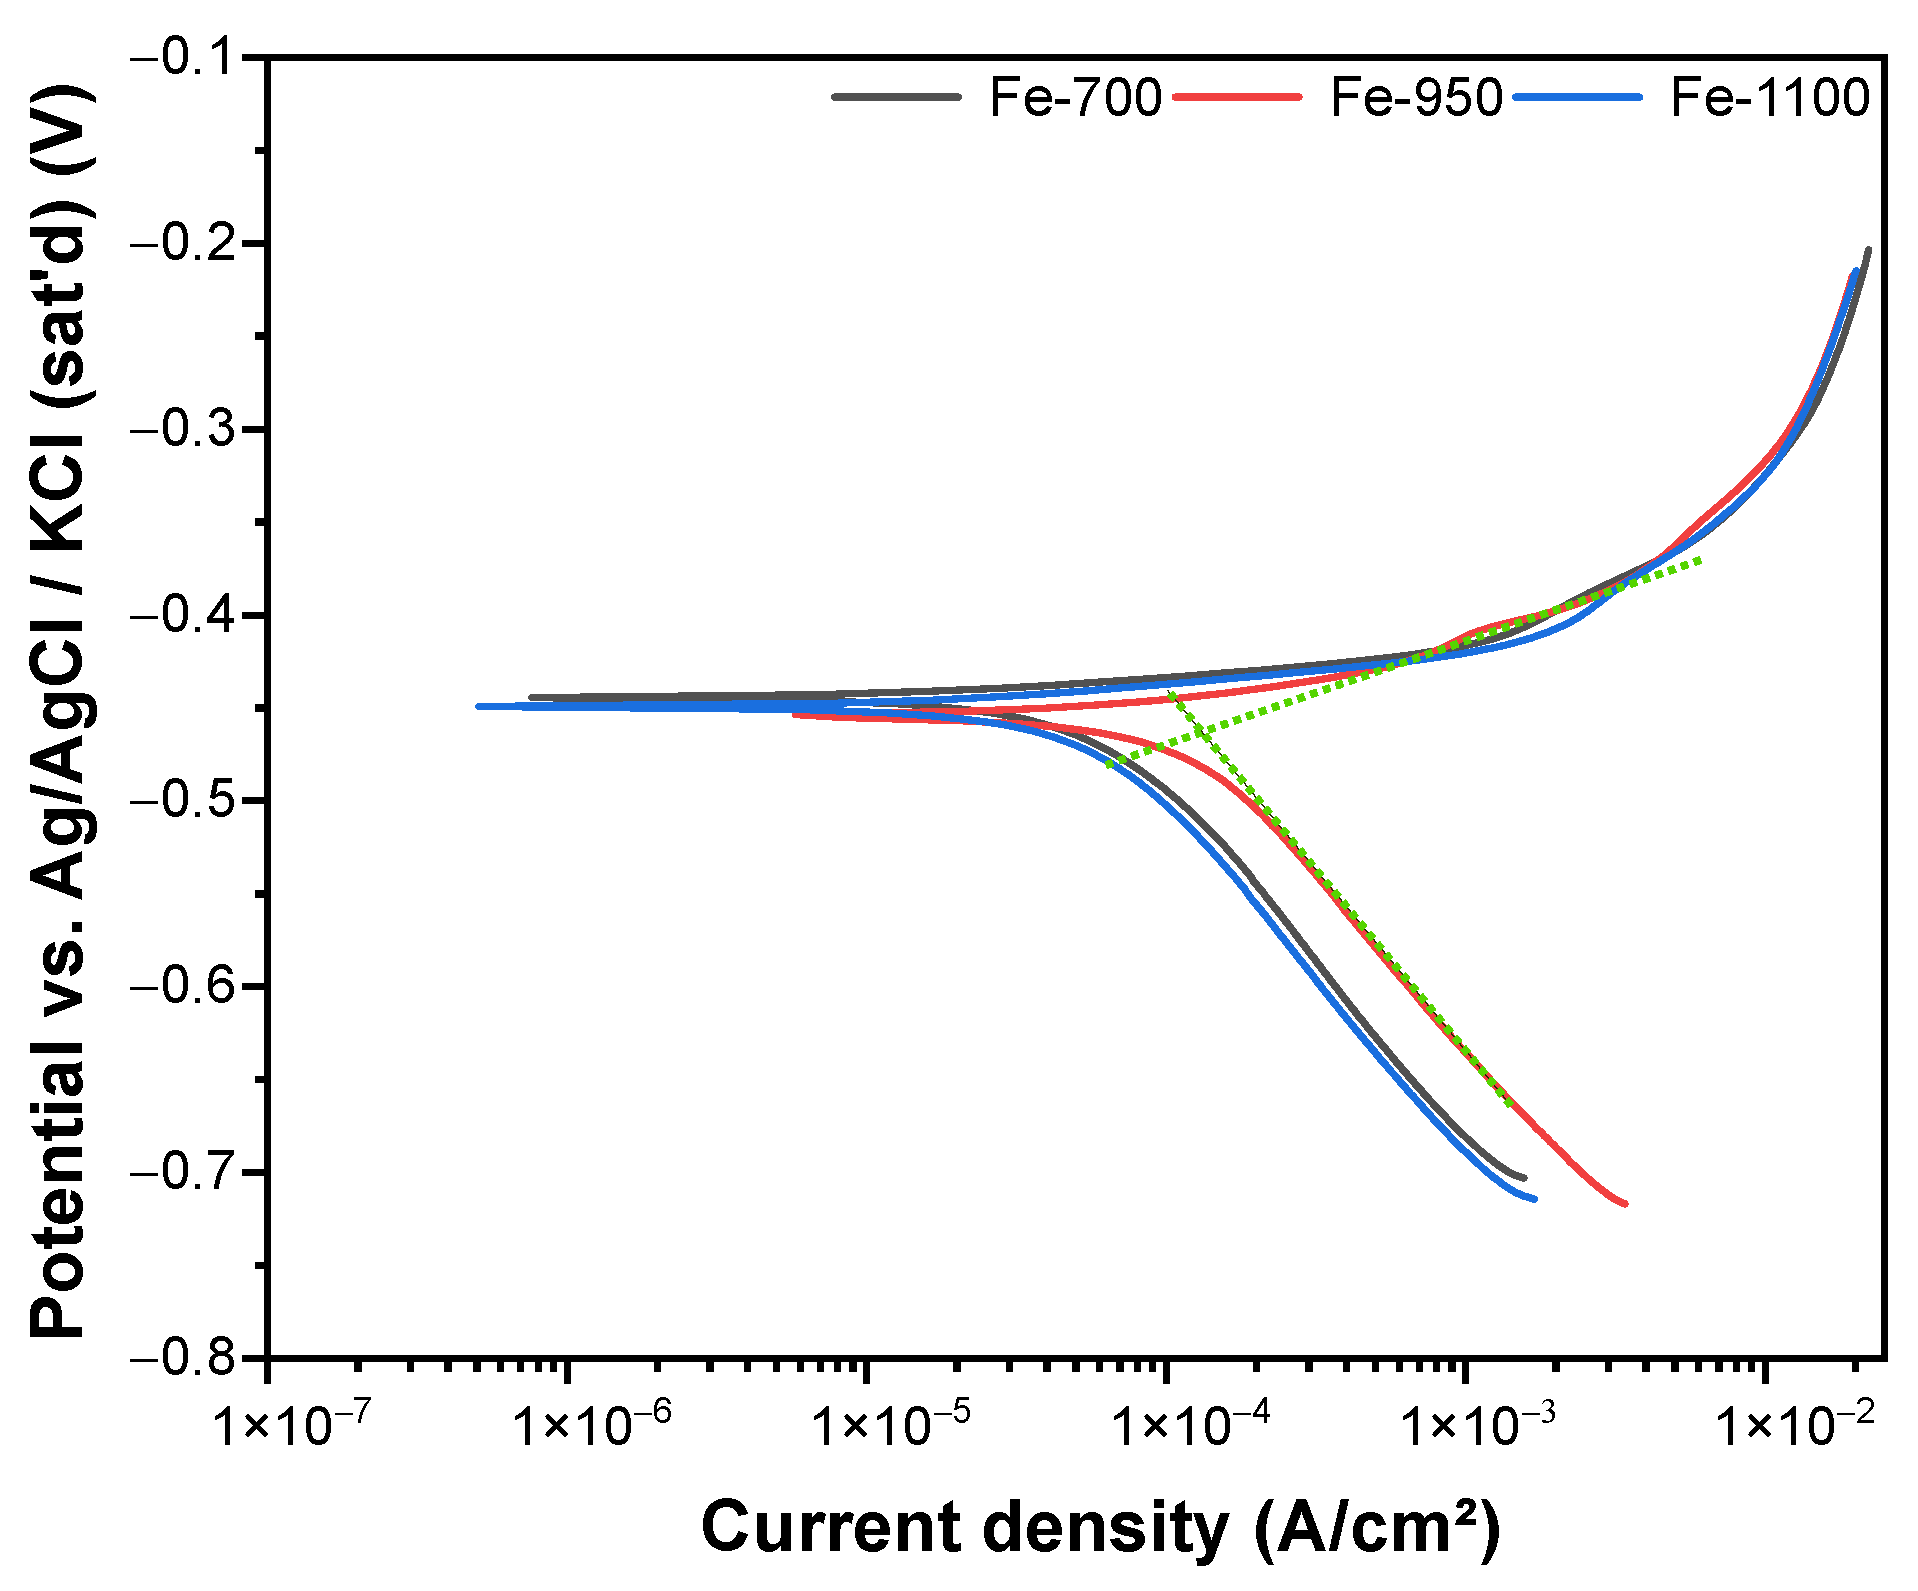
Potentiodynamic polarization—Figure 6 shows the potentiodynamic polarization curves of the samples in 0.1 M H2SO4 solution. The anodic and cathodic branches of the curves depict the metal dissolution and hydrogen evolution reaction behavior of the samples, respectively. The anodic branches of the samples nearly overlap over the entire potential scan. This indicates a common anodic reaction mechanism and similar reaction kinetics. The Bockris mechanism describes the anodic dissolution of iron [16]. The anodic reaction begins with the formation of adsorbed iron hydroxide in the first step, followed by de-electronation of the adsorbed iron hydroxide as the rate-determining step. The cathodic branches of the samples also show similar slopes, indicating a common reaction mechanism. The hydrogen evolution reaction (HER) is given by the Volmer–Heyrovsky mechanism [16]. The cathodic reaction begins with adsorption of hydrogen at a site on the metal surface, followed by desorption as a hydrogen gas molecule in the rate-determining step. However, among the samples, a noticeable difference is seen in the cathodic reaction kinetics. The cathodic current density of the Fe-950 sample is significantly higher than that of other samples over the entire range of the cathodic potential scan. Corrosion potential (Ecorr) and corrosion current density (icorr) values of the samples are obtained from the polarization curves by Tafel extrapolation and summarized in Table 4. The Ecorr values are similar across the samples with slight differences (limited to 3 mV). Fe-1100 and Fe-700 samples have close icorr values, while the Fe-950 sample shows a nearly 100% higher icorr value. The icorr values indicate that the corrosion rate increases in the sequence of Fe-1100, Fe-700, and Fe-950. The trend agrees with the charge–transfer resistance values obtained from the EIS measurements. The polarization curves of the samples show that the corrosion rate is governed by the cathodic hydrogen evolution reaction (HER) kinetics.
Morphology of corroded surface—Figure 7 shows the optical images of samples after the potentiodynamic polarization test in 0.1 M H2SO4 solution. The grains and grain boundaries are distinctly visible with an ‘etch-like’ appearance. Uniform corrosion attack is observed in the samples. Two interesting features can be noticed in these images. Firstly, some grains appear brighter and less severely attacked than other grains in the microstructure. Secondly, some grain boundaries appear to be more heavily attacked than others. The first feature can be associated with the anisotropic corrosion activity of grains based on their crystallographic orientation. The neighboring grains can form micro-galvanic couples based on their differences in corrosion activity. The second feature can be linked to the topography differences across the grain boundary. Depending on the corrosion activity differences of neighboring grains, the topography at grain boundary can exhibit shallow or steep variations [35,36,37].
4. Discussion
To understand the corrosion characteristics of microstructural features, samples with high purity were used in this study to eliminate the effects of chemical composition, elemental segregation, secondary phases, and inclusions on corrosion behavior. Subsequently, by selecting appropriate heat treatment, we obtained one sample with pronounced crystallographic texture (Fe-700) and two samples with nearly random texture (Fe-950 and Fe-1100), as confirmed by EBSD and XRD experiments. The EBSD results also show that the samples have similar dislocation density values and predominantly high-angle grain boundaries. Consequently, dislocation density and nature of grain boundary have limited impact in this corrosion study. The observed corrosion behavior of the samples hence can be directly linked to two microstructural features: grain size and crystallographic texture. In the particular case of Fe-950 and Fe-1100 samples, the grain size difference is the primary factor affecting their corrosion responses, while both grain size and crystallographic texture need to be considered for the corrosion behavior of the Fe-700 sample.
The potentiodynamic polarization results highlight the dominant role of cathodic hydrogen evolution reaction (HER) kinetics in dictating the corrosion behavior of iron. A similar effect has been reported in the work of Jinlong et al. [12]. According to Yule et al. [17], grain boundaries have a higher HER activity than the grains in low carbon steel. This explains the increase in corrosion rate of the Fe-950 sample relative to the Fe-1100 sample. The increase in grain boundary density with finer grains in the Fe-950 sample provides more active sites for the hydrogen evolution reaction, leading to a higher corrosion rate. The increase in grain boundary density was also used to explain the higher corrosion rate of fine-grained low alloy steel than its coarse-grained counterparts in NaCl solution [13]. On the other hand, the Fe-700 sample has a lower corrosion rate than the Fe-950 sample, despite having a higher grain boundary density. This contradictory corrosion behavior can only be explained by the dominant role of recrystallization texture, which overshadows the effect of reduction in grain size. Experimental orientation-dependent studies of pure iron [16] and low carbon steel [17] in sulfuric acid solution reported that the HER kinetics on low index grains follow the order {100} > {111} > {110}. A recent computational study stated that the corrosion susceptibility of different grain orientations of iron in acid environment follows the sequence {100} > {111} > {211} > {310} [38]. Thus, the slow HER kinetics of {111}-oriented grains lead to a lower corrosion rate of the Fe-700 sample than the Fe-950 sample. A combination of several factors such as Gibbs’ free energy of hydrogen adsorption, the work function of the electrode surface, the surface coverage of hydrogen and decomposed valence charge of the surface have been found to play a role in deciding the HER kinetics [16,39,40].
The findings in this study underline the complex corrosion trend of samples that arises from the interaction between the corrosion characteristics of microstructural features. By using controlled heat treatment and microstructure-corrosion property correlation, we demonstrate that the complex corrosion behavior of metals can be unraveled. This information in turn can be used to make suitable modifications in the material processing techniques for practical applications.
5. Conclusions
In this work, the roles of grain size and recrystallization texture are investigated on the corrosion behavior of pure iron in 0.1 M H2SO4 solution. The microstructure analyses of samples reveal grain size and crystallographic texture as the relevant features varying across the samples. The electrochemical experiments on samples lead to the following conclusions:
- The corrosion resistance decreases with a reduction in grain size. This conclusion is supported by the lower corrosion resistance of Fe-950 sample than the Fe-1100 sample;
- The recrystallization texture dominates grain size in influencing the corrosion behavior and leads to an improvement in corrosion resistance for a fine-grained sample. This conclusion is supported by the higher corrosion resistance of Fe-700 than Fe-950 sample;
- The corrosion behavior of iron in acidic medium is dominated by the cathodic hydrogen evolution reaction kinetics. This conclusion is supported by the potentiodynamic polarization measurements of the studied samples.
The study demonstrates that the complex corrosion behavior of metals can be elucidated through controlled material processing and then linking it to the corrosion characteristics of microstructural features.
Supplementary Materials
The following supporting information can be downloaded at: https://www.mdpi.com/article/10.3390/met13020388/s1, Figure S1: XRD spectra of the studied iron samples; Figure S2: Spatially resolved crystal orientation of samples, as measured by EBSD, color-coded with IPF along the normal direction (ND).
Author Contributions
Conceptualization, A.Y. and Y.G.-G.; methodology, A.Y. and Y.G.-G.; formal analysis, S.K., A.Y. and K.T.; investigation, S.K., A.Y. and K.T.; resources, J.S. and Y.G.-G.; writing—original draft preparation, S.K.; writing—review and editing, S.K., A.Y., K.T., J.S. and Y.G.-G.; supervision, J.S. and Y.G.-G.; project administration, J.S. and Y.G.-G.; funding acquisition, J.S. and Y.G.-G. All authors have read and agreed to the published version of the manuscript.
Funding
This research was carried out under Project No. F41.3.14546a in the framework of the Partnership Program of the Materials innovation institute, M2i (www.m2i.nl (accessed on 11 February 2023)) and the Foundation for Fundamental Research on Matter (FOM), which is part of the Netherlands Organisation for Scientific Research, NWO (www.nwo.nl (accessed on 11 February 2023)).
Institutional Review Board Statement
Not applicable.
Informed Consent Statement
Not applicable.
Data Availability Statement
The data presented in this study are available on request from the corresponding author.
Acknowledgments
Konstantina Traka thanks Maria Santofimia Navarro and Leo Kestens for the discussions on the expected microstructural outcome based on the treatment, and Ruud Hendrikx and Richard Huizenga for the discussions on the XRD measurements and processing.
Conflicts of Interest
The authors declare no conflict of interest.
References
- Peng-Heng, C.; Preban, A. The effect of ferrite grain size and martensite volume fraction on the tensile properties of dual phase steel. Acta Metall. 1985, 33, 897–903. [Google Scholar] [CrossRef]
- Takaki, S.; Kawasaki, K.; Kimura, Y. Mechanical properties of ultra fine grained steels. J. Mater. Process. Technol. 2001, 117, 359–363. [Google Scholar] [CrossRef]
- Hanamura, T.; Yin, F.; Nagai, K. Ductile-Brittle Transition Temperature of Ultrafine Ferrite/Cementite Microstructure in a Low Carbon Steel Controlled by Effective Grain Size. ISIJ Int. 2004, 44, 610–617. [Google Scholar] [CrossRef]
- Ariza, E.A.; Masoumi, M.; Tschiptschin, A.P. Improvement of tensile mechanical properties in a TRIP-assisted steel by controlling of crystallographic orientation via HSQ&P processes. Mater. Sci. Eng. A 2018, 713, 223–233. [Google Scholar] [CrossRef]
- Choi, S.H.; Kim, E.Y.; Woo, W.; Han, S.; Kwak, J. The effect of crystallographic orientation on the micromechanical deformation and failure behaviors of DP980 steel during uniaxial tension. Int. J. Plast. 2013, 45, 85–102. [Google Scholar] [CrossRef]
- Wang, X.; Muñiz-Lerma, J.A.; Attarian Shandiz, M.; Sanchez-Mata, O.; Brochu, M. Crystallographic-orientation-dependent tensile behaviours of stainless steel 316L fabricated by laser powder bed fusion. Mater. Sci. Eng. A 2019, 766, 138395. [Google Scholar] [CrossRef]
- Wang, P.j.; Ma, L.w.; Cheng, X.q.; Li, X.g. Influence of grain refinement on the corrosion behavior of metallic materials: A review. Int. J. Miner. Metall. Mater. 2021, 28, 1112–1126. [Google Scholar] [CrossRef]
- Miyamoto, H.; Yuasa, M.; Rifai, M.; Fujiwara, H. Corrosion Behavior of Severely Deformed Pure and Single-Phase Materials. Mater. Trans. 2019, 60, 1243–1255. [Google Scholar] [CrossRef]
- Ralston, K.D.; Birbilis, N. Effect of Grain Size on Corrosion: A Review. Corrosion 2010, 66, 075005–075005-13. [Google Scholar] [CrossRef]
- Wang, S.G.; Shen, C.B.; Long, K.; Yang, H.Y.; Wang, F.H.; Zhang, Z.D. Preparation and Electrochemical Corrosion Behavior of Bulk Nanocrystalline Ingot Iron in HCl Acid Solution. J. Phys. Chem. B 2005, 109, 2499–2503. [Google Scholar] [CrossRef]
- Wang, S.G.; Shen, C.B.; Long, K.; Zhang, T.; Wang, F.H.; Zhang, Z.D. The Electrochemical Corrosion of Bulk Nanocrystalline Ingot Iron in Acidic Sulfate Solution. J. Phys. Chem. B 2006, 110, 377–382. [Google Scholar] [CrossRef] [PubMed]
- Jinlong, L.; Hongyun, L. The effects of cold rolling temperature on corrosion resistance of pure iron. Appl. Surf. Sci. 2014, 317, 125–130. [Google Scholar] [CrossRef]
- Wang, P.; Ma, L.; Cheng, X.; Li, X. Effect of grain size and crystallographic orientation on the corrosion behaviors of low alloy steel. J. Alloys Compd. 2021, 857, 158258. [Google Scholar] [CrossRef]
- Fushimi, K.; Azumi, K.; Seo, M. Evaluation of Heterogeneity in Thickness of Passive Films on Pure Iron by Scanning Electrochemical Microscopy. ISIJ Int. 1999, 39, 346–351. [Google Scholar] [CrossRef]
- Schreiber, A.; Schultze, J.; Lohrengel, M.; Kármán, F.; Kálmán, E. Grain dependent electrochemical investigations on pure iron in acetate buffer pH 6.0. Electrochim. Acta 2006, 51, 2625–2630. [Google Scholar] [CrossRef]
- Fushimi, K.; Miyamoto, K.; Konno, H. Anisotropic corrosion of iron in pH 1 sulphuric acid. Electrochim. Acta 2010, 55, 7322–7327. [Google Scholar] [CrossRef]
- Yule, L.C.; Shkirskiy, V.; Aarons, J.; West, G.; Bentley, C.L.; Shollock, B.A.; Unwin, P.R. Nanoscale Active Sites for the Hydrogen Evolution Reaction on Low Carbon Steel. J. Phys. Chem. C 2019, 123, 24146–24155. [Google Scholar] [CrossRef]
- Hutchinson, W.B. Development and control of annealing textures in low-carbon steels. Int. Met. Rev. 1984, 29, 25–42. [Google Scholar] [CrossRef]
- Hölscher, M.; Raabe, D.; Lücke, K. Rolling and recrystallization textures of bcc steels. Steel Res. 1991, 62, 567–575. [Google Scholar] [CrossRef]
- Kestens, L.A.I.; Pirgazi, H. Texture formation in metal alloys with cubic crystal structures. Mater. Sci. Technol. 2016, 32, 1303–1315. [Google Scholar] [CrossRef] [Green Version]
- Young, J.Z.; Smith, S.W.J. The crystal structure of meteoric iron as determined by X-ray analysis. Proc. R. Soc. Lond. Ser. 1926, 112, 630–641. [Google Scholar] [CrossRef]
- Kurdjumow, G.; Sachs, G. Über den Mechanismus der Stahlhärtung. Zeitschrift für Phys. 1930, 64, 325–343. [Google Scholar] [CrossRef]
- Kestens, L.A.I.; Nguyen-Minh, T.; Petrov, R.H. The Role of Parent Phase Topology in Double Young–Kurdjumow–Sachs Variant Selection during Phase Transformation in Low-Carbon Steels. Metals 2022, 12, 939. [Google Scholar] [CrossRef]
- Brent, L.; Adams, J.K. EBSD-Based Microscopy: Resolution of Dislocation Density. Comput. Mater. Contin. 2009, 14, 185–196. [Google Scholar] [CrossRef]
- Bachmann, F.; Hielscher, R.; Schaeben, H. Texture Analysis with MTEX – Free and Open Source Software Toolbox. In Proceedings of the Texture and Anisotropy of Polycrystals III; Trans Tech Publications Ltd.: Baech, Switzerland, 2010; Volume 160, pp. 63–68. [Google Scholar] [CrossRef]
- Bachmann, F.; Hielscher, R.; Schaeben, H. Grain detection from 2d and 3d EBSD data—Specification of the MTEX algorithm. Ultramicroscopy 2011, 111, 1720–1733. [Google Scholar] [CrossRef]
- Jiang, J.; Britton, T.; Wilkinson, A. Measurement of geometrically necessary dislocation density with high resolution electron backscatter diffraction: Effects of detector binning and step size. Ultramicroscopy 2013, 125, 1–9. [Google Scholar] [CrossRef]
- Konijnenberg, P.; Zaefferer, S.; Raabe, D. Assessment of geometrically necessary dislocation levels derived by 3D EBSD. Acta Mater. 2015, 99, 402–414. [Google Scholar] [CrossRef]
- Bunge, H.J. 2—Orientation of Individual Crystallites. In Texture Analysis in Materials Science; Bunge, H.J., Ed.; Butterworth-Heinemann: Oxford, UK, 1982; pp. 3–41. [Google Scholar] [CrossRef]
- Bai, L.; Conway, B.E. AC Impedance of Faradaic Reactions Involving Electrosorbed Intermediates: Examination of Conditions Leading to Pseudoinductive Behavior Represented in Three-Dimensional Impedance Spectroscopy Diagrams. J. Electrochem. Soc. 1991, 138, 2897–2907. [Google Scholar] [CrossRef]
- Lai, W.Y.; Zhao, W.Z.; Yin, Z.F.; Zhang, J. Electrochemical and XPS studies on corrosion behaviours of AISI 304 and AISI 316 stainless steels under plastic deformation in sulphuric acid solution. Surf. Interface Anal. 2012, 44, 505–512. [Google Scholar] [CrossRef]
- Bellezze, T.; Giuliani, G.; Viceré, A.; Roventi, G. Study of stainless steels corrosion in a strong acid mixture. Part 2: Anodic selective dissolution, weight loss and electrochemical impedance spectroscopy tests. Corros. Sci. 2018, 130, 12–21. [Google Scholar] [CrossRef]
- Xu, W.; Han, E.H.; Wang, Z. Effect of tannic acid on corrosion behavior of carbon steel in NaCl solution. J. Mater. Sci. Technol. 2019, 35, 64–75. [Google Scholar] [CrossRef]
- Zhao, S.; Wang, Y.; Zhao, Y.; Sun, X.; Zhang, H.; Piao, H.G.; Zhang, Y.; Huang, Y. The effect of magnetic field pretreatment on the corrosion behavior of carbon steel in static seawater. RSC Adv. 2020, 10, 2060–2066. [Google Scholar] [CrossRef]
- Schreiber, A.; Rosenkranz, C.; Lohrengel, M. Grain-dependent anodic dissolution of iron. Electrochim. Acta 2007, 52, 7738–7745. [Google Scholar] [CrossRef]
- Schuh, C.A.; Anderson, K.; Orme, C. Rapid assessment of anisotropic surface processes: Experiments on the corrosion of Inconel 600. Surf. Sci. 2003, 544, 183–192. [Google Scholar] [CrossRef]
- Gray, J.; El Dasher, B.; Orme, C. Competitive effects of metal dissolution and passivation modulated by surface structure: An AFM and EBSD study of the corrosion of alloy 22. Surf. Sci. 2006, 600, 2488–2494. [Google Scholar] [CrossRef]
- Jin, H.; Blackwood, D.J.; Wang, Y.; Ng, M.F.; Tan, T.L. First-principles study of surface orientation dependent corrosion of BCC iron. Corros. Sci. 2022, 196, 110029. [Google Scholar] [CrossRef]
- Zeradjanin, A.R.; Grote, J.P.; Polymeros, G.; Mayrhofer, K.J.J. A Critical Review on Hydrogen Evolution Electrocatalysis: Re-exploring the Volcano-relationship. Electroanalysis 2016, 28, 2256–2269. [Google Scholar] [CrossRef]
- Gutić, S.J.; Dobrota, A.S.; Fako, E.; Skorodumova, N.V.; López, N.; Pašti, I.A. Hydrogen Evolution Reaction-From Single Crystal to Single Atom Catalysts. Catalysts 2020, 10, 290. [Google Scholar] [CrossRef] [Green Version]
Figure 1.
Heat treatment cycles used to obtain iron samples with different grain sizes.

Figure 2.
Optical images of (a) Fe-700, (b) Fe-950 and (c) Fe-1100 samples after etching in 2% Nital solution.
Figure 2.
Optical images of (a) Fe-700, (b) Fe-950 and (c) Fe-1100 samples after etching in 2% Nital solution.

Figure 3.
Spatially resolved crystal orientation color-coded with inverse pole figure for (a) Fe-700, (b) Fe-950 and (c) Fe-1100 samples, showing grain orientations along the sample normal direction (ND) (determined after decomposing the raw data into grains with at least 5° misorientation), (d) ODF = 45° section of Fe-700 sample generated from its EBSD data. EBSD maps of the samples prior to grain decomposition are provided in Figure S2 of Supplementary Materials.

Figure 4.
Measured pole figures (a) {110}, (b) {200}, and (c) {211} of Fe-950 sample. Corresponding pole figures of Fe-1100 sample in (d) {110}, (e) {200}, and (f) {211} orientations.
Figure 4.
Measured pole figures (a) {110}, (b) {200}, and (c) {211} of Fe-950 sample. Corresponding pole figures of Fe-1100 sample in (d) {110}, (e) {200}, and (f) {211} orientations.

Figure 5.
(a) Nyquist and (b) Bode plots of the samples in 0.1 M H2SO4 solution, (c) electrochemical equivalent circuit used to interpret the EIS data.
Figure 5.
(a) Nyquist and (b) Bode plots of the samples in 0.1 M H2SO4 solution, (c) electrochemical equivalent circuit used to interpret the EIS data.

Figure 6.
Potentiodynamic polarization curves of the samples measured in 0.1 M H2SO4 solution. Tafel extrapolation is shown here exemplarily in green dotted lines.
Figure 6.
Potentiodynamic polarization curves of the samples measured in 0.1 M H2SO4 solution. Tafel extrapolation is shown here exemplarily in green dotted lines.

Figure 7.
Optical images showing the surface morphology of (a) Fe-700, (b) Fe-950 and (c) Fe-1100 samples after potentiodynamic polarization test in 0.1 M H2SO4 solution.
Figure 7.
Optical images showing the surface morphology of (a) Fe-700, (b) Fe-950 and (c) Fe-1100 samples after potentiodynamic polarization test in 0.1 M H2SO4 solution.


Table 1.
Chemical composition of the iron samples.
| Element | Fe | C | N | Si | Mn | P | S | Al | Cr | Cu | Mo | Ni | Sn |
|---|---|---|---|---|---|---|---|---|---|---|---|---|---|
| wt.% | bal. | 0.001 | 0.003 | 0.003 | 0.04 | 0.003 | 0.003 | 0.004 | 0.014 | 0.007 | 0.001 | 0.012 | 0.002 |
Table 2.
Summary of microstructure parameters obtained from the EBSD data of the samples. (HAGB—High angle grain boundary, LAGB—Low angle grain boundary, GND—Geometrically necessary dislocation density).
Table 2.
Summary of microstructure parameters obtained from the EBSD data of the samples. (HAGB—High angle grain boundary, LAGB—Low angle grain boundary, GND—Geometrically necessary dislocation density).
| Sample | Average Grain Size (µm) | Grain Boundary Density (µm−1) | HAGB Density (µm−1) | LAGB Density (µm−1) | GND (m−2) |
|---|---|---|---|---|---|
| Fe-700 | 26 | 0.102 | 0.096 | 0.006 | 2.3 ± 0.4 × 10¹³ |
| Fe-950 | 53 | 0.052 | 0.050 | 0.002 | 7.9 ± 0.2 × 10¹² |
| Fe-1100 | 87 | 0.033 | 0.032 | 0.001 | 4.4 ± 0.2 × 10¹² |
Table 3.
Values of electrochemical parameters obtained after fitting the EIS measurements of samples in 0.1 M H2SO4 solution.
Table 3.
Values of electrochemical parameters obtained after fitting the EIS measurements of samples in 0.1 M H2SO4 solution.
| Sample | R1 (cm2) | R2 (cm2) | CPE-Y0 (−1cm−2sn × 10−5) | n | R3 (cm2) | L (H·cm2) |
|---|---|---|---|---|---|---|
| Fe-700 | 7 ± 2 | 380 ± 40 | 1.6 ± 0.1 | 0.80 ± 0.01 | 90 ± 30 | 30 ± 10 |
| Fe-950 | 7 ± 1 | 220 ± 50 | 2.3 ± 0.3 | 0.84 ± 0.02 | 60 ± 20 | 10 ± 4 |
| Fe-1100 | 11 ± 3 | 470 ± 40 | 1.7 ± 0.2 | 0.83 ± 0.01 | 130 ± 30 | 50 ± 10 |
Table 4.
Electrochemical parameters obtained by Tafel extrapolation of potentiodynamic polarization curves of samples in 0.1 M H2SO4 solution.
Table 4.
Electrochemical parameters obtained by Tafel extrapolation of potentiodynamic polarization curves of samples in 0.1 M H2SO4 solution.
| Sample | Ecorr (mV vs. Ag/AgCl) | icorr (µAcm−2) | anodic (mV dec−1) | cathodic (mV dec−1) |
|---|---|---|---|---|
| Fe-700 | −467 ± 7 | 83 ± 5 | 42 ± 5 | −198 ± 8 |
| Fe-950 | −466 ± 4 | 148 ± 4 | 49 ± 4 | −199 ± 4 |
| Fe-1100 | −465 ± 8 | 73 ± 1 | 45 ± 4 | −197 ± 10 |
Disclaimer/Publisher’s Note: The statements, opinions and data contained in all publications are solely those of the individual author(s) and contributor(s) and not of MDPI and/or the editor(s). MDPI and/or the editor(s) disclaim responsibility for any injury to people or property resulting from any ideas, methods, instructions or products referred to in the content. |
© 2023 by the authors. Licensee MDPI, Basel, Switzerland. This article is an open access article distributed under the terms and conditions of the Creative Commons Attribution (CC BY) license (https://creativecommons.org/licenses/by/4.0/).
Share and Cite
MDPI and ACS Style
Kar, S.; Yilmaz, A.; Traka, K.; Sietsma, J.; Gonzalez-Garcia, Y. Role of Grain Size and Recrystallization Texture in the Corrosion Behavior of Pure Iron in Acidic Medium. Metals 2023, 13, 388. https://doi.org/10.3390/met13020388
AMA Style
Kar S, Yilmaz A, Traka K, Sietsma J, Gonzalez-Garcia Y. Role of Grain Size and Recrystallization Texture in the Corrosion Behavior of Pure Iron in Acidic Medium. Metals. 2023; 13(2):388. https://doi.org/10.3390/met13020388
Chicago/Turabian StyleKar, Satyakam, Aytac Yilmaz, Konstantina Traka, Jilt Sietsma, and Yaiza Gonzalez-Garcia. 2023. "Role of Grain Size and Recrystallization Texture in the Corrosion Behavior of Pure Iron in Acidic Medium" Metals 13, no. 2: 388. https://doi.org/10.3390/met13020388
Note that from the first issue of 2016, this journal uses article numbers instead of page numbers. See further details here.