Article

Observation of Vapor Plume Behavior and Process Stability at Single-Track and Multi-Track Levels in Laser Powder Bed Fusion Regime

1
School of Mechanical Engineering and Automation, Beihang University, Beijing 100191, China
2
Science and Technology on Power Beam Processes Laboratory, AVIC Manufacturing Technology Institute, Beijing 100024, China
3
Key Laboratory of Aeronautical Technology on Additive Manufacturing, AVIC Manufacturing Technology Institute, Beijing 100024, China
4
Suzhou Automotive Research Institute, Tsinghua University, Suzhou 215134, China
*
Authors to whom correspondence should be addressed.
Metals 2021, 11(6), 937; https://doi.org/10.3390/met11060937
Submission received: 3 May 2021 / Revised: 3 June 2021 / Accepted: 7 June 2021 / Published: 9 June 2021
(This article belongs to the Special Issue Advanced Flexible Forming Technologies)

Abstract

:
Laser powder bed fusion (LPBF) is a promising additive manufacturing technology for producing metal parts with complex geometric features. However, the issue concerning process stability and repeatability still hinders its future acceptance by the industry. Gaining a better understanding of the behavior and stability of the evaporation process is an important step towards further insights into the complex interaction between laser and material. In this study, we used off-axis high-speed camera to observe vapor plume evolution in single-track formation on bare Ti-6Al-4V plates; the results showed that evaporation has a strong effect on melting quality even if the keyhole is not developed. We then expanded the experiments to multi-track level and found that the melting mode can change as the result of heat accumulation. The results show the possibility that keyhole regime may be reached even if it starts with a combination of parameters below the threshold for keyhole formation in single-track-level observation.

1. Introduction

Laser powder bed fusion (LPBF) is considered one of the most successful and promising additive manufacturing (AM) technologies because it can produce end use metal structures directly from a computer-aided design (CAD) model with reasonable part quality and attractive design freedoms [1,2]. In LPBF, a thin layer of powder is applied on a bare substrate and one or more laser beams are used to melt certain area track-by-track to form the first and lowest slice of the part. Then, the substrate is lowered by a predefined layer thickness for the next layer to be deposited, and the 2D laser scan process is repeated layer-by-layer until the 3D part is finished [3]. The repeated melting and solidification process is thus the essential point in determining the success of printing process and final part quality. Although the market for LPBF is expanding rapidly in recent years, process stability, reliability, and repeatability still remain as challenges to overcome for its potential to be fully realized [4].
The laser material interaction in LPBF is a complex process related to multiple interdependent factors [5], and a combination of complex phenomena can be observed during laser irradiation on a powder bed. Evaporation of material is one of the common phenomena in the LPBF process and it plays a vital role in determining the melting mode. In LPBF, the high-density laser beam used as heat source is usually sufficient enough to vaporize the metal [6], and the vapor in turn exerts a recoil pressure onto the melt pool surface from which it escapes. If the recoil pressure is minor and negligible, it is assumed that the energy enters the melt pool mainly by conduction. On the other hand, if a certain threshold is reached and exceeded, the recoil pressure can overcome the surface tension, penetrate deep into the melt pool surface, and lead to a keyhole melting mode. In this regime, laser absorption is significantly enhanced by the multi-reflection on the keyhole wall and the melt pool can be much deeper than in conduction mode [7,8]. Keyhole mode laser melting is generally undesirable because is often extremely unstable due to multi-reflection of laser on the keyhole wall and the collapse of keyhole can lead to excessive porosity in the final part [2,8,9,10,11]. Besides keyhole formation process and porosity, vapor behavior is also closely related to complex phenomena during laser–material interaction, such as powder layer denudation [1,12] and spattering [13,14,15], and final part quality [14,16].
For this reason, the complex physics of the formation of keyhole and keyhole related defects has drawn increasing attraction, and is extensively investigated using direct ultrahigh-speed X-ray observation of liquid–vapor interface [6,10,17] or multi-physical numerical simulation [18,19,20].
To our best knowledge, however, the above-mentioned direct high-speed X-ray observation of keyhole formation and complex multi-physical simulations are to date mainly conducted at single-track level. Moreover, process window prediction for new powders also to some extent relies on the observation result of single track quality. Therefore, whether the laser–melt interaction observed in the single-track level will be influenced by the heat accumulation along the printing process becomes a practical concern and it is still not fully addressed.
In this study, we chose vapor plume as a signal of process stability and performed high-speed observation at both single-track and multi-track levels. One reason is that plume behavior is the direct by-product of laser irradiation and is closely related with the interface at which the laser interacts with material [21]. This interface is the boundary at which the atoms gain energy from the laser beam to escape as vapor [22], and through which energy enters the melt pool. As the vapor flows in a direction perpendicular to the interface from which it escapes [14,23,24], the direction and stability can present useful information about the laser–liquid interaction. Thus, based on the interrelation between vaporization process, it might be safe to say, during laser melting of material, if the vapor plume behavior is not stable, neither is the heat transfer process. In this vein, fluctuations of the vapor plume can be identified as a signal of interface variations and a change in plume intensity can indicate instability of heat transfer into the melt pool. Another reason is observation of vapor plume can be conducted with almost all commercially available LPBF systems, making it easier to be used in real-life scenarios as an option of process evaluation.
Although separate powder particles can be a major source of instability in some regimes [16], the powder layer remains a secondary factor in keyhole formation [6]. The main interest of this study is to identify a regime that can be used in LPBF to avoid complex keyhole instability, and evaluation to what possible extent the results at single track level will be influenced by the heat accumulation in LPBF. Therefore, the experiments were conducted on bare Ti-6Al-4V plates to get insights into process stability of laser–melt interaction in LPBF regimes, as a first step toward better understanding of complex laser–powder–plate interactions.
The study reported here was structured as follows.
The evolution of vapor plume in single track formation was first studied with in situ high-speed observation in combination with ex situ evaluations. We found that the parameters we used for single tracks all fall into a forced conduction regime as identified by Fabbro [24], where the vapor-induced recoil pressure created a depression onto the melt pool surface. The depression is not as deep as a keyhole but still plays a vital role in laser-material interaction. Then, we expanded the high-speed observation to multi-track laser scan scenarios and found that the threshold for keyhole formation can be reached as a result of heat accumulation. There was a sudden sharp transition from forced conduction mode to keyhole mode, which is very similar to the depression–keyhole transition reported in the high-speed X-ray observation of keyhole formation in stationary laser illumination [6]. The property of the melting mode transition can be explained by the laser-trap effect at a critical angle of depression wall inclination [19]. The heat transfer process in forced conduction mode and regime shift under constant parameters in multi-track scan scenarios were then analyzed, respectively.

2. Materials and Methods

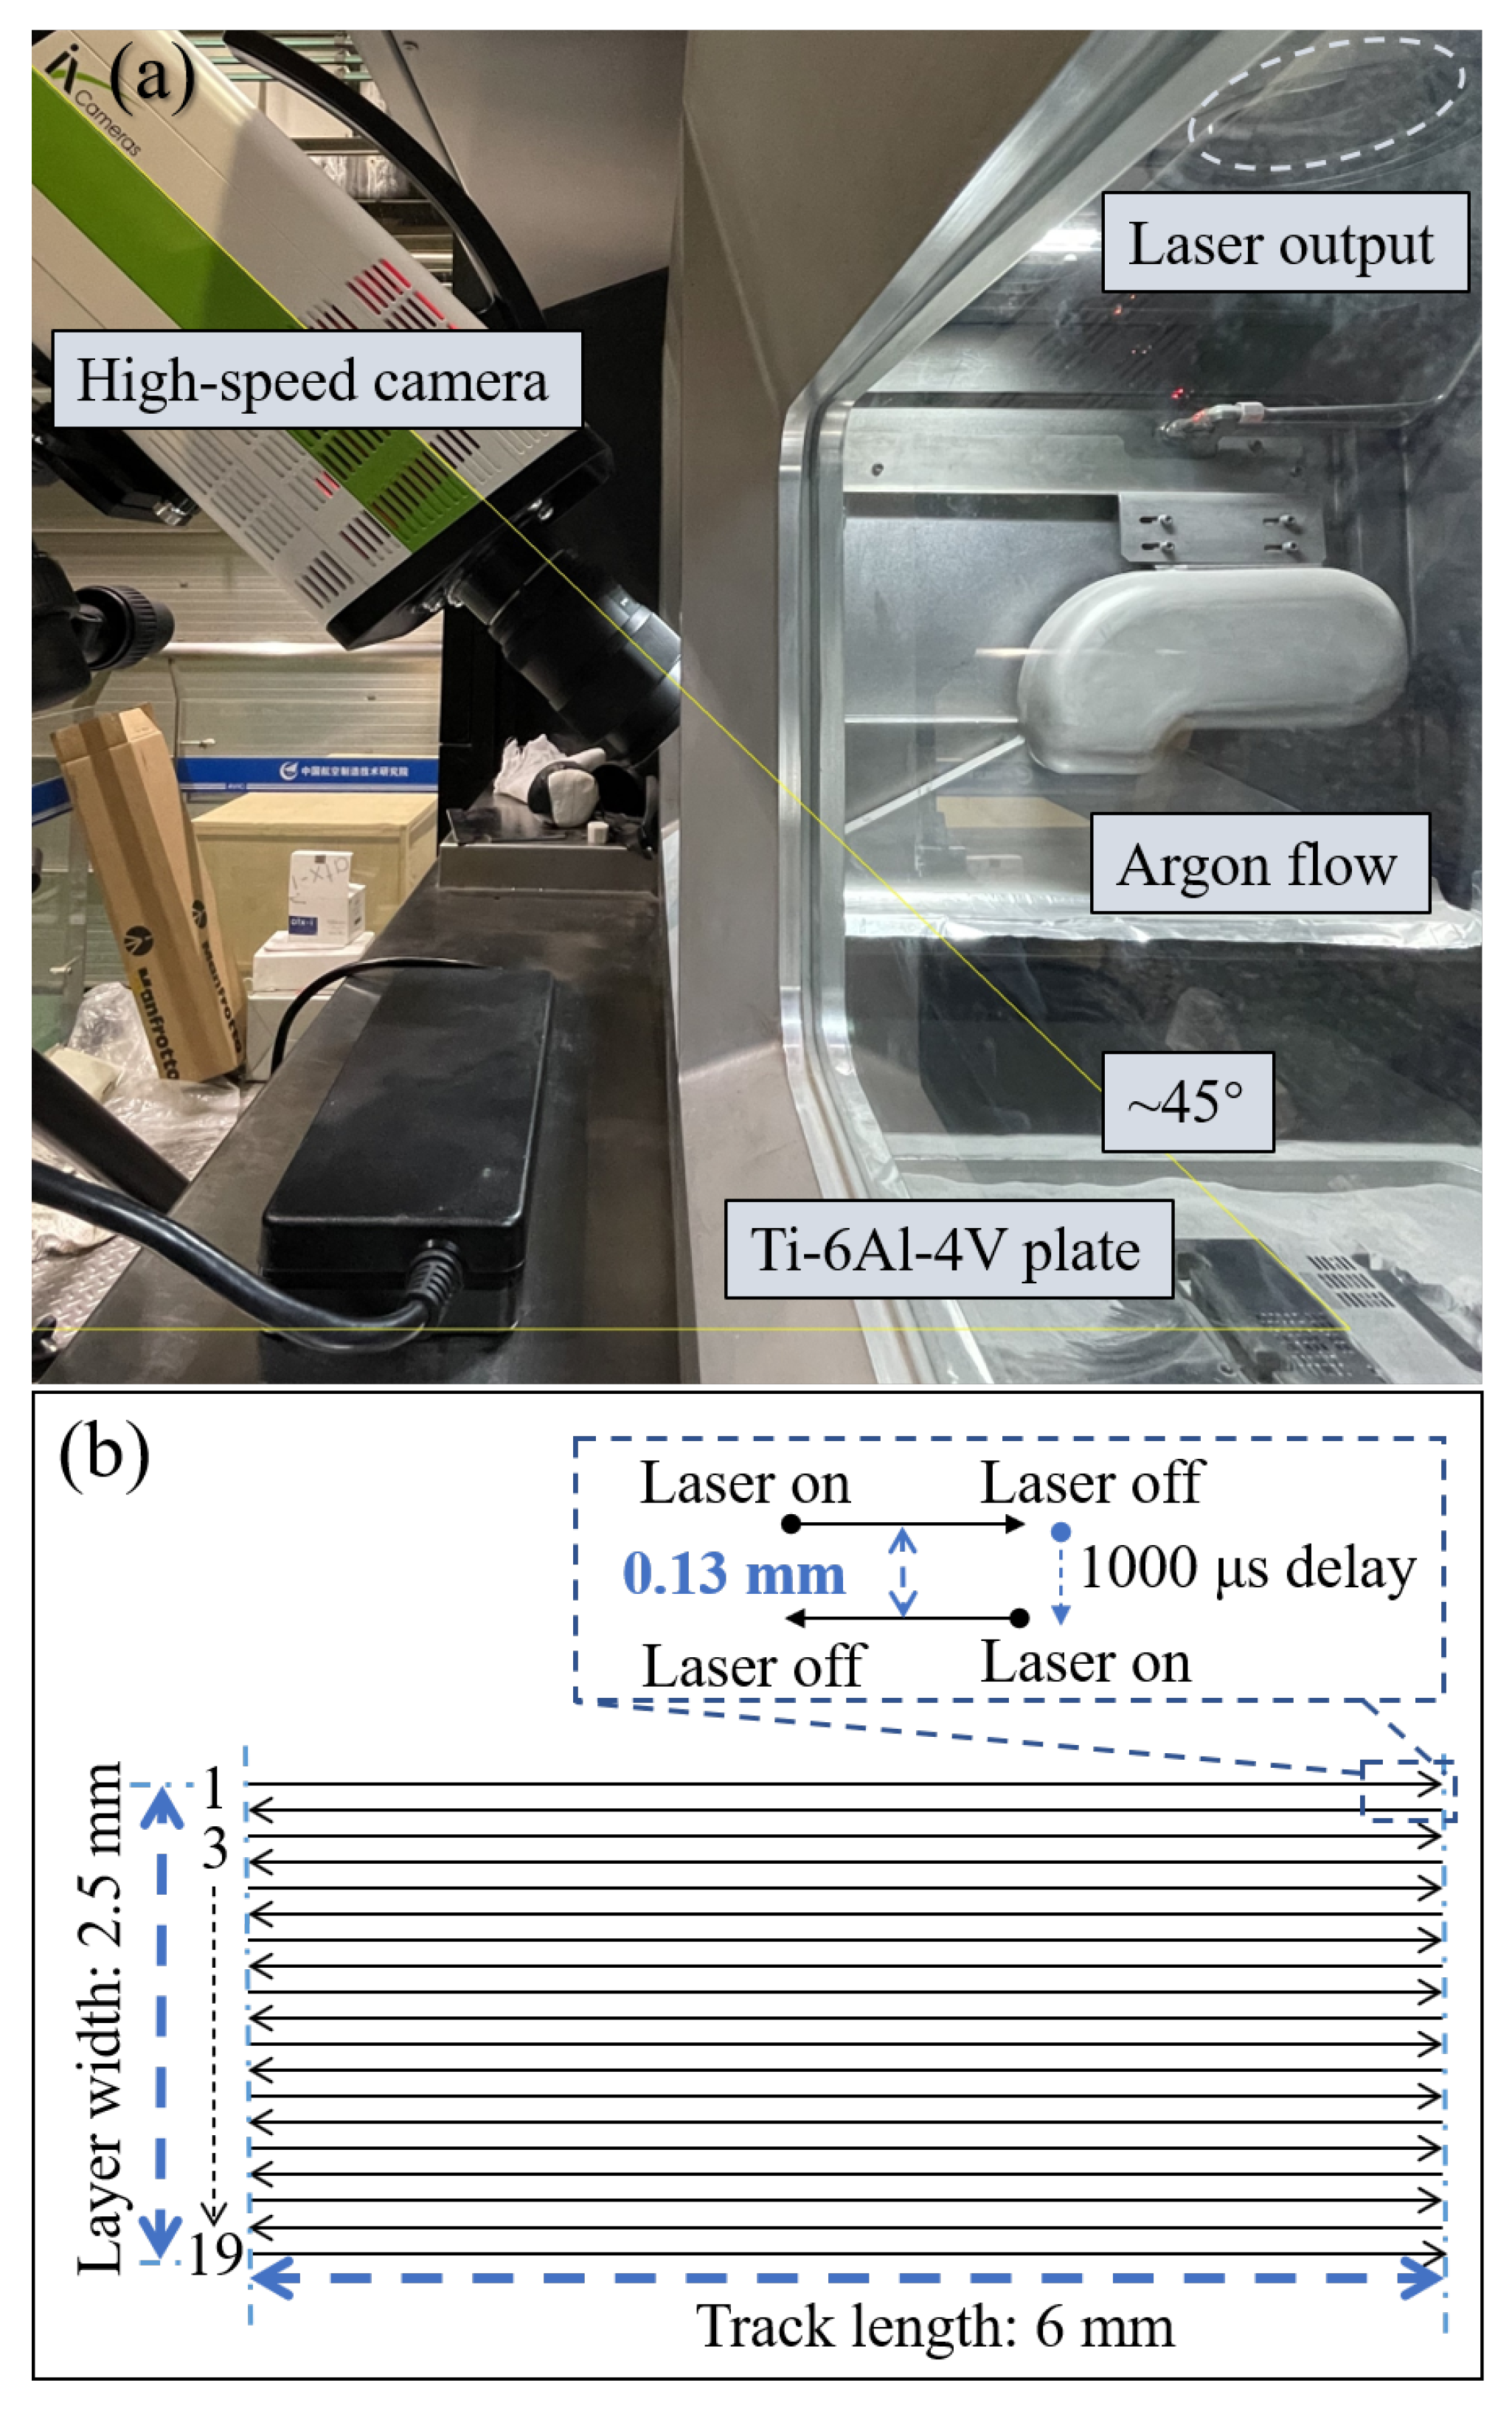
2.1. Material and Experimental Setup

The experimental setup is shown in Figure 1a. All experiments in this work were conducted in a self-developed laser powder bed fusion system. This system uses a continuous wave laser (IPG Photonics) at wavelength λ = 1070 nm, with a maximum output power P = 1000 W. The focused laser beam diameter σ = 100 m ( 1 / e 2 , Gaussian mode) at the build platform.
Bare Ti-6Al-4V plates was used in this study, the dimensions of the experimental plates were 118 mm long × 118 mm wide × 15–18 mm thick. Top surfaces were polished and cleaned before laser irradiation. Single track (30 mm) and multi-track (19-track single layer scan, 6 mm long × 2.5 mm wide, Figure 1b) laser melting experiments were performed under different laser power (300–500 W) and scan speeds (0.6–1.5 mm/s), the details of parameter sets are listed in Table 1. All the experiments were carried out under argon flow with chamber oxygen content controlled below 0.1%, to avoid possible oxidization.
The geometry of depression zone at the end of each single track and the surface of scanned layer were measured with a Zygo NexView 3D optical profilometer. The profilometer is capable of reaching a height resolution of less than 1 nm and presents a melting quality with sufficient accuracy. After top-view observation the samples were sectioned to evaluate the melt pool penetration under different parameter sets and their relationship with vapor behavior.

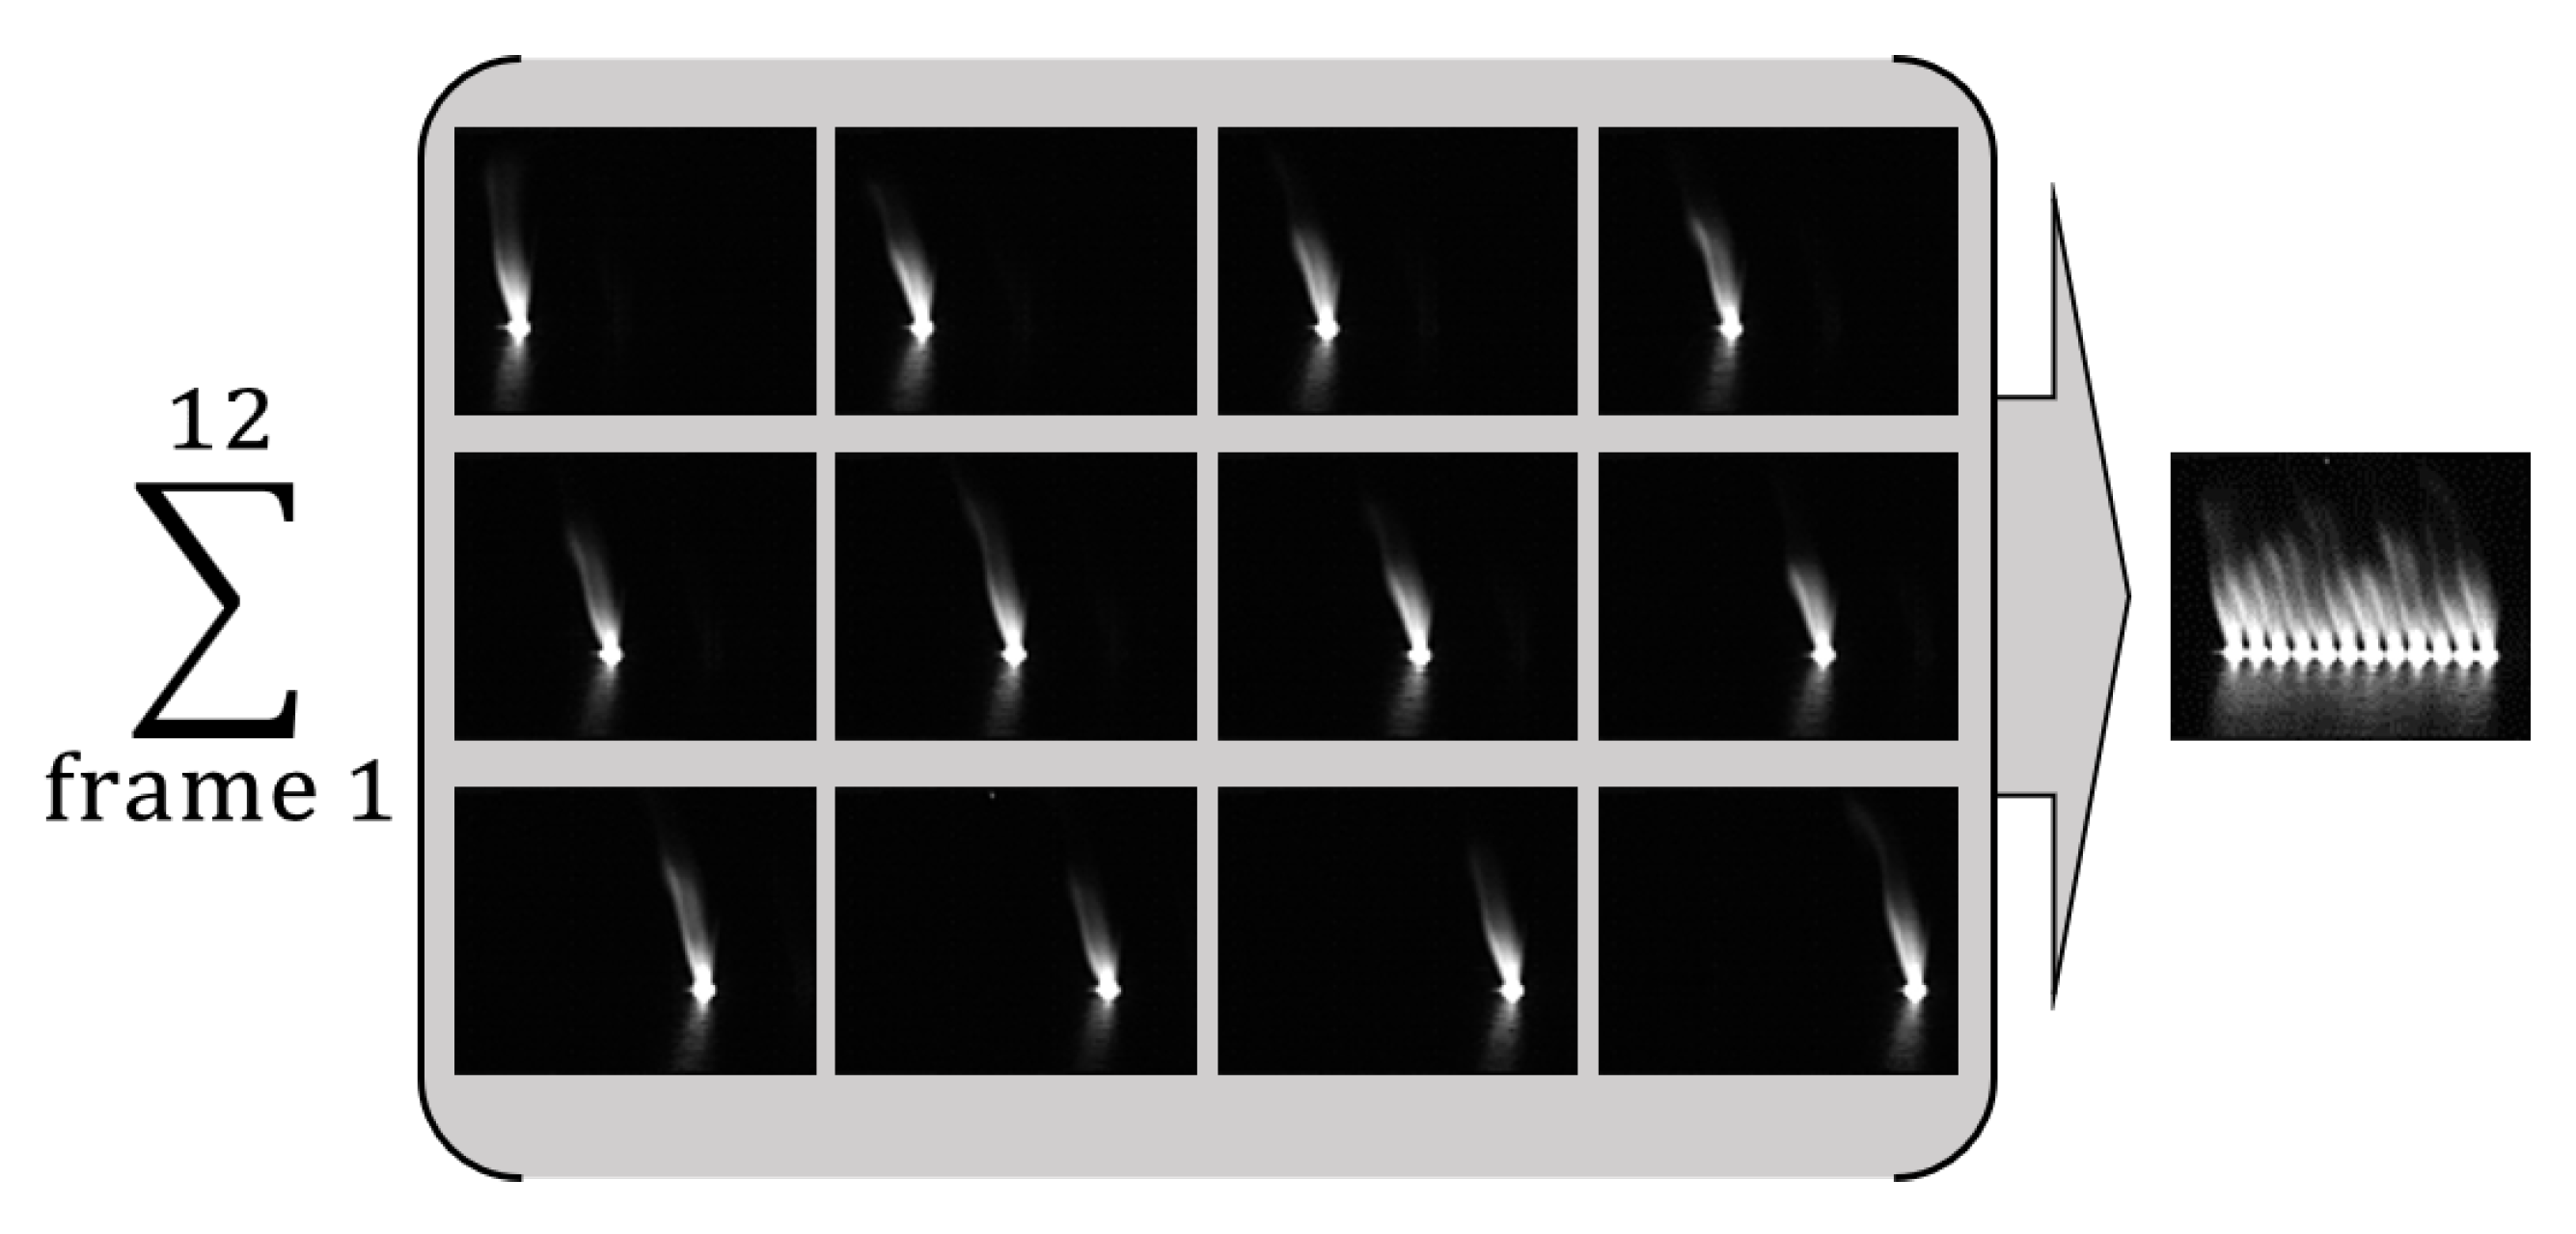
2.2. High-Speed Observation and Image Processing

Vapor plume behavior under different laser parameters was recorded using an i-SPEED high-speed CMOS camera (ix-cameras, the UK) positioned outside the chamber window, pointing at the build platform at 45°. The recording rate was fixed at 50,000 frames per second (fps) for single-track formation experiments to ensure good temporal resolution, and at 20,000 fps for multi-track laser scanning to reduce the video size and file saving duration. The resulting exposure times are 20 μs and 50 μs, respectively. No external illumination was applied during the laser melting experiments.
Images taken from the high speed observation were superimposed with a careful selection of temporal interval for better clarity. This maneuver enables that the information can be presented and analyzed at track level, making some phenomena easier to be visualized, as exemplified by Figure 2.

3. Results

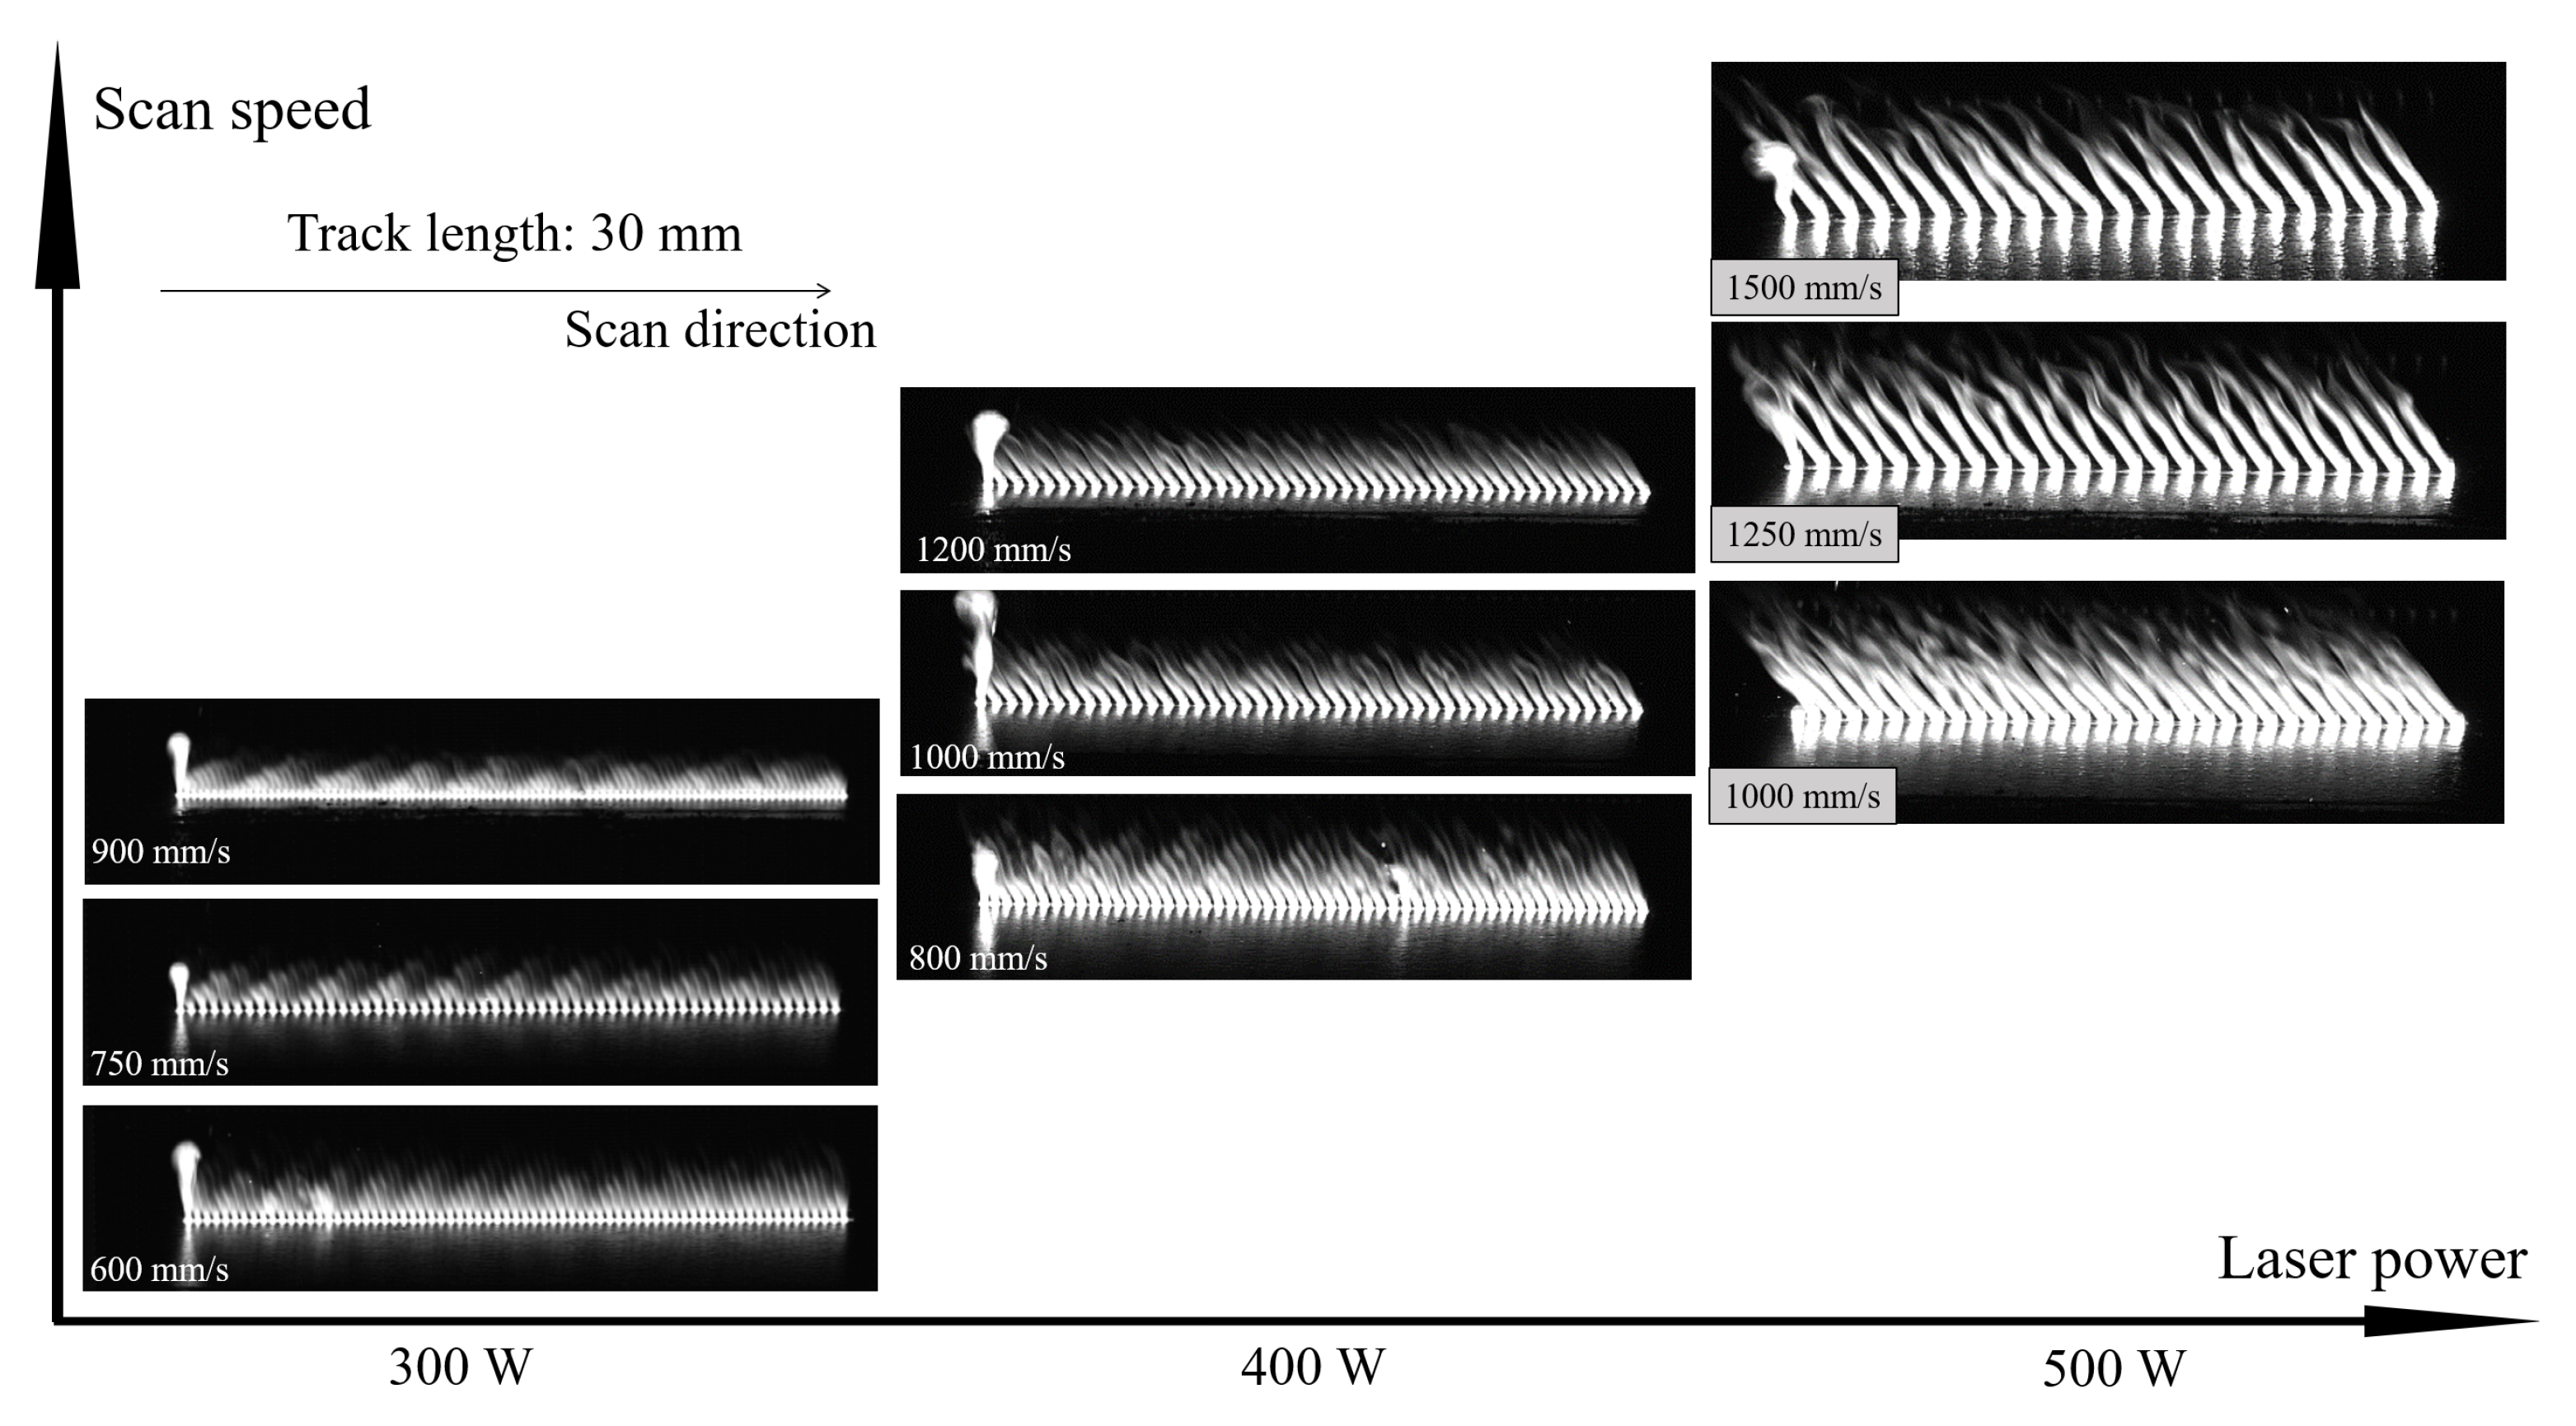
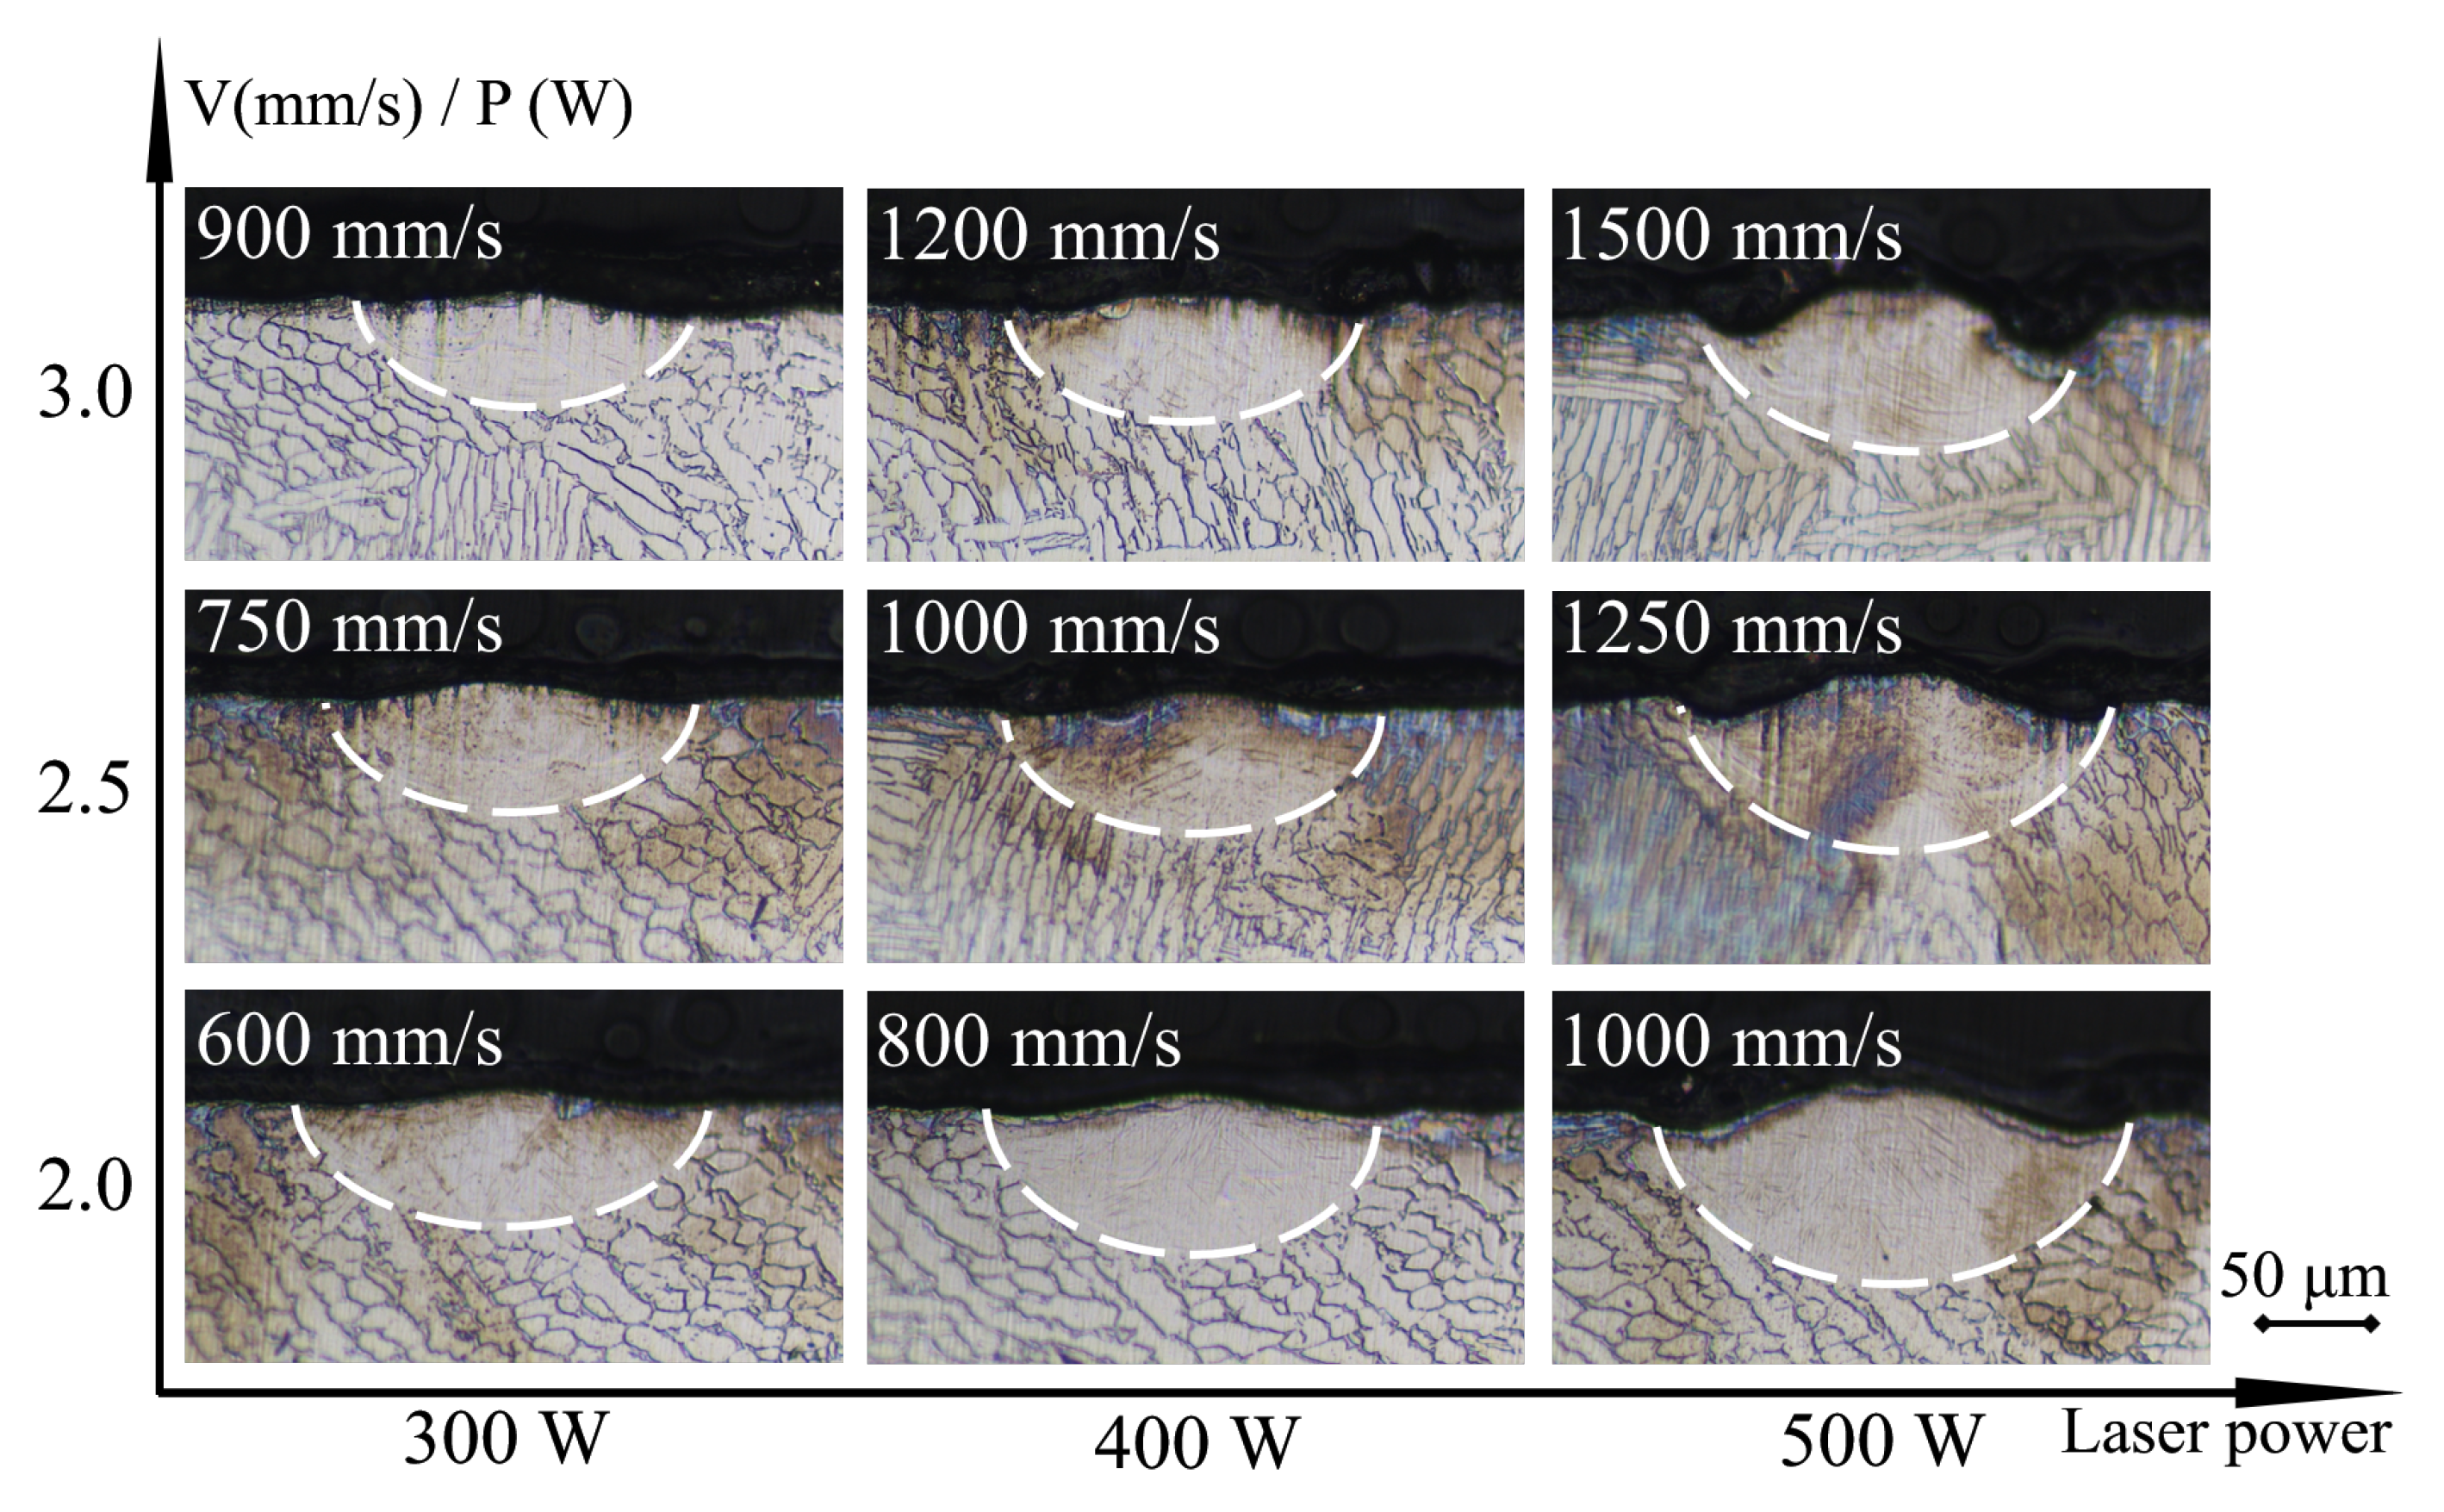
3.1. Single Track Formation

3.1.1. Plume Behavior along the Track

Superimposed images of the plume evolution during track formation under different laser parameters are shown in Figure 3. Plume behavior evolves in a similar manner for the parameter we choose in the single-track formation, as can be described as follows.
When the laser was turned on (set as t = 0 μs), a small melt pool can be seen in the video (the very first frame within each video). Without exception, a vapor plume began to rise vertically above the melt pool immediately in frame 2 of each video, immediately after the melt pool was observed. This means the melt pool surface was heated to boiling point and vaporization started at a very fast rate (within 20 μs). The vertical plume expanded gradually and reached its maximum size after a short time, this process lasted about 600 μs (about 30 frames). Then plume inclined backwards from the vertical, the angle stayed in a small range about 23–29° (in plane angle), and remained stable thereafter along each track.
Globally, the plume size increases with laser power, while it does not show any notable trend within the speed range at each fixed power. There were some irregular points where the plume ejection suddenly exposed and then returned to its normal level; we believe these points were the result of random variations in surface quality on the plates, and their existence does not compromise the overall trend of vapor plume evolution. It is also interesting to note that the plume length changed with an obvious periodicity when P = 300 & 400 W, if we choose a suitable frame interval it can be seen in the superimposed images (note the left and middle column in Figure 3. However, we failed to visualize a similar periodicity at P = 500 W, maybe because the periodicity was compromised by higher vaporization rate due to power intensity increase.

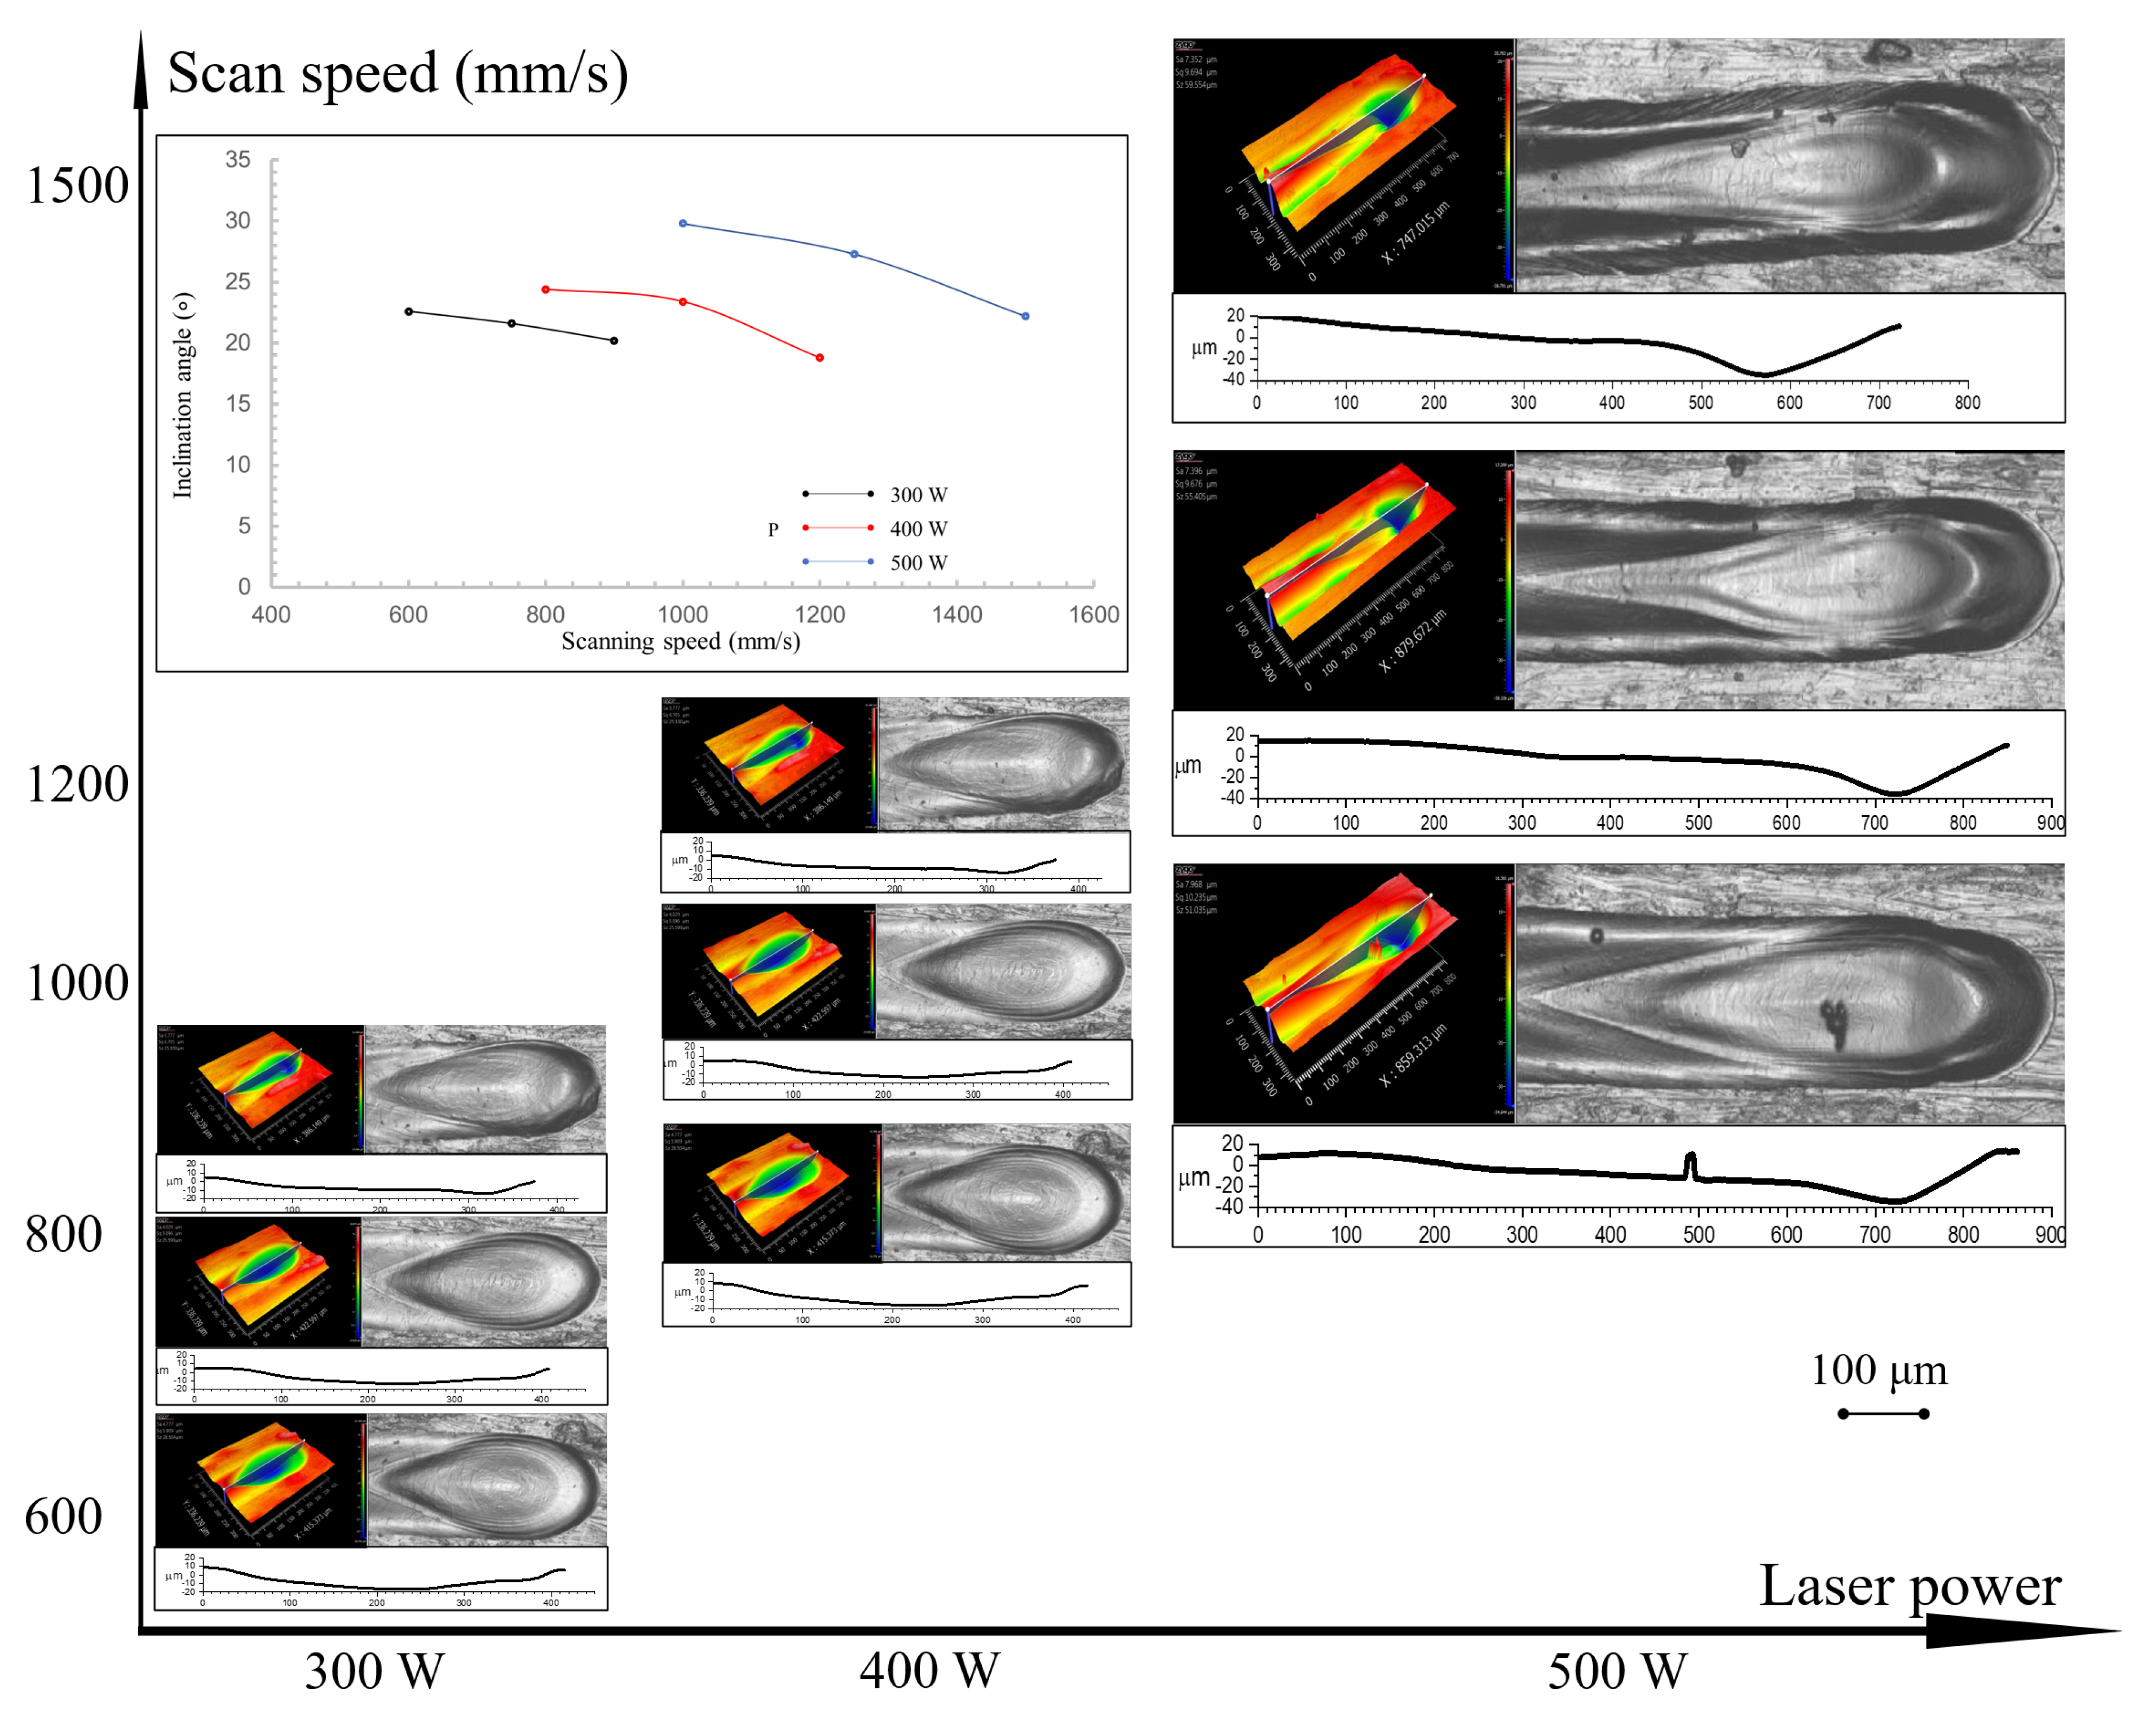
3.1.2. Depression at the Track End

The depression zone at the end of each track are mapped as a function of laser power and scan speed in Figure 4. As shown the supplementary videos, after the laser turn-off, the melt front solidified within one exposure time (20 μs at the framing rate of 50 k fps). In contrast, the rear parts of melt pool can remain visible for as long as 10 frames (200 μs) before fading into complete darkness. This is not surprising because the melting front wall is thinner than other parts due to vapor-induced recoil pressure and it is surrounded by the cold un-melted material. Therefore, the depression front wall area has the fastest cooling rate and solidifies first. For this reason, it is reasonable to assume that the geometry at the end of each track makes a reasonable estimate of the depression on melt pool geometry, and the front inclination angle can be preserved for measurement due to the ultra-fast solidification process. We measured the angle of the depression front wall from horizontal direction at the end of each track. The angle increases notably with laser power, from 20–22° for P = 300 W to 22–29° for P = 500 W, and decreases slightly with scan speed v at each power level, respectively. Also, as shown in Figure 4, both the length and width of the depression increased with laser power and decreased slightly with the increase of scan speed.

3.1.3. Melt Pool Cross-Section Analysis

The melt pool under all of the parameters assumed semi-elliptical shape, as shown in Figure 5. Both the melt pool width and depth decreased with the increase of scan speed at all three power levels, due to the decreased energy input. We also noticed that, at each fixed linear energy density level (defined as the ratio of P / v , corresponding to three rows in Figure 5), an increase in laser power makes the melt pool both deeper and wider, with the effects of decreased irradiation duration due to corresponding speed increase overwhelmed. This trend is in good agreement with the observation of the depression size and shape at the track tail.
Although the cross section had a typical shape as in the well-known conduction mode, this regime lies between conduction and keyhole mode. On one hand, it is different from conduction mode because the boiling point is reached and the vapor-induced recoil pressure creates a depression on the melt pool surface. On the other hand, however, it is different from the keyhole mode because the depression is not steep enough to trap the laser beam and improve energy absorption by multi-reflection, and it therefore cannot be identified as a keyhole. This regime was previously observed by Lee et al. in stationary laser welding [25], and then recently identified as “forced conduction” regime by R. Fabbro et al. [19,24]. The laser power is absorbed at the laser–melt pool interface (in this regime, the depression front wall), is transferred into the material by both conduction and convection, without multi-reflection involved.

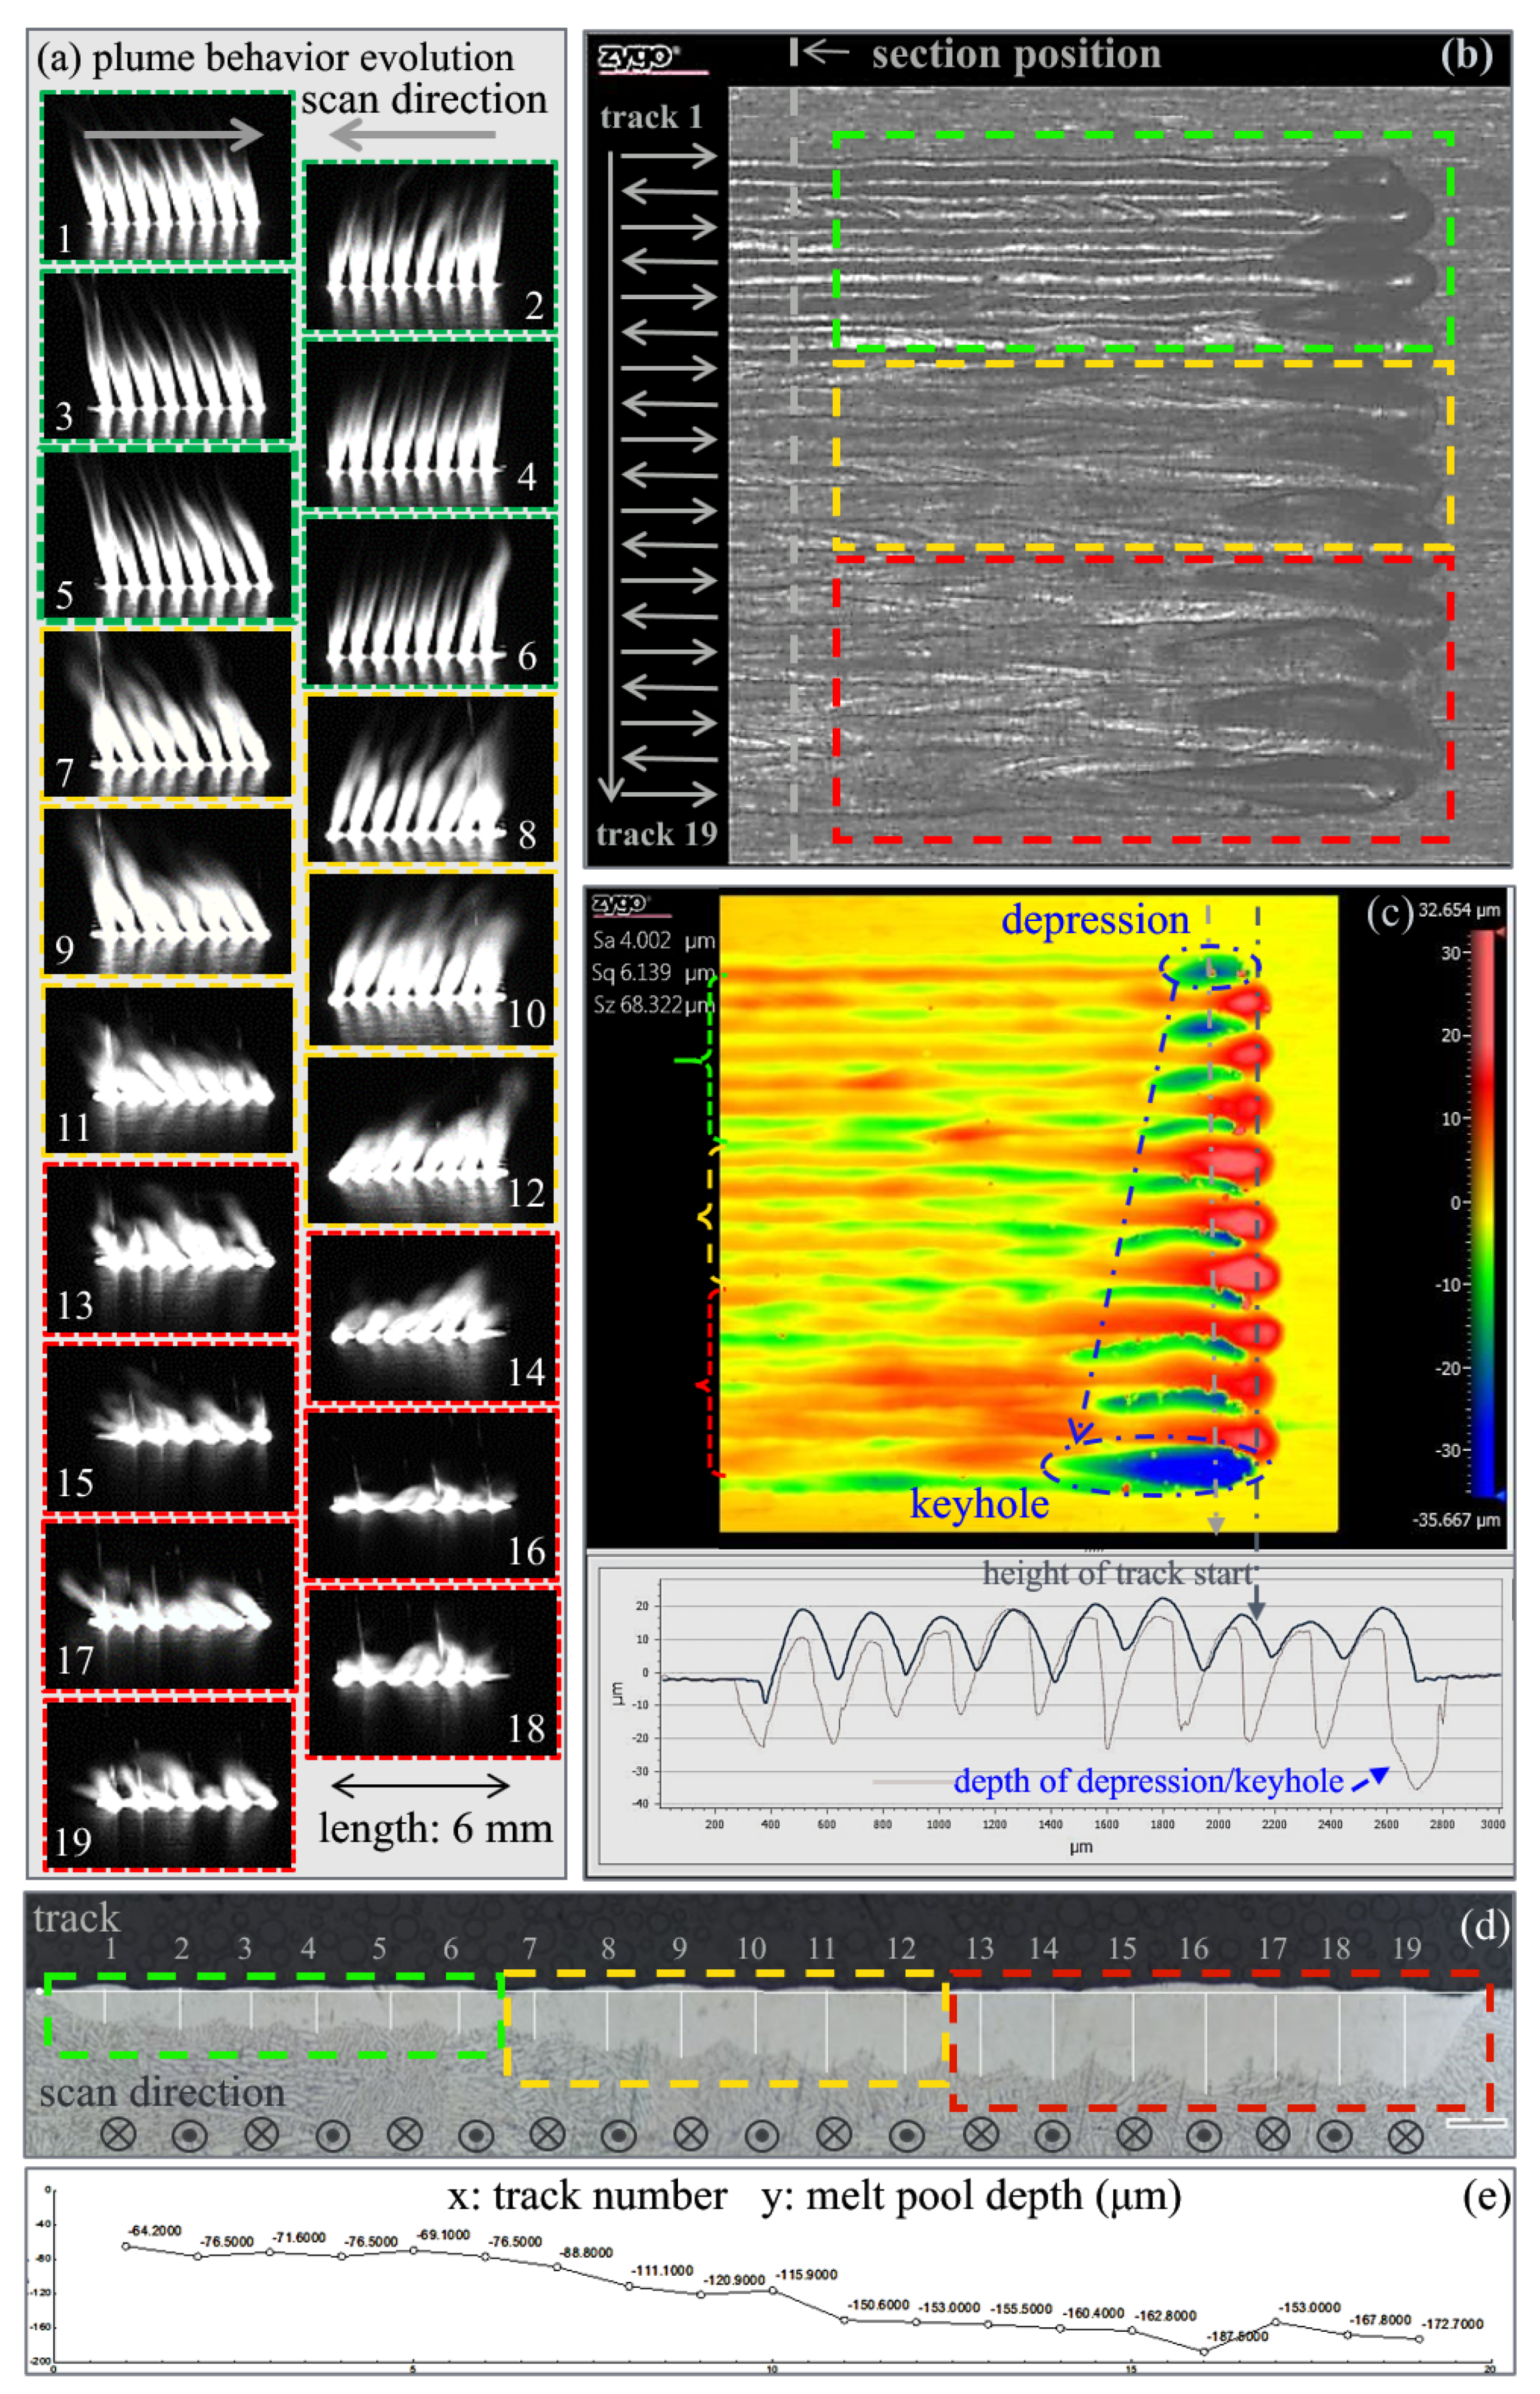
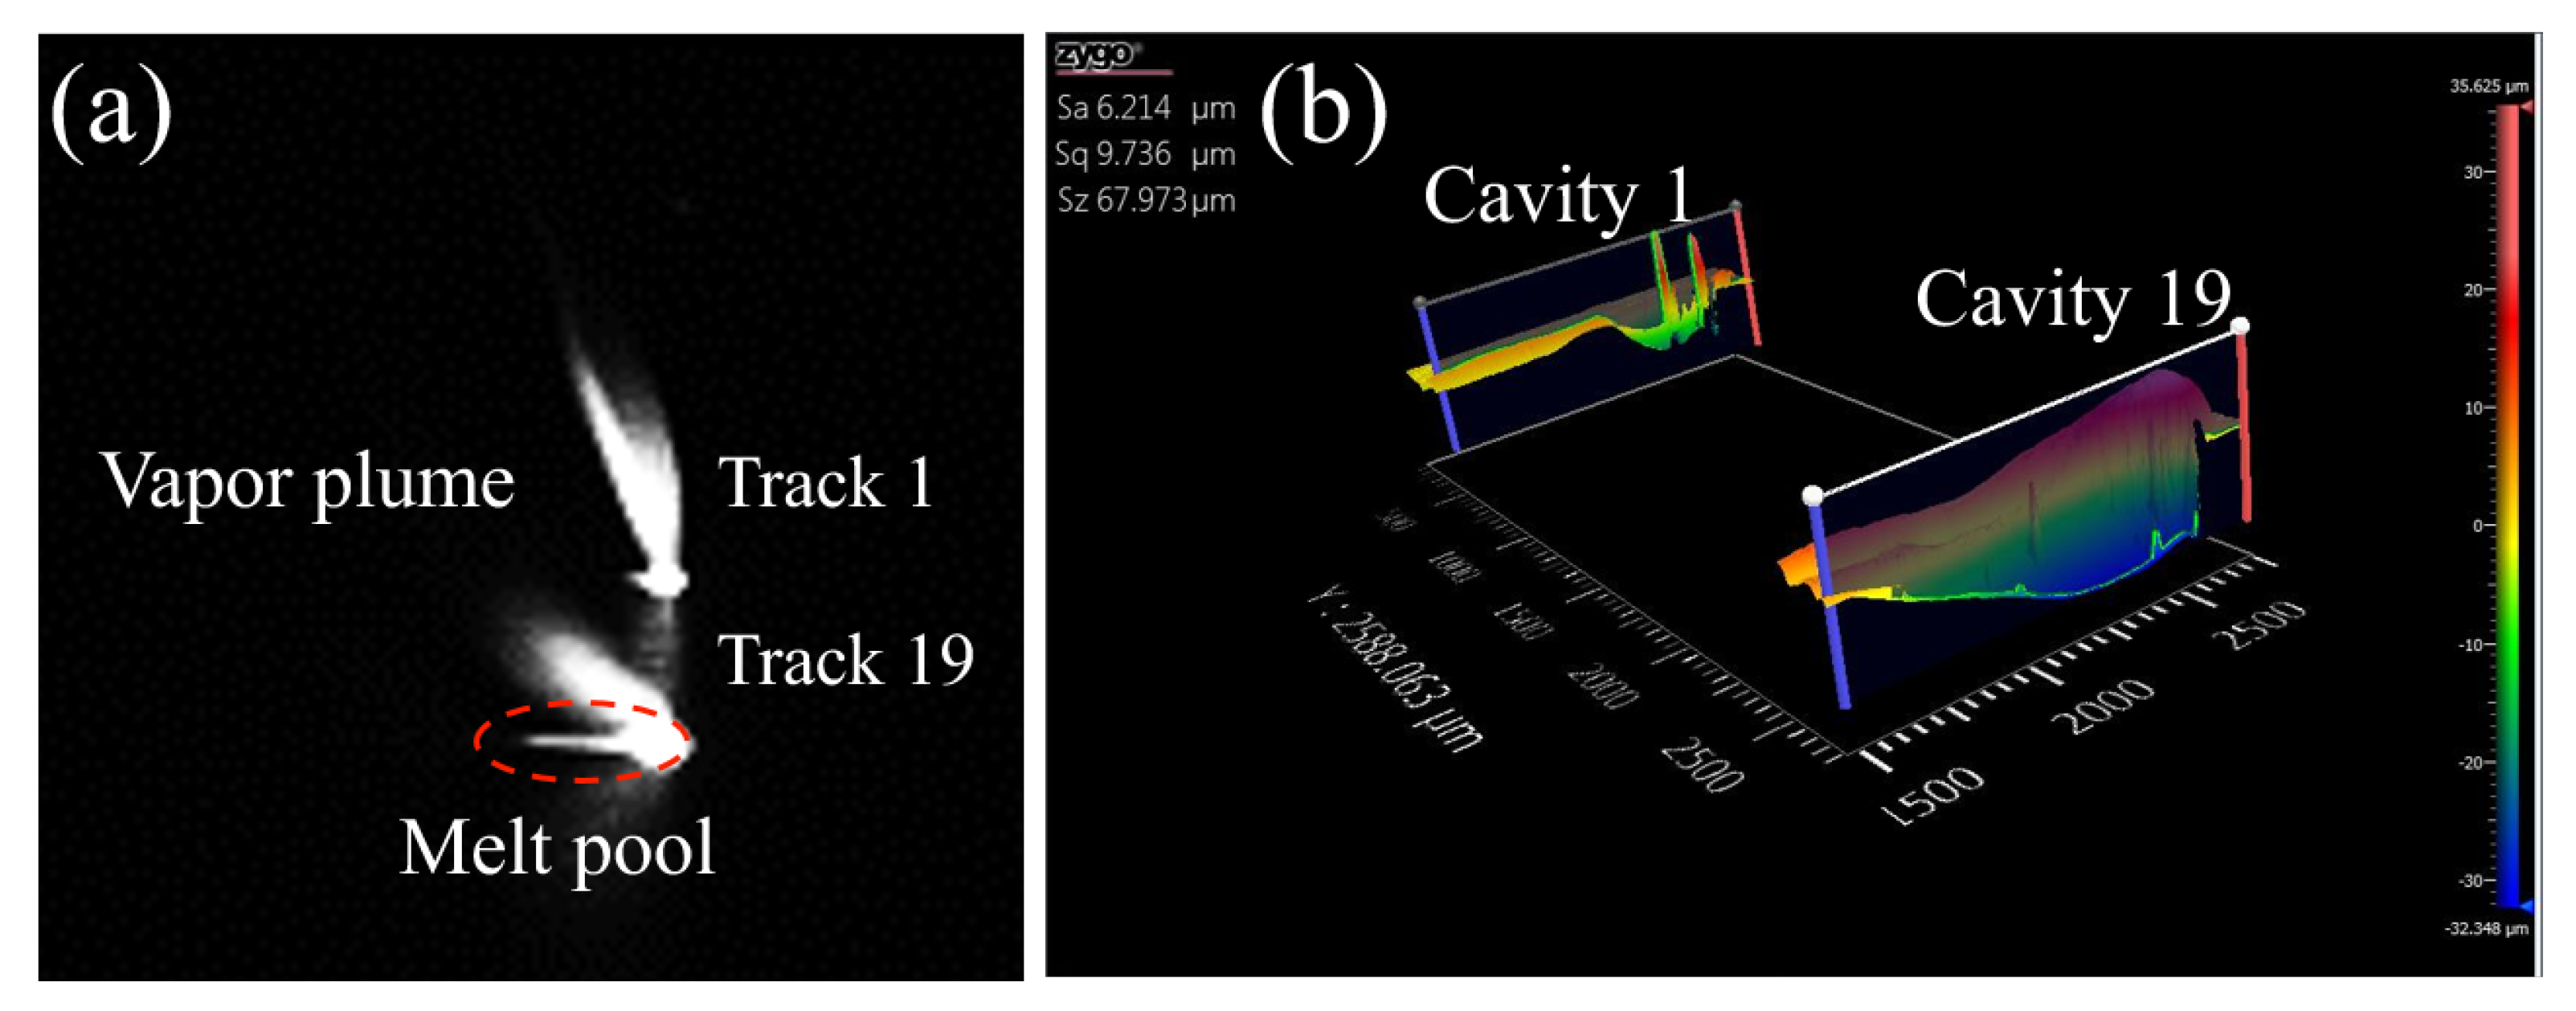
3.2. Multi-Track Laser Scan Observation

The evolution of plume behavior during a 19-track-layer scanning at P = 300 W–v = 600 mm/s is presented in Figure 6a. The plume behavior evolution can be categorized into three distinct stages according to the inclination angle and process stability:
  • Stage I (track 1–6, marked with green dashed box) refers to the forced conduction regime; the vapor plume showed notable similarity in shape and angle compared with single-track observation. It is obviously shown in the video that vapor ejection remained gentle and stable in this stage. Plume inclination is minor, in the range of less than 45°.
  • Stage II (track 7–12, marked with yellow-dashed box) refers to early stage keyhole mode as explained in the next paragraph; the vapor plume assumed a larger inclination angle (approximately 50°) from vertical. The plume ejection became much more intense than in the previous stage while the inclination angle generally remained fixed with minor fluctuations. In this stage, the vapor behavior serves as a signal that laser absorption was enhanced, but one may note that the process was relatively stable.
  • Stage III (track 13–19, marked with red dashed box) refers to keyhole mode with instability; the vapor plume maintained a large inclination angle range, like in Stage II, but exhibited fast fluctuations throughout the melting process. The shape, size, and incline angle of the vapor plume varied so rapidly that even the use of a 50 μs exposure duration failed to capture more details. In this stage, we did a frame-by-frame check and found that the shape and size of vapor plume from two adjacent frames can be completely different, with the inclination angle can be distinguished in the angle range above 45°. In this stage, it is logical to assume that the interplay between laser ray and melt pool became much more complex and intense oscillations occurred on the melt front, resulting in rapid change of inclination angle and plume direction.
Figure 6b,c present the evolution of tracks from the top-view and corresponding evolution of the track tail cavity from a depression to a keyhole. We identify the vapor cavity in stages II and III as a keyhole instead of a depression based on three reasons: first, the vapor inclined further, signaling a larger front wall inclination that can reflect laser ray downwards to the bottom of the cavity, the melt front assumed a concave shape which encouraged the focus of some laser ray onto the bottom of the cavity [19,20], this ultra-fast stage was also observed in the X-ray and identified as the beginning of keyhole formation [6]; second, intensive vapor flow, sometimes with ultra-fast fluctuations, can be seen in the video and superimposed images, confirming that multi-reflection was to some extent involved in the melting process; third, a dramatic increase can be observed in both the melt pool length in Figure 7a and penetration depth in Figure 6d, meaning a sharp increase in laser absorption was realized during this transition.
Furthermore, note that this keyhole was still not fully developed, because back vapor flow flattened the rear wall, opened the cavity, lowered the intensity of the ray reflected from the front wall, and thus made it easy for the ray to escape the vapor cavity [20]. Without further reflection, the key-holing process was restricted at a limited stage, and long wide open cavities were left on the track tail as the result of vapor-rear wall interaction. Additionally, the surface roughness was good in Stage I and II, where the vapor plume was stable, but became worse during the last 7 tracks under the influence of unstable vapor flow.
Figure 6d,e compare the melt pool shape and penetration depth into the plate from all three stages. The penetration depth were measured vertically from the lowest point of the melt pool to the surface of plate, as highlighted in Figure 6e. The melting depth increased progressively from 64 μm to 76.5 μm during Stage I, this depth range is quite similar with the observation of single track experiments. Then the depth increased sharply in Stage II and III, sudden increases can be seen between tracks 7 and 8, and 10 and 11. Due to the instability along a single track in Stages II and III, it is logical to assume that the shape of cross section will be different if we change the section position along the scan direction. That helps to explain the reason that the shift of vapor behavior and the location of corresponding increase in penetration depth did not fit exactly. Even in stage III, the plume can be seen at a large inclination angle in an overwhelming majority of frames, meaning that the laser-melt pool interaction happened most on the keyhole front wall, rather than keyhole bottom. The drilling effect was therefore suppressed so that a typical deep penetration was not realized, leaving the melt pool remained its semicircular shape throughout the all three stages.
We then analyzed the results of laser scan experiments at 400 W–800 mm/s and 500 W–1000 mm/s following similar approach.
At 400 W–800 mm/s (Figure 8), a similar transition from the forced conduction mode to a near stable early-stage keyhole mode was observed at track 13, while the keyhole instability (Stage III) was not observed before the laser turn-off. Furthermore, the length of the vapor cavities were doubled at the end of tracks 15, 17, and 19, and a corresponding jump in penetration depth was seen between tracks 13 and 14. Notice, however, vapor plume behavior in track 13 was the combination of both melting modes, the sharp increase of melt depth may be seen between track 12 and 13 if we move the section position a little left toward the starting point of this track.
At 500 W–1000 mm/s (Figure 9), the jump in vapor inclination and melt pool penetration depth were observed during track 9–12, with the longest cavities and worst surface quality. The penetration depth reached its maximum value of approximately 233 μm at track 10 and then returned to a smaller level of an average of approximately 155 μm.
Additionally, it is important to note that there were also some points where fast inclination jump along the tracks near the stage transfer. These point-level sudden shifts may not be captured by the superimposed images because their existence was short before the vapor plume returned to the local average level. However, sudden enlargements of plume can still be seen during the laser scan at tracks 5, 6 for 300 W–600 mm/s; tracks 8, 9 for 400 W–800 mm/s; and tracks 8, 10 for 500 W–1000 mm/s, and localized roughness on the scanned surface can be found exactly at the corresponding locations.

4. Discussion

4.1. Heat Transfer Analysis in Forced Conduction Mode

As mentioned above, all the single tracks we observed fall in the forced conduction regime. As is pointed out by Fabbro et al. [19,24], the forced conduction melting mode is a third mode between conduction and keyhole mode.
Because the inclination of melting front is not steep enough reflect the laser ray downward, boiling point temperature was reached (Figure 3) and the vaporization-induced recoil pressure created a shallow flat depression into the melt pool below the laser spot (Figure 4).
Although the threshold for multi-reflection (keyhole mode) was not reached in this regime [19], the depth of depression should also be taken into account when analyzing the energy balance at the laser–liquid interface. Without multi-reflection, the laser–melt interface can be identified as the intersection between the liquid surface and the laser spot. In a typical conduction melting mode, energy is absorbed through a fraction of flat liquid surface which is directly exposed to the laser beam (i.e., the beam spot) after initial surface melting stage mainly by conduction [22]. In the forced conduction melting mode, however, a recoil pressure is exerted onto the liquid surface as metal atoms gain the energy and escape from the interface as vapor flux [26]. As observed in the single track experiments, the vapor-induced recoil deforms the liquid surface by push metal melt away to create a depression. The depth of the depression front then becomes a dominant factor because it determines the extent the interface into the material [27]. It is therefore the intensity of vaporization that determines how deep into the material the energy absorption can take place. In addition, the recoil pressure induces melt flow away from the interaction zone, with more heat carried away by convection [20,27]. In this vein, the intensity of vaporization plays a vital role in determining energy absorption of melt pool, and further, in controlling the depth of melt pool. The magnitude of recoil pressure can be describe as [26]:
P r e c o i l = 0.56 P a t m e x p [ L 0 m A T T b k B T T b ] ,
where P a t m is saturation pressure and T b the boiling point, indicating it shows an exponential dependence on the peak temperature T of the evaporation interface.
In summary, both the recoil pressure and heat conduction process are strongly dependent on the surface temperature, which further depends on laser power. This suggests that the laser power makes a dominant factor on the melt pool dimension and vaporization intensity than the scan speed in controlling the melt pool dynamics. An increase in laser power could lead to higher peak temperature and deeper depression into melt pool, encouraging heat transfer with larger temperature gradient at the laser–liquid interface. As is consistent with the experimental observation, these effects might not be counterbalanced by the decrease of irradiation duration at increased speed.

4.2. Melting Mode Transfer in Multi-Track Scenarios

Despite choosing parameter combinations within forced conduction regime when we expanded single track experiments into multi-track, the keyhole regime was reached in all three experiments. An evident, major difference between single track and multi-track scenarios is whether the influence of previous track needs to be considered. Our observation showed that these influences proved quite pronounced.
As reported in the X-ray observations [6], the time needed to reach the conduction-keyhole transition can be shortened by an increase in laser power, which means higher recoil pressure and thus a higher drilling rate. In the same vein, higher surface temperature, as a result of heat accumulation, also means more energy will be carried away by evaporation, which in turn leads to more intensive evaporation and larger recoil pressure, as indicated in Equation (1). Therefore, in LPBF, heat accumulation can have a similar effect to laser power increase. Physically speaking, besides laser power, the time needed to reach the critical inclination at fixed laser irradiation may also be shortened by the elevated temperature. Namely, the threshold for keyhole formation will be lower as a result of heat accumulation during the LPBF printing process. Therefore, when the initial temperature is higher enough to make the critical inclination time needed shorter than irradiation duration (defined as t = σ / v for a spot diameter σ at scan speed v [7]), the regime shift will occur. As reported by Mayi et al. [19], a depression and a keyhole are separated by the critical inclination angle, at which the trapped fraction of laser ray acts as a positive feedback in the drilling process. The big gap in laser absorption between both sides of the critical inclination indicates that it will not be a stable stage that can be maintained during multi-track scan since a minor disturbance can act like a tipping point and trigger a sudden increase of laser absorption. Thus, there may not be a gentle and smooth transition from forced conduction mode into the keyhole regime. These considerations can help to explain why the plume intensity and inclination angle, melt pool penetration depth and track trail cavities show sudden changes by a much sharper margin on the boundaries of melting stages than within a single stage.
Furthermore, when there is a melting mode transfer, a simplified combination of as laser power, scan speed and beam diameter, such as linear energy density ( L E D , P / v ) and volumetric energy density ( V E D , 4 P / ( π σ 2 v ) ) will not be necessarily accurate to predict melting results. Because these parameters, by definition, are measurements of laser energy output from the scanning unit [28]. Prediction based on them may not agree with the melting outcome if there is melting mode transition causing the material absorb energy in a different manner.

4.3. The Issue of Process Stability in LPBF

Based on above analysis, it is logical to assume that this transition is likely to be missed in single track experiments but may be reached somewhere along the printing process. Therefore, the regime shift is very likely to occur in real-life scenarios of LPBF process. One reason is that heat accumulation is evidently common in LPBF process during the repeated laser scanning. Another reason is that there may not a clear-cut separation between forced conduction mode and keyhole formation.
The track-by-track, layer-by-layer manner means each track or layer starts at a higher initial temperature than the previous one. Moreover, the cooling of melted track/layer to a great extent relies on the conduction through hot previous tracks, layers, and support structures [29]. Because the contact between particles are significantly limited, the effective conductivity of powder layers is very low [26]. This will enhance the heat accumulation greatly and make the threshold for the critical inclination for keyhole formation much easier to reach. In addition, LPBF process is often applied to print parts with complex geometries thanks to its unique design freedom offered by the layer-by-layer approach. But the term “complex geometries”, by definition, means that these features are often not well supported or connected by bulk material, which in turn can spell complex localized heat accumulation and thus lower the keyhole threshold. It is also relevant to note that the laser beams used in all LPBF machines are directed from one or more fixed scan-heads at the roof of building chamber. Consequently, the laser beam is seldom vertical as simplified in most numerical models. Rather, the beam always has a varying incident angle from vertical when it scans on the build platform, except for the (0,0) point. With this preexisting incident angle, the laser may be reflected downwards and trapped by the cavity even before the predicted critical angle is reached, as illustrated in Figure 10. That is to say, the value of the critical inclination angle needed to trigger laser trap effect changes with the location on the build platform in LPBF. All these factors together lead to a higher possibility of the occurrence of depression–keyhole transition, and further make accurate prediction for keyhole threshold and process window more challenging.
From a manufacturing viewpoint, the early stage of keyhole regime is relatively acceptable. Even though the critical inclination for laser trap effect is reached, further multi-reflection is not intensive thanks to the elongated flat rear wall. Additionally, the inclined plume indicates that the interaction between laser and melt pool takes place mainly at the keyhole front wall, which is much different from the scenarios where the beam center reaches the bottom of the keyhole and produce keyhole collapses to trap the vapor as pores constantly. So the early stage of keyhole formation still can be categorized as a stable regime.
Note that the melting mode transfer not only results from heat accumulation from previous tracks, but also results in an acceleration of further heat accumulation for the following tracks and layers as well. Consequently, in the same vein, there might also exist a point where a fully developed keyhole emerges due to heat accumulation or sudden change of cooling conditions. A more realistic concern then becomes how far the keyhole regime will evolve further into the unstable regimes (i.e., Stage III at 300 W–600 mm/s or even a fully developed keyhole regime) before a balance can be reached between of laser absorption and cooling during the printing process.
Based on the above analysis, it may prove a logical option to lower the energy input by increasing scan speed or turning down laser power after a few initial layers to avoid further development toward a keyhole. Meanwhile, remelting of the lines of trail end cavities before the spread of subsequent powder layer can help eliminate pores before they are too deep to repair. And further, a real-time close-loop control of laser parameters may be the ultimate solution to improve the process stability to the next level.

5. Conclusions

In this study, we used off-axis high-speed observation to investigate the vapor plume behavior and its stability at both single-track and multi-track levels, in combination with the evaluation of the evolution of the melt pool and vapor-induced cavity. The main conclusions of the study can be drawn as follows.
1.
There is a forced conduction melting mode in LPBF regimes, where the boiling point is reached and a depression is created by the vapor-induced recoil pressure. The depression is not deep enough to trap the laser as in keyhole mode, but it still plays an important role in controlling heat transfer at melt pool surface and to a relatively limited extent, enables the melt pool to penetrate deeper than in conduction mode. In the forced conduction regime, laser power has a stronger effect than scan speed. The plume behavior is stable in this regime, indicating a stable constant interaction between laser and material can be maintained since no multi-reflection is involved.
2.
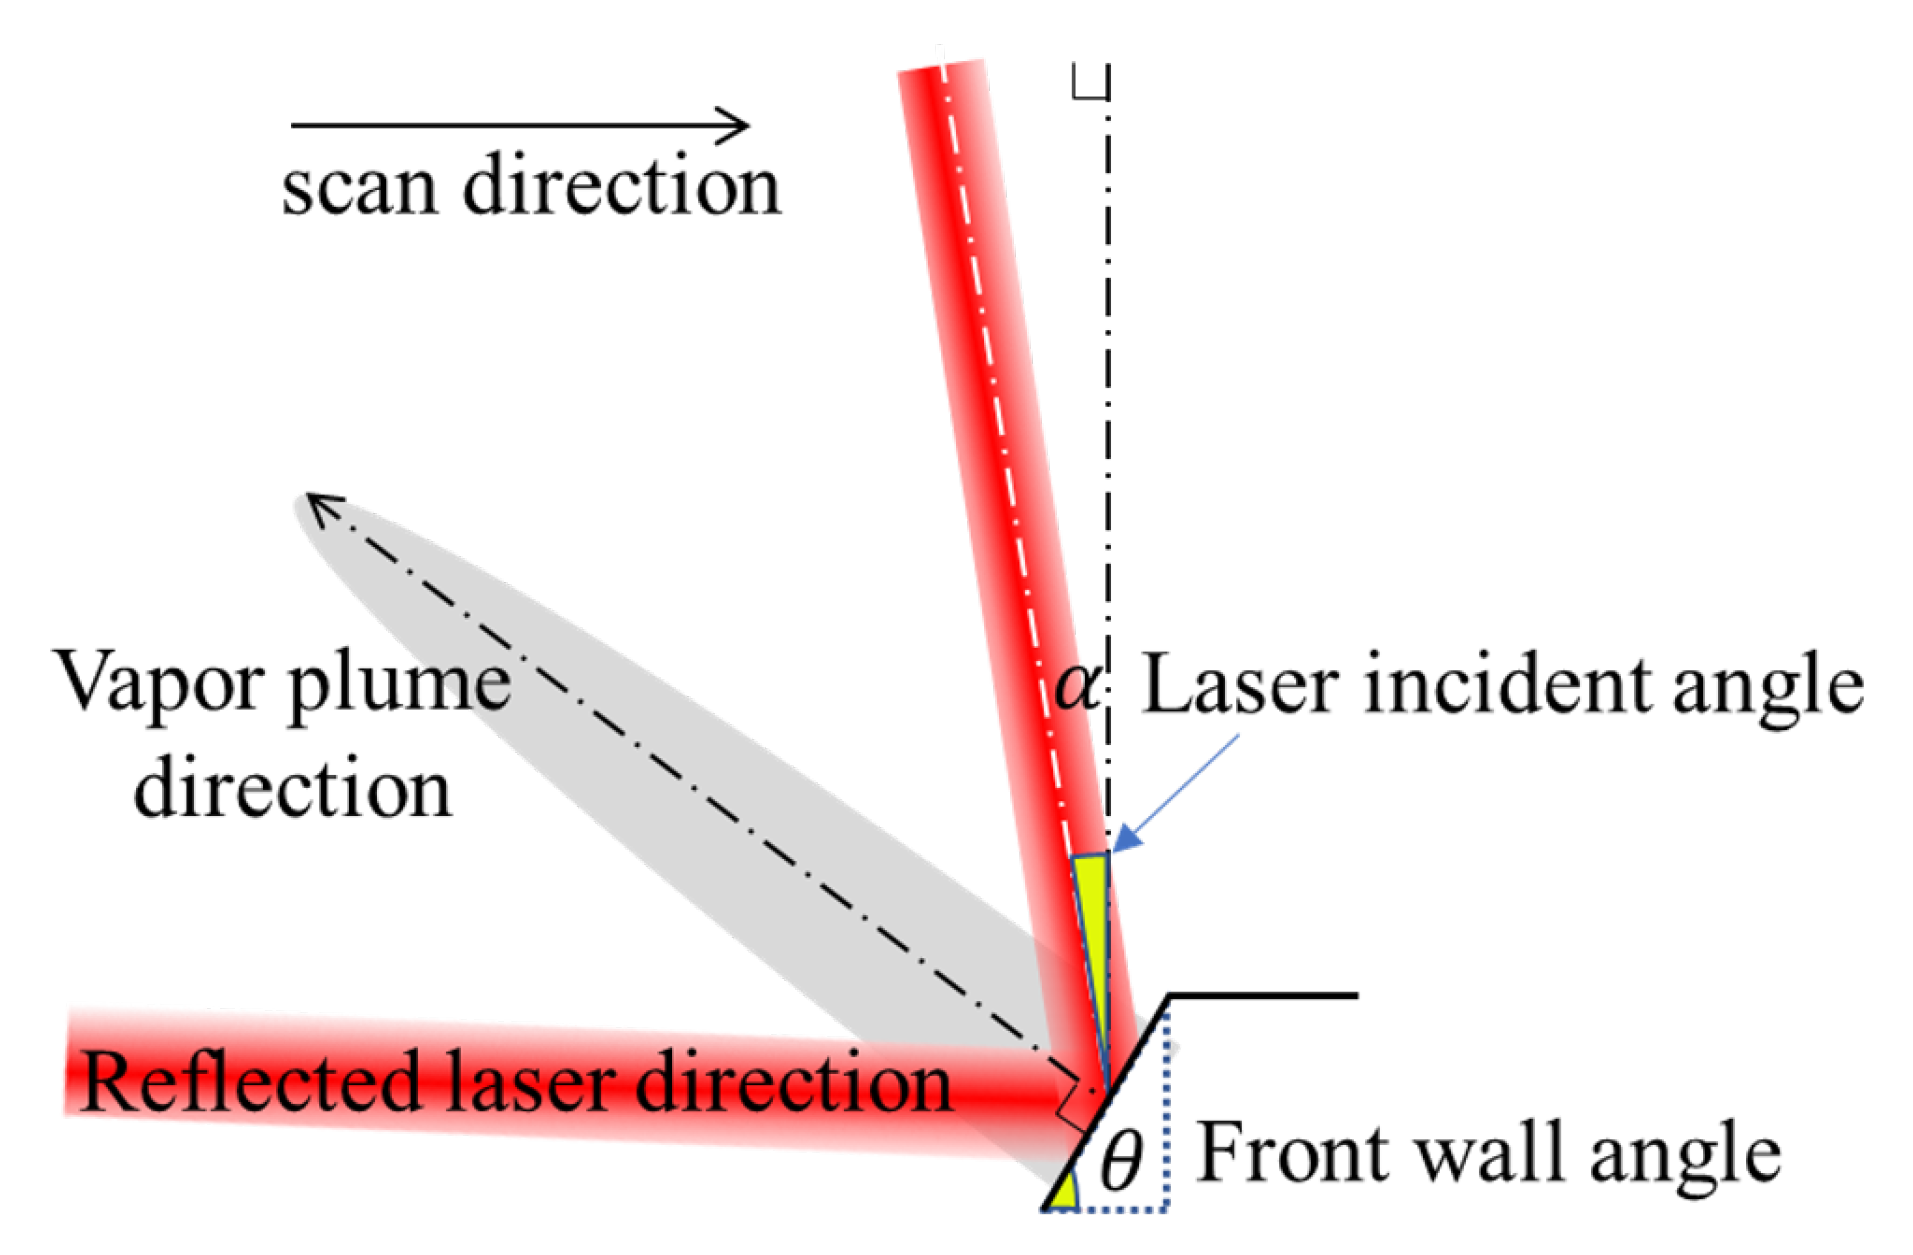
The heat accumulation along the printing process of LPBF proves an important factor on melting mode and process stability. Under constant laser parameters in this study, the melting mode was observed to begin in the forced conduction regime and evolve through a sharp transition into keyhole formation regime or even further. A sudden jump in vaporization intensity, penetration depth and cavity size on the surface of scanned layers was observed as the result of this melting mode transition. The transition is believed to result from the so-called laser-trap effect at a critical inclination of depression front wall, which means that laser beam can begin to be reflected downward and the laser absorption increases sharply. This critical inclination is therefore used as the separation of a depression from a keyhole. Further, due to the sudden increase of laser absorption, the transition cannot be smooth and the critical inclination will not be an angle that can be maintained stable at even if we progressively change the laser parameters.
The results show that there is a good chance that the accuracy of prediction based on single-track or even single-layer level experiments and numerical simulations can be compromised by the complex thermal history of the LPBF process. One may keep in mind that lack-of-fusion also proves a serious problem if the laser input is set too far below the keyhole threshold. That means keyhole regime might be reached somewhere along the LPBF process, even if we start the printing with a relatively lower laser energy input to avoid keyhole-related defects. How far the regime will be shifted towards the keyhole regime at elevated temperature may vary with both material properties and variations of localized cooling conditions of the parts; it shows the need of real-time observation and evaluation of critical process signals and adjustments of operating parameters need to be made in time, accordingly. Therefore, the results provide a new possibility to explain why stability issue in LPBF process remains so challenging to deal with after more than one decade of extensive investigations. Future work will be concentrated on the melting mechanisms with powder bed for better understanding and control of process stability at the multi-track and multi-layer levels.

Supplementary Materials

The following are available online at https://www.mdpi.com/article/10.3390/met11060937/s1.

Author Contributions

Conceptualization, H.Z., Y.W., Y.X. and H.L.; methodology, H.Z., S.Y. and Y.X.; validation, H.Z. and Y.G.; formal analysis, H.Z. and Y.G.; investigation, H.Z., Y.G., S.Y. and Y.W.; writing—original draft preparation, H.Z., Y.G. and R.H.; writing—review and editing, H.L. and L.L.; visualization, H.Z. and R.H.; supervision, L.L., S.G. and H.L.; project administration and funding acquisition, H.L. and S.G. All authors have read and agreed to the published version of the manuscript.

Funding

This research was funded by National Key R & D Program of China (Grant No. 2017YFB1104002) and Defense Industrial Technology Development Program (Grant No. JCKY2019205A002).

Conflicts of Interest

The authors declare no conflict of interest.

Abbreviations

The following abbreviations are used in this manuscript:
LPBFLaser powder bed fusion
AMAdditive manufacturing
FPSFrame per second
LEDLinear energy density
VEDVolumetric energy density

References

  1. Chen, H.; Yan, W. Spattering and denudation in laser powder bed fusion process: Multiphase flow modelling. Acta Mater. 2020, 196, 154–167. [Google Scholar] [CrossRef]
  2. Hojjatzadeh, S.M.H.; Parab, N.D.; Yan, W.; Guo, Q.; Xiong, L.; Zhao, C.; Qu, M.; Escano, L.I.; Xiao, X.; Fezzaa, K.; et al. Pore elimination mechanisms during 3D printing of metals. Nat. Commun. 2019, 10, 3088. [Google Scholar] [CrossRef] [Green Version]
  3. King, W.E.; Anderson, A.T.; Ferencz, R.M.; Hodge, N.E.; Kamath, C.; Khairallah, S.A.; Rubenchik, A.M. Laser powder bed fusion additive manufacturing of metals; physics, computational, and materials challenges. Appl. Phys. Rev. 2015, 2, 041304. [Google Scholar] [CrossRef]
  4. Spears, T.G.; Gold, S.A. In-process sensing in selective laser melting (SLM) additive manufacturing. Integr. Mater. Manuf. Innov. 2016. [Google Scholar] [CrossRef] [Green Version]
  5. Khairallah, S.A.; Martin, A.A.; Lee, J.R.I.; Guss, G.; Calta, N.P.; Hammons, J.A.; Nielsen, M.H.; Chaput, K.; Schwalbach, E.; Shah, M.N.; et al. Controlling interdependent meso-nanosecond dynamics and defect generation in metal 3D printing. Science 2020, 368, 660–665. [Google Scholar] [CrossRef] [PubMed]
  6. Cunningham, R.; Zhao, C.; Parab, N.; Kantzos, C.; Pauza, J.; Fezzaa, K.; Sun, T.; Rollett, A.D. Keyhole threshold and morphology in laser melting revealed by ultrahigh-speed x-ray imaging. Science 2019, 363, 849–852. [Google Scholar] [CrossRef]
  7. Patel, S.; Vlasea, M. Melting modes in laser powder bed fusion. Materialia 2020, 9. [Google Scholar] [CrossRef]
  8. King, W.E.; Barth, H.D.; Castillo, V.M.; Gallegos, G.F.; Gibbs, J.W.; Hahn, D.E.; Kamath, C.; Rubenchik, A.M. Observation of keyhole-mode laser melting in laser powder-bed fusion additive manufacturing. J. Mater. Process. Technol. 2014, 214, 2915–2925. [Google Scholar] [CrossRef]
  9. Bayat, M.; Thanki, A.; Mohanty, S.; Witvrouw, A.; Yang, S.; Thorborg, J.; Tiedje, N.S.; Hattel, J.H. Keyhole-induced porosities in Laser-based Powder Bed Fusion (L-PBF) of Ti6Al4V: High-fidelity modelling and experimental validation. Addit. Manuf. 2019, 30, 100835. [Google Scholar] [CrossRef]
  10. Zhao, C.; Parab, N.D.; Li, X.; Fezzaa, K.; Tan, W.; Rollett, A.D.; Sun, T. Critical instability at moving keyhole tip generates porosity in laser melting. Science 2020, 370, 1080–1086. [Google Scholar] [CrossRef] [PubMed]
  11. Bayat, M.; Mohanty, S.; Hattel, J.H. Multiphysics modelling of lack-of-fusion voids formation and evolution in IN718 made by multi-track/multi-layer L-PBF. Int. J. Heat Mass Transf. 2019, 139, 95–114. [Google Scholar] [CrossRef]
  12. Matthews, M.J.; Guss, G.; Khairallah, S.A.; Rubenchik, A.M.; Depond, P.J.; King, W.E. Denudation of metal powder layers in laser powder bed fusion processes. Acta Mater. 2016, 114, 33–42. [Google Scholar] [CrossRef] [Green Version]
  13. Ly, S.; Rubenchik, A.M.; Khairallah, S.A.; Guss, G.; Matthews, M.J. Metal vapor micro-jet controls material redistribution in laser powder bed fusion additive manufacturing. Sci. Rep. 2017, 7, 1–12. [Google Scholar] [CrossRef]
  14. Yin, J.; Wang, D.; Yang, L.; Wei, H.; Dong, P.; Ke, L.; Wang, G.; Zhu, H.; Zeng, X. Correlation between forming quality and spatter dynamics in laser powder bed fusion. Addit. Manuf. 2020, 31, 100958. [Google Scholar] [CrossRef]
  15. Gunenthiram, V.; Peyre, P.; Schneider, M.; Dal, M.; Coste, F.; Fabbro, R. Analysis of laser–melt pool–powder bed interaction during the selective laser melting of a stainless steel. J. Laser Appl. 2017, 29, 022303. [Google Scholar] [CrossRef]
  16. Zheng, H.; Li, H.; Lang, L.; Gong, S.; Ge, Y. Effects of scan speed on vapor plume behavior and spatter generation in laser powder bed fusion additive manufacturing. J. Manuf. Process. 2018, 36, 60–67. [Google Scholar] [CrossRef]
  17. Chen, Y.; Clark, S.J.; Leung, C.L.A.; Sinclair, L.; Marussi, S.; Olbinado, M.P.; Boller, E.; Rack, A.; Todd, I.; Lee, P.D. In-situ Synchrotron imaging of keyhole mode multi-layer laser powder bed fusion additive manufacturing. Appl. Mater. Today 2020, 20, 100650. [Google Scholar] [CrossRef]
  18. Khairallah, S.A.; Anderson, A.T.; Rubenchik, A.; King, W.E. Laser powder-bed fusion additive manufacturing: Physics of complex melt flow and formation mechanisms of pores, spatter, and denudation zones. Acta Mater. 2016, 108, 36–45. [Google Scholar] [CrossRef] [Green Version]
  19. Mayi, Y.A.; Dal, M.; Peyre, P.; Bellet, M.; Metton, C.; Moriconi, C.; Fabbro, R. Transient dynamics and stability of keyhole at threshold in laser powder bed fusion regime investigated by finite element modeling. J. Laser Appl. 2021, 33, 012024. [Google Scholar] [CrossRef]
  20. Kouraytem, N.; Li, X.; Cunningham, R.; Zhao, C.; Parab, N.; Sun, T.; Rollett, A.D.; Spear, A.D.; Tan, W. Effect of Laser-Matter Interaction on Molten Pool Flow and Keyhole Dynamics. Phys. Rev. Appl. 2019, 11, 064054. [Google Scholar] [CrossRef]
  21. Li, M.; Xiao, R.; Zou, J.; Wu, Q.; Xu, J. Correlation between plume fluctuation and keyhole dynamics during fiber laser keyhole welding. J. Laser Appl. 2020, 32, 22010. [Google Scholar] [CrossRef]
  22. Hebert, R.J. Viewpoint: Metallurgical aspects of powder bed metal additive manufacturing. J. Mater. Sci. 2016, 51, 1165–1175. [Google Scholar] [CrossRef]
  23. Fabbro, R.; Slimani, S.; Doudet, I.; Coste, F.; Briand, F. Experimental study of the dynamical coupling between the induced vapour plume and the melt pool for Nd–Yag CW laser welding. J. Phys. Appl. Phys. 2006, 39, 394–400. [Google Scholar] [CrossRef]
  24. Fabbro, R. Depth Dependence and Keyhole Stability at Threshold, for Different Laser Welding Regimes. Appl. Sci. 2020, 10, 1487. [Google Scholar] [CrossRef] [Green Version]
  25. Lee, J.Y.; Ko, S.H.; Farson, D.F.; Yoo, C.D. Mechanism of keyhole formation and stability in stationary laser welding. J. Phys. Appl. Phys. 2002, 35, 320. [Google Scholar] [CrossRef]
  26. Cook, P.S.; Murphy, A.B. Simulation of melt pool behaviour during additive manufacturing: Underlying physics and progress. Addit. Manuf. 2020, 31, 100909. [Google Scholar] [CrossRef]
  27. Semak, V.; Matsunawa, A. The role of recoil pressure in energy balance during laser materials processing. J. Phys. Appl. Phys. 1997, 30, 2541–2552. [Google Scholar] [CrossRef]
  28. Scipioni Bertoli, U.; Wolfer, A.J.; Matthews, M.J.; Delplanque, J.P.R.; Schoenung, J.M. On the limitations of Volumetric Energy Density as a design parameter for Selective Laser Melting. Mater. Des. 2017, 113, 331–340. [Google Scholar] [CrossRef] [Green Version]
  29. Clijsters, S.; Craeghs, T.; Buls, S.; Kempen, K.; Kruth, J.P. In situ quality control of the selective laser melting process using a high-speed, real-time melt pool monitoring system. Int. J. Adv. Manuf. Technol. 2014, 75, 1089–1101. [Google Scholar] [CrossRef]
Figure 1. Experimental design and scanning strategy. (a) Experimental setup and off-axis high speed observation solution and (b) scan pattern used in multi-track laser scan experiments.
Metals 11 00937 g001
Figure 2. Example of frame superimposition (single track formation at P = 300 W, v = 600 mm/s, recorded at 50 k fps), frame interval used here is 36, which means the time interval between two adjacent frames is 720 μs.
Metals 11 00937 g002
Figure 3. Track-level plume behavior under different laser parameters. Scan direction is from left to right and track length is 30 mm.
Metals 11 00937 g003
Figure 4. Depth map and geometry of depression zone at the end of each track. Scale: 100 μm for the measured curves at the bottom of each observation.
Metals 11 00937 g004
Figure 5. Cross section of each track, with melt pool boundaries highlighted by white dashed curves. Scale = 50 μm.
Metals 11 00937 g005
Figure 6. Correlation of plume behavior and melting quality in multi-track laser scanning at 300 W–600 mm/s. (a) Track-by-track superimposed images of plume evolution, the vertical plumes at the starting stages of each track are omitted for better clarity; the arrow indicates laser direction of the column and the track number are placed next to the track start. (b) Surface quality of the scanned layer. The gray arrows indicate scan direction and track succession, while the dashed line shows where the sample was sectioned. (c) 3D height map of surface roughness. (d) Cross section evolution. (e) Penetration depth measurement results.
Metals 11 00937 g006
Figure 7. Comparison of plume behavior and track tail cavities before and after melting mode transition. (a) Superimposition of the last frame captured before laser-off in Track 1 and 19 at 300 W 600 mm/s, the elongated melt pool is highlight in the red dashed ellipse. (b) Anatomy of the resultant solidified track tail cavities of Track 1 and 19.
Metals 11 00937 g007
Figure 8. Correlation of plume behavior and melting quality in multi-track laser scanning at 400 W–800 mm/s. (a) Track-by-track superimposed images of plume evolution, the vertical plumes at the starting stages of each track are omitted for better clarity; the arrow indicates laser direction of the column and the track number are placed next to the track start. (b) Surface quality of the scanned layer. The gray arrows indicate scan direction and track succession, while the dashed line shows where the sample was sectioned. (c) 3D height map of surface roughness. (d) Cross section evolution and (e) penetration depth.
Metals 11 00937 g008
Figure 9. Correlation of plume behavior and melting quality in multi-track laser scanning at 500 W–1000 mm/s. (a) Track-by-track superimposed images of plume evolution, the vertical plumes at the starting stages of each track are omitted for better clarity; the arrow indicates laser direction of the column and the track number are placed next to the track start. (b) Surface quality of the scanned layer. The gray arrows indicate scan direction and track succession, while the dashed line shows where the sample was sectioned. (c) 3D height map of surface quality. (d) Cross section evolution. (e) Penetration depth.
Metals 11 00937 g009
Figure 10. Schematic of laser incident angle, front wall inclination, and vapor flow direction.
Metals 11 00937 g010
Table 1. Laser parameters used in this study.
Experimental PlanLaser PowerScan SpeedBeam Diameter
(W)(mm/s)(mm)
single track (30 mm)3006000.1
3007500.1
3009000.1
4008000.1
40010000.1
40012000.1
50010000.1
50012500.1
50015000.1
multi-track (6 × 2.5 mm)3006000.1
4008000.1
50010000.1
Publisher’s Note: MDPI stays neutral with regard to jurisdictional claims in published maps and institutional affiliations.

