
Metabolomics Tools Assisting Classic Screening Methods in Discovering New Antibiotics from Mangrove Actinomycetia in Leizhou Peninsula


 ,
,  ,
,
Abstract
:1. Introduction
2. Results
2.1. Strain Isolation and Phylogenetic Identification
2.2. Antibacterial Assay
2.3. Strain Prioritization by Metabolomics
2.4. Molecular Network Analysis of Outlier Strains
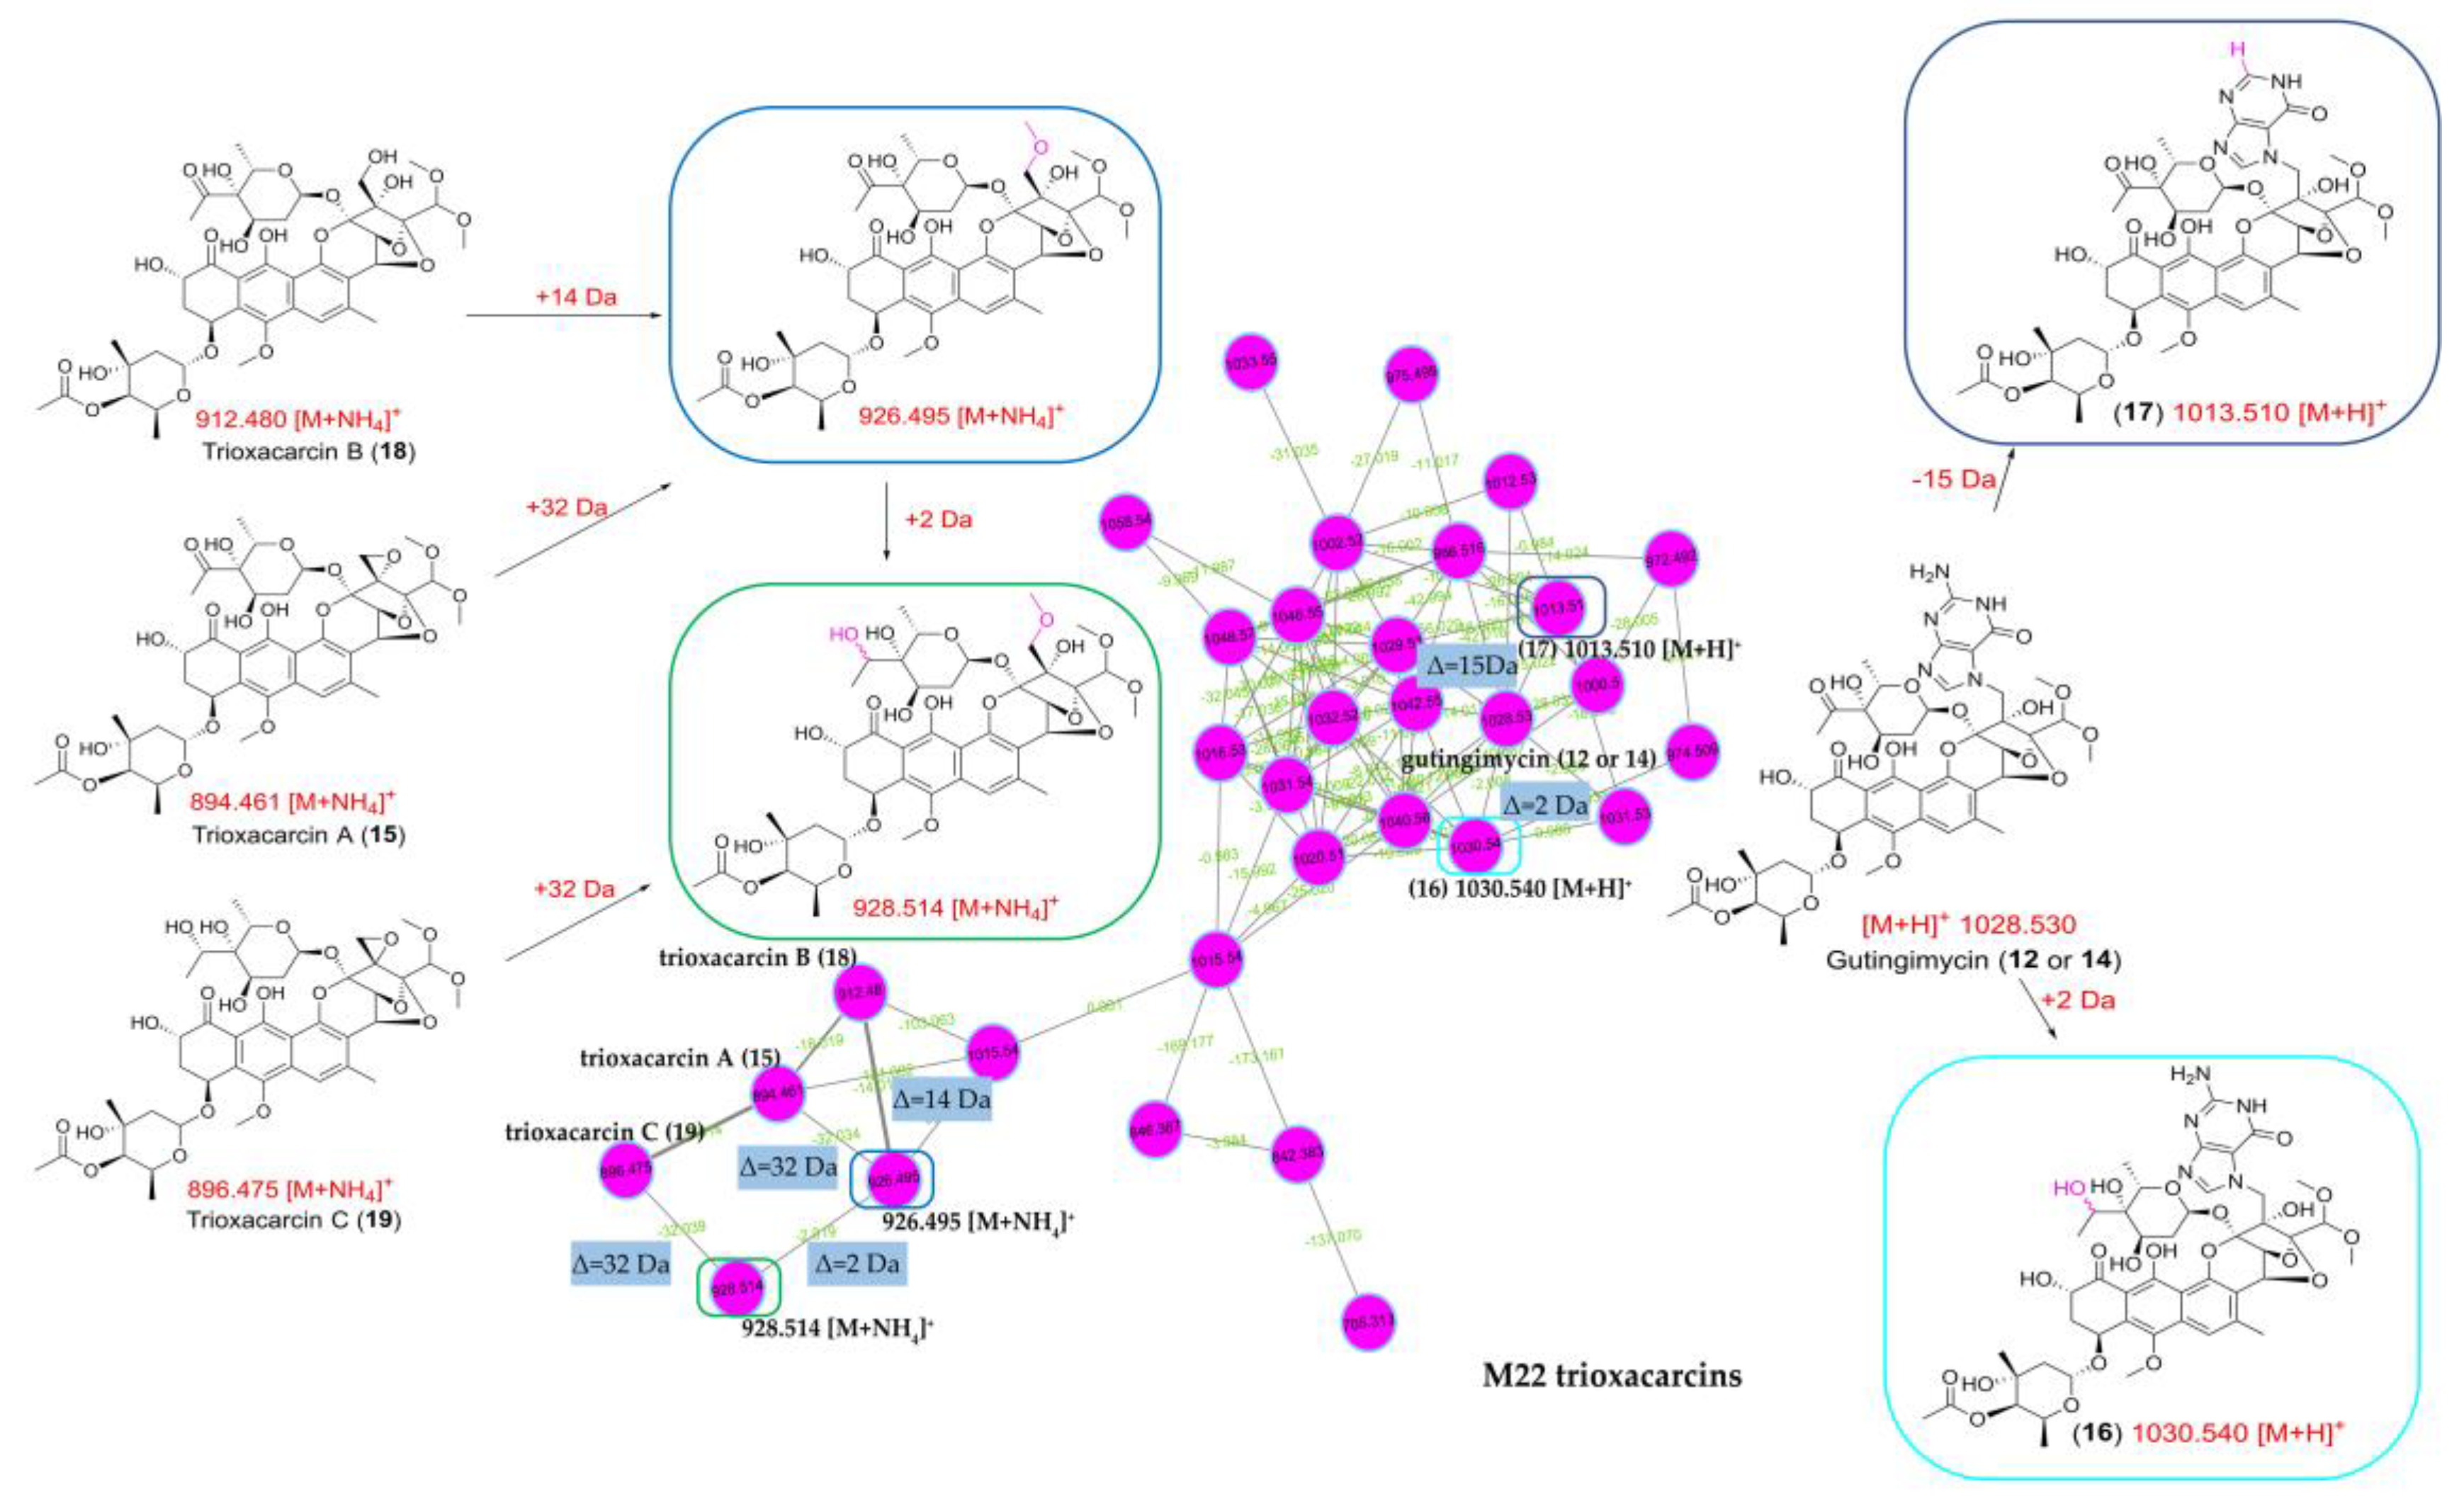
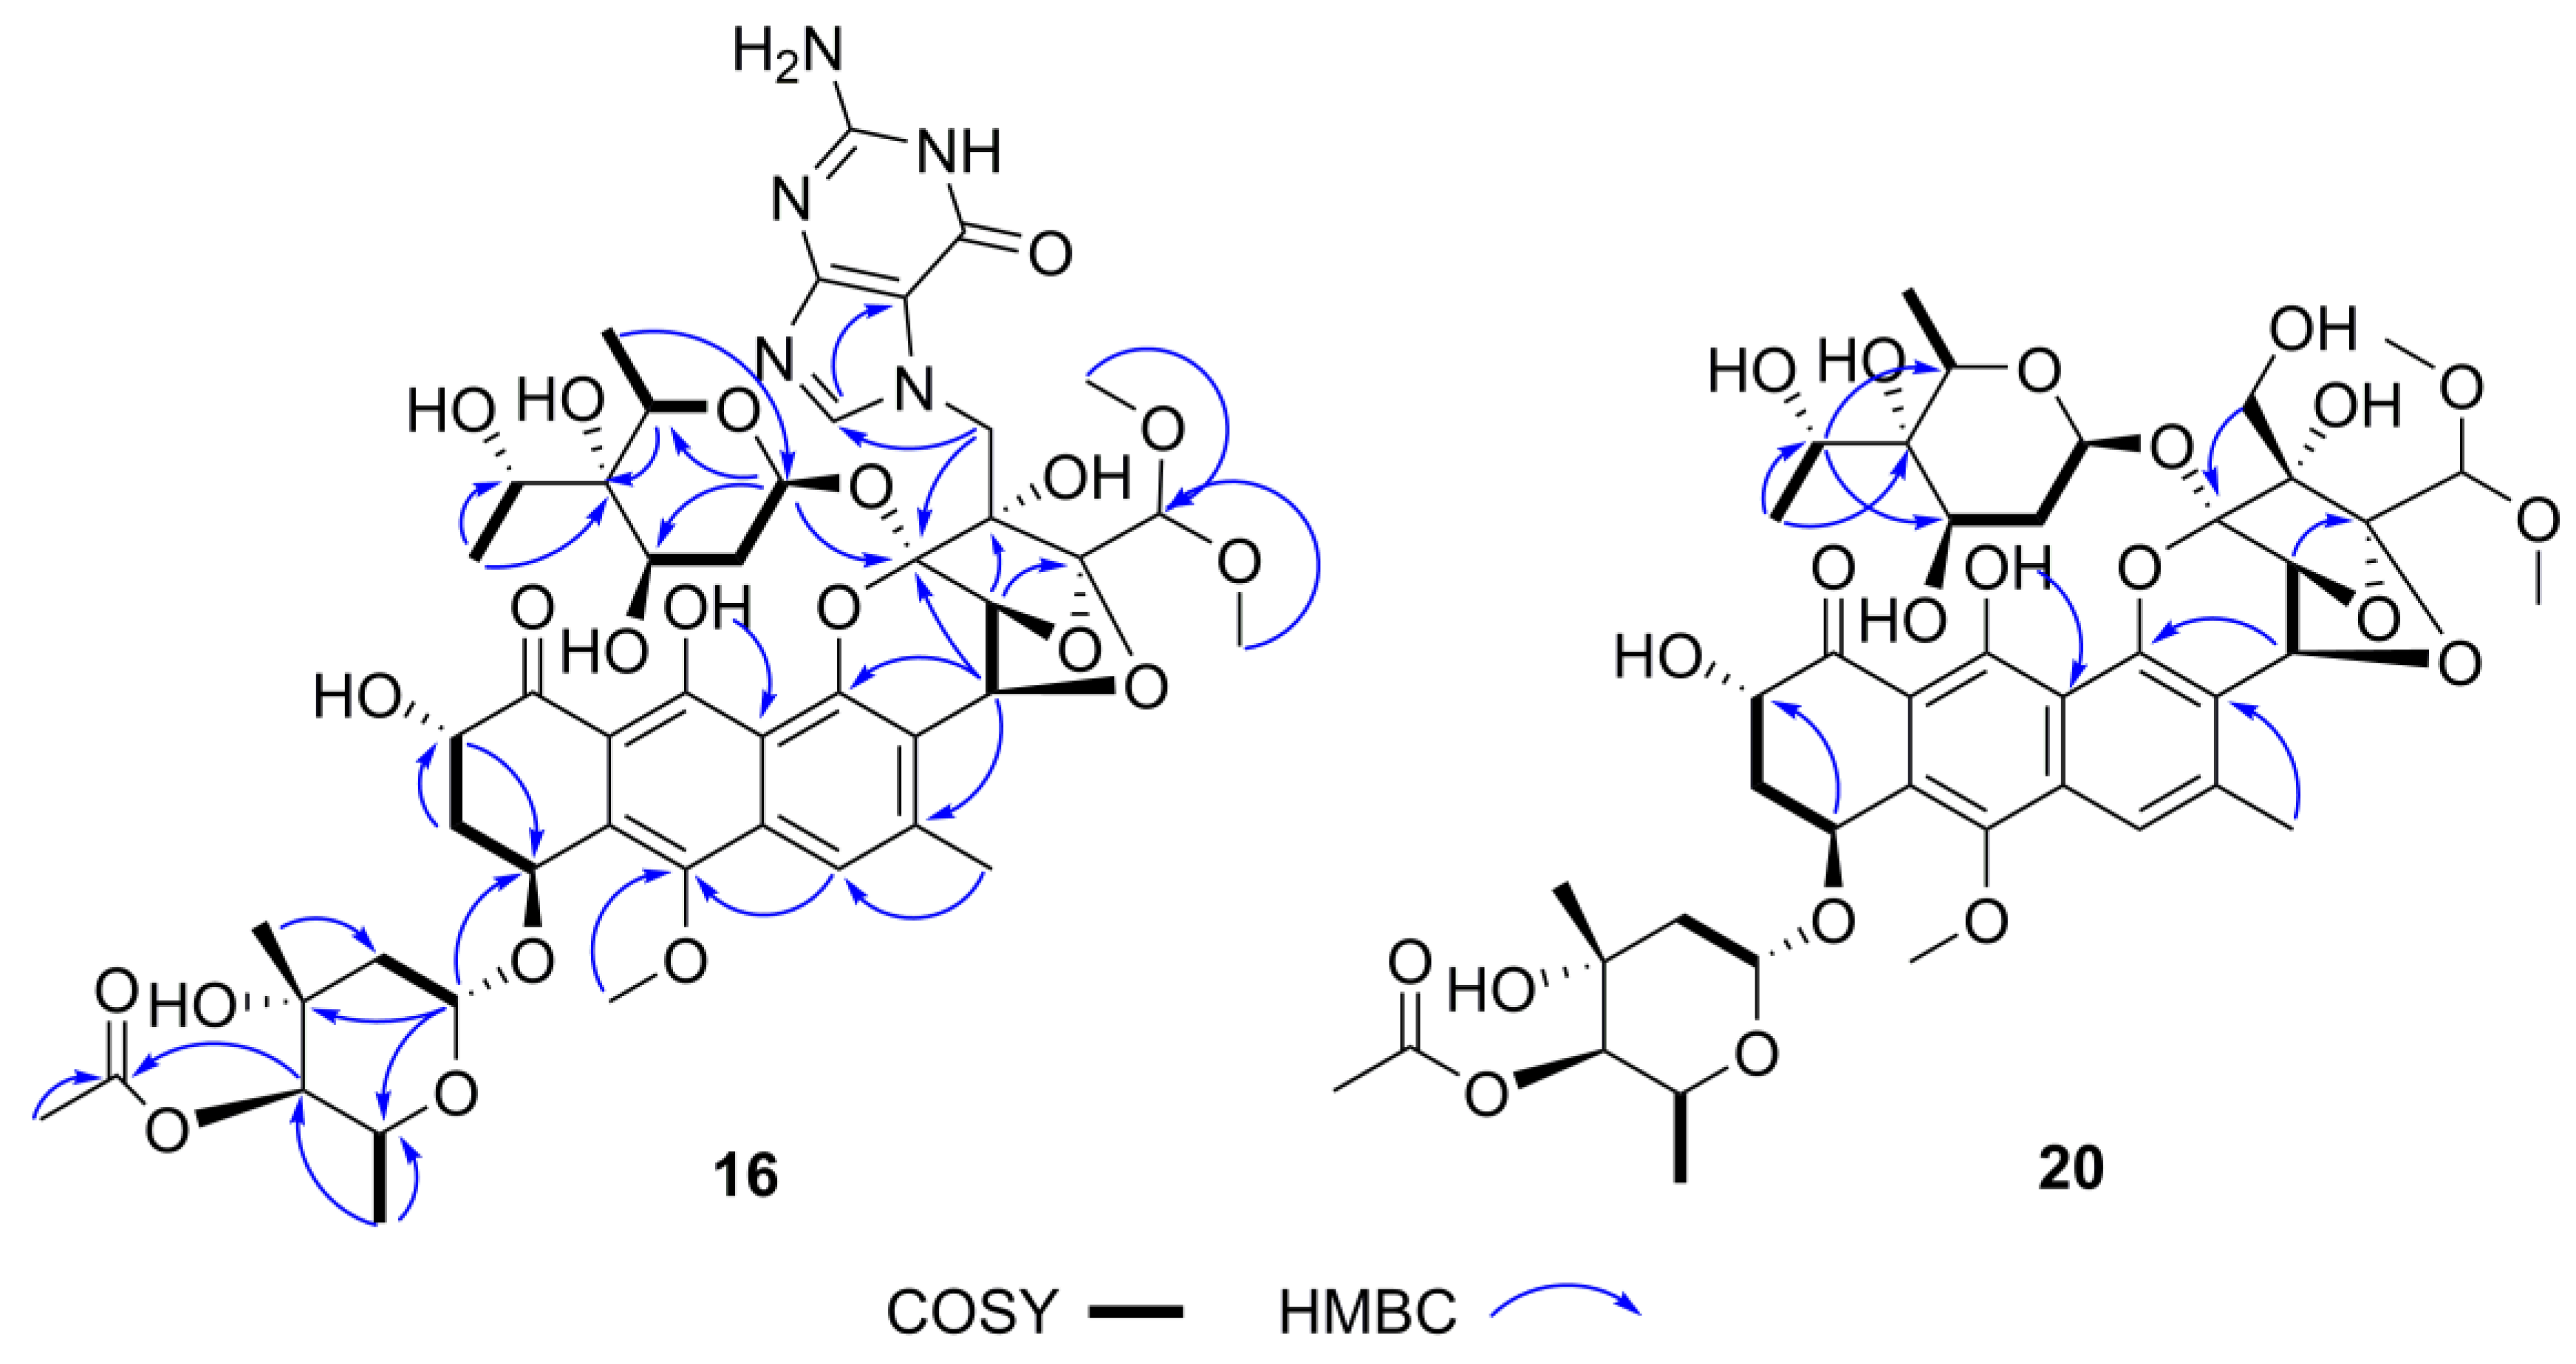
2.5. Structure Elucidation of Trioxacarcin Compounds from Strain Streptomyces sp. M22
3. Discussion
4. Materials and Methods
4.1. Samples Collection
4.2. Isolation of Actinomycetial Strains
4.3. Phylogenetic Analysis
4.4. Extracts Preparation and Bioactivity Assay
4.5. PCA and OPLS-DA Analysis
4.6. Molecular Network Analysis
4.7. Scale-Up Fermentation, Extraction, and Purification of Natural Products
5. Conclusions
Supplementary Materials
Author Contributions
Funding
Data Availability Statement
Acknowledgments
Conflicts of Interest
References
- Willyard, C. The drug-resistant bacteria that pose the greatest health threats. Nature 2017, 543, 15. [Google Scholar] [CrossRef] [PubMed] [Green Version]
- Tacconelli, E.; Carrara, E.; Savoldi, A.; Harbarth, S.; Mendelson, M.; Monnet, D.L.; Pulcini, C.; Kahlmeter, G.; Kluytmans, J.; Carmeli, Y. Discovery, research, and development of new antibiotics: The WHO priority list of antibiotic-resistant bacteria and tuberculosis. Lancet Infect. Dis. 2018, 18, 318–327. [Google Scholar] [CrossRef]
- Walsh, C.T.; Fischbach, M.A. Natural products version 2.0: Connecting genes to molecules. J. Am. Chem. Soc. 2010, 132, 2469–2493. [Google Scholar] [CrossRef] [PubMed] [Green Version]
- Newman, D.J.; Cragg, G.M. Natural products as sources of new drugs over the nearly four decades from 01/1981 to 09/2019. J. Nat. Prod. 2020, 83, 770–803. [Google Scholar] [CrossRef]
- Salam, N.; Jiao, J.Y.; Zhang, X.T.; Li, W.J. Update on the classification of higher ranks in the phylum Actinobacteria. Int. J. Syst. Evol. Microbiol. 2020, 70, 1331–1355. [Google Scholar] [CrossRef]
- Procópio, R.E.; Silva, I.R.; Martins, M.K.; Azevedo, J.L.; Araújo, J.M. Antibiotics produced by Streptomyces. Braz. J. Infect. Dis. 2012, 16, 466–471. [Google Scholar] [CrossRef] [Green Version]
- Watve, M.G.; Tickoo, R.; Jog, M.M.; Bhole, B.D. How many antibiotics are produced by the genus Streptomyces? Arch. Microbiol. 2001, 176, 386–390. [Google Scholar] [CrossRef]
- Clardy, J.; Fischbach, M.A.; Walsh, C.T. New antibiotics from bacterial natural products. Nat. Biotechnol. 2006, 24, 1541–1550. [Google Scholar] [CrossRef]
- Genilloud, O. Actinomycetes: Still a source of novel antibiotics. Nat. Prod. Rep. 2017, 34, 1203–1232. [Google Scholar] [CrossRef]
- Kamjam, M.; Sivalingam, P.; Deng, Z.; Hong, K. Deep sea actinomycetes and their secondary metabolites. Front. Microbiol. 2017, 8, 760. [Google Scholar] [CrossRef] [Green Version]
- Mohammadipanah, F.; Wink, J. Actinobacteria from arid and desert habitats: Diversity and biological activity. Front. Microbiol. 2015, 6, 1541. [Google Scholar] [CrossRef] [Green Version]
- Tian, Y.; Li, Y.L.; Zhao, F.C. Secondary metabolites from polar organisms. Mar. Drugs 2017, 15, 28. [Google Scholar] [CrossRef] [Green Version]
- Xu, D.B.; Ye, W.W.; Han, Y.; Deng, Z.X.; Hong, K. Natural products from mangrove actinomycetes. Mar. Drugs 2014, 12, 2590–2613. [Google Scholar] [CrossRef] [Green Version]
- Azman, A.S.; Othman, I.; Velu, S.S.; Chan, K.G.; Lee, L.H. Mangrove rare actinobacteria: Taxonomy, natural compound, and discovery of bioactivity. Front. Microbiol. 2015, 6, 856. [Google Scholar] [CrossRef]
- Ancheeva, E.; Daletos, G.; Proksch, P. Lead compounds from mangrove-associated microorganisms. Mar. Drugs 2018, 16, 319. [Google Scholar] [CrossRef] [Green Version]
- Hong, K.; Gao, A.H.; Xie, Q.Y.; Gao, H.G.; Zhuang, L.; Lin, H.P.; Yu, H.P.; Li, J.; Yao, X.S.; Goodfellow, M.; et al. Actinomycetes for marine drug discovery isolated from mangrove soils and plants in China. Mar. Drugs 2009, 7, 24–44. [Google Scholar] [CrossRef]
- Tong, L.Y. Isolation and Identification of Actinomycetes from Soil of Root System of Mangrove Forest in Zhanjiang; Guangdong Ocean University: Zhanjiang, China, 2011. [Google Scholar]
- Xu, M.; Li, J.; Dai, S.J.; Gao, C.Y.; Liu, J.M.; Tuo, L.; Wang, F.F.; Li, X.J.; Liu, S.W.; Jiang, Z.K.; et al. Study on diversity and bioactivity of actinobacteria isolated from mangrove plants collected from Zhanjiang in Guangdong Province. Chin. J. Antibiot. 2016, 41, 26–34. [Google Scholar]
- Betancur, L.A.; Naranjo-Gaybor, S.J.; Vinchira-Villarraga, D.M.; Moreno-Sarmiento, N.C.; Maldonado, L.A.; Suarez-Moreno, Z.R.; Acosta-González, A.; Padilla-Gonzalez, G.F.; Puyana, M.; Castellanos, L.; et al. Marine actinobacteria as a source of compounds for phytopathogen control: An integrative metabolic-profiling/bioactivity and taxonomical approach. PLoS ONE 2017, 12, e0170148. [Google Scholar] [CrossRef]
- Sebak, M.; Saafan, A.E.; AbdelGhani, S.; Bakeer, W.; El-Gendy, A.O.; Espriu, L.C.; Duncan, K.; Edrada-Ebel, R. Bioassay- and metabolomics-guided screening of bioactive soil actinomycetes from the ancient city of Ihnasia, Egypt. PLoS ONE 2019, 14, e0226959. [Google Scholar] [CrossRef] [Green Version]
- Hou, Y.P.; Braun, D.R.; Michel, C.R.; Klassen, J.L.; Adnani, N.; Wyche, T.P.; Bugni, T.S. Microbial strain prioritization using metabolomics tools for the discovery of natural products. Anal. Chem. 2012, 84, 4277–4283. [Google Scholar] [CrossRef]
- Villas-Bôas, S.G.; Mas, S.; Åkesson, M.; Smedsgaard, J.; Nielsen, J. Mass spectrometry in metabolome analysis. Mass Spectrom. Rev. 2005, 24, 613–646. [Google Scholar] [CrossRef]
- Samat, N.; Tan, P.J.; Shaari, K.; Abas, F.; Lee, H.B. Prioritization of natural extracts by LC-MS-PCA for the identification of new photosensitizers for photodynamic therapy. Anal. Chem. 2014, 86, 1324–1331. [Google Scholar] [CrossRef]
- Forner, D.; Berrué, F.; Correa, H.; Duncan, K.; Kerr, R.G. Chemical dereplication of marine actinomycetes by liquid chromatography–high resolution mass spectrometry profiling and statistical analysis. Anal. Chim. Acta 2013, 805, 70–79. [Google Scholar] [CrossRef]
- Gill, K.A.; Berrué, F.; Arens, J.C.; Kerr, R.G. Isolation and structure elucidation of cystargamide, a lipopeptide from Kitasatospora cystarginea. J. Nat. Prod. 2014, 77, 1372–1376. [Google Scholar] [CrossRef]
- Stewart, A.K.; Ravindra, R.; Van Wagoner, R.M.; Wright, J.L.C. Metabolomics-guided discovery of microginin peptides from cultures of the cyanobacterium Microcystis aeruginosa. J. Nat. Prod. 2018, 81, 349–355. [Google Scholar] [CrossRef]
- Gill, K.A.; Berrué, F.; Arens, J.C.; Carr, G.; Kerr, R.G. Cystargolides, 20S proteasome inhibitors isolated from Kitasatospora cystarginea. J. Nat. Prod. 2015, 78, 822–826. [Google Scholar] [CrossRef]
- Abdelmohsen, U.R.; Cheng, C.; Viegelmann, C.; Zhang, T.; Grkovic, T.; Ahmed, S.; Quinn, R.J.; Hentschel, U.; Edrada-Ebel, R. Dereplication strategies for targeted isolation of new antitrypanosomal actinosporins A and B from a marine sponge associated-Actinokineospora sp. EG49. Mar. Drugs 2014, 12, 1220–1244. [Google Scholar] [CrossRef] [Green Version]
- Tawfike, A.; Attia, E.Z.; Desoukey, S.Y.; Hajjar, D.; Makki, A.A.; Schupp, P.J.; Edrada-Ebel, R.; Abdelmohsen, U.R. New bioactive metabolites from the elicited marine sponge-derived bacterium Actinokineospora spheciospongiae sp. nov. AMB Express 2019, 9, 12. [Google Scholar] [CrossRef]
- Yang, J.Y.; Sanchez, L.M.; Rath, C.M.; Liu, X.T.; Boudreau, P.D.; Bruns, N.; Glukhov, E.; Wodtke, A.; de Felicio, R.; Fenner, A.; et al. Molecular networking as a dereplication strategy. J. Nat. Prod. 2013, 76, 1686–1699. [Google Scholar] [CrossRef] [Green Version]
- Tangerina, M.M.P.; Furtado, L.C.; Leite, V.M.B.; Bauermeister, A.; Velasco-Alzate, K.; Jimenez, P.C.; Garrido, L.M.; Padilla, G.; Lopes, N.P.; Costa-Lotufo, L.V.; et al. Metabolomic study of marine Streptomyces sp.: Secondary metabolites and the production of potential anticancer compounds. PLoS ONE 2020, 15, e0244385. [Google Scholar] [CrossRef]
- Wang, M.X.; Carver, J.J.; Phelan, V.V.; Sanchez, L.M.; Garg, N.; Peng, Y.; Nguyen, D.D.; Watrous, J.; Kapono, C.A.; Luzzatto-Knaan, T.; et al. Sharing and community curation of mass spectrometry data with Global Natural Products Social Molecular Networking. Nat. Biotechnol. 2016, 34, 828–837. [Google Scholar] [CrossRef] [PubMed] [Green Version]
- Van Santen, J.A.; Jacob, G.; Singh, A.L.; Aniebok, V.; Balunas, M.J.; Bunsko, D.; Neto, F.C.; Castaño-Espriu, L.; Chang, C.; Clark, T.N.; et al. The Natural products atlas: An open access knowledge base for microbial natural products discovery. ACS Cent. Sci. 2019, 5, 1824–1833. [Google Scholar] [CrossRef] [PubMed] [Green Version]
- Moumbock, A.F.; Gao, M.; Qaseem, A.; Li, J.; Kirchner, P.A.; Ndingkokhar, B.; Bekono, B.D.; Simoben, C.V.; Babiaka, S.B.; Malange, Y.I.; et al. StreptomeDB 3.0: An updated compendium of streptomycetes natural products. Nucleic Acids Res. 2020, 49, D600–D604. [Google Scholar] [CrossRef] [PubMed]
- Zhang, X.F.; Ye, X.W.; Chai, W.Y.; Lian, X.Y.; Zhang, Z.Z. New metabolites and bioactive actinomycins from marine-derived Streptomyces sp. ZZ338. Mar. Drugs 2016, 14, 181. [Google Scholar] [CrossRef] [PubMed] [Green Version]
- Lackner, H.; Bahner, I.; Shigematsu, N.; Pannell, L.K.; Mauger, A.B. Structures of five components of the actinomycin Z complex from Streptomyces fradiae, two of which contain 4-chlorothreonine. J. Nat. Prod. 2000, 63, 352–356. [Google Scholar] [CrossRef] [PubMed]
- David, L.; Ayala, H.L.; Tabet, J.C. Abierixin, a new polyether antibiotic. Production, structural determination and biological activities. J. Antibiot. 1985, 38, 1655–1663. [Google Scholar] [CrossRef] [Green Version]
- Zhao, X.; Wang, B.; Xie, K.Z.; Liu, J.Y.; Zhang, Y.Y.; Wang, Y.J.; Guo, Y.W.; Zhang, G.X.; Dai, G.J.; Wang, J.Y. Development and comparison of HPLC-MS/MS and UPLC-MS/MS methods for determining eight coccidiostats in beef. J. Chromatogr. B Analyt. Technol. Biomed. Life Sci. 2018, 1087–1088, 98–107. [Google Scholar] [CrossRef]
- Martínez-Villalba, A.; Moyano, E.; Galceran, M.T. Fast liquid chromatography/multiple-stage mass spectrometry of coccidiostats. Rapid Commun. Mass Spectrom. 2009, 23, 1255–1263. [Google Scholar] [CrossRef]
- Takahashi, K.; Yoshihara, T.; Kurosawa, K. Ushikulides A and B, immunosuppressants produced by a strain of Streptomyces sp. J. Antibiot. 2005, 58, 420–424. [Google Scholar] [CrossRef] [Green Version]
- Mouslim, J.; Cuer, A.; David, L.; Tabet, J.C. Epigrisorixin, a new polyether carboxylic antibiotic. J. Antibiot. 1993, 46, 201–203. [Google Scholar] [CrossRef]
- Gachon, P.; Kergomard, A.; Veschambre, H.; Esteve, C.; Staron, T. Grisorixin, a new antibiotic related to nigericin. J. Chem. Soc. D 1970, 21, 1421–1422. [Google Scholar] [CrossRef]
- Cui, H.; Liu, Y.N.; Li, J.; Huang, X.S.; Yan, T.; Cao, W.H.; Liu, H.J.; Long, Y.H.; She, Z.G. Diaporindenes A–D: Four unusual 2,3-dihydro-1H-indene analogues with anti-inflammatory activities from the mangrove endophytic fungus Diaporthe sp. SYSU-HQ3. J. Org. Chem. 2018, 83, 11804–11813. [Google Scholar] [CrossRef]
- An, C.Y.; Li, X.M.; Luo, H.; Li, C.S.; Wang, M.H.; Xu, G.M.; Wang, B.G. 4-Phenyl-3,4-dihydroquinolone derivatives from Aspergillus nidulans MA-143, an endophytic fungus isolated from the mangrove plant Rhizophora stylosa. J. Nat. Prod. 2013, 76, 1896–1901. [Google Scholar] [CrossRef]
- Sato, K.; Goda, Y.; Sasaki, S.S.; Shibata, H.; Maitani, T.; Yamada, T. Identification of major pigments containing D-amino acid units in commercial Monascus pigments. Chem. Pharm. Bull. 1997, 45, 227–229. [Google Scholar] [CrossRef] [Green Version]
- Guo, J.; Huan, T. Comparison of Full-Scan, Data-Dependent, and Data-Independent Acquisition modes in liquid chromatography–mass spectrometry based untargeted metabolomics. Anal. Chem. 2020, 92, 8072–8080. [Google Scholar] [CrossRef]
- Nikolskiy, I.; Mahieu, N.G.; Chen, Y., Jr.; Tautenhahn, R.; Patti, G.J. An untargeted metabolomic workflow to improve structural characterization of metabolites. Anal. Chem. 2013, 85, 7713–7719. [Google Scholar] [CrossRef] [Green Version]
- Helm, S.; Baginsky, S. MSE for label-free absolute protein quantification in complex proteomes. Methods Mol. Biol. 2018, 1696, 235–247. [Google Scholar]
- Baksh, A.; Kepplinger, B.; Isah, H.A.; Probert, M.R.; Clegg, W.; Wills, C.; Goodfellow, M.; Errington, J.; Allenby, N.; Hall, M.J. Production of 17-O-demethyl-geldanamycin, a cytotoxic ansamycin polyketide, by Streptomyces hygroscopicus DEM20745. Nat. Prod. Res. 2017, 31, 1895–1900. [Google Scholar] [CrossRef]
- Lin, H.N.; Wang, K.L.; Wu, Z.H.; Tian, R.M.; Liu, G.Z.; Xu, Y. Biological and chemical diversity of bacteria associated with a marine flatworm. Mar. Drugs 2017, 15, 281. [Google Scholar] [CrossRef] [Green Version]
- DeBoer, C.; Meulman, P.A.; Wnuk, R.J.; Peterson, D.H. Geldanamycin, a new antibiotic. J. Antibiot. 1970, 23, 442–447. [Google Scholar] [CrossRef]
- Maskey, R.P.; Sevvana, M.; Usón, I.; Helmke, E.; Laatsch, H. Gutingimycin: A highly complex metabolite from a marine Streptomycete. Angew. Chem. Int. Ed. 2004, 43, 1281–1283. [Google Scholar] [CrossRef]
- Tamaoki, T.; Shirahata, K.; Iida, T.; Tomita, F. Trioxacarcins, novel antitumor antibiotics. II. Isolation, physico-chemical properties and mode of action. J. Antibiot. 1981, 34, 1525–1530. [Google Scholar] [CrossRef] [Green Version]
- Maoka, T.; Takemura, M.; Tokuda, H.; Suzuki, N.; Misawa, N. 4-Ketozeinoxanthin, a novel carotenoid produced in Escherichia coli through metabolic engineering using carotenogenic genes of bacterium and liverwort. Tetrahedron Lett. 2014, 55, 6708–6710. [Google Scholar] [CrossRef]
- Wong, W.R.; Oliver, A.G.; Linington, R.G. Development of antibiotic activity profile screening for the classification and discovery of natural product antibiotics. Chem. Biol. 2012, 19, 1483–1495. [Google Scholar] [CrossRef] [Green Version]
- Kihara, T.; Kusakabe, H.; Nakamura, G.; Sakurai, T.; Isono, K. Cytovaricin, a novel antibiotic. J. Antibiot. 1981, 34, 1073–1074. [Google Scholar] [CrossRef] [PubMed] [Green Version]
- Cai, R.S.; Wu, J.M. Biochemical and biological characterization of ionophorous antibiotic W341. Chin. J. Antibiot. 1985, 10, 342–347. [Google Scholar]
- Crusemann, M.; O’Neill, E.C.; Larson, C.B.; Melnik, A.V.; Floros, D.J.; da Silva, R.R.; Jensen, P.R.; Dorrestein, P.C.; Moore, B.S. Prioritizing natural product diversity in a collection of 146 bacterial strains based on growth and extraction protocols. J. Nat. Prod. 2016, 80, 588–597. [Google Scholar] [CrossRef] [Green Version]
- Tomita, F.; Tamaoki, T.; Shirahata, K.; Iida, T.; Morimoto, M.; Fujimoto, K. Antibiotic substances DC-45, and their use as medicaments. U.S. Patent No. 4511560, 16 April 1985. [Google Scholar]
- Maskey, R.P.; Helmke, E.; Kayser, O.; Fiebig, H.H.; Maier, A.; Busche, A.; Laatsch, H. Anti-cancer and antibacterial trioxacarcins with high anti-malaria activity from a marine Streptomycete and their absolute stereochemistry. J. Antibiot. 2004, 57, 771–779. [Google Scholar] [CrossRef] [Green Version]
- Nicolaou, K.C.; Cai, Q.; Sun, H.; Qin, B.; Zhu, S. Total synthesis of trioxacarcins DC-45-A1, A, D, C, and C7″-epi-C and full structural assignment of trioxacarcin C. J. Am. Chem. Soc. 2016, 138, 3118–3124. [Google Scholar] [CrossRef]
- Li, F.N.; Liu, S.W.; Lu, Q.P.; Zheng, H.Y.; Osterman, I.A.; Lukyanov, D.A.; Sergiev, P.V.; Dontsova, O.A.; Liu, S.S.; Ye, J.J.; et al. Studies on antibacterial activity and diversity of cultivable actinobacteria isolated from mangrove soil in futian and maoweihai of China. Evid. Based Complement. Alternat. Med. 2019, 2019, 3476567. [Google Scholar] [CrossRef] [Green Version]
- Lu, Q.P.; Ye, J.J.; Huang, Y.M.; Liu, D.; Liu, L.F.; Dong, K.; Razumova, E.A.; Osterman, I.A.; Sergiev, P.V.; Dontsova, O.A.; et al. Exploitation of potentially new antibiotics from mangrove actinobacteria in Maowei Sea by combination of multiple discovery strategies. Antibiotics 2019, 8, 236. [Google Scholar] [CrossRef] [PubMed] [Green Version]
- Feling, R.H.; Buchanan, G.O.; Mincer, T.J.; Kauffman, C.A.; Jensen, P.R.; Fenical, W. Salinosporamide A: A Highly Cytotoxic Proteasome Inhibitor from a Novel Microbial Source, a Marine Bacterium of the New Genus Salinospora. Angew. Chem. Int. Ed. 2003, 42, 355–357. [Google Scholar] [CrossRef] [PubMed]
- Chauhan, D.; Catley, L.; Li, G.; Podar, K.; Hideshima, T.; Velankar, M.; Mitsiades, C.; Mitsiades, N.; Yasui, H.; Letai, A.; et al. A novel orally active proteasome inhibitor induces apoptosis in multiple myeloma cells with mechanisms distinct from Bortezomib. Cancer Cell 2005, 8, 407–419. [Google Scholar] [CrossRef] [PubMed] [Green Version]
- Ding, L.; Münch, J.; Goerls, H.; Maier, A.; Fiebig, H.-H.; Lin, W.-H.; Hertweck, C. Xiamycin, a pentacyclic indolosesquiterpene with selective anti-HIV activity from a bacterial mangrove endophyte. Bioorg. Med. Chem. Lett. 2010, 20, 6685–6687. [Google Scholar] [CrossRef]
- Gao, X.M.; Han, W.D.; Liu, S.Q. The mangrove and its conservation in Leizhou Peninsula, China. J. For. Res. 2009, 20, 174–178. [Google Scholar] [CrossRef]
- Li, M.S.; Mao, L.J.; Shen, W.J.; Liu, S.Q.; Wei, A.S. Change and fragmentation trends of Zhanjiang mangrove forests in southern China using multi-temporal Landsat imagery (1977–2010). Estuar. Coast. Shelf Sci. 2013, 130, 111–120. [Google Scholar] [CrossRef]
- Hazarika, S.N.; Thakur, D. Chapter 21—Actinobacteria. In Beneficial Microbes in Agro-Ecology; Amaresan, N., Kumar, M.S., Annapurna, K., Kumar, K., Sankaranarayanan, A., Eds.; Academic Press: Cambridge, MA, USA, 2020; pp. 443–476. [Google Scholar] [CrossRef]
- Harikrishnan, H.; Shanmugaiah, V.; Nithya, K.; Balasubramanian, N.; Sharma, M.P.; Gachomo, E.W.; Kotchoni, S.O. Enhanced production of phenazine-like metabolite produced by Streptomyces aurantiogriseus VSMGT1014 against rice pathogen, Rhizoctonia solani. J. Basic Microbiol. 2016, 56, 153–161. [Google Scholar] [CrossRef]
- Cheng, C.; MacIntyre, L.; Abdelmohsen, U.R.; Horn, H.; Polymenakou, P.N.; Edrada-Ebel, R.; Hentschel, U. Biodiversity, anti-trypanosomal activity screening, and metabolomic profiling of actinomycetes isolated from mediterranean sponges. PLoS ONE 2015, 10, e0138528. [Google Scholar] [CrossRef]
- Genilloud, O.; González, I.; Salazar, O.; Martín, J.; Tormo, J.R.; Vicente, F. Current approaches to exploit actinomycetes as a source of novel natural products. J. Ind. Microbiol. Biotechnol. 2011, 38, 375–389. [Google Scholar] [CrossRef]
- Liu, X.Y.; Ashforth, E.; Ren, B.; Song, F.H.; Dai, H.Q.; Liu, M.; Wang, J.; Xie, Q.; Zhang, L.X. Bioprospecting microbial natural product libraries from the marine environment for drug discovery. J. Antibiot. 2010, 63, 415–422. [Google Scholar] [CrossRef] [Green Version]
- Stuart, K.A.; Welsh, K.; Walker, M.C.; Edrada-Ebel, R. Metabolomic tools used in marine natural product drug discovery. Expert Opin. Drug Discov. 2020, 15, 499–522. [Google Scholar] [CrossRef]
- Gu, R.H.; Rybalov, L.; Negrin, A.; Morcol, T.; Long, W.W.; Myers, A.K.; Isaac, G.; Yuk, J.; Kennelly, E.J.; Long, C.L. Metabolic profiling of different parts of Acer truncatum from the Mongolian Plateau using UPLC-QTOF-MS with comparative bioactivity assays. J. Agric. Food. Chem. 2019, 67, 1585–1597. [Google Scholar] [CrossRef]
- Tomita, F.; Tamaoki, T.; Morimoto, M.; Fujimoto, K. Trioxacarcins, novel antitumor antibiotics. I. Producing organism, fermentation and biological activities. J. Antibiot. 1981, 34, 1519–1524. [Google Scholar] [CrossRef] [Green Version]
- Magauer, T.; Smaltz, D.J.; Myers, A.G. Component-based syntheses of trioxacarcin A, DC-45-A1 and structural analogues. Nat. Chem. 2013, 5, 886–893. [Google Scholar] [CrossRef] [Green Version]
- Arshad, M.; Sharif, A.; Ahmed, E.; Bariyah, S. Trioxacarcins as a promising class of anticancer drugs. World J. Pharm. Pharm. Sci. 2019, 8, 81–107. [Google Scholar]
- Nicolaou, K.C.; Chen, P.; Zhu, S.; Cai, Q.; Erande, R.D.; Li, R.; Sun, H.; Pulukuri, K.K.; Rigol, S.; Aujay, M.; et al. Streamlined total synthesis of trioxacarcins and its application to the design, synthesis, and biological evaluation of analogues thereof. discovery of simpler designed and potent trioxacarcin analogues. J. Am. Chem. Soc. 2017, 139, 15467–15478. [Google Scholar] [CrossRef]
- Nicolaou, K.C.; Cai, Q.; Qin, B.; Petersen, M.T.; Mikkelsen, R.J.; Heretsch, P. Total synthesis of trioxacarcin DC-45-A2. Angew. Chem. Int. Ed. Engl. 2015, 54, 3074–3078. [Google Scholar] [CrossRef]
- Zhang, M.; Hou, X.-F.; Qi, L.-H.; Yin, Y.; Li, Q.; Pan, H.-X.; Chen, X.-Y.; Tang, G.-L. Biosynthesis of trioxacarcin revealing a different starter unit and complex tailoring steps for type II polyketide synthase. Chem. Sci. 2015, 6, 3440–3447. [Google Scholar] [CrossRef] [Green Version]
- Shen, Y.; Nie, Q.-Y.; Yin, Y.; Pan, H.-X.; Xu, B.; Tang, G.-L. Production of a trioxacarcin analog by introducing a C-3 dehydratase into deoxysugar biosynthesis. Acta Biochim. Biophys. Sin. 2019, 51, 539–541. [Google Scholar] [CrossRef]
- Qi, L.-H.; Zhang, M.; Pan, H.-X.; Chen, X.-D.; Tang, G.-L. Production of a trioxacarcin analogue by engineering of its biosynthetic pathway. Chin. J. Org. Chem. 2014, 34, 1376. [Google Scholar] [CrossRef] [Green Version]
- Yin, Y.; Shen, Y.; Meng, S.; Zhang, M.; Pan, H.-X.; Tang, G.-L. Characterization of a membrane-bound O-acetyltransferase involved in trioxacarcin biosynthesis offers insights into its catalytic mechanism. Chin. J. Chem 2020, 38, 1607–1611. [Google Scholar] [CrossRef]
- Yang, K.; Qi, L.H.; Zhang, M.; Hou, X.F.; Pan, H.X.; Tang, G.L.; Wang, W.; Yuan, H. The SARP family regulator Txn9 and two-component response regulator Txn11 are key activators for trioxacarcin biosynthesis in Streptomyces bottropensis. Curr. Microbiol. 2015, 71, 458–464. [Google Scholar] [CrossRef]
- Pfoh, R.; Laatsch, H.; Sheldrick, G.M. Crystal structure of trioxacarcin A covalently bound to DNA. Nucleic Acids Res. 2008, 36, 3508–3514. [Google Scholar] [CrossRef]
- Pröpper, K.; Dittrich, B.; Smaltz, D.J.; Magauer, T.; Myers, A.G. Crystalline guanine adducts of natural and synthetic trioxacarcins suggest a common biological mechanism and reveal a basis for the instability of trioxacarcin A. Bioorg. Med. Chem. Lett. 2014, 24, 4410–4413. [Google Scholar] [CrossRef]
- Macintyre, L.; Zhang, T.; Viegelmann, C.; Martinez, I.J.; Cheng, C.; Dowdells, C.; Abdelmohsen, U.R.; Gernert, C.; Hentschel, U.; Edrada-Ebel, R.A. Metabolomic tools for secondary metabolite discovery from marine microbial symbionts. Mar. Drugs 2014, 12, 3416–3448. [Google Scholar] [CrossRef] [Green Version]
- Zhou, S.Q.; Huang, X.L.; Huang, D.Y.; Hu, X.W.; Chen, J.L. A rapid method for extracting DNA from actinomycetes by Chelex-100. Shengwu Jishu Tongbao 2010, 2, 123–125. [Google Scholar]
- Yoon, S.H.; Ha, S.M.; Kwon, S.; Lim, J.; Kim, Y.; Seo, H.; Chun, J. Introducing EzBioCloud: A taxonomically united database of 16S rRNA gene sequences and whole-genome assemblies. Int. J. Syst. Evol. Microbiol. 2017, 67, 1613–1617. [Google Scholar] [CrossRef]
- Kumar, S.; Stecher, G.; Tamura, K. MEGA7: Molecular evolutionary genetics analysis version 7.0 for bigger datasets. Mol. Biol. Evol. 2016, 33, 1870–1874. [Google Scholar] [CrossRef] [Green Version]
- Saitou, N.; Nei, M. The neighbor-joining method: A new method for reconstructing phylogenetic trees. Mol. Biol. Evol. 1987, 4, 406–425. [Google Scholar]
- Letunic, I.; Bork, P. Interactive Tree Of Life (iTOL) v4: Recent updates and new developments. Nucleic Acids Res. 2019, 47, W256–W259. [Google Scholar] [CrossRef] [Green Version]
- Chambers, M.C.; Maclean, B.; Burke, R.; Amodei, D.; Ruderman, D.L.; Neumann, S.; Gatto, L.; Fischer, B.; Pratt, B.; Egertson, J.; et al. A cross-platform toolkit for mass spectrometry and proteomics. Nat. Biotechnol. 2012, 30, 918–920. [Google Scholar] [CrossRef] [PubMed]
- Shannon, P.; Markiel, A.; Ozier, O.; Baliga, N.S.; Wang, J.T.; Ramage, D.; Amin, N.; Schwikowski, B.; Ideker, T. Cytoscape: A software environment for integrated models of biomolecular interaction networks. Genome Res. 2003, 13, 2498–2504. [Google Scholar] [CrossRef] [PubMed]


| Isolates ID | GenBank Accession No. | Top-Hit Taxon (Pairwise Similarity, %) | Diameter of Inhibition Zone (mm) | |
|---|---|---|---|---|
| A. baumannii_S | S. aureus_R | |||
| H7 | MW724538 | Streptomyces malaysiensis NBRC 16446T (100.00) | - | 24 |
| H8 | MW724539 | Streptomyces bungoensis DSM 41781T (99.62) | - | 10 |
| H37 | MW724543 | Streptomyces thermoviolaceus subsp. Thermoviolaceus DSM 40443T (98.50) | 13 | 17 |
| H51 | MW724550 | Streptomyces griseochromogenes ATCC 14511T (99.38) | - | 23 |
| H55 | MW724552 | Streptomyces galbus DSM 40089T (99.50) | - | 24 |
| H65 | MW724554 | Streptomyces griseoincarnatus LMG 19316T (100.00) | - | 18 |
| H112 | MW724556 | Gordonia polyisoprenivorans NBRC 16320T (98.54) | - | 10 |
| H121 | MW724559 | Rhodococcus zopfii NBRC 100606T (100.00) | - | 10 |
| M28 | MW724573 | Streptomyces sundarbansensis MS1/7T (99.76) | - | 11 |
| M106 | MW724593 | Streptomyces geysiriensis NBRC 15413T (99.75) | 10 | 20 |
| M111 | MW724597 | Streptomyces smyrnaeus SM3501T (99.74) | - | 16 |
| Y2 | MW724603 | Streptomyces hygroscopicus subsp. hygroscopicus NBRC 13472T (99.63) | - | 21 |
| Y4 | MW724605 | Streptomyces albogriseolus NRRL B-1305T (100.00) | 10 | 26 |
| Y9 | MW724607 | Streptomyces pluripotens MUSC 135T (99.87) | 17 | 23 |
| Y15 | MW724610 | Streptomyces cellulosae NBRC 13027T (100.00) | - | 11 |
| Y20 | MW724611 | Streptomyces levis NBRC 15423T (99.75) | - | 18 |
| Y46 | MW724616 | Streptomyces antibioticus NBRC 12838T (100.00) | 9 | 25 |
| Y101 | MW724624 | Micromonospora humi DSM 45647T (99.61) | - | 10 |
| Y198 | MW724634 | Micromonospora pallida DSM 43817T (99.13) | - | 14 |
| H12 | MW724637 | Streptomyces similanensis KC-106T (99.13) | 10 | 23 |
| H18 | MW724638 | Streptomyces seoulensis NRRL B-24310T (100.00) | 8 | 20 |
| M22 | MW724664 | Streptomyces shenzhenensis 172115T (99.88) | 16 | 10 |
| M45 | MW724671 | Demequina salsinemoris NBRC 105323T (99.63) | - | 17 |
| Peak ID | Compound | Isolate No. a | Rt (min) | Neutral Mass | Observed m/z | UV-Vis (nm) b | Hit 1 | Hit 2 | Predicted MF e |
|---|---|---|---|---|---|---|---|---|---|
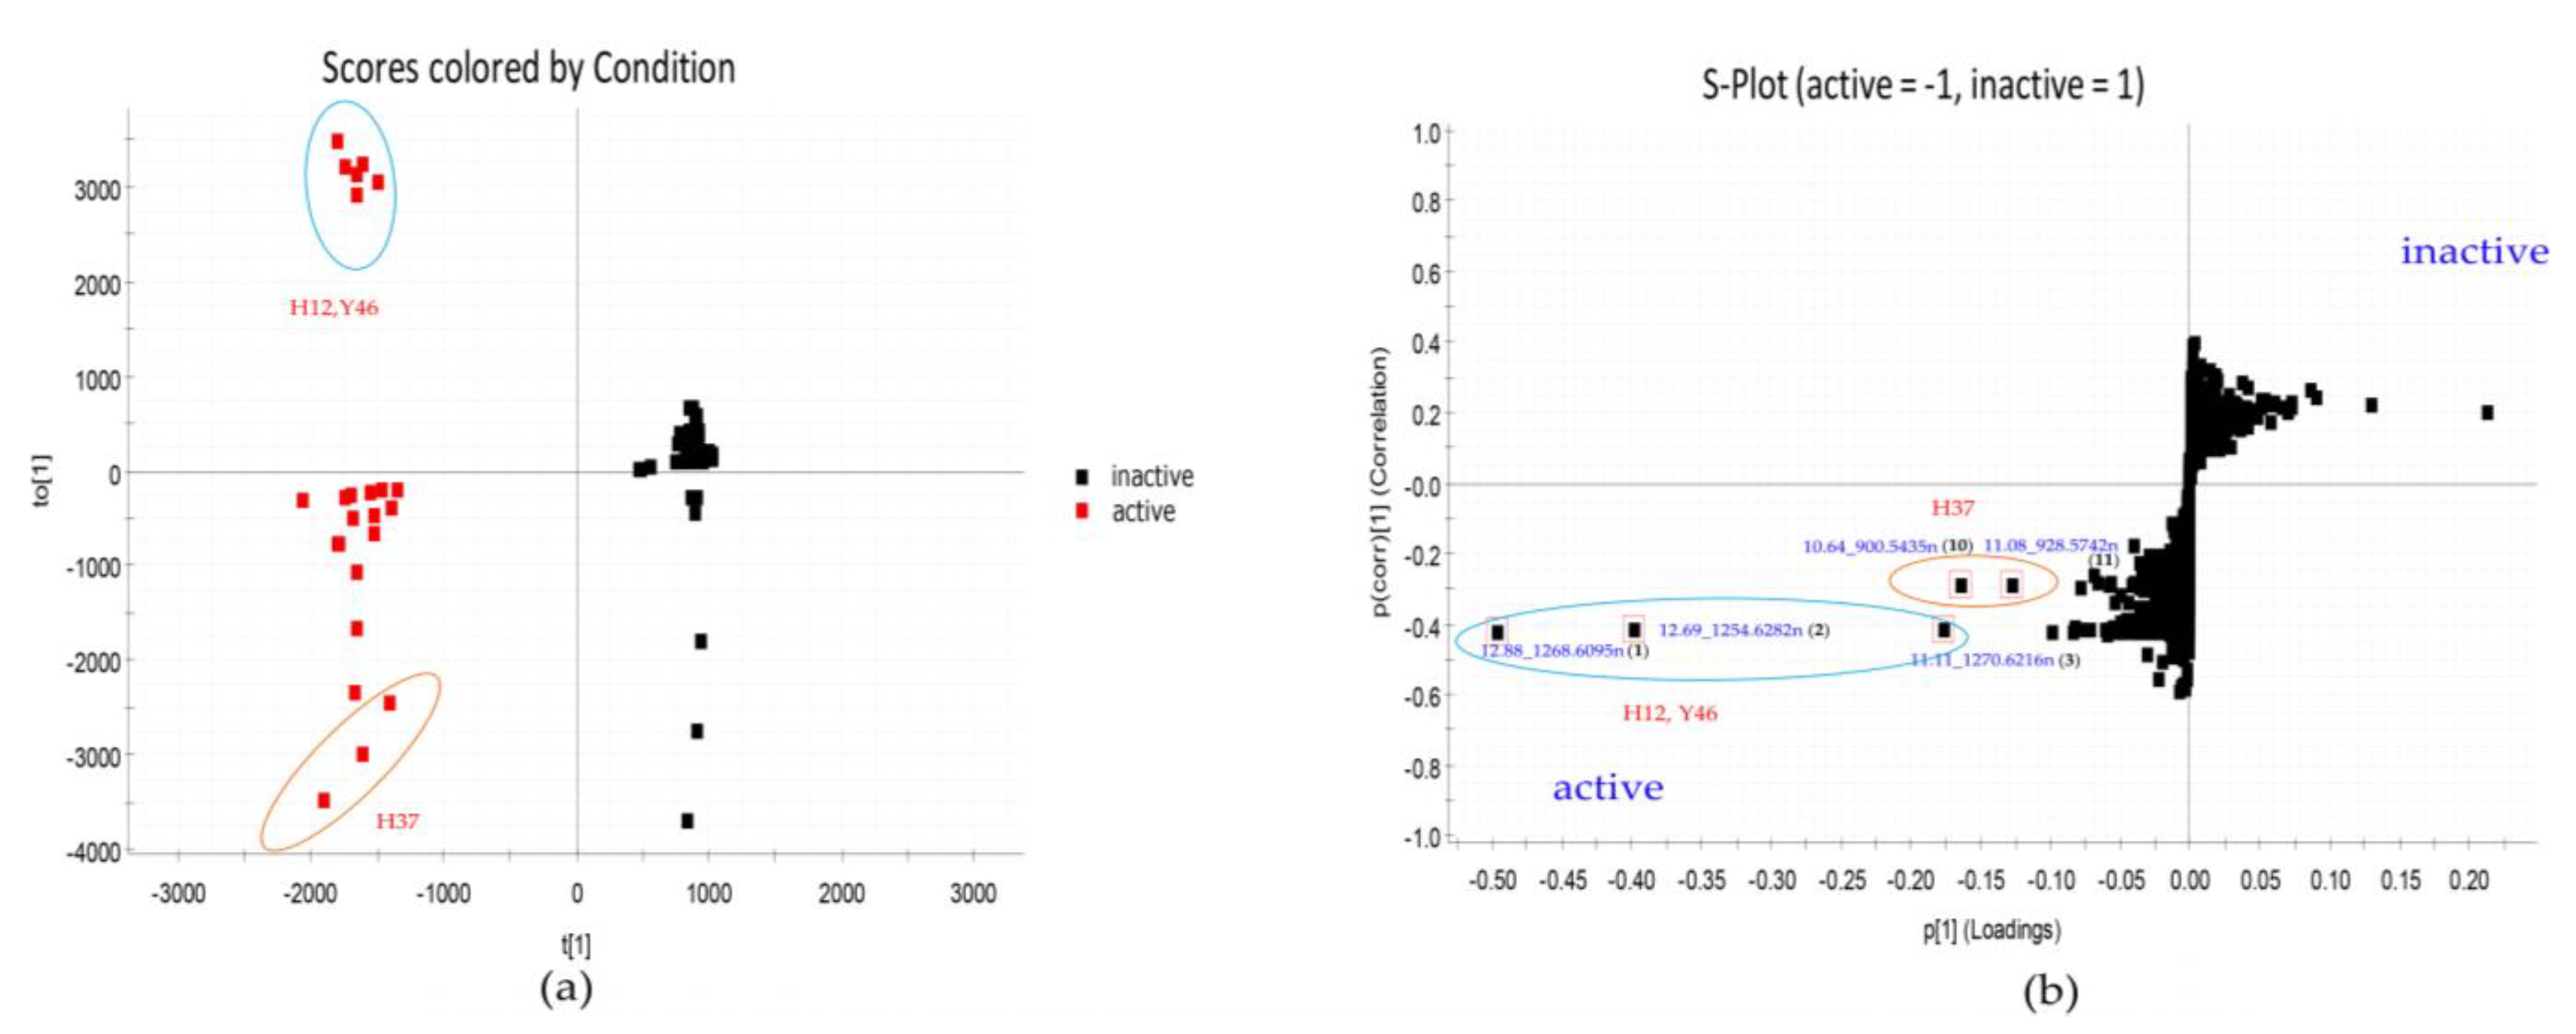
| 1 | 12.88_1268.6095n | H12,Y46 | 12.88 | 1268.6095 | 1269.6168 | 245, 442 | Actinomycin Z4 (1a) | C62H84N12O17 | |
| Actinomycin X2(V) (1b) | C62H84N12O17 | ||||||||
| 2 | 12.69_1254.6282n | H12,Y46 | 12.69 | 1254.6282 | 1255.6355 | 245, 442 | Actinomycin D (2a) | Actinomycin D (2a) | C62H86N12O16 |
| 3 | 11.11_1270.6216n | H12,Y46 | 11.11 | 1270.6216 | 1271.6289 | 245, 442 | Actinomycin X0δ (3a) | C62H86N12O17 | |
| Actinomycin X0β (3b) | C62H86N12O17 | ||||||||
| 4 | 16.71_724.4749n | H7,Y2 | 16.71 | 724.4749 | 747.4654 | - c | Nigericin (4a) | Nigericin (4a) | C40H68O11 |
| Epinigericin (4b) | C40H68O11 | ||||||||
| Abierixin (4c) | C40H68O11 | ||||||||
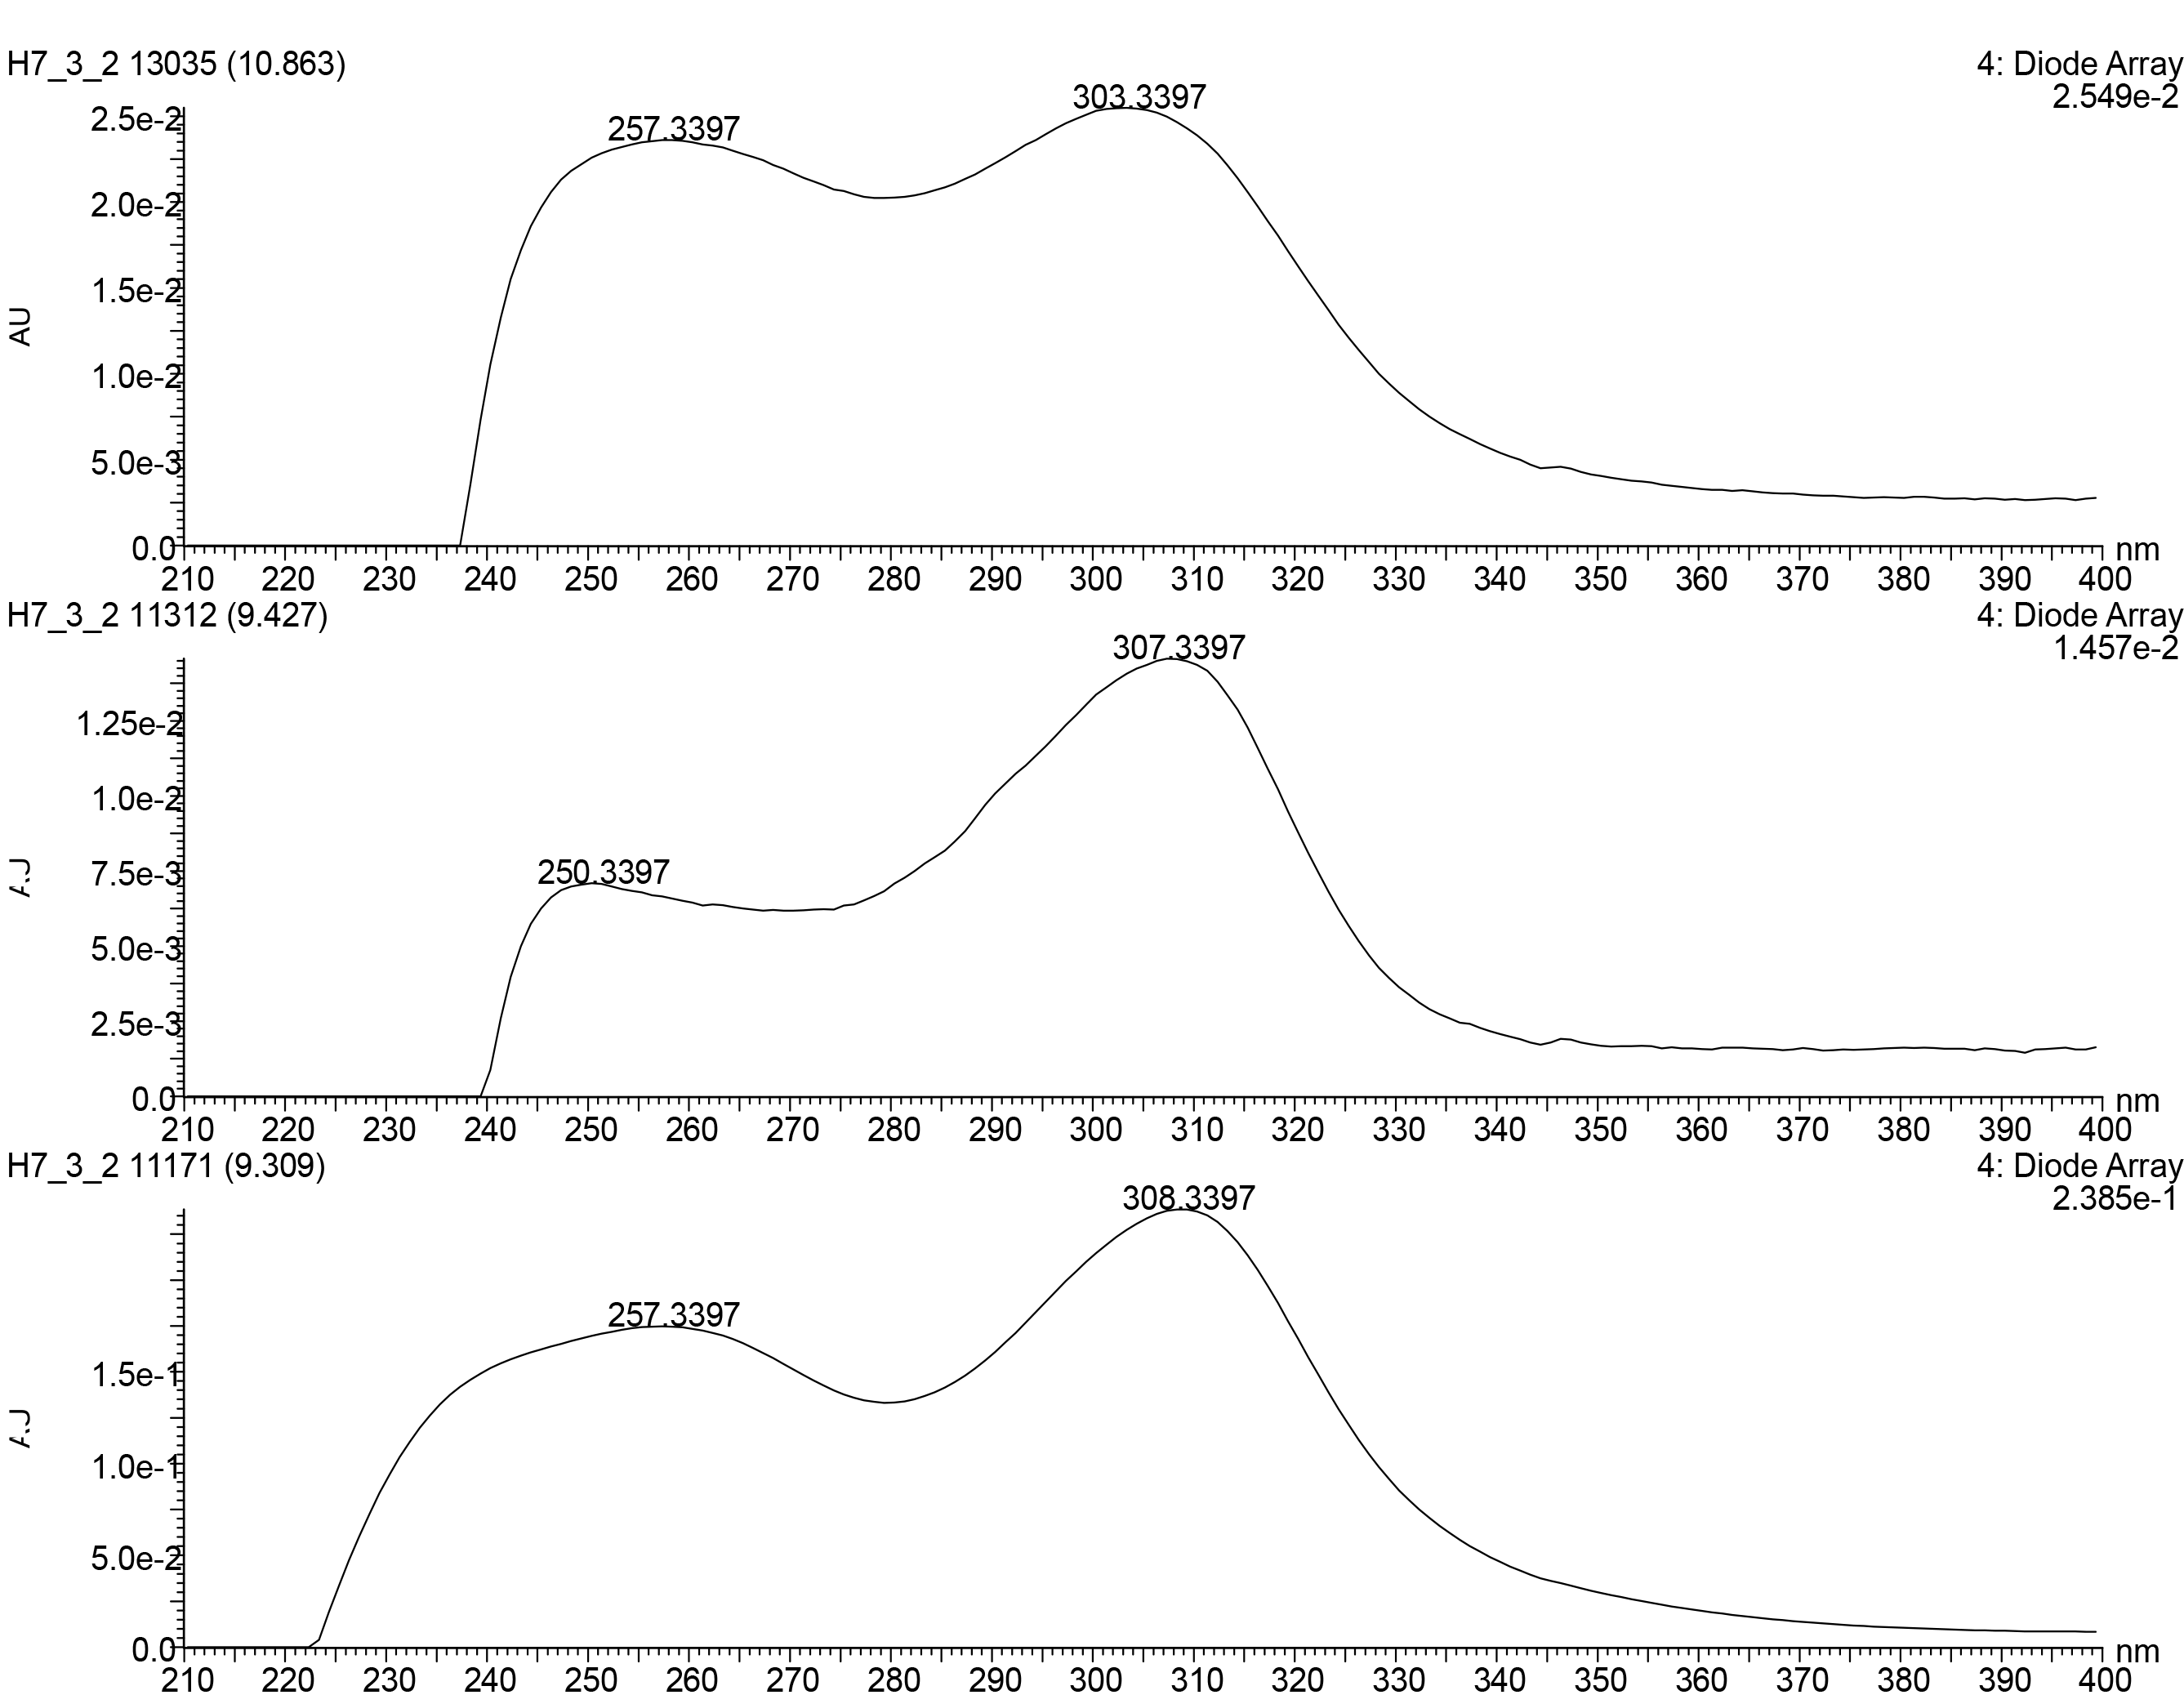
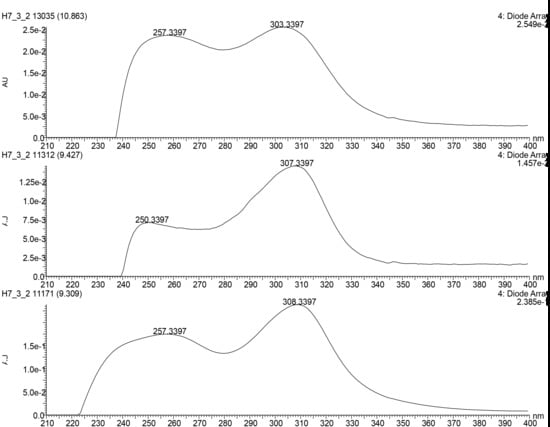
| 5 | 9.35_453.2153n d | H7,Y2 | 9.35 | 453.2153 | 454.2226 | 257, 308 | Diaporisoindole D (5a) | C26H31NO6 | |
| Diaporisoindole E (5b) | C26H31NO6 | ||||||||
| Aniduquinolone B (5c) | C26H31NO6 | ||||||||
| NPA001400 (5d) | C26H31NO6 | ||||||||
| NPA020460 (5e) | C26H31NO6 | ||||||||
| 6 | 18.21_708.4796n | H7,Y2 | 18.21 | 708.4796 | 731.4806 | - c | Grisorixin (6a) | Grisorixin (6a) | C40H68O10 |
| Epigrisorixin (6b) | C40H68O10 | ||||||||
| Ushikulide A (6c) | Ushikulide A (6c) | C40H68O10 | |||||||
| Ushikulide B (6d) | Ushikulide B (6d) | C40H68O10 | |||||||
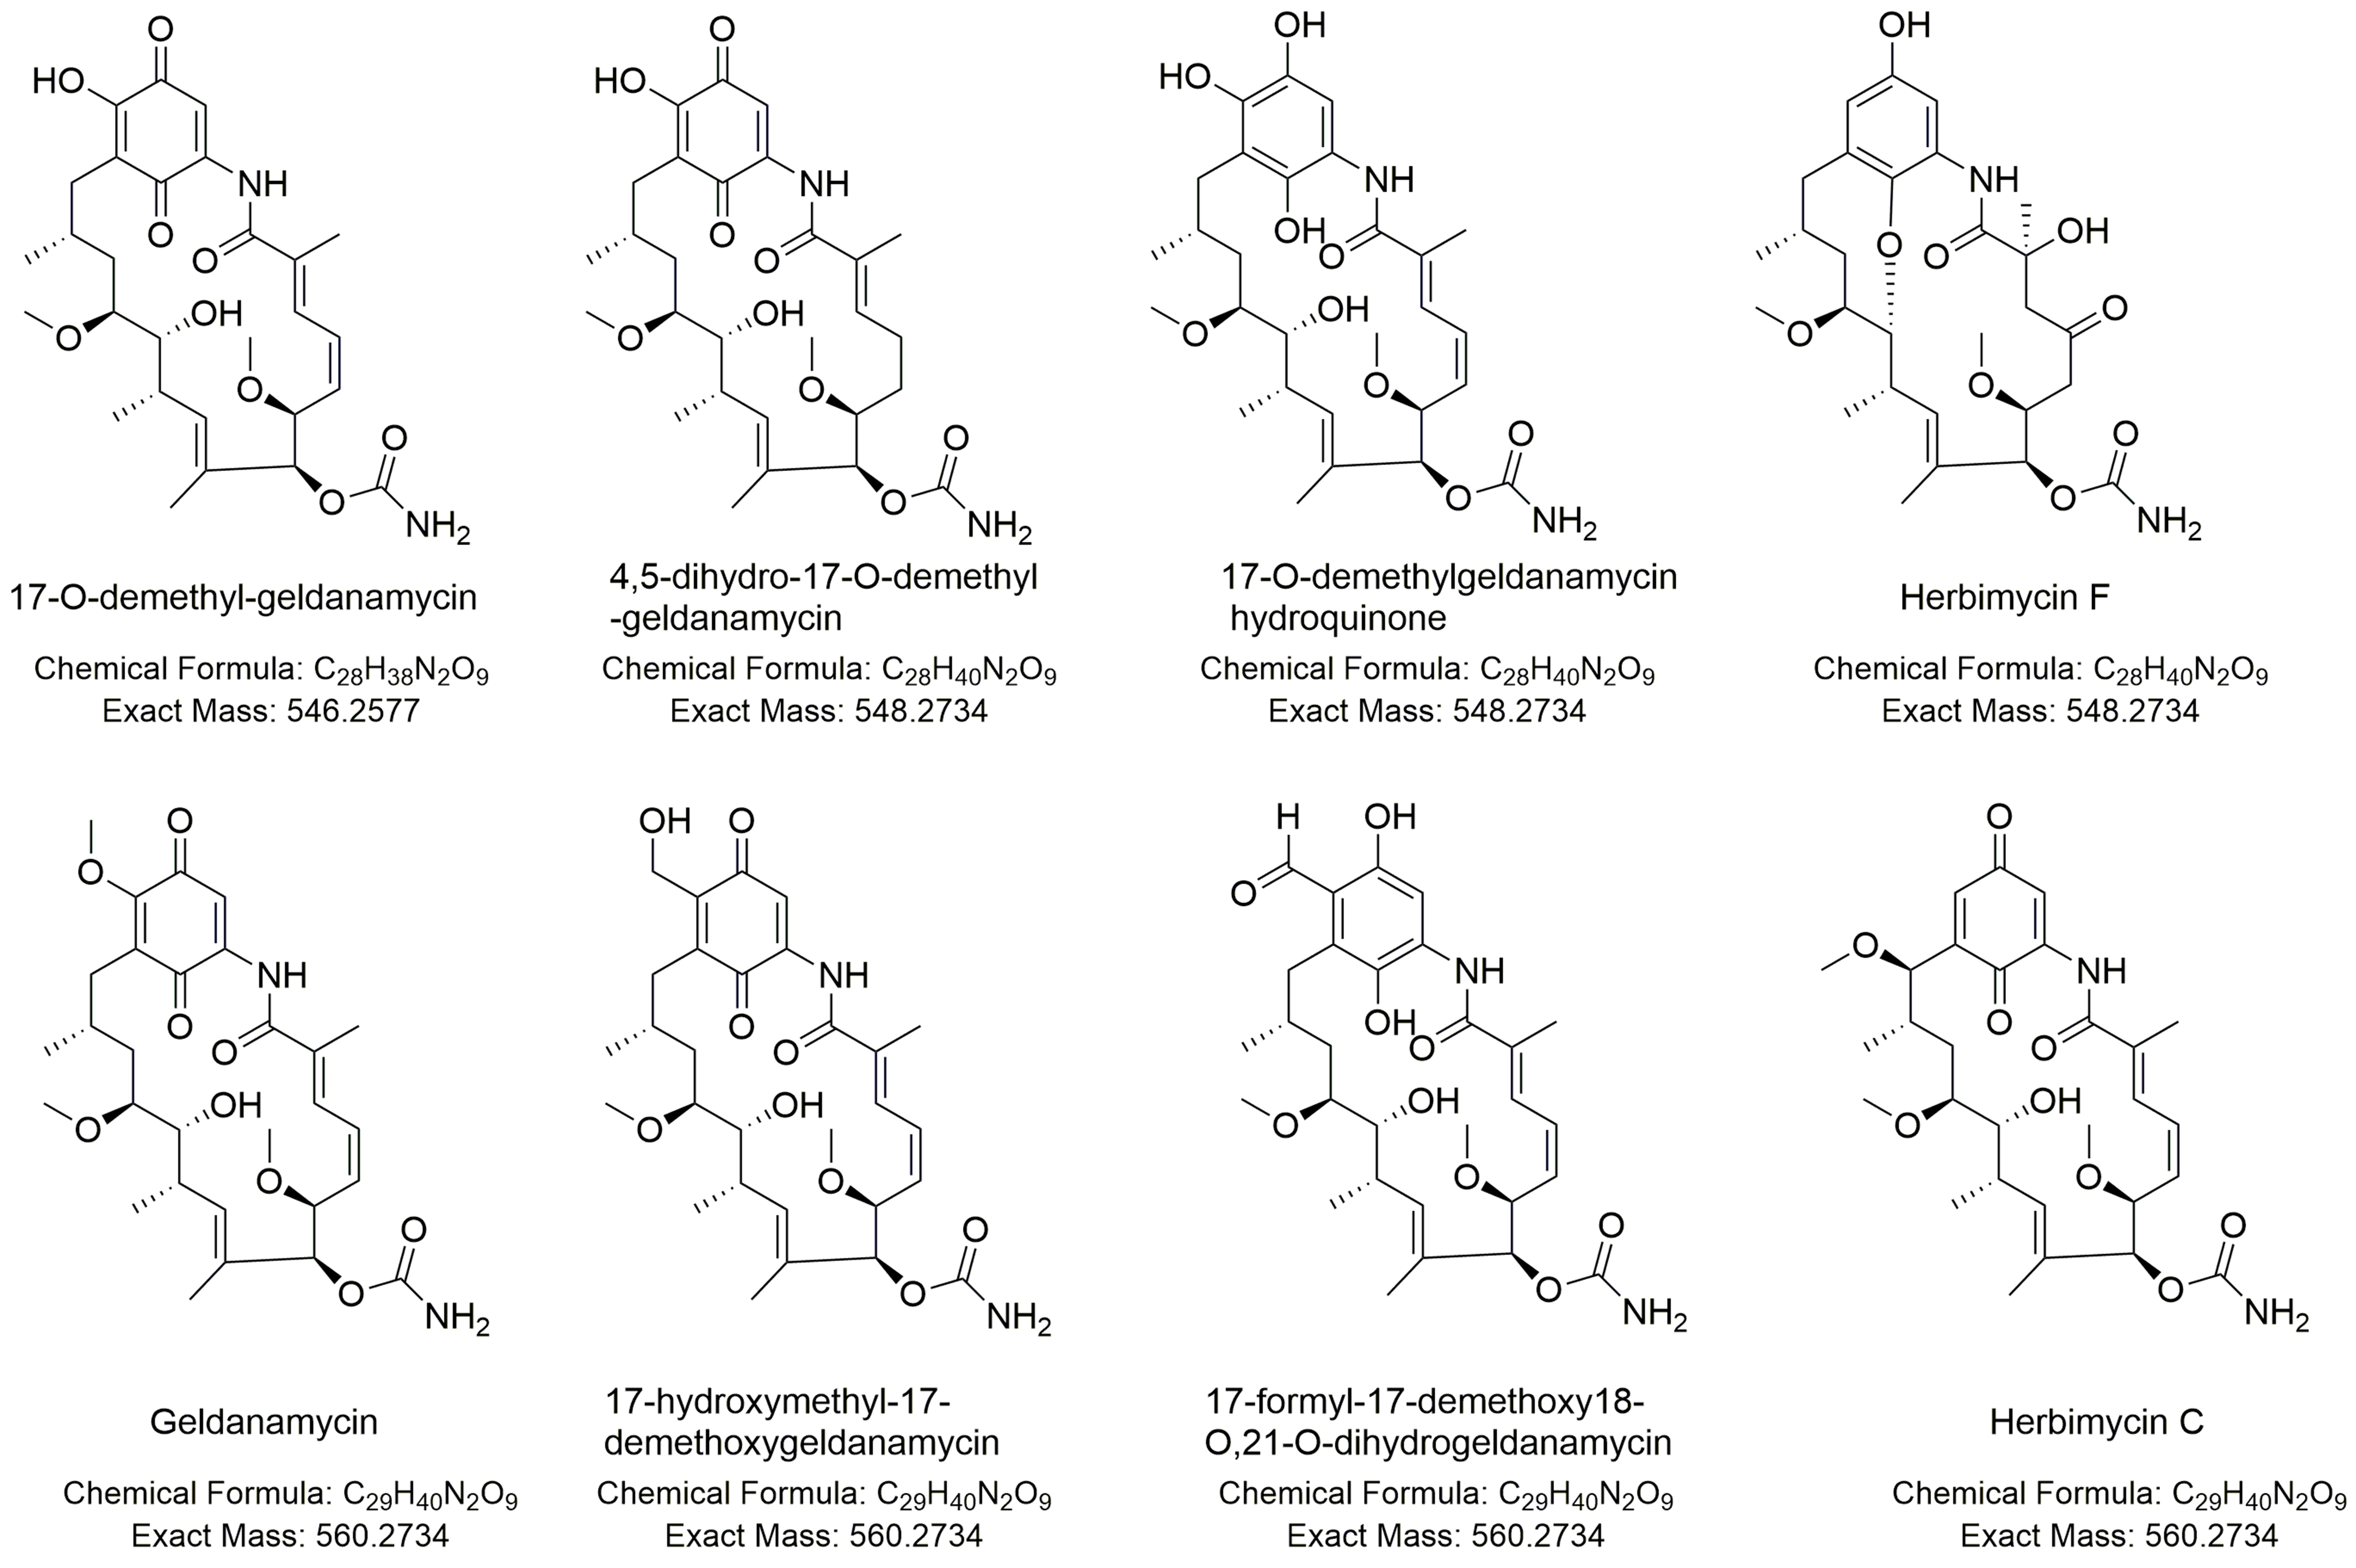
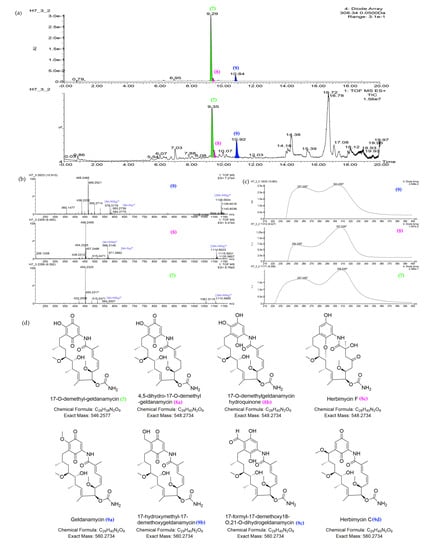
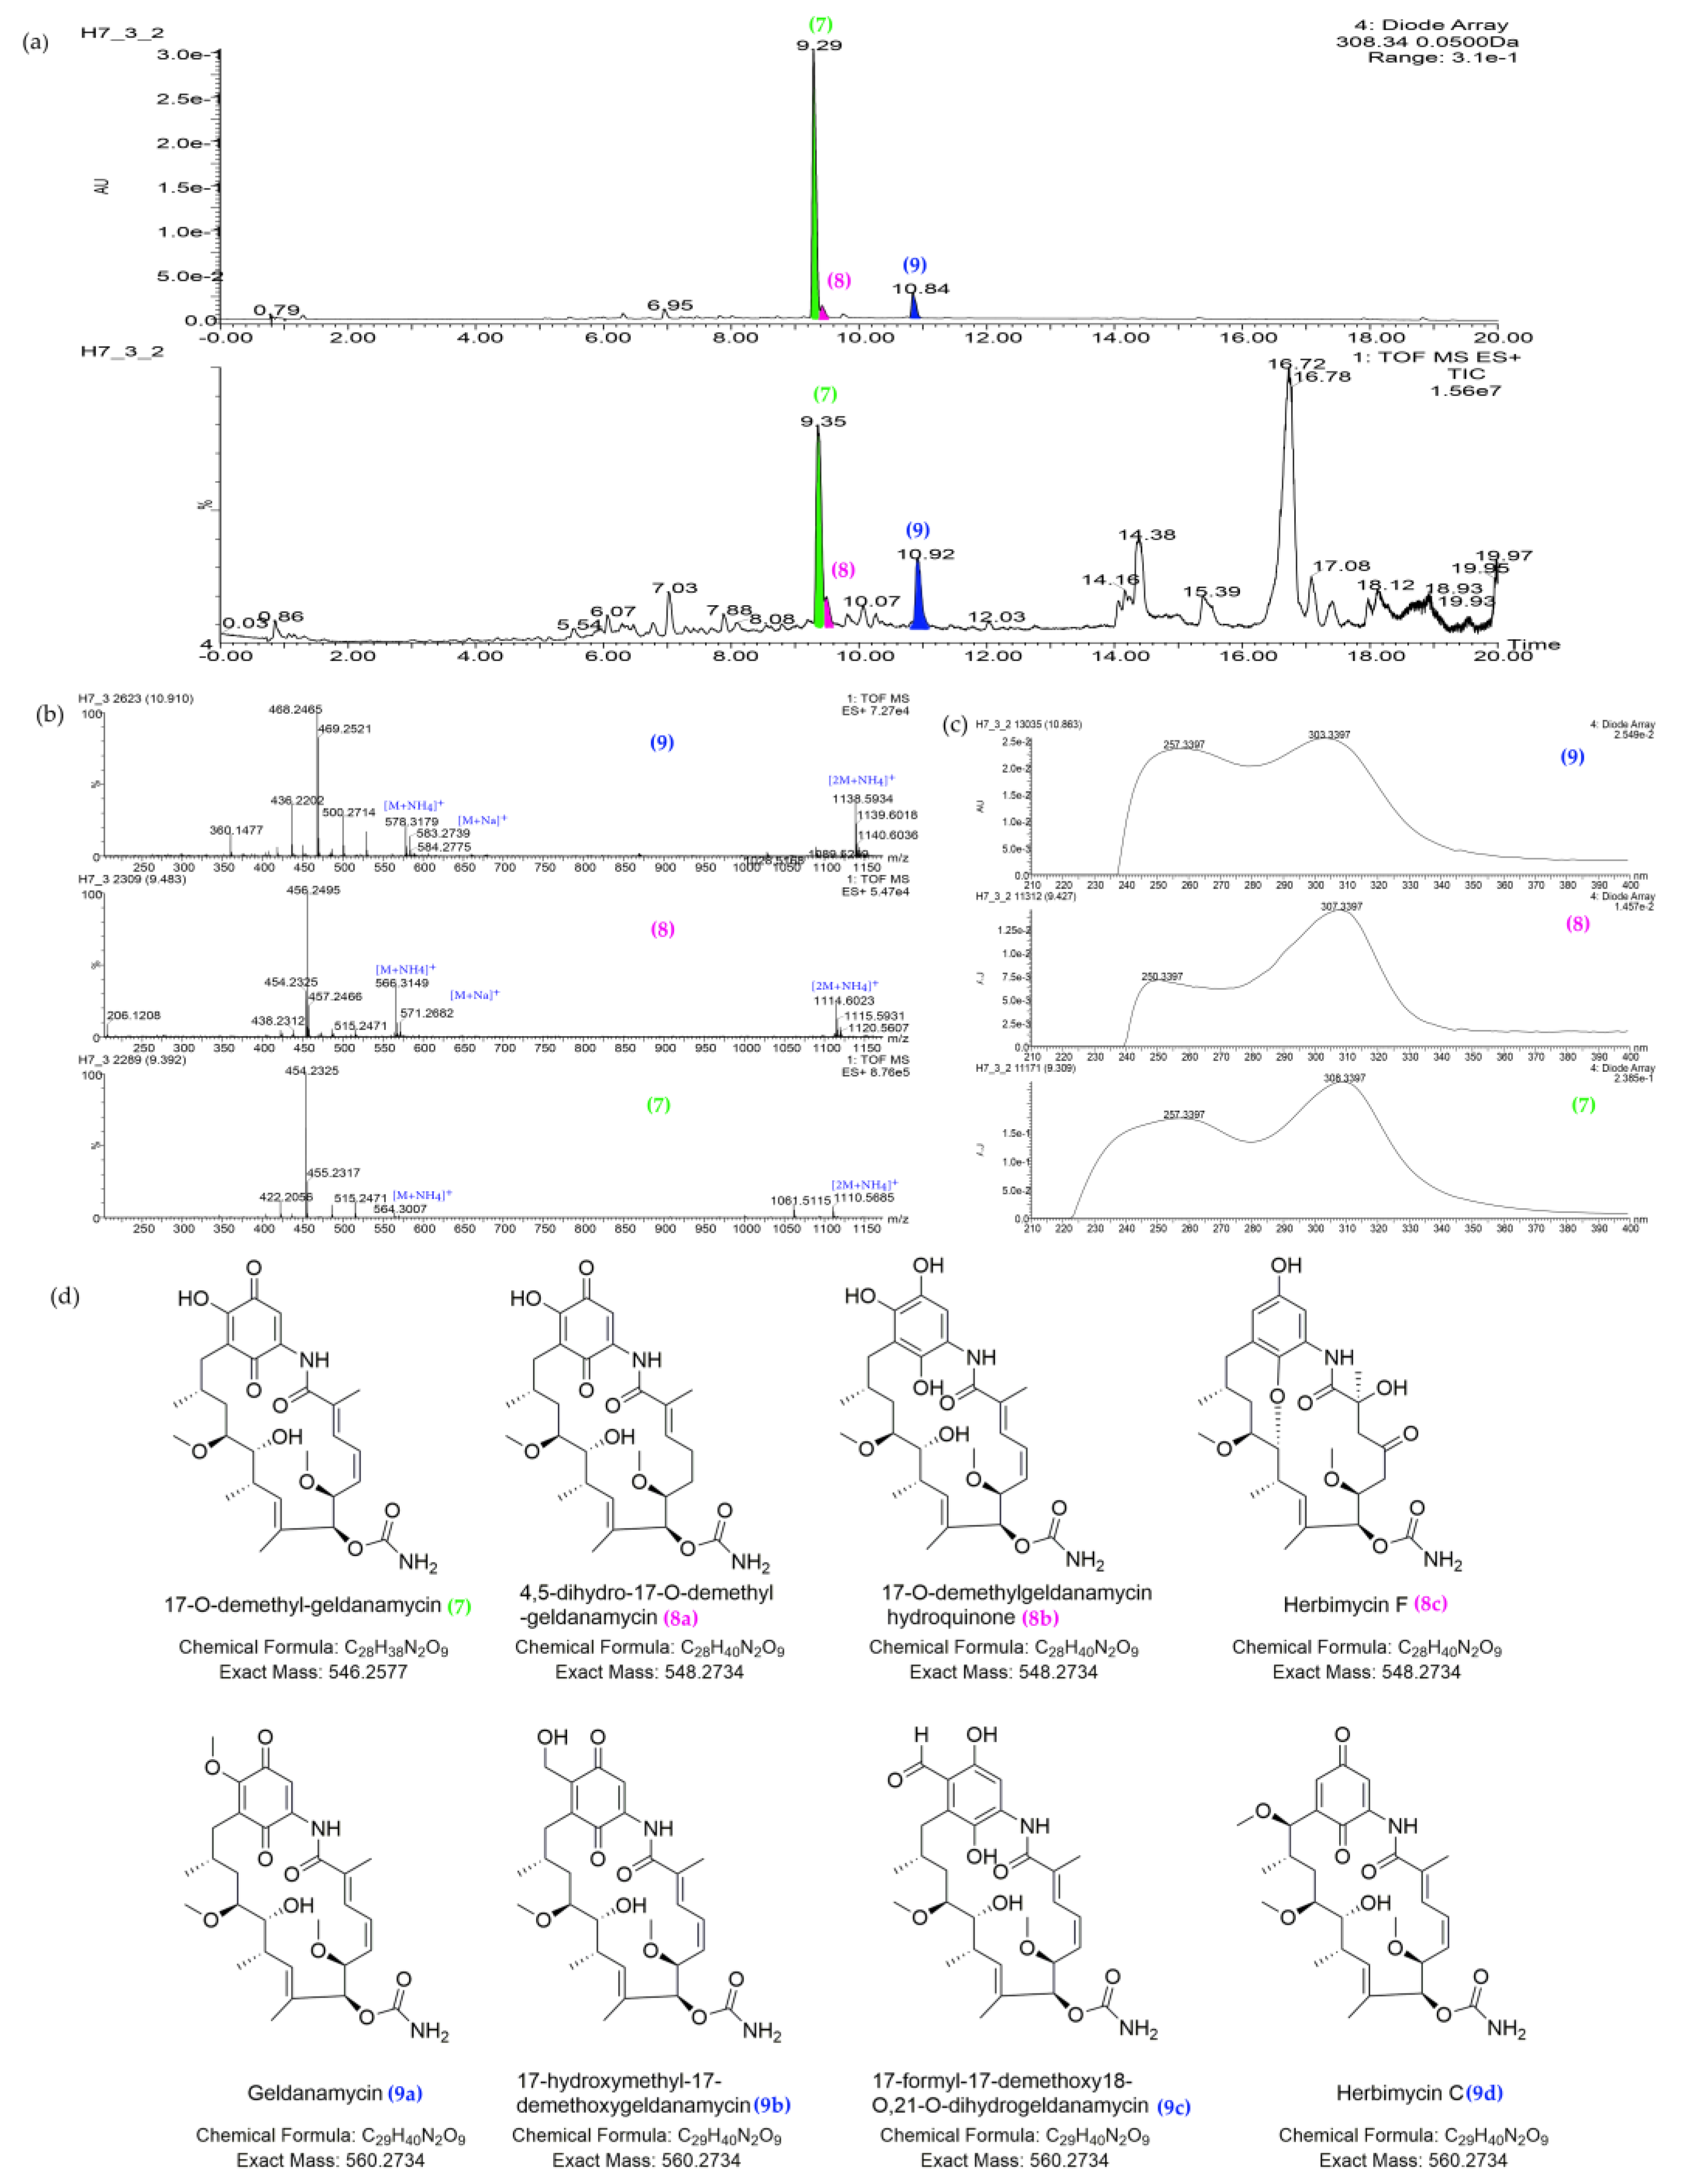
| 7 | 9.35_546.2571n | H7,Y2 | 9.35 | 546.2571 | 564.2910 | 257, 308 | 17-O-demethyl-geldanamycin (7) | C28H38N2O9 | |
| 8 | 9.46_548.2717n | H7,Y2 | 9.46 | 548.2717 | 566.3055 | 257, 308 | 4,5-dihydro-17-O-demethyl-geldanamycin (8a) | 4,5-dihydro-17-O-demethyl-geldanamycin (8a) | C28H40N2O9 |
| 17-O-demethylgeldanamycin hydroquinone (8b) | |||||||||
| Herbimycin F (8c) | |||||||||
| Antimycin A1a (8d) | Antimycin A1a (8d) | ||||||||
| Antimycin A1 (8e) | |||||||||
| Antimycin A12 (8f) | |||||||||
| Antimycin A13 (8g) | |||||||||
| Antimycin A19 (8h) | Antimycin A19 (8h) | ||||||||
| Deformylantimycin A2a (8i) | |||||||||
| 9 | 10.91_560.2719n | H7,Y2 | 10.91 | 560.2719 | 578.3062 | 257, 308 | Geldanamycin (9a) | C29H40N2O9 | |
| 17-hydroxymethyl-17-demethoxygeldanamycin (9b) | 17-hydroxymethyl-17-demethoxygeldanamycin (9b) | C29H40N2O9 | |||||||
| 17-formyl-17-demethoxy18-O,21-O-dihydrogeldanamycin (9c) | 17-formyl-17-demethoxy18-O,21-O-dihydrogeldanamycin (9c) | C29H40N2O9 | |||||||
| Herbimycin C (9d) | Herbimycin C (9d) | C29H40N2O9 |
| Peak ID | Compound | Isolate No. a | Rt (min) | Neutral Mass | Observed m/z | UV-Vis (nm) b | Hit 1 | Hit 2 | Predicted MF d |
|---|---|---|---|---|---|---|---|---|---|
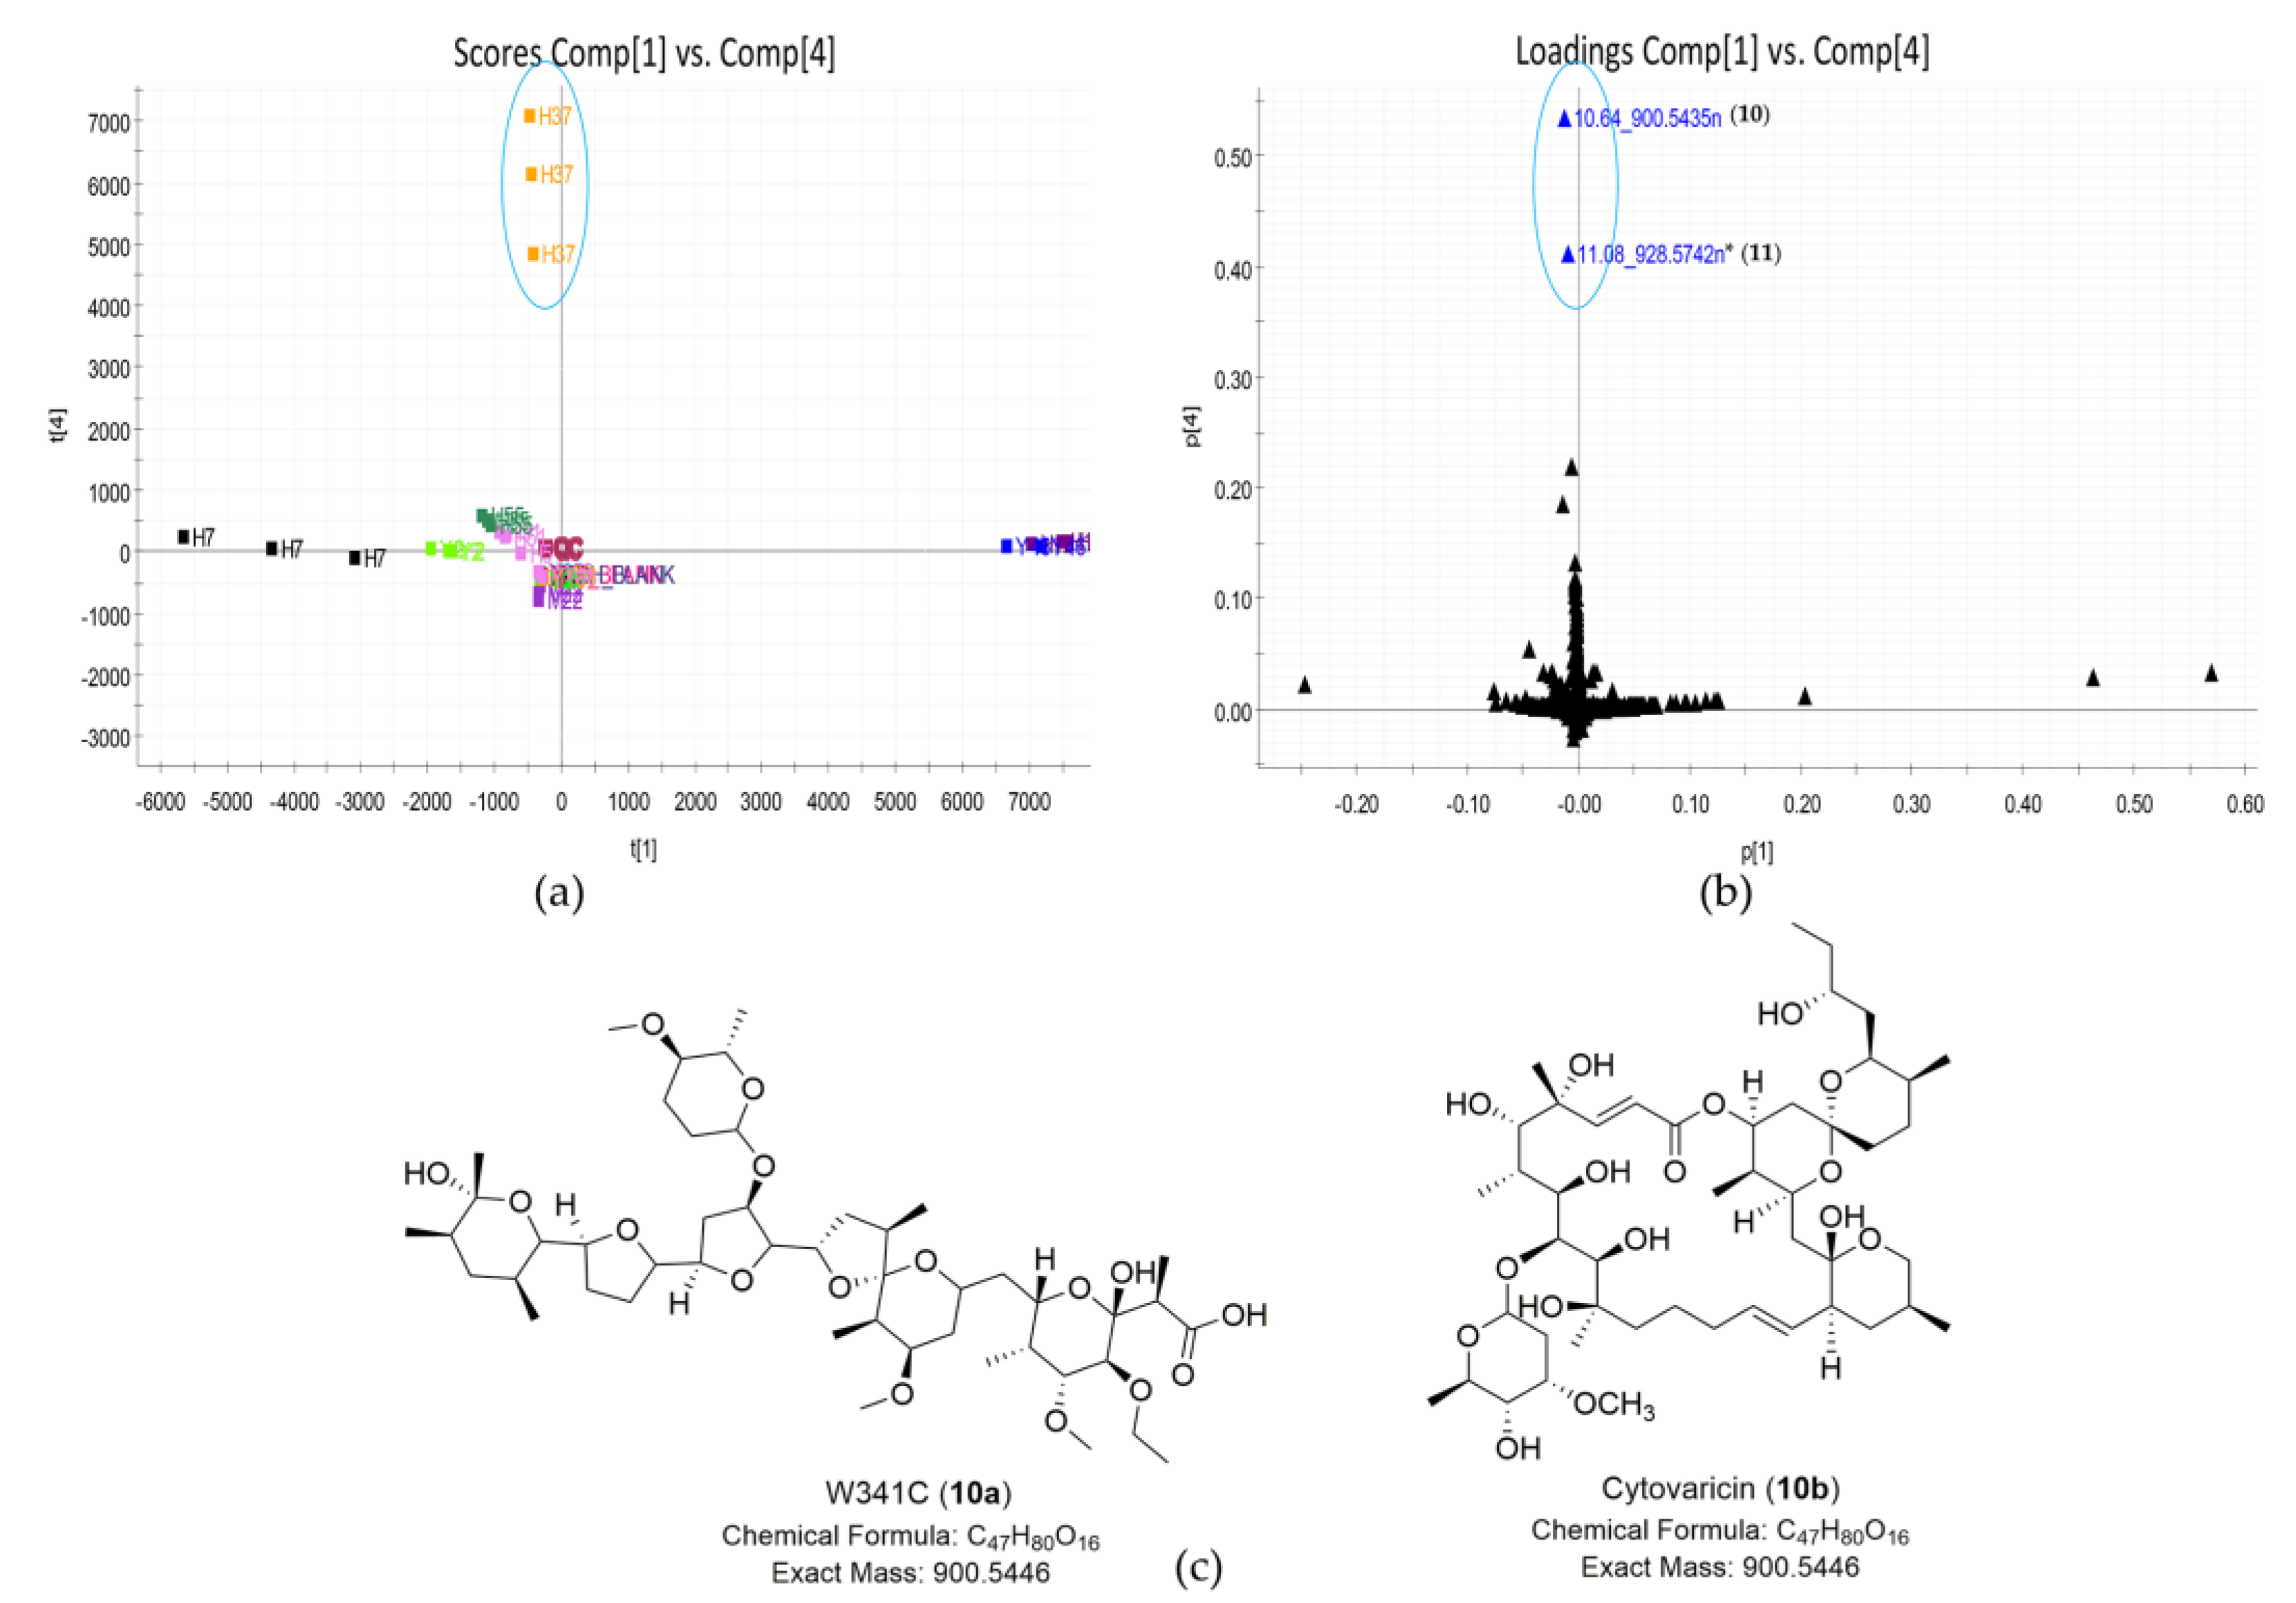
| 10 | 10.64_900.5435n | H37 | 10.64 | 900.5435 | 901.5508 | - c | W341C (10a) | C47H80O16 | |
| Cytovaricin (10b) | Cytovaricin (10b) | C47H80O16 | |||||||
| 11 | 11.08_928.5742n | H37 | 11.08 | 928.5742 | 929.5815 | - c | No hit | No hit | unknown |
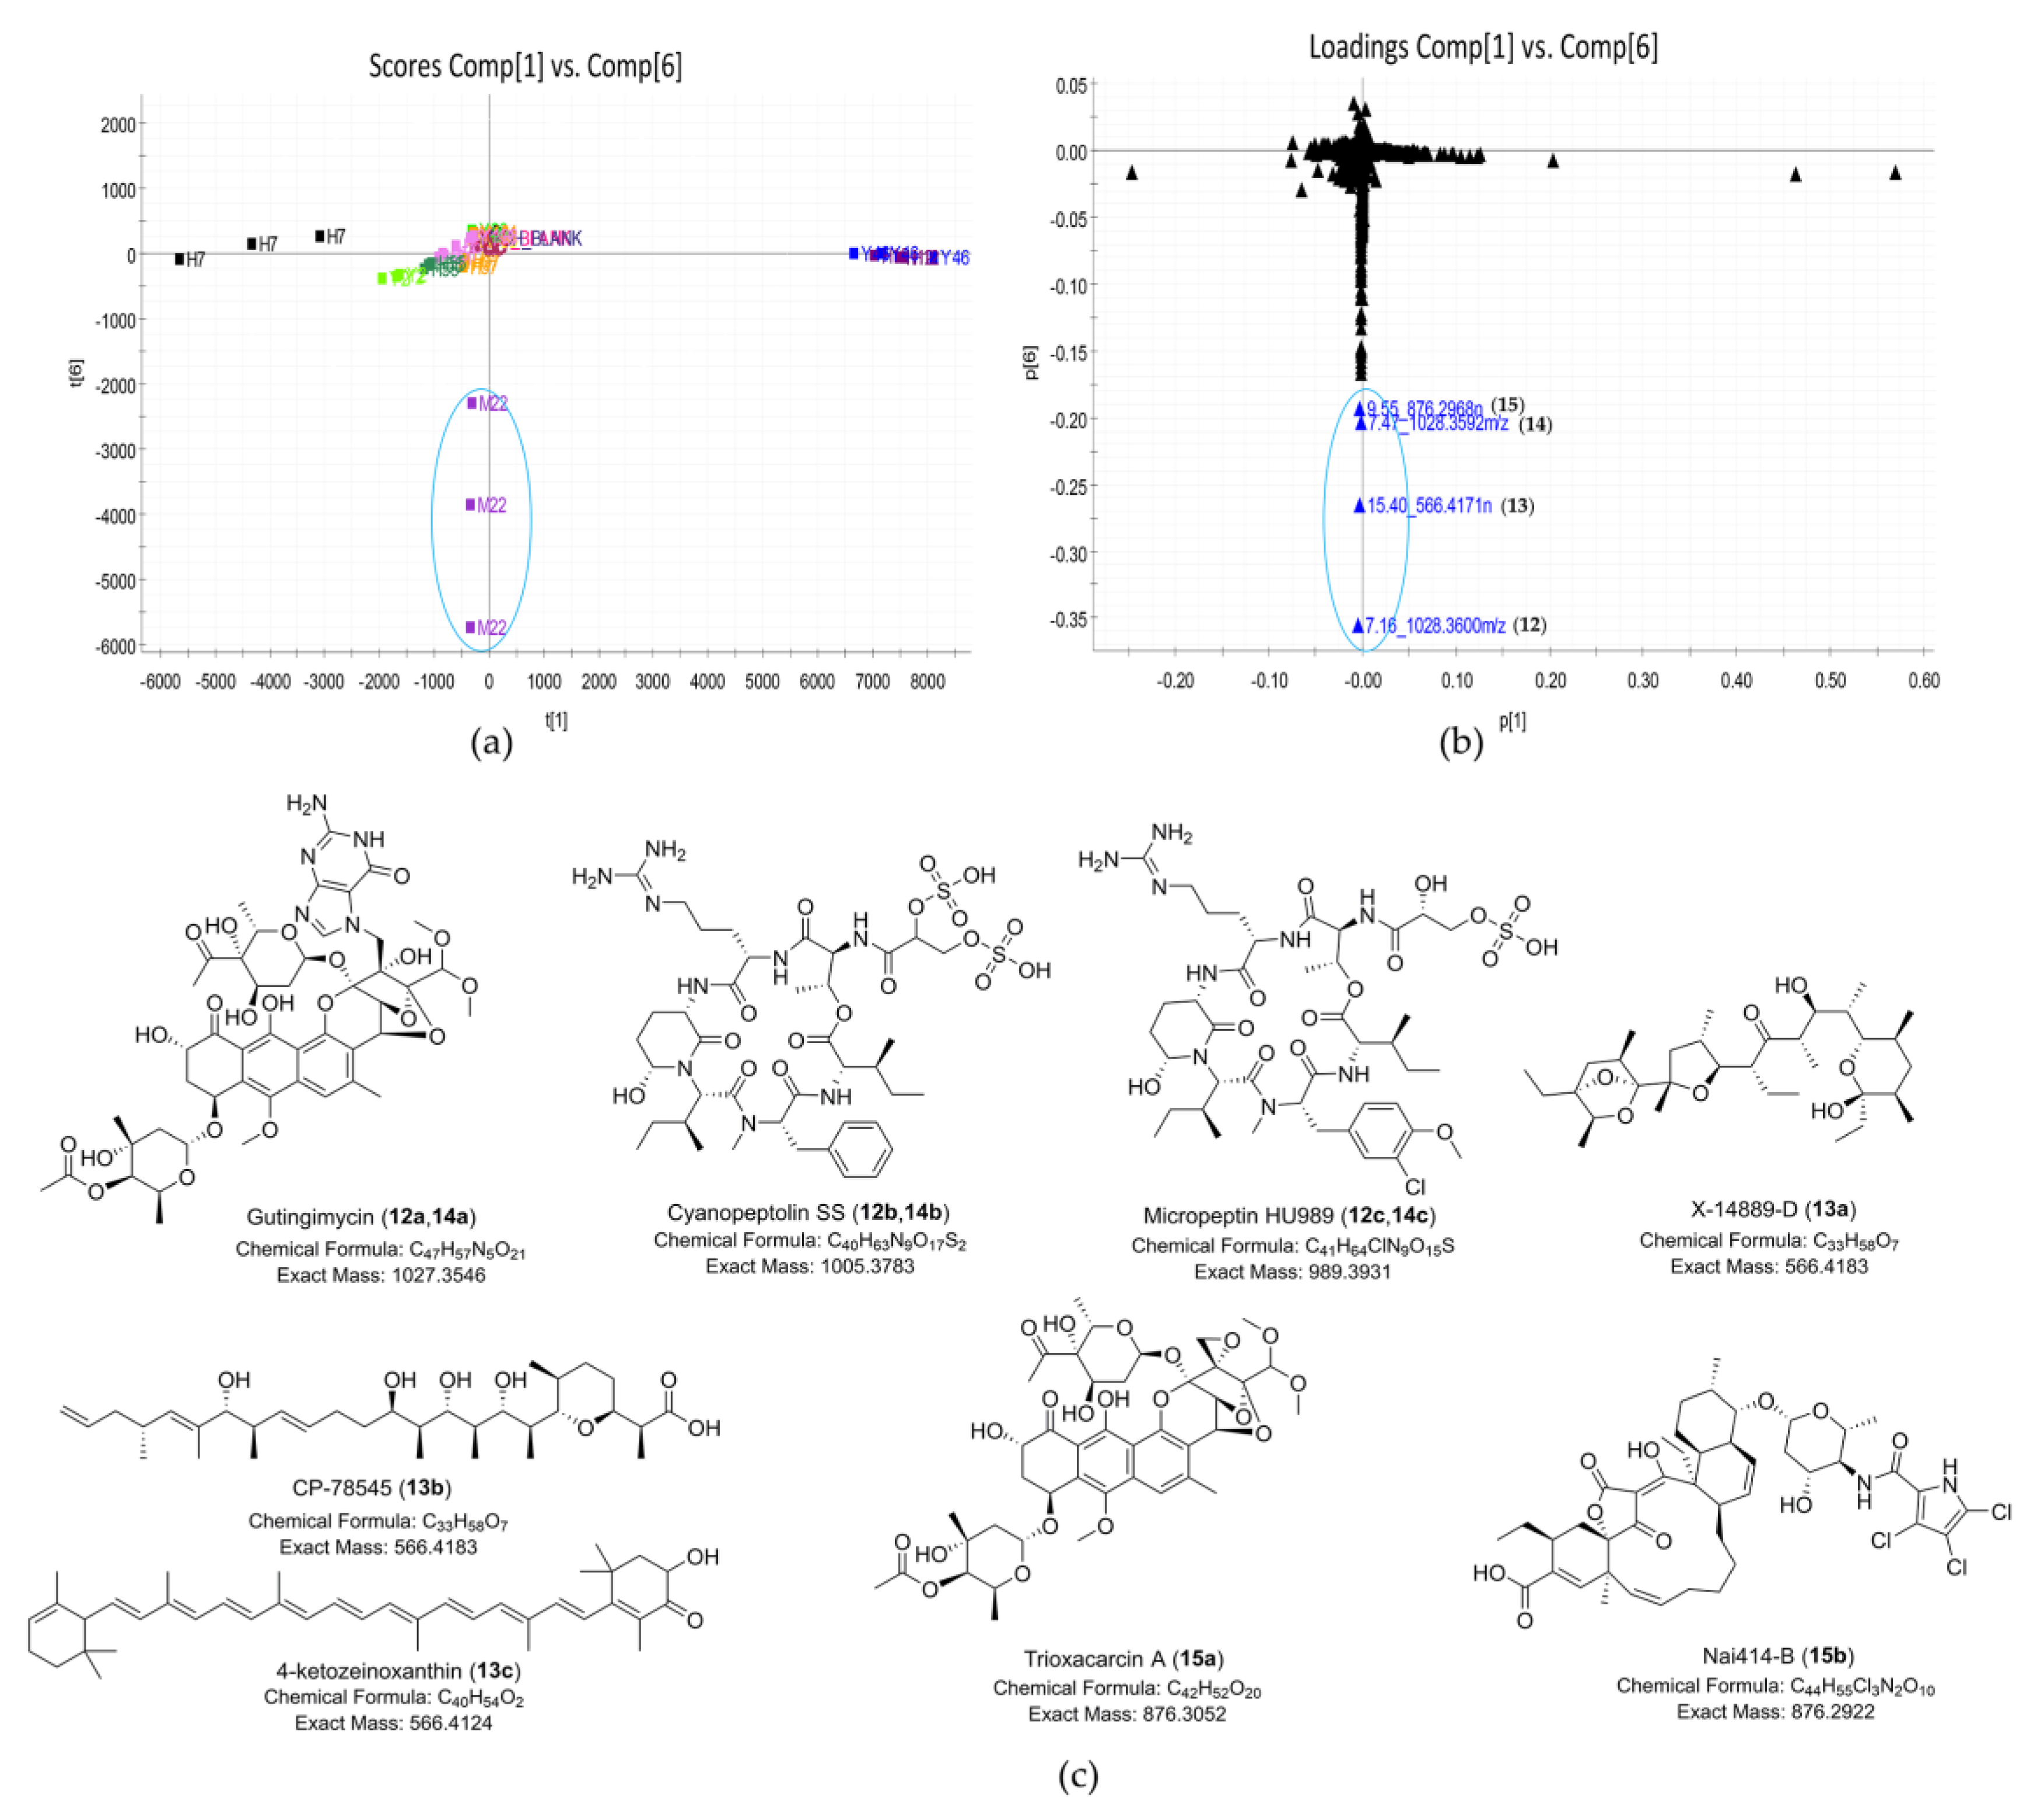
| 12 | 7.16_1028.3600m/z | M22 | 7.16 | unknown | 1028.3600 | 219, 230 (sh), 270, 397 | Gutingimycin (12a) | C47H57N5O21 | |
| Cyanopeptolin SS (12b) | C40H63N9O17S2 | ||||||||
| Micropeptin HU989 (12c) | C41H64ClN9O15S | ||||||||
| 13 | 15.40_566.4171n | M22 | 15.4 | 566.4171 | 549.4138 | - c | X-14889-D (13a) | C33H58O7 | |
| CP-78545 (13b) | CP-78545 (13b) | C33H58O7 | |||||||
| 4-ketozeinoxanthin (13c) | C40H54O2 | ||||||||
| 14 | 7.47_1028.3592m/z | M22 | 7.47 | unknown | 1028.3592 | 219, 230 (sh), 270, 397 | Gutingimycin (14a) | C47H57N5O21 | |
| Cyanopeptolin SS (14b) | C40H63N9O17S2 | ||||||||
| Micropeptin HU989 (14c) | C41H64ClN9O15S | ||||||||
| 15 | 9.55_876.2968n | M22 | 9.55 | 876.2968 | 894.3355 | 232, 270, 399 | Trioxacarcin A (15a) | C42H52O20 | |
| Nai414-B (15b) | C44H55Cl3N2O10 | ||||||||
| 16 | 6.69_1030.3751m/z | M22 | 6.69 | unknown | 1030.3751 | 219, 230 (sh), 270, 397 | Stremycin A (16a) | Stremycin A (16a) | |
| Kedarcidin (16b) | |||||||||
| 17 | 7.94_1013.3486m/z | M22 | 7.94 | unknown | 1013.3486 | 232, 270, 399 | No hit | No hit | unknown |
| 18 | 8.43_894.3132n | M22 | 8.43 | 894.3132 | 232, 270, 399 | Trioxacarcin B (18) | C42H54O21 | ||
| 19 | 8.89_878.3168n | M22 | 8.89 | 878.3168 | 232, 270, 399 | Trioxacarcin C (19) | C42H54O20 |
| Position | 16 | 20 | Position | 16 | 20 | ||||
|---|---|---|---|---|---|---|---|---|---|
| δH (multi, J, Hz) | δc | δH (multi, J, Hz) | δc | δH (multi, J, Hz) | δc | δH (multi, J, Hz) | δc | ||
| 1 | 207.6 | 203.9 | 17A | 5.02 (d, 15.6) | 46.2 | 3.68 (m) | 62.8 | ||
| 2 | 5.50 (br s) | 68.2 | 4.81 (dd, 12.6, 5.4) | 68.0 | 17B | 4.33 (d, 15.6) | 3.68 (m) | ||
| 3A | 2.97 (d, 13.8) | 37.1 | 2.77 (m) | 36.7 | 1′ | 5.51 (d, 4.2) | 100.9 | 5.35 (d, 4.2) | 97.4 |
| 3B | 2.21 (overlapped) | 2.22 (overlapped) | 2′A | 1.99 (overlapped) | 37.7 | 1.93 (dd, 15.0, 4.2) | 36.5 | ||
| 4 | 5.34 (br s) | 72.2 | 5.41 (t, 3.0) | 66.7 | 2′B | 1.92 (d, 15.0) | 1.62 (d, 15.0) | ||
| 4a | 128.4 | 126.7 | 3′ | 67.3 | 69.0 | ||||
| 5 | 7.48 (s) | 116.8 | 7.50 (br s) | 117.1 | 3′-CH3 | 1.18 (s) | 27.3 | 1.06 (s) | 25.8 |
| 6 | 142.5 | 142.7 | 4′ | 5.14 (s) | 75.9 | 4.74 (s) | 74.5 | ||
| 6-CH3 | 2.62 (s) | 20.2 | 2.59 (s) | 20.3 | 4′-OCOCH3 | 173.3 | 170.5 | ||
| 7 | 113.2 | 114.2 | 4′-OCOCH3 | 2.25 (s) | 21.1 | 2.12 (s) | 21.0 | ||
| 8 | 152.7 | 152.6 | 5′ | 4.92 (br s) | 62.2 | 4.53 (q, 6.6) | 62.9 | ||
| 8a | 114.4 | 114.2 | 5′-CH3 | 1.26 (d, 6.6) | 16.9 | 1.23 (d, 6.6) | 17.0 | ||
| 9 | 162.9 | 162.5 | 1″ | 5.64 (d, 3.6) | 92.5 | 5.65 (d, 3.0) | 93.7 | ||
| 9a | 108.3 | 108.2 | 2″A | 2.21 (overlapped) | 33.8 | 2.28 (overlapped) | 33.0 | ||
| 9-OH | 13.84 (s) | 14.61 (s) | 2″B | 1.76 (d, 15.6) | 2.05 (d, 15.0) | ||||
| 10 | 144.6 | 145.3 | 3″ | 3.91 (br s) | 68.6 | 3.97 (br s) | 68.4 | ||
| 10-OCH3 | 3.95 (s) | 62.7 | 3.84 (s) | 62.9 | 4″ | 72.1 | 72.6 | ||
| 10a | 135.7 | 135.5 | 5″ | 4.68 (q, 6.6) | 66.2 | 4.60 (q, 6.6) | 66.3 | ||
| 11 | 5.10 (d, 4.2) | 69.0 | 5.13 (d, 3.6) | 69.3 | 5″-CH3 | 1.26 (d, 6.6) | 15.7 | 1.23 (d, 6.6) | 15.5 |
| 12 | 5.22 (d, 4.2) | 71.5 | 5.21 (d, 3.6) | 71.2 | 6″ | 3.99 (q, 6.6) | 70.3 | 3.91 (q, 6.6) | 70.7 |
| 13 | 103.3 | 105.2 | 7″ | 1.37 (d, 6.6) | 17.8 | 1.34 (d, 6.6) | 18.2 | ||
| 14 | 84.4 | 85.0 | 2‴ | 151.8 | |||||
| 15 | 108.8 | 108.2 | 4‴ | 153.8 | |||||
| 16 | 5.08 (s) | 99.6 | 5.04 (s) | 99.9 | 5‴ | 108.1 | |||
| 16-OCH3 | 3.66 (s) | 56.1 | 3.63 (s) | 56.4 | 6‴ | 157.8 | |||
| 16-OCH3 | 3.53 (s) | 56.4 | 3.54 (s) | 57.3 | 8‴ | 8.22 (s) | 140.6 | ||
Publisher’s Note: MDPI stays neutral with regard to jurisdictional claims in published maps and institutional affiliations. |
© 2021 by the authors. Licensee MDPI, Basel, Switzerland. This article is an open access article distributed under the terms and conditions of the Creative Commons Attribution (CC BY) license (https://creativecommons.org/licenses/by/4.0/).
Share and Cite
Lu, Q.-P.; Huang, Y.-M.; Liu, S.-W.; Wu, G.; Yang, Q.; Liu, L.-F.; Zhang, H.-T.; Qi, Y.; Wang, T.; Jiang, Z.-K.; et al. Metabolomics Tools Assisting Classic Screening Methods in Discovering New Antibiotics from Mangrove Actinomycetia in Leizhou Peninsula. Mar. Drugs 2021, 19, 688. https://doi.org/10.3390/md19120688
Lu Q-P, Huang Y-M, Liu S-W, Wu G, Yang Q, Liu L-F, Zhang H-T, Qi Y, Wang T, Jiang Z-K, et al. Metabolomics Tools Assisting Classic Screening Methods in Discovering New Antibiotics from Mangrove Actinomycetia in Leizhou Peninsula. Marine Drugs. 2021; 19(12):688. https://doi.org/10.3390/md19120688
Chicago/Turabian StyleLu, Qin-Pei, Yong-Mei Huang, Shao-Wei Liu, Gang Wu, Qin Yang, Li-Fang Liu, Hai-Tao Zhang, Yi Qi, Ting Wang, Zhong-Ke Jiang, and et al. 2021. "Metabolomics Tools Assisting Classic Screening Methods in Discovering New Antibiotics from Mangrove Actinomycetia in Leizhou Peninsula" Marine Drugs 19, no. 12: 688. https://doi.org/10.3390/md19120688