A Failure Mode Assessment Model Based on Neutrosophic Logic for Switched-Mode Power Supply Risk Analysis


1
Department of Industrial Engineering and Management, National Taipei University of Technology, 1, Sec. 3, Zhongxiao E. Rd., Taipei 10608, Taiwan
2
Ph.D. Program at College of Management, National Taipei University of Technology, 1, Sec. 3, Zhongxiao E. Rd., Taipei 10608, Taiwan
3
Department of Industrial Engineering and Management, Chaoyang University of Technology, 168, Jifeng E. Rd., Taichung 413310, Taiwan
*
Author to whom correspondence should be addressed.
Mathematics 2020, 8(12), 2145; https://doi.org/10.3390/math8122145
Submission received: 3 November 2020
/
Revised: 25 November 2020
/
Accepted: 26 November 2020
/
Published: 1 December 2020
(This article belongs to the Special Issue Recent Advances and Applications in Multi-Criteria Decision Analysis)
Abstract
:Reducing the potential risks in the manufacturing process to improve the reliability of the switched-mode power supply (SMPS) is a critical issue for the users’ safety. This paper proposes a novel failure mode and effects analysis (FMEA) model based on hybrid multiple criteria decision-making (MCDM), which adopts neutrosophic set theory into the proposed model. A developed neutrosophic Best Worst method (NBWM) is used to evaluate the weights of risk factors and determine their importance. Secondly, the neutrosophic Weight Aggregated Sum Product Assessments (NWASPAS) method is utilized to calculate the Risk Priority Number (RPN) of the failure modes. The proposed model improves the shortcomings of traditional FMEA and improves the practical applicability and effectiveness of the Best Worst method (BWM) and Weight Aggregated Sum Product Assessments (WASPAS) methods. In addition, this study uses neutrosophic logic to reflect the true judgments of experts in the assessment, which considers authenticity, deviation, and uncertainty to obtain more reliable information. Finally, an empirical case study from an SMPS company headquartered in Taiwan demonstrates the effectiveness and robustness of the proposed model. In addition, by comparing with two other FMEA models, the results show that the proposed model can more clearly reflect the true and effective risks in the assessment. The results can effectively help power supply manufacturers to assess risk factors and determine key failure modes.
1. Introduction
In today’s highly competitive consumer electronics industry environment, cumulative sales of many hot-selling products have reached tens of millions of units [1]. For brands and manufacturers, any issues related to product safety should be considering as priorities [2]. Otherwise, once quality problems occur, in addition to the cost of product recalls and the possible huge loss due to consumer class action lawsuits, the loss of goodwill caused by such events is even more difficult to measure in terms of money [3].
Most electronic products require power supply units to provide electric power directly or indirectly to drive the system to operate. In other words, whether the power supply meets the safety regulations is related to the safety and reliability of the entire electronic product [4]. Manufacturing and quality assurance managers should identify and pre-manage possible problems in the production process and potential risks when consumers use the product in the future, to maximize the reliability and safety of the product. To consider user behavior under complex circumstances such as risk and uncertainty, studies have been developing machine learning algorithms to learn and predict complex scenarios to improve the quality of service for users [5,6]. Another commonly used method in the field of risk management is FMEA. This method can be used to evaluate and diagnose the reliability of a system/product/component [7]. The main goal of FMEA is to identify potential failure modes in the system/product/component, evaluate possible subsequent effects, and recommend detectability strategies to eliminate or reduce the chance of serious problems, thus ensuring the robustness and safety of various products or system operating. Traditional FMEA has some shortcomings in practical use (the detailed description is presented in Section 2). Therefore, many studies combine Multiple Criteria Decision-Making (MCDM) with FMEA to strengthen the applicability of traditional FMEA. For instance, Chemweno et al. [8] developed an FMEA model for asset management and maintenance decision-making, which uses the Analytic Network Process (ANP) method to consider the interdependence of risk factors. The selected risk factors are on the basis of the International Organization for Standardization (ISO) 31,000:2009. Wang et al. [9] established a risk priority model for the vertical machining system. The model uses the rough VlseKriterijuska Optimizacija I Komoromisno Resenje (VIKOR) method, and introduces House of Reliability (HoR) to identify the associations among the critical failure modes. In addition, a new method based on Failure Mode, Effects, and Criticality Analysis (FMECA) was proposed to prevent the possibility of direct or indirect occupational hazards (injury, illness, or death) caused by workplace risks—the so-called Total efficient risk priority number (TERPN) [10]. Chang et al. [11] proposed a hybrid FMEA and MCDM model that combines rough Best Worst method (BWM) and Rough Technique for Order Preference by Similarity to an Ideal Solution (R-TOPSIS) to obtain the ranking of failure modes. They used a multinational audio equipment manufacturing company to demonstrate that the model effectively overcomes many shortcomings of traditional FMEA, helping decision-makers and Research and Design (R&D) departments improve product reliability.
However, the above studies did not consider the uncertainty and ambiguity of the assessment environment in risk analysis. Considering the obvious complexity of the entire manufacturing process and the inherent ambiguity of human judgment, it is often difficult for the experts to express their judgments with clear and accurate numbers in the early stages of production operations. In order to be more flexible and more effectively describe the uncertainty and fuzzy information in actual operations, it is necessary to propose a more reasonable mathematical tool to deal with uncertainty and ambiguity, and build modeling based on the subjective opinions of experts [12,13]. For example, Kompa et al. [14] pointed out that in high-risk fields, such as pharmaceuticals or self-driving cars, deep learning prediction models have been widely adopted in recent years, many studies have shown that prediction uncertainty can be improved. Among them, the Monte Carlo approach is one of the well-known deep learning methods [15] and the other is the Bayesian neural network. In addition to using the discriminant model, it also uses the generative model to find out distribution data. Even though generative models are a way to perform out-of-distribution detection, they cannot assess predictive uncertainty [16]. Moreover, some studies combined with fuzzy theory to improve the analysis of FMEA. Li et al. [17] developed an FMEA model based on fuzzy information. The interval-valued intuitionistic fuzzy set (IVIFs) was applied to embody the risk ambiguity of failure modes. Their paper used service process at a hospital as an empirical example to demonstrate the accuracy, effectiveness, and flexibility of the proposed model. Many academic articles point out that the FMEA model combined with fuzzy theory can improve the accuracy of risk analysis. Unfortunately, previous FMEA studies used vague methods that did not take into account certainty, uncertainty, and error simultaneous in the risk assessment.
This paper proposes a novel FMEA model based on hybrid MCDM, which adopts neutrosophic set theory into the model. This theory can not only consider the uncertainty of the evaluation environment, but also explore the true judgments of experts during the evaluation (the measured factors include truth, falsity, and indeterminacy). This paper is divided into three stages. First, department managers related to design and production form an expert team. The expert team draws out all possible failure causes/modes for the analyzed products. Secondly, a NBWM questionnaire was designed for experts to evaluate the importance of risk factors, so as to obtain the weights of risk factors. Finally, all experts evaluate the risk value of each failure mode under the risk factors, and use neutrosophic Weight Aggregated Sum Product Assessments (NWASPAS) to calculate the Risk Priority Number (RPN) of the failure modes. The higher the number, the greater the risk level. The proposed model can encompass a wider range of uncertainties. This paper took a power supply product designed by a Taiwanese multinational electronics company as an analysis case. The potential critical failure modes are identifying through the analysis of this research, and the reliability of the product can be improved by eliminating the risk of product failure. In summary, the specific contributions and characteristics of this study are described below.
- (i)
- The proposed FMEA model takes into account the economic perspective, which adds the expected cost (E) as a risk factor.
- (ii)
- The introduction of the Single-Valued Trapezoidal Neutrosophic Numbers (SVTNNs), which integrates neutrosophic set theory into the analysis methods (BWM and WASPAS), can more clearly show the uncertainty of the experts in evaluating risks.
- (iii)
- NBWM significantly reduces the number of pairwise comparisons and achieves a better consistency ratio.
- (iv)
- NWASPAS optimizes traditional FMEA’s RPN calculation method to obtain more reliable ranking results.
- (v)
- The root causes of the failures of the switching power supply are analyzed and provided to the decision-makers and R&D department to formulate improvement measures.
The rest of this paper is arranged as follows: Section 2 briefly reviews the related research on FMEA combined with MCDM in recent years and points out research gaps in this field. Section 3 describes the proposed FMEA model, including the detailed calculation steps of the neutrosophic set, NBWM, and NWASPAS. Section 4 introduces a multinational corporation as an empirical case to demonstrate the practicality of the proposed model. Section 5 explains the sensitivity analysis, model comparisons, and provides management implications. Finally, Section 6 summarizes the findings and contributions of this research and explains future research directions.
2. A Brief Literature Review of MCDM Combined with FMEA
The FMEA model was developed by Grumman Aircraft Corporation in the 1960s and used to analyze the flight control system of naval aircraft [18,19]. So far, it has been used in various fields for more than 50 years, and is especially widely used in the evaluation of failure modes of products or systems operation. Generally speaking, the assessment of FMEA is based on three risk factors, namely, the severity (S), occurrence (O) and detection (D), and RPN = S × O × D. The scale of each risk factor is from 1 to 10. The higher the value, the higher the risk of failure mode. Many studies criticize that RPN has the following disadvantages:
- (i)
- (ii)
- (iii)
- (iv)
- (v)
- There are other important risk factors that are ignored, for example, the expected cost from a financial perspective is not considered [23].
- (vi)
- Uncertainty and ambiguity of information are not considered in traditional FMEA.
Many scholars have proposed to build a model by combing FMEA and MCDM methods. This study summarizes the academic research related to FMEA in the past two years, as shown in Table 1.
Through an extensive FMEA literature review, some research gaps were found in this study. As mentioned earlier, FMEA is based on expert judgment [33]. In some cases, if the experts are not confident or unable to make appropriate judgments, that will lead to uncertainty in the risk analysis process [34,35]. In addition, only S, O, and D are considered in most FMEAs, and only a few studies have explored the management costs of failure modes. In the methodology section, a risk assessment model combining NBWM and NWASPAS methods has not been proposed in past studies. In particular, the proposed FMEA model has never been used in the switching power supply, one of the important parts of electronic products. In Section 3, the analysis process of the proposed FMEA model is explained.
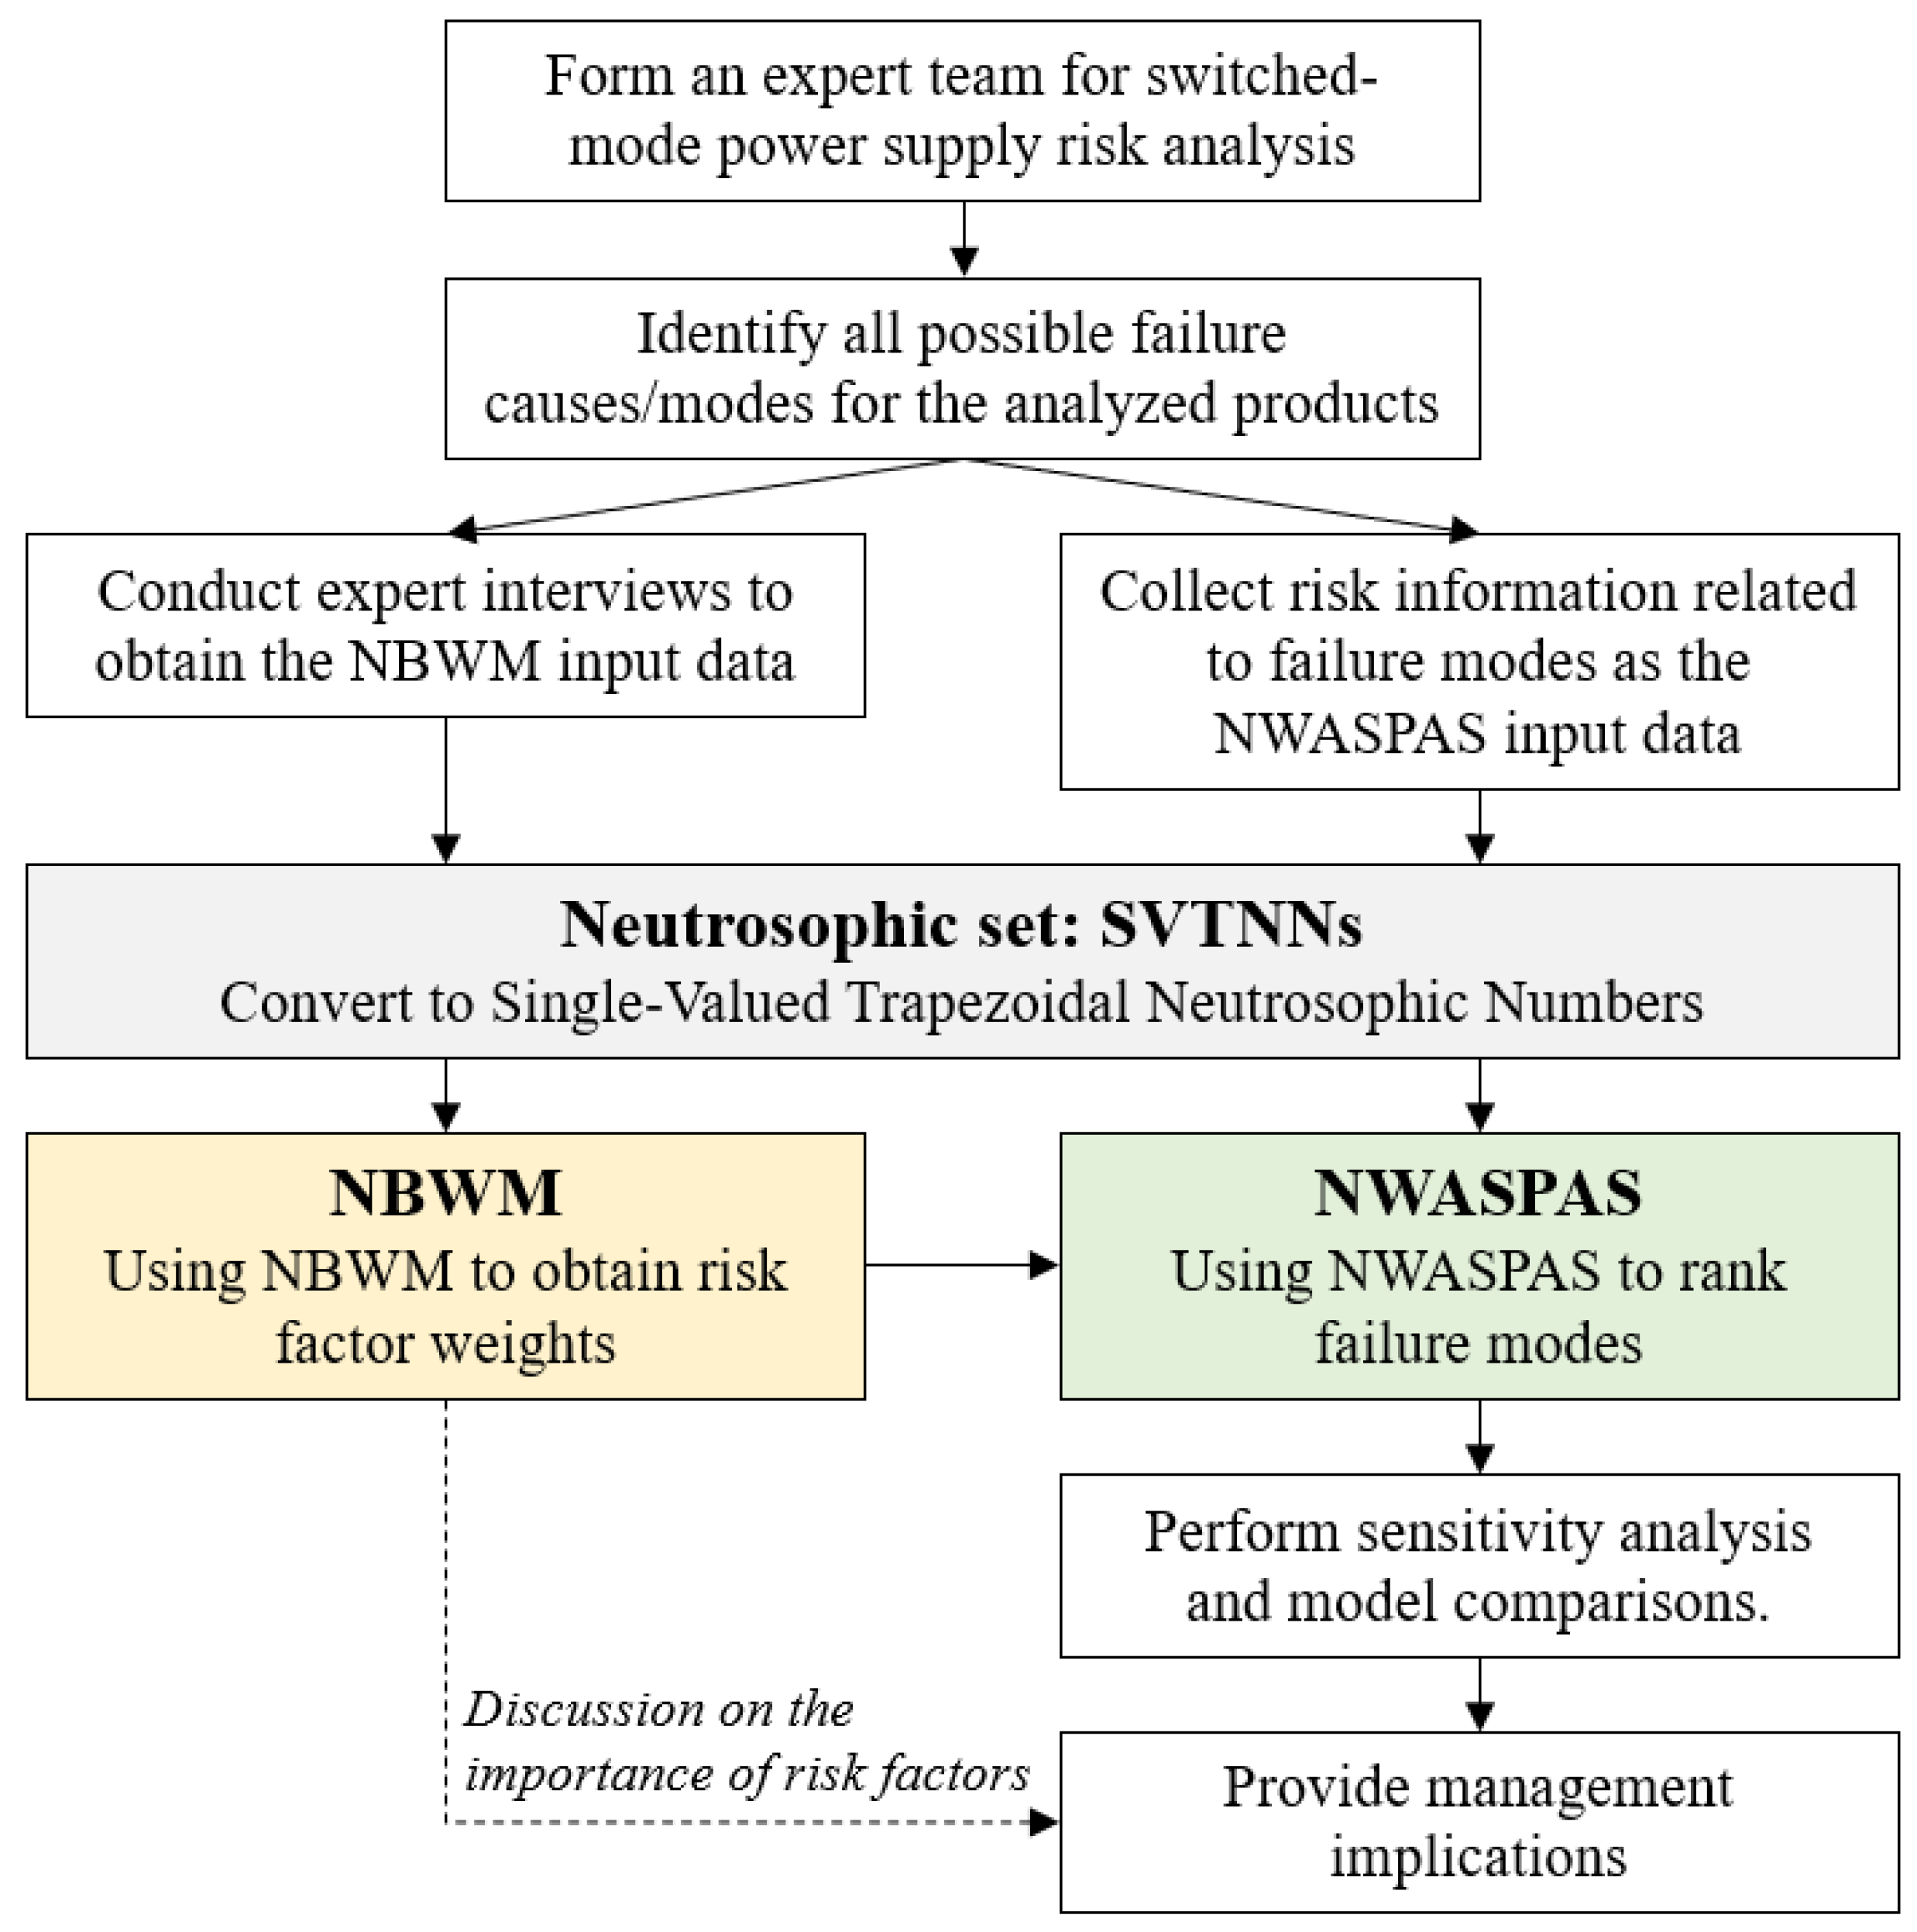
3. The Proposed FMEA Model
The proposed FMEA model integrates three methods, including the neutrosophic set, BWM, and WASPAS. This section details the concepts of the methods involved and presents the analysis steps of the proposed model. The important indices and variables are summarized in Table 2. In addition, architecture of the proposed FMEA model for switched-mode power supply risk analysis is illustrated in Figure 1. The research procedures can be divided into three stages. First, an expert team is formed to identify all possible failure causes/modes of switched-mode power supply. Second, the input data required by the analysis program is collected, and NBWM is used to obtain the weights of the criteria. Finally, we apply the NWASPAS to determine the priority of failure modes. In addition, sensitivity analysis and model comparisons are carried out to illustrate the advantages of the proposed model.
3.1. Neutrosophic Set: SVTNNs
Neutrosophic logic is proposed by Smarandache [36], which extends the concept of traditional intuitionistic fuzzy logic, using three parameters to reflect the uncertainty of the evaluation environment, including truth (), falsity (), and indeterminacy (). In the real world, in the face of unprecedented or special events, it is difficult for humans to accurately judge, evaluate and explain what circumstance it may happen in the future. Thus, using general fuzzy numbers to express the uncertainty of information may not be enough. SVTNNs is a method in neutrosophic set theory, which has two advantages to overcome traditional intuitionistic fuzzy numbers, namely, the inclusion of three parameters to reflect the ambiguity and the use of trapezoidal fuzzy numbers to include a larger amount of information. Several definitions of SVTNNs are as follows [37].
Definition 1.
The value range of,, andis between 0 and 1, normally expressed as a percentage. An SVTNN can be expressed as. It belongs to a special neutrosophic set in the real number set R, where,, andare expressed as truth-membership, falsity-membership, and indeterminacy-membership functions. The membership functions of,, andare shown as Equations (1)–(3) [36,37].
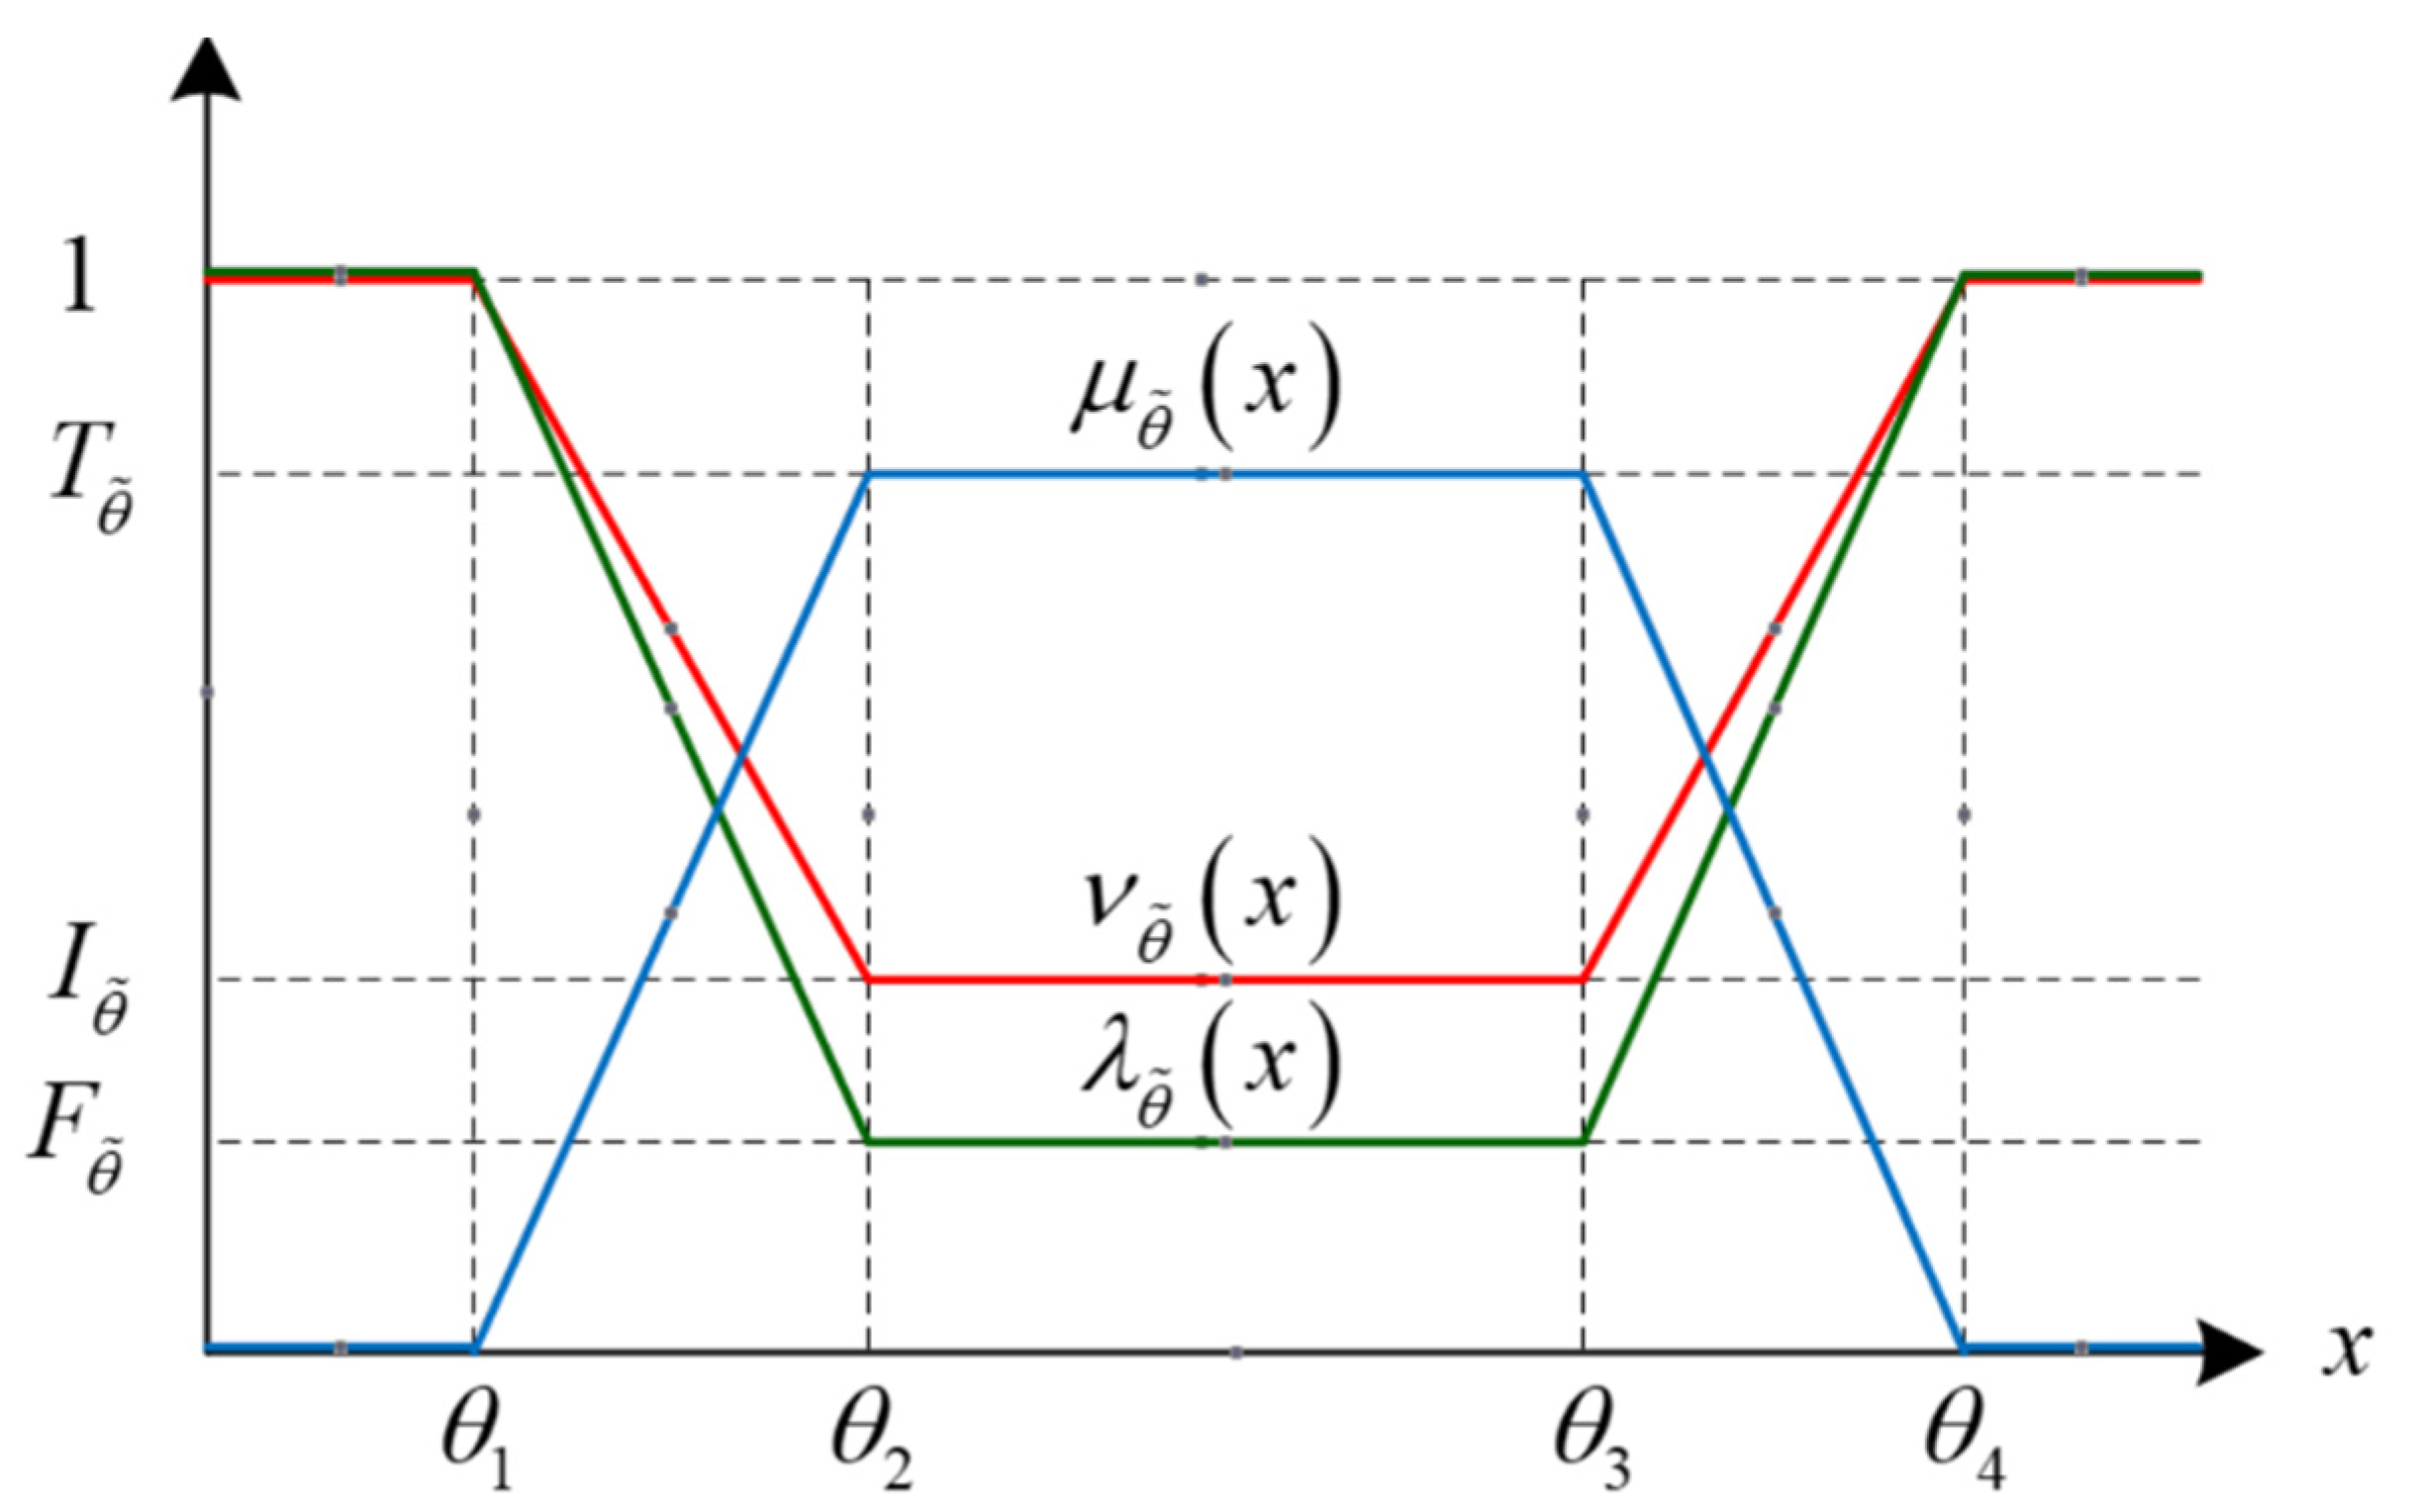
The SVTNN is composed of two parts, including the trapezoidal fuzzy number and the neutrosophic part . Specifically, a trapezoidal fuzzy number can be used to describe the evaluation of an evaluated event, and the experts have to consider whether the number is consistent, inconsistent, and uncertain with the evaluated event separately before forming a complete SVTNN. In neutrosophic logic, the three parameters are independent of one another, and there should be no mutual dependence during the evaluation. The membership function of the three parameters can be plotted as shown in Figure 2. Obviously, truth-membership function belongs to the larger the better (LTB) feature, and the remaining two functions are the smaller the better (STB) feature. The linear function on the Figure 2 can correspond to Equations (1)–(3).
, is an increasing function, but and are decreasing functions. On the other hand, when , is a decreasing function, but and are increasing functions. This phenomenon shows that the concept of is opposite to the other two membership functions. In a nutshell, the truth-membership function is a positive parameter. The larger the value, the higher the confidence of the expert in the evaluation
Definition 2.
Definition 3.
Suppose that there are two SVTNNs here, namelyand, therefore,andcan be compared with each other, which is defined as follows.
- If , then , and it indicates that is absolutely better than .
- If and , then , and it means that is better than .
- If , then , and it means that is worse than .
If , , and , then . Obviously, is better than . On the other hand, if , then . Finally, when , it means that and is the same. Next, the survey data of BWM and WASPAS will be constructed using SVTNNs.
3.2. NBWM
The MCDM method assists experts in the decision-making process to be more scientific. Rezaei [38] proposed BWM in 2015; in contrast with AHP, BWM’s structure is more streamlined and comes with better consistent results. This study combines the neutrosophic set with the BWM method, so that SVTNNs can be used to replace the crisp value in the BWM survey. The detailed steps of NBWM obtaining the weights are as follows:
- ▪
- Step 1. Identify the set of risk factors for the decision-making system
The expert team formulates n risk factors that meet the decision-making issues, .
- ▪
- Step 2. Decide the most and least important risk factors
Following the n risk factors established in Step 1, the most important (i.e., most satisfactory, best, or most preferred) and the least important (i.e., most dissatisfied, worst, or disfavored) risk factors are selected.
- ▪
- Step 3. Take the most important risk factor as a basis and doing pairwise comparisons with other risk factors to produce the neutrosophic Best-to-Others (BO) vector
Experts assess the relative importance of the most important risk factor and other risk factors, as shown in Table 3. The linguistic variables of assessment are from “Equally important, (1, 1, 1, 1)” to “Absolutely important, (4.5, 4.5, 4.5, 5)”. Next, a degree of confidence is given to each evaluation item with the linguistic variables in Table 4. Each evaluation item is a set of SVTNNs. The neutrosophic BO vector can be generated, as shown in Equation (7).
where represents the importance of the most important risk factor B relative to risk factors j, and the comparison between the most important risk factor and itself must be “Equally important” and “Absolutely high confidence”, that is, .
- ▪
- Step 4. Take the rest of the risk factors as a benchmark, and make pairwise comparisons with the least important risk factor to generate the neutrosophic Others-to-Worst (OW) vector
Similar to Step 3, the experts assess the relative importance of other risk factors with the least important risk factor, and generate the neutrosophic OW vector, as shown in Equation (8).
where represents the importance of the remaining risk factor j relative to the least important risk factor W, and .
- ▪
- Step 5. Use Equation (4) to convert SVTNNs into crisp values
The elements of the neutrosophic BO and OW vectors are all types of SVTNNs. Before linear programming is used to obtain the criteria weights, the elements of the neutrosophic BO and OW vectors must be converted to crisp values through Equation (4).
- ▪
- Step 6. Calculate the optimal weight value of each risk factor
The optimal weight is calculated by the linear programming model. The BO and OW vectors are the input data (with crisp values), and the absolute deviations from the expert evaluation (that is, and ). Moreover, to maximize the absolute deviation value in the end, the minimum of the two is chosen as the optimal goal function, and the complete model is shown in Equation (9).
In Equation (9), the goal function for minimizing the maximum value can be alternated into a linear goal function to facilitate the calculation. The minimization goal function after conversion can be introduced by the following model:
In Equation (10), it is possible to produce multiple optimal solutions; thus, Rezaei [39] proposed a linear BWM model and modified the minimization goal function model to:
It is a linear function in Equation (11), and only a single optimal solution is obtained. can be regarded as a consistency index when is close to 0, which indicates a high degree of consistency.
3.3. NWASPAS
WASPAS is a hybrid MCDM method, developed by combining the two systems of Weighted Sum Model (WSM) and Weighted Product Model (WPM) [40]. This method has been used to deal with MCDM problems. For example, Badalpur and Nurbakhsh [41] applied WASPAS identified and evaluated the risks of a road construction project in Iran. In addition, authors pointed out that WASPAS is one of the basic MCDM methods for getting started, and the calculation results of this method are reliable and effective.
The paper proposes the NWASPAS method to determine the risk score of failure modes and their ranking. The operation steps are as follows:
- ▪
- Step 1. Obtain the initial neutrosophic assessment matrix
This study applies the linguistic variables in Table 5 [30] to identify the scores of failure modes. Next, the experts give confidence levels for each score according to Table 4.
Assume that the FMEA team has k experts. Experts assess the score of failure mode i in risk factor j to obtain the initial neutrosophic assessment matrix (Equation (12)), where k = 1, 2, …, p; j = 1, 2, …, n; and i = 1, 2, …, m.
where represents the score of the kth expert’s assessment of the failure mode i under the risk factor j.
- ▪
- Step 2. Obtain the assessment matrix
According to Equation (4), the initial neutrosophic assessment matrix is defuzzified to obtain the assessment matrix Equation (13).
- ▪
- Step 3. Use Equation (14) to calculate the average assessment matrix
- ▪
- Step 4. Calculate the normalized matrix
In order to unify the unit and score range of the assessment risk factors, the normalized matrix Equation (15) is obtained through Equation (16) here, we set the highest risk score to 10.
- ▪
- Step 5. Calculate the performance indexes WSM and WSP
Through Equations (17) and (18), the performance indexes WSM and WSP can be calculated.
Both WSM and WSP are considered in NWASPAS, and the preference ratio of these two is determined by the parameter. The integrated performance index Z is shown in Equation (19).
The failure modes are ranked according to the performance index Z. If it has the highest performance value Z, it means that the failure mode is the riskiest.
4. Case Illustration
This section demonstrates the effectiveness and practicality of the proposed FMEA model with actual cases and compares it with the traditional FMEA method. Finally, significant management implications are provided through the analysis results and recommendations are made to decision- makers on future improvement plans.
4.1. Problem Description and Data Collection
The quality and reliability of power supply products are critical to electronic products. The manufacturing process and quality engineers have to evaluate the possible failure modes before the new products are launched, and further exploit improvement strategies to reduce the possibility of product risks. The case in this study is a multinational company headquartered in Taiwan that has business with global well-known brands in the electronics industry. The power supply product categories designed by the company include laptops, consumer products, desktop computers, workstations, and servers. Facing the trend of consumers with higher product safety requirements, the top management believes that it is necessary to continuously improve product quality to face sales competition in the global market.
The FMEA plan of the case company was composed of senior managers within the company. A total of 15 experts, who have had more than 10 years’ experience, came from five departments, including manufacturing process design, production management, quality assurance, R&D, and sales team. The 20 possible failure modes of power supply products of the power supply were determined, as shown in Table 6.
4.2. Using NBWM to Obtain Risk Factor Weights
The operating process of NBWM is to invite the 15 experts to decide the best and worst risk factors based on their experience and expertise. Table 7 shows the most important and least important risk factors selected by the experts. According to Equations (7) and (8), the neutrosophic BO and OW vectors can be obtained, as shown in Table 8 and Table 9 (taking Expert 1 as an example).
Based on Step 5 of Section 3.2, the Equation (4) is applied to defuzzify the contents of Table 8 and Table 9, the BO and OW vectors can be obtained as shown in Table 10 and Table 11.
The consistency ratios of the 15 experts in the NBWM questionnaire were all less than 0.1, indicating high consistency [42]. Table 12 lists the weights of the risk factors and their ranking. The ranking of the risk factors is S, E, O, and D based on their relative importance. The most important risk factor is severity (S), and its weight is 0.408. The added expected cost (E) ranks second with the weight of 0.2872.
4.3. Using NWASPAS to Rank Failure Modes
This study uses a hybrid MCDM performance method, WASPAS, to enhance the effectiveness of the risk analysis model, and the reliability and efficiency of the model calculation will not be influenced by the number of failure modes. In the next step, the 15 experts used the linguistic variables (Table 4 and Table 5) to assess each failure mode under different risk factors. The initial neutrosophic assessment matrix of Expert 1 is shown in Table 13.
Though Equations (13)–(19), the calculation results of NWASPAS can be obtained, as shown in Table 14. The top five failure modes are capacitor burst (FM11), components burned out (FM13), transistor failure (FM12), blown fuses (FM14), and insufficient voltage output (FM21). The WASPAS of the failure mode FM11 has the largest value (0.6945) in the assessment model; thus, it should have the highest priority for prevention and correction. Based on the results, Section 5 presents sensitivity analysis, model comparison, and discussion of management implications.
5. Discussion
In this section, sensitivity analysis and model comparisons are performed to measure the robustness and effectiveness of the proposed model. In addition, in the part of management implications, the elimination and improvement strategies of failure modes are also discussed.
5.1. Sensitivity Analysis
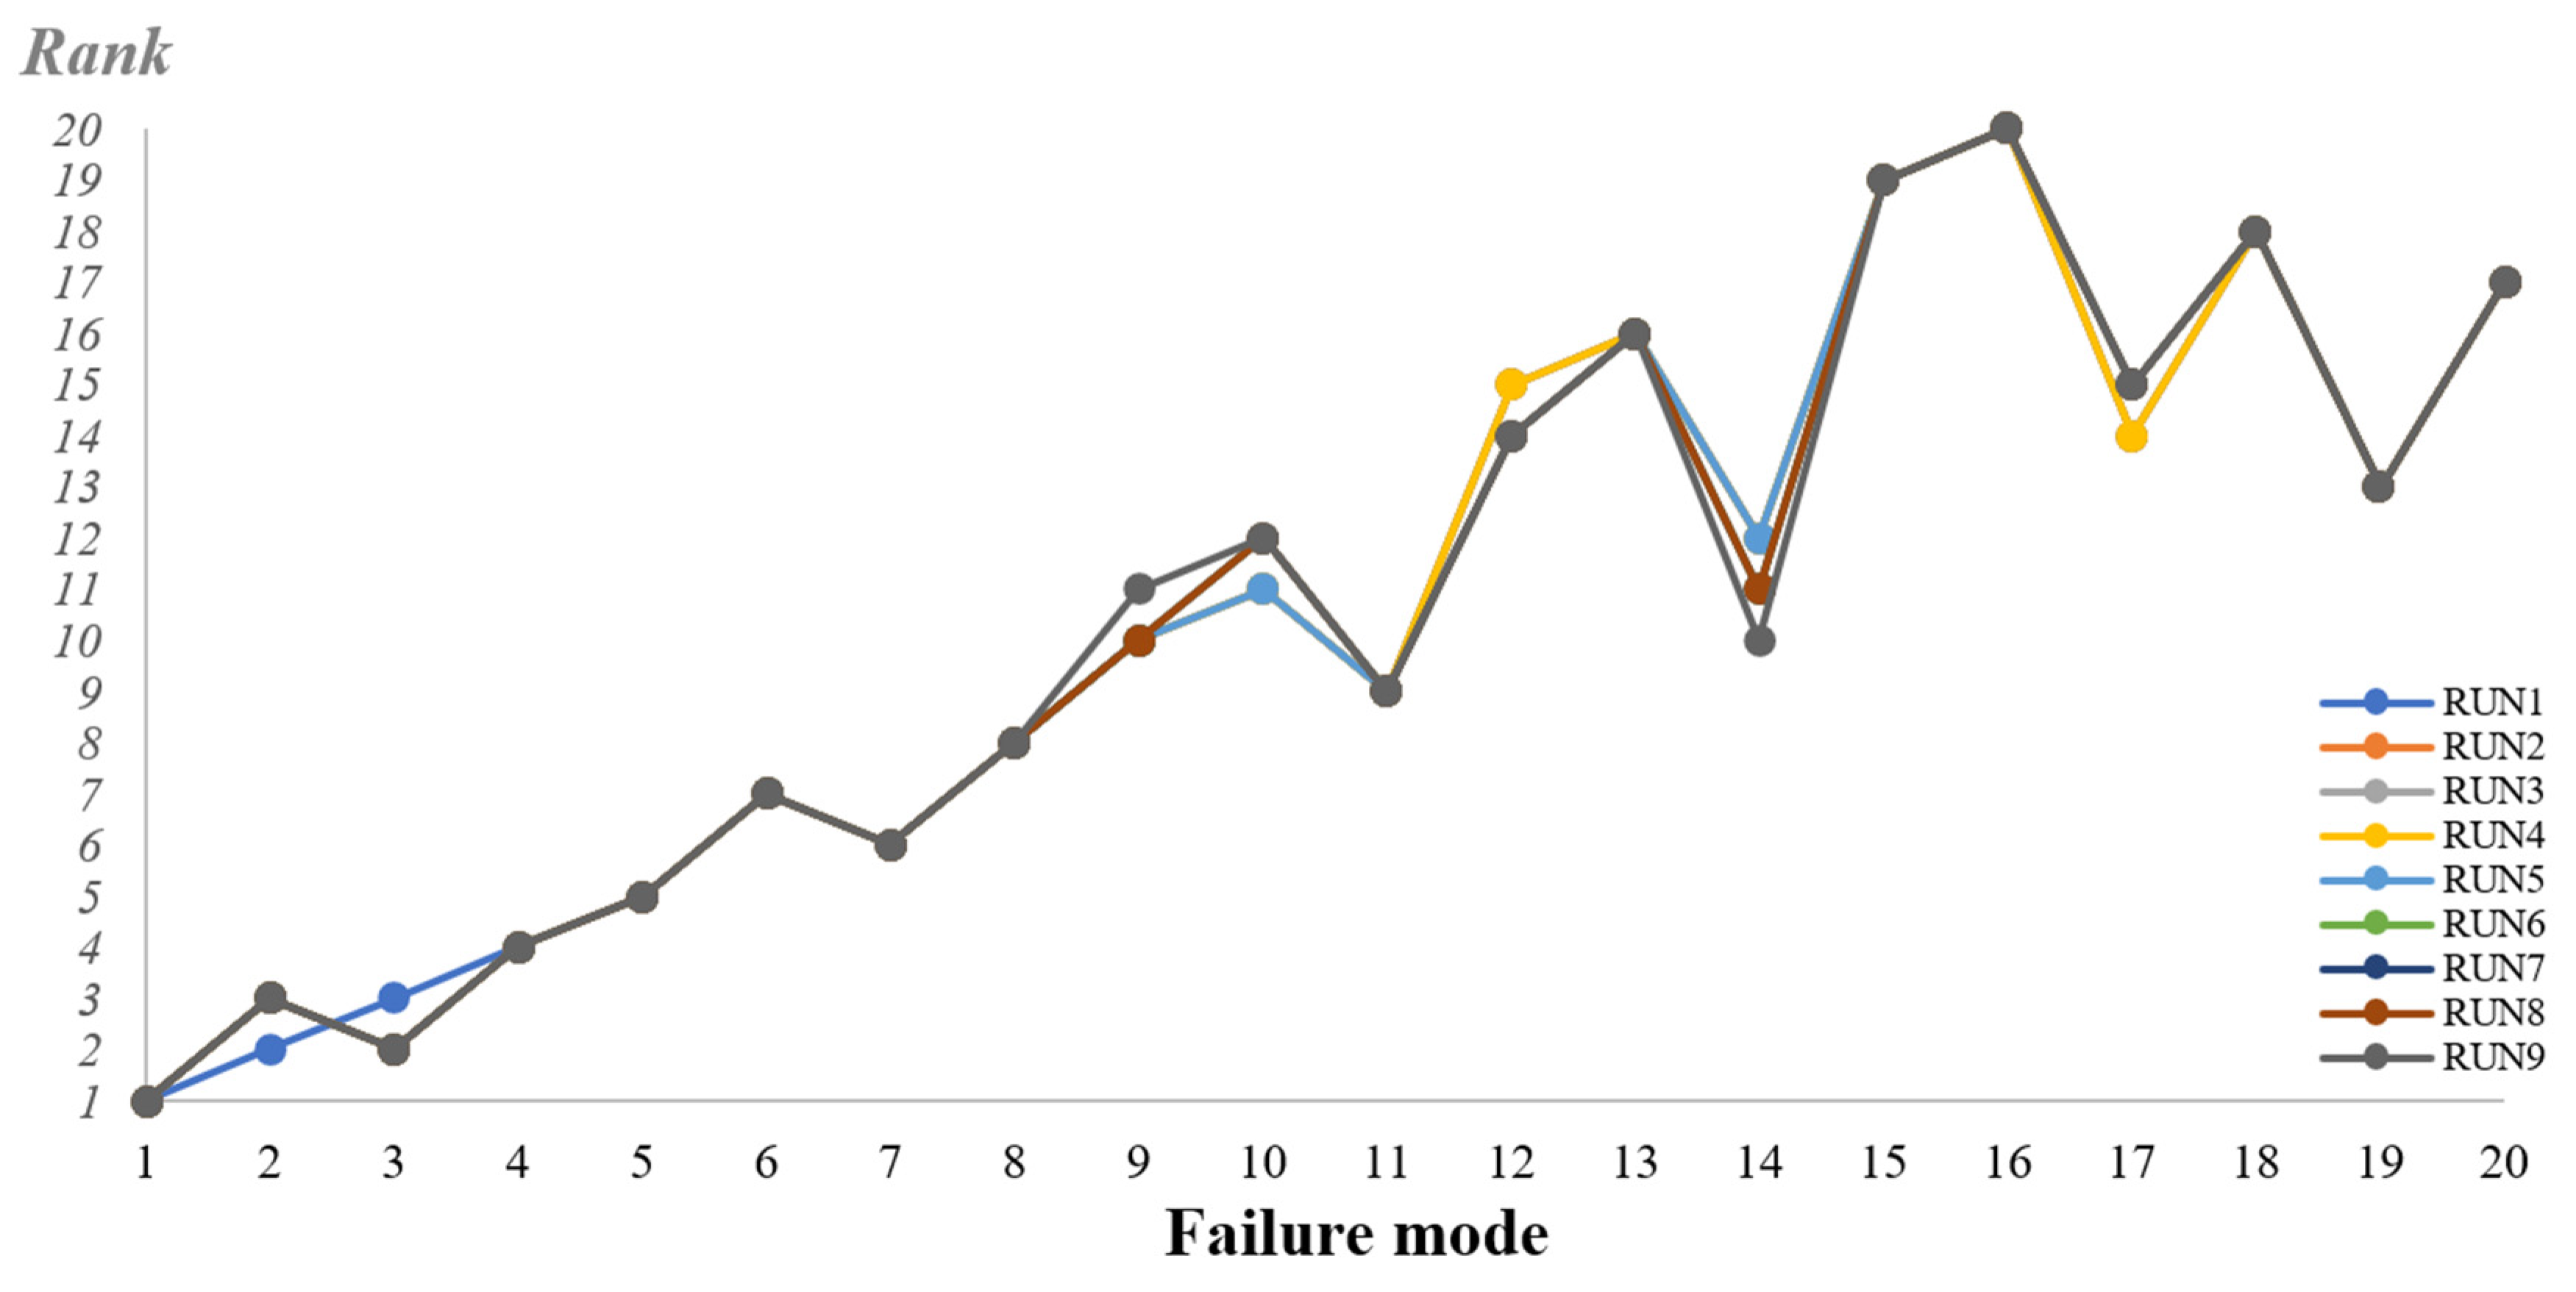
The integration of the two parameters WSM and WSP is used for sensitivity analysis. This study set these two parameters to be configured with equal weight (λ = 0.5), which means that the parameters have equal importance in the beginning. The reason for taking this approach is to ensure the robustness of the proposed model not being affected by the different weights of WSM and WSP. Table 15 shows the failure modes for different risk scores, with the parameter ranging from 0.1 to 0.9 (lowest to highest). According to Figure 3, there is no significant difference in the ranking result even though the parameter is changed. Therefore, it is justifiable to set the parameter = 0.5.
5.2. Model Comparisons
The following section is to compare the model (NBWM and NWASPAS) proposed in this study with two other models. As shown in Table 16, the RPN of the first model was obtained from the traditional FMEA. From the perspective of failure mode ranking, the results of RPN are only slightly different from the ranking results of our proposed model. However, just as the shortcoming discussed in Section 2, the final value obtained by multiplying the three factors could range from 1 to 10,000. These unreasonable RPN numbers could mislead the interpretation of risk levels. Another problem is that the weights of S, O, and D are equal, which will cause the relative importance of these three risk factors to be ignored. It is very likely to have the same value after calculation, but almost impossible to determine which ones are more serious and need to be treated as the priority tasks to resolve.
For the second model [43,44], BWM and SAW, it does not take into account the uncertainty of the evaluation environment. In addition, there is no way to obtain the confidence levels from the interviews with the experts in answering questions during the evaluation process. The proposed model (NBWM and NWASPAS) not only allows the authenticity, deviation, and uncertainty to be considered, but also more clearly reflects the true and effective risk values during the expert assessment.
5.3. Management Implications
Among the top five failure modes with the highest risk, four modes are related to the lack of power output. The following content will discuss their root causes and consequences, respectively. The experts unanimously agree that FM11 (risk score 0.6925) capacitor burst is ranked number one. The operating temperature of the electrolytic capacitor is up to 105 °C [45]. Once the internal temperature rises to the boiling point of the electrolyte liquid, it leads to the rising of the capacitor’s inside pressure to exceed the withstand limit of the explosion-proof valve, which will cause capacitor burst. The main chemical solvent and electrolytic paper of the electrolyte are flammable, and the electrolyte liquid is also conductive. If the electrolyte contacts the motherboard, it may corrode the circuit or cause a short circuit, resulting in smoke or fire. Therefore, the circuit layout should not be located under the capacitor; similarly, the operating conditions should not exceed its rated operating voltage and temperature.
For the second-place FM13 (risk score 0.6143), components are burned out due to overheating. This phenomenon can happen for several reasons: (1) the input voltage is continuously unstable or over the component rated specification, (2) the components are damaged by rush currents, (3) the parts are highly abrasive after long time use, and (4) the cooling fan efficiency decreases, which causes overheating. Ranked third is the failure of FM12 (risk score 0.6026), transistor failure. A transistor is a solid semiconductor, and as a variable current switch, it can control the output current based on the input voltage [46]. There are many points to pay attention to in the application of transistors, especially the maximum ratings, such as maximum voltage, current, and output power. Used in an excessive state, the internal structure of the transistor will be damaged and cause the problem of no power output after it fails.
The fourth item is FM14 (risk score 0.5788)—blown fuses. Switched-mode power supply (SMPS)’s fuses burning out can be due to the following reasons: (1) the total output capacity is too close to the designed current, (2) the input power is larger than the rated specification, and (3) the fuse has problems of aging or quality defects. A blown fuse sometimes burns its associated circuit parts in a chain reaction; thus, it is necessary to be very careful about this kind of problem. Ranked fifth is FM21 (risk score 0.5088), the output voltage being insufficient. The general root cause is using controller IC with poor quality. It may also be caused by lower input or unstable voltage. This problem will affect the performance of the entire device. Take a desktop computer as an example. It may not be able to boot the computer or its computing performance may be lower than the original design specifications. In severe cases, it could damage the motherboard, graphics card, and hard disk. This is a serious failure problem for the desktop computer.
According to the research results shown above, the risk assessment values of the top five failure modes are all more than 0.5; thus, they are relatively important among all failure modes. Furthermore, “severity (S)” and “expected cost (E)” are the linchpin risk factors for appraising the failure modes of a power supply, which shows the need to add the expected cost in the FMEA evaluation factors. The quality of the SMPS directly affects the overall performance and safety of electronic equipment. Improving power output and quality are urgent actions to be taken.
6. Conclusions and Future Work
This study has brought many benefits to the case company. An important concept is that the reliability of power supply should be considered from the source (i.e., the product development and manufacturing stage) of a product. Otherwise, the subsequent maintenance costs in the market may be extraordinarily costly and cause consumers to lose confidence in the brand. Engineers may consider using different production methods or higher-grade components to remove these problems. However, considering limited resources and the time constraint in the real world, this study uses a hybrid MCDM based FMEA model to enhance the effectiveness of the risk analysis model. Moreover, the efficiency and reliability of the model calculation will not be influenced by the number of failure modes. The calculation concept in this method is clear, easy to understand and operate, and suitable for practical use. In addition, this model not only effectively integrates the judgments from experts but also greatly optimizes the calculation of traditional FMEA. Specific contributions and characteristics of this study are summarized below:
- (i)
- Considering the expected cost (E) as a risk factor.
- (ii)
- Introducing the neutrosophic logic into the analysis methods and clearly showing the uncertainty of experts during the evaluation process.
- (iii)
- Significantly reducing the number of problem items and achieving a better consistency ratio.
- (iv)
- Optimizing the traditional FMEA’s RPN calculation method to obtain more reliable ranking results.
- (v)
- Analyzing root causes of SMPS failures and providing improvement measures to decision-makers and engineers of R&D and quality.
Even though this research makes up for some of the shortcomings and limitations of the original FMEA model, there are still some discrepancies that need to be improved. In the future, evaluation systems can be used to apply more seasonable measurement data to help experts to judge the effectiveness and efficiency of the failure modes. Furthermore, even though the proposed model can help diagnose failure modes, troubleshooting still has to be performed by well-trained professionals. In terms of application, our research methods will be extended to the risk management of other electronic products in the future, and we expect that evaluation model can be used for coding software for different industrial uses. In addition, the research framework will be combined with other evaluation tools, such as DEMATEL, to define the mutual influence among the risk factors, so that risk assessment can be more comprehensive and cover a wider range.
Author Contributions
Conceptualization, H.-W.L.; Methodology, H.-W.L.; Validation, J.J.H.L.; Formal Analysis, J.J.H.L. and P.C.Y.L.; Investigation, P.C.Y.L.; Writing—Original Draft Preparation, P.C.Y.L.; Writing—Review & Editing, J.J.H.L. and H.-W.L.; Project Administration, P.C.Y.L. All authors have read and agreed to the published version of the manuscript.
Funding
This research received no external funding.
Conflicts of Interest
The authors declare no conflict of interest.
Nomenclature
| Acronym | Nomenclature |
| BO | Best-to-Others |
| FMEA | Failure Mode and Effects Analysis |
| GRA | Grey Relational Analysis |
| NBWM | Neutrosophic Best Worst method |
| NWASPAS | Neutrosophic Weight Aggregated Sum Product Assessments |
| OW | Others-to-Worst |
| R&D | Research and Design |
| RPN | Risk Priority Number |
| SAW | Simple Additive Weighting |
| SMPS | Switched-Mode Power Supply |
| SVTNNs | Single-Valued Trapezoidal Neutrosophic Numbers |
| TERPN | Total efficient risk priority number |
| TOPSIS | Technique for Order Preference by Similarity to an Ideal Solution |
| VIKOR | VlseKriterijuska Optimizacija I Komoromisno Resenje |
| WASPAS | Weight Aggregated Sum Product Assessments |
| WSM | Weighted Sum Model |
| WPM | Weighted Product Model |
References
- Huang, H.; Tong, X.; Cai, Y.; Tian, H. Gap between discarding and recycling: Estimate lifespan of electronic products by survey in formal recycling plants in China. Resour. Conserv. Recycl. 2020, 156, 104700. [Google Scholar] [CrossRef]
- Murumkar, A.B.; Teli, S.N.; Loni, R.R. Framework for Reduction of Quality Cost. Int. J. Res. Eng. Appl. Manag. 2018, 156–162. [Google Scholar] [CrossRef]
- Guinot, J.; Evans, D.; Badar, M.A. Cost of quality consideration following product launch in a present worth assessment. Int. J. Qual. Reliab. Manag. 2016, 33, 399–413. [Google Scholar] [CrossRef]
- Liangliang, Z.; Shaojie, H.; Jiawen, S.; Feng, Z.; Hao, Z.; Junhui, H. Light Touch Power Supply Switch Using For Portable Device. In Proceedings of the 2nd Joint International Information Technology, Mechanical and Electronic Engineering Conference (JIMEC 2017), Chongqing, China, 4–5 October 2017; Atlantis Press: Amsterdam, The Netherlands, 2017. [Google Scholar]
- Huang, X.L.; Ma, X.; Hu, F. Machine learning and intelligent communications. Mob. Netw. Appl. 2018, 23, 68–70. [Google Scholar] [CrossRef] [Green Version]
- Apostolopoulos, P.A.; Tsiropoulou, E.E.; Papavassiliou, S. Demand response management in smart grid networks: A two-stage game-theoretic learning-based approach. Mob. Netw. Appl. 2018, 1–14. [Google Scholar] [CrossRef] [Green Version]
- Boral, S.; Howard, I.; Chaturvedi, S.K.; McKee, K.; Naikan, V.N. An integrated approach for fuzzy failure modes and effects analysis using fuzzy AHP and fuzzy MAIRCA. Eng. Fail. Anal. 2020, 108, 104195. [Google Scholar] [CrossRef]
- Chemweno, P.; Pintelon, L.; Van Horenbeek, A.; Muchiri, P. Development of a risk assessment selection methodology for asset maintenance decision making: An analytic network process (ANP) approach. Int. J. Prod. Econ. 2015, 170, 663–676. [Google Scholar] [CrossRef]
- Wang, Z.; Gao, J.M.; Wang, R.X.; Chen, K.; Gao, Z.Y.; Zheng, W. Failure mode and effects analysis by using the house of reliability-based rough VIKOR approach. IEEE Trans. Reliab. 2017, 67, 230–248. [Google Scholar] [CrossRef]
- Di Bona, G.; Silvestri, A.; Forcina, A.; Petrillo, A. Total efficient risk priority number (TERPN): A new method for risk assessment. J. Risk Res. 2018, 21, 1384–1408. [Google Scholar] [CrossRef]
- Chang, T.W.; Lo, H.W.; Chen, K.Y.; Liou, J.J. A novel FMEA model based on rough BWM and rough TOPSIS-AL for risk assessment. Mathematics 2019, 7, 874. [Google Scholar] [CrossRef] [Green Version]
- Liu, B.; Hu, Y.; Deng, Y. New Failure Mode and Effects Analysis based on D Numbers Downscaling Method. Int. J. Comput. Commun. Control 2018, 13, 205–220. [Google Scholar] [CrossRef] [Green Version]
- Zheng, H.; Deng, Y. Evaluation method based on fuzzy relations between dempster-shafer belief structure. Int. J. Intell. Syst. 2018, 33, 1343–1363. [Google Scholar] [CrossRef]
- Kompa, B.; Snoek, J.; Beam, A. Empirical Frequentist Coverage of Deep Learning Uncertainty Quantification Procedures. arXiv 2020, arXiv:2010.03039. [Google Scholar]
- Martino, L.; Elvira, V.; Luengo, D.; Corander, J. An adaptive population importance sampler: Learning from uncertainty. IEEE Trans. Signal Process. 2015, 63, 4422–4437. [Google Scholar] [CrossRef] [Green Version]
- Van Amersfoort, J.; Smith, L.; Teh, Y.W.; Gal, Y. Simple and Scalable Epistemic Uncertainty Estimation Using a Single Deep Deterministic Neural Network. arXiv 2020, arXiv:2003.02037. [Google Scholar]
- Li, Y.L.; Wang, R.; Chin, K.S. New failure mode and effect analysis approach considering consensus under interval-valued intuitionistic fuzzy environment. Soft Comput. 2019, 23, 11611–11626. [Google Scholar] [CrossRef]
- Can, G.F. An intutionistic approach based on failure mode and effect analysis for prioritizing corrective and preventive strategies. Hum. Factors Ergon. Manuf. 2018, 28, 130–147. [Google Scholar] [CrossRef]
- Gugaliya, A.; Boral, S.; Naikan, V.N. A hybrid decision making framework for modified failure mode effects and criticality analysis. Int. J. Qual. Reliab. Manag. 2019, 36, 1266–1283. [Google Scholar] [CrossRef]
- Kang, J.; Sun, L.; Sun, H.; Wu, C. Risk assessment of floating offshore wind turbine based on correlation-FMEA. Ocean Eng. 2017, 129, 382–388. [Google Scholar] [CrossRef]
- Ghoushchi, S.J.; Yousefi, S.; Khazaeili, M. An extended FMEA approach based on the Z-MOORA and fuzzy BWM for prioritization of failures. Appl. Soft Comput. 2019, 81, 1–13. [Google Scholar] [CrossRef]
- Chanamool, N.; Naenna, T. Fuzzy FMEA application to improve decision-making process in an emergency department. Appl. Soft Comput. 2016, 43, 441–453. [Google Scholar] [CrossRef]
- Chang, K.H. Generalized multi-attribute failure mode analysis. Neurocomputing 2016, 175, 90–100. [Google Scholar] [CrossRef]
- Lo, H.W.; Shiue, W.; Liou, J.J.; Tzeng, G.H. A hybrid MCDM-based FMEA model for identification of critical failure modes in manufacturing. Soft Comput. 2020, 24, 15733–15745. [Google Scholar] [CrossRef]
- Bian, T.; Zheng, H.; Yin, L.; Deng, Y. Failure mode and effects analysis based on D numbers and TOPSIS. Qual. Reliab. Eng. Int. 2018, 34, 501–515. [Google Scholar] [CrossRef]
- Hu, Y.P.; You, X.Y.; Wang, L.; Liu, H.C. An integrated approach for failure mode and effect analysis based on uncertain linguistic GRA–TOPSIS method. Soft Comput. 2019, 23, 8801–8814. [Google Scholar] [CrossRef]
- Liu, H.C.; You, J.X.; Shan, M.M.; Su, Q. Systematic failure mode and effect analysis using a hybrid multiple criteria decision-making approach. Total Qual. Manag. Bus. Excell. 2019, 30, 537–564. [Google Scholar] [CrossRef]
- Boral, S.; Howard, I.; Chaturvedi, S.K.; McKee, K.; Naikan, V.N. A novel hybrid multi-criteria group decision making approach for failure mode and effect analysis: An essential requirement for sustainable manufacturing. Sustain. Prod. Consum. 2020, 21, 14–32. [Google Scholar] [CrossRef]
- Zhu, J.; Shuai, B.; Li, G.; Chin, K.S.; Wang, R. Failure mode and effect analysis using regret theory and PROMETHEE under linguistic neutrosophic context. J. Loss Prev. Process. Ind. 2020, 64, 104048. [Google Scholar] [CrossRef]
- Liu, H.C.; Wang, L.E.; You, X.Y.; Wu, S.M. Failure mode and effect analysis with extended grey relational analysis method in cloud setting. Total Qual. Manag. Bus. Excell. 2019, 30, 745–767. [Google Scholar] [CrossRef]
- Srivastava, P.; Khanduja, D.; Ganesan, S. Fuzzy methodology application for risk analysis of mechanical system in process industry. Int. J. Syst. Assur. Eng. Manag. 2020, 11, 297–312. [Google Scholar] [CrossRef]
- Rezaee, M.J.; Yousefi, S.; Eshkevari, M.; Valipour, M.; Saberi, M. Risk analysis of health, safety and environment in chemical industry integrating linguistic FMEA, fuzzy inference system and fuzzy DEA. Stoch. Environ. Res. Risk Assess. 2020, 34, 201–218. [Google Scholar] [CrossRef]
- Liu, Y.; Shen, G.T.; Zhao, Z.Y.; Wu, Z.W. Risk assessment of failure mode and effects analysis (FMEA) under hesitant fuzzy information. Insight-Non-Destr. Test. Cond. Monit. 2019, 61, 214–221. [Google Scholar] [CrossRef]
- Qin, J.; Xi, Y.; Pedrycz, W. Failure mode and effects analysis (FMEA) for risk assessment based on interval type-2 fuzzy evidential reasoning method. Appl. Soft Comput. 2020, 89, 106–134. [Google Scholar] [CrossRef]
- Panchal, D.; Kumar, D. Risk analysis of compressor house unit in thermal power plant using integrated fuzzy FMEA and GRA approach. Int. J. Ind. Syst. Eng. 2017, 25, 228–250. [Google Scholar]
- Smarandache, F. A unifying field in Logics: Neutrosophic Logic. In Philosophy; CogPrints; American Research Press: Santa Fe, NM, USA, 1999; pp. 1–141. [Google Scholar]
- Liang, R.X.; Wang, J.Q.; Li, L. Multi-criteria group decision-making method based on interdependent inputs of single-valued trapezoidal neutrosophic information. Neural Comput. Appl. 2018, 30, 241–260. [Google Scholar] [CrossRef]
- Rezaei, J. Best-worst multi-criteria decision-making method. Omega 2015, 53, 49–57. [Google Scholar] [CrossRef]
- Rezaei, J. Best-worst multi-criteria decision-making method: Some properties and a linear model. Omega 2016, 64, 126–130. [Google Scholar] [CrossRef]
- Chakraborty, S.; Zavadskas, E.K. Applications of WASPAS method in manufacturing decision making. Informatica 2014, 25, 1–20. [Google Scholar] [CrossRef] [Green Version]
- Badalpur, M.; Nurbakhsh, E. An application of WASPAS method in risk qualitative analysis: A case study of a road construction project in Iran. Int. J. Constr. Manag. 2019, 1–9. [Google Scholar] [CrossRef]
- Yazdani, M.; Zavadskas, E.K.; Ignatius, J.; Abad, M.D. Sensitivity analysis in MADM methods: Application of material selection. Eng. Econ. 2016, 27, 382–391. [Google Scholar] [CrossRef] [Green Version]
- Sotoudeh-Anvari, A.; Sadjadi, S.; Molana, S.; Sadi-Nezhad, S. A new MCDM-based approach using BWM and SAW for optimal search model. Decis. Sci. Lett. 2018, 7, 395–404. [Google Scholar] [CrossRef]
- Stević, Ž.; Pamučar, D.; Zavadskas, E.K.; Ćirović, G.; Prentkovskis, O. The selection of wagons for the internal transport of a logistics company: A novel approach based on rough BWM and rough SAW methods. Symmetry 2017, 9, 264. [Google Scholar] [CrossRef] [Green Version]
- Romero, J.; Azarian, M.H.; Pecht, M. Reliability analysis of multilayer polymer aluminum electrolytic capacitors. Microelectron. Reliab. 2020, 112, 1–7. [Google Scholar] [CrossRef]
- Shirriff, K. The quiet remaking of computer power supplies: A half century ago, better transistors and switching regulators revolutionized the design of computer power supplies. IEEE Spectr. 2019, 56, 36–41. [Google Scholar] [CrossRef]
Figure 1.
A flow chart of this study.

Figure 2.
The truth-membership, falsity-membership, and indeterminacy-membership functions.

Figure 3.
Ranking results after nine sensitivity analysis performed.


Table 1.
Summary of literature review of multiple criteria decision-making (MCDM) combined with failure mode and effects analysis (FMEA) models.
Table 1.
Summary of literature review of multiple criteria decision-making (MCDM) combined with failure mode and effects analysis (FMEA) models.
| Author | Research Methodology | Application Field |
|---|---|---|
| Lo et al. [24] | Use Decision Making Trial and Evaluation Laboratory (DEMATEL) to determine influence weight of risk factors, rank and compare the results obtained using different MCDM methods—Simple Additive Weighting (SAW) VIKOR, Grey Relational Analysis (GRA), Complex proportional assessment of alternatives (COPRAS) to generate a final ranking result. | Computer Numerical Control (CNC) rotary machine |
| Bian et al. [25] | A risk priority model based on D numbers, and propose technique for order of preference by similarity to ideal solution (TOPSIS) to evaluate the risk in FMEA. | Applying to rotor blades of aircraft’s turbine |
| Hu et al. [26] | Applying grey relation analysis (GRA) –TOPSIS to determining risk ranking of identified failure modes. Considering vagueness and uncertainty in FMEA team’s evaluations on failure modes, proposed two-dimensional uncertain linguistic variables to describe the risk evaluation result and reliability of a failure mode. | A healthcare risk analysis case study about suctioning by endotracheal tube (ETT) |
| Liu et. al. [27] | Use Analytic Hierarchy Process (AHP) to determine weights of risk factors, fuzzy Graph-Theoretical Matrix calculate risk effect indexes, and identify interrelationships between failure modes by DEMATEL. | Empirical study of rotary switch |
| Boral et al. [28] | MCGDM integrating by Interval Type-2 Fuzzy DEMATEL (IT2F-DEMATEL) and Modified Fuzzy Multi-Attribute Ideal Real Comparative Analysis (Modified FMAIRCA). | To extend FMEA approach to reflect benefits on sustainable manufacturing |
| Zhu et al. [29] | Use linguistic neutrosophic numbers to capture decision-makers’ evaluation of failure modes on each risk criterion. Combined regret theory and PROMETHEE (Preference ranking organization method for enrichment evaluation) methods to establish a hybrid risk ranking model of FMEA. | Using a supercritical water gasification system as an empirical case study |
| Liu et. al. [30] | Integrating cloud model theory with extended GRA for resolving disadvantages of traditional RPN method. | Screening unit in a paper mill |
| Srivastava et al. [31] | Combined fuzzy decision support system and fuzzy GRA for estimating RPN scores, then compared with classical RPN scores for realistic prioritization and decision making. | Sugar plants milling system |
| Rezaee et al. [32] | A hybrid approach based on the Linguistic FMEA, Fuzzy Inference System (FIS) and Fuzzy Data Envelopment Analysis (DEA) model to calculate scores for covering shortcomings of RPN and prioritizing HSE risks. | Chemical industry. |
Table 2.
Important indices and variables.
| Indices | Description | ||
| i | Failure mode i, i = 1, 2, …, m | ||
| j | Risk factor j, j = 1, 2, …, n | ||
| k | Expert k, k = 1, 2, …, p | ||
| Variables | Description | Variables | Description |
| SVTNN | Weight of risk factor | ||
| Truth variable | Consistency index | ||
| Falsity variable | Initial neutrosophic assessment matrix of expert k | ||
| Indeterminacy variable | Average assessment matrix | ||
| Truth-membership function | Normalized assessment matrix | ||
| Falsity-membership function | Performance indexes WSM of failure mode i | ||
| Indeterminacy-membership function | Performance indexes WSP of failure mode i | ||
| BO vector | Integrated performance index of failure mode i | ||
| OW vector |
Table 3.
Linguistic variables and corresponding fuzzy numbers in the Best Worst Method (BWM) survey.
Table 3.
Linguistic variables and corresponding fuzzy numbers in the Best Worst Method (BWM) survey.
| Linguistic Variables | Fuzzy Numbers |
|---|---|
| Equally important | (1, 1, 1, 1) |
| Weakly important | (1, 1.5, 1.5, 1.5) |
| Fairly important | (1.5, 2, 2, 2.5) |
| Important | (2.5, 3, 3, 3.5) |
| Very important | (3.5, 4, 4, 4.5) |
| Absolutely important | (4.5, 4.5, 4.5, 5) |
Table 4.
Linguistic variables and corresponding fuzzy numbers in the neutrosophic part.
| Linguistic Variables | Fuzzy Numbers |
|---|---|
| No confidence | (0, 0, 0) |
| Low confidence | (0.6, 0.2, 0.2) |
| Fairly low confidence | (0.7, 0.1, 0.1) |
| Medium confidence | (0.8, 0.1, 0) |
| Fairly high confidence | (0.8, 0.2, 0.2) |
| High confidence | (0.9, 0.1, 0.1) |
| Absolutely high confidence | (1, 0, 0) |
Table 5.
Linguistic variables and fuzzy numbers for risk factors.
| S | O | D | E | Fuzzy Numbers |
|---|---|---|---|---|
| Very hazardous | Failure almost inevitable | Absolute uncertainty | Almost close to the original price | (1, 1, 1, 2) |
| Hazardous | Very high | Very remote | Extremely high | (1, 2, 2, 3) |
| Extreme | Repeated failures | Remote | Very high | (2, 3, 3, 4) |
| Major | High | Very low | High | (3, 4, 4, 5) |
| Significant | Moderately high | Low | Moderately high | (4, 5, 5, 6) |
| Moderate | Moderate | Moderate | Moderate | (5, 6, 6, 7) |
| Low | Relatively low | Moderately high | Relatively low | (6, 7, 7, 8) |
| Minor | Low | High | Low | (7, 8, 8, 9) |
| Very minor | Remote | Very high | Remote | (8, 9, 9, 10) |
| None | Nearly impossible | Almost certain | Nearly no cost | (9, 10, 10, 10) |
Table 6.
Description of failure modes.
| Category | Description | Failure Mode | |
|---|---|---|---|
| No Output | No power output | FM11 | Capacitor burst |
| FM12 | Transistor failure | ||
| FM13 | Components burned out | ||
| FM14 | Blown fuses | ||
| Electrical | Electrical | FM21 | Insufficient output voltage |
| Defect | characteristics | FM22 | No power-good signal |
| failed to meet | FM23 | Cooling fan no operation | |
| specifications | FM24 | Insufficient output wattage | |
| FM25 | Efficiency recession | ||
| FM26 | High frequency noise | ||
| FM27 | Radiation interference | ||
| Appearance | Appearance out of | FM31 | Tooling abrasion |
| Issue | product specification | FM32 | Case Scratch |
| FM33 | Connector deformation | ||
| FM34 | Label broken | ||
| FM35 | Printing blurred | ||
| Dimension | Mechanical dimension | FM41 | Direct Current (DC) cable dimension |
| Defect | Out of specifications | FM42 | Screw hole offset |
| FM43 | Improper heat dissipation hole | ||
| FM44 | Assembly problem |
Table 7.
The selected most and least important risk factors.
| Expert No. | 1 | 2 | 3 | 4 | 5 | 6 | 7 | 8 | 9 | 10 | 11 | 12 | 13 | 14 | 15 |
|---|---|---|---|---|---|---|---|---|---|---|---|---|---|---|---|
| Most important | S | S | E | S | S | E | S | S | E | S | E | S | S | S | E |
| Least important | D | D | D | D | E | O | D | D | O | D | D | D | O | O | D |
Table 8.
The neutrosophic Best-to-Others (BO) vector obtained by Expert 1.
| S | O | D | E | |
|---|---|---|---|---|
| S (most important) | {(1.0, 1.0, 1.0, 1.0), (1.0, 0.0, 0.0)} | {(3.5, 4.0, 4.0, 4.5), (0.8, 0.1, 0.0)} | {(4.5, 4.5, 4.5, 5.0), (0.8, 0.1, 0.0)} | {(1.5, 2.0, 2.0, 2.5), (0.8, 0.1, 0.0)} |
Table 9.
The neutrosophic Others-to-Worst (OW) vector obtained by Expert 1.
| D (Least Important) | |
|---|---|
| S | {(4.5, 4.5, 4.5, 5.0), (0.8, 0.1, 0.0)} |
| O | {(1.5, 2.0, 2.0, 2.5), (0.8, 0.1, 0.0)} |
| D | {(1.0, 1.0, 1.0, 1.0), (1.0, 0.0, 0.0)} |
| C | {(3.5, 4.0, 4.0, 4.5), (0.8, 0.1, 0.0)} |
Table 10.
The BO vector obtained by Expert 1.
| S | O | D | E | |
|---|---|---|---|---|
| S (most important) | 1.0 | 3.6 | 4.1 | 1.8 |
Table 11.
The OW vector obtained by Expert 1.
| D (Least Important) | |
|---|---|
| S | 4.1 |
| O | 1.8 |
| D | 1.0 |
| E | 3.6 |
Table 12.
Results of the NBWM analysis.
| Risk Factor | Weights | Rank |
|---|---|---|
| S | 0.4080 | 1 |
| O | 0.1879 | 3 |
| D | 0.1169 | 4 |
| E | 0.2872 | 2 |
Table 13.
Initial neutrosophic assessment matrix obtained by Expert 1.
| Failure Mode | S | O | D | E |
|---|---|---|---|---|
| FM11 | {(8.0, 9.0, 9.0, 10.0), (0.8, 0.1, 0.0)} | {(6.0, 7.0, 7.0, 8.0), (0.9, 0.1, 0.1)} | {(7.0, 8.0, 8.0, 9.0), (0.9, 0.1, 0.1)} | {(8.0, 9.0, 9.0, 10.0), (0.8, 0.1, 0.0)} |
| FM12 | {(8.0, 9.0, 9.0, 10.0), (0.8, 0.2, 0.2)} | {(4.0, 5.0, 5.0, 6.0), (0.8, 0.1, 0.0)} | {(7.0, 8.0, 8.0, 9.0), (0.9, 0.1, 0.1)} | {(7.0, 8.0, 8.0, 9.0), (0.8, 0.2, 0.2)} |
| FM44 | {(1.0, 2.0, 2.0, 3.0), (0.9, 0.1, 0.1)} | {(4.0, 5.0, 5.0, 6.0), (0.8, 0.2, 0.2)} | {(2.0, 3.0, 3.0, 4.0), (0.8, 0.2, 0.2)} | {(2.0, 3.0, 3.0, 4.0), (0.9, 0.1, 0.1)} |
Table 14.
Results of NWASPAS.
| Failure Mode | WSM | WSP | WASPAS | Rank |
|---|---|---|---|---|
| FM11 | 0.6945 | 0.6905 | 0.6925 | 1 |
| FM12 | 0.6100 | 0.5952 | 0.6026 | 3 |
| FM13 | 0.6397 | 0.5889 | 0.6143 | 2 |
| FM14 | 0.6072 | 0.5504 | 0.5788 | 4 |
| FM21 | 0.5235 | 0.4942 | 0.5088 | 5 |
| FM22 | 0.4092 | 0.3872 | 0.3982 | 7 |
| FM23 | 0.4397 | 0.4012 | 0.4204 | 6 |
| FM24 | 0.3865 | 0.3735 | 0.3800 | 8 |
| FM25 | 0.3274 | 0.3219 | 0.3247 | 10 |
| FM26 | 0.3262 | 0.3130 | 0.3196 | 11 |
| FM27 | 0.3527 | 0.3451 | 0.3489 | 9 |
| FM31 | 0.2531 | 0.2338 | 0.2434 | 14 |
| FM32 | 0.2482 | 0.2036 | 0.2259 | 16 |
| FM33 | 0.3307 | 0.3081 | 0.3194 | 12 |
| FM34 | 0.1146 | 0.0829 | 0.0987 | 19 |
| FM35 | 0.1093 | 0.0708 | 0.0900 | 20 |
| FM41 | 0.2465 | 0.2393 | 0.2429 | 15 |
| FM42 | 0.1652 | 0.1614 | 0.1633 | 18 |
| FM43 | 0.2817 | 0.2757 | 0.2787 | 13 |
| FM44 | 0.1962 | 0.1898 | 0.1930 | 17 |
Table 15.
Risk scores of failure modes after nine sensitivity analyses.
| RUN1 | RUN2 | RUN3 | RUN4 | RUN5 | RUN6 | RUN7 | RUN8 | RUN9 | |||
|---|---|---|---|---|---|---|---|---|---|---|---|
| WSM | WSP | λ = 0.1 | λ = 0.2 | λ = 0.3 | λ = 0.4 | λ = 0.5 | λ = 0.6 | λ = 0.7 | λ = 0.8 | λ = 0.9 | |
| FM11 | 0.6945 | 0.6905 | 0.6909 | 0.6913 | 0.6917 | 0.6921 | 0.6925 | 0.6929 | 0.6933 | 0.6937 | 0.6941 |
| FM12 | 0.6100 | 0.5952 | 0.5967 | 0.5981 | 0.5996 | 0.6011 | 0.6026 | 0.6040 | 0.6055 | 0.6070 | 0.6085 |
| FM44 | 0.1962 | 0.1898 | 0.1904 | 0.1911 | 0.1917 | 0.1924 | 0.1930 | 0.1937 | 0.1943 | 0.1949 | 0.1956 |
Table 16.
The failure mode ranking results of the three models.
| Failure Mode | RPN | Rank | BWM and SAW | Rank | NBWM and NWASPAS | Rank |
|---|---|---|---|---|---|---|
| FM11 | 4132.95 | 1 | 0.8298 | 1 | 0.6925 | 1 |
| FM12 | 2426.67 | 2 | 0.7350 | 4 | 0.6026 | 3 |
| FM13 | 1632.15 | 3 | 0.7854 | 2 | 0.6143 | 2 |
| FM14 | 1350.85 | 4 | 0.7452 | 3 | 0.5788 | 4 |
| FM21 | 1096.68 | 5 | 0.6371 | 5 | 0.5088 | 5 |
| FM22 | 675.58 | 6 | 0.4988 | 7 | 0.3982 | 7 |
| FM23 | 470.13 | 9 | 0.5402 | 6 | 0.4204 | 6 |
| FM24 | 525.50 | 7 | 0.4736 | 8 | 0.3800 | 8 |
| FM25 | 401.69 | 10 | 0.3992 | 12 | 0.3247 | 10 |
| FM26 | 290.28 | 11 | 0.4035 | 11 | 0.3196 | 11 |
| FM27 | 506.15 | 8 | 0.4294 | 9 | 0.3489 | 9 |
| FM31 | 154.35 | 14 | 0.3056 | 15 | 0.2434 | 14 |
| FM32 | 105.73 | 17 | 0.2996 | 16 | 0.2259 | 16 |
| FM33 | 243.30 | 12 | 0.4049 | 10 | 0.3194 | 12 |
| FM34 | 18.66 | 19 | 0.1473 | 19 | 0.0987 | 19 |
| FM35 | 16.63 | 20 | 0.1367 | 20 | 0.0900 | 20 |
| FM41 | 153.21 | 15 | 0.3057 | 14 | 0.2429 | 15 |
| FM42 | 71.83 | 18 | 0.2096 | 18 | 0.1633 | 18 |
| FM43 | 238.83 | 13 | 0.3458 | 13 | 0.2787 | 13 |
| FM44 | 115.93 | 16 | 0.2432 | 17 | 0.1930 | 17 |
Publisher’s Note: MDPI stays neutral with regard to jurisdictional claims in published maps and institutional affiliations. |
© 2020 by the authors. Licensee MDPI, Basel, Switzerland. This article is an open access article distributed under the terms and conditions of the Creative Commons Attribution (CC BY) license (http://creativecommons.org/licenses/by/4.0/).
Share and Cite
MDPI and ACS Style
Liou, J.J.H.; Liu, P.C.Y.; Lo, H.-W. A Failure Mode Assessment Model Based on Neutrosophic Logic for Switched-Mode Power Supply Risk Analysis. Mathematics 2020, 8, 2145. https://doi.org/10.3390/math8122145
AMA Style
Liou JJH, Liu PCY, Lo H-W. A Failure Mode Assessment Model Based on Neutrosophic Logic for Switched-Mode Power Supply Risk Analysis. Mathematics. 2020; 8(12):2145. https://doi.org/10.3390/math8122145
Chicago/Turabian StyleLiou, James J. H., Perry C. Y. Liu, and Huai-Wei Lo. 2020. "A Failure Mode Assessment Model Based on Neutrosophic Logic for Switched-Mode Power Supply Risk Analysis" Mathematics 8, no. 12: 2145. https://doi.org/10.3390/math8122145
Note that from the first issue of 2016, this journal uses article numbers instead of page numbers. See further details here.