Influence of Magnetic Microparticles Isolation on Adenine Homonucleotides Structure

 ,
, 
Abstract
: The electroactivity of purine and pyrimidine bases is the most important property of nucleic acids that is very useful for determining oligonucleotides using square wave voltammetry. This study was focused on the electrochemical behavior of adenine-containing oligonucleotides before and after their isolation using paramagnetic particles. Two peaks were detected—peak A related to the reduction of adenine base and another peak B involved in the interactions between individual adenine strands and contributes to the formation of various spatial structures. The influence of the number of adenine bases in the strand in the isolation process using paramagnetic particles was investigated too.1. Introduction
It is well known that a DNA molecule is composed of nucleotides, the basic building blocks of DNA. The nucleotide consists of 2-deoxy-β-d-ribose, phosphate group and purine (adenine, guanine) or pyrimidine (cytosine, thymine) base [1]. For the study of nucleic acids, various instrumental methods such as ultraviolet-visible (UV/Vis) spectrometry, electrophoretic methods, polymerase chain reaction (PCR) and circular dichroism are used [2–6]. Besides these methods, electrochemical methods are also possible to use [7]. Electroactivity of nucleic acids bases on mercury electrodes is one of the most sensitive ones. Palecek was the first who used modern oscillographic polarography for successful detection of redox DNA signals [8–11]. Since then, great progress and development has been made in the electrochemistry of nucleic acids on various electrodes [7,12,13]. The attention is paid to various electrochemical methods using a mercury electrode as a working one including linear sweep and cyclic polarography/voltammetry (elimination polarography/voltammetry), differential pulse polarography/voltammetry, square wave polarography/voltammetry, alternating currents (AC) polarography/voltammetry, and chronopotentiometry for analysis of DNA [7,14]. The connection of adsorptive transfer stripping technique with the above-mentioned methods is very promising tool for studying nucleic acids [14].
Square wave voltammetry (SWV) is one of the most sensitive electrochemical methods for determination of oligonucleotides (ODNs) [15–17]. SWV is generally the best choice among all pulse methods, because it offers background suppression combined with the effectiveness of differential pulse voltammetry (DPV), slightly greater sensitivity than that of DPV, much faster scan times, and applicability to a wider range of electrode materials and systems. The most reproducible behavior and lowest detection limits are generally found on mercury surfaces [18]. From the point of view of DNA electroanalysis, this method belongs to the most sensitive label free ones with the lowest limits of detection [19–24].
Aptamers represent one of the specific parts of the whole wide oligonucleotide group. They are defined as molecules of ribonucleic (RNA) and single-strand (ss) deoxyribonucleic (ssDNA) acids or peptides that can bind to targets with high affinity and specificity due to their specific three-dimensional structure [25]. Especially RNA and ssDNA aptamers can differ from each other in the sequence and the folding pattern, although they bind to the same target [26]. Applications of aptamers in the area of biosensing have been widely developed during last decade. Aptamers have been studied as a biomaterial in numerous investigations concerning their use as diagnostic and therapeutic tools, biosensing probe, and in the development of new drugs, mainly drug delivery systems [25,27,28].
A phenol-chloroform extraction is considered a standard method for nucleic acid isolation, but this method needs special laboratory equipment, and it is also time-consuming. For these reasons, the research has been focused on other alternative methods for biomolecules isolation [29–31]. One possible way is the isolation of nucleic acids using paramagnetic and/or superparamagnetic particles (MPs) [32,33]. Paramagnetic particles are the particles with size ranges from nm to mm, responding to an external magnetic field and facilitating the binding of bioactive molecules due to their modified surface by biocomponents [34–36]. The main advantages of MPs are as follows: easy to use, fast sample preparation without centrifugation and dialysis. Physicochemical properties of MPs are very important for their biological applications. The most commonly used MPs in biosensor applications are composed of ferrous oxide or ferric oxide [37]. Nanoparticles of ferric oxide can provide adequate surface for binding biomolecules. There are two methods of surface modifications of MPs. The first method is based on the electric envelope layer, which ensures the electrostatic adsorption of biomolecules [38]. The second method of surface treatment of paramagnetic particles is based upon biomolecules anchored on the particle, which are able to bind the target biomolecule specifically [23,39]. The isolation of adenine containing nucleotides is based on this principle, because oligo (deoxythymine) 25 is anchored on the surface of MPs and can be hybridized by molecules of adenine-containing nucleotides [12].
The aim of our study was to investigate the electrochemical behavior of adenine-containing nucleotides on the surface of a mercury electrode and their behavior after separation using paramagnetic particles. The description of this phenomenon could be useful for understanding of some aspects of isolation processes using magnetic materials.
2. Results and Discussion
2.1. Square Wave Voltammetry of Adenine-Containing Oligonucleotides
As it was mentioned above, square wave voltammetry is one of the most frequently used and sensitive electrochemical methods for determination of DNA [22,40,41]. For oligonucleotides, containing different bases, both CA and G peaks can be measured using this method. Current peaks of guanine can be obtained on mercury or amalgam electrodes by re-oxidation of the product of guanine reduction, 7,8-dihydroguanine [42]. Inset of Figure 1A shows typical voltammograms of oligonucleotide that contains adenine bases. Homonucleotide dA15 was selected as an example. Two peaks were recorded: the first one at potential −1.37 V, well-known and often described as peak A (related to adenine reduction on HMDE) and the second one recorded at potential −1.10 V, described as peak B in this study. In Figure 1A, it is also shown that the potentials of both the peaks are measured within the concentration range from 0.09 to 50 μg/mL of dA15. For peak A, there are no changes in the peak potential with the increasing concentration of the adenine oligonucleotide dA15. On the contrary, the potentials of peak B are shifted to more positive values with increasing concentration of dA15. The absolute potential difference, determined in the concentration range from 0.09 to 50 μg/mL of dA15, was 0.025 V.
Palecek defined and described the peak IISW, which has high similarity (in accordance with the obtained voltammograms) with our peak B, only in a native double-stranded DNA structure [24,43]. In our samples, only adenine single-stranded oligonucleotides were occurring. Due to this fact, we assumed the detection of the peak B as a result of formation of more complex structures of the adenine chains. The interactions in the nucleosides structures, in general, can be considered as electrostatic interactions. These interactions lead to the formation of planar base-pair structures as those of the Watson-Crick (WC) type [44]. One of them, the formation of the trans-configuration of adenine-adenine pairs, is expected, when the phosphodiester bonds have the same orientation. In addition, the non-covalent interactions that stabilize both DNA and RNA can be divided into three groups as follows: hydrogen bonding, base-stacking, and electrostatic effect of the strands [44]. The base-stacking interaction is also recognized as crucial to stabilize the structure of nucleic acids. It is particularly important to note that the planar structures are generally more stable than stacked structures. These effects have been shown in numerous studies of behavior of the adenine bases and there are several possibilities of formation of complexes [45–51], mainly possible hydrogen bonds in A–A structures [52,53].
According to the angle between the planes of two bases, five structural types of pairing of bases can be distinguished: (1) planar, H-bonded; (2) non-planar, H-bonded; (3) T-shaped; (4) planar stacked; and (5) non-planar stacked [54]. The planar base-pair structure for dimers of bare adenine has been observed and assigned to that having two moieties that are doubly hydrogen bonded [53]. Plutzer et al. [53] identified various conformations of adenine pair by IR-UV resonance spectroscopy. Some of the isomers are stabilized by the inter-fragment interactions similar to the H-bonding. Five of them have hydrogens of –NH2 of the one fragment pointing towards nitrogen atoms of the other fragment. However, the study of structures revealed that these bonds are relatively long and, consequently, are weaker than regular hydrogen bonds [51]. A symmetric H-bonded dimer, labelled as AA-HB1, is the most stable adenine dimer [51,52,54]. The stacked structures, stabilized dimers of adenine nucleosides, have been widely investigated and related to the various energy changes by some authors [50,51]. The results demonstrate that the dimer possesses a stacked structure being stabilized by the formation of hydrogen-bonding network involving the two sugar groups. In many presented variations of adenine and thymine dimers, the adenine dimer AA-ST1 was suggested as the most stable stacked configuration [51].
Dependence of Measured Signals on Different SWV Parameters
All measurements were carried out using square wave voltammetry. To use the most sensitive conditions for analysis of the compounds of interest, we optimized some parameters. Deposition potential was the first optimized parameter (Figure 1B). Five different values of potential, at which the effect of sample deposition on the mercury drop on the electrochemical signal was investigated, were selected. The highest and best A signal was detected using the deposition potential of −0.1 V. This potential was used in all further measurements. Other selected deposition potentials showed lower signals or potential shift at different concentrations of the sample occurred. On the other hand, the peak B had the best signal at the potential of −0.3 V. The difference between both the best accumulation potentials indicates the different nature of both signals. Because of the fact that the peak A has been well described and known, we decided to realize next measurements with the accumulation potential of −0.1 V. The second factor in support of this decision was that the SWV scans were performed from 0 to −1.6 V and in such case the accumulation at −0.1 V causes no problems, but only lower signal.
The effect of accumulation time of monomeric adenine deoxyribonucleotides on the surface of mercury electrode was the second studied parameter. Figure 1C clearly shows the increasing trend of the electrochemical signal depending on the increasing time of the accumulation. The tested time interval was from 60 to 720 s. The accumulation time of 720 s provided the highest signal and therefore was chosen as the best time of accumulation. The potentials of the signals during the varying accumulation time showed no significant changes.
The frequency is a very important parameter in determination of DNA by the square wave voltammetry. Figure 1D shows the effect of frequency on the size and quality of both A and B peaks. Two values of frequency, 100 and 280 Hz, were used in this experiment. The intensity of signal was measured within the concentration range from dA15 0.09 to 50 μg/mL. The electrochemical signal at the frequency of 280 Hz was two times higher in comparison to that measured at the frequency of 100 Hz for both the peaks. Therefore, the frequency 280 Hz was used for all further measurements.
2.2. Influence of Number of Adenine Bases on the Electrochemical Signal
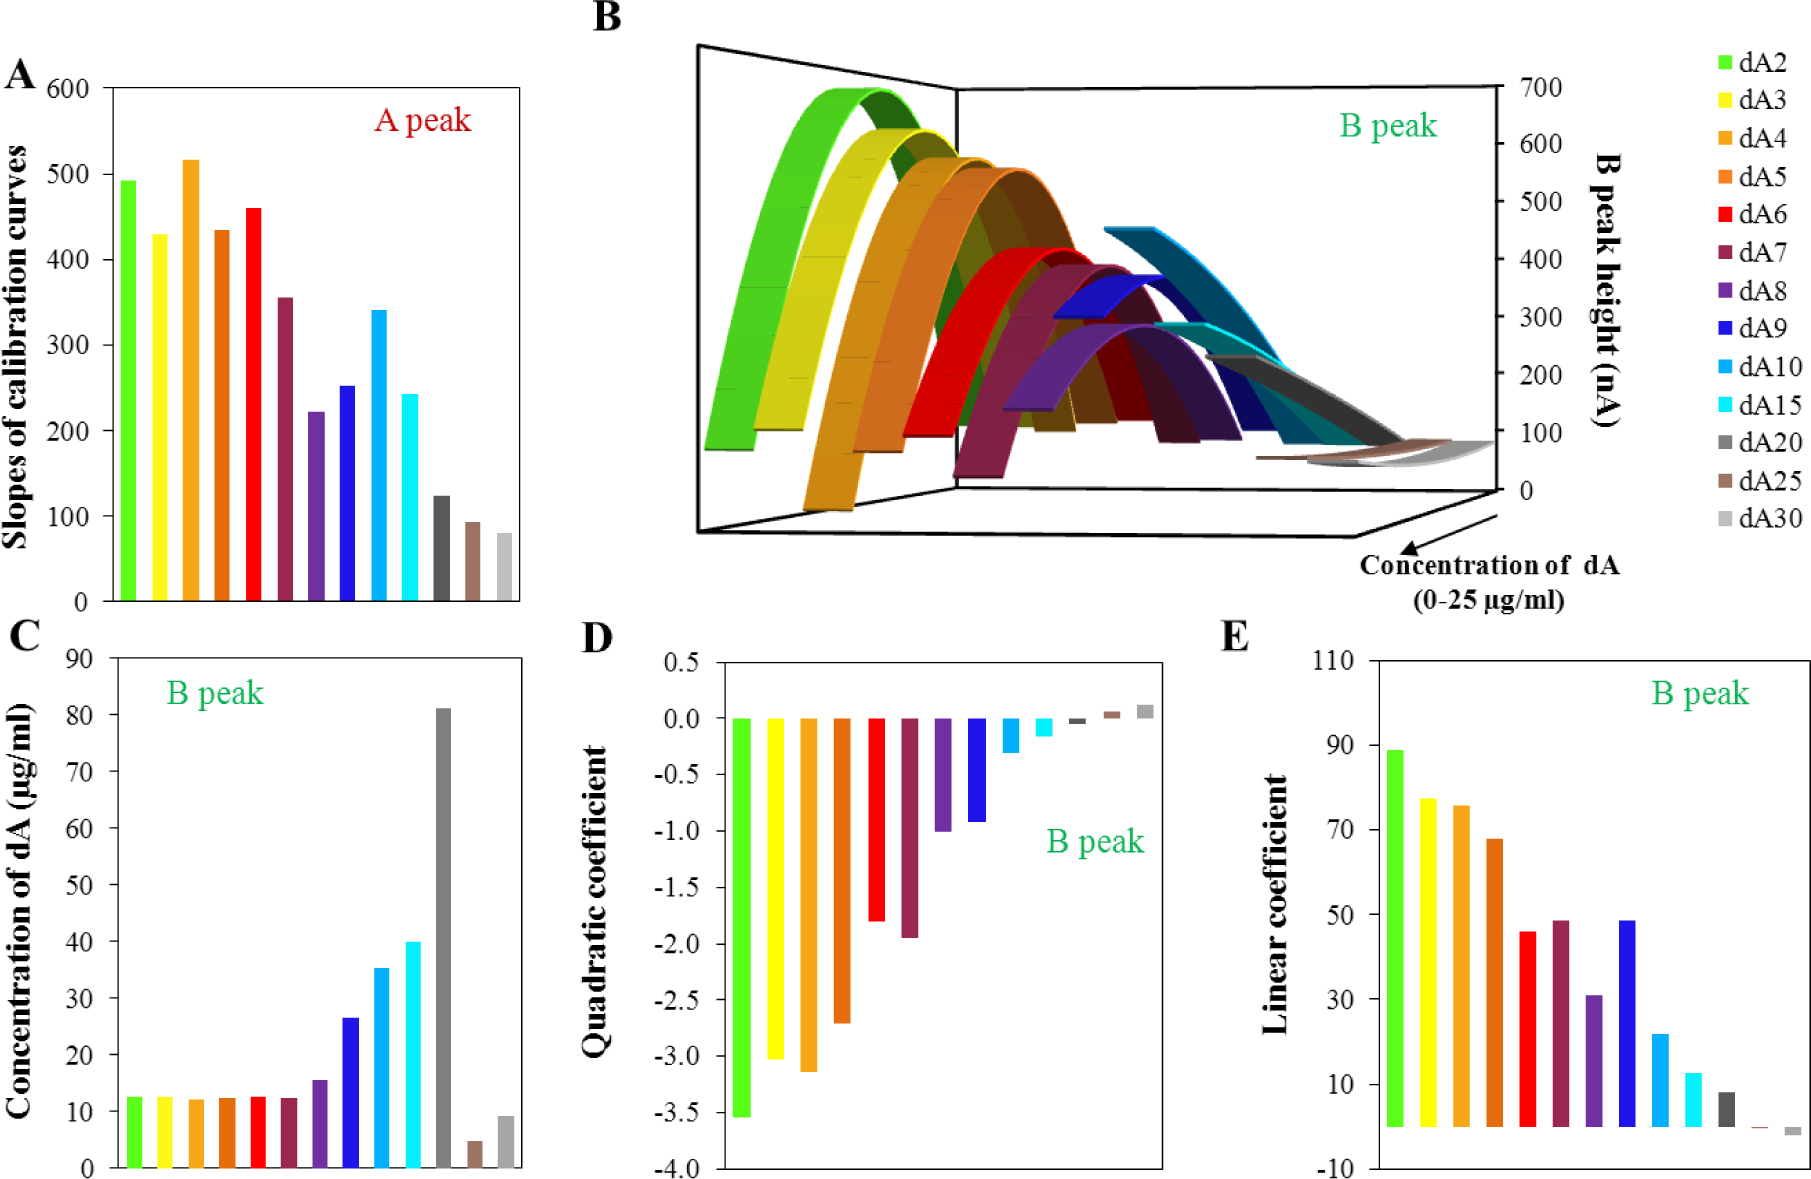
Thirteen oligonucleotides differing in the number of adenine bases in their sequence were used in this study, oligonucleotides dA2–dA10, then dA15, dA20, dA25, and dA30. For each ODN, calibration curves were determined within the concentration range from 50 ng/mL to 25 μg/mL. The applied amount of ODN, quantitatively determined using UV/Vis spectrometry [20,55–57], (data is not shown) served as a control. The influence of ODN concentration on peak A and B height was determined. The reduction signal of adenine (peak A) changed linearly with increasing ODN concentration and peak B had quadratic concentration dependences. The slopes of the calibration curves related to peak A depending on the length of the oligonucleotide chain are shown in Figure 2A. From oligonucleotide dA2 to dA4, we can assume that the slope of the calibration curve of peak A have similar values with a slightly declining trend. Generally, the slopes of the calibration curves gradually decreases with the increasing number of adenine bases in the oligonucleotide chain, thus the sensitivity of the method for this determination is limited.
Calibration curves were also evaluated for the peak B. Figure 2B shows the calculated quadratic calibration curves. The quadratic regression equations were based on the calibration set of data of the individual oligonucleotides with confidence interval at least 0.99. Generally, the increasing length of the adenine oligonucleotide strand causes reduction of the maximum electrochemical signal and its shift to the lower intensity. Nevertheless, for the set of dA2–dA7 the shift of the maximum is not relevant and only intensity of the signal decreases. This phenomenon could be explained by the modification of the surface of the electrode by adenine nucleotides. The longer strands (dA7–dA30) cause decrease of the intensity of the signal of peak B, which indicates “isolation” character of longer strands towards forming bonds between individual adenine strands. For short the adenine strands, there is a prerequisite for the pairing of adenine bases between two strands. The electron transport through the strands is a complex process and the transmission onto the surface of the electrode is not fully understood. For the longer adenine strands, there is apparently no connection between adenine bases in two strands, but the adenine-adenine connection can be formed in one strand. From dA8 there is a probability of the intra-molecular binding of adenines due to the conformational freedom in individual adenine strands and thus the electrochemical signal of peak B is lowered. Peak B, as it has been assumed and confirmed by Palecek’s experiments [24,43], is connected with the formation of binding between various strands. The shape of the obtained curves changed dramatically for the borderline between dA20 and longer oligonucleotides. The successive lengths of the oligonucleotide strand (dA25 and dA30) present only minimal changes in the intensity of the peak B with the increasing concentration of dA. This effect could be caused by the forming of relatively stable spatial intra-conformation of individual strands that is stabilized by A–A bonds. The formation of inter-strand binding is, in this case, unlikely and unexpected due to high conformational freedom in the individual adenine strands. Such structures could easily cover the surface of the electrode and thus eliminate the response to the concentration changes.
For the model of quadratic equations, the concentrations related to the local maxima/minima were calculated (Figure 2C). This calculated concentration is necessary to understand as an optimal amount of individual dA for the most creation of space structures based on adenine interactions. As it is obvious from the figure, dA2–dA7 does not change the calculated concentration maxima. It means that the same concentration of dA (variable in the length of chain) induces the maximum of peak B measured (variable in the peak intensity), it means maximal spatial arrangement of dA molecules. From eight adenines in the strand (dA8), the concentration maxima increase rapidly up to twenty adenines, where the breakpoint of the shape of the calculated curves is present. Further, the local minimum is presented for dA25 and dA30. The length of 20 adenines is critical in the obtained curve shape too. As it is indicated in Figure 2B, the shape of the curve is changed with the increasing number of adenines in the strand. The length of twenty adenines is the borderline between the negative and positive quadratic parts of the calculated curves (Figure 2D) and thus limits the shape of the obtained curves. The linear parts of the calculated dependencies (Figure 2B) are shown in Figure 2E. These dependencies directly reflect the changes in the length of the strand.
As it was mentioned above, the shape of the calculated curves changes with the increasing number of adenines. The change between dA20 and dA25 is obvious from Figure 2C–E. Among these two values, one curve lies having zero quadratic part of the calculated equation (linear equation). This represents the break point of modeling curves. The calculation of this point was based on the direct connection of points related to the dA20 and dA25 in the dependence of quadratic part on the number of adenines in the strand (Figure 2D). This equation is as follows: y = 0.0215x − 0.4809. From this equation, it was simply calculated that the length of 22 (exactly 22.37) adenine bases is critical for the formation of the inter-stranded structure of the homoadenine strands. This conclusion is based on the belief in the suggested explanation of the observed changes in the intensity of the signal of peak B, which is described above. Similarly, it is possible to calculate the critical number of adenines from the dependence of the linear part on the number of adenines in the strand (Figure 2E). This equation is as follows: y = −1.7512x + 43.2220. The critical number of adenines of 25 was calculated from this equation. This result is probably influenced by errors in a greater extent, because the linear part of the model quadratic equations still remains at the critical point (change from quadratic to the linear equation). Therefore, the obtained result seems to be correct. This conclusion is supported just with a look to Figure 2C, where the change is located between dA20 and dA25.
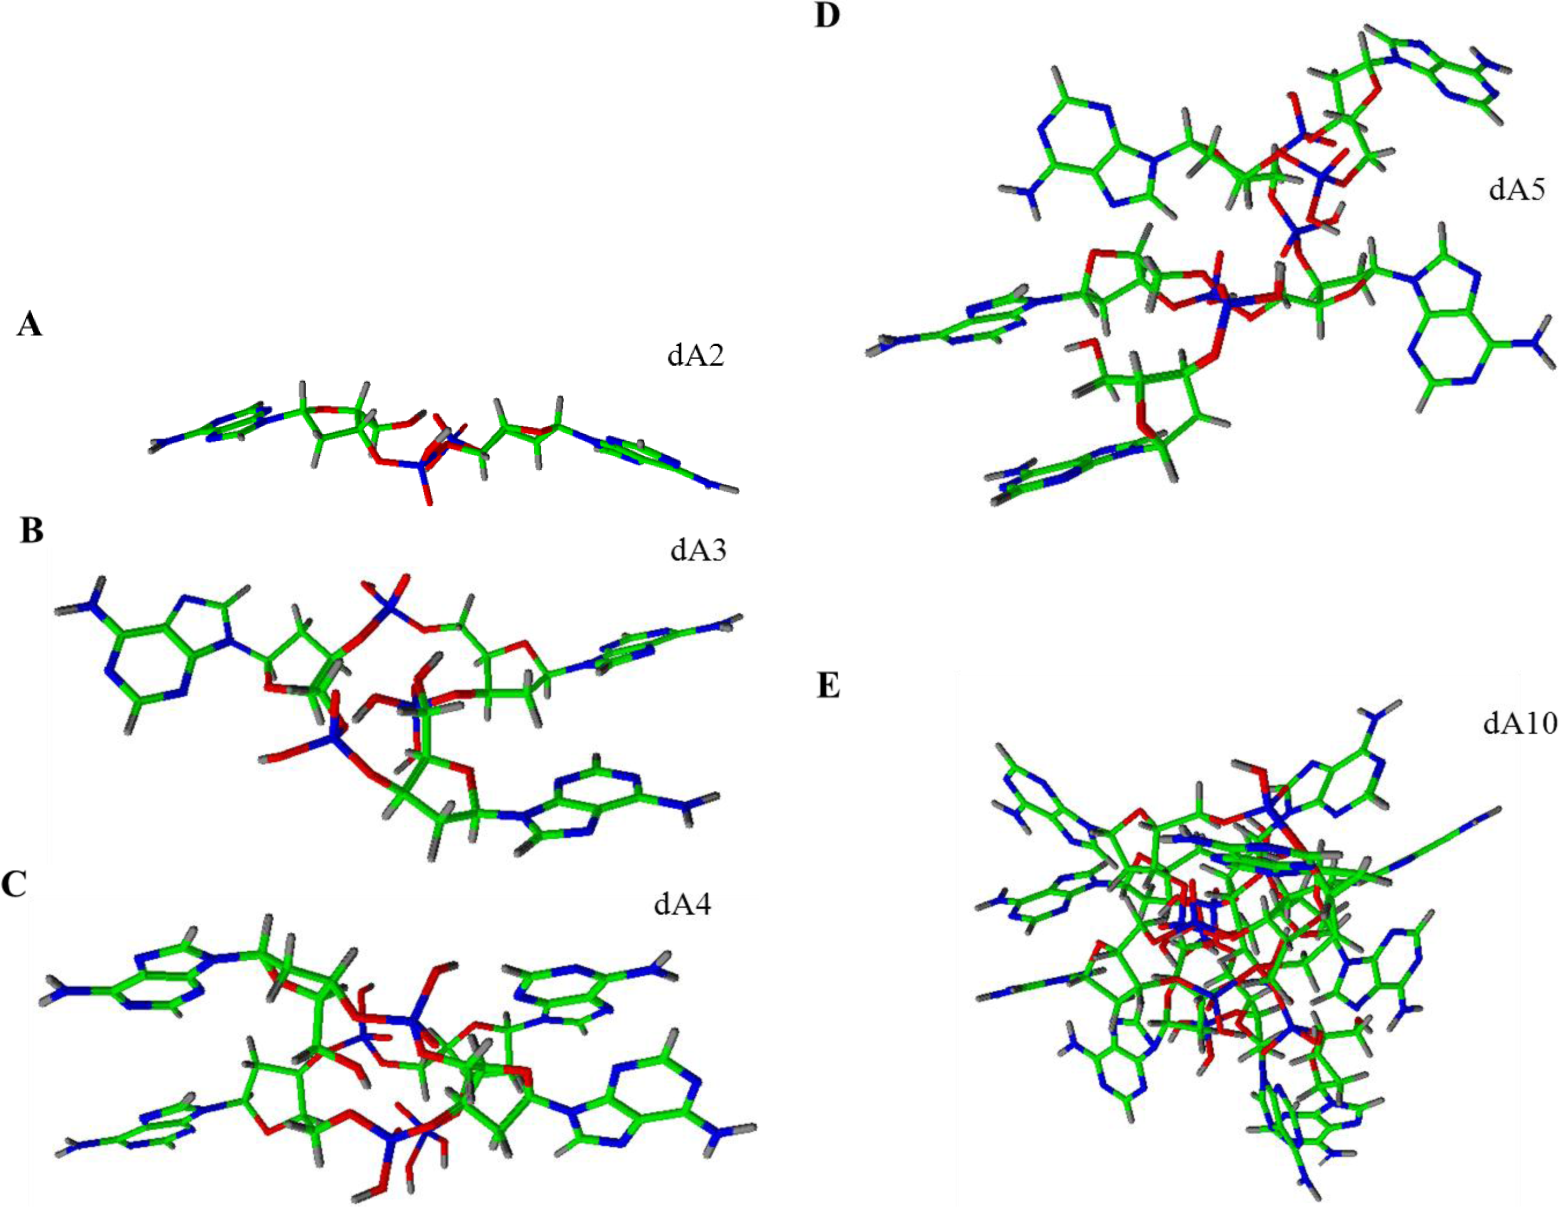
For the better understanding and imagination of conformation of the strands, we attempted to create structure models of individual homoadenine strands (Figure 3) in software ACD/ChemSketch using functions as follows: clean structure, check of tautomeric form, and 3D optimization. From the presented models, it is obvious that the adenine bases are located to the surface of creating structure. The dA2 creates the planar structure. The other homoadenines create spherical structures, which are obvious with the steps from dA2 (Figure 3A) to dA5 (Figure 3D), and next to the dA10 (Figure 3E). The dA10 structure is spherical at most from the presented models only. The higher dA structures are more complex and the spherical shape is confirmed (not shown).
2.3. Isolation of Adenine-Containing Oligonucleotides
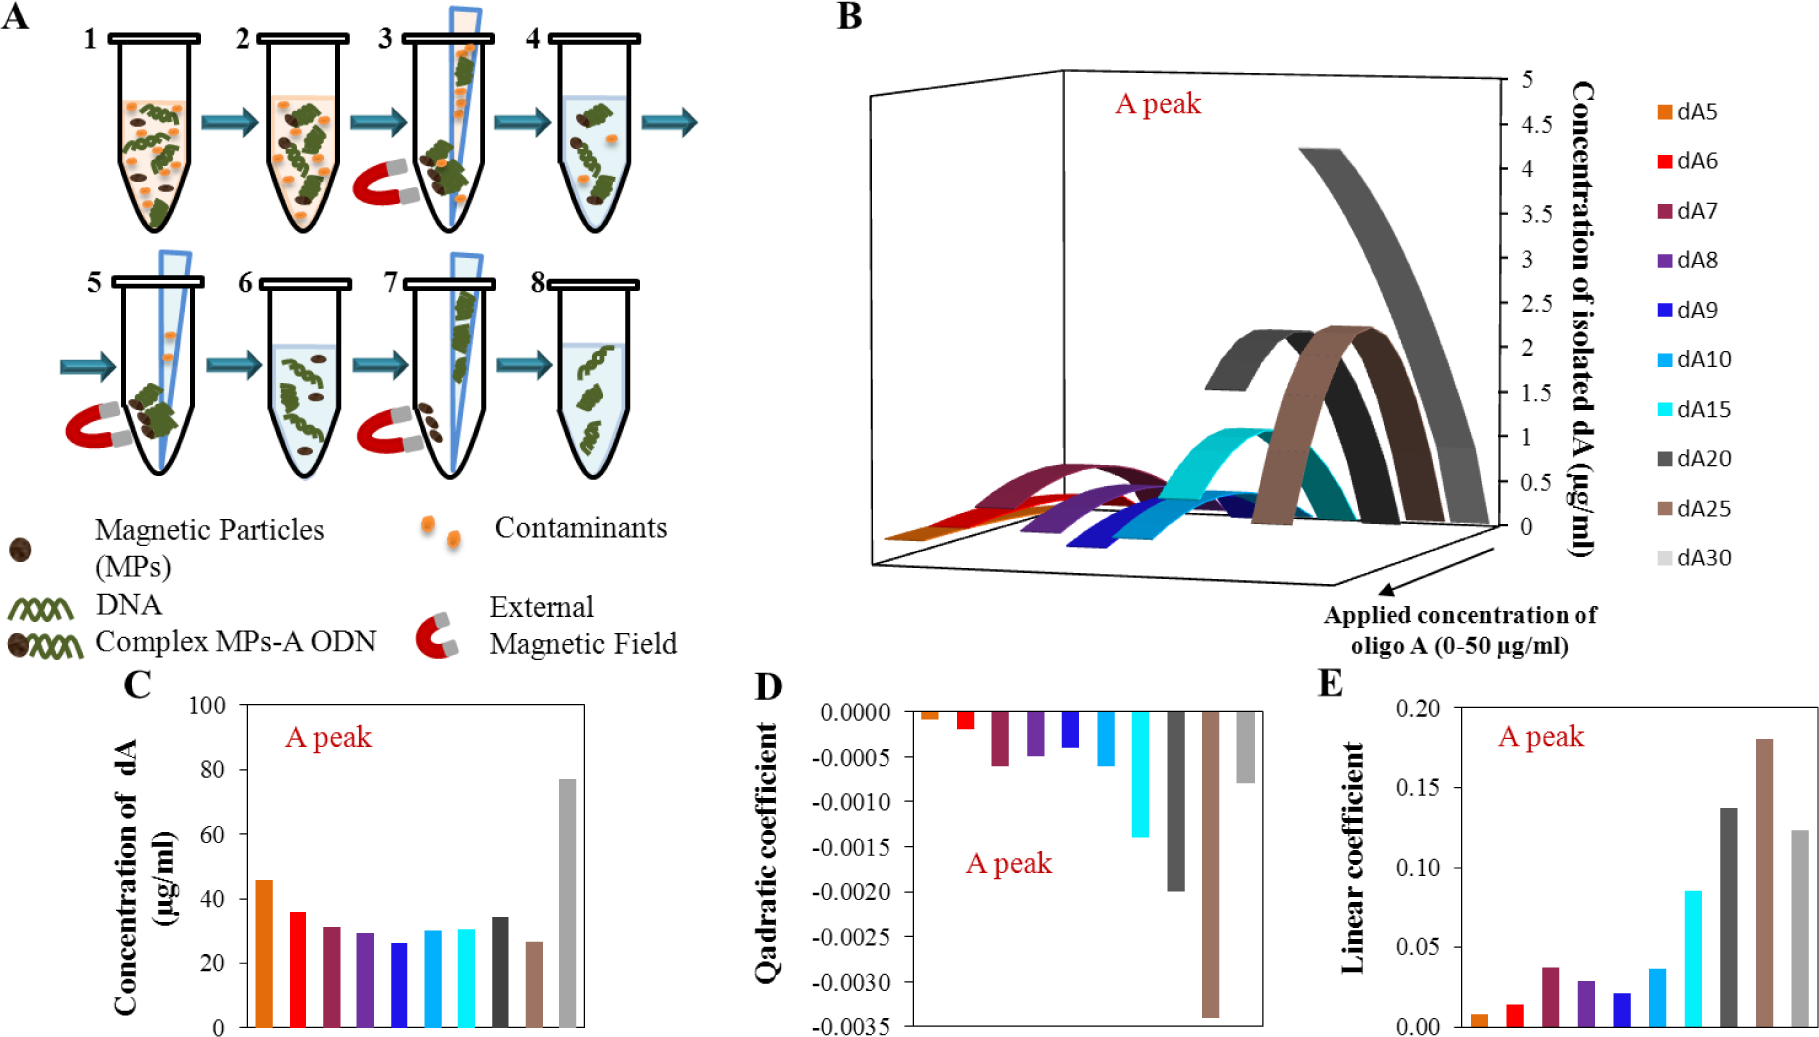
The second part of our experiment was focused on the isolation of adenine ODNs using paramagnetic particles (scheme is shown in Figure 4A). The application of paramagnetic particles is widespread in the biotechnology procedures and experiments. This is mainly due to the simplicity of the procedure, low costs, and good efficiency. Our aim was to investigate the behavior of the adenine strand after the isolation process, mainly with focus on both the monitored peaks. The model procedure of the isolation process was adapted from Huska et al. [58]. With regard to the expected lower isolation yield, concentration range 1.56–50 μg/mL of all mentioned ODNs was used.
2.3.1. A Peak
In Figure 4B, calculated quadratic dependence of peak A after isolation by MPs is recorded. The first important result is that no signal for the oligonucleotides dA2, dA3, and dA4 was detected after isolation, so the magnetic separation cannot be done for these short ODNs. In comparison with the calibration dependencies of peak A for the oligonucleotides without isolation, the calibration curves after isolation changed course from pseudo-linear (very few quadratic) to quadratic with the increasing number of adenines and the electrochemical signal reached higher values for the longer oligonucleotide strands. This is the second important result as the change from linear calibration dependence before isolation to quadratic ones after the isolation process. This phenomenon is probably caused by the binding of individual adenine strands onto the dT25 located on the surface of MPs. It seems that the longer dA strands have higher affinity due to the higher number of established A–T bonds. The quadratic course of the dependences is probably caused by the saturation of the surface of magnetic particles. The reduction of the electrochemical signal at higher concentrations is apparently the result of the supersaturation of the surface where the ODNs are tore off out from the magnetic particles.
The maximum yield of the individual dA after isolation (Figure 4C) was observed within the concentration range from 27.3 μg/mL to 47.1 μg/mL of applied dA concentration. An exception is the oligonucleotide dA30, where the maximum yield was calculated at the applied concentration 77.7 μg/mL; this concentration is beyond the applied concentration range, so this value represents only the theoretical calculation based on the quadratic equation of the calibration curve for the respective oligonucleotide (Figure 4C). In Figure 4D,E, the individual parameters of evaluated quadratic curves are demonstrated. The obvious change of the quadratic part is located between the dA25 and dA30, which is in accordance with the calculated concentration of the maximum signal (Figure 4C). Linear parts of the quadratic equations respect the same phenomenon and the break point is obvious for the dA30 too (Figure 4E).
2.3.2. B Peak
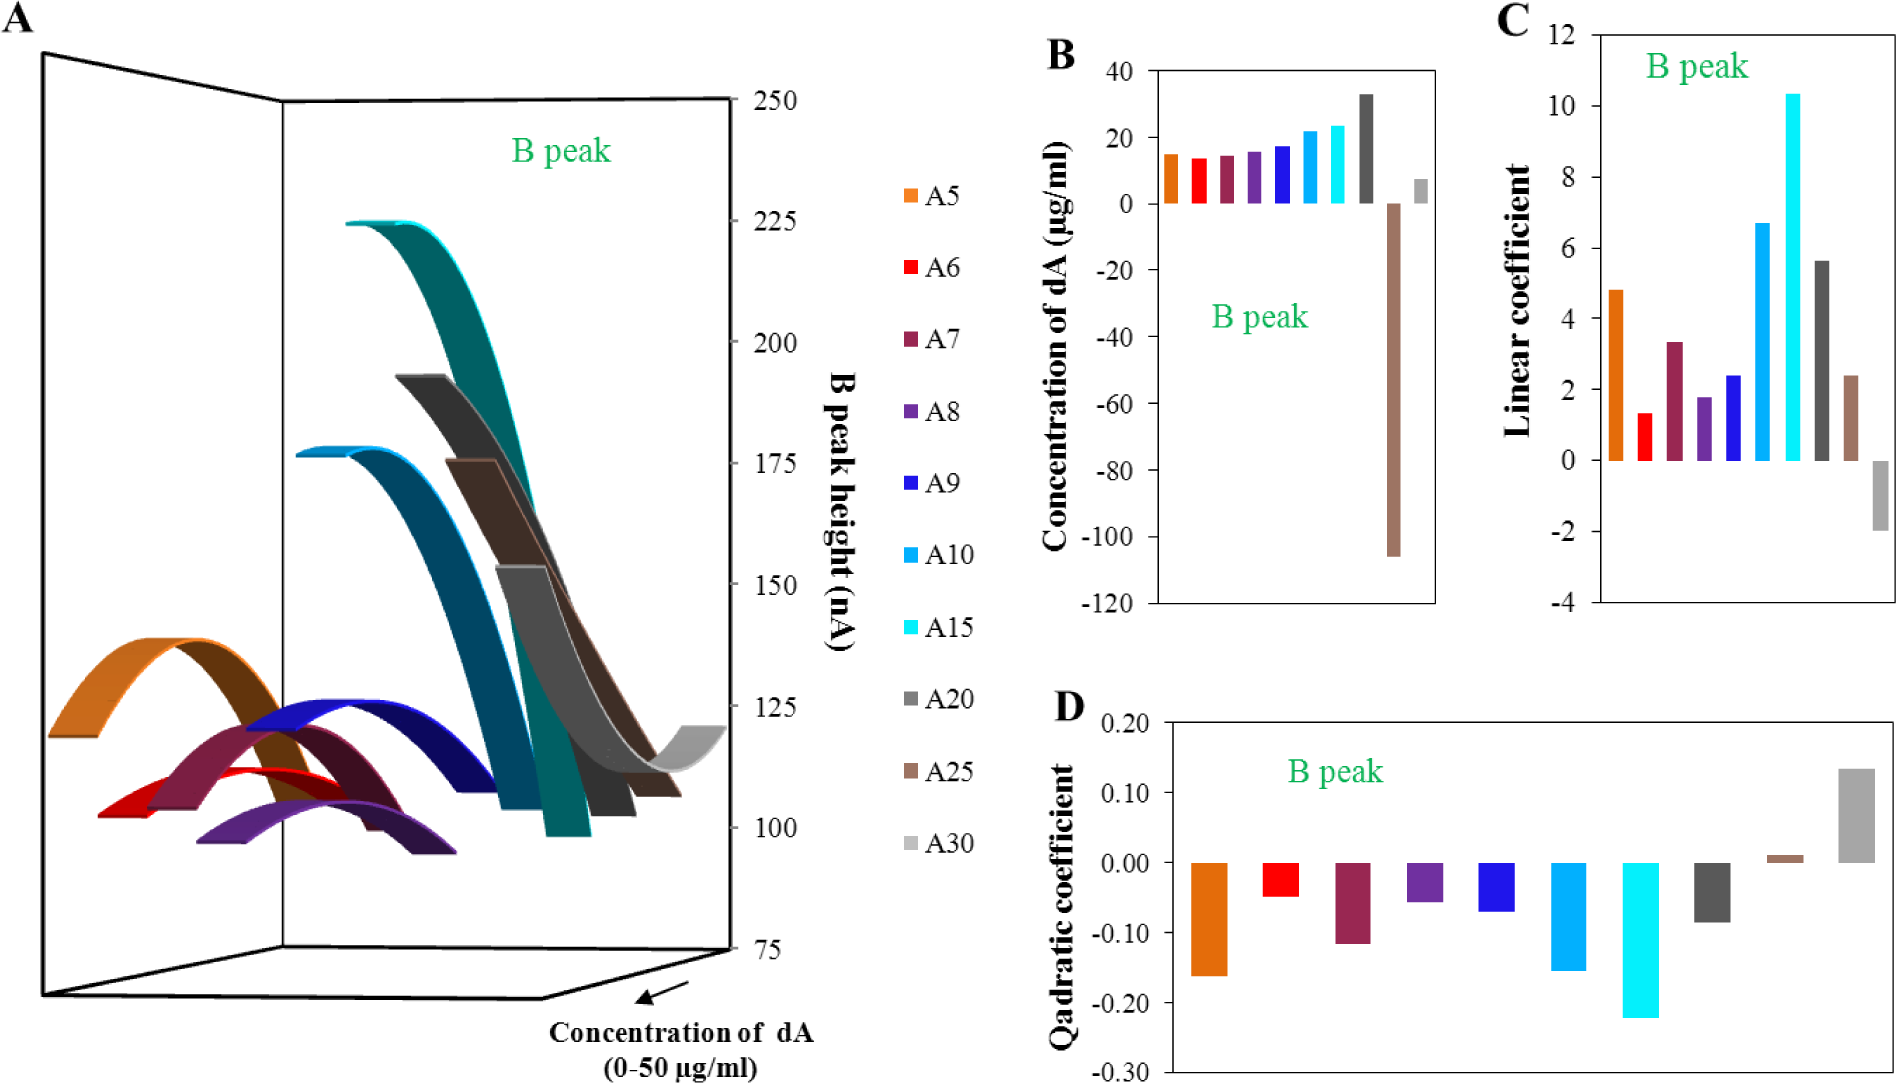
The evaluation of peak B is shown in Figure 5 in the same way as for peak A in Figure 4. The obtained quadratic curves for various lengths of adenine strands were related to the various concentrations of the dA (Figure 5A). It is obvious that the presented curves change their shape with the increasing number of adenines in the strand. The shapes of individual dA curves presented in Figure 5A are similar to the stage before the isolation. While the intensity of the peak decreased before the isolation process with the number of adenines in the strand, after isolation the peak intensity growth. This change could be connected with the dominance of the magnetic beads isolation effect. It means the effect of probe length, located on the surface of magnetic beads which better binds longer dA. However, the change of intensity of peak B for individual monomeric adenine deoxyribonucleotides depending on concentration is lower in comparison to the stage before the isolation. This effect is connected with the magnetic beads isolation efficiency which decreases the obtained heights of peak B.
Dependence of the dA concentration related to the local maxima/minima on the number of adenines in strands is presented in Figure 5B. Here, the optimal concentrations of individual dA slightly increased with increasing number of adenines in strands. The great change in obtained concentration for dA25 was caused by the great proximity of this strand length to the break-point of this dependence. This borderline, important change of the obtained curves, was determined to be 24 adenine bases. This number was calculated from the elimination of quadratic coefficient (zero value of the coefficient) from modeling quadratic curves. The theoretical number of adenines calculated from the linear coefficients was determined as 29 adenines. These calculated borderlines correspond approximately to the state before the isolation. This difference is greater than for the determination without the isolation process. The differences among the number of adenines determined from the quadratic or linear part of the function before and after the isolation process is two adenine bases. Such variation is able to relate the isolation procedure itself and not to the change of dA strands behaviors. It is important to note that these borderlines could denote the number of adenines in strand, which change the character of adenines interaction form intermolecular to intramolecular. In comparison to the results obtained before the isolation, dependencies of the individual equation parts (quadratic and linear—Figure 5C,D) after the isolation are more incorrect and less tendentious. The dispersion of individual values is obvious in the interval from dA5 to dA9. From this reason, it could be assumed that the isolation process using MPs influences mainly the structure of adenine nucleotides in the range from the dA5 to dA9. From the dependencies presented in Figure 5A, it seems to be that dA10 and dA15 had the best conformation properties itself and for the binding of the dT25 probes, located on the surface of magnetic beads. In conclusion, the isolation process using paramagnetic particles is able to slightly influence and change the secondary structure of adenine homonucleotides. This fact can be very helpful in future studies of aptamer structures from the viewpoint of electrochemical detection.
2.4. Quantification of Isolation Procedure
The process of the isolation is closely connected to the question of the efficiency of the isolation. We chose the initial concentration 25 μg/mL for all adenine ODNs to evaluate the efficiency of the isolation. The effect of the number of adenines in the strand was investigated in accordance with peak A and B (Figure 6A,B).
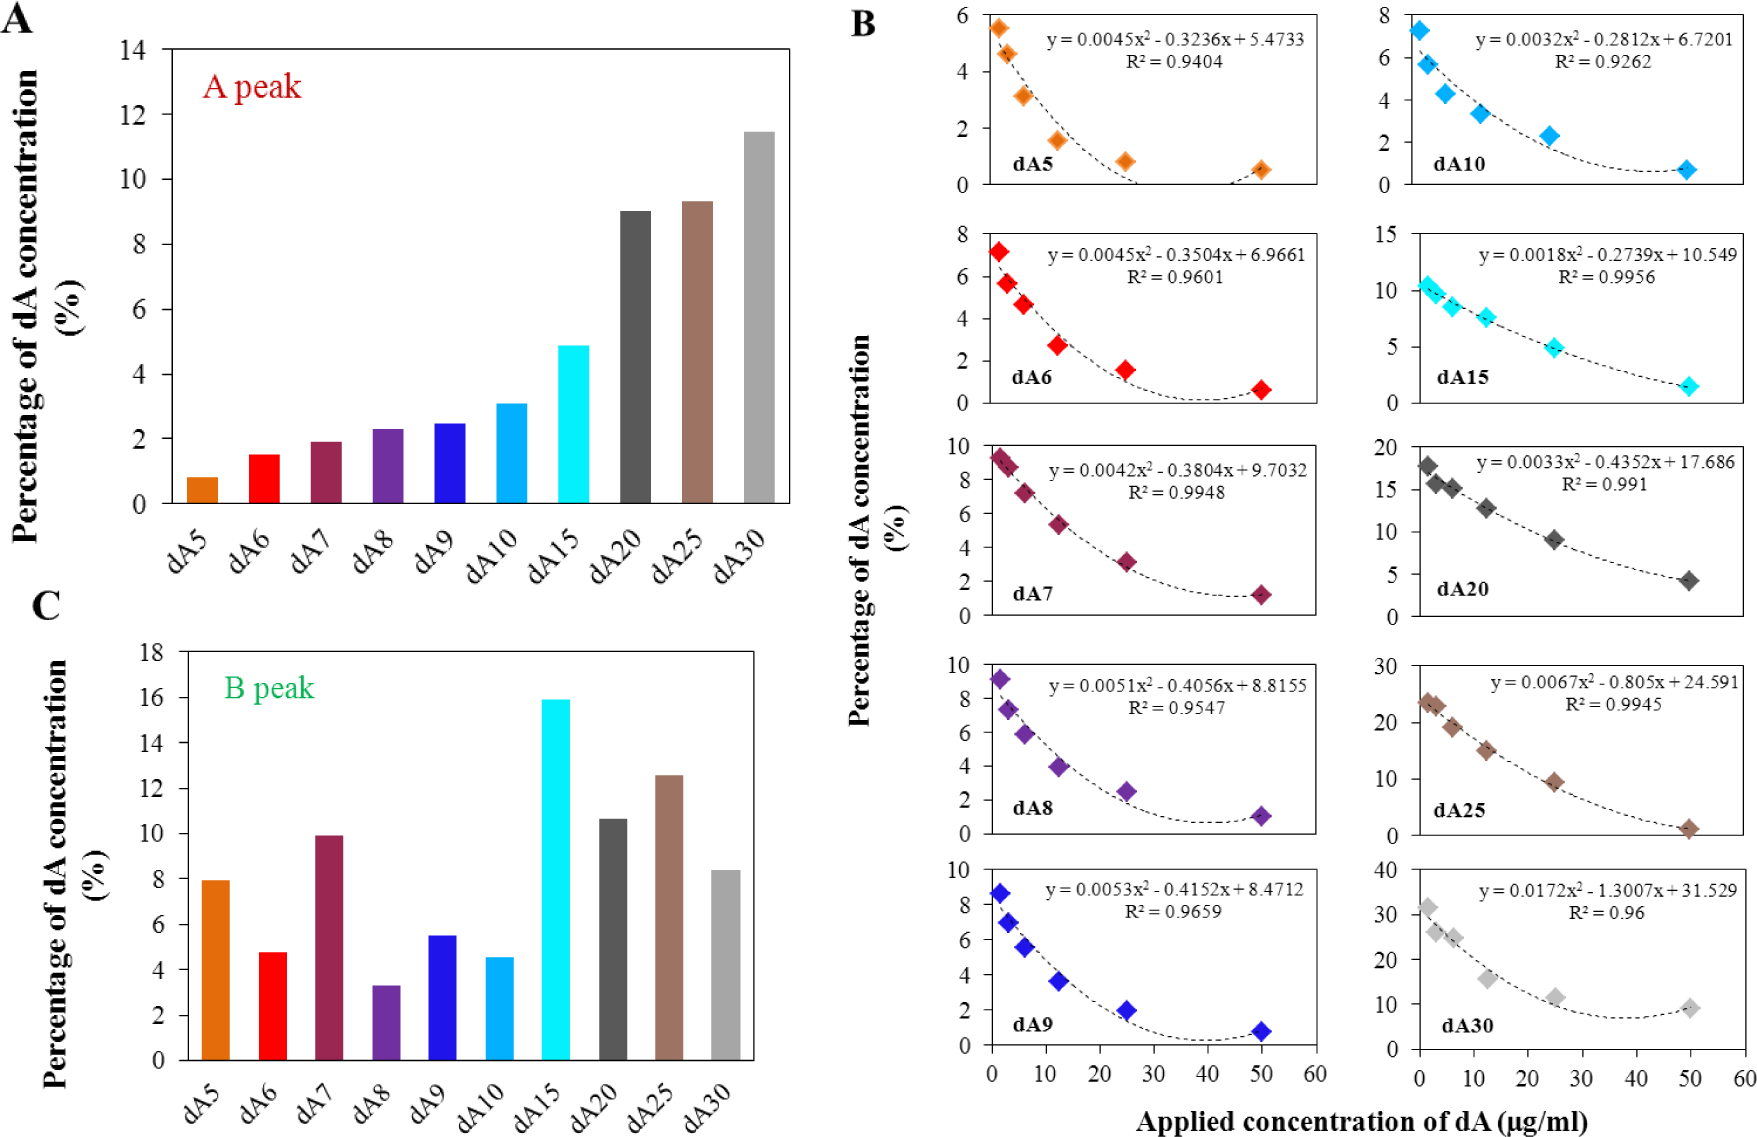
From the electrochemical signals, obtained after the isolation, the percentage of isolated amount was calculated. As it is well evident from Figure 6A, the efficiency of the isolation process increased with increasing length of the oligonucleotide strand. The highest efficiency of the isolation was demonstrated for the oligonucleotide dA30, the value at applied concentration was about 12%.
Figure 6B shows the percentage yield of the isolation for all applied concentrations of ODNs. For all adenine oligonucleotides, the dependence of percentage yield on the applied concentration shows polynomial character, confidence intervals varied from 0.92 to 0.99. The increasing applied concentration led to a decrease of the percentage yield. In contrast, the highest efficiency of the isolation process is well evident for the application of lower concentrations of adenine nucleotides. This is probably caused by the good steric access of the lower number of dA to dT strands located on the surface of magnetic particles. The longer dA strands had the greater affinity to the immobilized dT strands due to the higher number of A–T pairs.
After the separation of the various adenine nucleotides using the MPs, the electrochemical signal related to peak B was also evaluated. Figure 6C shows the dependence of intensity of peak B after isolation process on the length of the adenine strands. The presented data shows no significant correlation between the intensity of peak B and the number of adenines in the strand. This experiment showed that peak B, in contrast to peak A, is not suitable for quantification of the adenine strands before/after the isolation process.
3. Experimental Section
3.1. Chemicals
All the chemicals in ACS purity were purchased from Sigma-Aldrich Chemical Corp. (St. Louis, MA, USA) unless noted otherwise. The deionized water was prepared using reverse osmosis equipment Aqual 25 (Brno, Czech Republic). The deionized water was further purified by an apparatus MiliQ Direct QUV (Aqua Osmotic, Tisnov, Czech Republic) equipped with an UV lamp. MiliQ water was applied for the dilution of samples. Synthetic homo ODNs in the range from 5’-AA-3’ (dA2) to 5’-A…A-3’ (dA30) were used as a standard. Stock standard solutions of ODNs (100 μg/mL) were prepared from lyophilized dA (0.5 mg/mL) with water of ACS purity (Sigma-Aldrich, St. Louis, MA, USA) and stored in dark at −20°C. The concentration of dA was determined spectrophotometrically at 260 nm using a spectrometer Spectronic Unicam (Spectronic Camspec Ltd, Leeds, UK). The pH values were measured using WTWinoLab Level 3 with terminal Level 3 (Wissenschaftlich-Technische Werkstatten, Weilheim, Germany).
3.2. Instrumentation for Isolation of Adenine-Containing Oligonucleotides (dA2–dA30)
The isolation of adenine-containing oligonucleotides was carried out using paramagnetic particles Dynabeads Oligo (dT)25 (Invitrogen, Carlsbad, CA, USA) and a magnetic stand Dynal Magnetic Particle Concentrator-S supplied by Dynal A.S (Oslo, Norway). All the experiments with paramagnetic particles were performed in a RNA/DNA UV cleaner box UVT-S-AR (Biosan, Riga, Latvia). For centrifuging and vortexing of a sample, a multi-spin MSC- 3000 centrifuge (Biosan, Riga, Latvia) placed in the UV cleaner box was used. Denaturation was carried out at 85 °C using Thermomixer 5355 Comfort/Compact (Eppendorf, Hamburg, Germany). The buffers used in our experiments were as follows: (a) phosphate buffer I: 0.1 M NaCl + 0.05 M Na2HPO4 + 0.05 M NaH2PO4; (b) phosphate buffer II: 0.2 M NaCl + 0.1 M Na2HPO4 + 0.1 M NaH2PO4; (c) acetate buffer: 0.2 M CH3COOH + 0.2M CH3COONa. Hybridization solution: 100 mM Na2HPO4 + 100 mM NaH2PO4, 0.5 M NaCl, 0.6 M guanidinium thiocyanate, 0.15 M Trizma base adjusted by HCl to pH 7.5.
3.3. Fully Automated Isolation of Adenine Contain Oligonucleotides (dA2–dA30)
A fully automated isolation was carried out on an automated pipetting system epMotion 5075 (Eppendorf, Hamburg, Germany). The position of B4 is a magnetic separator (Promega, Mannheim, Germany). The positions of C1 and C4 can be thermostated (Epthermoadapter PCR96, Eppendorf, Hamburg, Germany). The pipetting provides a robotic arm with adapters (TS50, TS300 and TS1000, Eppendorf, Hamburg, Germany) and Gripper (TG-T, Eppendorf, Hamburg, Germany). The samples are placed in the position B3 in an adapter Ep0.5/1.5/2 mL. A Module Reservoir is located in the position B1, where washing of solutions and waste are available. An epMotion control panel controls the device. Tips are located in the A4 (ePtips 50), A3 (ePtips 300), and A2 (ePtips 1000) positions. PCR 96 plates are used. The resulting volumes of the collected samples ranged from 10 to 30 μL depending on the procedure.
3.4. Electrochemical Determination of Peak A
The determination of adenine-containing oligonucleotides was performed using a 797 VA Stand instrument connected to an 889 IC Sample Center (Metrohm, Herisau, Switzerland). An analyzer (797 VA Computrace from Metrohm, Herisau, Switzerland) employs a conventional three-electrode configuration with a hanging mercury drop electrode (HMDE) as a working electrode with drop area of 0.4 mm2, Ag/AgCl/3MKCl as a reference electrode, and a platinum auxiliary electrode. Metrohm supplies the following setup assembled of automated voltammetric analysis. A sample changer (Metrohm 889 IC Sample Center, Metrohm, Herisau, Switzerland) performs the sequential analysis of 96 samples in plastic test tubes. For the addition of standard solutions and reagents, an automatic dispenser (Metrohm 800 Dosimat, Metrohm, Herisau, Switzerland) is used, when a peristaltic pump station (Metrohm 843 Pump Station, Metrohm, Herisau, Switzerland) is employed for transferring the rinsing solution into the voltammetric cell and for removing solutions from the voltammetric cell. A central unit (Metrohm 846 Dosing Interface, Metrohm, Herisau, Switzerland) controls automatic dispenser and peristaltic pump station.
Square wave voltammetric measurements were carried out under the following parameters: deoxygenating with argon 120 s; start potential −0.1 V; end potential −1.6 V; deposition potential −0.1 V; accumulation time 720 s; amplitude 0.02 V; voltage step 5.951 mV; equilibration time 5 s; frequency 280 Hz (sweep rate 1.6663 V/s), volume of injected sample 20 μL; cell was filled with 1500 μL of electrolyte [0.2 M acetate buffer (CH3COONa + CH3COOH) adjust to pH 5].
3.5. Mathematical Treatment of Data and Estimation of Detection Limits
The mathematical analysis of the data and their graphical interpretation were analyzed by software Matlab (version 7.11., MathWorks, Natick, MA, USA). The results are expressed as mean ± standard deviation (S.D.) unless noted otherwise (EXCEL®, Microsoft, Redmond, WA, USA). The limits of detection (3 signal/noise, S/N) were calculated, whereas N was expressed as standard deviation of noise determined in the signal domain unless stated otherwise [59].
4. Conclusions
Isolation of nucleic acids or oligonucleotides via magnetic particles is one of many applications of these magnetic materials. In this study, the electrochemical behavior of adenine homonucleotides before and after the magnetic separation was described. The application of SWV method gave two different characteristic signals in the obtained voltammograms. The separation process based on paramagnetic particles influenced the behavior of adenine homonucleotides in the way of changes in structure (interruption of inter- and intra-stranded binds) and changes in analytical parameters (calibration curves). It seems that the separation processes based on magnetic materials could change the properties of biomolecules and influence especially their usage in in vivo applications.
Acknowledgments
Financial support from NanoBioTECell GA CR P102/11/1068 and CEITEC Z.1.05/1.1.00/02.0068 is highly acknowledged.
Conflicts of Interest
The authors declare no conflict of interest.
References
- Watson, J.D.; Crick, F.H. Molecular structure of nucleic acids: A structure for deoxyribose nucleic acid. Nature 1953, 171, 737–738. [Google Scholar]
- Cortesi, R.; Campioni, M.; Ravani, L.; Drechsler, M.; Pinotti, M.; Esposito, E. Cationic lipid nanosystems as carriers for nucleic acids. New Biotech 2014, 31, 44–54. [Google Scholar]
- Goncharova, I. Ag(I)-mediated homo and hetero pairs of guanosine and cytidine: Monitoring by circular dichroism spectroscopy. Spectrochim. Acta A Mol. Biomol. Spectrosc 2014, 118, 221–227. [Google Scholar]
- Choi, J.K.; Reed, A.; Balaz, M. Chiroptical properties, binding affinity, and photostability of a conjugated zinc porphyrin dimer complexed with left-handed Z-DNA and right-handed B-DNA. Dalton Trans 2014, 43, 563–567. [Google Scholar]
- Thomas, J.M.; Yu, H.-Z.; Sen, D. DNA electronic switches based on analyte-responsive aptamers. Methods Mol. Biol 2014, 1103, 267–276. [Google Scholar]
- Von Hippel, P.H.; Johnson, N.P.; Marcus, A.H. Fifty years of DNA “breathing”: Reflections on old and new approaches. Biopolymers 2013, 99, 923–954. [Google Scholar]
- Palecek, E.; Bartosik, M. Electrochemistry of Nucleic Acids. Chem. Rev 2012, 112, 3427–3481. [Google Scholar]
- Palecek, E. Oszillographische polarographie der nucleinsauren und ihrer bestandteile. Naturwissenschaften 1958, 45, 186–187. (in German). [Google Scholar]
- Palecek, E. Oscillographic polarography of highly polymerized deoxyribonucleic acid. Nature 1960, 188, 656–657. [Google Scholar]
- Palecek, E. Oszillographische polarographie der ucleinsaurekomponenten. Collect. Czech Chem. Commun 1960, 25, 2283–2289. (in German). [Google Scholar]
- Palecek, E. Oscillographic polarography of deoxyribonucleic and apurinic acids. Biochem. Mosc 1960, 25, 619–624. [Google Scholar]
- Palecek, E. Past, present and future of nucleic acids electrochemistry. Talanta 2002, 56, 809–819. [Google Scholar]
- Palecek, E. Fifty Years of Nucleic Acid Electrochemistry. Electroanalysis 2009, 21, 239–251. [Google Scholar]
- Hynek, D.; Prasek, J.; Koudelka, P.; Chomoucka, J.; Trnkova, L.; Adam, V.; Hubalek, J.; Kizek, R. Advantages and progress in the analysis of DNA by using mercury and amalgam electrodes—Review. Curr. Phys. Chem 2011, 1, 299–324. [Google Scholar]
- Odea, J.J.; Osteryoung, J.G. Characterization of quasi-reversible surface processes by square-wave voltammetry. Anal. Chem 1993, 65, 3090–3097. [Google Scholar]
- Osteryoung, J.; Odea, J.J. Square-wave voltammetry. Electroanal. Chem 1986, 14, 209–308. [Google Scholar]
- Osteryoung, J.G.; Osteryoung, R.A. Square-wave voltammetry. Anal. Chem 1985, 57, A101–A110. [Google Scholar]
- Bard, A.J.; Faulkner, L.R. Electrochemical Methods—Fundamentals and Applications; Wiley-VCH: New York, NY, USA, 2001. [Google Scholar]
- Huska, D.; Adam, V.; Hubalek, J.; Trnkova, L.; Eckschlager, T.; Stiborova, M.; Provaznik, I.; Kizek, R. Off-line coupling of automated pipetting system with square wave voltammetry as a tool for study of drug-DNA interaction. Chim. Oggi Chem. Today 2010, 28, 18–20. [Google Scholar]
- Huska, D.; Adam, V.; Krizkova, S.; Hrabeta, J.; Eckschlager, T.; Stiborova, M.; Kizek, R. An electrochemical study of interaction of an anticancer alkaloid ellipticine with DNA. Chim. Oggi Chem. Today 2010, 28, 15–17. [Google Scholar]
- Huska, D.; Hubalek, J.; Adam, V.; Kizek, R. Miniaturized electrochemical detector as a tool for detection of DNA amplified by PCR. Electrophoresis 2008, 29, 4964–4971. [Google Scholar]
- Huska, D.; Adam, V.; Babula, P.; Hrabeta, J.; Stiborova, M.; Eckschlager, T.; Trnkova, L.; Kizek, R. Square-wave voltammetry as a tool for investigation of doxorubicin interactions with DNA isolated from neuroblastoma cells. Electroanalysis 2009, 21, 487–494. [Google Scholar]
- Palecek, E.; Billova, S.; Havran, L.; Kizek, R.; Miculkova, A.; Jelen, F. DNA hybridization at microbeads with cathodic stripping voltammetric detection. Talanta 2002, 56, 919–930. [Google Scholar]
- Jelen, F.; Tomschik, M.; Palecek, E. Adsorptive stripping square-wave voltammetry of DNA. J. Electroanal. Chem 1997, 423, 141–148. [Google Scholar]
- Mairal, T.; Ozalp, V.C.; Sanchez, P.L.; Mir, M.; Katakis, I.; O’Sullivan, C.K. Aptamers: Molecular tools for analytical applications. Anal. Bioanal. Chem 2008, 390, 989–1007. [Google Scholar]
- Song, K.M.; Lee, S.; Ban, C. Aptamers and their biological applications. Sensors 2012, 12, 612–631. [Google Scholar]
- Ni, X.; Castanares, M.; Mukherjee, A.; Lupold, S.E. Nucleic acid aptamers: Clinical applications and promising new horizons. Curr. Med. Chem 2011, 18, 4206–4214. [Google Scholar]
- Tombelli, S.; Minunni, A.; Mascini, A. Analytical applications of aptamers. Biosens. Bioelectron 2005, 20, 2424–2434. [Google Scholar]
- Archer, M.J.; Lin, B.C.; Wang, Z.; Stenger, D.A. Magnetic bead-based solid phase for selective extraction of genomic DNA. Anal. Biochem 2006, 355, 285–297. [Google Scholar]
- Cler, L.; Bu, D.W.; Lewis, C.; Euhus, D. A comparison of five methods for extracting DNA from paucicellular clinical samples. Mol. Cell. Probes 2006, 20, 191–196. [Google Scholar]
- Ki, J.S.; Chang, K.B.; Roh, H.J.; Lee, B.Y.; Yoon, J.Y.; Jang, G.Y. Direct DNA isolation from solid biological sources without pretreatments with proteinase-K and/or homogenization through automated DNA extraction. J. Biosci. Bioeng 2007, 103, 242–246. [Google Scholar]
- Becker, C.; Hodenius, M.; Blendinger, G.; Sechi, A.; Hieronymus, T.; Muller-Schulte, D.; Schmitz-Rode, T.; Zenke, M. Uptake of magnetic nanoparticles into cells for cell tracking. J. Magn. Magn. Mater 2007, 311, 234–237. [Google Scholar]
- Cao, Z.J.; Li, Z.X.; Zhao, Y.J.; Song, Y.M.; Lu, J.Z. Magnetic bead-based chemiluminescence detection of sequence-specific DNA by using catalytic nucleic acid labels. Anal. Chim. Acta 2006, 557, 152–158. [Google Scholar]
- Kim, D.K.; Zhang, Y.; Voit, W.; Rao, K.V.; Muhammed, M. Synthesis and characterization of surfactant-coated superparamagnetic monodispersed iron oxide nanoparticles. J. Magn. Magn. Mater 2001, 225, 30–36. [Google Scholar]
- Kinoshita, T.; Seino, S.; Mizukoshi, Y.; Nakagawa, T.; Yamamoto, T.A. Functionalization of magnetic gold/iron-oxide composite nanoparticles with oligonucleotides and magnetic separation of specific target. J. Magn. Magn. Mater 2007, 311, 255–258. [Google Scholar]
- Palecek, E.; Fojta, M. Magnetic beads as versatile tools for electrochemical DNA and protein biosensing. Talanta 2007, 74, 276–290. [Google Scholar]
- Ngomsik, A.F.; Bee, A.; Draye, M.; Cote, G.; Cabuil, V. Magnetic nano- and microparticles for metal removal and environmental applications: A review. Comptes Rendus Chim 2005, 8, 963–970. [Google Scholar]
- Matsunaga, T.; Kawasaki, M.; Yu, X.; Tsujimura, N.; Nakamura, N. Chemiluminescence enzyme immunoassay using bacterial magnetic particles. Anal. Chem 1996, 68, 3551–3554. [Google Scholar]
- Palecek, E.; Kizek, R.; Havran, L.; Billova, S.; Fojta, M. Electrochemical enzyme-linked immunoassay in a DNA hybridization sensor. Anal. Chim. Acta 2002, 469, 73–83. [Google Scholar]
- Masarik, M.; Huska, D.; Adam, V.; Hubalek, J.; Provaznik, I.; Trnkova, L.; Eckschlager, T.; Stiborova, M.; Kizek, R. Square wave voltammetry as a tool for study of ellipticine-DNA interaction. Int. J. Mol. Med 2010, 26, S46–S46. [Google Scholar]
- Trnkova, L.; Kizek, R.; Vacek, J. Square wave and elimination voltammetric analysis of azidothymidine in the presence of oligonucleotides and chromosomal DNA. Bioelectrochemistry 2004, 63, 31–36. [Google Scholar]
- Studnickova, M.; Trnkova, L.; Zetek, J.; Glatz, Z. Reduction of guanosine at a mercury-electrode. Bioelectrochem. Bioenerg 1989, 21, 83–86. [Google Scholar]
- Bartosik, M.; Palecek, E. Square wave stripping voltammetry of unlabeled single- and double-stranded DNAs. Electroanalysis 2011, 23, 1311–1319. [Google Scholar]
- Kool, E.T. Preorganization of DNA: Design principles for improving nucleic acid recognition by synthetic oligonucleotides. Chem. Rev 1997, 97, 1473–1487. [Google Scholar]
- Morgado, C.A.; Jurecka, P.; Svozil, D.; Hobza, P.; Sponer, J. Reference MP2/CBS and CCSD(T) quantum-chemical calculations on stacked adenine dimers. Comparison with DFT-D, MP2.5, SCS(MI)-MP2, M06-2X, CBS(SCS-D) and force field descriptions. Phys. Chem. Chem. Phys 2010, 12, 3522–3534. [Google Scholar]
- Sponer, J.; Riley, K.E.; Hobza, P. Nature and magnitude of aromatic stacking of nucleic acid bases. Phys. Chem. Chem. Phys 2008, 10, 2595–2610. [Google Scholar]
- Sponer, J.; Leszczynski, J.; Hobza, P. Structures and energies of hydrogen-bonded DNA base pairs. A nonempirical study with inclusion of electron correlation. J. Phys. Chem 1996, 100, 1965–1974. [Google Scholar]
- Sponer, J.; Leszczynski, J.; Hobza, P. Hydrogen bonding and stacking of DNA bases: A review of quantum-chemical ab initio studies. J. Biomol. Struct. Dyn 1996, 14, 117–135. [Google Scholar]
- Kurita, N.; Danilov, V.I.; Anisimov, V.M. The structure of Watson-Crick DNA base pairs obtained by MP2 optimization. Chem. Phys. Lett 2005, 404, 164–170. [Google Scholar]
- Asami, H.; Yagi, K.; Ohba, M.; Urashima, S.; Saigusa, H. Stacked base-pair structures of adenine nucleosides stabilized by the formation of hydrogen-bonding network involving the two sugar groups. Chem. Phys 2013, 419, 84–89. [Google Scholar]
- Bravaya, K.B.; Kostko, O.; Ahmed, M.; Krylov, A.I. The effect of pi-stacking, H-bonding, and electrostatic interactions on the ionization energies of nucleic acid bases: adenine-adenine, thymine-thymine and adenine-thymine dimers. Phys. Chem. Chem. Phys 2010, 12, 2292–2307. [Google Scholar]
- Kabelac, M.; Hobza, P. At nonzero temperatures, stacked structures of methylated nucleic acid base pairs and microhydrated nonmethylated nucleic acid base pairs are favored over planar hydrogen-bonded structures: A molecular dynamics simulations study. Chem. Eur. J 2001, 7, 2067–2074. [Google Scholar]
- Plutzer, C.; Hunig, I.; Kleinermanns, K. Pairing of the nucleobase adenine studied by IR-UV double-resonance spectroscopy and ab initio calculations. Phys. Chem. Chem. Phys 2003, 5, 1158–1163. [Google Scholar]
- Kabelac, M.; Hobza, P. Potential energy and free energy surfaces of all ten canonical and methylated nucleic acid base pairs: Molecular dynamics and quantum chemical ab initio studies. J. Phys. Chem. B 2001, 105, 5804–5817. [Google Scholar]
- Huska, D.; Adam, V.; Trnkova, L.; Kizek, R. Dependence of adenine isolation efficiency on the chain length evidenced using paramagnetic particles and voltammetry measurements. J. Magn. Magn. Mater 2009, 321, 1474–1477. [Google Scholar]
- Hynek, D.; Krejcova, L.; Zitka, O.; Adam, V.; Trnkova, L.; Sochor, J.; Stiborova, M.; Eckschlager, T.; Hubalek, J.; Kizek, R. Electrochemical study of doxorubicin interaction with different sequences of single stranded oligonucleotides, Part I. Int. J. Electrochem. Sci 2012, 7, 13–33. [Google Scholar]
- Prasek, J.; Huska, D.; Jasek, O.; Zajickova, L.; Trnkova, L.; Adam, V.; Kizek, R.; Hubalek, J. Carbon composite micro- and nano-tubes-based electrodes for detection of nucleic acids. Nanoscale Res. Lett 2011, 6, 385–390. [Google Scholar]
- Huska, D.; Hubalek, J.; Adam, V.; Vajtr, D.; Horna, A.; Trnkova, L.; Havel, L.; Kizek, R. Automated nucleic acids isolation using paramagnetic microparticles coupled with electrochemical detection. Talanta 2009, 79, 402–411. [Google Scholar]
- Long, G.L.; Winefordner, J.D. Limit of detection. Anal. Chem 1983, 55, A712–A724. [Google Scholar]


© 2014 by the authors; licensee MDPI, Basel, Switzerland This article is an open access article distributed under the terms and conditions of the Creative Commons Attribution license (http://creativecommons.org/licenses/by/3.0/).
Share and Cite
Kremplova, M.; Fialova, D.; Nejdl, L.; Hynek, D.; Trnkova, L.; Hubalek, J.; Kizek, R.; Adam, V. Influence of Magnetic Microparticles Isolation on Adenine Homonucleotides Structure. Materials 2014, 7, 1455-1472. https://doi.org/10.3390/ma7031455
Kremplova M, Fialova D, Nejdl L, Hynek D, Trnkova L, Hubalek J, Kizek R, Adam V. Influence of Magnetic Microparticles Isolation on Adenine Homonucleotides Structure. Materials. 2014; 7(3):1455-1472. https://doi.org/10.3390/ma7031455
Chicago/Turabian StyleKremplova, Monika, Dana Fialova, Lukas Nejdl, David Hynek, Libuse Trnkova, Jaromir Hubalek, Rene Kizek, and Vojtech Adam. 2014. "Influence of Magnetic Microparticles Isolation on Adenine Homonucleotides Structure" Materials 7, no. 3: 1455-1472. https://doi.org/10.3390/ma7031455