
Comparative Analysis of Waste Materials for Their Potential Utilization in Green Concrete Applications

 ,
,  ,
,  ,
, 
Abstract
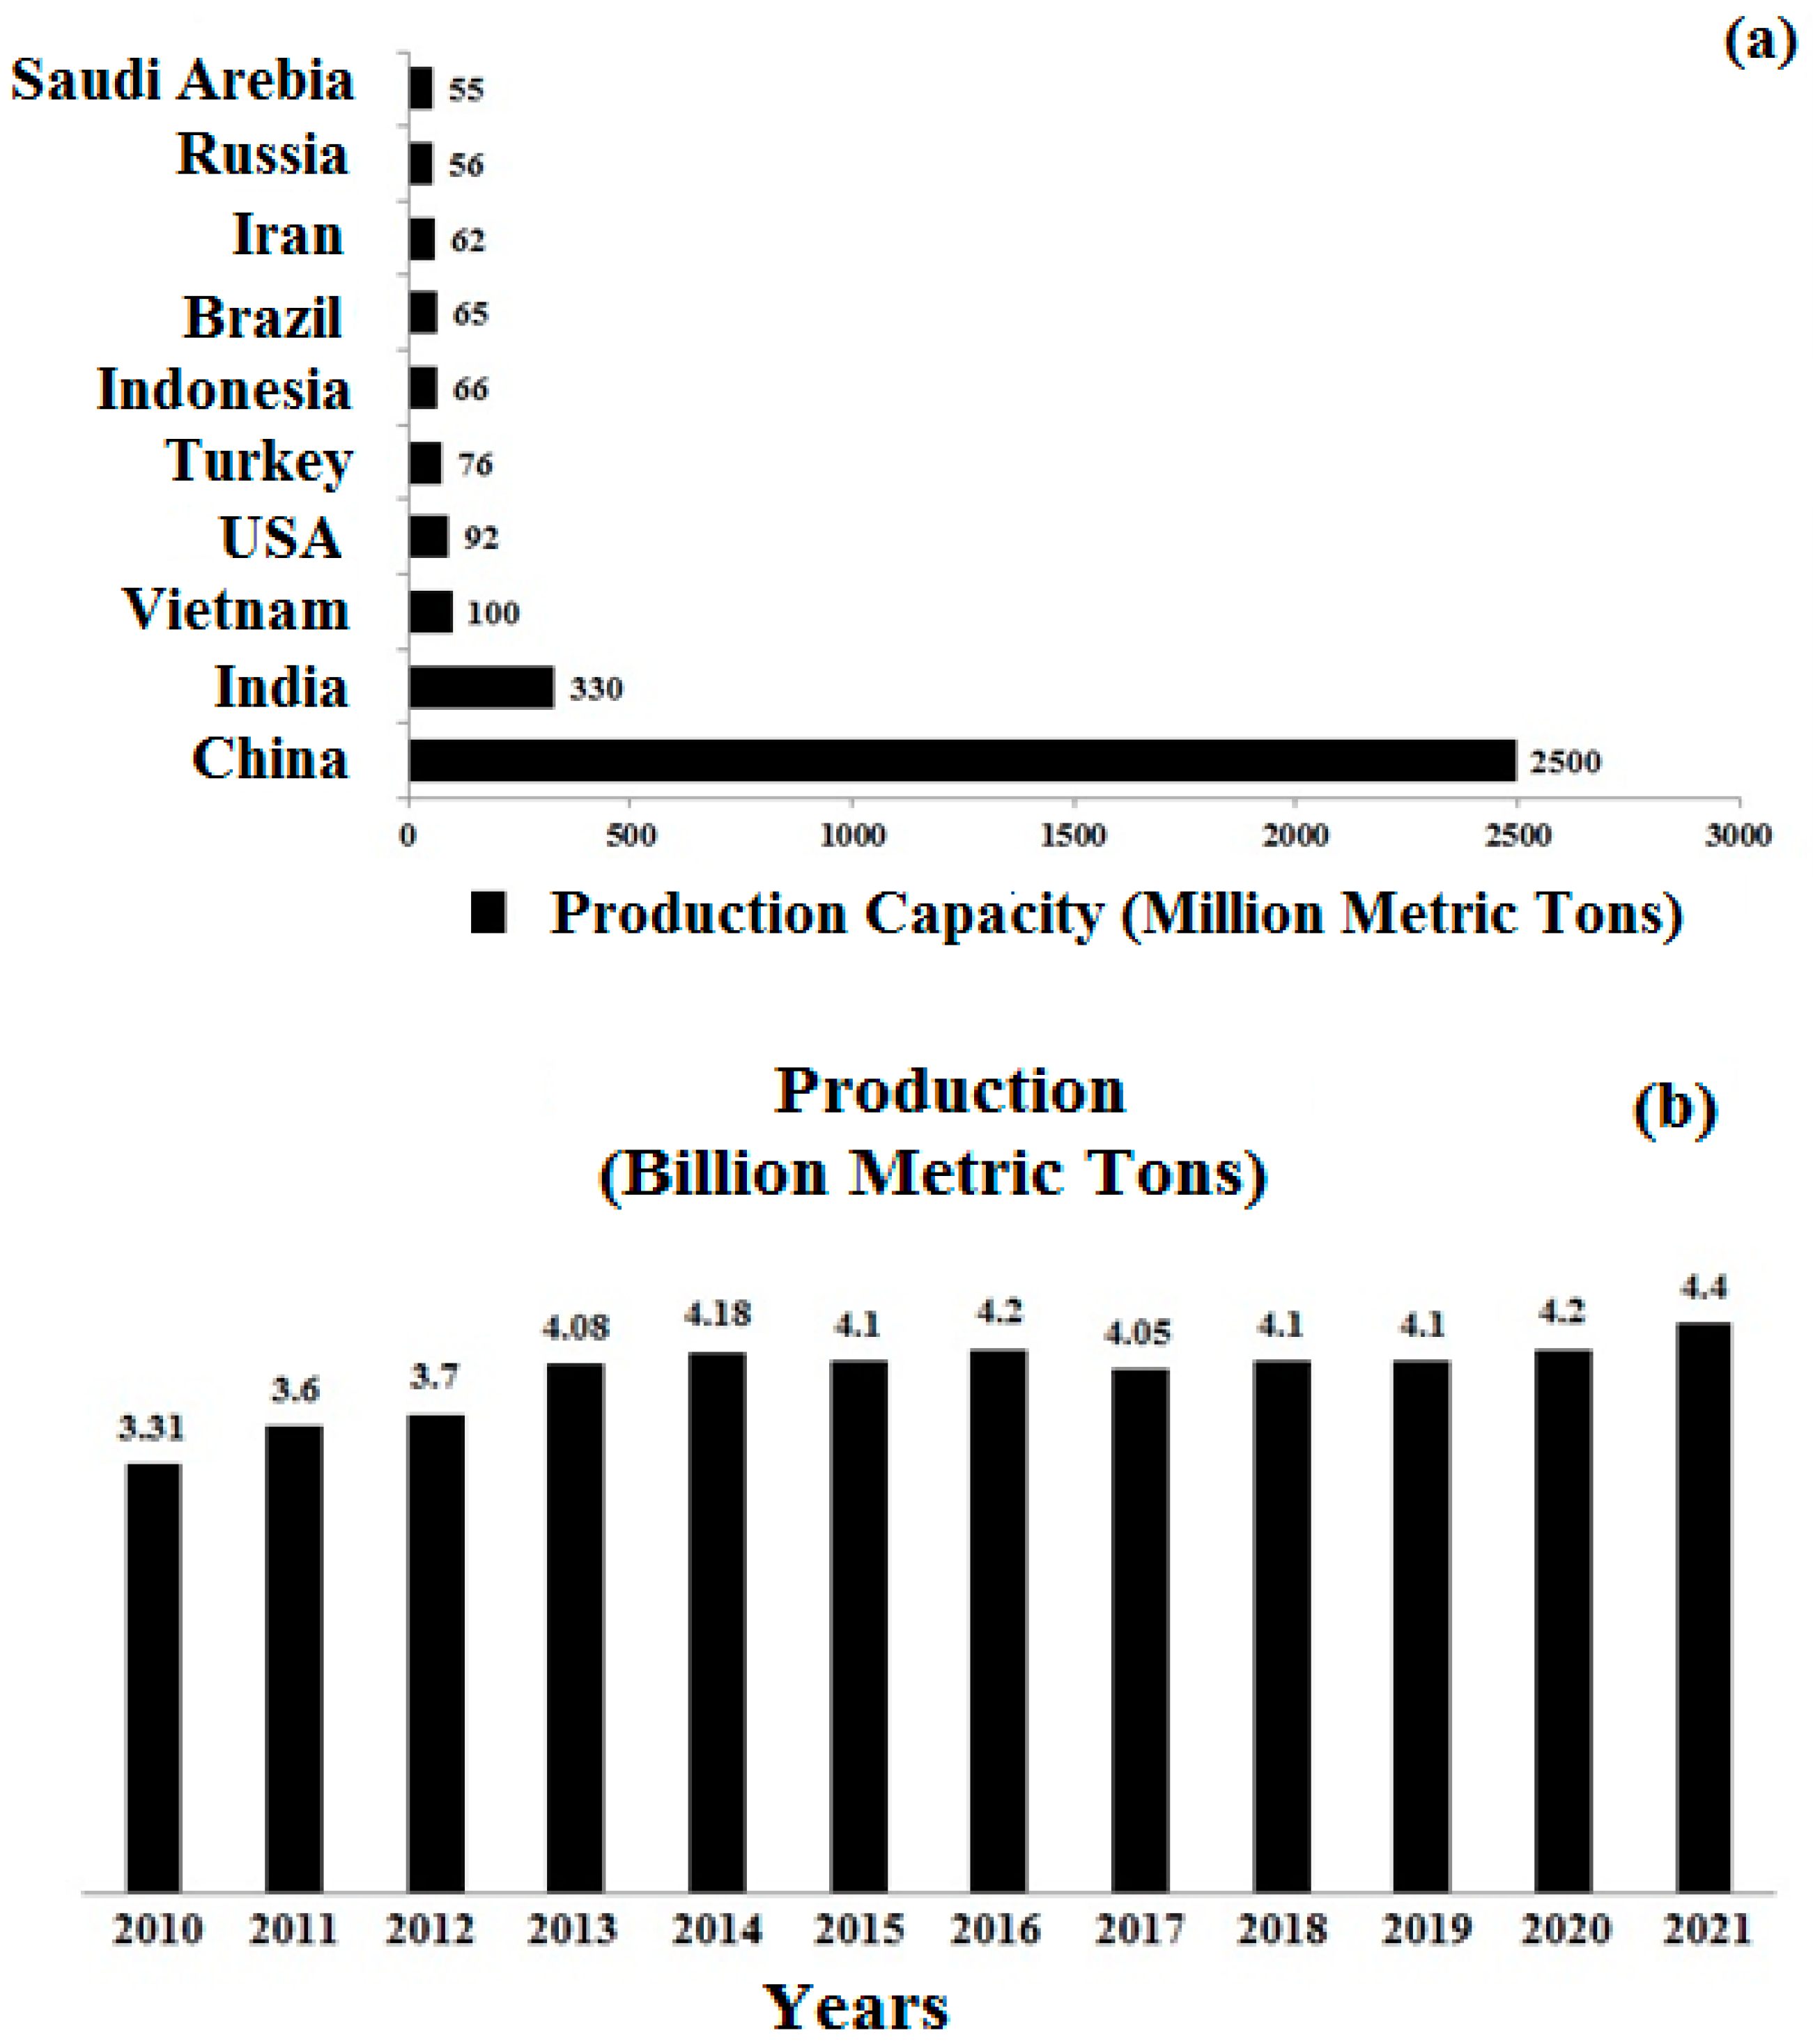
:1. Introduction
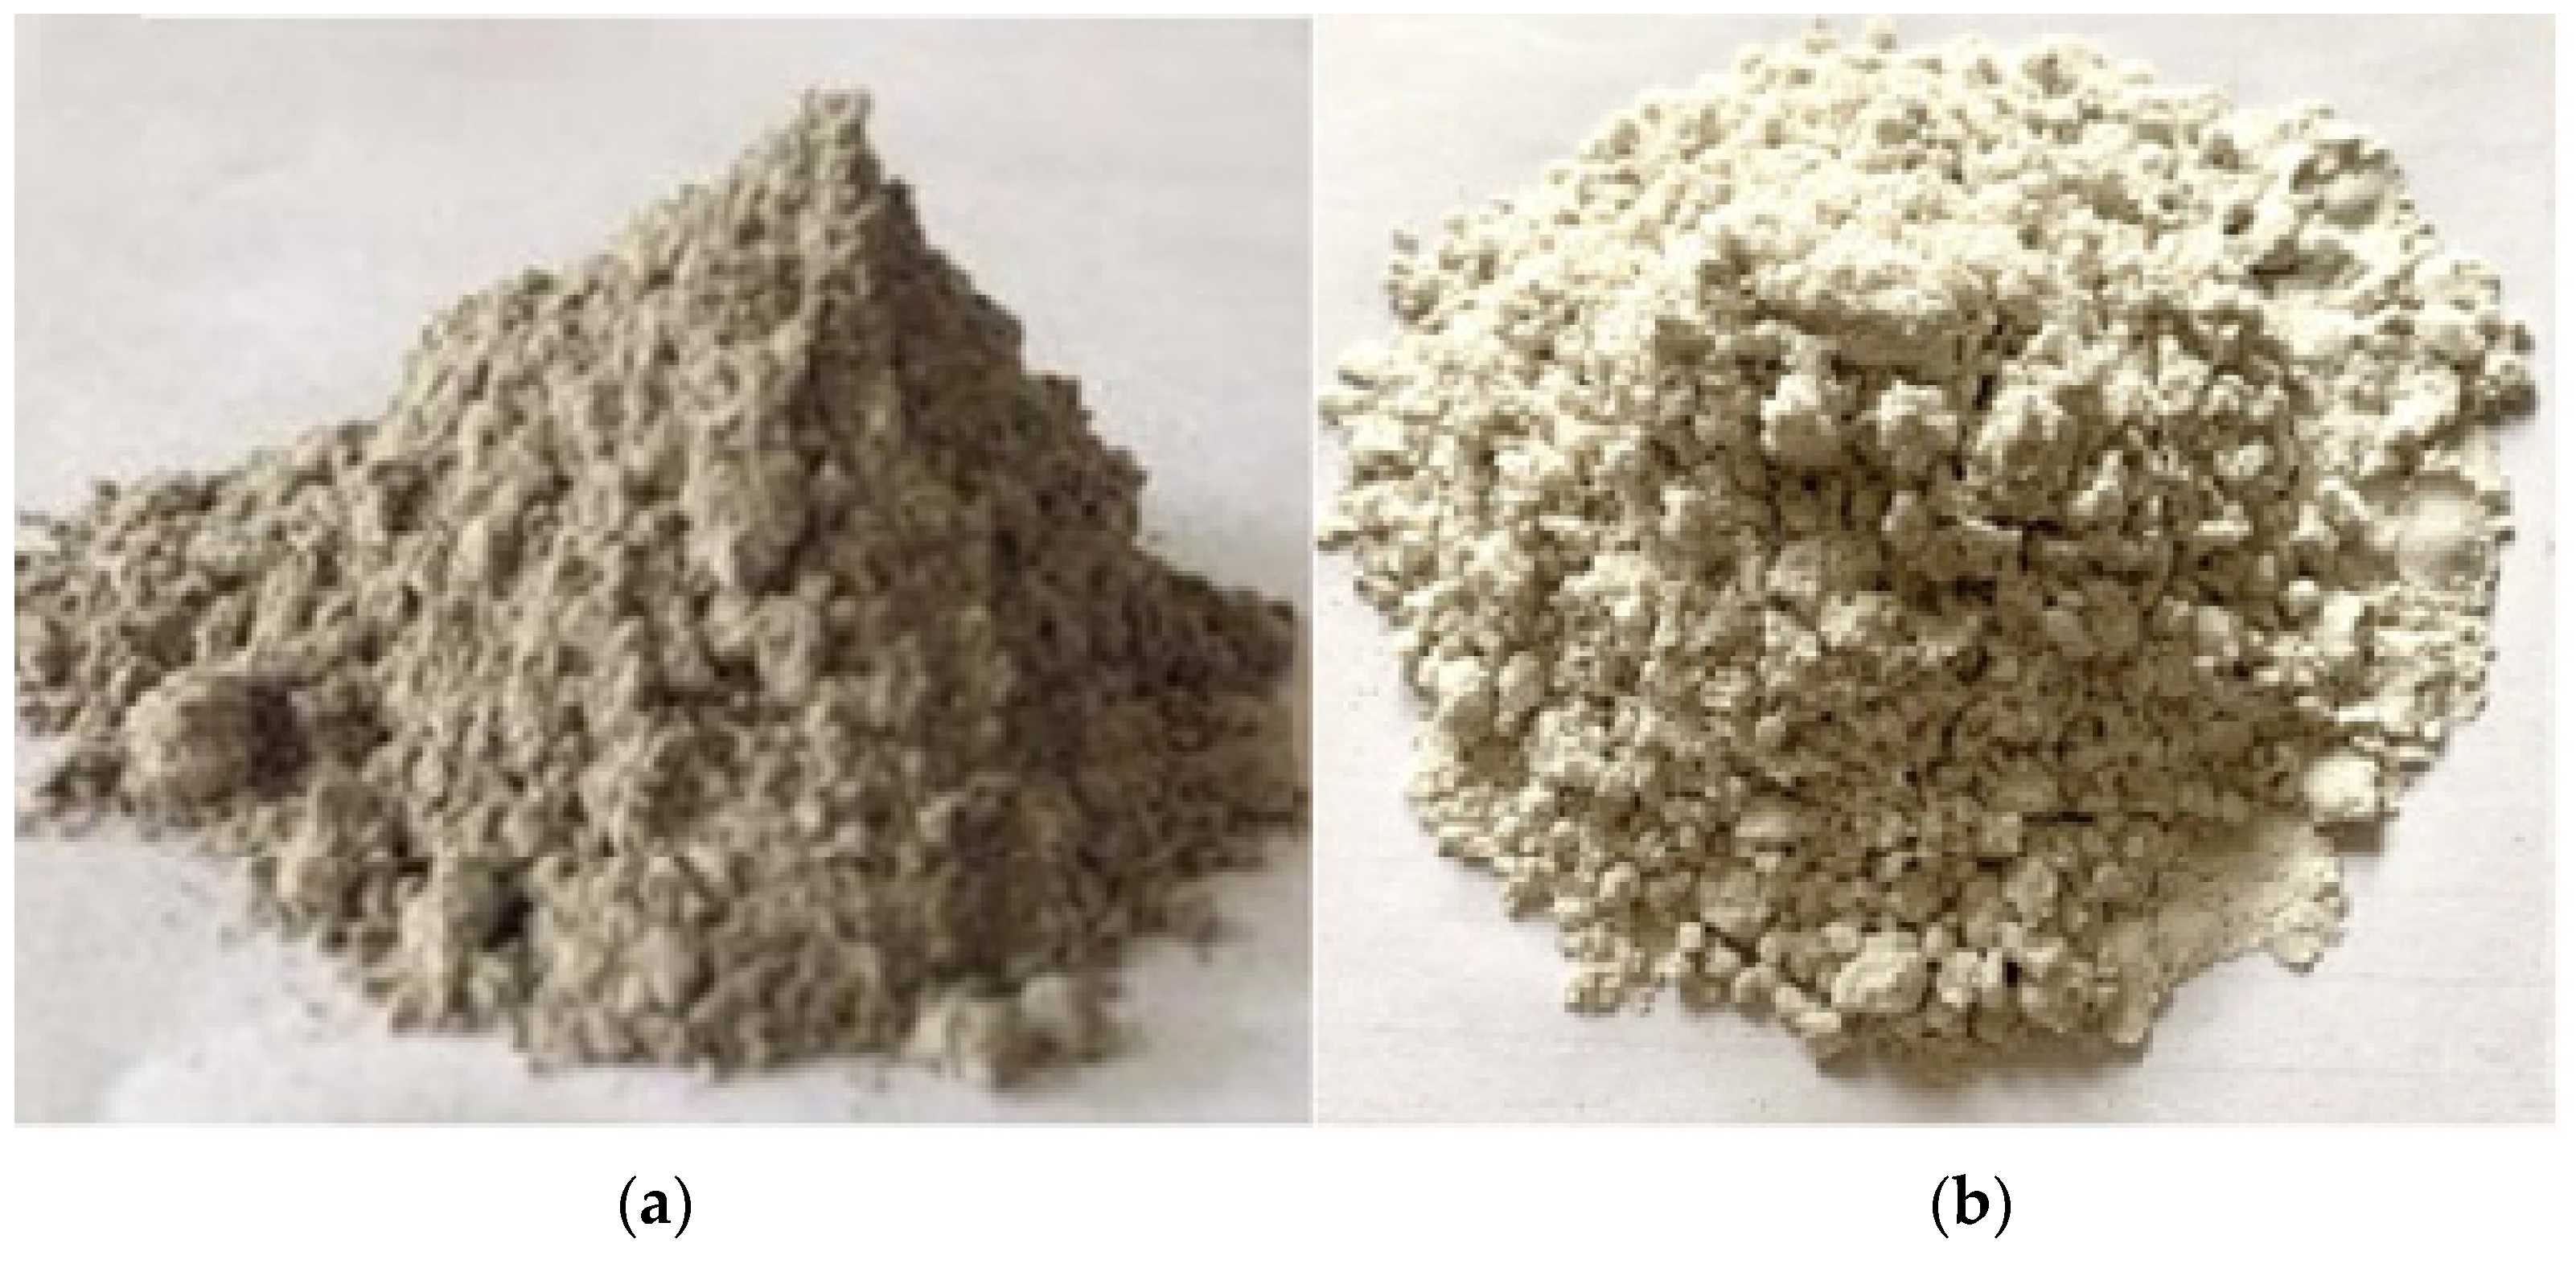
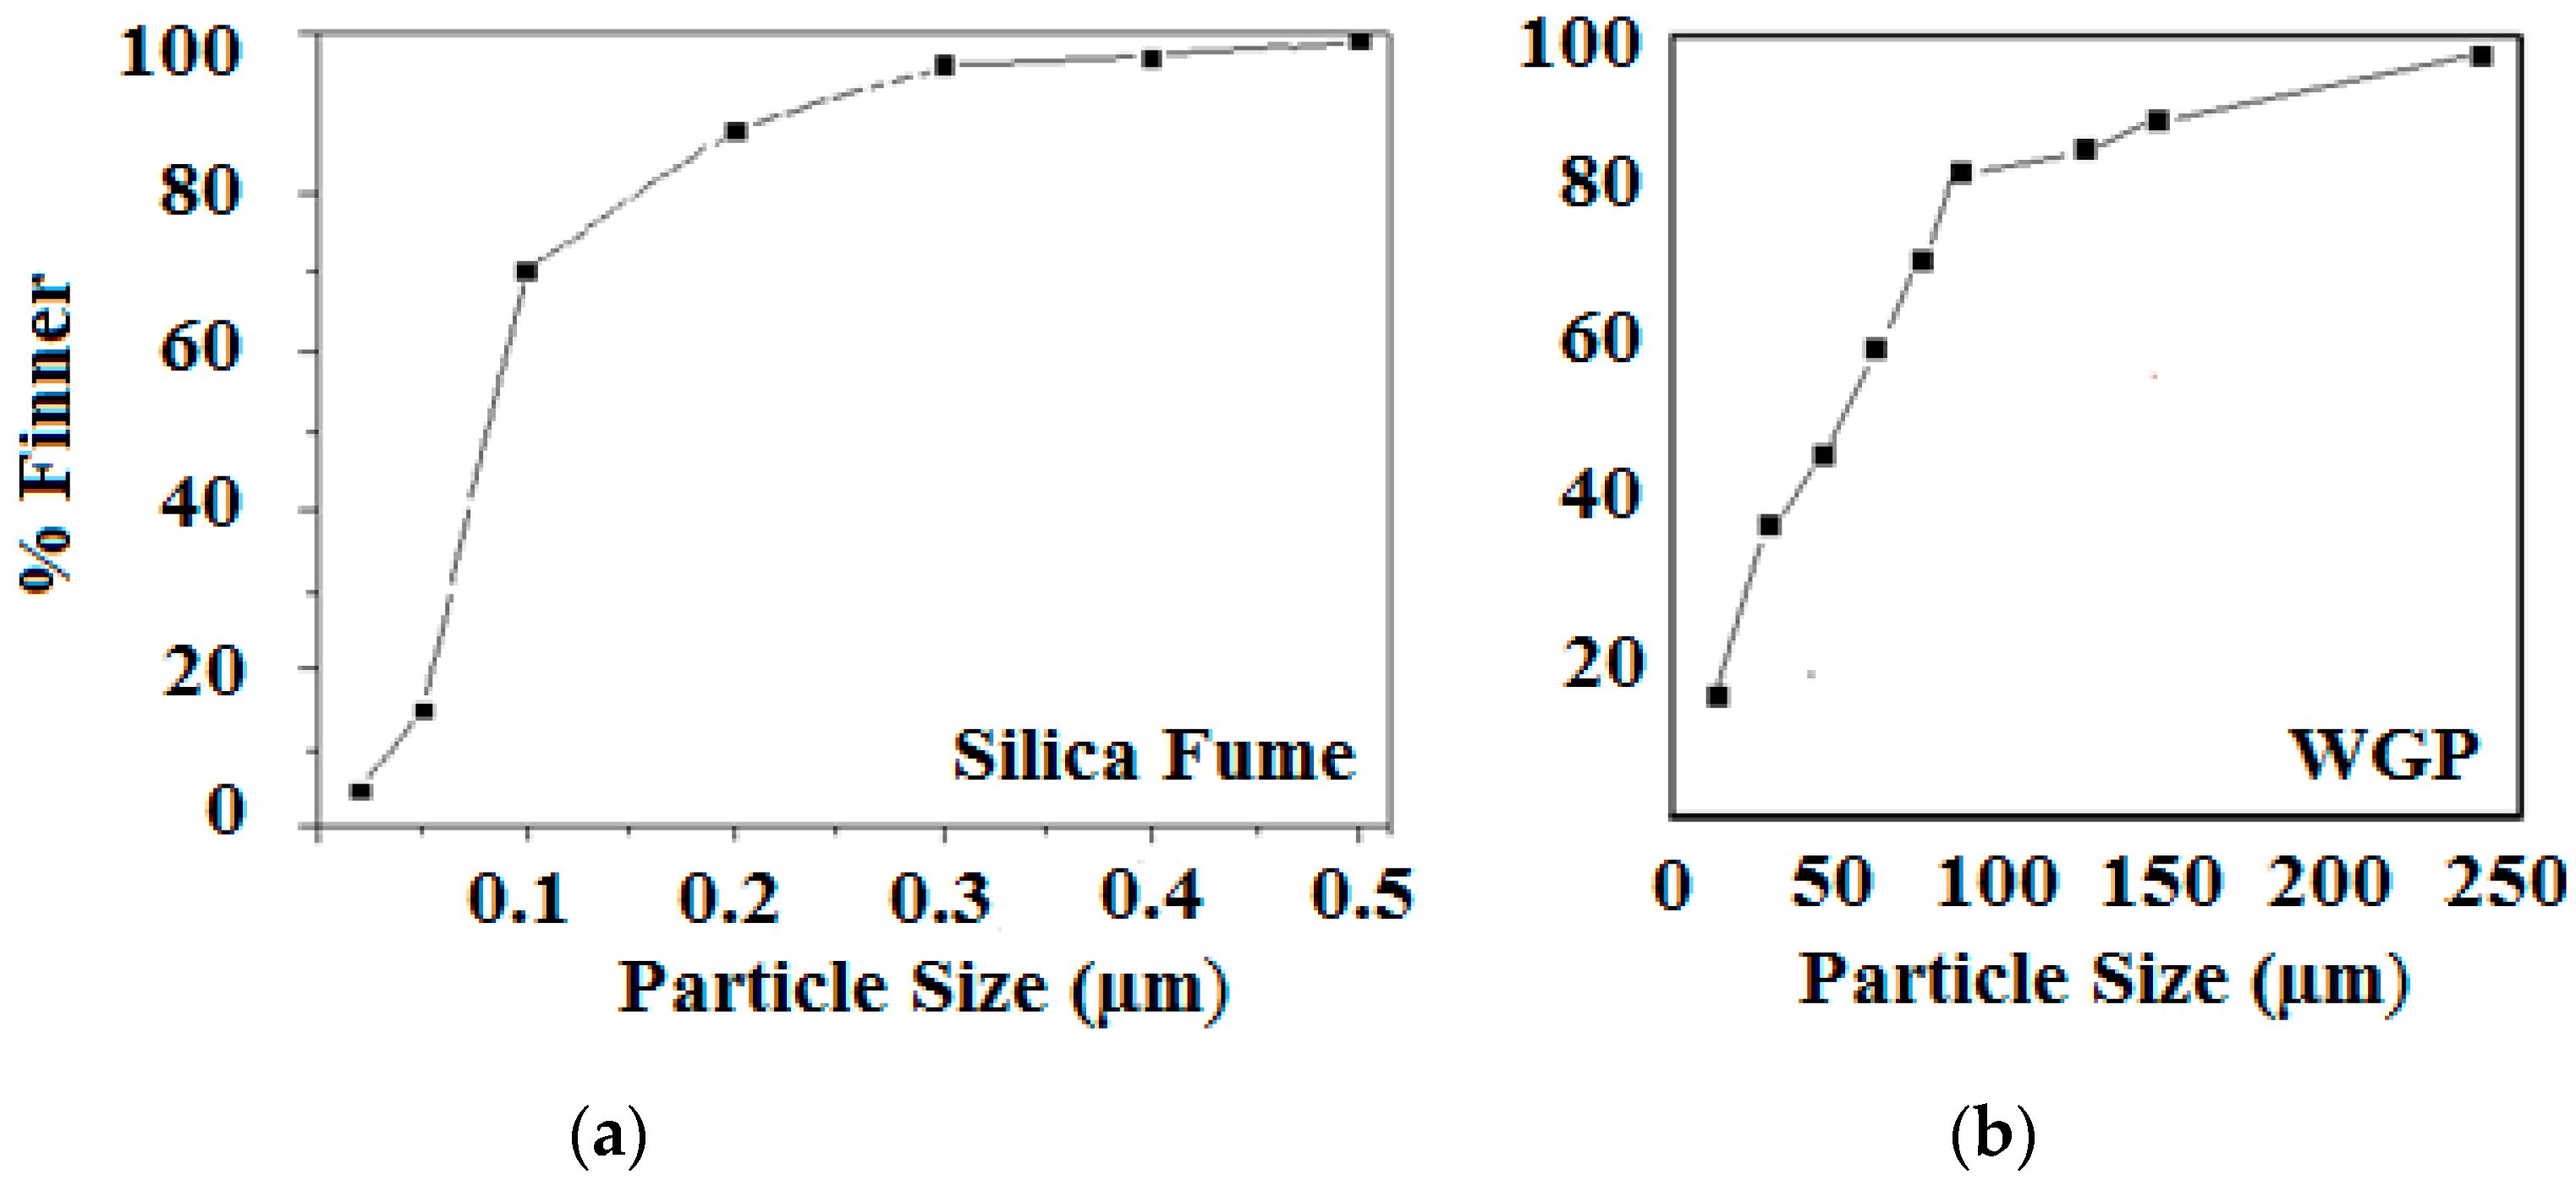
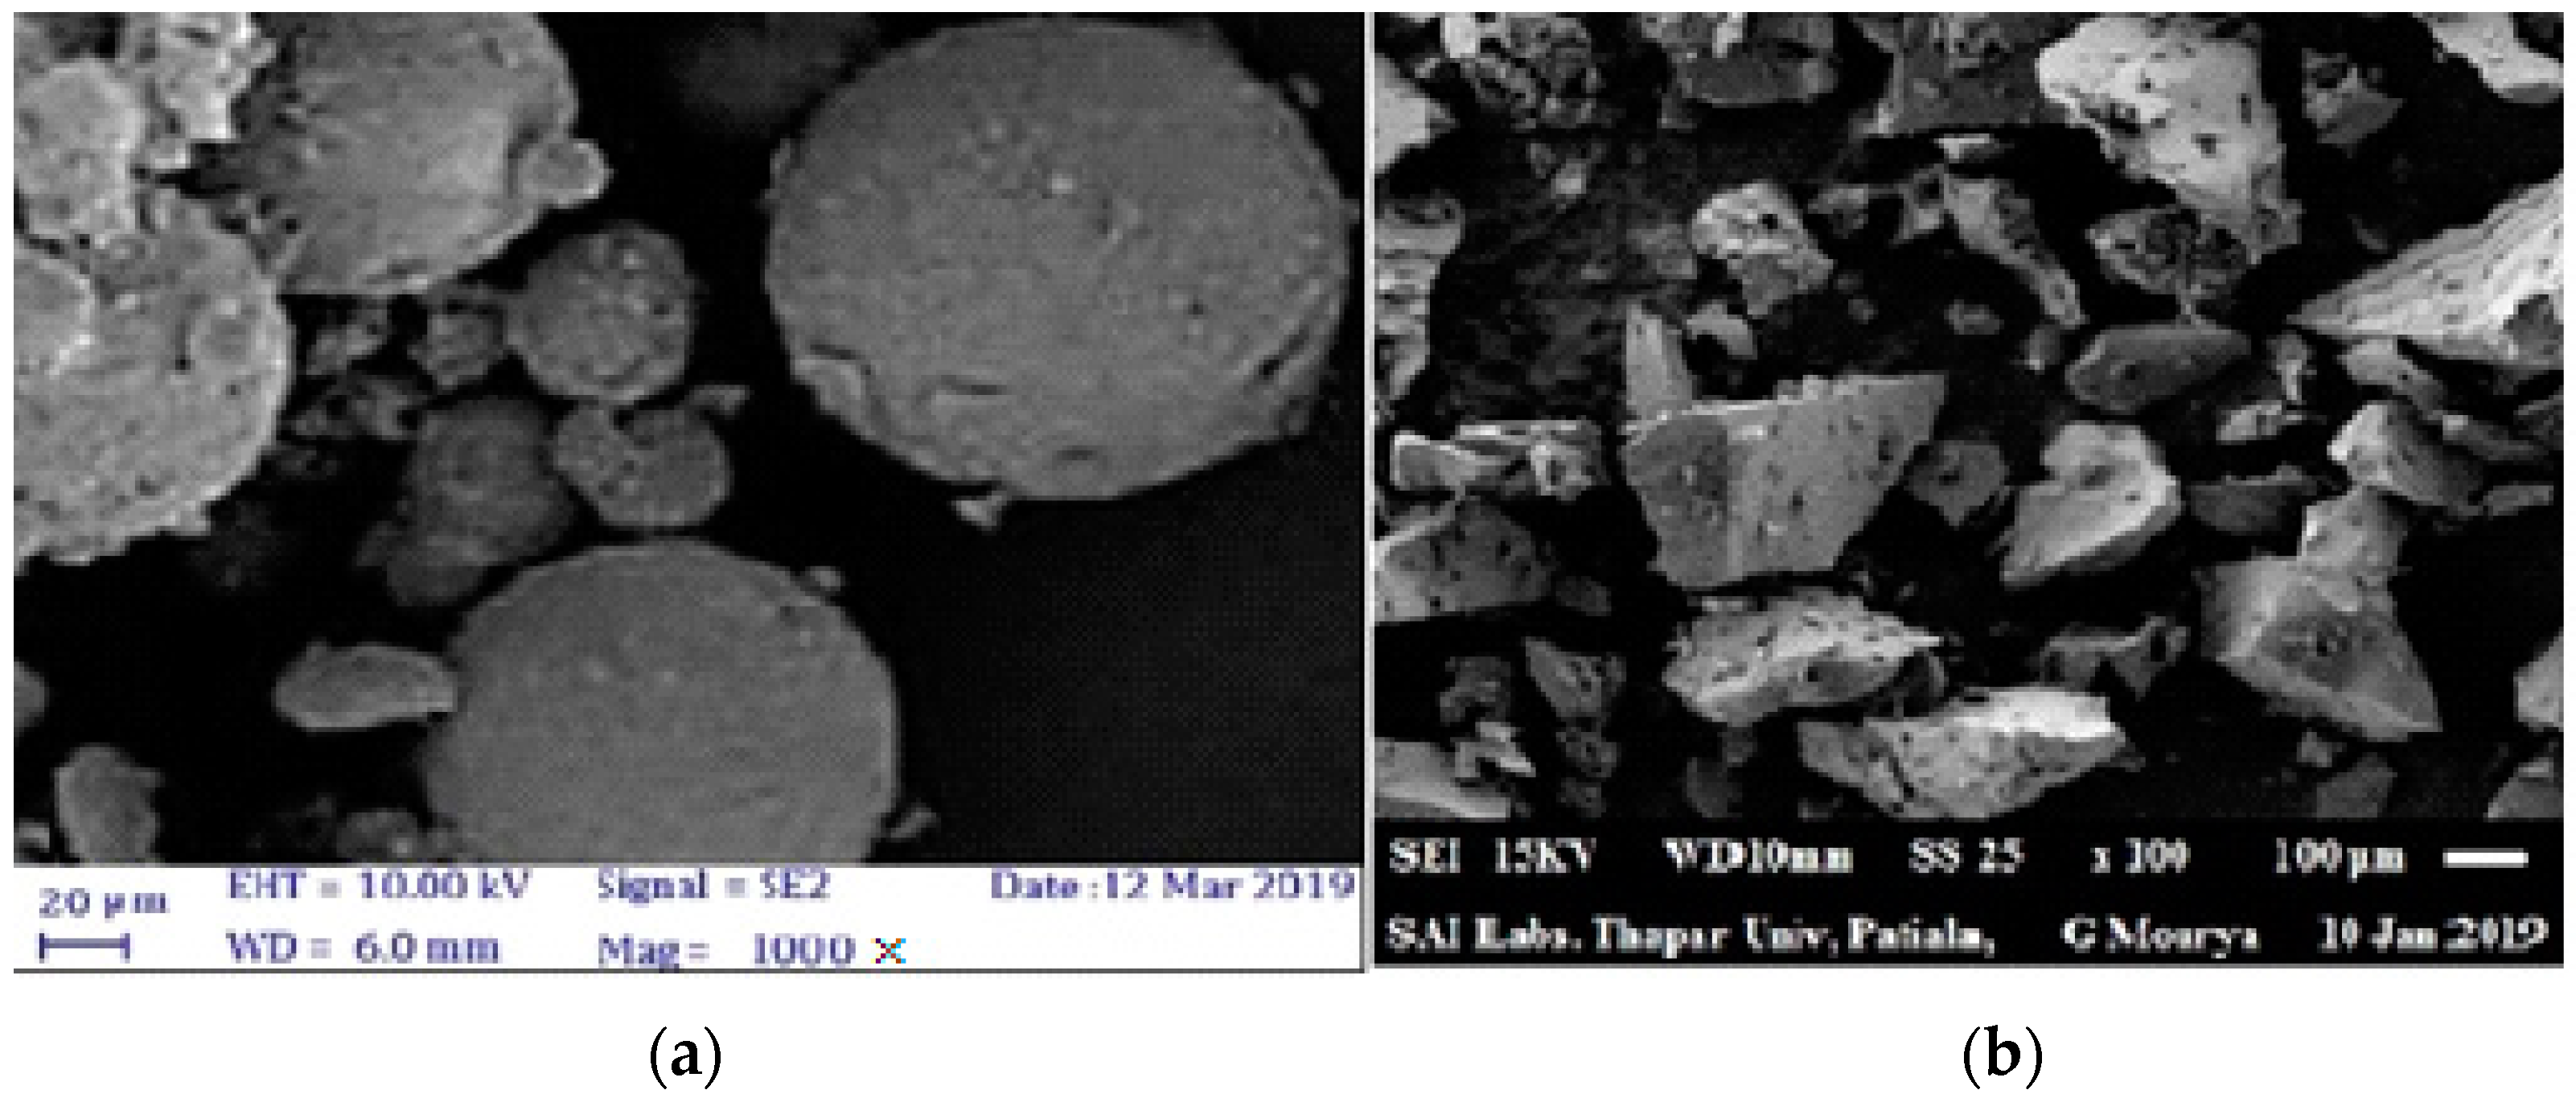
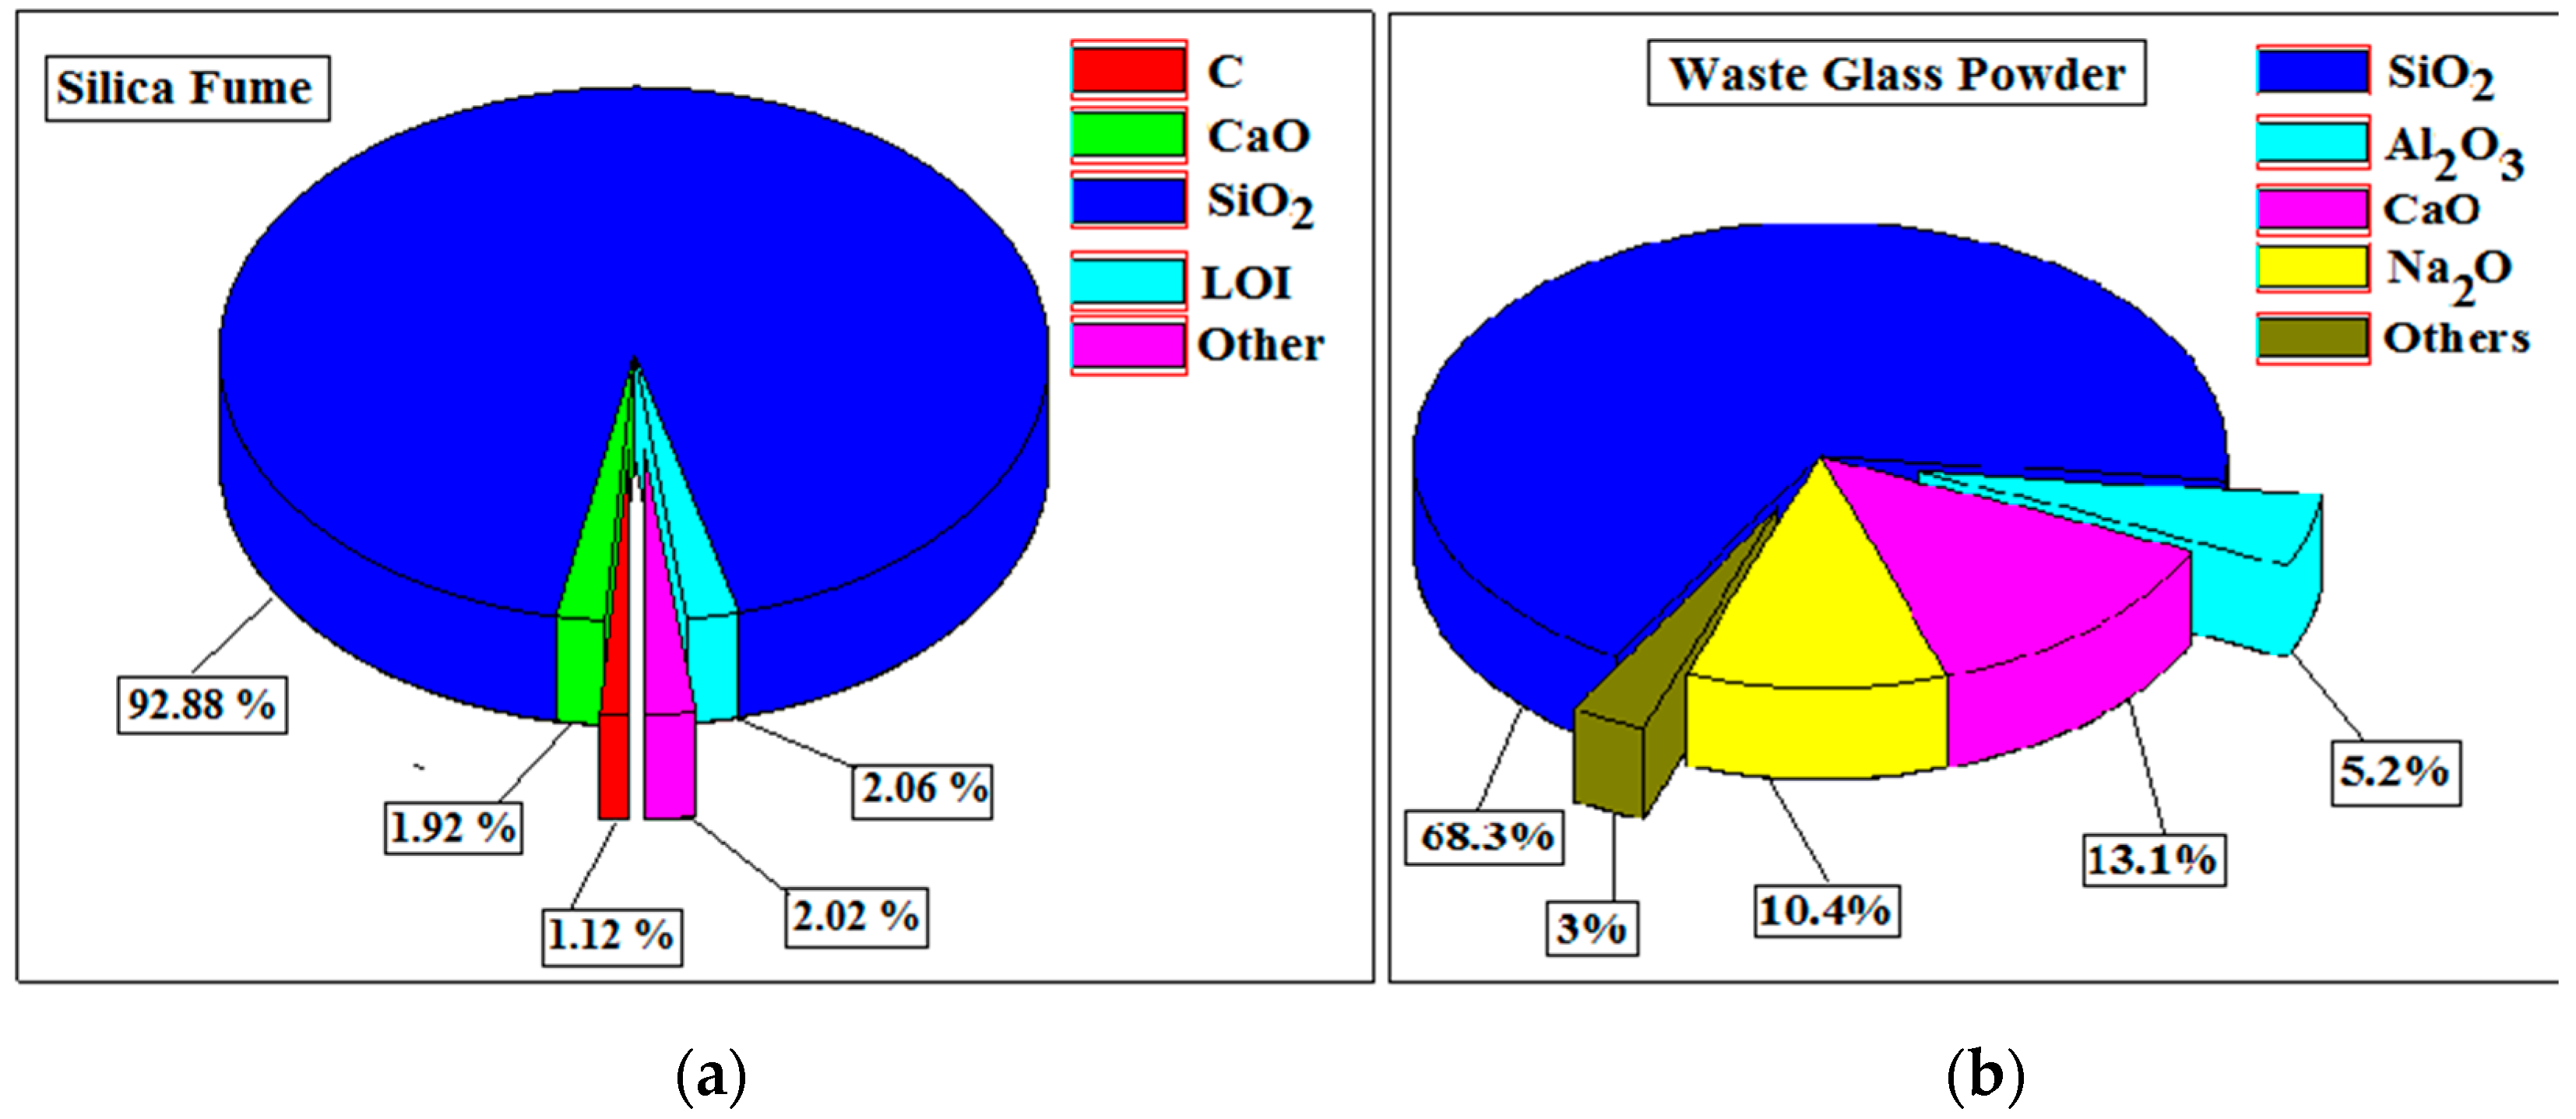
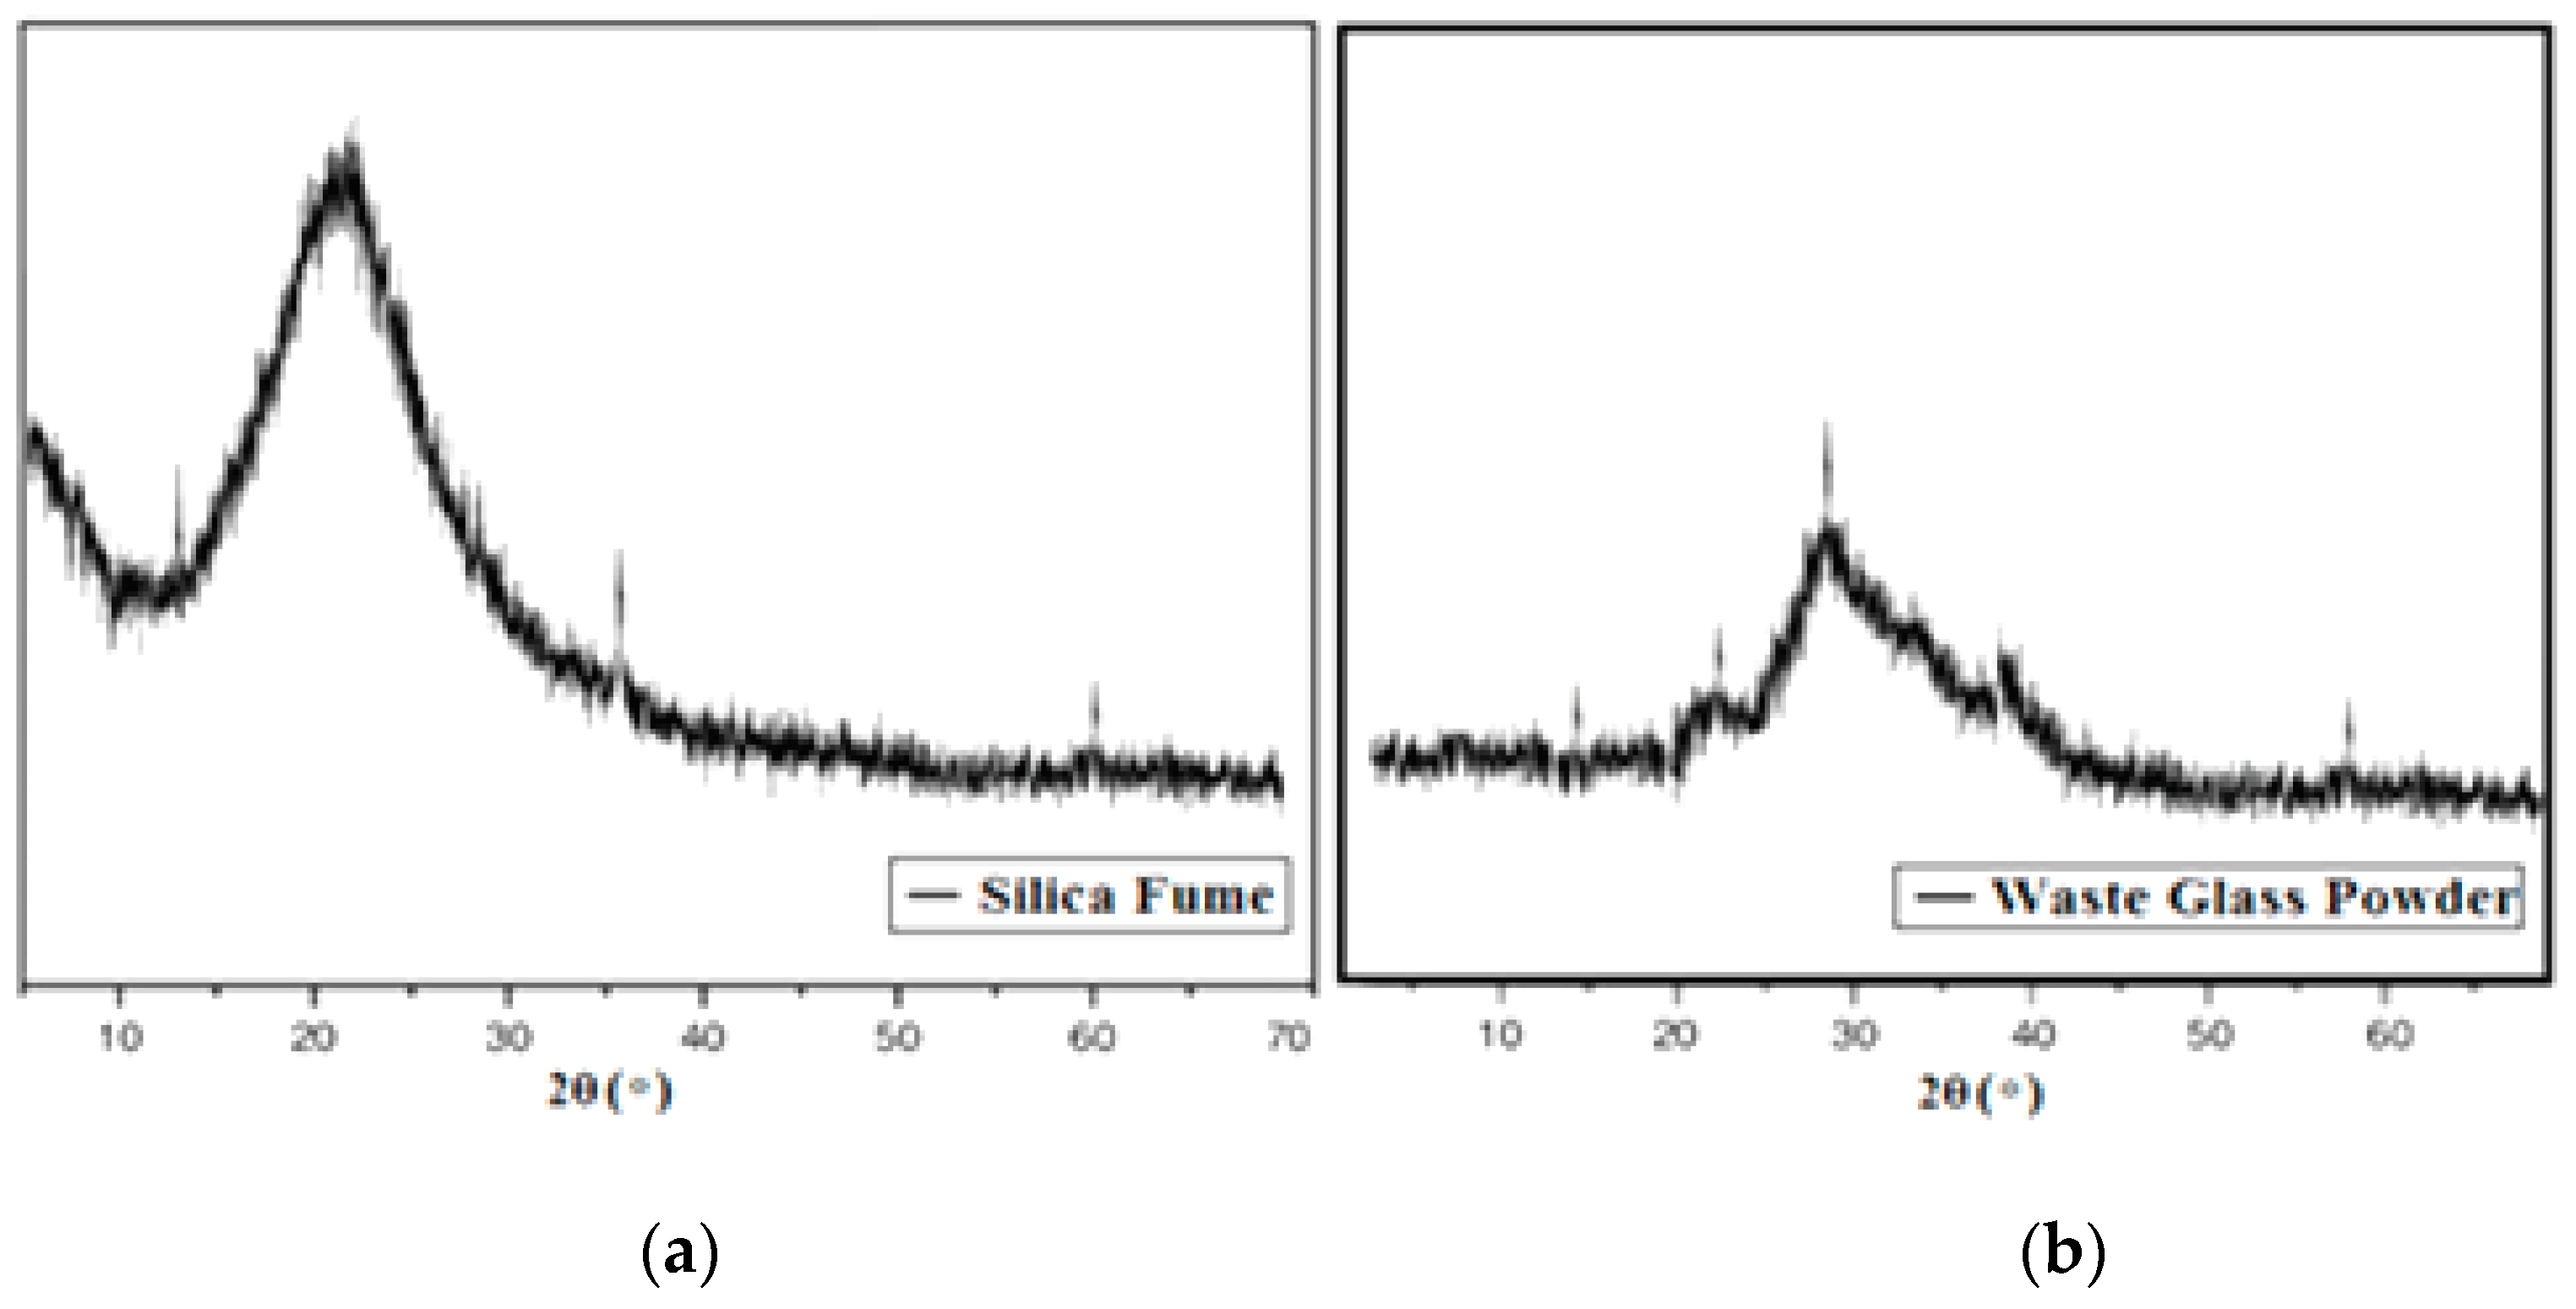
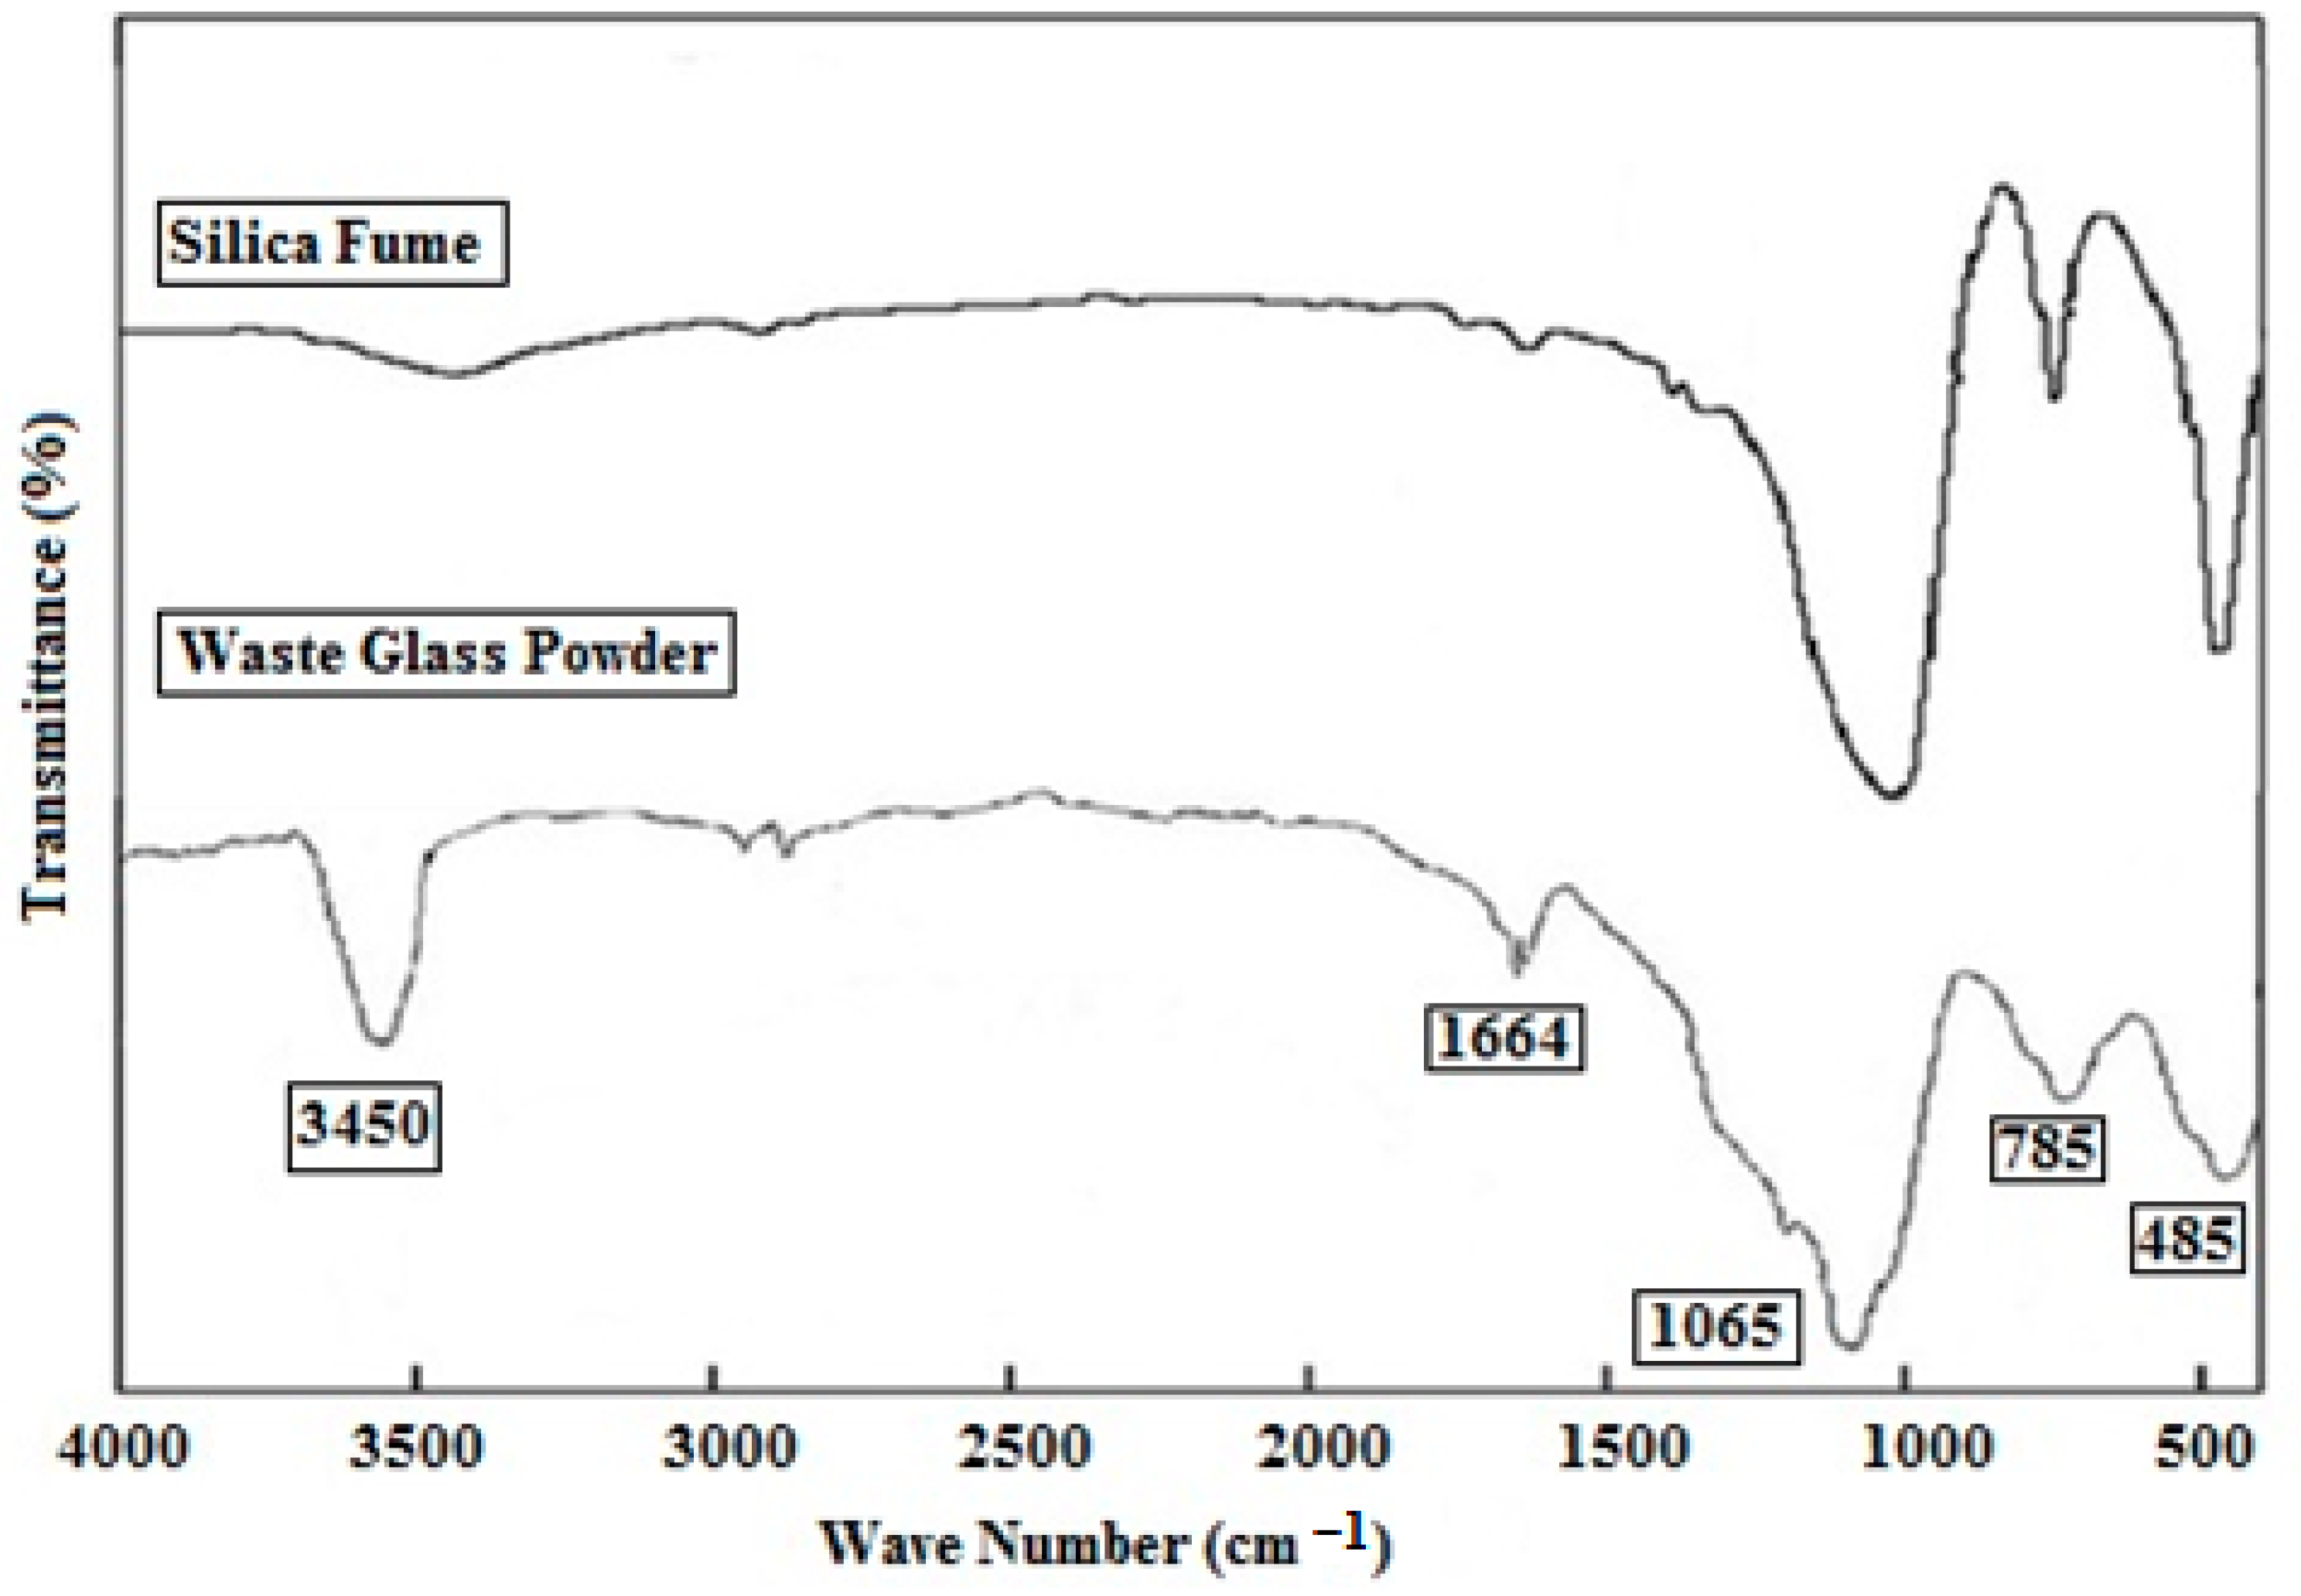
1.1. Waste Glass Powder
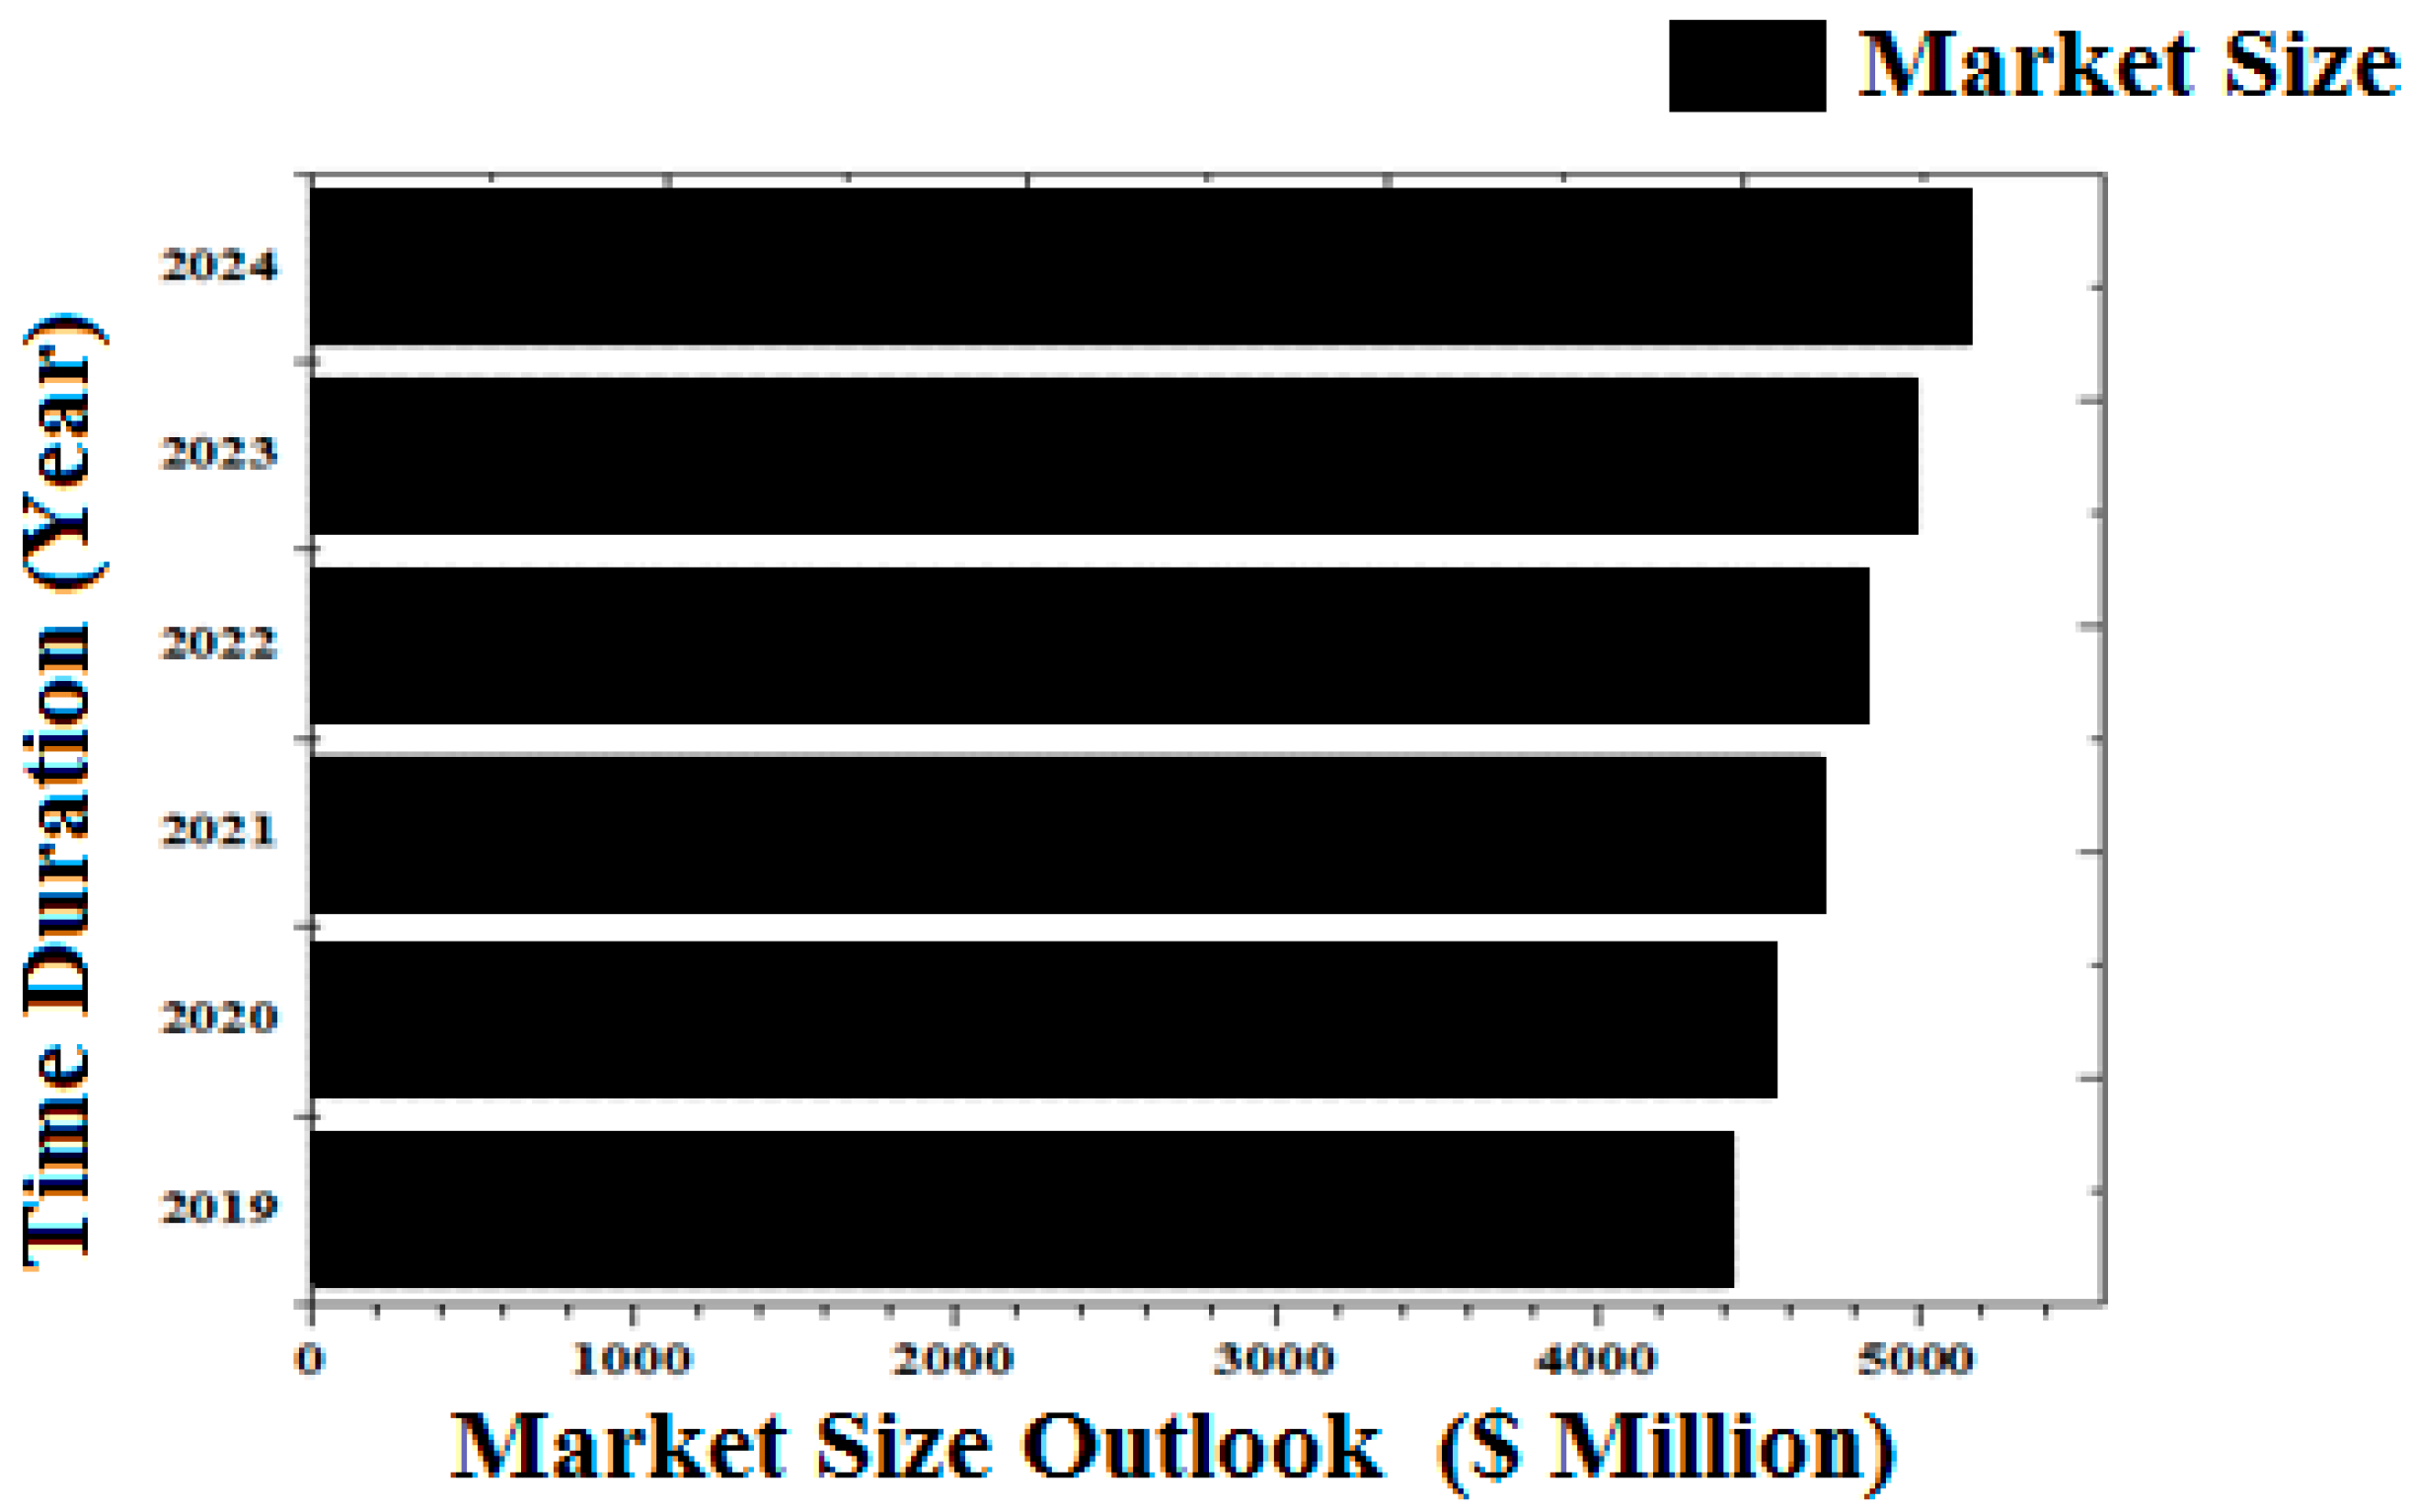
1.2. Silica Fume
2. Methodology
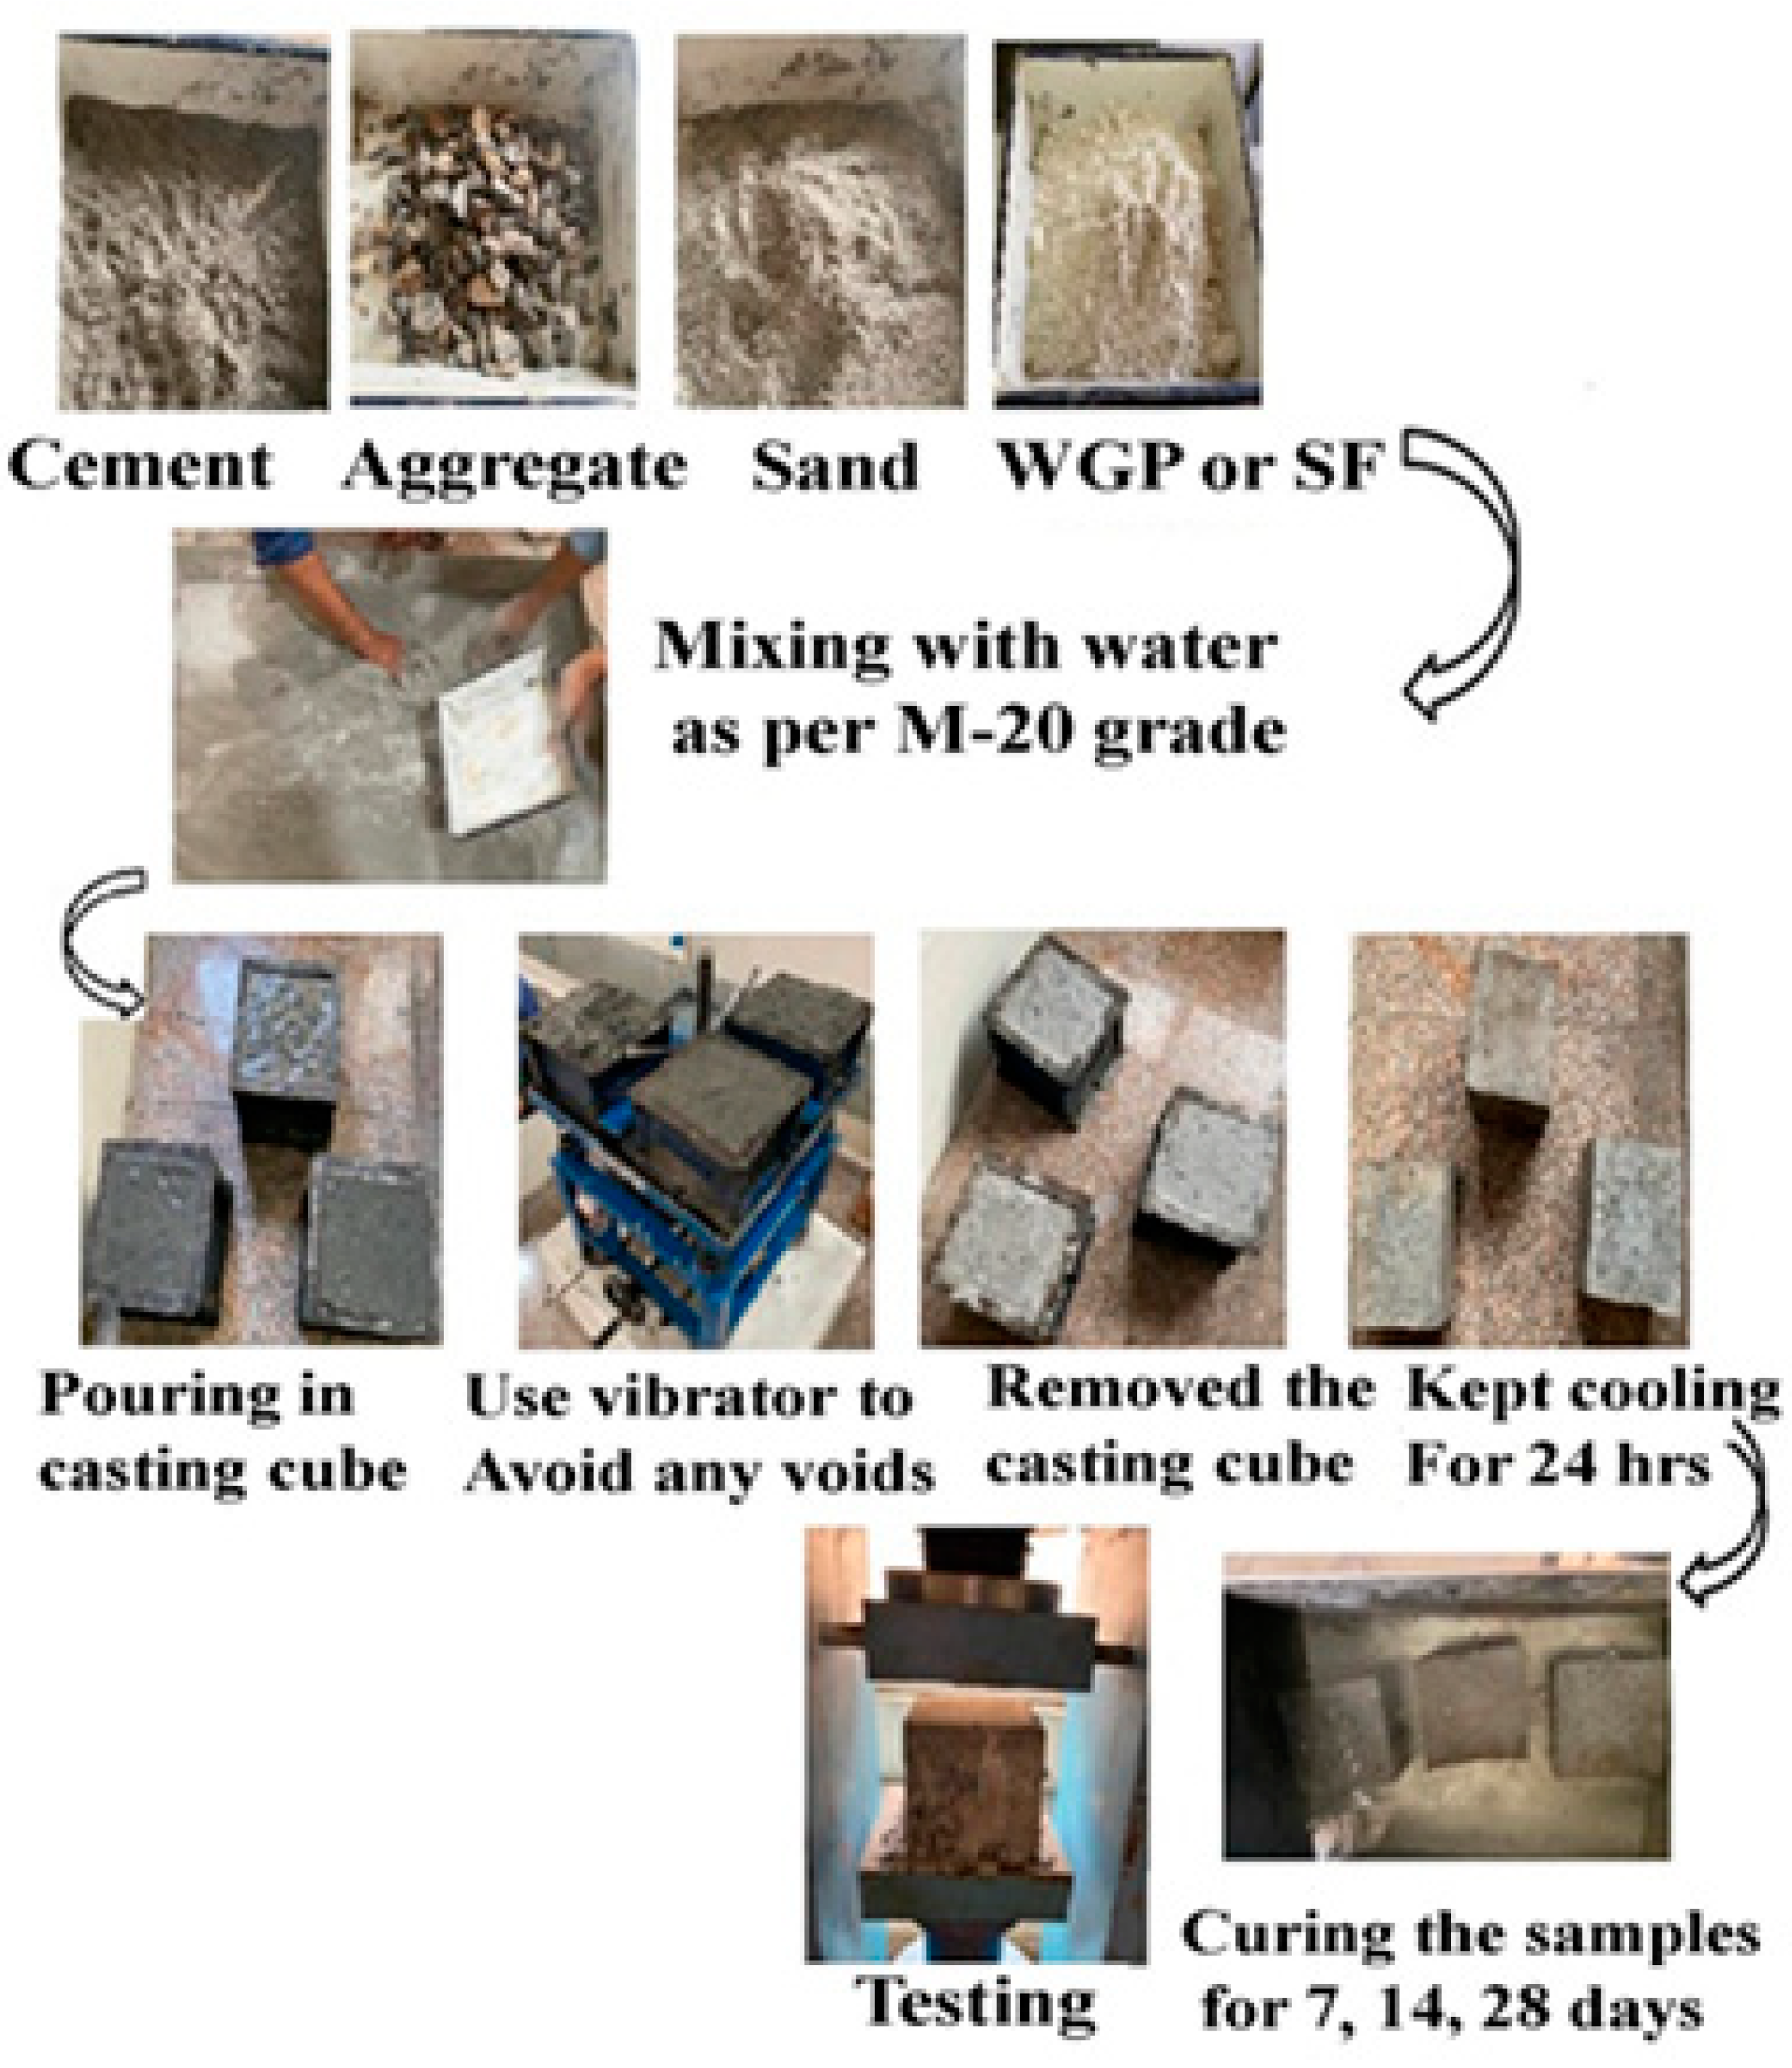
Sample Preparation and Experimentation
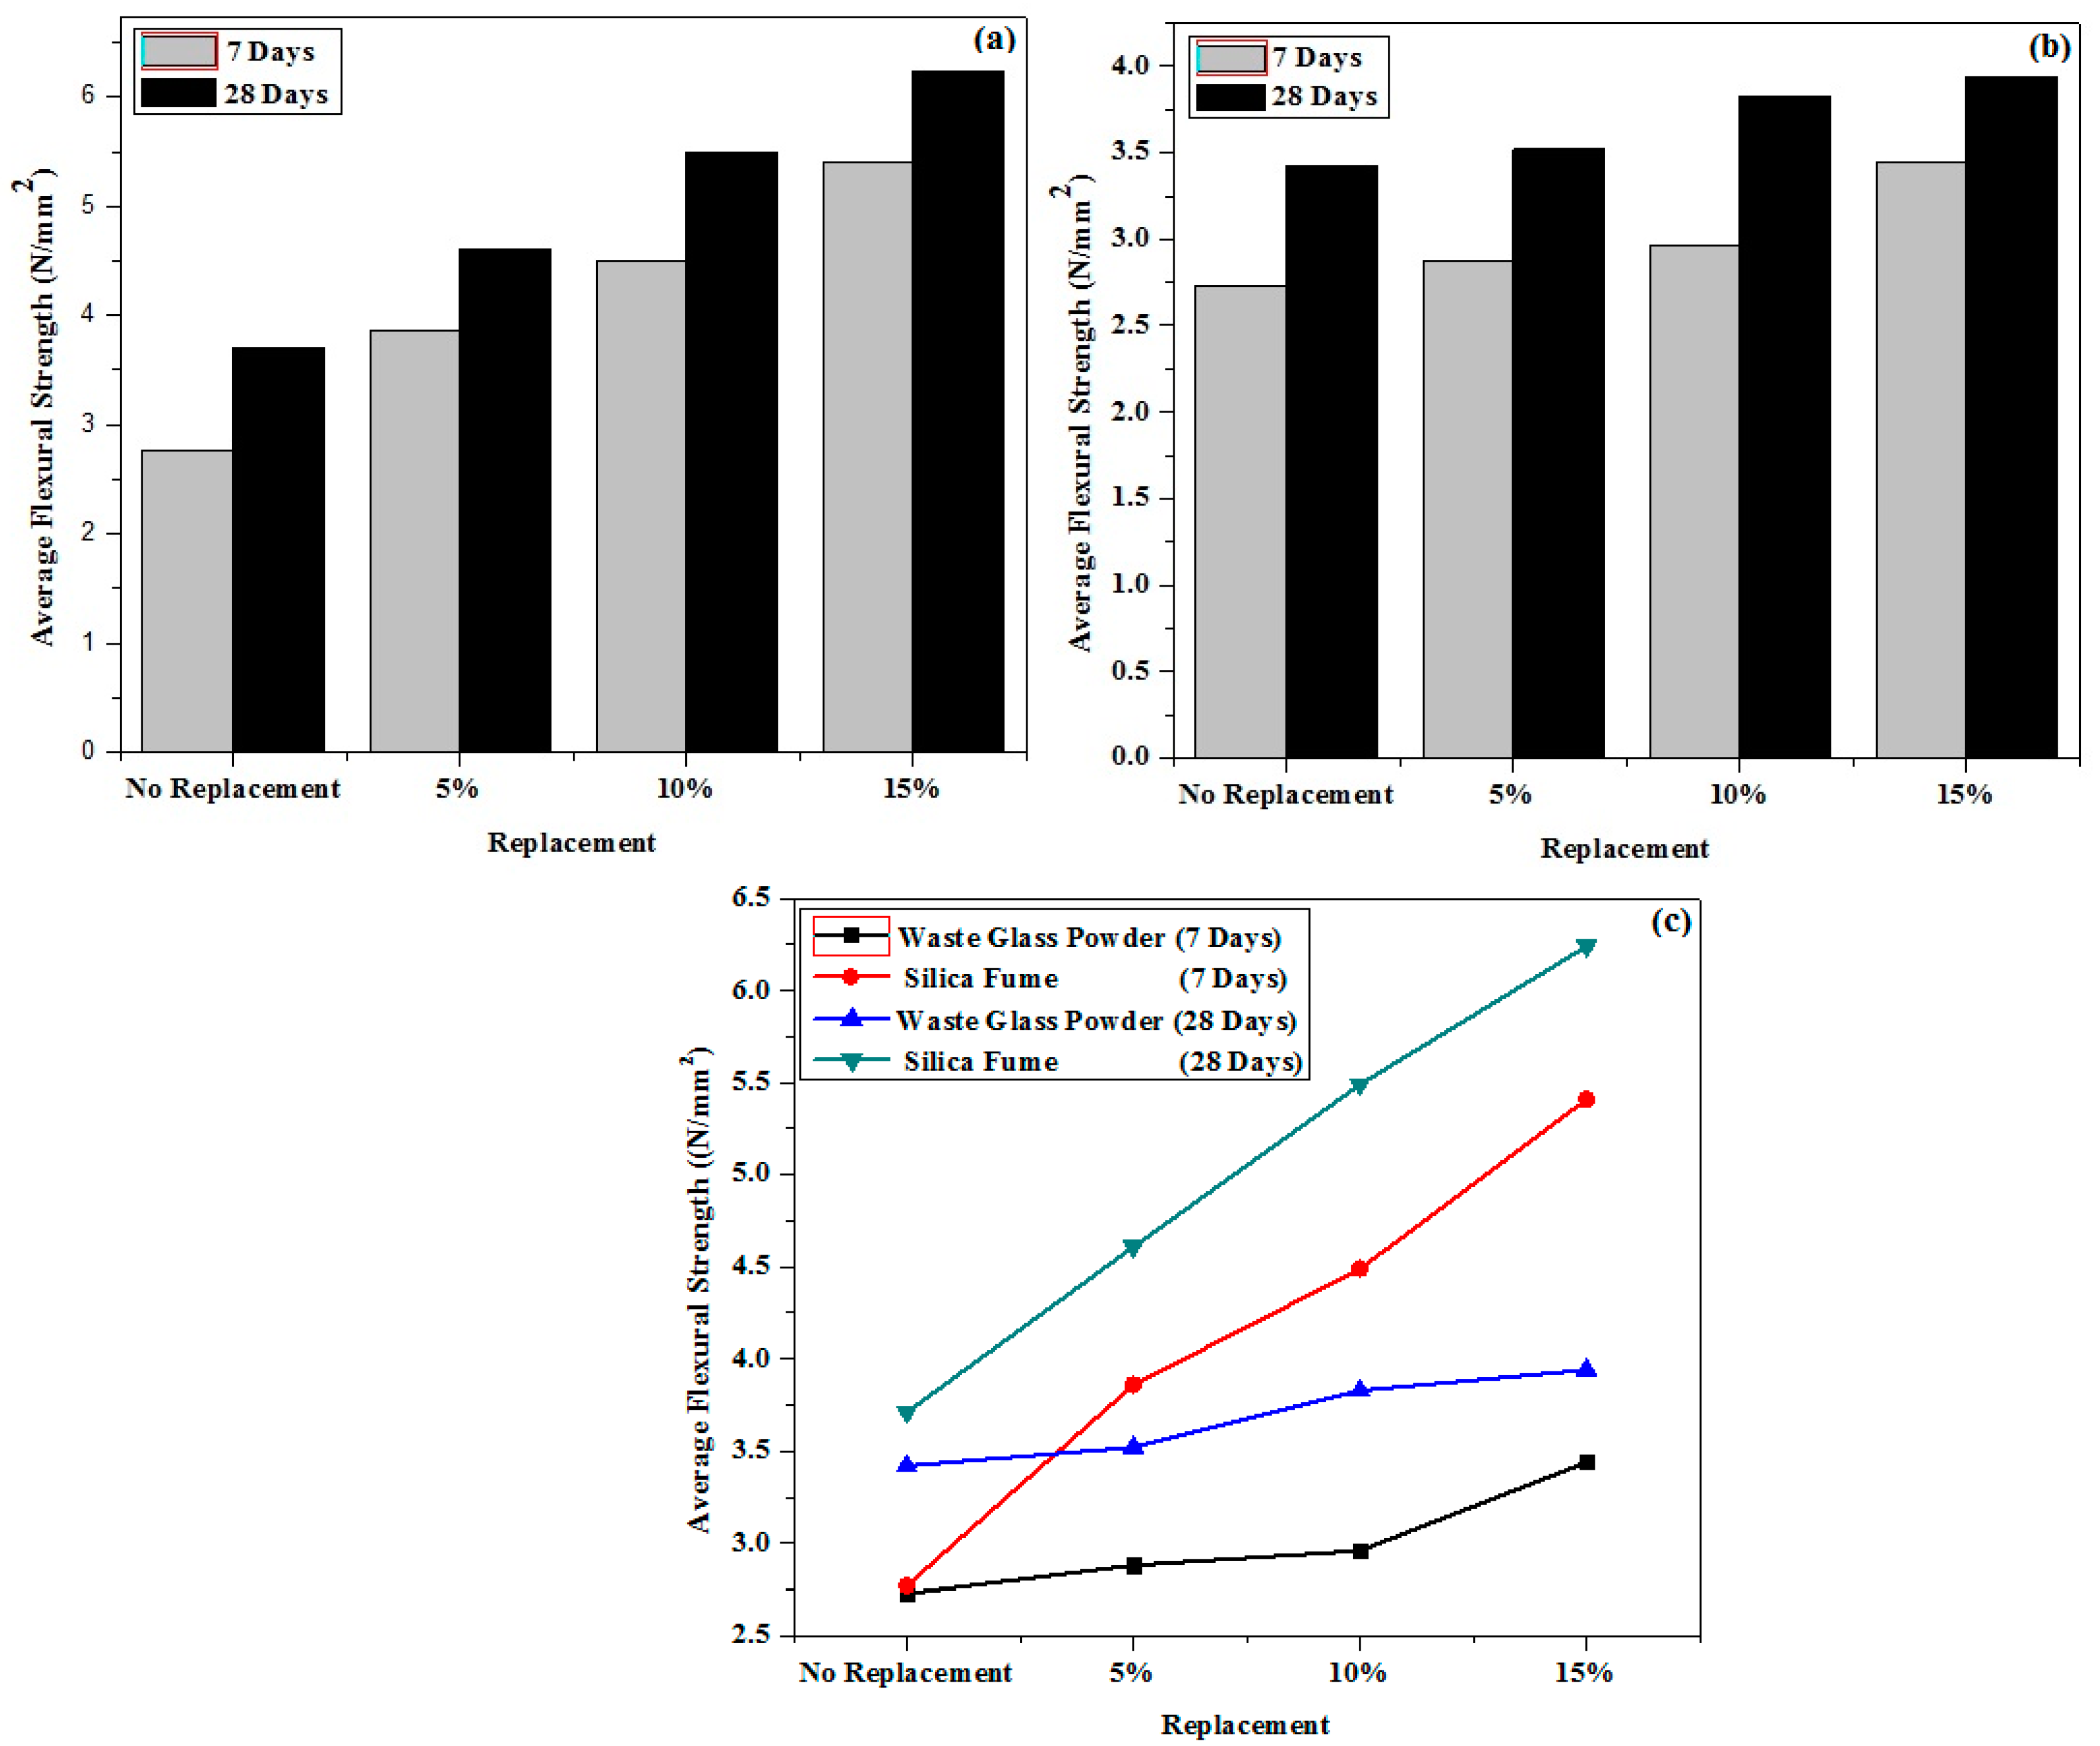
3. Results and Discussion
4. Conclusions
Author Contributions
Funding
Data Availability Statement
Conflicts of Interest
References
- Wilberforce, T.; Baroutaji, B.; Al-Alami, A.G.; Olabi, A.H. Outlook of carbon capture technology and challenges. Sci. Total Environ. 2019, 657, 56–72. [Google Scholar] [CrossRef] [PubMed] [Green Version]
- Drissi, S.; Ling, T.C.; Mo, K.H.; Eddhahak, A. A review of microencapsulated and composite phase change materials: Alteration of strength and thermal properties of cement-based materials. Renew. Sustain. Energy Rev. 2019, 110, 467–484. [Google Scholar] [CrossRef]
- Garside, M. Available online: https://www.statista.com/statistics/1087115/global-cement-production-volume (accessed on 23 March 2022).
- Meng, Y.; Ling, T.-C.; Mo, K.H.; Tian, W. Enhancement of high temperature performance of cement blocks via CO2 curing. Sci. Total Environ. 2019, 671, 827–837. [Google Scholar] [CrossRef] [PubMed]
- Schneider, M.; Romer, M.; Tschudin, M.; Bolio, H. Sustainable cement production—Present and future. Cem. Concr. Res. 2011, 41, 642–650. [Google Scholar] [CrossRef]
- Ramezanianpour, A.A. Cement Replacement Materials Properties, Durability, Sustainability. In Springer Geochemistry/Mineralogy; Springer: Berlin/Heidelberg, Germany, 2013. [Google Scholar] [CrossRef]
- Juenger, M.C.G.; Siddique, R. Recent advances in understanding the role of supplementary cementations materials in concrete. Cem. Concr. Res. 2015, 78, 71–80. [Google Scholar] [CrossRef]
- Sadiqul, G.; Rahman, M.; Kazia, N. Waste glass powder as partial replacement of cement for sustainable concrete practice. Int. J. Sustain. Built Environ. 2016, 6, 37–44. [Google Scholar]
- Dixit, S.; Stefańska, A.; Musiuk, A. Architectural form finding in arboreal supporting structure optimisation. Ain Shams Eng. J. 2012, 12, 2321–2329. [Google Scholar] [CrossRef]
- Vanjare, M.; Shriram, H. Experimental Investigation on Self Compacting Concrete Using Glass Powder. Int. J. Eng. Res. 2012, 2, 1488–1492. [Google Scholar]
- Hussein, I.A.; Mona, S.M.M. Solid waste issue: Sources, composition, disposal, recycling, and valorization. Egypt. J. Pet. 2018, 27, 1275–1290. [Google Scholar] [CrossRef]
- Rashed, A. Recycled waste glass as fine aggregate replacement in cementations materials based on Portland cement. Constr. Build. Mater. 2014, 72, 340–357. [Google Scholar] [CrossRef]
- Shao, Y.; Lefort, T.; Moras, S.; Rodriguez, D. Studies on concrete containing ground waste glass. Cem. Concr. Res. 2000, 30, 91–100. [Google Scholar] [CrossRef]
- Du, H.; Tan, K.H. Effect of particle size on alkali-silica reaction in recycled glass mortars. Constr. Build. Mater. 2014, 66, 275–285. [Google Scholar] [CrossRef]
- Dixit, S. Study of factors affecting the performance of construction projects in AEC industry. Organ. Technol. Manag. Constr. 2020, 12, 2275–2282. [Google Scholar] [CrossRef]
- Kim, J.; Moon, J.H.; Shim, J.W.; Sim, J.; Lee, H.G.; Zi, G. Durability properties of a concrete with waste glass sludge exposed to freeze-and-thaw condition and de-icing salt. Constr. Build. Mater. 2014, 66, 398–402. [Google Scholar] [CrossRef]
- Nassar, R.; Soroushian, P. Strength and durability of recycled aggregate concrete containing milled glass as partial replacement for cement. Constr. Build. Mater. 2012, 29, 368–377. [Google Scholar] [CrossRef]
- Federico, L.M.; Chidiac, S.E. Waste glass as a supplementary cementitious material in concrete—Critical review of treatment methods. Cem. Concr. Compos. 2009, 31, 606–610. [Google Scholar] [CrossRef]
- Elaqra, H.; Rustom, R. Effect of using glass powder as cement replacement on rheological and mechanical properties of cement paste. Constr. Build. Mater. 2018, 179, 326–335. [Google Scholar] [CrossRef]
- Shi, C.; Wu, Y.; Riefler, C.; Wang, H. Characteristics and pozzolanic reactivity of glass powders. Cem. Concr. Res. 2005, 35, 987–993. [Google Scholar] [CrossRef]
- Dixit, S.; Singh, P. Investigating the disposal of E-Waste as in architectural engineering and construction industry. Mater. Today Proc. 2021, 56, 1891–1895. [Google Scholar] [CrossRef]
- Khan, M.I.; Siddique, R. Utilization of silica fume in concrete: Review of durability properties. Resour. Conserv. Recycl. 2011, 57, 30–35. [Google Scholar] [CrossRef]
- Hongjian, D.; Kiang, T. Waste glass powder as cement replacement in concrete. J. Adv. Concr. Technol. 2014, 12, 468–477. [Google Scholar] [CrossRef] [Green Version]
- Diamond, S.; Sahu, S.; Thaulow, N. Reaction products of densified silica fume agglomerates in concrete. Cem. Concr. Res. 2004, 34, 1625–1632. [Google Scholar] [CrossRef]
- Sanjuán, M.Á.; Argiz, C.; Gálvez, J.C.; Moragues, A. Effect of silica fume fineness on the improvement of Portland cement strength performance. Constr. Build. Mater. 2015, 96, 55–64. [Google Scholar] [CrossRef]
- Dixit, S. Impact of management practices on construction productivity in Indian building construction projects: An empirical study. Organ. Technol. Manag. Constr. 2021, 13, 2383–2390. [Google Scholar] [CrossRef]
- ACI Committee 116R. SP-019: Cement and Concrete Terminology; Copyright 2000; American Concrete Institute: Farmington Hills, MI, USA, 2020; Volume 19, pp. 1–144. [Google Scholar]
- ACI Committee 234. Guide for the Use of Silica Fume in Concrete; ACI 234R-06; Copyright © 2006; American Concrete Institute: Farmington Hills, MI, USA, 2006; p. 63. [Google Scholar]
- Hooton, R.D. Influence of silica fume replacement of cement on physical properties and resistance to sulfate attack, freezing and thawing, and alkalisilica reactivity. Mater. J. 1993, 90, 143–151. [Google Scholar] [CrossRef]
- Kuzielová, E.; Slaný, M.; Žemlička, M.; Másilko, J.; Palou, M.T. Phase composition of silica Fume—Portland cement system formed under hydrothermal curing evaluated by FTIR, XRD and TGA. Materials 2021, 14, 2786. [Google Scholar] [CrossRef] [PubMed]
- Juenger, M.C.G.; Ostertag, C.P. Alkali–silica reactivity of large silica fume derived particles. Cem. Concr. Res. 2004, 34, 1389–1402. [Google Scholar] [CrossRef]
- Maddalena, R.; Hall, C.; Hamilton, A. Effect of silica particle size on the formation of calcium silicate hydrate [C-S-H] using thermal analysis. Thermochim. Acta 2019, 672, 142–149. [Google Scholar] [CrossRef]
- Maas, A.J.; Ideker, J.H.; Juenger, M.C. Alkali silica reactivity of agglomerated silica fume. Cem. Concr. Res. 2007, 37, 166–174. [Google Scholar] [CrossRef]
- Katzer, J.; Halbiniak, J.; Langier, B.; Major, M.; Major, I. Influence of varied waste ceramic fillers on the resistance of concrete to freeze–Thaw cycles. Materials 2021, 14, 624. [Google Scholar] [CrossRef]
- Seitl, S.; Viszlay, V.; Domski, J.; Katzer, J. Fracture Mechanical Properties of Cement Based Composites with Various Amount of Waste Aggregates. Procedia Eng. 2017, 190, 345–351. [Google Scholar] [CrossRef]
- Seitl, S.; Miarka, P.; Šimonová, H.; Domski, J.; Katzer, J. Change of fatigue and mechanical fracture properties of a cement composite due to partial replacement of aggregate by red ceramic waste. Period. Polytech. Civ. Eng. 2019, 63, 152–159. [Google Scholar] [CrossRef]
- Silica Fume Market in India by Application and Source—Forecast and Analysis 2020–2024. Available online: https://www.technavio.com (accessed on 16 November 2019).
- Wu, Z.; Shi, C.; Khayat, K.H. Influence of silica fume content on microstructure development and bond to steel fiber in ultra-high strength cement-based materials (UHSC). Cem. Concr. Compos. 2016, 71, 97–109. [Google Scholar] [CrossRef] [Green Version]
- Khatri, R.P.; Sirivivatnanon, V.; Gross, W. Effect of different supplementary cementitious materials on mechanical properties of high performance concrete. Cem. Concr. Res. 1995, 25, 209–220. [Google Scholar] [CrossRef]
- Mindess, S.; Young, J.F.; Darwin, D. Concrete, 2nd ed.; Prentice Hall: Hoboken, NJ, USA; Pearson Education Inc.: Hoboken, NJ, USA, 2003; p. 07458. [Google Scholar]
- Arora, R.; Kumar, K.; Dixit, S.; Mishra, L. Analyze the outcome of waste material as cement replacement agent in basic concrete. Mater. Today Proc. 2021, 56, 1877–1881. [Google Scholar] [CrossRef]
- Dixit, S.; Sharma, K. An Empirical Study of Major Factors Affecting Productivity of Construction Projects. In Lecture Notes in Civil Engineering; Springer: Singapore, 2020; Volume 61. [Google Scholar] [CrossRef]
- Dixit, S.; Singh, S.; Singh, S.; Varghese, R.G.; Pandey, A.K.; Varshney, D. Role of Solar Energy and Issues in Its Implementation in the Indian Context; ICDAMS, Saveetha School of Engineering: Chennai, India, 2018; Volume 172, p. 06001. [Google Scholar] [CrossRef]
- Dixit, S. Analysing the Impact of Productivity in Indian Transport Infra Projects. In IOP Conference Series: Materials Science and Engineering; IOP Publishing: Bristol, UK, 2022; Volume 1218, p. 12059. [Google Scholar]
- Dixit, S.; Arora, R.; Kumar, K.; Bansal, S.; Vatin, N.; Araszkiewicz, K.; Epifantsev, K. Replacing E-waste with coarse aggregate in architectural engineering and construction industry. Mater. Today Proc. 2021, 56, 2353–2358. [Google Scholar] [CrossRef]
- Dixit, S.; Mandal, S.N.; Thanikal, J.V.; Saurabh, K. Evolution of studies in construction productivity: A systematic literature review (2006–2017). Ain Shams Eng. J. 2019, 10, 555–564. [Google Scholar] [CrossRef]
- Dixit, S.; Sharma, K.; Ingh, S. Identifying and Analysing Key Factors Associated with Risks in Construction Projects. In Emerging Trends in Civil Engineering; Babu, K.G., Rao, H.S., Amarnath, Y., Eds.; Singapore: Singapore, 2020; pp. 25–32. [Google Scholar]
- Dixit, S.; Stefańska, A. Digitisation of contemporary fabrication processes in the AEC sector. Mater. Today Proc. 2021, 56, 1882–1885. [Google Scholar] [CrossRef]
- Dixit, S.; Stefańska, A.; Singh, P. Manufacturing technology in terms of digital fabrication of contemporary biomimetic structures. Int. J. Constr. Manag. 2021, 1–9. [Google Scholar] [CrossRef]
- Kumar, K.; Arora, R.; Khan, S.; Dixit, S. Characterization of fly ash for potential utilization in green concrete. Mater. Today Proc. 2021, 56, 1886–1890. [Google Scholar] [CrossRef]
- Rai, R.K.; Gosain, A.K.; Singh, P.; Dixit, S. Farm Advisory Services for Farmers Using SWAT and APEX Model. In International Conference Sustainable Energy Systems: Innovative Perspectives; Springer: Cham, Switzerland, 2020; pp. 444–458. [Google Scholar]
- Shah, M.N.; Dixit, S.; Kumar, R.; Jain, R.; Anand, K. Causes of delays in slum reconstruction projects in India. Int. J. Constr. Manag. 2019, 21, 452–467. [Google Scholar] [CrossRef]
- Singh, P.; Dixit, S.; Sammanit, D.; Krishnan, P. The Automated Farmlands of Tomorrow: An IoT Integration with Farmlands. In IOP Conference Series: Materials Science and Engineering; IOP Publishing: Bristol, UK, 2022; Volume 1218, p. 12048. [Google Scholar]
- Singh, S.; Dixit, S.; Sahai, S.; Sao, A.; Kalonia, Y.; Kumar, R.S. Key Benefits of Adopting Lean Manufacturing Principles in Indian Construction Industry. MATEC Web Conf. 2018, 172, 05002. [Google Scholar] [CrossRef] [Green Version]
- Erdem, T.K.; Kırca, Ö. Use of binary and ternary blends in high strength concrete. Constr. Build. Mater. 2008, 22, 1477–1483. [Google Scholar] [CrossRef]
- Soliman, N.A.; Tagnit-Hamou, A. Partial substitution of silica fume with fine glass powder in UHPC: Filling the micro gap. Constr. Build. Mater. 2017, 139, 374–383. [Google Scholar] [CrossRef]


| Sr. No. | Physical Properties | Materials and Measure | Unit | |
|---|---|---|---|---|
| Silica Fume | Waste-Glass Powder | |||
| 1 | Particle Size Distribution | <1 | 10–250 | µm |
| 2 | Specific Gravity | 2.22 | 2.94 | - |
| 3 | Bulk Density | 380 | 2540 | kg/m3 |
| 4 | Color | Grey | White | - |
| 5 | Surface area | 16,000 | 3130 | m2/kg |
| Entity | Proportion |
|---|---|
| Cement (kg/m3) | 399.2 |
| Fine Aggregate (kg/m3) | 672.8 |
| Coarse Aggregate (kg/m3) | 1097.2 |
| Water (Litres/m3) | 191.6 |
| Water Cement Ratio | 0.48 |
| Mix Ratio | 1:1.5:3 |
| Proportion | M 20 |
| Mix Designation | Cement | Glass Powder/Silica Fume | Fine Aggregate | Coarse Aggregate |
|---|---|---|---|---|
| Mx-0 | 100% | 0% | 100% | 100% |
| WMx-1/SMx-1 | 95% | 5% | 100% | 100% |
| WMx-2/SMx-2 | 90% | 10% | 100% | 100% |
| WMx-3/SMx-3 | 85% | 15% | 100% | 100% |
Publisher’s Note: MDPI stays neutral with regard to jurisdictional claims in published maps and institutional affiliations. |
© 2022 by the authors. Licensee MDPI, Basel, Switzerland. This article is an open access article distributed under the terms and conditions of the Creative Commons Attribution (CC BY) license (https://creativecommons.org/licenses/by/4.0/).
Share and Cite
Kumar, K.; Dixit, S.; Arora, R.; Vatin, N.I.; Singh, J.; Soloveva, O.V.; Ilyashenko, S.B.; John, V.; Buddhi, D. Comparative Analysis of Waste Materials for Their Potential Utilization in Green Concrete Applications. Materials 2022, 15, 4180. https://doi.org/10.3390/ma15124180
Kumar K, Dixit S, Arora R, Vatin NI, Singh J, Soloveva OV, Ilyashenko SB, John V, Buddhi D. Comparative Analysis of Waste Materials for Their Potential Utilization in Green Concrete Applications. Materials. 2022; 15(12):4180. https://doi.org/10.3390/ma15124180
Chicago/Turabian StyleKumar, Kaushal, Saurav Dixit, Rishabh Arora, Nikolai Ivanovich Vatin, Jarnail Singh, Olga V. Soloveva, Svetlana B. Ilyashenko, Vinod John, and Dharam Buddhi. 2022. "Comparative Analysis of Waste Materials for Their Potential Utilization in Green Concrete Applications" Materials 15, no. 12: 4180. https://doi.org/10.3390/ma15124180