Article

The Auto-Combustion Method Synthesized Eu2O3- ZnO Nanostructured Composites for Electronic and Photocatalytic Applications

1
Laboratory of Nano-Smart Materials for Science and Technology (LNSMST), Department of Physics, Faculty of Science, King Khalid University, P.O. Box 9004, Abha 61413, Saudi Arabia
2
Department of Chemistry, Faculty of Education, Ain Shams University, Roxy, Cairo 11757, Egypt
3
Nanoscience Laboratory for Environmental and Bio-Medical Applications (NLEBA), Semiconductor Laboratory, Metallurgical Lab, Department of Physics, Faculty of Education, Ain Shams University, Roxy, Cairo 11757, Egypt
4
Research Unit, Physics of Insulating and Semi-insulating Materials, Faculty of Sciences, University of Sfax, B.P. 1171, Sfax 3000, Tunisia
5
Preparatory Year Program, Shaqra University, Al-Quwayiyah Branch, Sahqra 19248, Saudi Arabia
6
Materials Science and Nanotechnology Department, Faculty of Postgraduate Studies for Advanced Sciences, Beni-Suef University, Beni-Suef 62511, Egypt
7
Research Center for Advanced Materials Science (RCAMS), King Khalid University, P.O. Box 9004, Abha 61413, Saudi Arabia
8
Department of Chemistry, Faculty of Sciences and Arts Touhama, King Khaled University, Muhayil Asir 63311, Saudi Arabia
9
Electrochemistry, Materials, and Environment, Preparatory Institute for Engineering Studies, Kairouan 3100, Tunisia
*
Authors to whom correspondence should be addressed.
Materials 2022, 15(9), 3257; https://doi.org/10.3390/ma15093257
Submission received: 5 March 2022 / Revised: 10 April 2022 / Accepted: 25 April 2022 / Published: 1 May 2022
(This article belongs to the Topic Advanced Nanomaterials for Sensing Applications)

Abstract

:
An efficient and environmentally friendly combustion technique was employed to produce ZnO nanopowders with different Eu concentrations (from 0.001 g to 5 g). The structural morphology of the Eu2O3-ZnO nanocomposites was examined using XRD, SEM, and infrared spectroscopy (FT-IR). In addition, UV-Vis diffuse reflectance spectroscopy was also used to investigate the effects of europium (Eu) dopant on the optical behaviors and energy bandgaps of nano-complex oxides. The photocatalytic degradation efficiency of phenol and methylene blue was investigated using all the prepared Eu2O3-ZnO nanostructured samples. Photocatalytic effectiveness increased when europium (Eu) doping ratios increased. After adding moderate Eu, more hydroxyl radicals were generated over ZnO. The best photocatalyst for phenol degradation was 1 percent Eu2O3-ZnO, while it was 0.5 percent Eu2O3-ZnO for methylene blue solutions. The obtained Eu2O3-doped ZnO nanostructured materials are considered innovative, promising candidates for a wide range of nano-applications, including biomedical and photocatalytic degradation of organic dyes and phenol.

1. Introduction

Recently, more attention has been paid to wastewater treatment for human society. Phenolics are particular contaminants frequently produced from a wide range of industrial products, including textiles, pesticides, gunpowder, dyes, and plastics [1,2]. Most of these compounds cause severe damage in various natural areas, in which phenols are difficult to remove using traditional organic treatment techniques due to their high stability and toxicity [3,4]. ZnO exhibits remarkable properties, including high electrochemical coupling, high chemical stability, low dielectric constant, and high exciton binding energy of about 60 meV. It also shows a broad bandgap (approximately 3.37 eV at room temperature), sufficient binding, thermal conductivity, and UV protection [5,6]. ZnO films are also thought to be high-transparency materials, with refractive indices ranging from infrared (IR) to visible. As a result, many ZnO-based materials are widely used in different technical products, such as UV light emitters, windows for solar cells, thin-film transistors, biological and chemical gas sensors, biomedical gas sensors, and varistors [7]. Among these properties, ZnO has also been an excellent candidate for photocatalyst applications in wastewater treatment due to its highly photocatalytic characteristic with ultraviolet (UV) light [8,9,10]. Several synthesis methods have been studied to increase ZnO photocatalytic properties, including sol-gel, solid-state reaction, and solvothermal [11,12,13]. In addition, different non-metal or metal dopants have been doped into a pure ZnO matrix to improve its optical, chemical, and physical properties [14,15,16].
When pure ZnO is doped with different rare earth elements such as La3+, Nd3+, Dy3+, Sm3+, and Ce3+, it increases the efficiency of photocatalytic studies [17,18]. Consequently, ZnO doped with europium offers a practical approach to photocatalytic behavior since electron trapping is significantly effective through Eu2+ and Eu3+ valence sites [19]. Yang and Yu et al. [20,21] prepared to enhance the photocatalytic effects of hydrothermal synthesized Eu3+-ZnO nanostructured materials. Additionally, Phuruangrat et al. applied the sonochemical approach to manufacture Eu-doped ZnO nanomaterials to investigate structure morphology and photocatalytic behaviors. It was shown that the dopant with 3 mol% Eu had the highest efficiency of photocatalytic activities [22]. Importantly, ZnO-Eu nanostructures have been designed to promote photocatalytic activity, display transparent coatings, and improve UV emissions from photoluminescence (PL) [23,24]. In addition, several studies have considered europium (Eu) rare earth elements to be utilized to enhance the optical parameters of ZnO [25]. Europium compounds are also utilized in computer monitoring, neutron scintillators, X-ray screens, mercury vapor lamps with significant intensity, detectors for charged parts, and optically read memory systems [26,27]. In addition to these properties, there are some challenges involved in preparing Eu2O3-doped ZnO nanostructures. Europium is the rarest and most expensive rare earth element (REE), representing only 0.05–0.1% of REEs in inorganic monazite. The most significant behavior of the Eu element is its luminescence, which can be described by way of light emissions, which are, significantly the energy absorption of the material [27]. This behavior controls the primary Eu usage in various potential applications, such as phosphorus, emitting colored light via electroluminescent procedures, and computer and television displays. In addition, many scientists have utilized luminescence spectroscopy based on europium ions to elucidate the structure of natural and synthetic compounds [27]. Although some reports are available on photocatalytic studies of Eu2O3-doped ZnO nanostructures [20,21,22], there is still a lack of systematic studies on the structural, morphological, spectral, and photodegradation properties of Eu2O3-doped ZnO nanostructures. Nonetheless, based on the most special properties of Eu2O3, the present study used the combustion method to prepare Eu2O3-ZnO nanostructures for enhancing photocatalytic properties.
Further, X-ray diffraction (XRD) and scanning electron microscopy (SEM) were used to characterize the structural morphology of the Eu2O3-doped ZnO materials. The improvements of ZnO optical characteristics with europium (Eu) were investigated using UV-Vis diffuse reflectance spectroscopy (DR) and Fourier transformation infrared spectroscopy (FT-IR) at varying concentrations ranging from 0.001 g to 5 g. Finally, the photocatalytic performance of visible photodegradation of ZnO and Eu2O3-doped ZnO was estimated using Ph and MB concerning illumination time.

2. Experimental Techniques

2.1. Material Growth

In this work, we synthesized ZnO nanoparticles (NPs) doped with europium rare earth metal (Eu2O3) using a combustion process. Initially, 5 g of Zn(NO3)2·6H2O was mixed and well ground in ceramic crucibles with one gram of gum acacia. Next, eight concentrations of europium (III) nitrate elements ranging from 0.001 g to 5 g were added to the previous mixture, liquified in 5 mL of distilled water, and then kept at 100 °C for 48 h until a completely dried gel formed. After that, the dried gel’s combustion process was applied without further purification at 600 °C for two hours before being cooled at ambient temperature. Gum acacia was used as a fuel in this preparation procedure to help convert the ZnO structure from crystallinity to nanoscale by expanding its elements within the matrix. Table 1 illustrates the abbreviations assigned to the prepared samples as S0 to S7, respectively.

2.2. Devices and Measurements

The crystal structure of the prepared samples was characterized using a Shimadzu LabX-XRD-6000 X-ray diffractometer, Kyoto, Japan, with CuKα = 1.54 Å radiation in the angle range from 5° to 80°. A JSM-6360 scanning electron microscopy (SEM) with an operating voltage of 20 kV (JEOL, Tokyo, Japan) was used to analyze the morphology of the prepared nanoparticles. Moreover, the ultraviolet-visible spectra of all prepared samples were measured using a UV-3600 UV-Vis spectrophotometer (Shimadzu, Kyoto, Japan), with a wavelength range from 2200 nm to 1600 nm and a step scan of 5 nm. A Thermo Scientific DXR FT-IR Spectrometer was used to study the Fourier transform infrared (FT-IR) spectra of Eu2O3-doped ZnO nanocomposites in the wavenumber range from 400 to 4000 cm−1.

2.3. Photocatalytic Measurements

Different types of organic pollutants, such as methylene blue and phenol, were used in a thermostatic photoreactor fitted with a multi-position magnetic stirrer for photocatalytic measurements.

2.3.1. Design of the Ultraviolet-Visible Photoreactor

A wooden photoreactor was used to test the visible photocatalytic operation of all samples under investigation for industrial wastewater treatment under different experimental conditions [28]. The reactor is divided into two portions on the inside and outside. A hardwood frame of 100 cm in height, 95 cm in length, and 65 cm in width makes up the exterior component. In the inner part, seven white (400–700 nm) bulbs and seven blue (18 watts) lamps, each having a spectrum higher than 420 nm, are individually controlled. The wavelength of the visible lamp is larger than 420 nm and for the UVA lamp is 367 nm. The intensity of visible and UVA lamps is 18 watts each. The system is controlled primarily by ON/OFF buttons. The air fan is also attached to the photoreactor for an internal circulating air system to maintain the photoreactor temperature at room temperature. A magnetic stirrer with a multi-position was used to stir the prepared solution.

2.3.2. Photocatalytic Irradiation

The prepared samples of 0.01 g of each doping concentration were dissolved in 100 mL of organic solution, either MB or Ph, with the attention of 20 mg/L. The complete setup was kept in the dark for around 30 min to examine chemisorption until the equilibrium state was obtained. After a 10-min interval of irradiation, 1 mL of the solution sample was withdrawn and centrifuged at 3000 rpm to remove all powder suspension. The remainder of the mixture was exposed to visible light again. The sample activity was measured every 15 min during the irradiation. To investigate the main oxidant species of the photocatalytic reaction, photocatalytic experiments were also carried out on different scavengers. Moreover, following up on the dependency of the photocatalytic performance on light irradiation and its mechanism, trapping experiments with visible-light irradiation for the active species produced during the photodegradation reaction were notably studied. Different agents, including sodium chloride (Cl), sodium nitrate (NO3), isopropyl alcohol (IPA), and ascorbic acid (AA), were employed as the scavengers for h+, e, OH, and O2, respectively. Finally, the photodegradation process was detected using a UV-Vis spectrophotometer (200–800 nm).
The Scherrer equation was employed to investigate the XRD data and the crystallite size (D) of the prepared Eu2O3-doped ZnO nanocomposites [29,30].
D = 0.9 λ / β cos θ
Separately, the dislocation density ( η ), as well as lattice strain (ε) of the pure ZnO and Eu2O3-doped ZnO, were evaluated using the coming expressions [31,32]:
η = 1 / D 2
ε = β cos θ / 4
where λ is the X-ray wavelength in the unit of nm, β is the full width at half maximum (FWHM) in terms of radians, and θ is the diffraction angle in the degree unit. Dislocations are imperfections in a crystal related to the misregister of the lattice in one part of the crystal concerning another part.
Tauc’s model was used to calculate the optical bandgap (Eg) of pure and Eu2O3-doped ZnO nanostructured samples using the following equations [29,33]:
F ( R ) = ( 1 R ) 2 2 R = K S
α = F ( R ) t
( α h ν ) 1 / n = A 1 / n ( h ν E g )
Here, F(R) represents the material reflectivity using the Kubelka–Munk model, R is reflectance, K is the molar absorption coefficient, and S is the scattering quantity. In Equations (5) and (6), α is the absorption index; t is the material thickness; ν is the photon frequency; h is the Planck constant; A is the band tailing factor, with values ranging from 1 × 105 cm−1·eV−1 to 1 × 106 cm−1·eV−1; and Eg is a bandgap [34]. In addition, the values of n in Equation (6) are either n = ½ for direct optical bandgaps or n = 2 for indirect optical bandgaps of the studied samples determined by using the following relations:
( α h ν ) 2 = A 2 ( h ν E g )
( α h ν ) 1 / 2 = A 1 / 2 ( h ν E g )
The catalytic efficiency of the prepared samples was estimated from the degradation (%) and the process rate [35]:
% of degradation = (C0C/C0) × 100%,
where C0 is the starting concentration of MB or Ph and C is noted as the concentration of the MB or Ph at various times. The photocatalytic degradation reaction is a virtual first-order reaction, as the pollutant’s concentrations are within the millimolar range [35]:
ln (C/C0) = kt,
where k is the constant amount and t is the irradiation time in minutes.
The reaction between electrons and the adsorbed H2O is illustrated in the following expressions [36,37,38,39,40]:
ZnO + h+ → ZnO(e) + ZnO(h+),
e + Eu3+ → Eu2+,
Eu2+ + O2 → Eu3+ + O2•−,
e + V0++ → V0+,
V0+ + O2 → O2•−,
e + O2•− + 2H+ → H2O2,
e + H2O2 → OH + OH,
Simultaneously, the VB photogenerated holes undergo trapping with the surface group of hydroxyls, reacting with ionized oxygen defects or reacting with adsorbed water (H2O2) through transferring of interfacial charges, creating a highly radical reactive hydroxyl (OH) [41,42,43]:
h+ + (H2O H+ + OH) H+ + OH,

3. Results and Discussions

3.1. X-ray Diffraction (XRD) Pattern
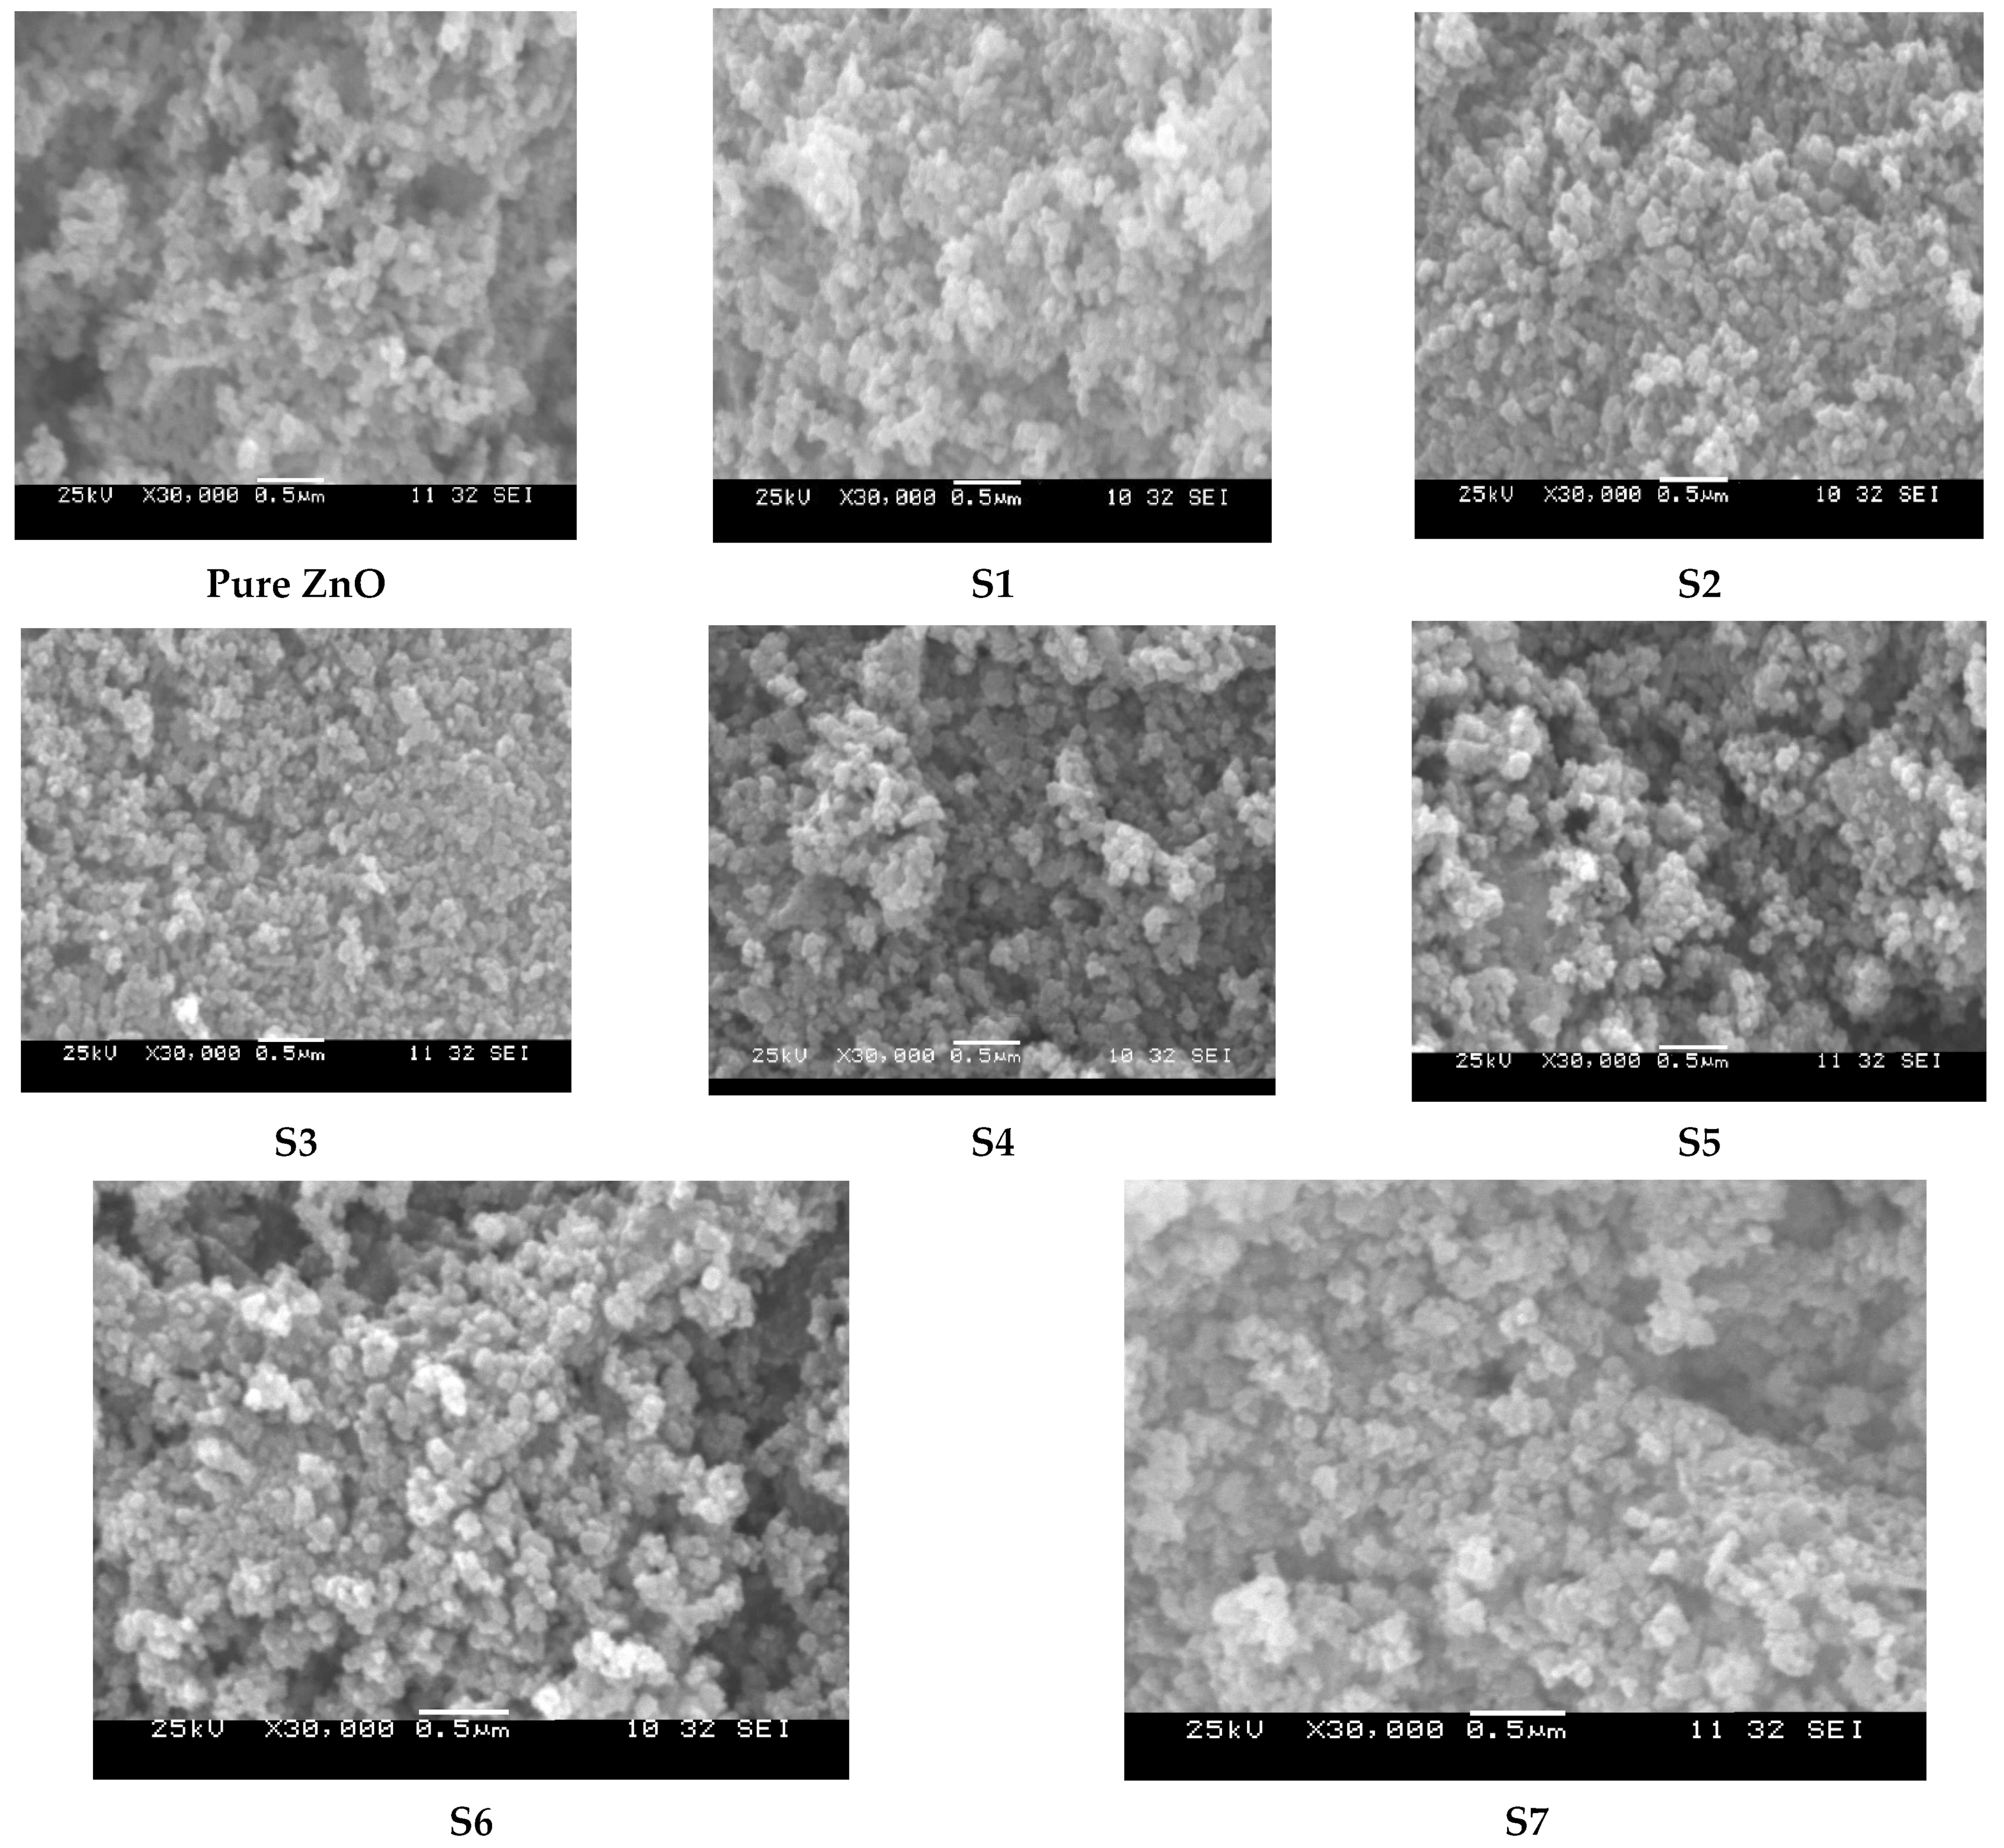
Figure 1 shows the measured XRD patterns of the pure and Eu2O3-doped ZnO nanostructures. It is clear that pure ZnO and Eu2O3-doped ZnO predominantly illustrated seven XRD peaks and confirmed the wurtzite phase, which is well-matched with JSPDS 01-075-0576. The critical diffraction peaks have the positions at 31.8°, 34.5°, 36.4°, 47.7°, 56.7°, 62.9°, 66.4° and 69.05° with the indices of (1 0 0), (0 0 2), (1 0 1), (1 0 2), (1 1 0), (1 0 3), (2 0 0), and (2 0 1) respectively. The observed diffraction peaks for pure ZnO nanoparticles outstandingly matched the data reported by Aydn et al. [29] and were similar to the reported data by Wang, R. H., et al. [30]. In the case of doping samples, the Eu2O3-ZnO phase does not appear at low doping, as shown in Table 2 and Figure 1, but does occur as the dopant concentration increases in the pure ZnO matrix. The reason could be explained by dislocations which are crystal flaws in one section of the crystal that cause the lattice to misregister as compared with another part. Further, all the calculated structural parameters of pure and doped samples are depicted in Table 2.
Fascinating features can be seen in the XRD patterns of the Eu2O3-ZnO nanostructures with the phase (JSPDS 00-034-0392) with the indices of (2 2 2), (2 1 1), (4 0 0), and (6 2 2). The prominent peaks corresponded to (1 0 0) and (1 0 1) planes that have been detected in all prepared nanomaterials. A slight shift of the (0 0 2) plane towards a value to the left at a higher concentration of doping samples than undoped ZnO material reveals that the content of europium (Eu) dopant significantly affects the crystalline structure of pure material. It is also observed from the XRD graphs that there is a formation of the Eu2O3 phase at higher concentrations, which suggests the effect of doping into the pure matrix. Furthermore, the mean crystallite size values of all prepared ZnO-doped Eu2O3 nanocomposites are diverse with variations in doping, in the range of 13–42 nm. In this current study, the attained grain size was in agreement with the published results for silver-ZnO nanomaterial by Wang, R. H. et al. [30]. The Scherrer formula calculated the mean grain size from the XRD spectra, ranging between 20.9 nm and 22.1 nm [30]. The evaluated crystallinity size noticeably increased with an increase in the dopant ratios.

3.2. SEM Analysis

Scanning electron microscopy (SEM) was used to study the morphology of Eu2O3-ZnO nanostructures, as illustrated in Figure 2. The structural morphology changes in the pure-ZnO matrix and the europium (Eu)-doped ZnO nanocomposites were directly recognizable. The SEM pictures of Eu2O3-ZnO nanocomposite powder exhibited a general homogeneous dispersion of spherical nanoparticles. The europium ions strongly formed tiny grains and promoted crystal nucleation, whereas the trapping of Eu grains hindered grain development. The europium ions created grains of small size (ranging between 75 and 89 nm) and encouraged the crystal nucleation rate, while the trapping of europium grains prevented grain development. This trend could be due to the discrepancy in ionic radius between zinc and europium [44]. The form and size of the nanoparticles changed as the amount of Eu doped in them grew, as illustrated in Table 2. The obtained SEM results closely matched the results of Chao, L. C., et al. [45].

3.3. Spectroscopic Analysis

Figure 3 shows the FT-IR spectra of the prepared samples in 400–4000 cm−1. The undoped ZnO sample’s optical transparency improved marginally compared to Eu doped samples. As the doping ratio for europium (Eu) increased, the transmission of Eu2O3-ZnO nano samples decreased, possibly due to increased scattering. In the FT-IR spectra, the highly intense broad absorption peak at around 438 cm−1 of the wavenumber was credited to the stretching vibrations in the pure ZnO matrix [46]. In addition, a wide absorbance band at about 3450 cm−1 characterized the O–H group’s stretching vibrations, while the small absorption peak at around 1635 cm−1 corresponded to the bending vibrations of the interlayered molecule. The surface caused the impurity bands of different higher wavenumber adsorbed organic matrices either in the synthesis procedure or the characterization. The impurity effects were extremely predominant for Eu nanoparticles because of the large ratio of surface to volume; however, those impurity bands gradually disappeared in the bulk materials [46]. As a result, the most excellent Eu2O3 doping ratios (i.e., 5 g) exhibit the highest absorbance, consistent with the structural morphology results from the XRD and SEM investigations. Furthermore, the observed effects were similar to those with the developments of Nd-doped ZnO nanocomposites reported by Chauhan et al. [46].

3.4. Optical Characterizations

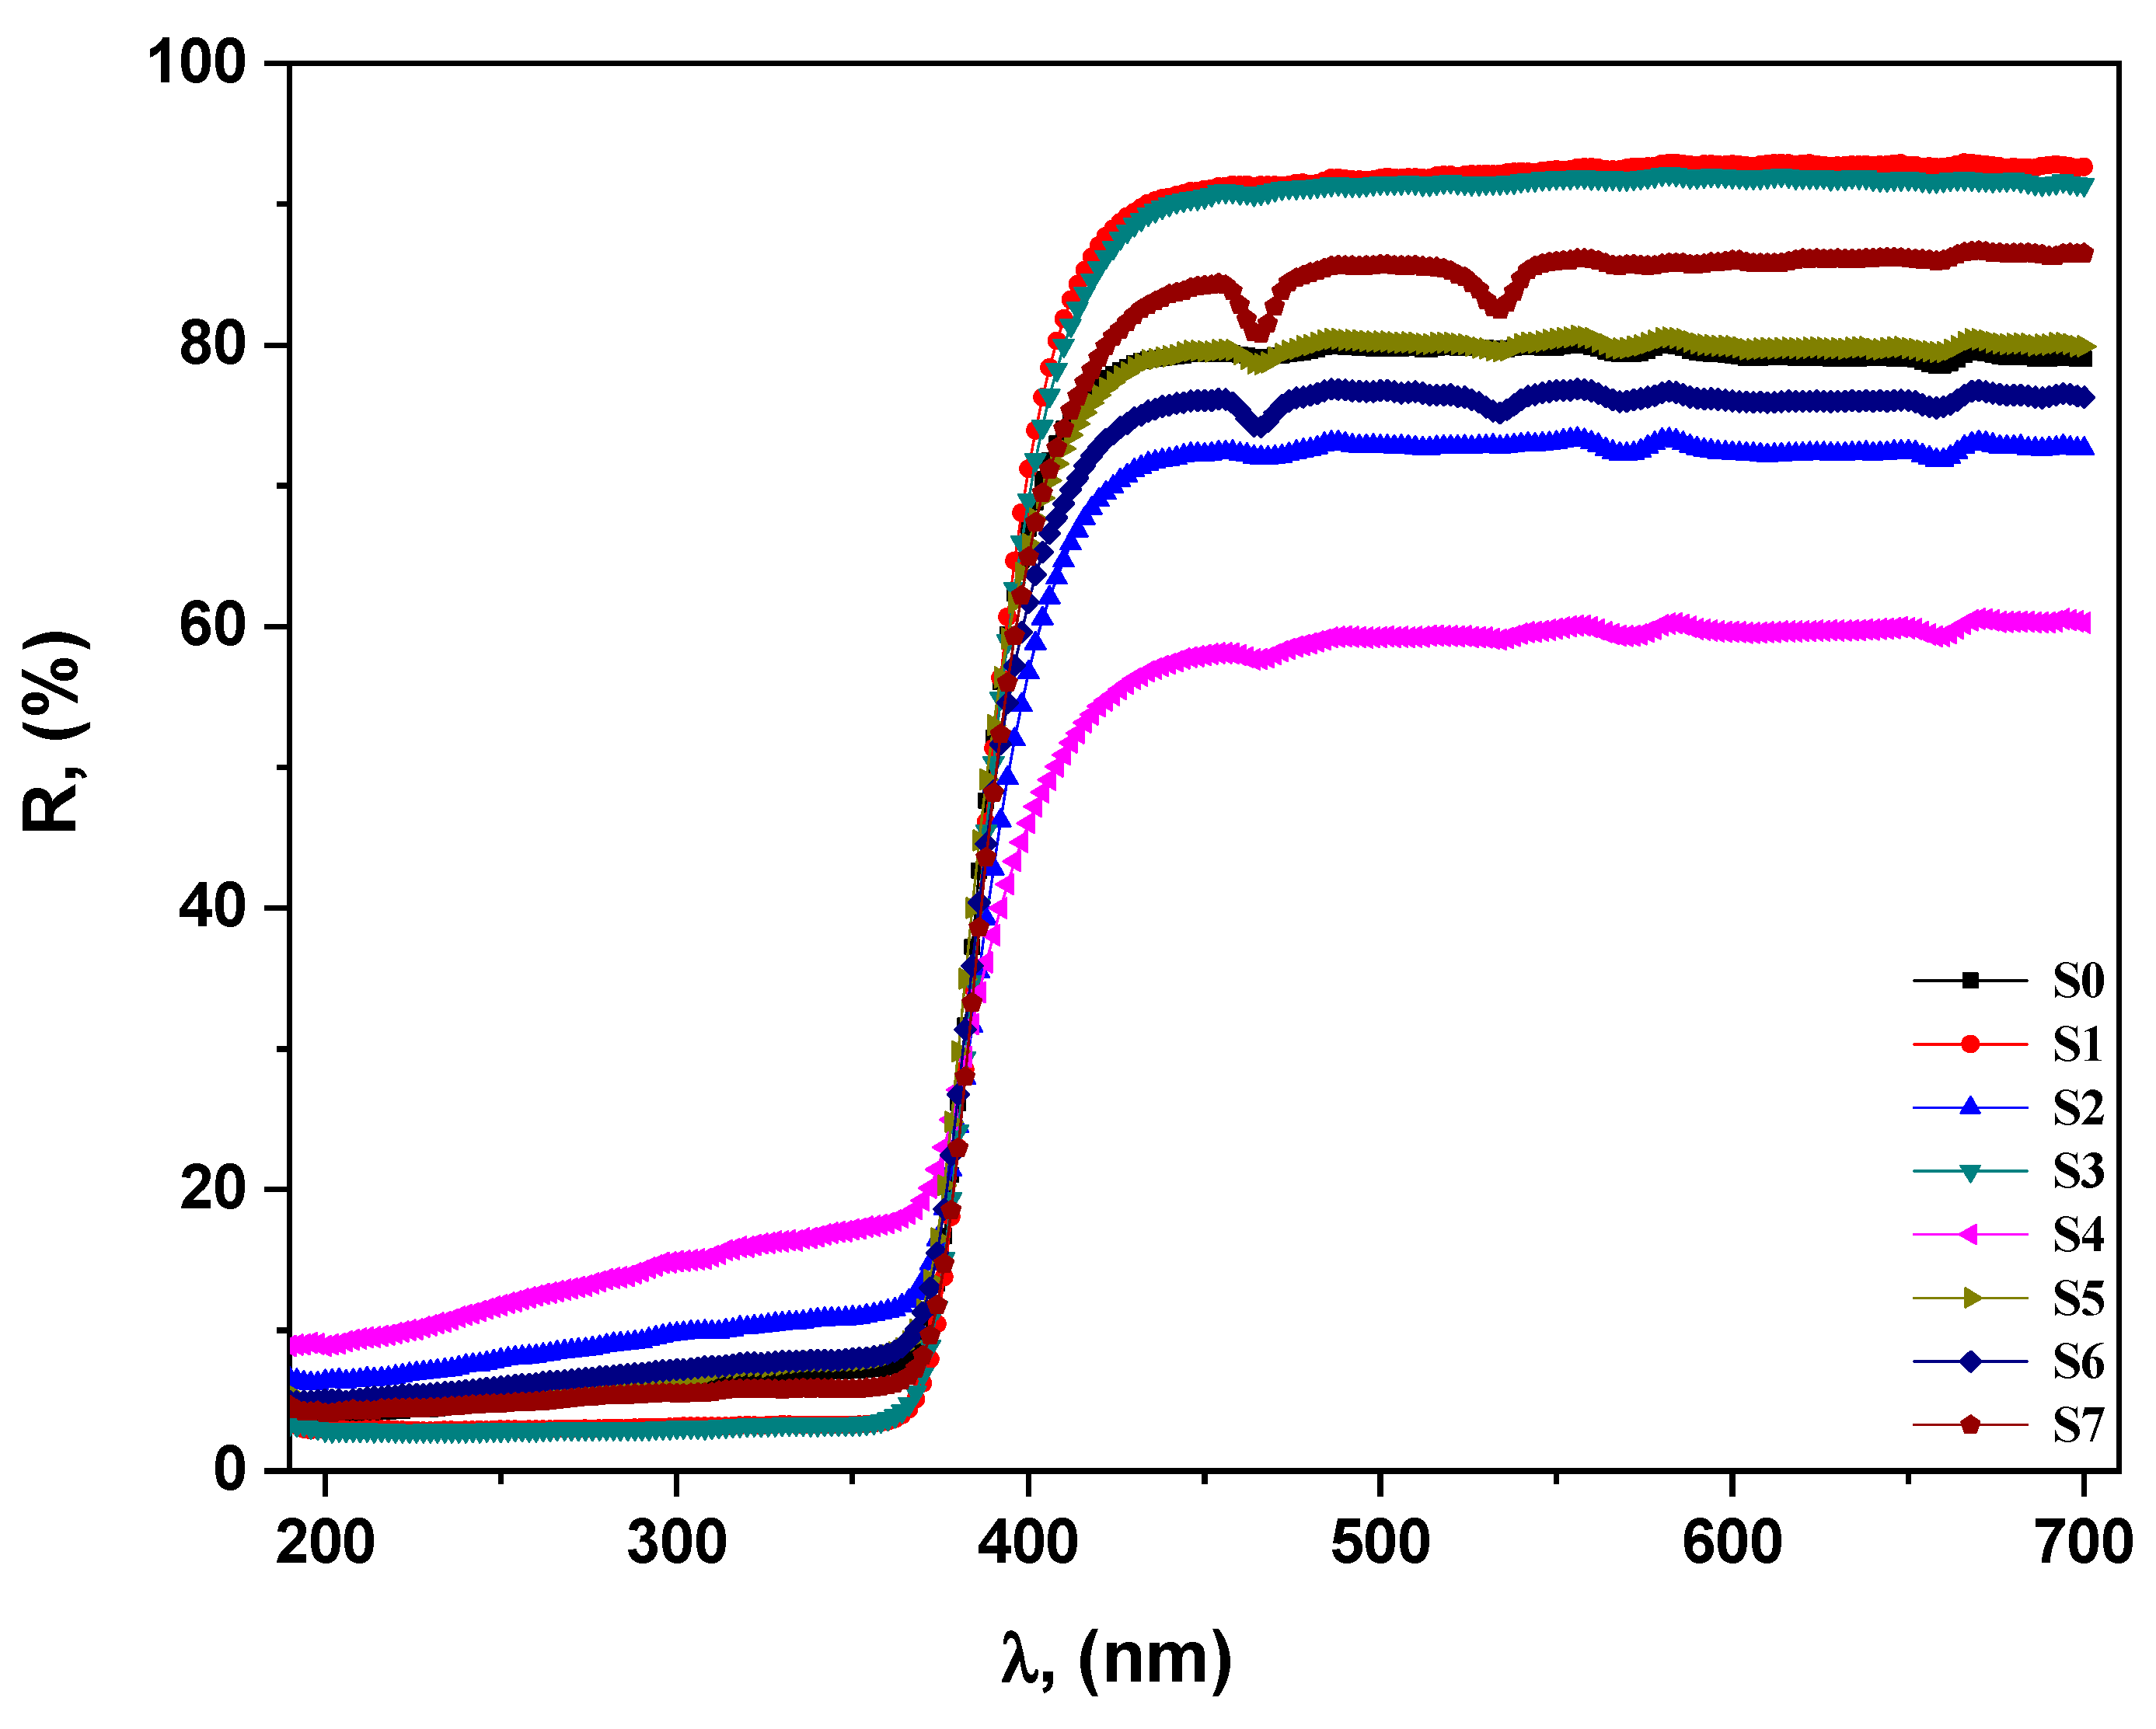
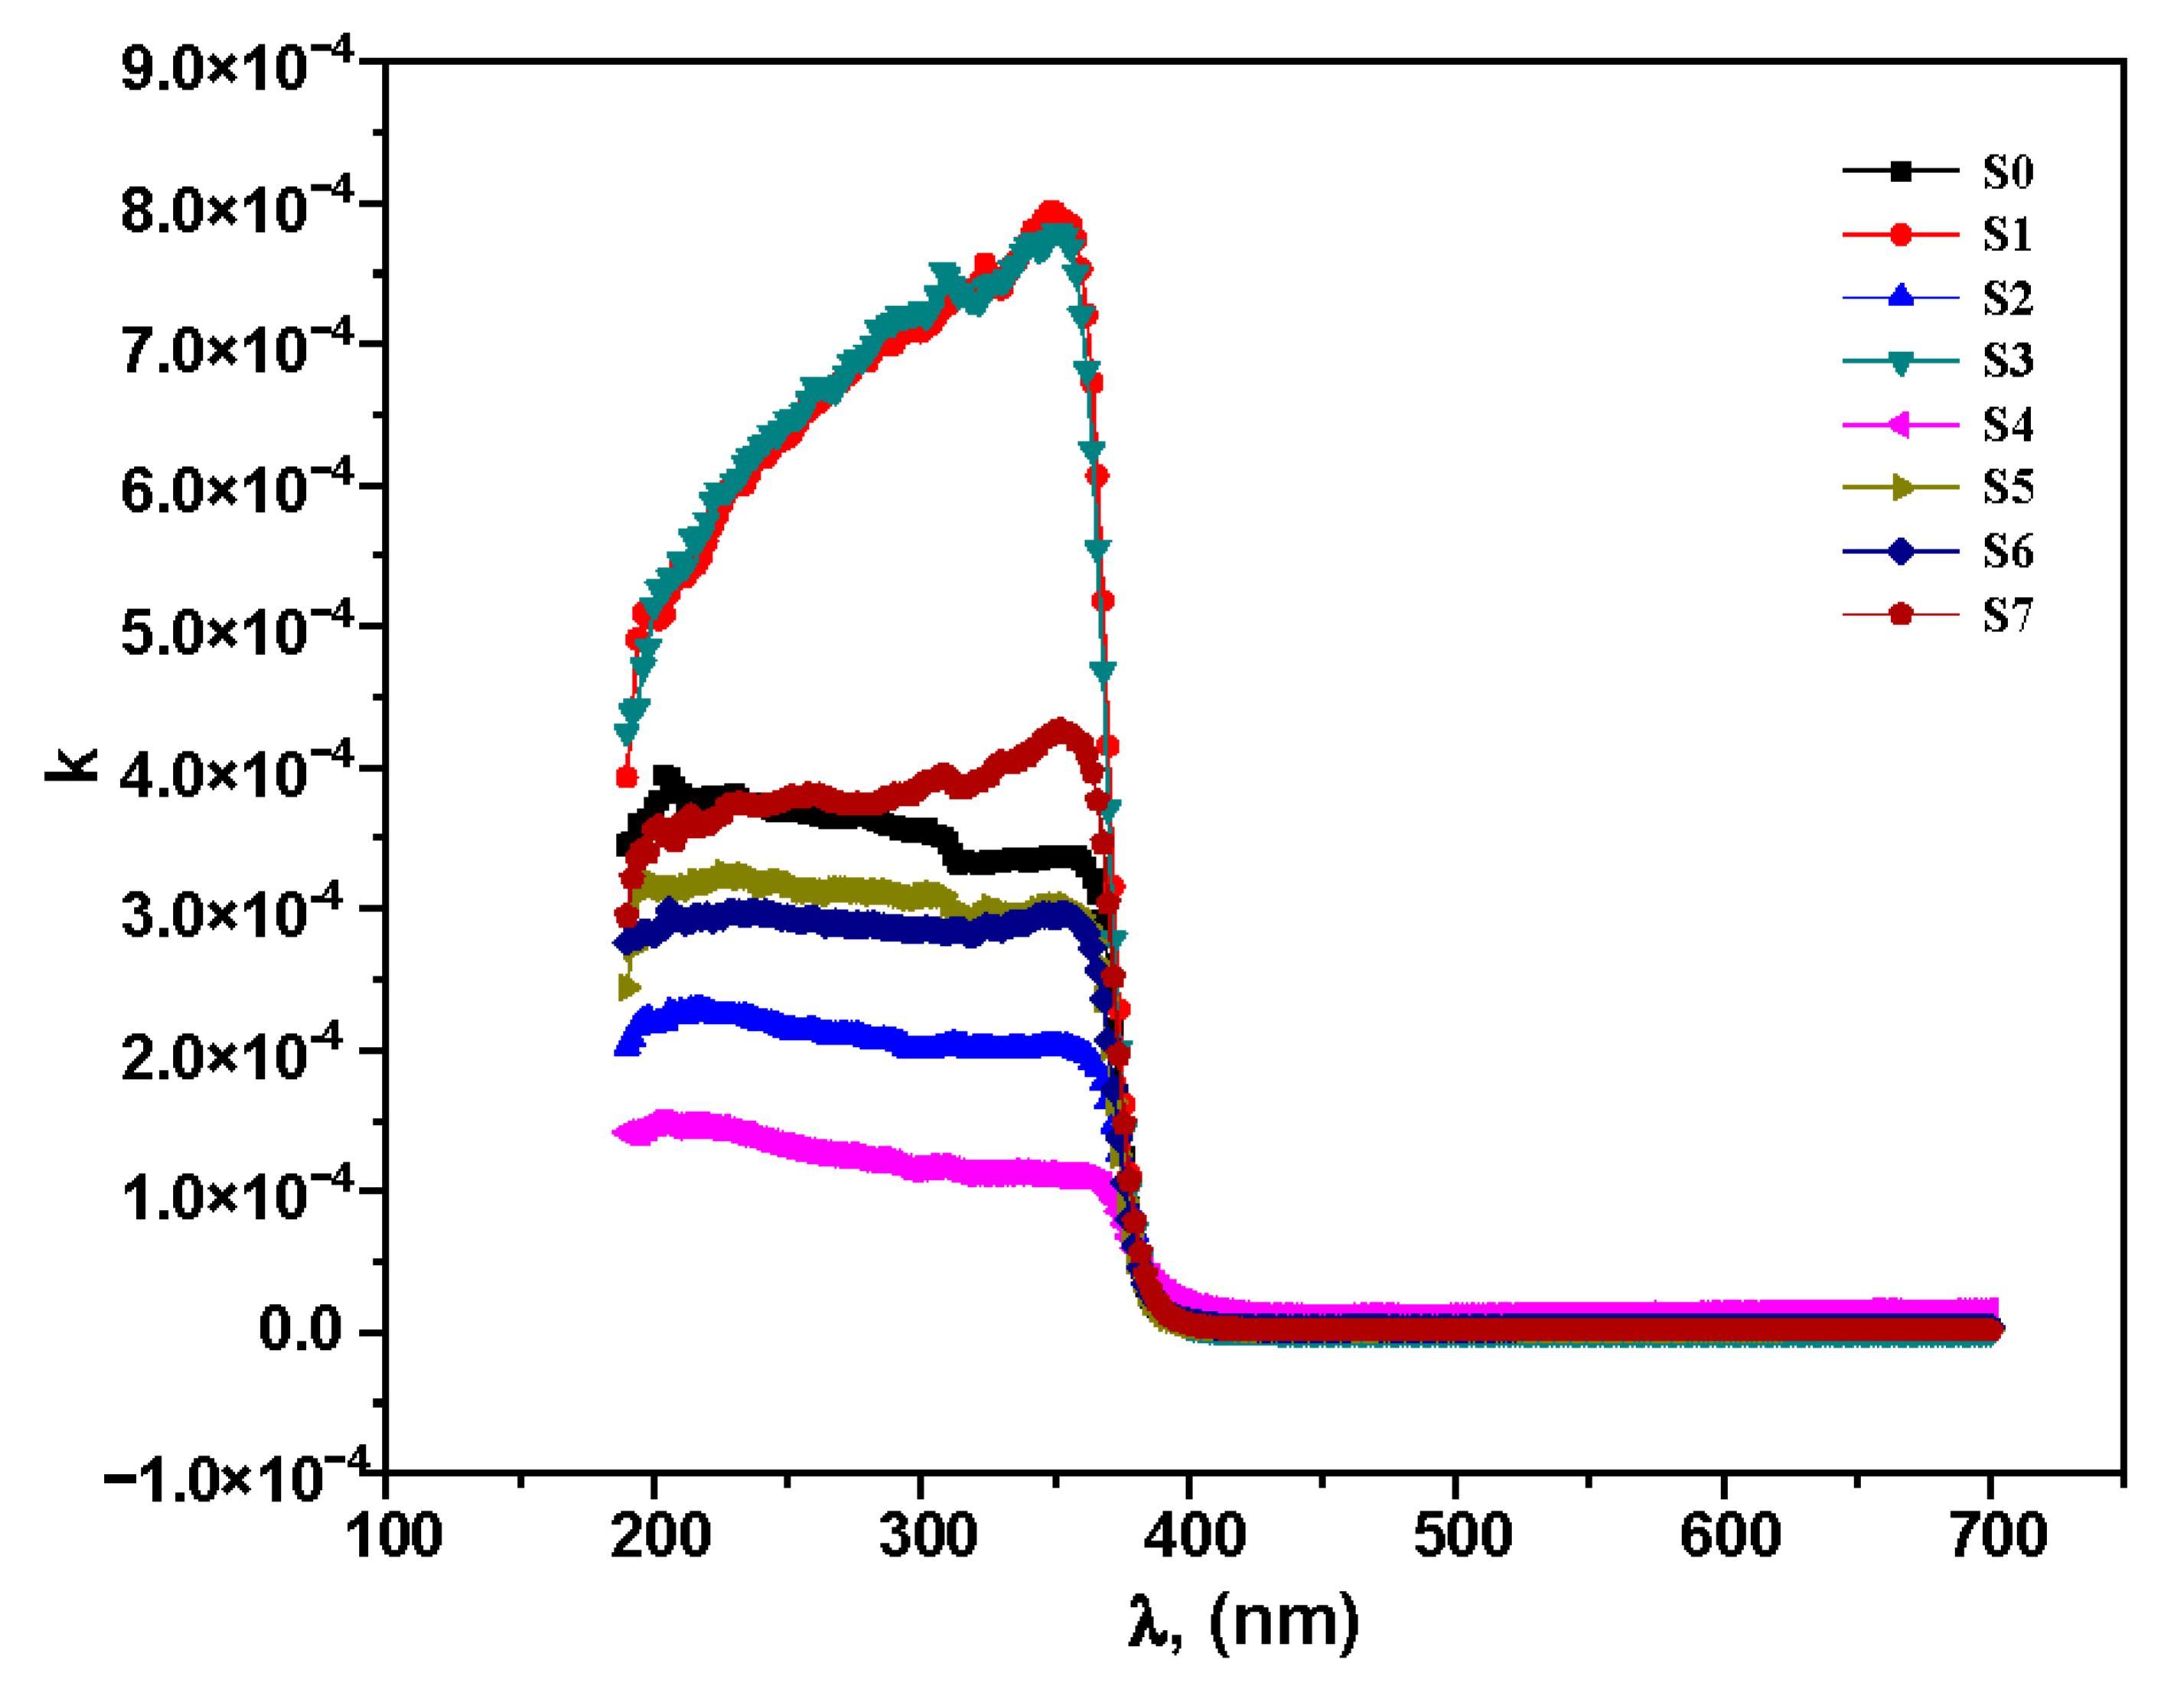
3.4.1. Optical Diffused Reflectance (ODR) and Absorption Index

Diffuse reflectance (DR) measurement is a well-known technique for obtaining information on the absorption properties of nanostructured materials. Figure 4 and Figure 5 show the optical diffused reflectance (ODR) and absorption index (k) of the Eu2O3-doped ZnO nanocomposites from 200 nm to 700 nm. From Figure 4, it can be observed that, in the range from 200 nm to 370 nm, no change in ODR data was monitored. However, a substantial increase in the ODR was seen from 370 nm to 410 nm, producing the optical bandgap. Within the wavelength range from 410 to 700 nm, the diffuse optical reflectance (ODR) spectra showed virtually straight curves with few variations.
The calculated ODR agreed with the reported optical results reported by Chaudhary et al. [23]. The optical properties showed that the absorption edges shifted toward the visible region [23]. The optical investigation of sol-gel prepared Nd-doped ZnO nanoparticles reported by Chao, L. C., et al. also demonstrated durable emission of band edge placed at the wavelength of 380 nm, where the defect emission was related to the deep level at about 620 nm wavelength [47]. In conclusion, the absorbed light generates a bandgap of optical absorption via the deliberate samples, which can be explained due to non-absorbent surface area and the predisposition of Eu2O3-ZnO nanocomposite materials to incident light [48,49]. Figure 5 shows a slightly small absorption index (k) of the examined Eu2O3-doped ZnO nano-samples, ranging between 1 × 10⁻⁴ and 8 × 10⁻⁴. The most outstanding absorption values are at a light wavelength of roughly 380 nm. The light will cause electrons to move from their ground state orbitals to higher-energy, excited state or antibonding orbitals. If the molecule has transitions in the ultraviolet (UV) or visible ranges of the electromagnetic spectrum, ultraviolet-visible spectroscopy can be used to determine the electronic transitions. Many molecular electronic transitions exist, i.e., σ     σ , π → π*, n     σ , n     π . Especially in the region of 200–800 nm, the three responsible transitions, i.e., π → π*, n     σ , n     π , [50,51].

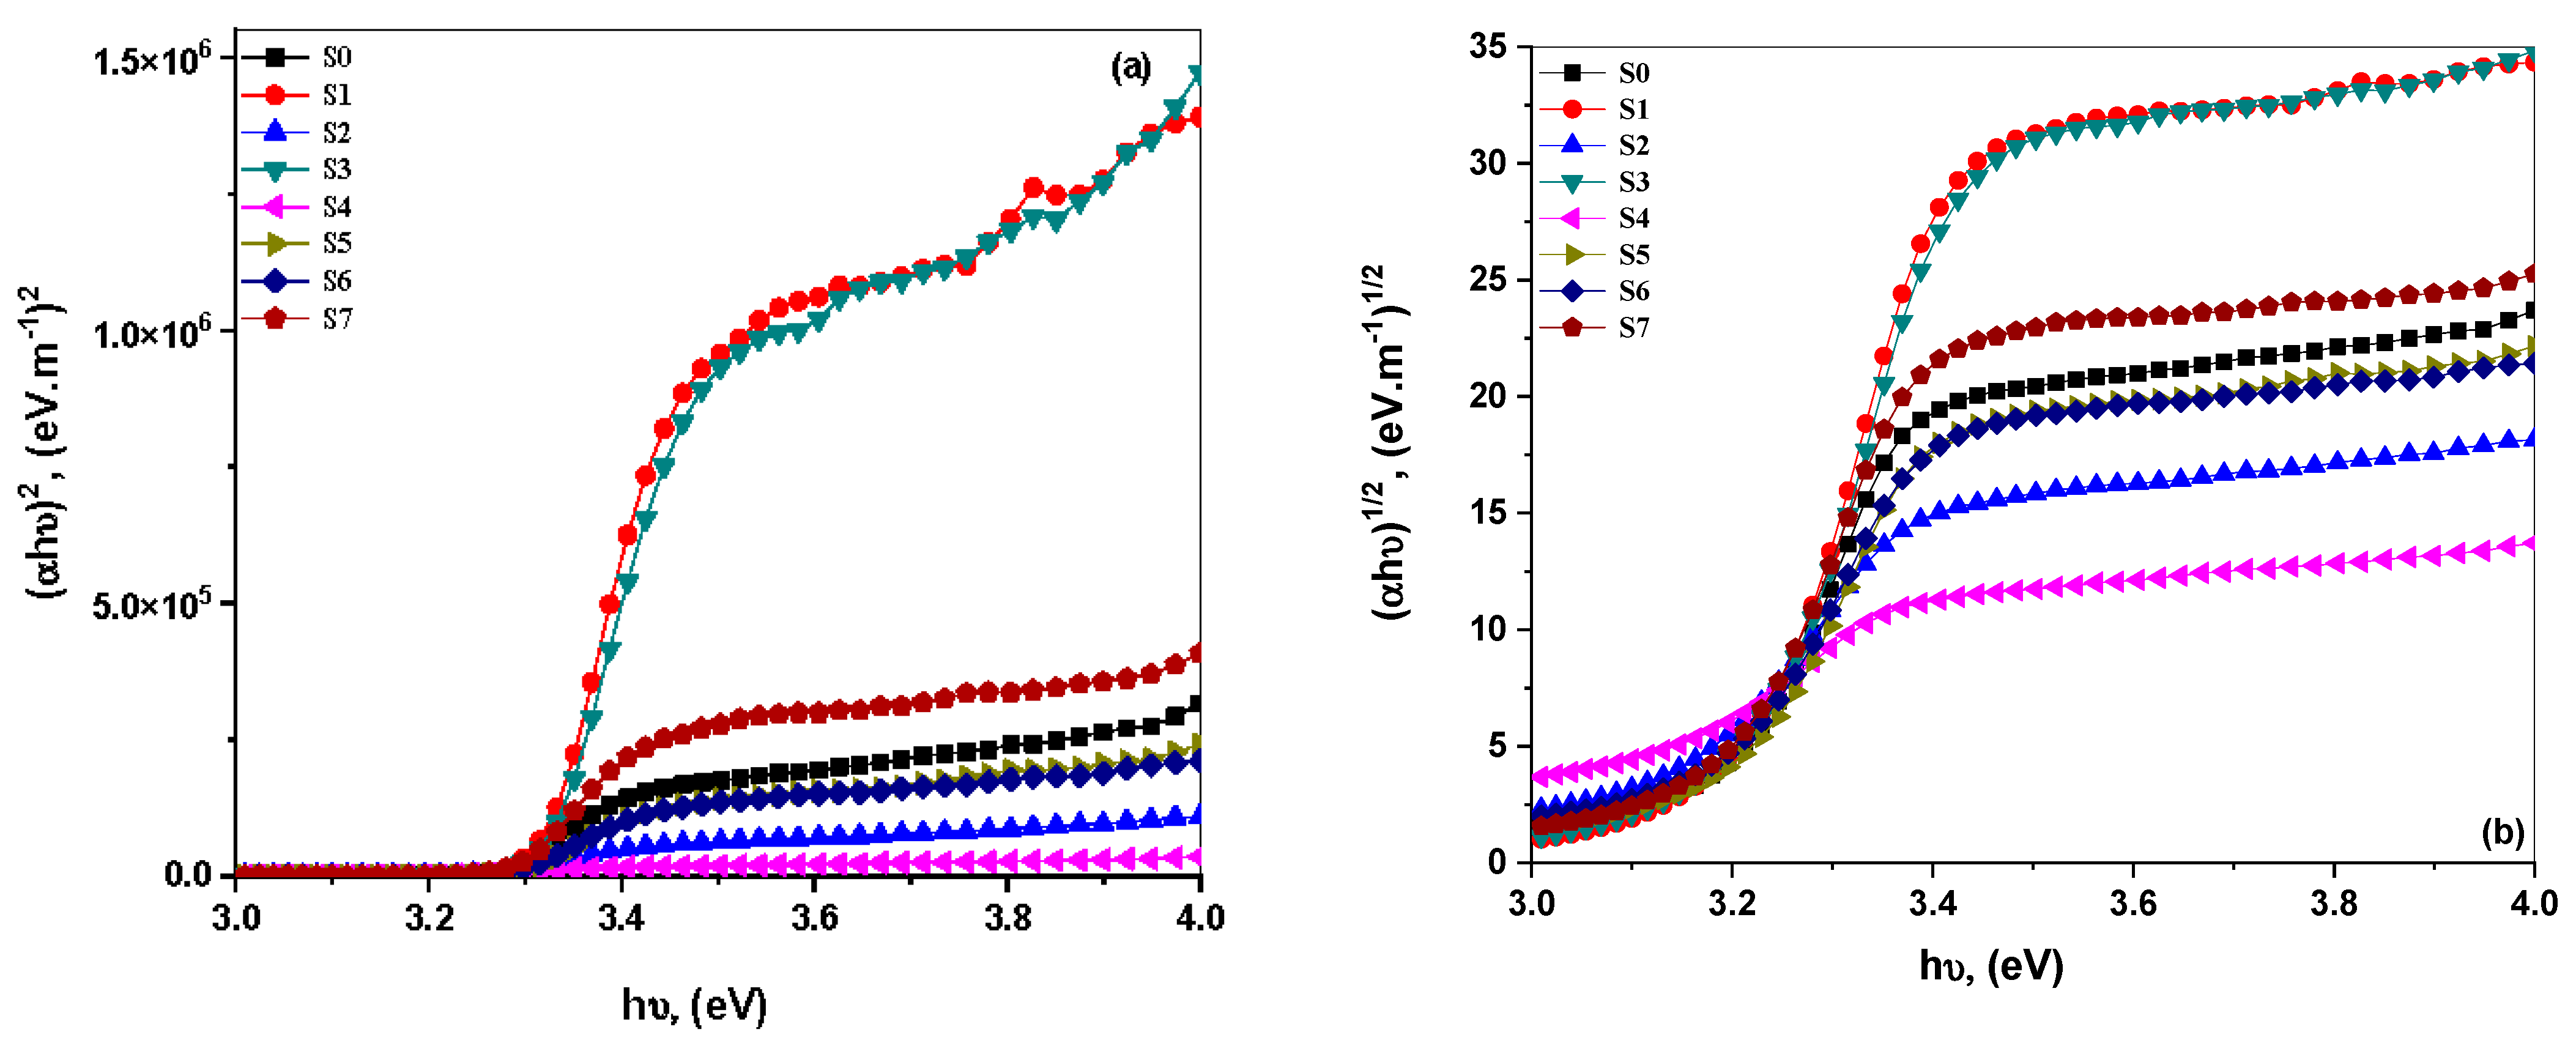
3.4.2. Optical Energy Bandgaps

Figure 6a,b show the (αhυ)1/2 and (αhυ)2 versus the photon energy () of the Eu2O3-ZnO samples. On the one hand, the calculated values of direct optical bandgap range from 3.31 eV to 3.24 eV. On the other hand, the indirect optical allowed optical transition values range from 3.23 eV to 3.14 eV. The evaluated optical bandgaps for the synthesized Eu2O3-doped ZnO nanoparticles are presented in Table 3. The present samples’ direct and indirect bandgap values agree with the recently reported Fe-ZnO nanostructures by Aydın et al. [29] and Chauhan et al. [45]. The decreasing bandgap in the samples could be explained due to the new generation of energy state between the conduction and the valence levels.

3.5. Photocatalytic Activity

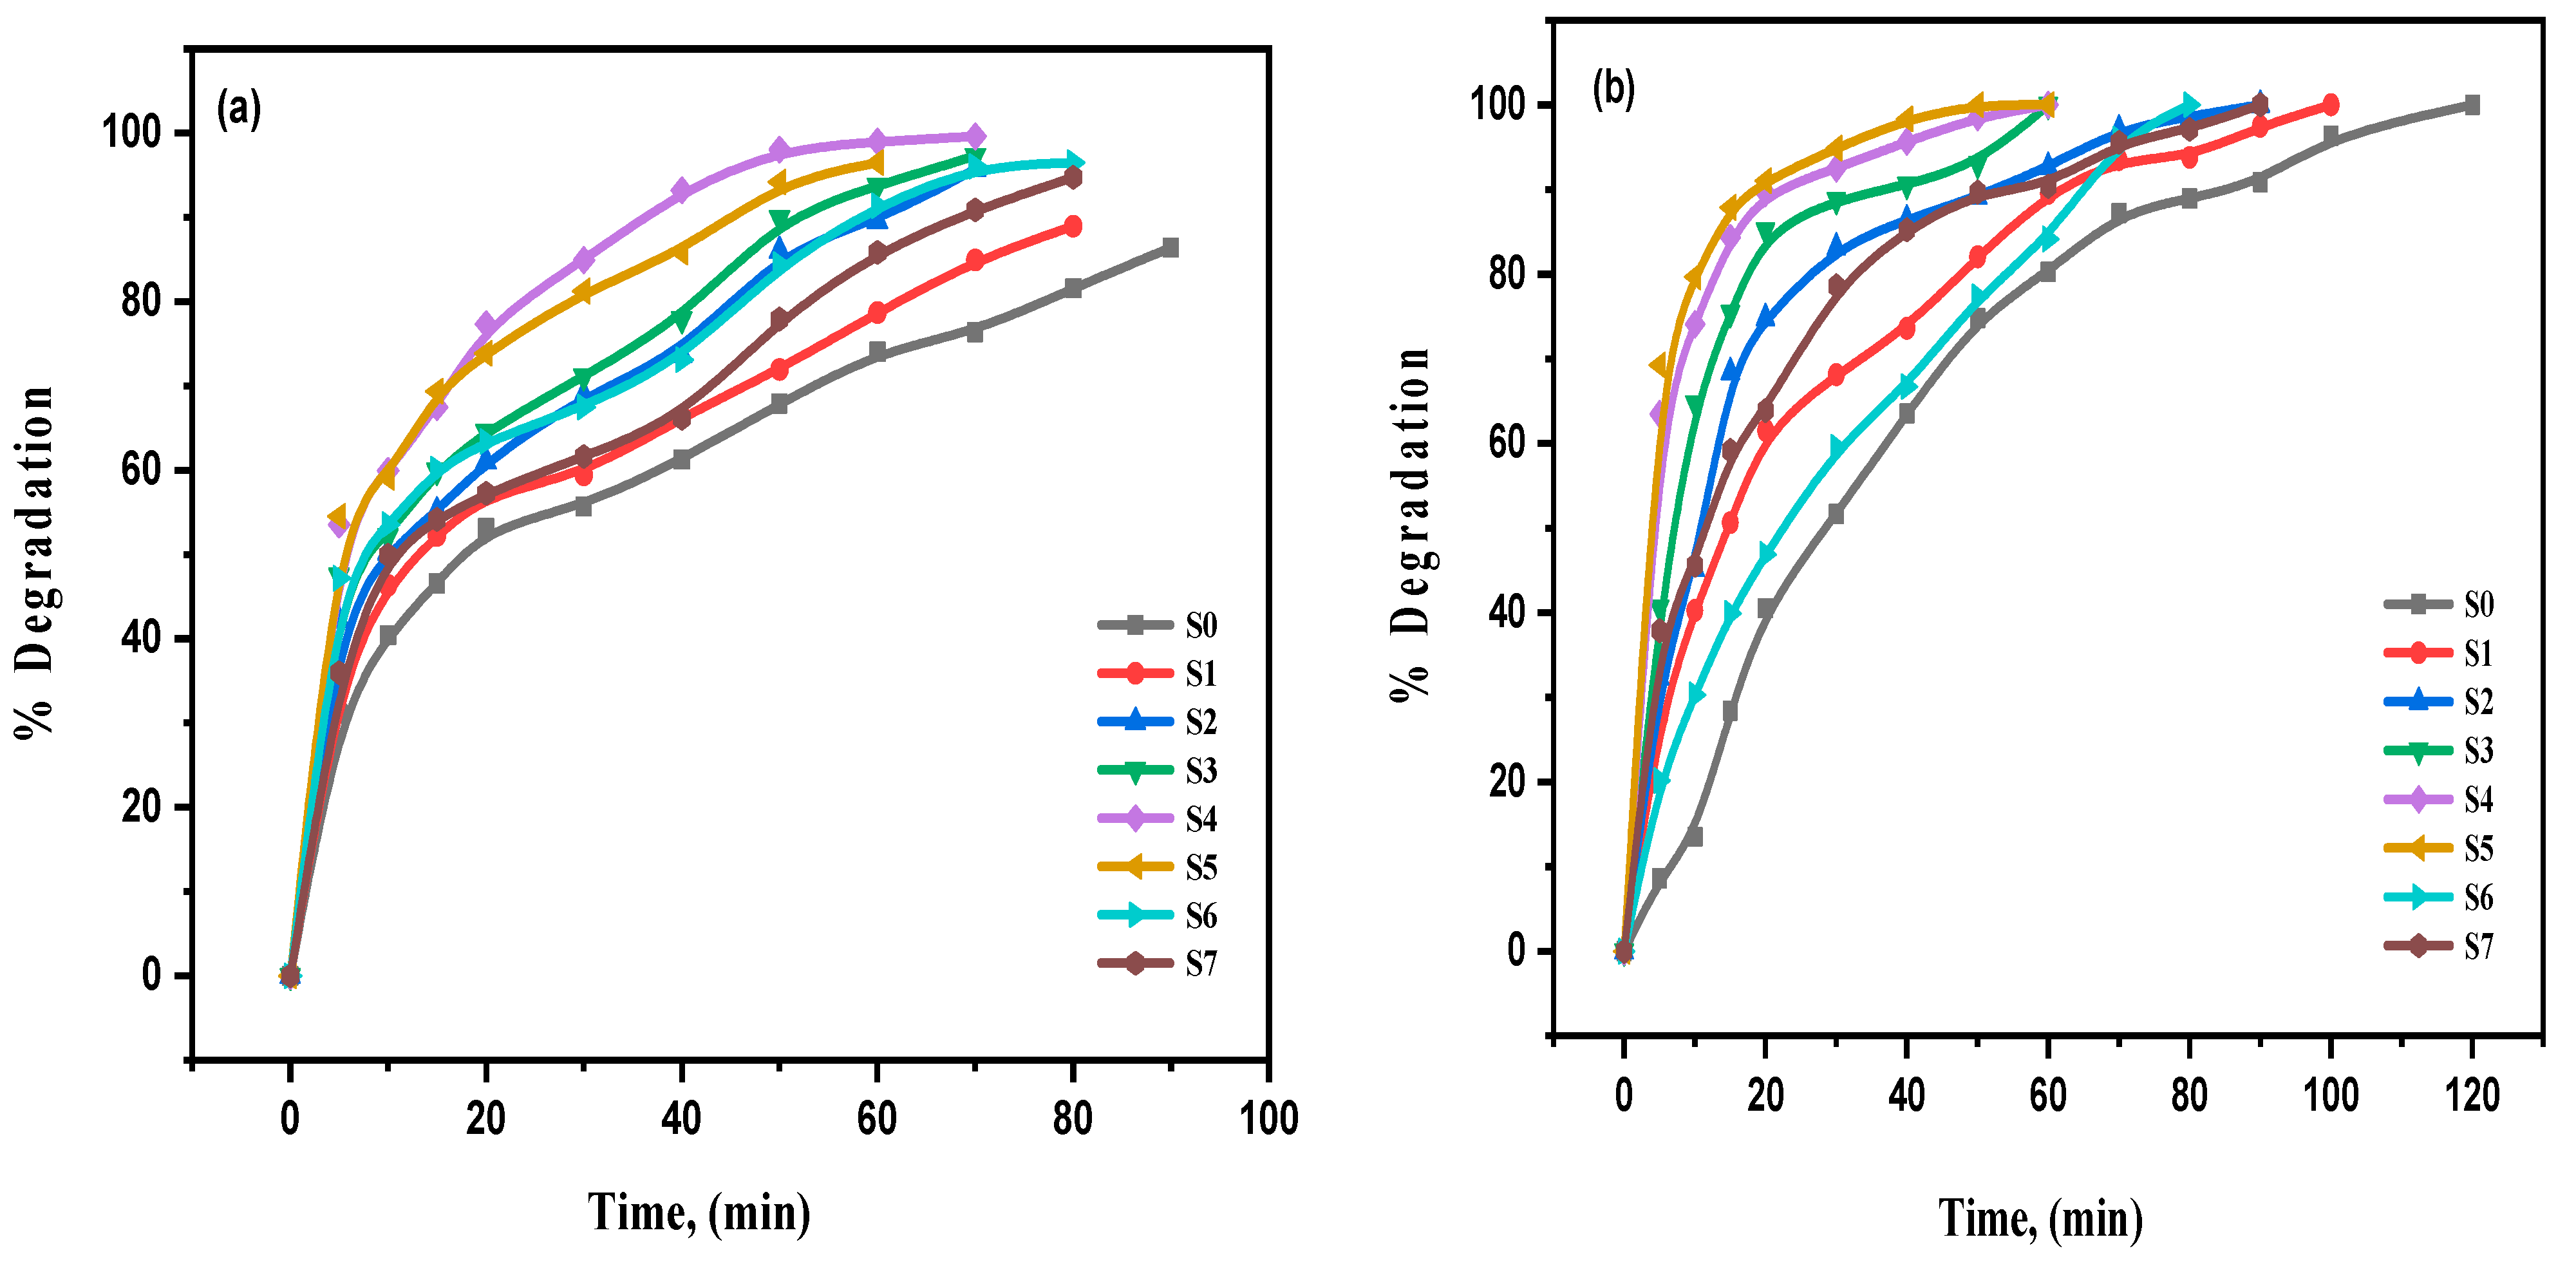
3.5.1. Photodegradation of Organic Compounds under Investigation Using Prepared Samples

The photocatalytic activities of pure and Eu2O3-doped ZnO were examined under visible irradiation using methylene blue as a colored dye and phenol as a colorless organic compound. The absorption spectra of the aqueous MB and Ph solution at various time intervals at irradiation were recorded. The photodegradation was estimated from the reduction in the maximum intensity of the absorption peak. Photocatalytic degradation of MB and Ph is distinguished from the concentration plot of MB or Ph versus irradiation time (min). Figure 7a,b shows the decrease in the MB solution and Ph solution concentrations at various illumination times for pure and Eu2O3-doped ZnO samples.

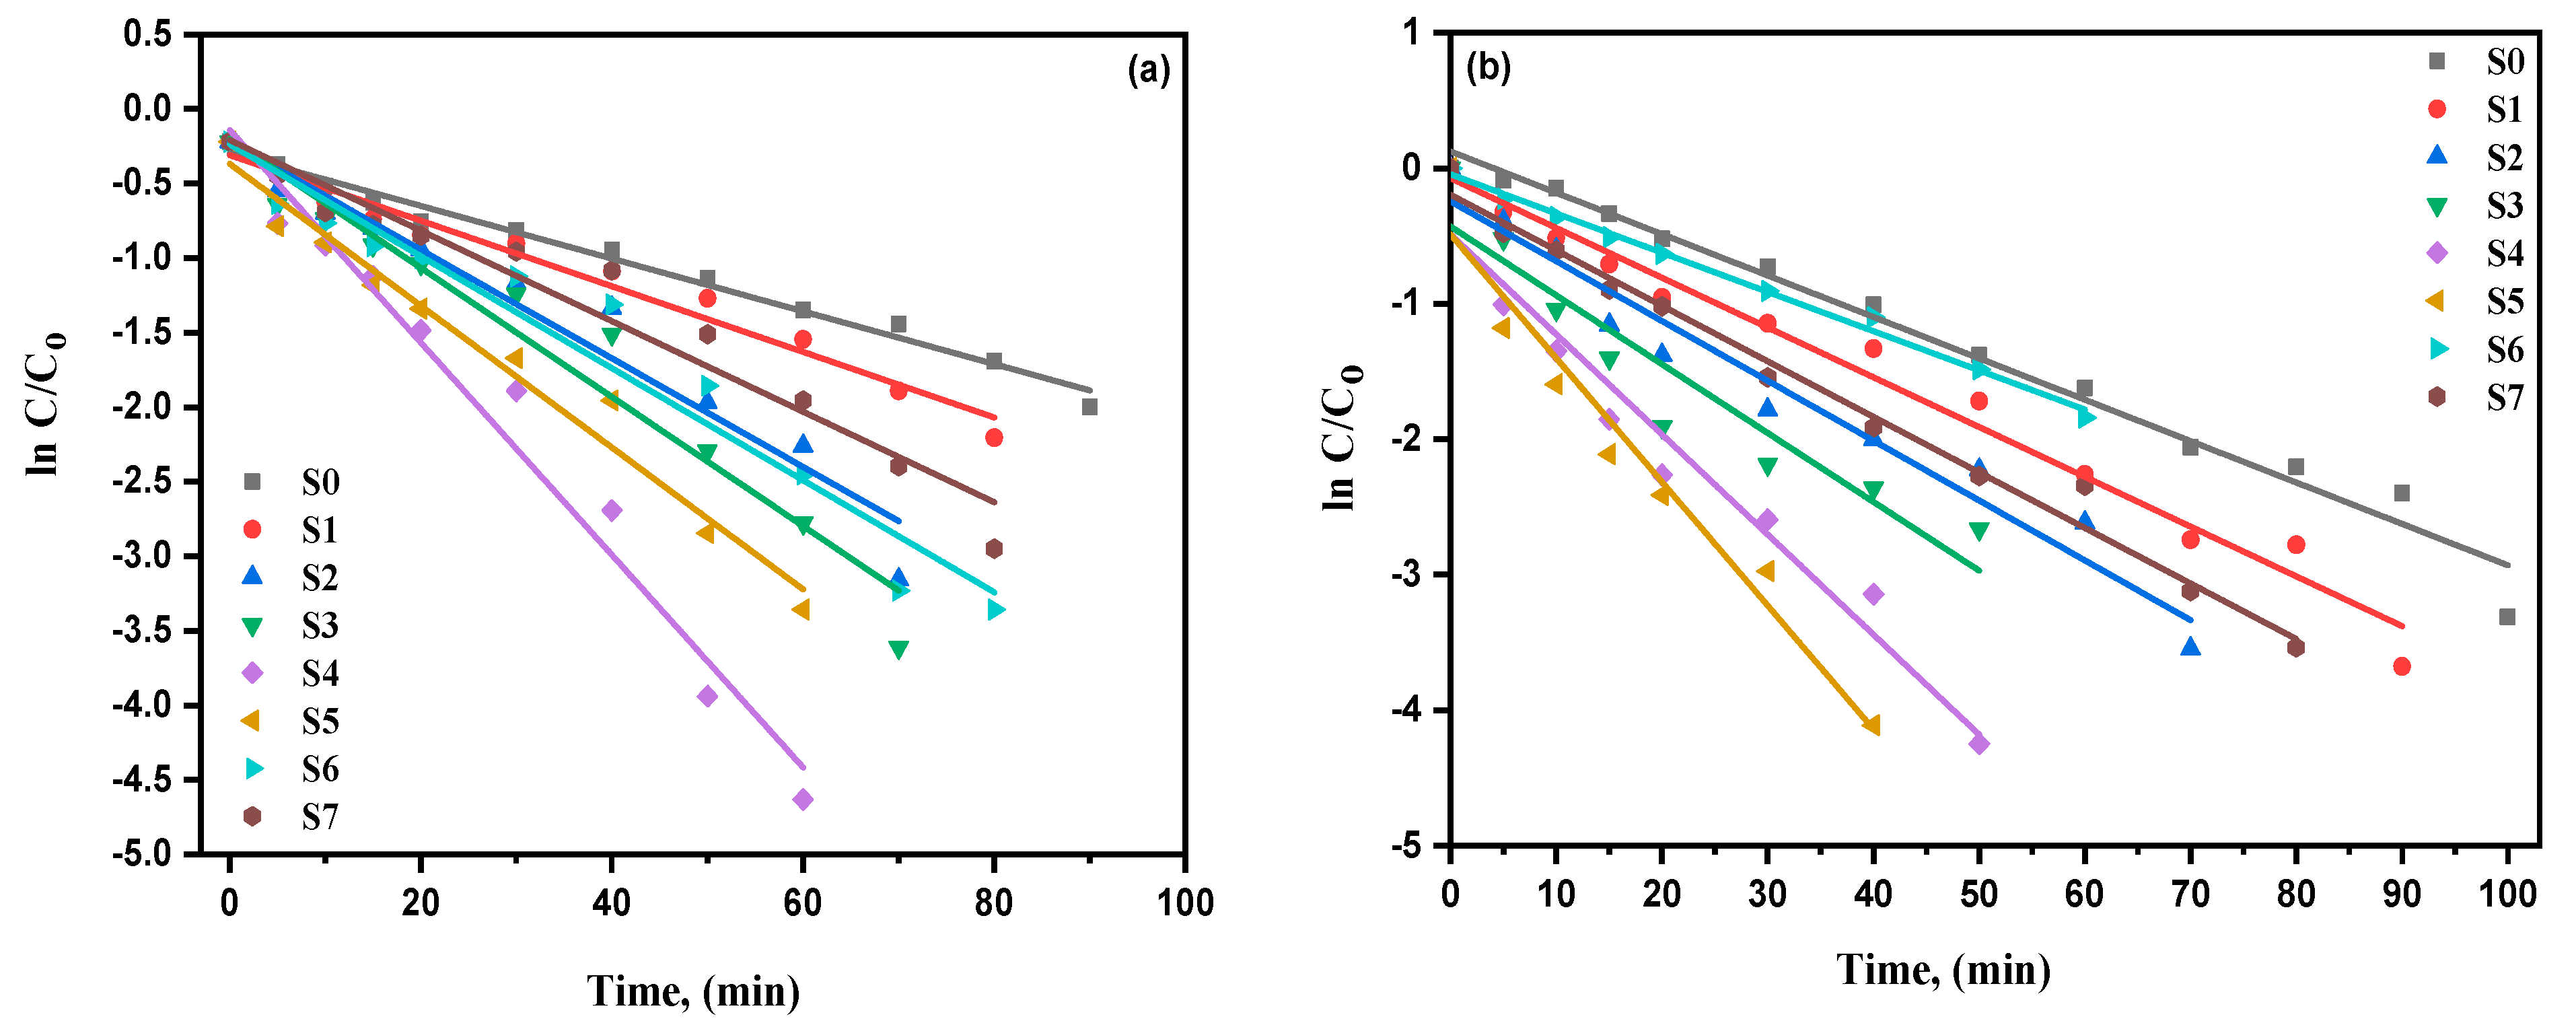
3.5.2. Kinetic Studies of the Photocatalytic Degradation Process

The weight concentrations of Eu increased, and the % of degradation of both MB and Ph increased, as shown in Figure 8a,b. The relationship between ln (C/Co) and the reaction time is illustrated in Figure 9a,b. The spectrum fitting of photocatalytic degradation of MB or Ph was accomplished to obtain the best straight line. The obtained coefficients of linear regression (R2) were estimated at around one for all the measured samples, indicating that the photodegradation obeyed the pseudo-first-order kinetics. The rate constants for the degradation of MB ranged from 0.017 to 0.07 min−1. At the same time, it varied from 0.03 to 0.09 min−1 for the phenol degradation for different doping concentrations.
The degradation factors for MB with 0.5% Eu-doped ZnO nanocomposites increase the reaction rate by around four times compared with pure ZnO samples. However, the reaction rate for Ph degradation constants with 1% Eu2O3-doped ZnO is three times more than that for pure ZnO. Generally, the performance of photocatalyst activities was well-defined through the recombination rate delay of photo-created electron-hole pairs. Consequently, the correct mole fraction of Eu3+ ions-doped ZnO nanostructures would enhance the photocatalytic activities due to increased electron-hole lifetime.
Table 4 summarizes the first-order rate coefficient (k) values extracted from the linear graphs. The defined k values for pure ZnO and Eu2O3-doped nanostructures indicated increased rate parameters with increasing Eu dopants. Therefore, the improvement in the Eu-ZnO photocatalytic activities could increase the concentration of Eu nanoparticles, as confirmed through absorption and XRD spectra. Additionally, doping Eu NPs could present in the ZnO lattice both point defects and trapping sites, which results in increased separation among electron-hole pairs, thus, increasing the ZnO photocatalytic efficiency [17]. Moreover, a photo-created electron in the conduction band could be recognized via Eu+3 ions. Then, the generated Eu+2 could be related to the dissolved O2 and produce the radical anion of superoxide O2 [22].

3.5.3. Proposed Mechanism of Photodegradation of MB and Ph

In the literature, investigations of the photocatalytic mechanism of semiconductor materials and the effects of rare earth ions have been extremely recognized [61,62,63,64]. In this study, the VB electrons absorb energy from visible light to irradiate ZnO. Then, those electrons are excited to the conduction band (CB), creating electron-hole pairs (e/h+). The reactions of oxidation are initiated from those (e/h+) pairs as follows: The dissolved oxygen is reduced to an anion of superoxide radical (O2), and the H2O molecule is oxidized to (OH) radicals. Here, h+, O2, and.OH, radicals are very significant in contributing to the organic dye’s decomposition to CO2 and H2O. Even though one challenging factor in an investigation of photocatalytic efficiency is the recombination of the created (e/h+) pairs [64]. The degradation mechanism of Eu2O3-ZnO photocatalytic is illustrated in Scheme 1.
The 0.5 g of Eu2O3-doped ZnO (S4) displayed 100% MB removal in 80 min. Furthermore, 1 g Eu-doped ZnO degraded 100% phenol in 60 min. The more considerable photocatalytic activity of Eu2O3-doped ZnO nanocomposites is primarily due to electron movement among the valence bands of Eu, Eu2+, and Eu3+ [65]. Since europium (Eu) can have two and three valence electrons, Eu3+ and Eu2+ could trap those electrons and give them oxygen to form radical ions of superoxide (O2). It was conveyed that the potential energy of Eu (Eu3+/Eu2+) reduction is negative about -0.35 eV further than E (O2) with +0.12 eV [66]. Therefore, the oxygen absorption on the Eu2O3-doped ZnO surface could be decreased to reach O2. As seen in Scheme 1, the capturing and transferring of electrons increases the Eu2O3-doped ZnO photocatalytic activities, which results in the effective separation of electron-hole pairs.
Thus, rapid exciton recombination could enormously reduce the efficiency of the Eu2O3-ZnO photocatalytic activity. In the case of Eu3+ dopants, the electrons are trapped in the energetically favorable Eu3+ ions, as in Equation (13). As a result, electrons are inhibited from recombination with holes to generate superoxide radicals (O2•−), as seen in Equation (14) [67]. Equation (15) illustrates that the transferring of electrons to ionize oxygen vacancies (V0++) leads to the reaction by adsorbate oxygen (O2) to produce radicals of superoxide (O2) [33]. As ZnO nanostructures are doped with Eu3+ ions, the larger quantity of the created radicals (O2) increases the photocatalytic activity. In the degradation process, organic compounds are initially oxidized via the sequential hole transfer and/or the radical attack of hydroxyl OH [68].
Furthermore, the Eu3+ dopants could agree to take the CB electrons of ZnO nanostructures to generate Eu2+, which could move one electron for dissolving O2 to create radical anions of superoxide for preventing the electron-hole recombination, as demonstrated in Scheme 1 [69,70]. As a result, Eu3+ on the ZnO surface could be considered a scavenger of electrons. Additionally, Eu3+-ZnO nanostructures have a narrow energy bandgap as compared with undoped ZnO semiconductors, which could cause an increase in the stability of electron-hole pairs and enhance the efficiency of photocatalytic degradation. Nevertheless, Eu3+ ions charging above their ideal level could perform as a recombination focus on photogenerated electron-hole pairs due to their interaction, which reduces the efficiency of photocatalytic [67,71]. Jinrui Li et al. reported that Eu doping on ZnO exhibited the highest photocurrent density, which indicated that the electron-hole lifetime at the interface of the catalyst was extended [72].
Similarly, different researchers have reported the electron transfer and involvement of superoxide radicals in photodegradation by Eu ions [73]. Paola Franco et al. showed the photocatalytic activities of manufactured materials investigated in EBT dye photodegradation using UV and visible irradiation [57]. The experimentally obtained results illustrated that the Eu-ZnO structures synthesized using the supercritical antisolvent SAS (Eu-ZnO-SAS) technique could assure the highest photocatalytic efficiency. Finally, Phuruangrat et al. investigated the photocatalytic activity of manufactured ZnO and Eu-ZnO nanostructures using MB degradation in aqueous solutions within UV irradiation [58]. The MB photocatalytic efficiency of 3% Eu-ZnO reached 90.51% in 300 min, more extensive than undoped ZnO semiconductor. Yanqing Zong et al. found that the efficiency of MO photodegradation for undoped ZnO was just 75.7% in 180 min, while the efficiency reached 95.3% for 1.0 mol% dopants Eu-ZnO [60]. Conspicuously, as the Eu dopant concentrations increases, the efficiency of photodegradation initially upsurges and, after that, declines. Balachandran et al. used the hydrothermal process to prepare Eu2O3-ZnO nanoclusters, where the composite was comprised of 91% ZnO and 9% Eu2O3 [60]. The synthesized Eu2O3-ZnO nanostructures displayed the more considerable photocatalytic activity of 99.2% in the Rhodamine B (RhB) photodegradation under sunlight in 75 min under neutral pH. Numerous researchers have considered hydroxyl radicals the most vital active materials for impurity degradation. The previous comparison proved the influences of the preparation method, weight concentrations of Eu, and conditions of photocatalytic procedure on the photocatalytic activities of prepared Eu2O3-doped ZnO materials.
In this present work, 0.5 g Eu-ZnO (0.05 Eu/Zn molar%) nanocomposites displayed the highest MB photocatalytic degradation in 80 min of visible irradiation to reach 100% degradation. However, 1 g Eu-doped ZnO indicated 100% phenol degradation after 60 min. This behavior may be attributed to the oxidation procedure resulting from the electron injection into ZnO NPs, with just one exciting organic compound level.

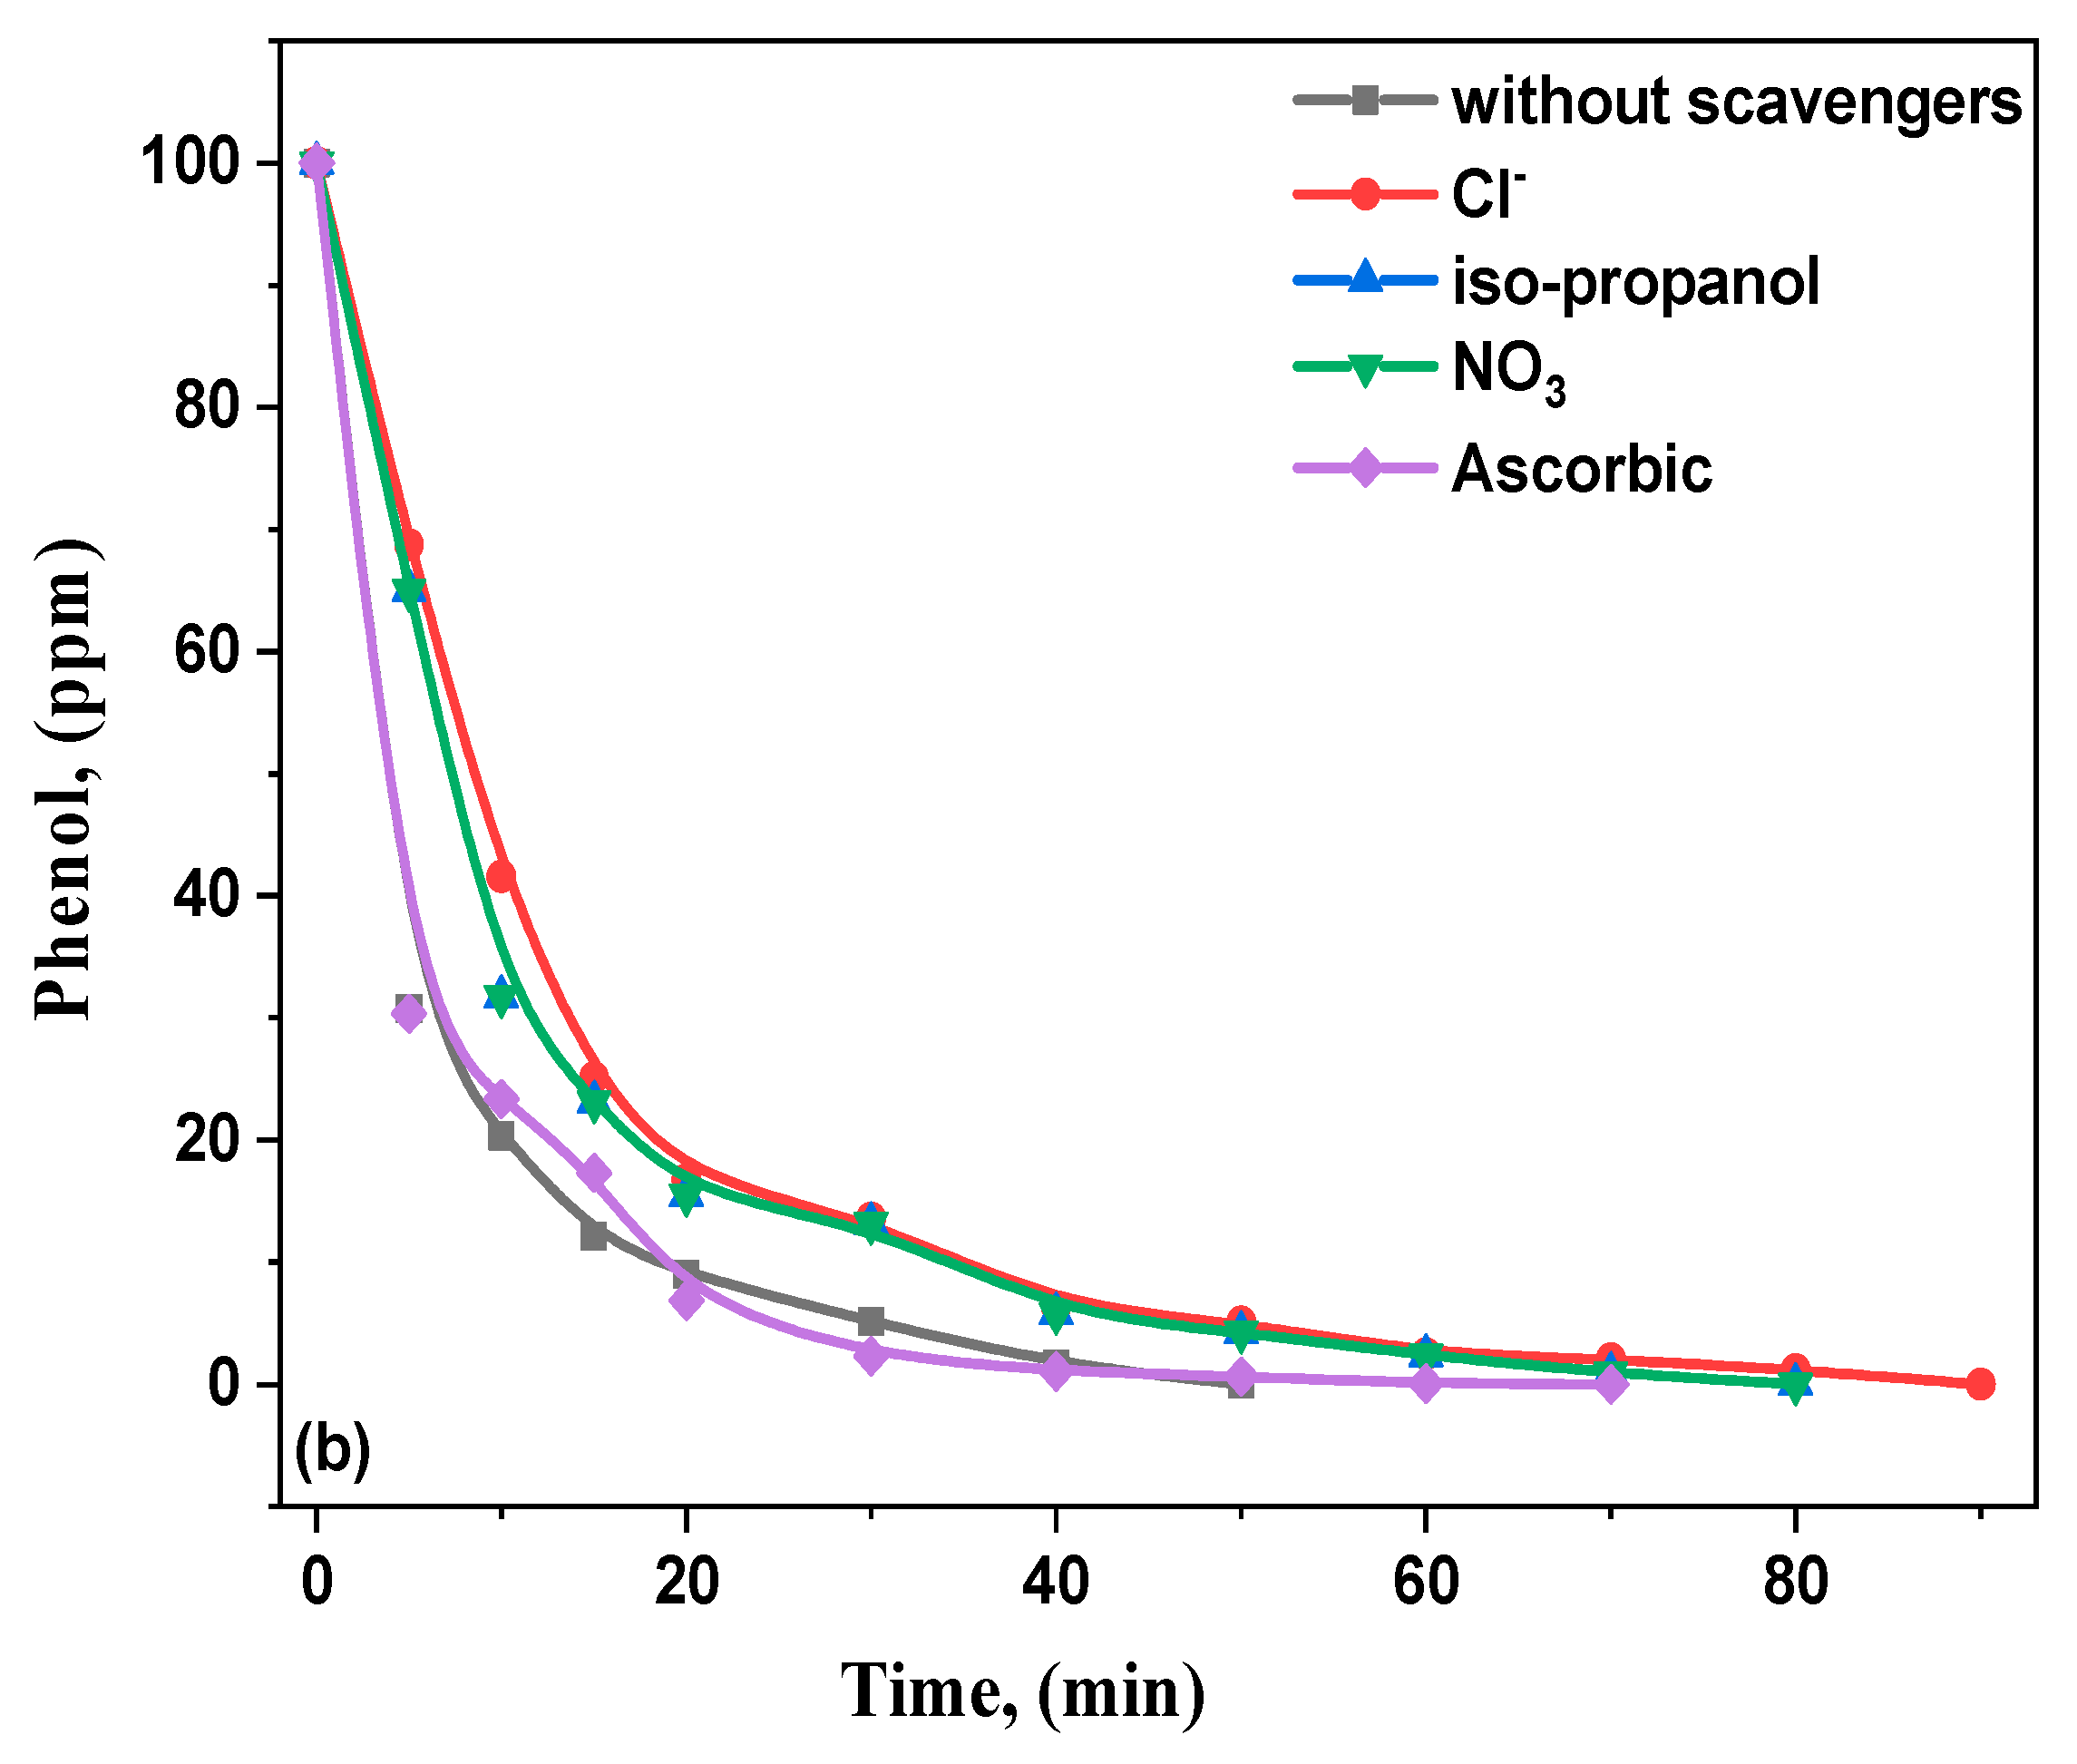
3.5.4. Detection of Active Species Responsible for the Photocatalytic Degradation Process

The rare-earth dopants can enhance photocatalytic activities to a substantial degree via the mechanism of charge separation [74]. This significant recombination can be decreased via metal dopant, which professionally traps the charge carriers and increases their lifetime. In this case, Eu3+ behaves as traps for electrons, Eu3+ ions in the material take the CB electrons, condensed to get Eu3+. These produced Eu3+ can move those electrons toward adsorbed O2 molecules, thus, creating O2 radicals. Throughout this procedure, Eu3+ would be oxidized as Eu2+. Both trapping and the releasing process of electrons by Eu3+ significantly decrease the recombination percentage of e-h+ pairs [59]. The effects of such scavenging agents have been studied to clarify the main reactive types (photogenerated electrons and holes, superoxide/OH radicals) in the photodegradation of MB and phenol molecules shown in Figure 10a,b. As a hole scavenger, the degradation of 200 mM sodium chloride substantially reduces the catalyst activity against photodegradation of MB and Ph.
The photogenerated holes can react and emit chlorine radicals with the chloride anion, which can respond and form radicals of dichloride anions (Cl2) [61]. To produce chlorine and chloride-free anions, two radicals of dichloride anion can efficiently react with each other. To generate radicals of chloro and hydroxyl, the reaction between radicals of dichloride anion and water molecules is also accomplished to get ClOH. Chloride has been referred to as a scavenger of OH radicals. IPA can also scavenge a moderately slower rate of .H radicals than OH radicals. OH can be effectively captured by nitrate ions, while H and photogenerated electrons can be scavenged to a lesser degree [59]. Ascorbic acid (H2A) showed the most extreme decline in MB and Ph degradation as an O2 scavenger. The reaction between H2A and superoxide radicals could be completed under acidic environments to create ascorbate radicals and H2O2 with a second-order response. The resulting ascorbate was a relatively non-reactive reaction that decomposed into H2A and dehydroascorbic acid through a disproportionate reaction [75].
As confirmed before, the following pattern was found to reduce the photocatalytic behavior of the studied composites in the existence of trapping agents. This pattern, AA > IPA > chloride > nitrate, suggests that the highly significant positions were in MB and phenol photodegradation using the prepared materials, superoxide radicals, and then OH, h+ and e. The arrived photons will excite both semiconductors based on these findings, resulting in e/h+ pair output in both semiconductors. Degradation in the presence of scavengers reveals the prominent role of superoxide radicals generated by the longer lifetime of electrons caused by the presence of Eu ions. As seen in the scavenger test results, superoxide and holes were the main reactive species that caused the degradation of MB and Ph. In addition, the bandgap energy of this coupled oxide is more minor than ZnO, which makes the catalyst widen its spectral absorption range, extending to the visible region. Eu2O3-ZnO may have intermittent bands, which causes a reduction in bandgap energy, and this improves its visible light absorption. The photogenerated electrons-hole separation over ZnO/Eu2O3 heterojunctions enhances the Eu2O3-doped ZnO performance to be larger than either Eu2O3 or ZnO nanoparticles.

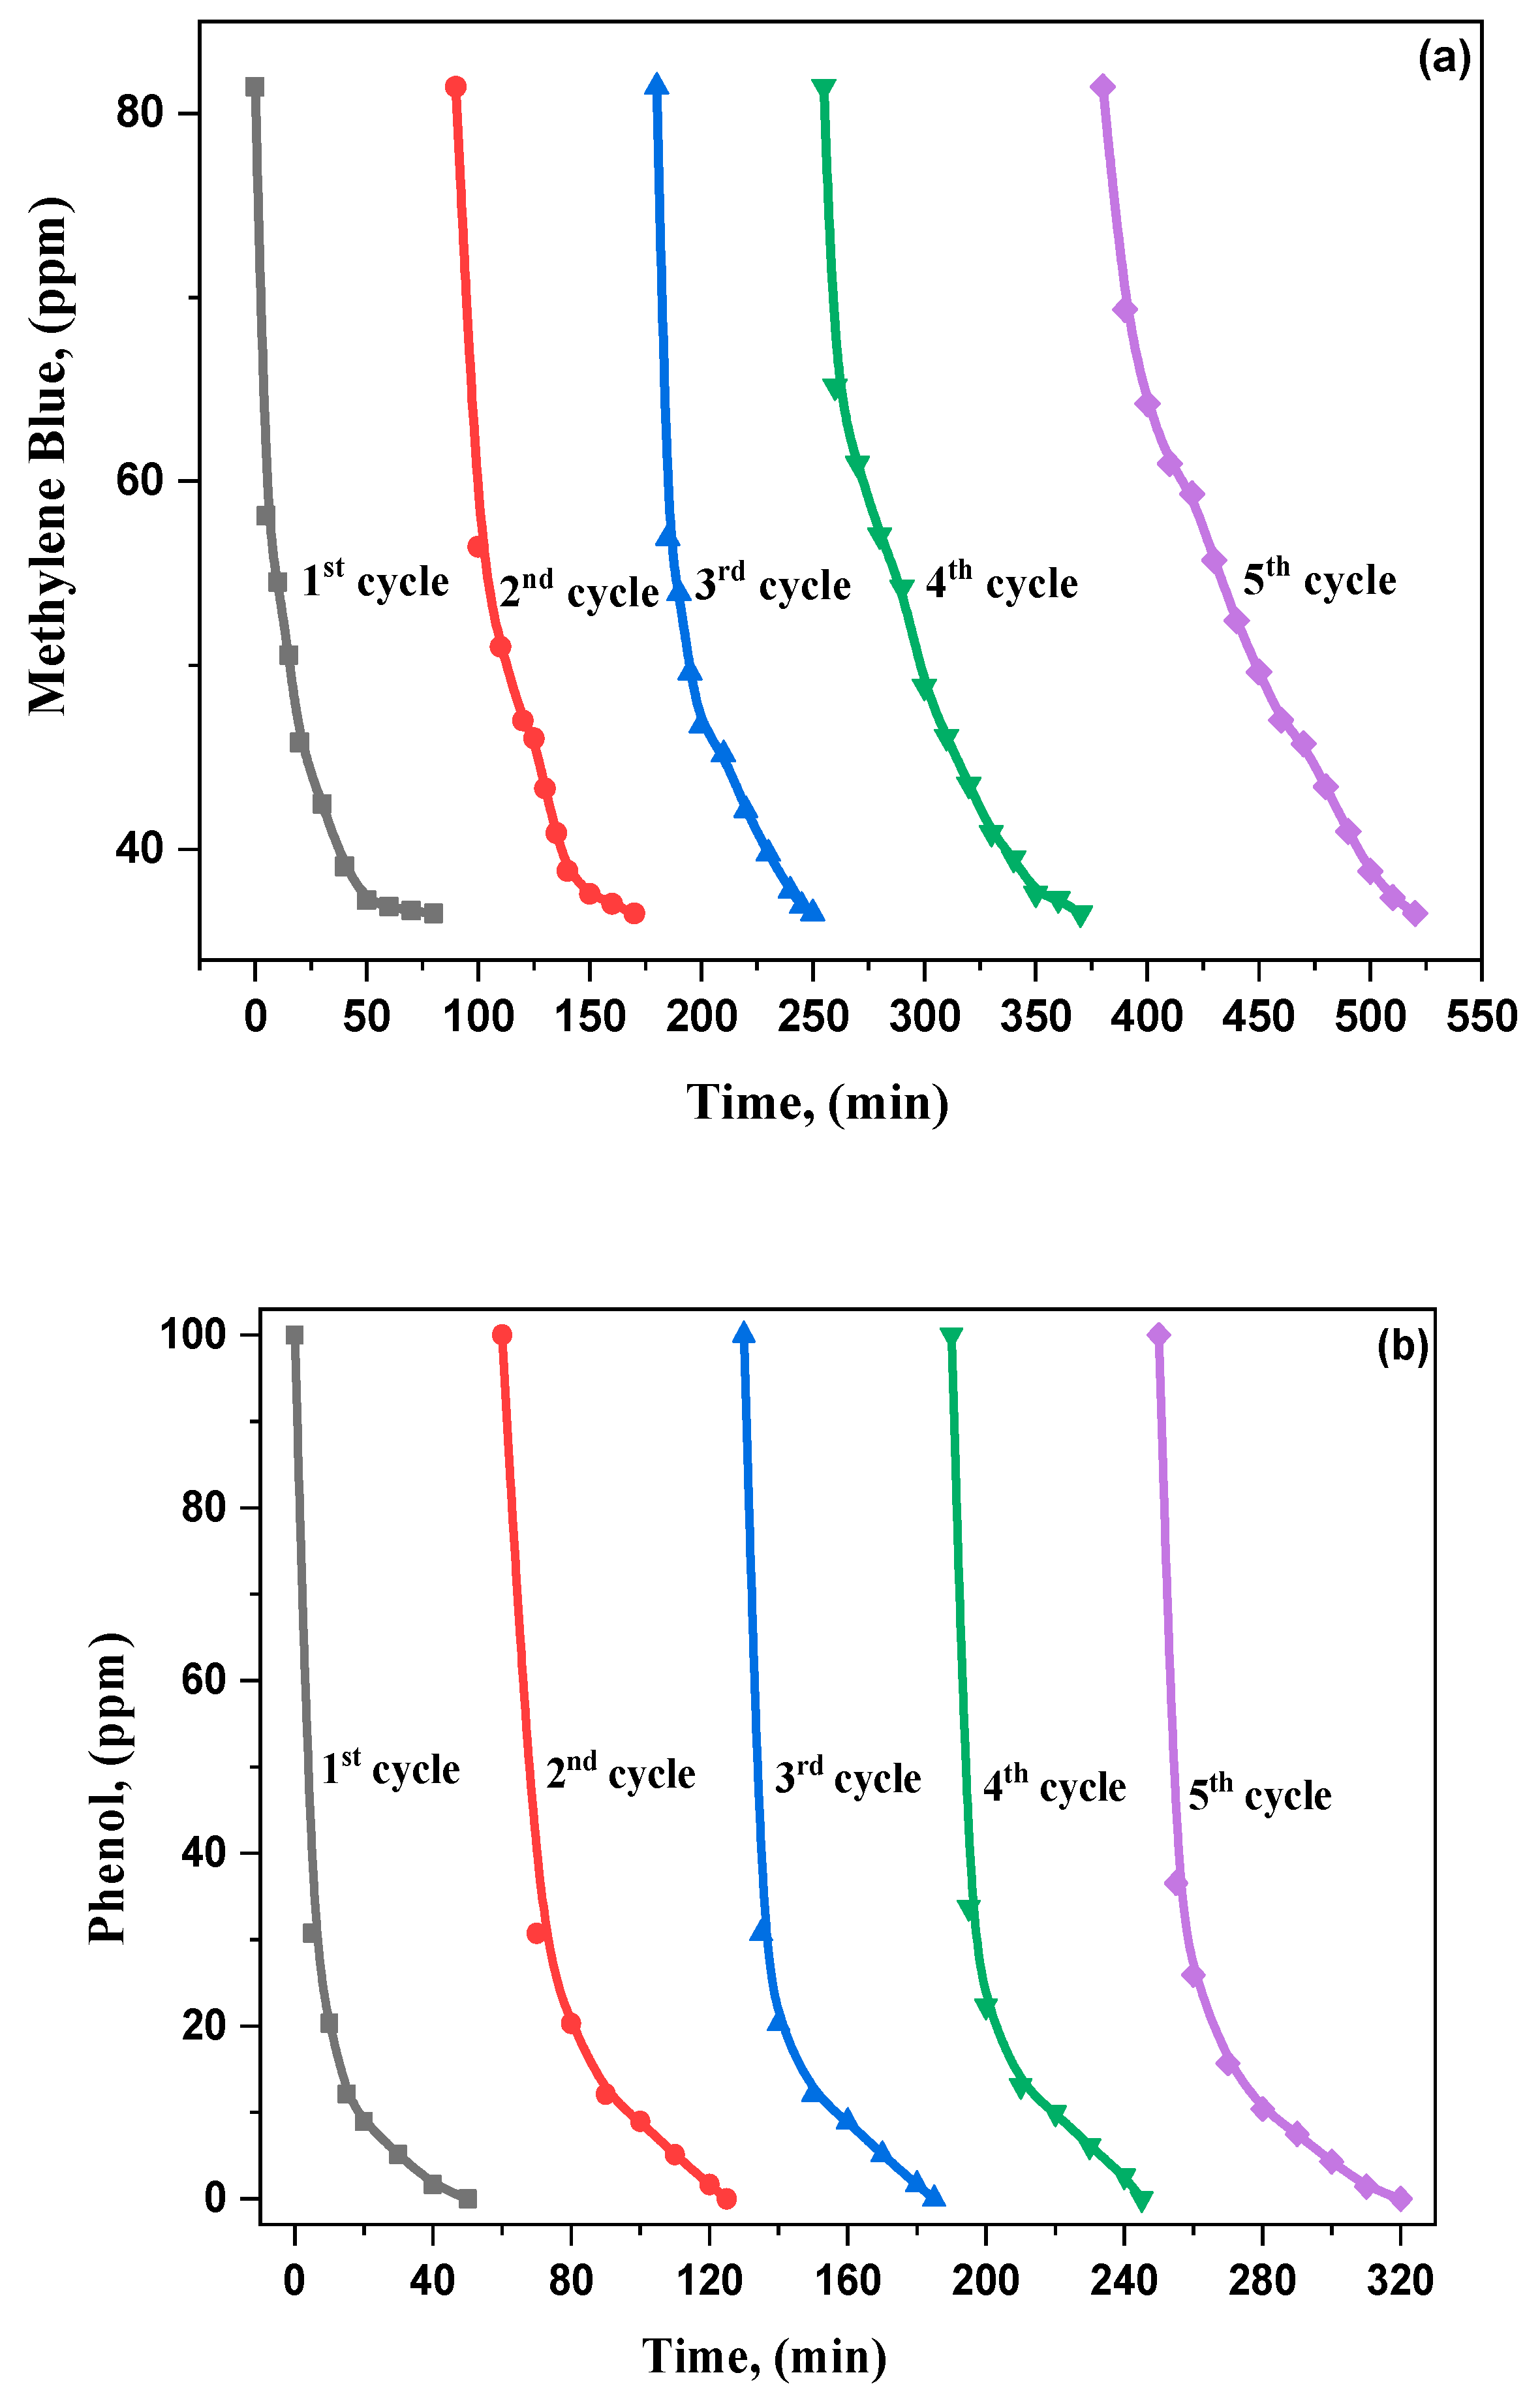
3.5.5. Recycling of the Prepared Samples

The reusability and recyclability of the 0.5 g and 1 g E-ZnO (S4, S5) photocatalysts are correspondingly estimated for MB and phenol photodegradation, respectively. As illustrated in Figure 11a,b, no loss was significantly presented in the efficiency of MB and Ph photodegradation, even after five succeeding series, which confirms the excellent reusability of the photocatalyst. Additionally, recovering the photocatalyst could be efficiently completed using the photoreaction mixtures with just the centrifugal separation approach. The effectively obtained reusability and recyclability of Eu2O3-doped ZnO photocatalysts could potentially be advantageous in wastewater treatment technological applications.

4. Conclusions

In the present work, the combustion technique is a suitable, inexpensive, efficient, and environmentally friendly approach to preparing Eu2O3-doped ZnO (from 0.001 g to 5 g). The SEM studies confirm an increase in grain size of doped samples compared with pure ZnO nanostructures. The Eu2O3-ZnO nanocomposites’ optical energy bandgap was between 3.31 eV and 3.24 eV, representing the catalyst absorption edge subject to the ZnO structure. This proposed research concludes that the performance of photocatalytic degradation increases with doping concentration and reaches 100% degradation of MB after 80 min for 0.5 g. Similarly, for 1 g Eu, 100% phenol degradation is reached within 60 min under visible irradiation, indicating the excellent and selective photocatalytic behavior of the produced Eu2O3-doped ZnO nanocomposites towards the degradation of phenols and methylene blue dyes. The primary role of .O2 made from the longer lifetime of electrons due to Eu ions was confirmed to have the highest responsibility for degradation via various trapping agents. Furthermore, this catalyst was recyclable for several runs. Therefore, the nanostructures, innovative and multifunctional materials of Eu2O3-doped ZnO production, are promising candidates for wide-scale technological, environmental, and biomedical applications, such as optoelectronics and photocatalysis.

Author Contributions

All authors contributed to the study’s conception and design. Material preparation, data collection, and analysis were performed by T.H.A., M.S.A.H., M.A., and V.G.; methodology, A.B., H.A., and H.Y.Z.; software, M.S.A.-w., I.S.Y., and S.N.; validation, M.S.A.H., M.A., and V.G.; formal analysis, A.B., H.A., and H.Y.Z.; investigation, V.G., T.H.A., and M.A.; resources, V.G., T.H.A., and H.Y.Z.; data curation, A.B., H.A., and H.Y.Z.; writing—original draft preparation, T.H.A., M.S.A.H., M.A., and V.G.; essay—review and editing T.H.A., M.S.A.H., M.A., and V.G.; visualization M.S.A.-w., I.S.Y., and S.N.; supervision, M.S.A.-w., I.S.Y., and S.N.; project administration, V.G.; funding acquisition, V.G. All authors have read and agreed to the published version of the manuscript.

Funding

The authors extend their appreciation to the Deputyship for Research & Innovation, Ministry of Education in Saudi Arabia, for funding this research work, project number IFP-KKU-2020/6.

Conflicts of Interest

The authors declare no conflict of interest.

References

  1. Ren, Y.-Z.; Wu, Z.-L.; Franke, M.; Braeutigam, P.; Ondruschka, B.; Comeskey, D.J.; King, P.M. Sonoelectrochemical degradation of phenol in aqueous solutions. Ultrason. Sonochem. 2013, 20, 715–721. [Google Scholar] [CrossRef] [PubMed]
  2. Kennedy, L.J.; Vijaya, J.J.; Kayalvizhi, K.; Sekaran, G. Adsorption of phenol from aqueous solutions using mesoporous carbon prepared by a two-stage process. Chem. Eng. J. 2007, 132, 279–287. [Google Scholar] [CrossRef]
  3. Jin, X.; Gao, J.; Zha, J.; Xu, Y.; Wang, Z.; Giesy, J.P.; Richardson, K.L. A tiered ecological risk assessment of three chlorophenols in Chinese surface waters. Environ. Sci. Pollut. Res. 2014, 19, 1544–1554. [Google Scholar] [CrossRef] [PubMed]
  4. Blasco, R.; Castillo, F. Characterization of 2,4-dinitrophenol uptake by Rhodobacter capsulatus. Pestic. Biochem. Physiol. 1997, 58, 1–6. [Google Scholar] [CrossRef]
  5. You, Q.; Cai, H.; Hu, Z.; Liang, P.; Prucnal, S.; Zhou, S.; Sun, J.; Xu, N.; Wu, J. Blue shift in absorption edge and widening of band gap of ZnO by Al doping and Al–N co-doping. J. Alloys Compd. 2015, 644, 528–533. [Google Scholar] [CrossRef]
  6. Choi, H.W.; Lee, K.S.; Theodore, N.D.; Alford, T.L. Improved performance of ZnO nanostructured bulk heterojunction organic solar cells with nanowire-density modified by yttrium chloride introduction into solution. Sol. Energy Mater. Sol. Cells 2013, 117, 273–278. [Google Scholar] [CrossRef]
  7. Wang, Y.; Yang, J.; Kong, J.; Jia, H.; Yu, M. ZnO microspheres: Controllable preparation and optical properties. Superlattices Microstruct. 2015, 86, 228–235. [Google Scholar] [CrossRef]
  8. Senthilvelan, S.; Chandraboss, V.L.; Karthikeyan, B.; Natanapatham, L.; Murugavelu, M. TiO2, ZnO and nano bimetallic silica catalyzed photodegradation of methyl green. Mater. Sci. Semicond. Process. 2013, 16, 185–192. [Google Scholar] [CrossRef]
  9. Kaneva, N.; Stambolova, I.; Blaskov, V.; Dimitriev, Y.; Bojinova, A.; Dushkin, C. A comparative study on the photocatalytic efficiency of ZnO thin films prepared by spray pyrolysis and sol-gel method. Surf. Coat. Technol. 2012, 207, 5–10. [Google Scholar] [CrossRef]
  10. Zhong, J.B.; Li, J.Z.; Lu, Y.; He, X.Y.; Zeng, J.; Hu, W.; Shen, Y.C. Fabrication of Bi3+-doped ZnO with enhanced photocatalytic performance. Appl. Surf. Sci. 2012, 258, 4929–4933. [Google Scholar] [CrossRef]
  11. Fu, M.; Li, Y.; Wu, S.; Lu, P.; Liu, J.; Dong, F. Sol-gel preparation and enhanced photocatalytic performance of Cu-doped ZnO nanoparticles. Appl. Surf. Sci. 2011, 258, 1587–1591. [Google Scholar] [CrossRef]
  12. Jia, X.; Fan, H.; Afzaal, M.; Wu, X.; O’Brien, P. Solid-state synthesis of tin-doped ZnO at room temperature: Characterization and its enhanced gas sensing and photocatalytic properties. J. Hazard. Mater. 2011, 193, 194–199. [Google Scholar] [CrossRef] [PubMed]
  13. Zhang, Y.; Wang, Q.; Xu, J.; Ma, S. Synthesis of Pd/ZnO nanocomposites with a high photocatalytic performance by a solvothermal method. Appl. Surf. Sci. 2012, 258, 10104–10109. [Google Scholar] [CrossRef]
  14. Patil, A.B.; Patil, K.R.; Pardeshi, S.K. Eco-friendly synthesis and solar photocatalytic activity of Si-doped ZnO. J. Hazard. Mater. 2010, 183, 315–323. [Google Scholar] [CrossRef]
  15. Li, L.; Wang, W.; Liu, H.; Liu, X.; Song, Q.; Ren, S. First-principles calculations of electronic band structure and optical properties of Cr-doped ZnO. J. Phys. Chem. C 2009, 113, 8460–8464. [Google Scholar] [CrossRef]
  16. Peralta, M.d.R.; Pal, U.; Zeferino, R.S. Photoluminescence (PL) quenching and enhanced photocatalytic activity of Au-decorated ZnO nanorods fabricated through microwave-assisted chemical synthesis. ACS Appl. Mater. Interfaces 2012, 4, 4807–4816. [Google Scholar] [CrossRef]
  17. Yayapao, O.; Thongtem, T.; Phuruangrat, A.; Thongtem, S. Ultrasonic-assisted synthesis of Nd-doped ZnO for photocatalysis. Mater. Lett. 2013, 90, 83–86. [Google Scholar] [CrossRef]
  18. Yayapao, O.; Thongtem, T.; Phuruangrat, A.; Thongtem, S. Sonochemical synthesis of Dy-doped ZnO nanostructures and their photocatalytic properties. J. Alloys Compd. 2013, 576, 72–79. [Google Scholar] [CrossRef]
  19. Yao, S.; Sui, C.; Shi, Z. Preparation and characterization of visible-light-driven europium doped mesoporous titania photocatalyst. J. Rare Earths 2011, 29, 929–933. [Google Scholar] [CrossRef]
  20. Yang, L.L.; Wang, Z.; Zhang, Z.Q.; Sun, Y.F.; Gao, M. Surface effects on the optical and photocatalytic properties of graphene-like ZnO: Eu3þ nanosheets. J. Appl. Phys. 2013, 113, 033514. [Google Scholar] [CrossRef] [Green Version]
  21. Li, F.H.; Liu, H.; Yu, L.X. Preparation, photoluminescence and photocatalytic properties of ZnO: Eu3+ nanocrystals. J. Nanosci. Nanotechnol. 2013, 13, 5115–5118. [Google Scholar] [CrossRef] [PubMed]
  22. Rabenstein, D.L. Applications of paramagnetic shift reagents in proton magnetic resonance spectrometry: Analysis of alcohol mixtures. Anal. Chem. 1971, 43, 1599–1605. [Google Scholar] [CrossRef]
  23. Chaudhary, S.; Umar, A. Glycols functionalized fluorescent Eu2O3 nanoparticles: Functionalization effect on the structural and optical properties. J. Alloys Compd. 2016, 682, 160–169. [Google Scholar] [CrossRef]
  24. Sungeun, H.; Sharma, S.K.; Lee, S.; Lee, Y.; Kim, C.; Lee, B.; Lee, H.; Kim, D.Y. Effects of Y contents on surface, structural, optical, and electrical properties for Y-doped ZnO thin films. Thin Solid Film. 2014, 558, 27–30. [Google Scholar]
  25. Hsieh, P.-T.; Chuang, R.-K.; Chang, C.-Q.; Wang, C.-M.; Chang, S.-J. Optical and structural characteristics of yttrium doped ZnO films using sol-gel technology. J. Sol-Gel Sci. Technol. 2011, 58, 42–47. [Google Scholar] [CrossRef]
  26. Sayed, A.S.; Rabie, K.; Salama, I. Studies on europium separation from middle rare earth concentrate by in situ zinc reduction technique. Hydrometallurgy 2005, 9, 145–154. [Google Scholar] [CrossRef]
  27. Nassar, E.J.; Ciuffi, K.J.; Calefi, P.S.; Ávila, L.; Bandeira, L.C.; Cestari, A.; de Faria, E.H.; Marçal, A.L.; Matos, M., III. Europium III: Different Emission Spectra in Different Matrices, the Same Element; Nova Science Publishers: Hauppauge, NY, USA, 2010; pp. 1–88. [Google Scholar]
  28. Hussien, M.S.A.; Mohammed, M.I.; Yahia, I.S. Flexible photocatalytic membrane based on CdS/PMMA polymeric nanocomposite films: Multifunctional materials. Environ. Sci. Pollut. Res. 2020, 27, 45225–45237. [Google Scholar] [CrossRef]
  29. Aydın, C.; El-Sadek, M.S.A.; Zheng, K.; Yahia, I.S.; Yakuphanoglu, F. Synthesis, diffused reflectance and electrical properties of nanocrystalline Fe-doped ZnO via sol-gel calcination technique. Opt. Laser Technol. 2013, 48, 447–452. [Google Scholar] [CrossRef] [Green Version]
  30. Wang, R.H.; Xin, J.H.Z.; Yang, Y.; Liu, H.F.; Xu, L.M.; Hu, J.H. The characteristics and photocatalytic activities of silver doped ZnO nanocrystallites. Appl. Surf. Sci. 2004, 227, 312. [Google Scholar] [CrossRef]
  31. Callister, W.D. Materials Science and Engineering: An Introduction, 4th ed.; John Wiley & Sons: NY, New York, USA, 1997. [Google Scholar]
  32. Padiyan, D.P.; Marikini, A.; Murli, K.R. Influence of thickness and substrate temperature on electrical and photoelectrical properties of vacuum-deposited CdSe thin films. Mater. Chem. Phys. 2002, 78, 51–58. [Google Scholar] [CrossRef]
  33. Kumar, V.; Singh, R.G.; Singh, N.; Kapoor, A.; Mehra, R.M.; Purohit, L.P. Synthesis and characterization of aluminum–boron Co-doped ZnO nanostructures. Mater. Res. Bull. 2013, 48, 362–366. [Google Scholar] [CrossRef]
  34. Davis, E.A.; Mott, N.F. Conduction in non-crystalline systems V. Conductivity, optical absorption and photoconductivity in amorphous semiconductors. Philos. Mag. 1970, 22, 903–922. [Google Scholar] [CrossRef]
  35. Konstantinou, I.K.; Albanis, T.A. TiO2-assisted photocatalytic degradation of azo dyes in aqueous solution: Kinetic and mechanistic investigations: A review. Appl. Catal. B Environ. 2004, 49, 1–14. [Google Scholar] [CrossRef]
  36. Sin, J.C.; Lam, S.M.; Satoshi, I.; Lee, K.T.; Mohamed, A.R. Sunlight photocatalytic activity enhancement and mechanism of novel europium-doped ZnO hierarchical micro/nanospheres for degradation of phenol. Appl. Catal. B Environ. 2014, 148, 258–268. [Google Scholar] [CrossRef]
  37. Chang, X.; Huang, J.; Tan, Q.; Wang, M.; Ji, G.; Deng, S.; Yu, G. Photocatalytic degradation of PCP-Na over BiOI nanosheets under simulated sunlight irradiation. Catal. Commun. 2009, 10, 1957–1961. [Google Scholar] [CrossRef]
  38. Kuriakose, S.; Satpati, B.; Mohapatra, S. Enhanced photocatalytic activity of Co-doped ZnO nanodisks and nanorods prepared by a facile wet chemical method. Phys. Chem. Chem. Phys. 2014, 16, 12741–12749. [Google Scholar] [CrossRef]
  39. Minero, C.; Mariella, G.; Maurino, V.; Pelizzetti, E. Photocatalytic transformation of organic compounds in the presence of inorganic anions. 1. Hydroxyl-mediated and direct electron-transfer reactions of phenol on a titanium dioxide-fluoride system. Langmuir 2000, 16, 2632–2641. [Google Scholar] [CrossRef]
  40. Kayaci, F.; Vempati, S.; Donmez, I.; Biyikli, N.; Uyar, T. Role of zinc interstitials and oxygen vacancies of ZnO in photocatalysis: A bottom-up approach to control defect density. Nanoscale 2014, 6, 10224–10234. [Google Scholar] [CrossRef] [Green Version]
  41. Tsonos, C. Comments on frequency-dependent AC conductivity in polymeric materials at the low-frequency regime. Curr. Appl. Phys. 2019, 19, 491–497. [Google Scholar] [CrossRef] [Green Version]
  42. Zheng, Y.; Chen, C.; Zhan, Y.; Lin, X.; Zheng, Q.; Wei, K.; Zhu, J.; Zhu, Y. Luminescence and photocatalytic activity of ZnO nanocrystals: Correlation between structure and property. Inorg. Chem. 2007, 46, 6675–6682. [Google Scholar] [CrossRef]
  43. Kumar, V.; Gohain, M.; Kumar, V.; Tonder, J.H.V.; Bezuidenhoudt, B.C.B.; Ntwaeaborwa, O.M.; Swart, H.C. Synthesis of quinoline based heterocyclic compounds for blue lighting application. Opt. Mater. 2015, 50, 275–281. [Google Scholar] [CrossRef]
  44. Dong, X.U.; Jiang, B.; Jiao, L.; Cui, F.-D.; Xu, H.-X.; Yang, Y.-T.; Yu, R.-H.; Cheng, X.-N. Sol–gel synthesis of Y2O3-doped ZnO thin films varistors and their electrical properties. Trans. Nonferrous Met. Soc. China 2012, 22 (Suppl. S1), s110–s114. [Google Scholar]
  45. Murowski, L.; Barczynski, R.J. Dielectric Properties of Transition Metal Oxide Glasses. J. Non-Cryst. Solids 1995, 185, 84. [Google Scholar] [CrossRef]
  46. Chauhan, S.; Kumar, M.; Chhoker, S.; Katyal, S.C.; Awana, V.P.S. Structural, vibrational, optical, and magnetic properties of sol-gel derived Nd-doped ZnO nanoparticles. J. Mater. Sci. Mater. Electron. 2013, 24, 5102–5110. [Google Scholar] [CrossRef]
  47. Chao, L.C.; Huang, J.W.; Chang, C.W. Annealing effects on the properties of Nd containing ZnO nanoparticles prepared by sol-gel process. Physica B 2009, 404, 1301. [Google Scholar] [CrossRef]
  48. SowriBabun, K.; Reddy, A.R.; Sujatha, C.; Reddy, K.V. Effects of precursor, temperature, surface area and excitation wavelength on photoluminescence of ZnO/mesoporous silica nanocomposite. Ceram. Int. 2013, 39, 3055–3064. [Google Scholar] [CrossRef]
  49. Zhang, W.C.; Wu, X.L.; Chen, H.T.; Zhu, J.; Huang, G.S. The Excitation wavelength dependence of the visible photoluminescence from amorphous ZnO granular films. J. Appl. Phys. 2008, 103, 093718. [Google Scholar] [CrossRef]
  50. El-Kabbany, F.; Taha, S.; Hafez, M. A study of the phase transition of reheated diphenyl carbazide (DPC) by using UV spectroscopy. Spectrochim. Acta Part A Mol. Biomol. Spectrosc. 2014, 128, 481–488. [Google Scholar] [CrossRef]
  51. Ishii, H.; Hayashi, N.; Ito, E.; Washizu, Y.; Sugi, K.; Kimura, Y.; Seki, K. Metal Interfaces: Examination of Fermi Level Alignment. Phys. Org. Semicond. 2006, 3, 69. [Google Scholar]
  52. Shivakumara, C.; John, A.K.; Behera, S.; Dhananjaya, N.; Saraf, R. Photoluminescence and photocatalytic properties of Eu3+-doped ZnO nanoparticles synthesized by the nitrate-citrate gel combustion method. Eur. Phys. J. Plus 2017, 132, 44. [Google Scholar] [CrossRef]
  53. Poornaprakash, B.; Chalapathi, U.; Sekhar, M.C.; Rajendar, V.; Prabhakar, S.V.; Vattikuti, S.P.; Reddy, M.S.P.; Suh, Y.; Park, S.H. Effect of Eu3+ on the morphology, structural, optical, magnetic, and photocatalytic properties of ZnO nanoparticles. Superlattices Microstruct. 2018, 123, 154–163. [Google Scholar] [CrossRef]
  54. Hernández-Carrillo, M.A.; Torres-Ricárdez, R.; García-Mendoza, M.F.; Ramírez-Morales, E.; Rojas-Blanco, L.; Díaz-Flores, L.L.; Sepúlveda-Palacios, G.E.; Paraguay-Delgado, F.; Pérez-Hernández, G. Eu-modified ZnO nanoparticles for applications in photocatalysis. Catal. Today 2010, 349, 191–197. [Google Scholar] [CrossRef]
  55. Trandafilović, L.V.; Jovanović, D.J.; Zhang, X.; Ptasińska, S.; Dramićanin, M.D. Enhanced photocatalytic degradation of methylene blue and methyl orange by ZnO: Eu nanoparticles. Appl. Catal. B Environ. 2017, 203, 740–752. [Google Scholar] [CrossRef] [Green Version]
  56. Vaiano, V.; Matarangolo, M.; Sacco, O.; Sannino, D. Photocatalytic Removal of Eriochrome Black T Dye over ZnO Nanoparticles Doped with Pr, Ce or Eu. Chem. Eng. Trans. 2017, 57, 625–630. [Google Scholar]
  57. Franco, P.; Sacco, O.; De Marco, I.; Sannino, D.; Vaiano, V. Photocatalytic Degradation of Eriochrome Black-T Azo Dye Using Eu-doped ZnO Prepared by Supercritical Antisolvent Precipitation Route: A Preliminary Investigation. Top. Catal. 2020, 63, 1193–1205. [Google Scholar] [CrossRef]
  58. Phuruangrat, A.; Yayapao, O.; Thongtem, T.; Thongtem, S. Synthesis and Characterization of Europium-Doped Zinc Oxide Photocatalyst. J. Nanomater. 2014, 2014, 367529. [Google Scholar] [CrossRef] [Green Version]
  59. Zong, Y.; Li, Z.; Wang, X.; Ma, J.; Men, Y. Synthesis and high photocatalytic activity of Eu-doped ZnO nanoparticles. Ceram. Int. 2014, 40, 10375–10382. [Google Scholar] [CrossRef]
  60. Balachandran, S.; Jothi, K.J.; Selvakumar, K.; Bhat, D.K.; Sathiyanarayanan, K.; Swaminathan, M. Solar active ZnO–Eu2O3 for energy and environmental applications. Mater. Chem. Phys. 2020, 256, 123624. [Google Scholar] [CrossRef]
  61. Li, H.; Li, W.; Gu, S.; Wang, F.; Zhou, H.; Liu, X.; Ren, C. Enhancement of photocatalytic activity in Tb/Eu co-doped Bi2 MoO6: The synergistic effect of Tb–Eu redox cycles. RSC Adv. 2016, 6, 48089–48098. [Google Scholar] [CrossRef]
  62. Rauf, M.A.; Meetani, M.A.; Hisaindee, S. An overview on the photocatalytic degradation of azo dyes in the presence of TiO2 doped with selective transition metals. Desalination 2011, 276, 13–27. [Google Scholar] [CrossRef]
  63. Li, Y.; Niu, J.; Yin, L.; Wang, W.; Bao, Y.; Chen, J.; Duan, Y. Photocatalytic degradation kinetics and mechanism of pentachlorophenol based on superoxide radicals. J. Environ. Sci. 2011, 23, 1911–1918. [Google Scholar] [CrossRef]
  64. Hoffmann, M.R.; Martin, S.T.; Choi, W.; Bahnemann, D.W. Environmental applications of semiconductor photocatalysis. Chem. Rev. 1995, 95, 69–96. [Google Scholar] [CrossRef]
  65. Yilmaz, S.; Turkoglu, O.; Ari, M.; Belenli, I. Electrical conductivity of the ionic conductor tetragonal (Bi2O3)1-x(Eu2O3)x. Ceramica 2011, 57, 185–192. [Google Scholar] [CrossRef]
  66. Gu, S.; Li, W.; Bian, Y.; Wang, F.; Li, H.; Liu, X. Highly-visible-light photocatalytic performance derived from a lanthanide self-redox cycle in Ln2O3/BiVO4 (ln: Sm, Eu, Tb) redox heterojunction. J. Phys. Chem. C 2016, 120, 19242–19251. [Google Scholar] [CrossRef]
  67. Yang, P.; Lu, C.; Hua, N.; Du, Y. Titanium dioxide nanoparticles co-doped with Fe3+ and Eu3+ ions for photocatalysis. Mater. Lett. 2002, 57, 794–801. [Google Scholar] [CrossRef]
  68. Houas, A.; Lachheb, H.; Ksibi, M.; Elaloui, E.; Guillard, C.; Herrmann, J.-M. Photocatalytic degradation pathway of methylene blue in water. Appl. Catal. B 2001, 31, 145–157. [Google Scholar] [CrossRef]
  69. Tang, J.T.; Chen, X.M.; Liu, Y.; Gong, W.; Peng, Z.S.; Cai, T.J.; Jin, L.W.; Deng, Q. Europium-doped mesoporous anatase with enhanced photocatalytic activity toward the elimination of gaseous methanol. J. Phys. Chem. Solids 2012, 73, 198–203. [Google Scholar] [CrossRef]
  70. Weber, A.S.; Grady, A.M.; Koodali, R.T. Lanthanide modified semiconductor photocatalysts. Catal. Sci. Technol. 2012, 2, 683–693. [Google Scholar] [CrossRef]
  71. Wu, X.H.; Qin, W.; Ding, X.B.; Wen, Y.; Liu, H.L.; Jiang, Z.H. Photocatalytic activity of Eu-doped TiO2 ceramic films prepared by microplasma oxidation method. J. Phys. Chem. Solids 2007, 68, 2387–2393. [Google Scholar]
  72. Li, J.; Zhang, Z.; Lang, J.; Wang, J.; Zhang, Q.; Wang, J.; Han, Q.; Yang, J. Tuning red emission and photocatalytic properties of highly active ZnO nanosheets by Eu addition. J. Lumin. 2018, 204, 573–580. [Google Scholar] [CrossRef]
  73. Kaneva, N.; Bojinova, A.; Papazova, K.; Dimitrov, D. Photocatalytic purification of dye contaminated seawater by lanthanide (La3+, Ce3+, Eu3+) modified ZnO. Catal. Today 2015, 252, 113–119. [Google Scholar] [CrossRef]
  74. Liu, W.; Sun, W.; Borthwick, A.G.; Wang, T.; Li, F.; Guan, Y. Simultaneous removal of Cr (VI) and 4-chlorophenol through photocatalysis by a novel anatase/titanate nanosheet composite: Synergetic promotion effect and autosynchronous doping. J. Hazard. Mater. 2016, 317, 385–393. [Google Scholar] [CrossRef] [PubMed] [Green Version]
  75. Buxton, G.V.; Greenstock, C.L.; Helman, W.P.; Ross, A.B. A critical review of rate constants for reactions of hydrated electrons, hydrogen atoms, and hydroxyl radicals (OH/O-) in an aqueous solution. J. Phys. Chem. Ref. Data 1998, 17, 513–886. [Google Scholar] [CrossRef] [Green Version]
Figure 1. XRD patterns of the prepared Eu2O3-ZnO nanostructures at different concentrations. * is pure ZnO phase and ** is for Eu2O3 phase.
Materials 15 03257 g001
Figure 2. SEM images of pure and Eu2O3-doped ZnO nanostructured samples, with various europium (Eu) doping ratios (0–5 g).
Materials 15 03257 g002
Figure 3. FT-IR spectra of undoped ZnO and Eu2O3-doped ZnO nanocomposites at different europium (Eu) doping ratios.
Materials 15 03257 g003
Figure 4. Graph of the optical diffused reflectance (ODR) of all nanostructured Eu2O3-ZnO samples with different doping ratios of europium versus light wavelength.
Materials 15 03257 g004
Figure 5. Graph the absorption coefficient (k) of the prepared Eu2O3-ZnO nanocomposites as a function of light wavelength between 200 nm and 700 nm.
Materials 15 03257 g005
Figure 6. (a,b) Illustration of the relation between the optical allowed direct (αhυ)2 and indirect (αhυ)1/2 transitions of the prepared Eu2O3-doped ZnO nanocomposites versus the photon energy ().
Materials 15 03257 g006
Figure 7. (a,b) Concentration versus time for photodegradation using Eu2O3-ZnO of: (a) MB; (b) phenol.
Materials 15 03257 g007
Figure 8. (a,b) Degradation % using Eu2O3-doped ZnO nanocomposites of: (a) MB; (b) phenol.
Materials 15 03257 g008
Figure 9. (a,b) Kinetic data for photodegradation using Eu2O3-ZnO of: (a) MB; (b) phenol.
Materials 15 03257 g009
Scheme 1. Degradation mechanism for MB and phenol using Eu2O3-ZnO nanocomposites.
Materials 15 03257 sch001
Figure 10. (a,b) Trapping agent data for photodegradation using Eu2O3-doped ZnO of: (a) MB; (b) phenol.
Materials 15 03257 g010aMaterials 15 03257 g010b
Figure 11. (a,b) Recycling data for photodegradation in the presence of (a) 0.5 g Eu-doped ZnO (S4) of MB; (b) 1 g Eu-doped ZnO (S5) of phenol.
Materials 15 03257 g011
Table 1. Sample code of pure and doped ZnO nanostructures with different Eu2O3 concentrations.
Nanostructured SamplesCodesEu/Zn Molar%
Pure ZnOS0-
0.001 g Eu-doped ZnOS10.0001
0.01 g Eu-doped ZnOS20.001
0.1 g Eu-doped ZnOS30.01
0.5 g Eu-doped ZnOS40.05
1 g Eu-doped ZnOS50.09
2.5 g Eu-doped ZnOS60.21
5 g Eu-doped ZnOS70.35
Table 2. The calculated grain size, dislocation, and lattice strain values of all nanostructured Eu2O3-doped ZnO samples were studied from XRD analysis compared with the SEM results obtained.
SamplesMean Values from XRDFrom SEM Analysis
Grain
Size, (nm)
Dislocation
Density, (nm)−2
Lattice
Strain
Grain Sizes,
(nm)
Pure ZnO 88.8
Phase 1 ZnO40.20.0010.001
Phase 2 carbon33.50.0020.001
0.001 g Eu-doped ZnO 78.5
Phase 1 ZnO42.90.0010.001
Phase 2 Carbon30.60.0020.001
0.01 g Eu-doped ZnO
Phase 1 ZnO37.80.0010.001
Phase 2 Carbon13.60.0050.003
0.1 g Eu-doped ZnO 75.1
Phase 1 ZnO25.30.0030.002
Phase 2 Carbon13.70.0070.003
0.5 g Eu-doped ZnO 75.3
Phase 1 ZnO23.90.0030.002
Phase 2 Eu2O318.30.0030.002
1 g Eu-doped ZnO 86.7
Phase 1 ZnO21.90.0030.002
Phase 2 Eu2O315.10.0040.002
2.5 g Eu-doped ZnO 82.5
Phase 1 ZnO22.10.0030.002
Phase 2 Eu2O318.20.0040.002
5 g Eu-doped ZnO 83.8
Phase 1 ZnO24.90.0020.002
Phase 2 Eu2O318.50.0030.002
Table 3. The calculated optical energy bandgaps (both direct and indirect transitions) of Eu2O3-doped ZnO nanoparticles.
SamplesEg1(d), eVEg1(ind), eV
S03.283.20
S13.273.19
S23.253.17
S33.293.21
S43.243.14
S53.313.23
S63.303.22
S73.263.18
Table 4. Reaction rate constants of MB and Ph degradation in all prepared samples.
PhotocatalystDoping %Method of PreparationOrganic SolutionCatalyst Load (g/L)Irradiation TimeEnergy Source% DegradationRef.
Eu-doped ZnO2%Co-precipitationPhenol0.130 minSun light97.3%[51]
Eu-doped ZnO5%Combustion methodMB0.05150 minUV-light100%[52]
Eu-doped ZnO3%Co-precipitationRhB0.0250 minUV-light100%[53]
Eu-doped ZnO1.62%Co-precipitationMB0.02480 minHalogen lamp99.3%[54]
Eu-doped ZnO1%Co-precipitation in waterMB0.01150 minOsram Vitalux lamp90%[55]
Eu-doped ZnO3%Co-precipitation in methanolMO0.01150 minOsram Vitalux lamp62%[55]
Eu-doped ZnO0.46%Co-precipitationEBT3180 minUV-light-[56]
Eu-doped ZnO3%Supercritical antisolvent processEBT3240 minUV-light-[57]
Eu-doped ZnO3%Co-precipitationMB0.15300 minUV-light90.5%[58]
Eu-doped ZnO1%Co-precipitationMO0.1180 minUV-light95.3%[59]
Eu-doped ZnO9%HydrothermalRhB0.175 minVisible light99.2%[60]
Eu- doped ZnO0.5%CombustionMB0.180 minVisible light100%Present work
Eu-doped ZnO1%CombustionPhenol0.160 minVisible light100%Present work
Publisher’s Note: MDPI stays neutral with regard to jurisdictional claims in published maps and institutional affiliations.

