
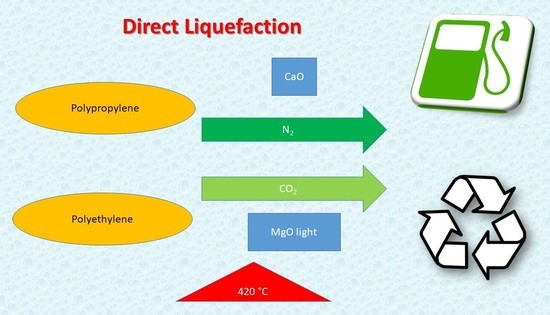
Direct Polypropylene and Polyethylene Liquefaction in CO2 and N2 Atmospheres Using MgO Light and CaO as Catalysts

 ,
,  , and
, and
Abstract
:
1. Introduction
2. Materials and Methods
2.1. Materials
2.2. Tests
2.3. Mass Balance
2.4. Analytical Methods
3. Results and Discussion
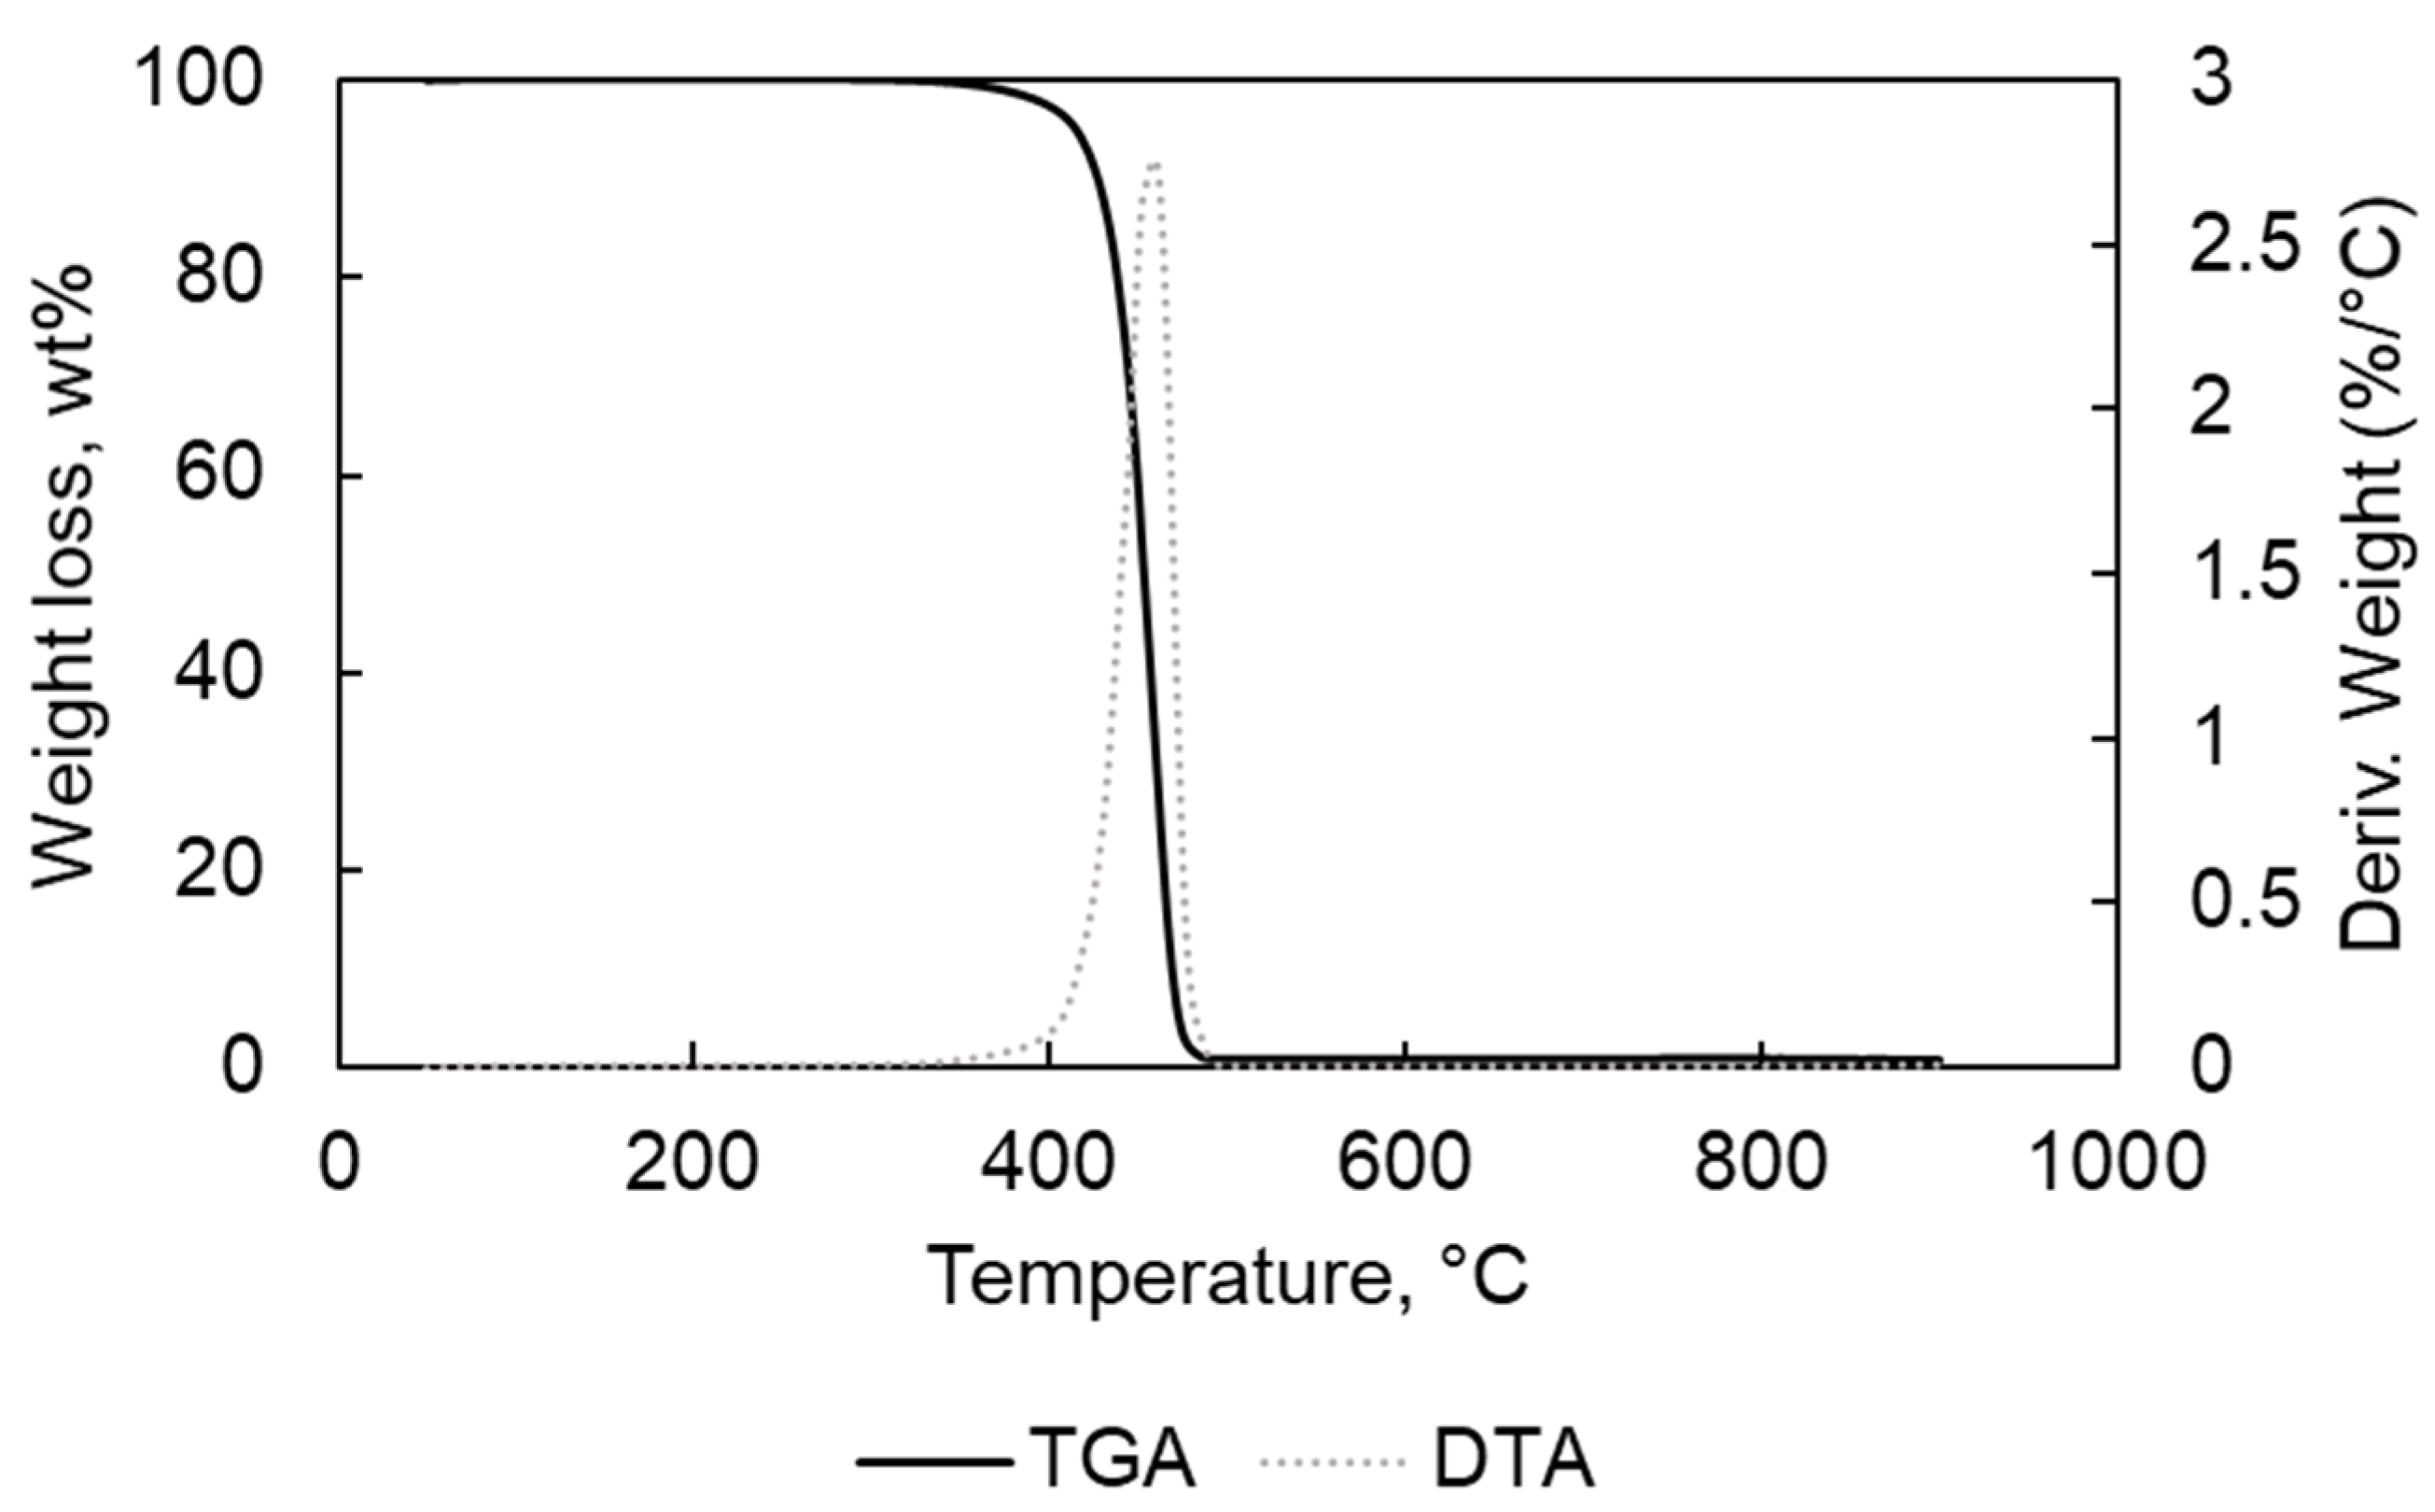
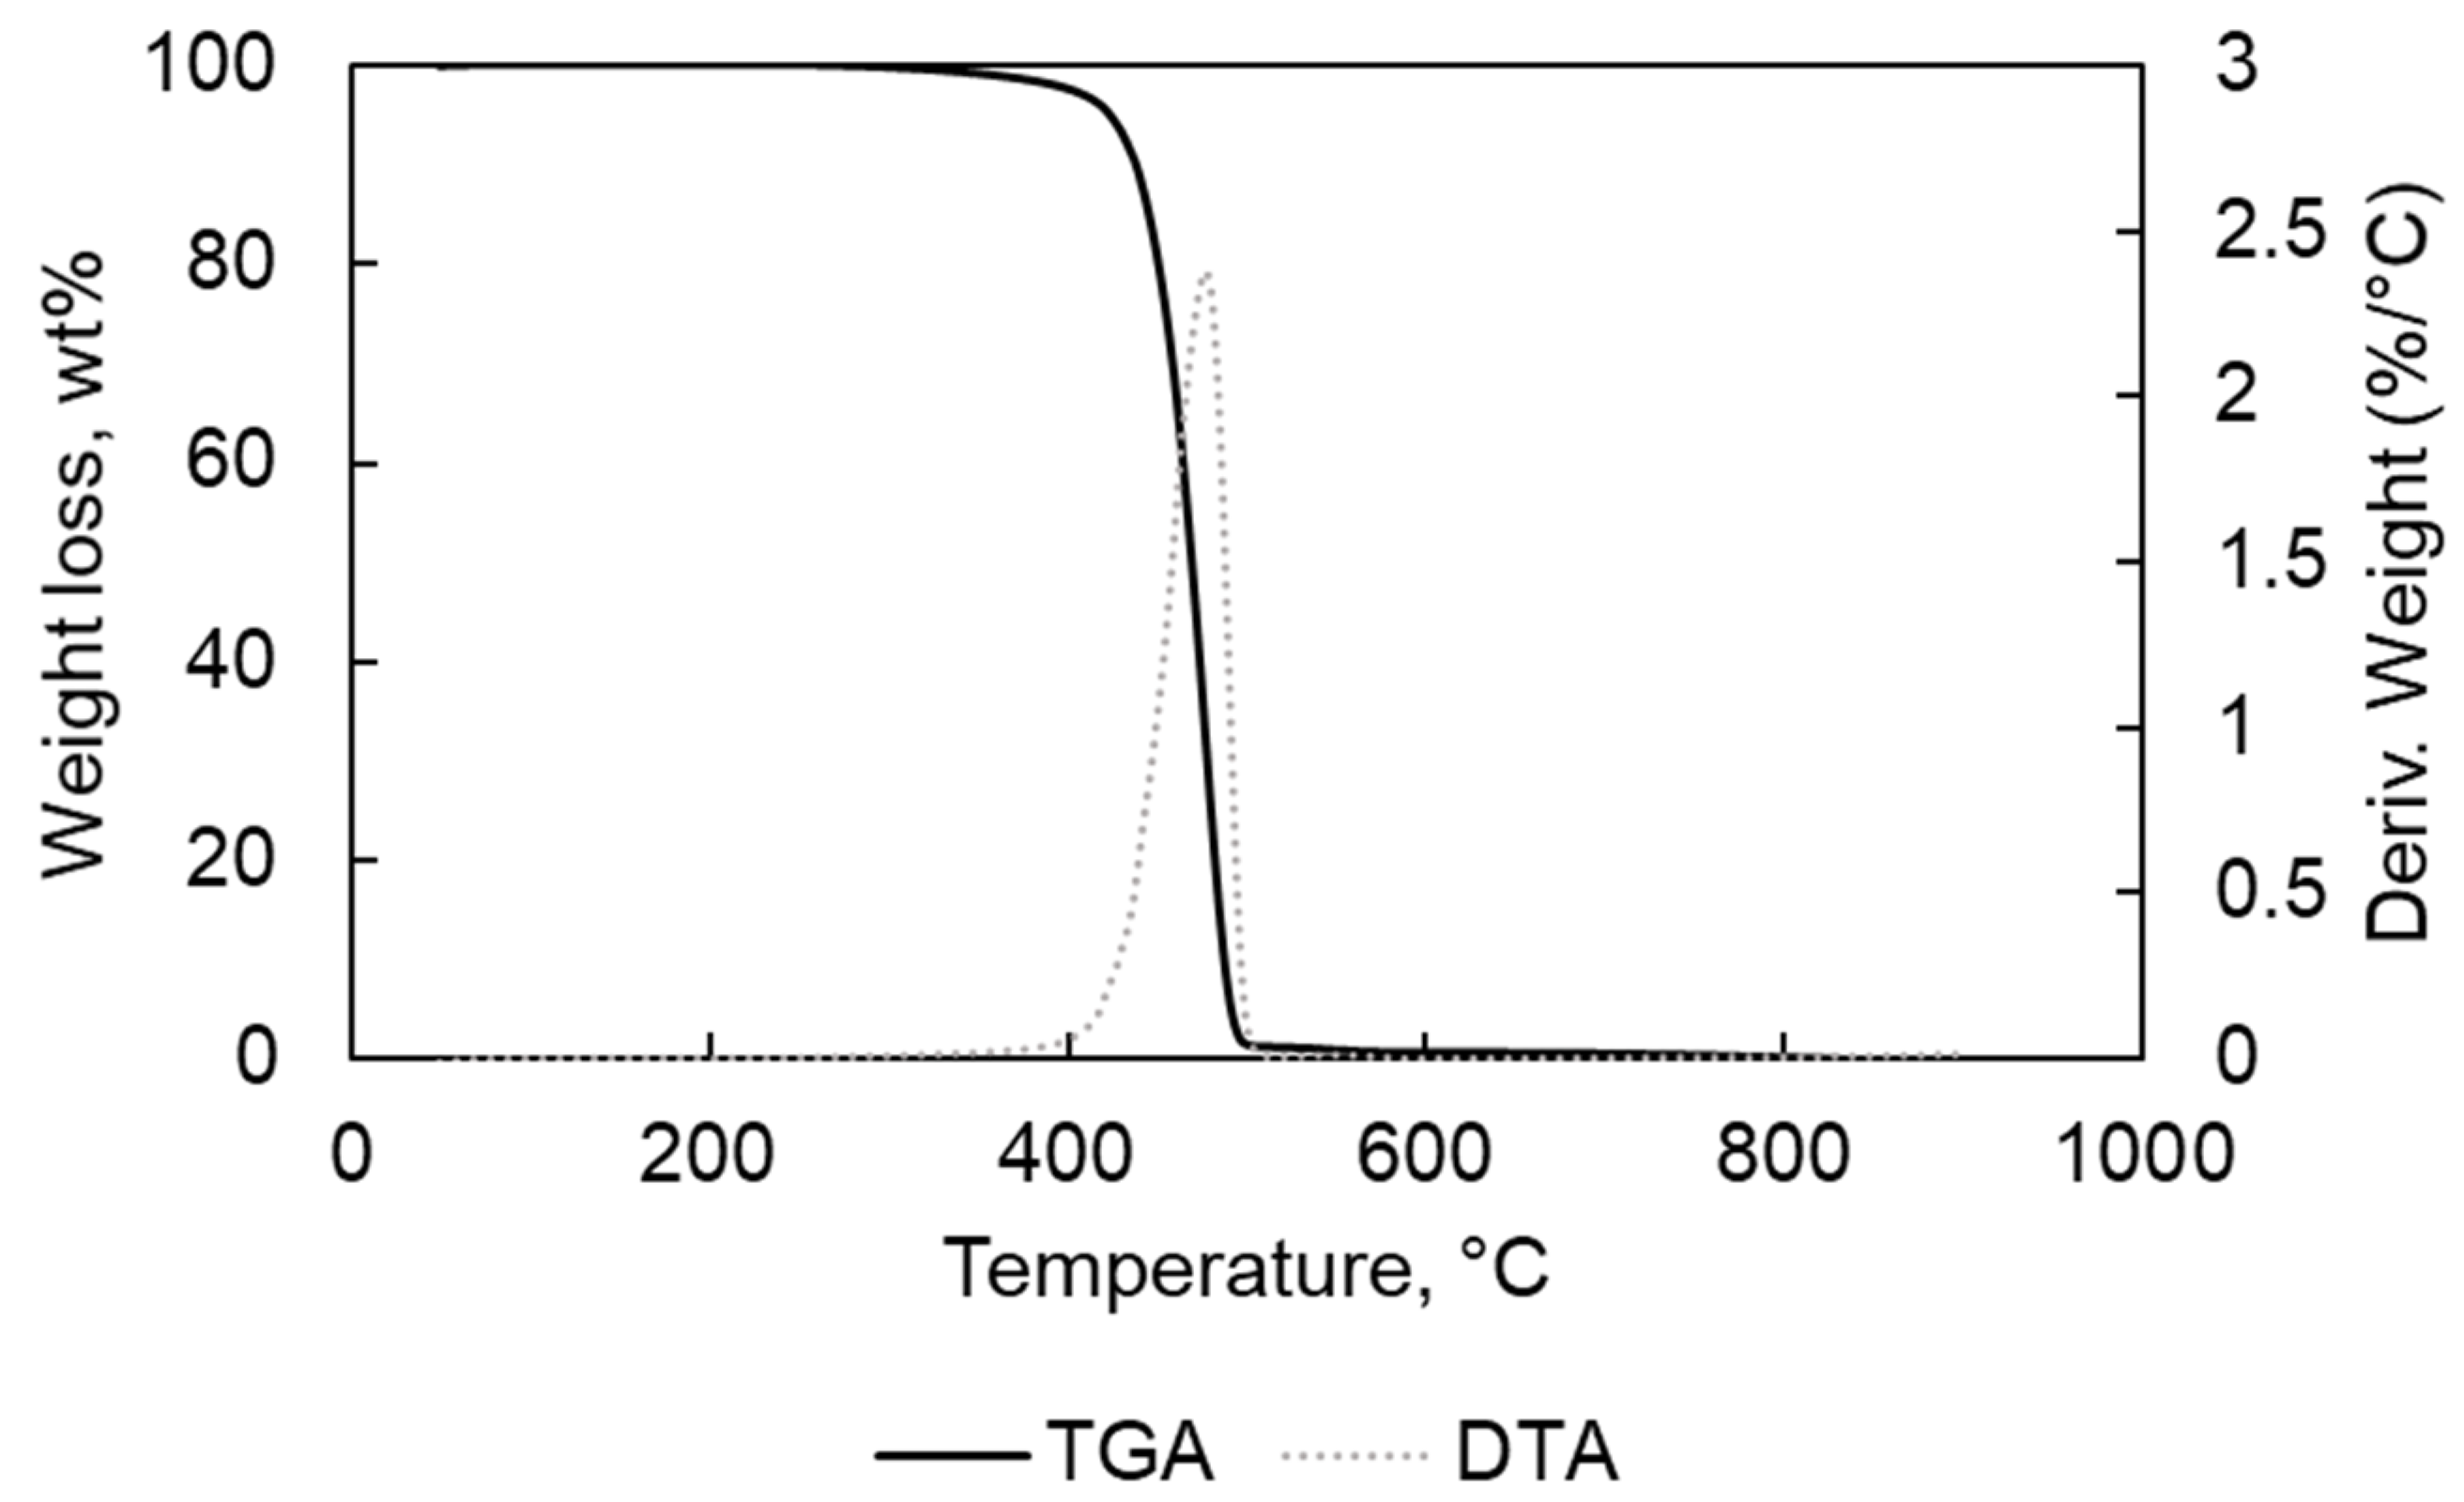
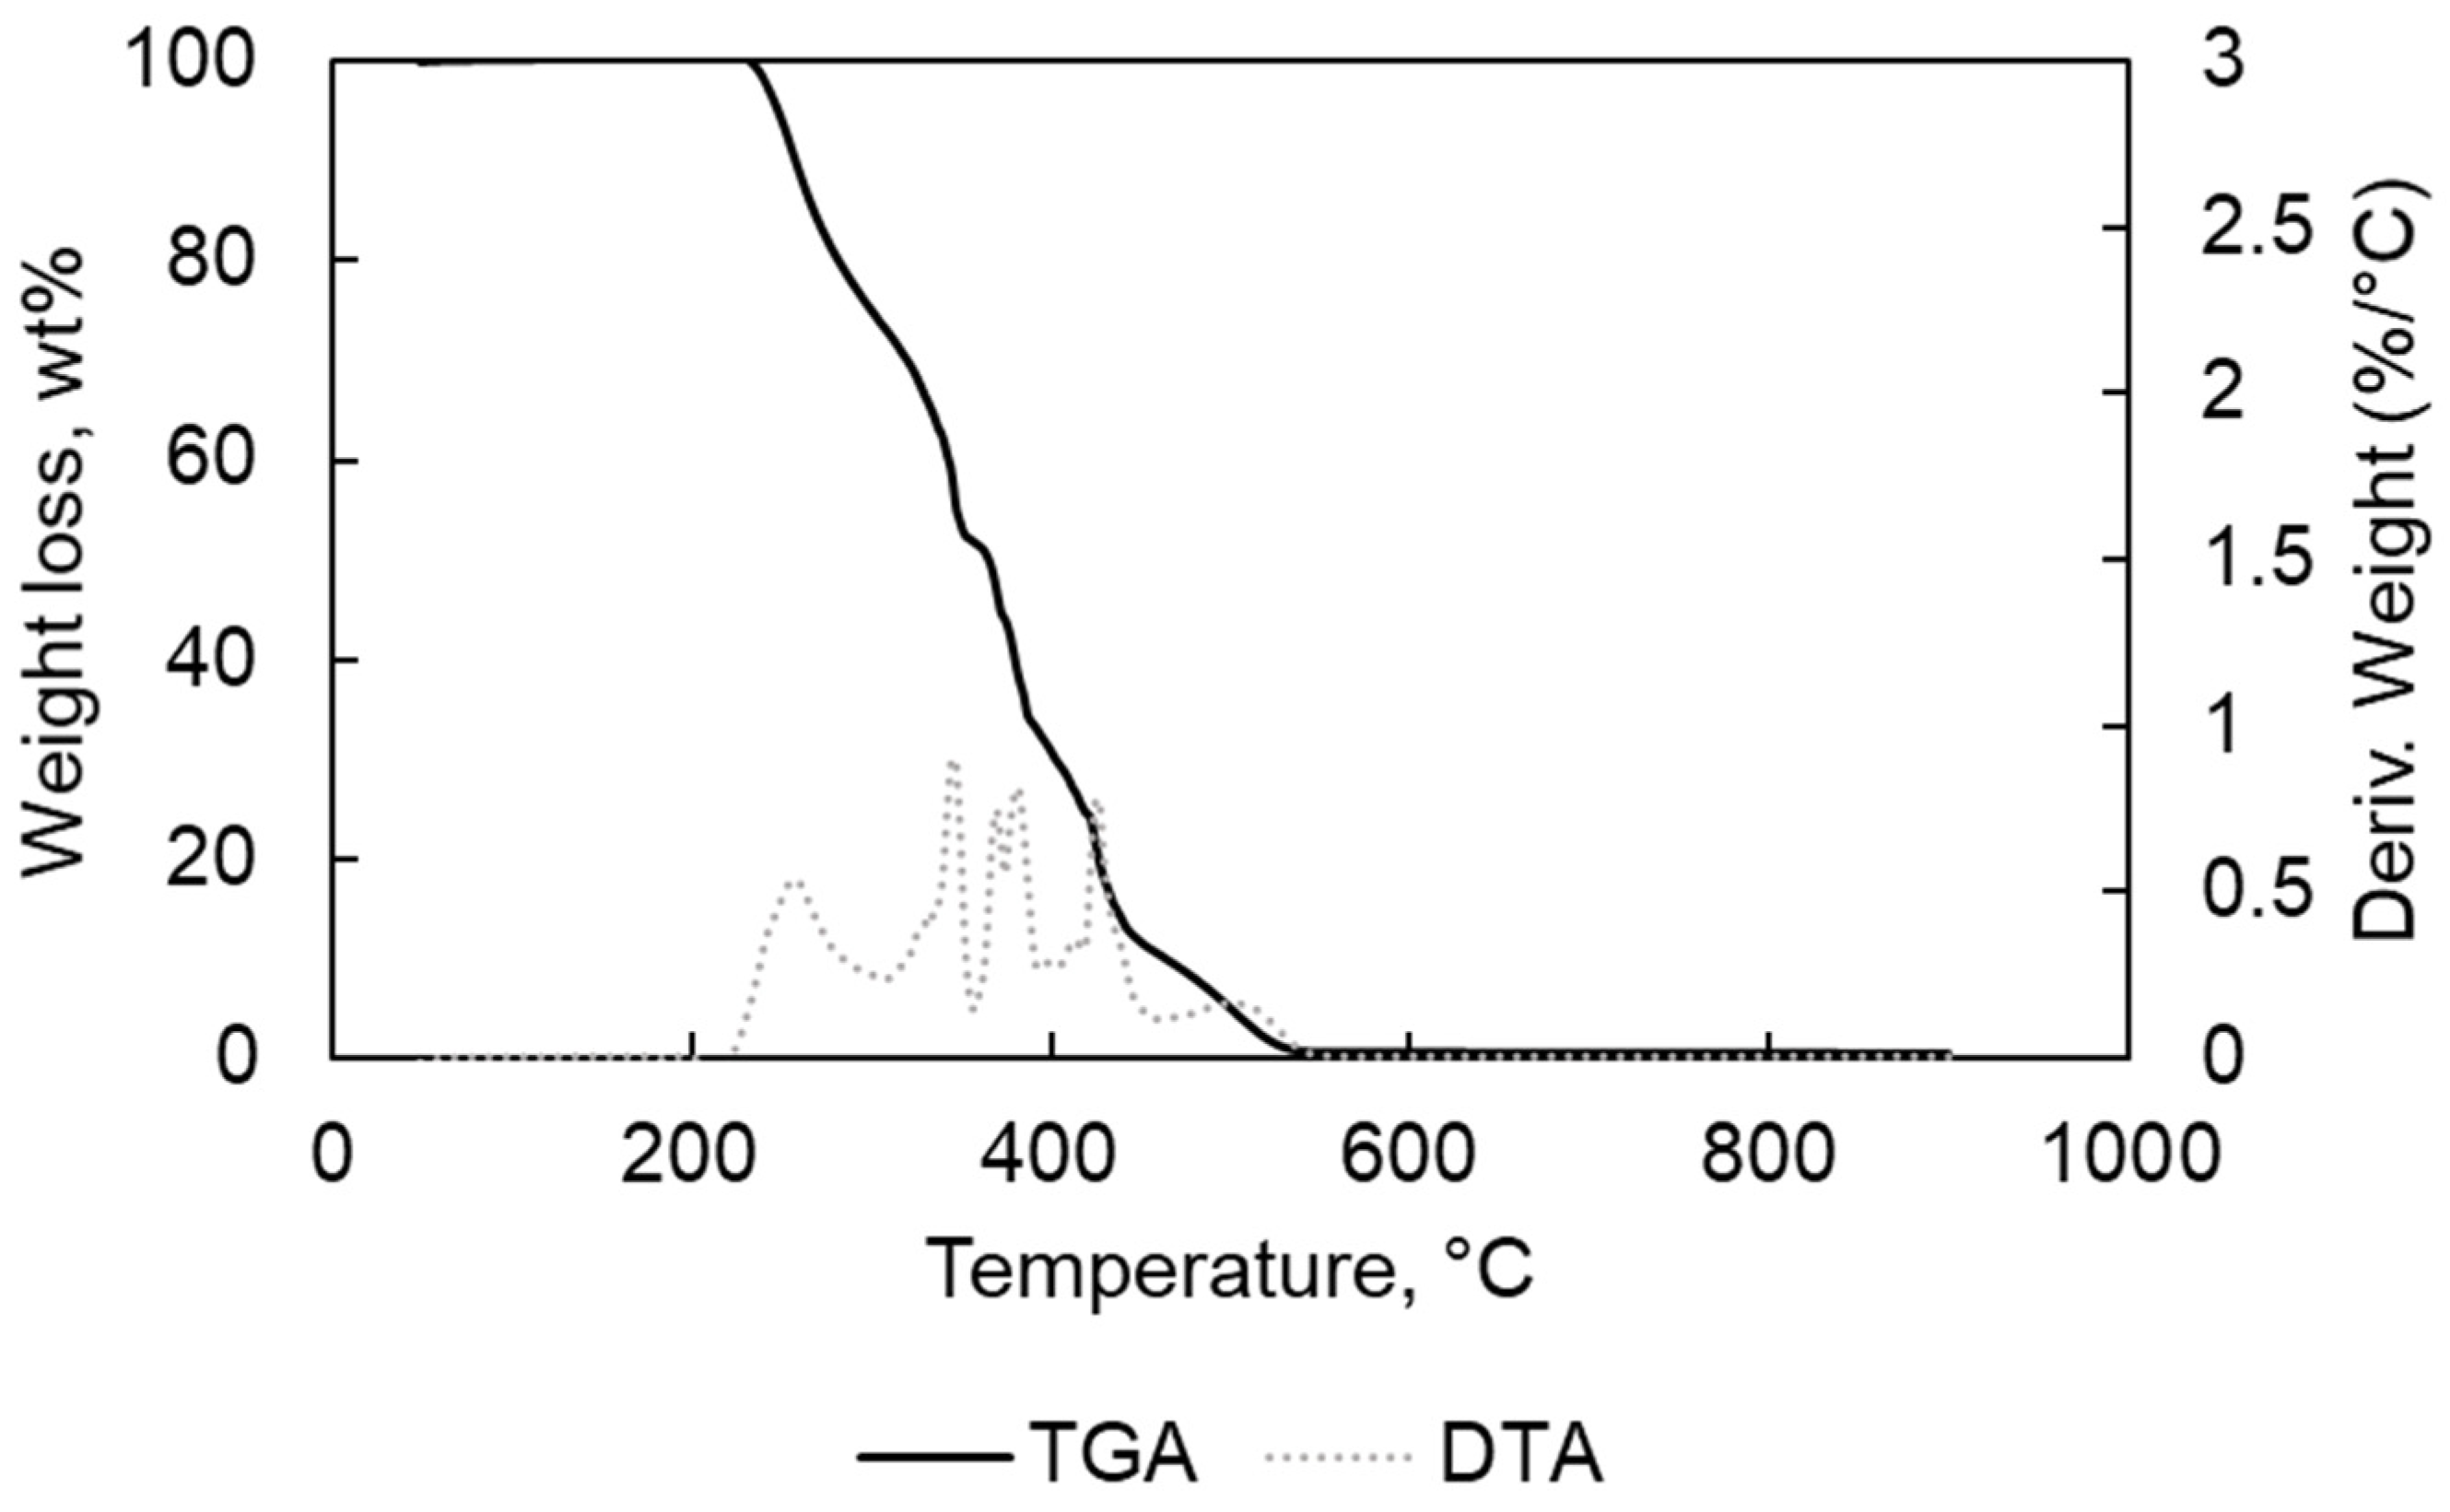
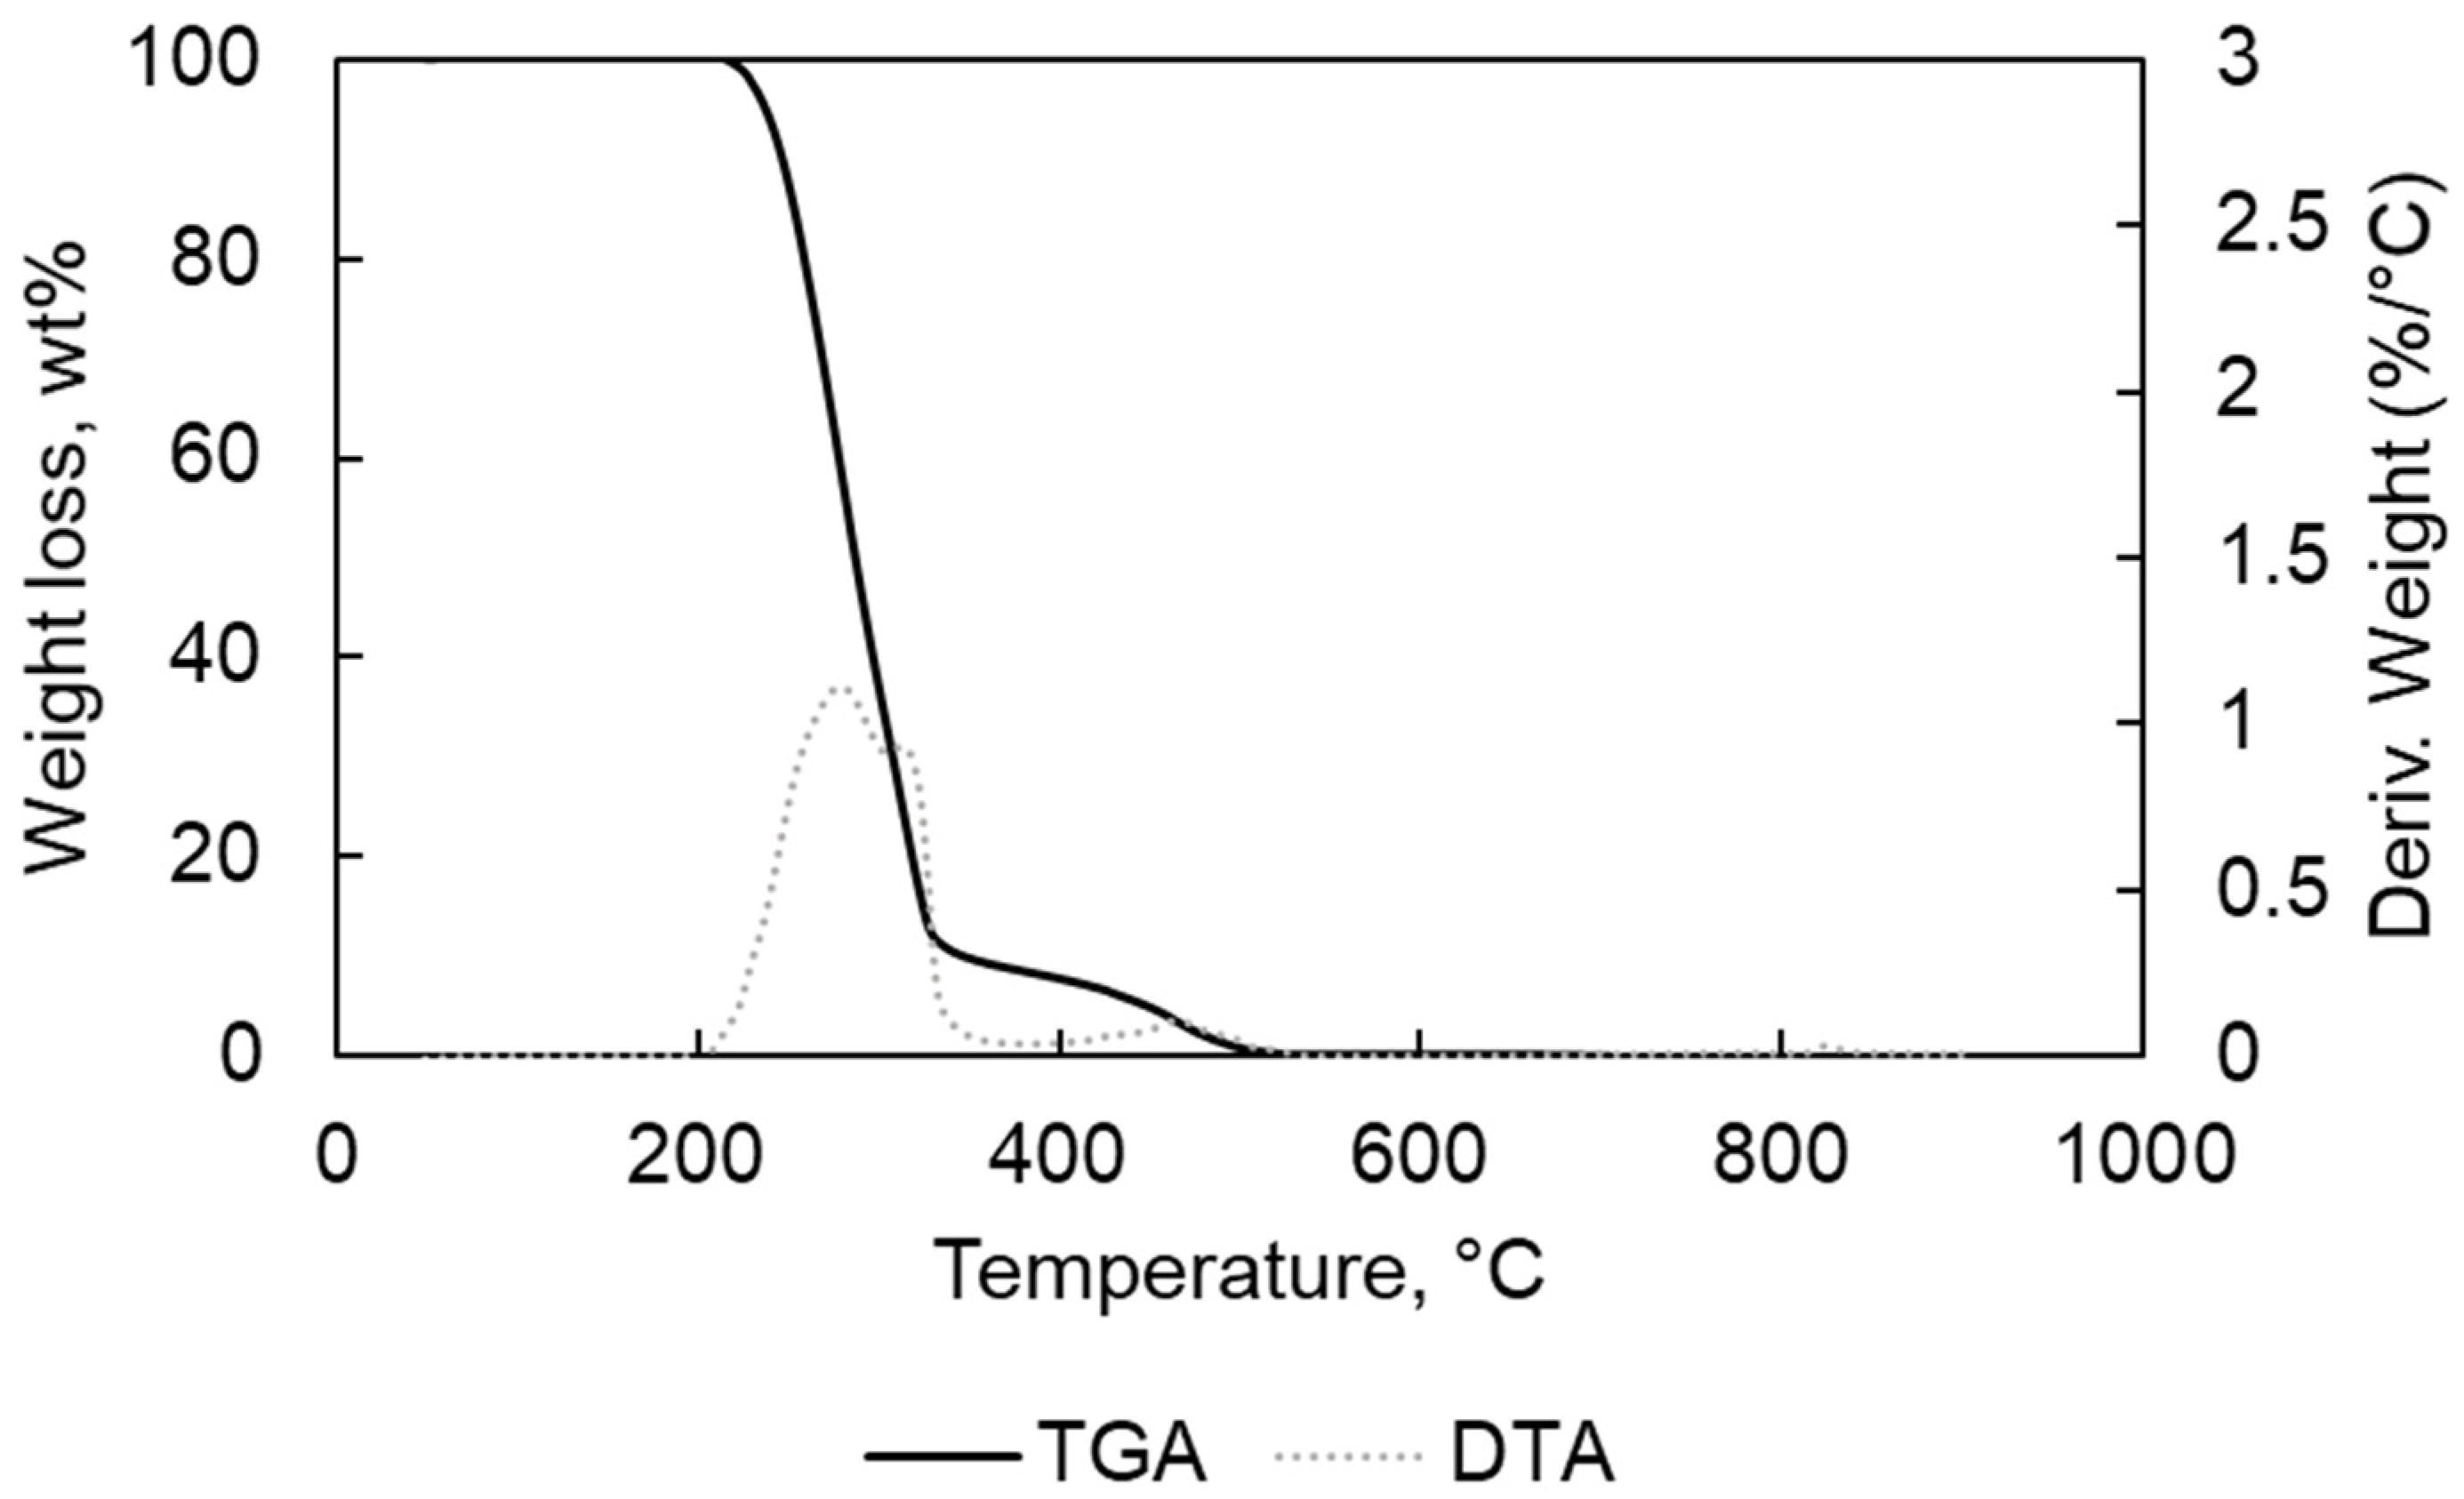
3.1. Feedstocks Analyses
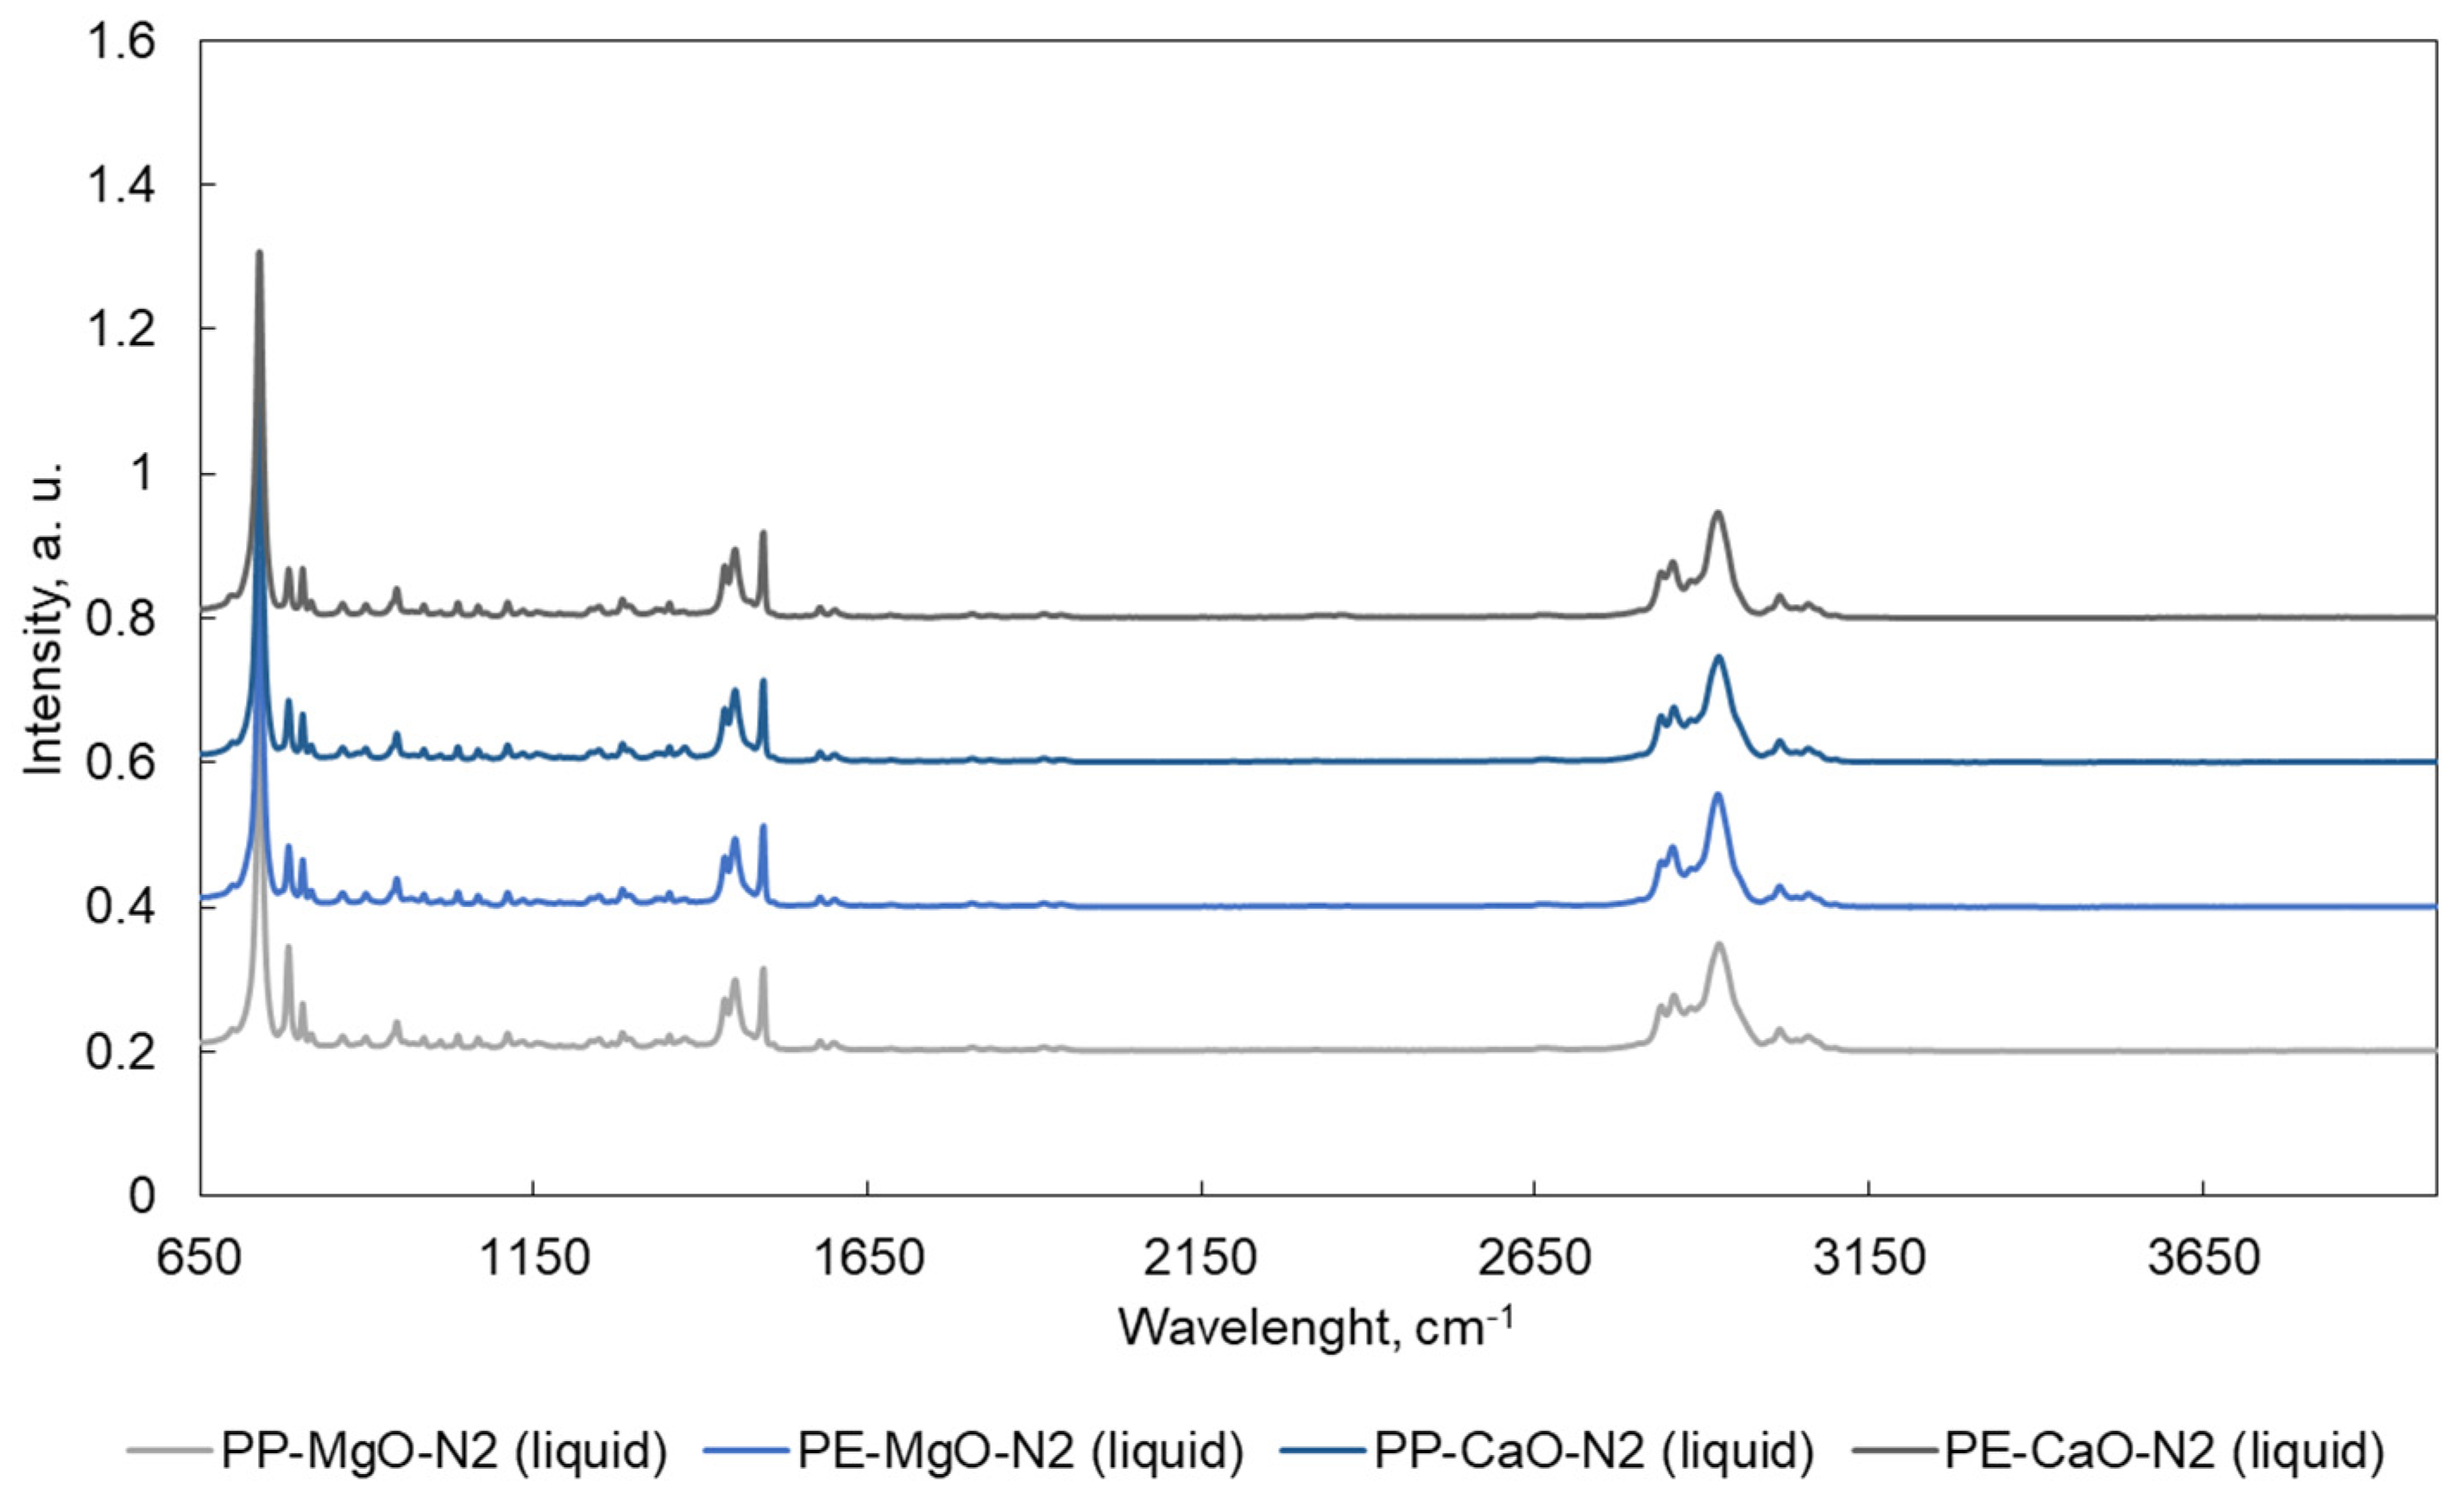
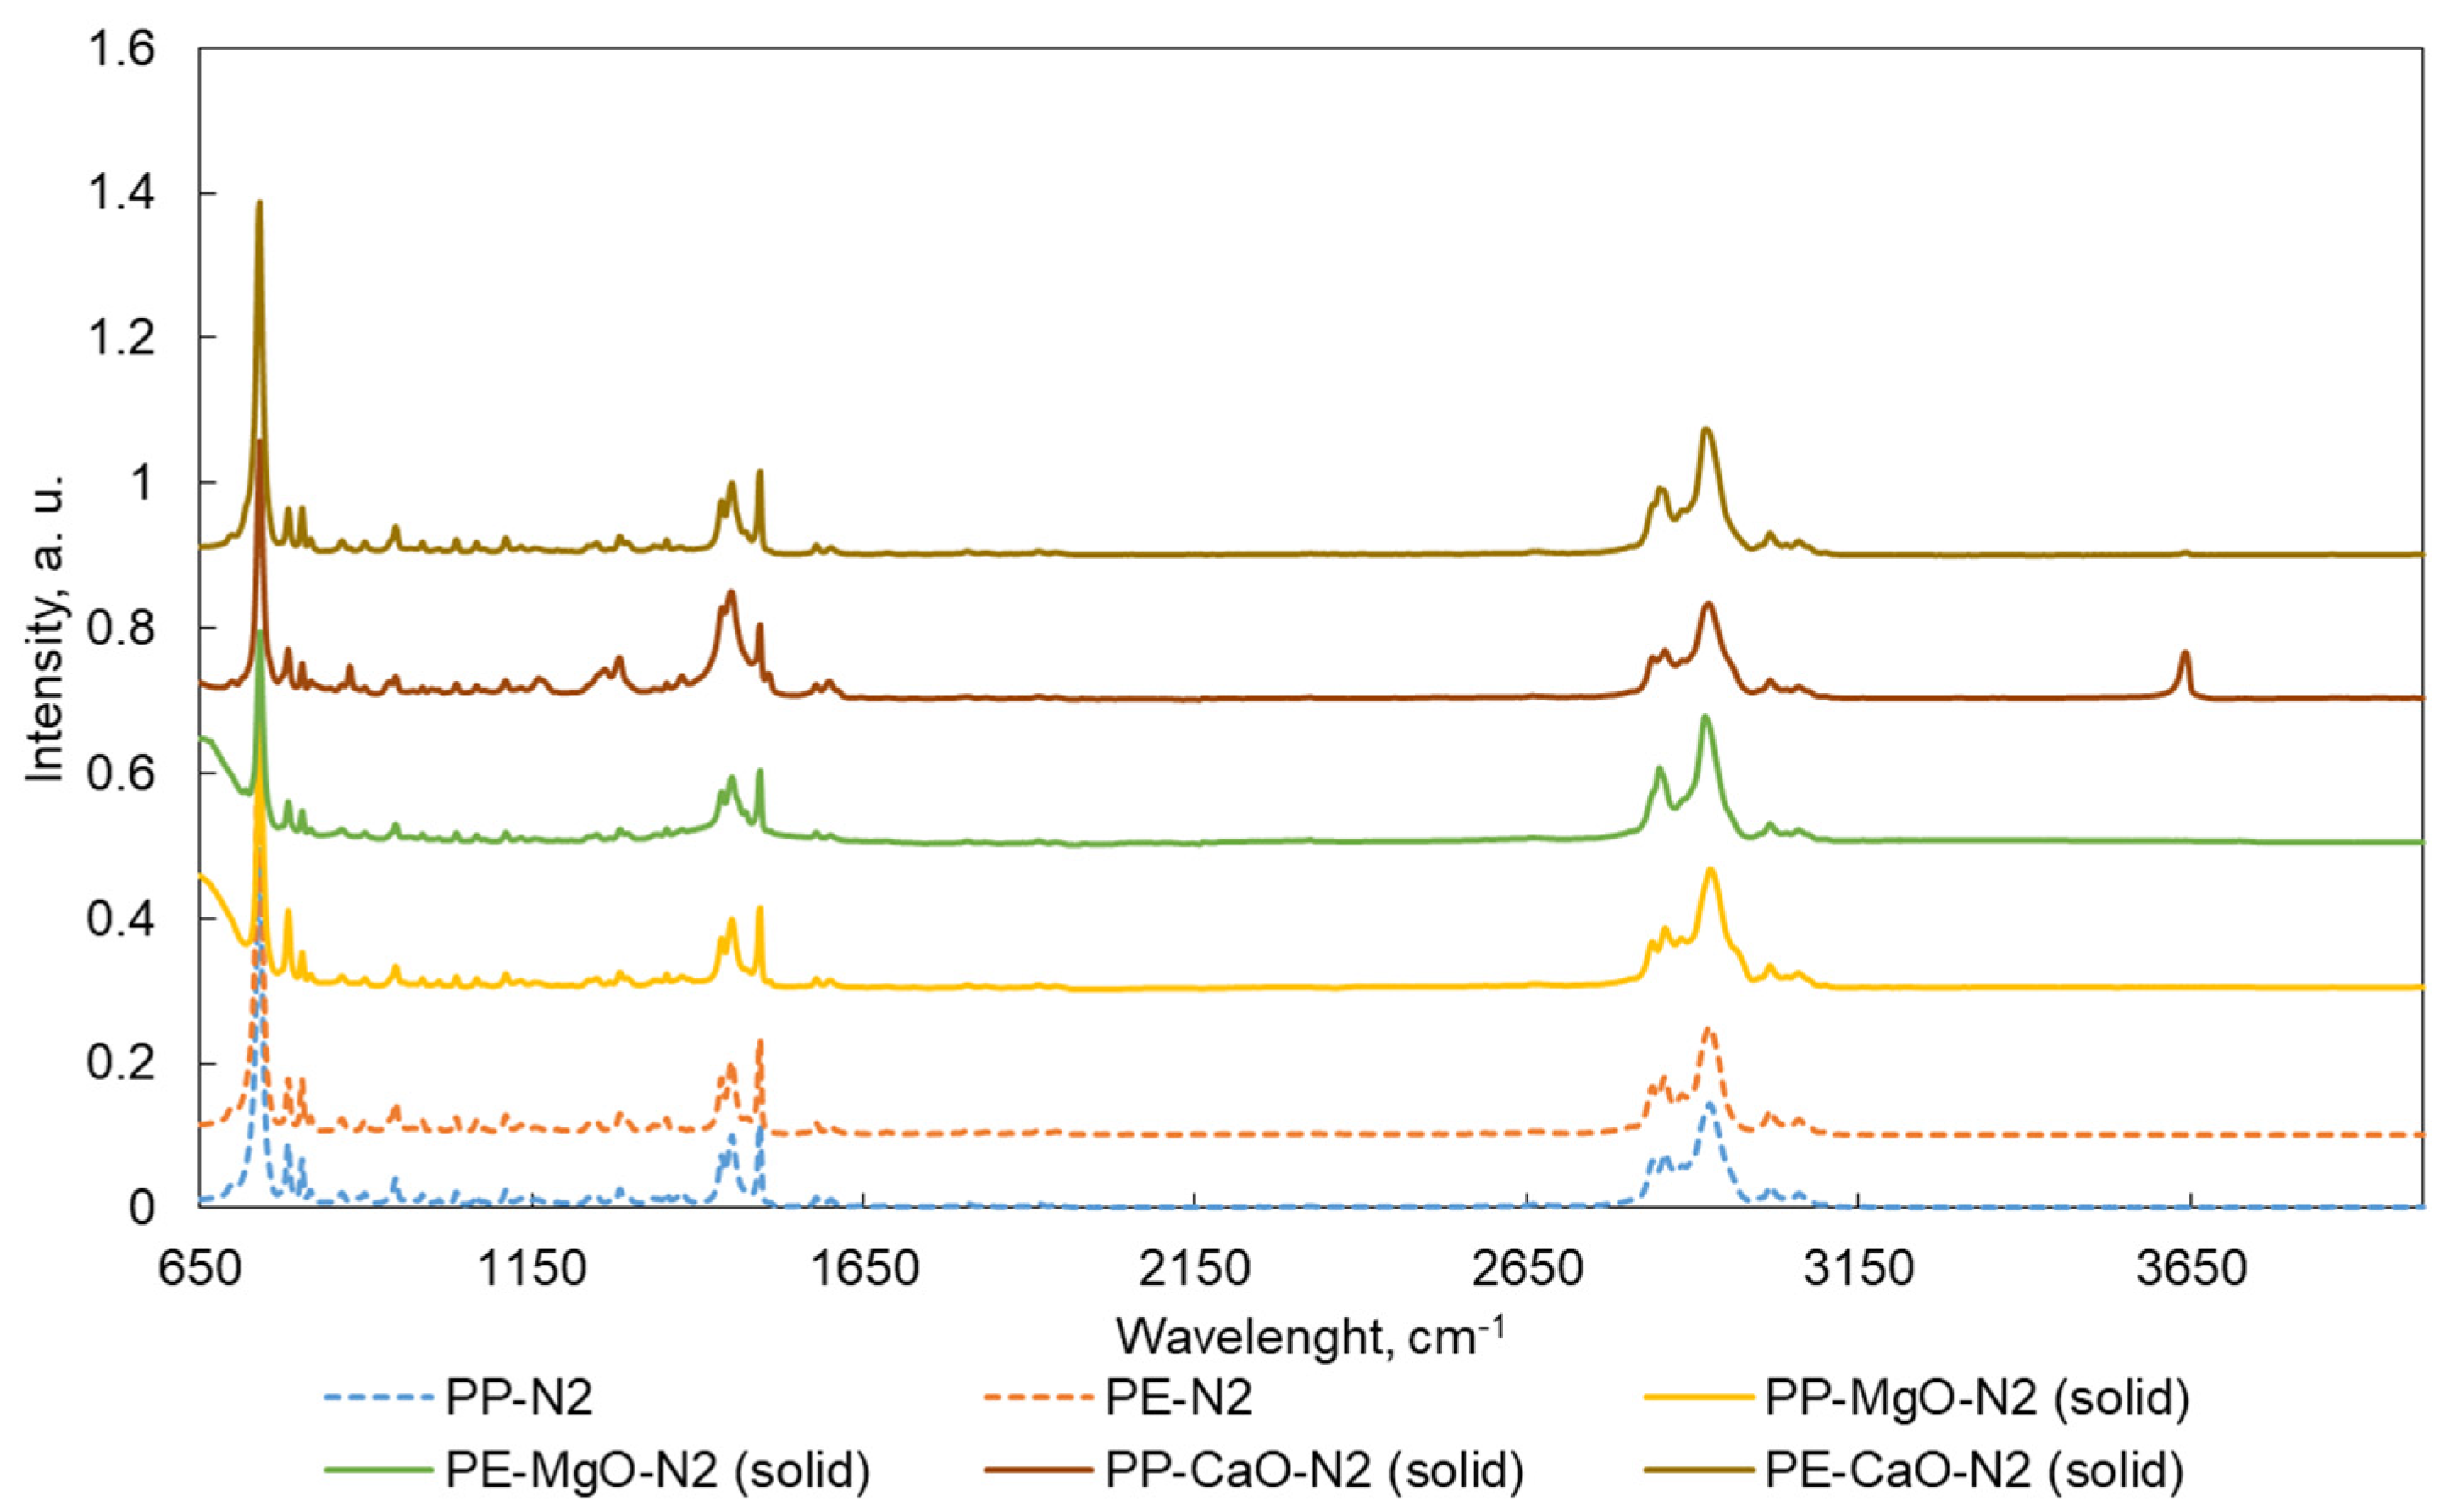
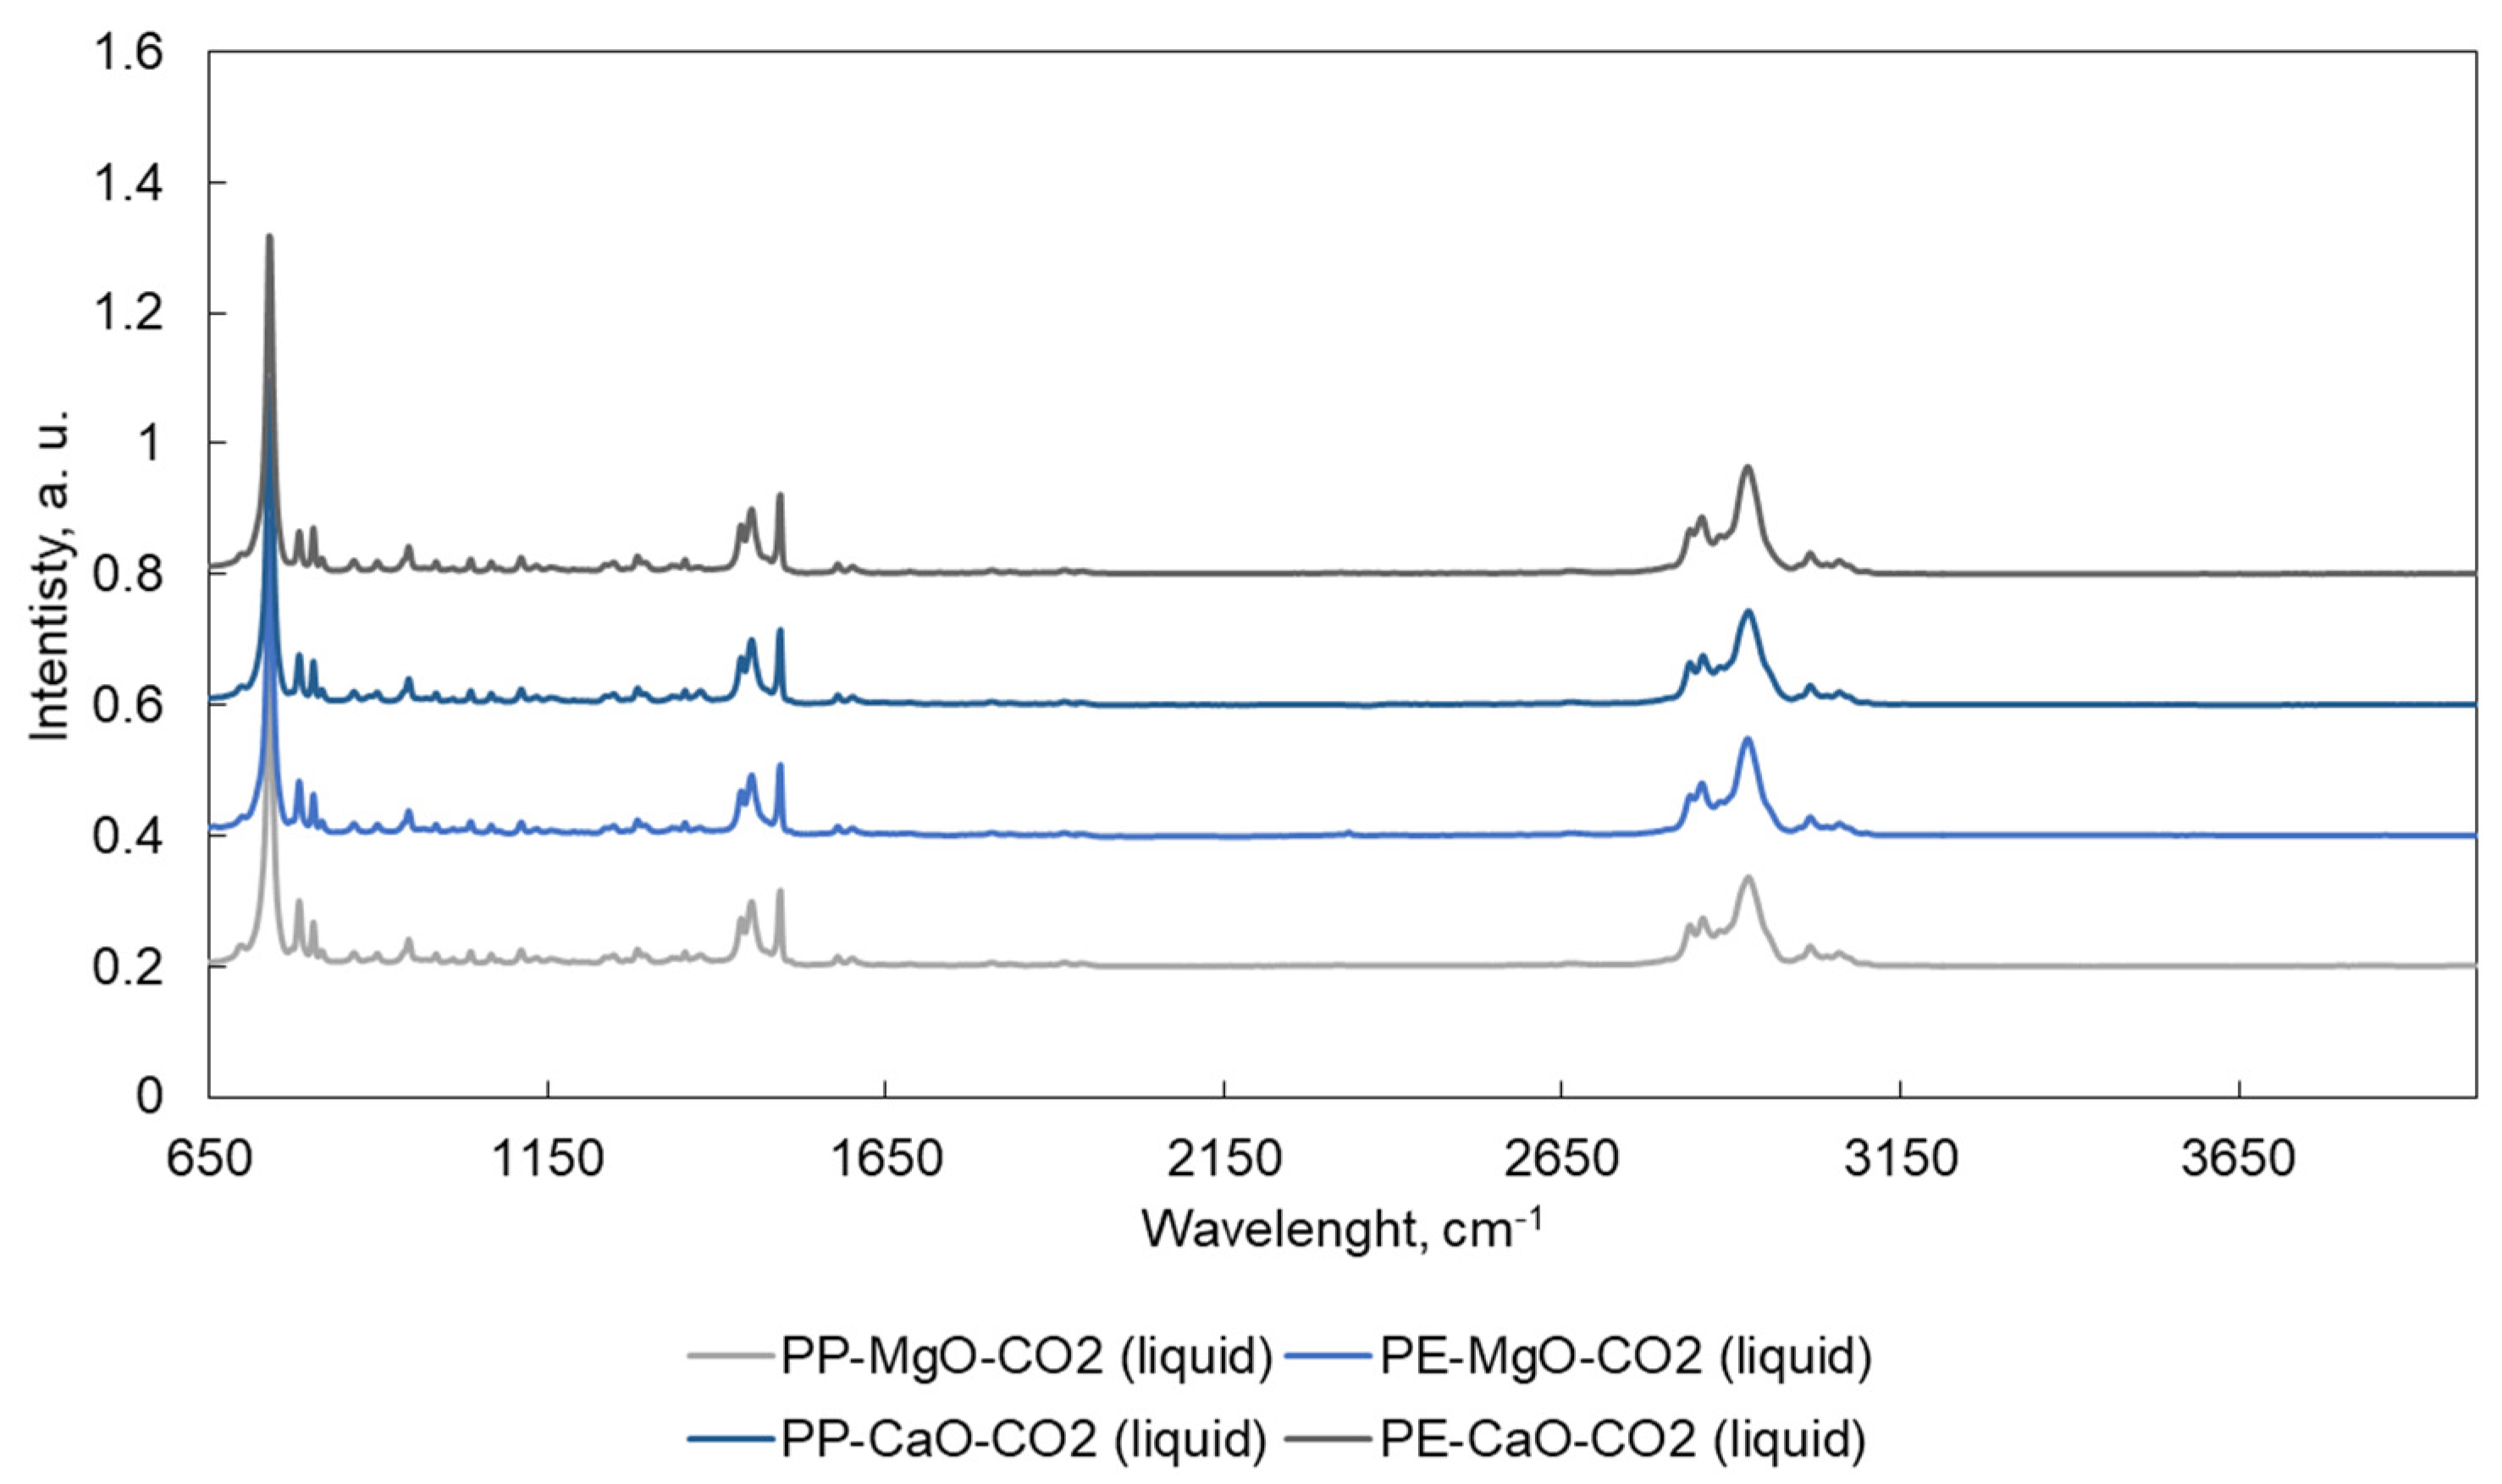
3.2. Product Analyses
4. Conclusions
Supplementary Materials
Author Contributions
Funding
Data Availability Statement
Conflicts of Interest
References
- Single-Use Plastics: New EU Rules to Reduce Marine Litter. European Commission—Fact Sheet. MEMO/18/3909. Brussels, 28 May 2018. Updated on 11/06/2018 at 11:40. Available online: https://ec.europa.eu/commission/presscorner/detail/en/MEMO_18_3909 (accessed on 30 July 2021).
- Abdel-Shafy, H.I.; Mansour, M.S.M. Solid Waste Issue: Sources, Composition, Disposal, Recycling, and Valorization. Egypt. J. Pet. 2018, 27, 1275–1290. [Google Scholar] [CrossRef]
- Schmaltz, E.; Melvin, E.C.; Diana, Z.; Gunady, E.F.; Rittschof, D.; Somarelli, J.A.; Virdin, J.; Dunphy-Daly, M.M. Plastic Pollution Solutions: Emerging Technologies to Prevent and Collect Marine Plastic Pollution. Environ. Int. 2020, 144, 106067. [Google Scholar] [CrossRef] [PubMed]
- Jin, K.; Vozka, P.; Kilaz, G.; Chen, W.-T.; Wang, N.-H.L. Conversion of Polyethylene Waste into Clean Fuels and Waxes via Hydrothermal Processing (HTP). Fuel 2020, 273, 117726. [Google Scholar] [CrossRef]
- Zhao, D.; Wang, X.; Miller, J.B.; Huber, G.W. The Chemistry and Kinetics of Polyethylene Pyrolysis: A Process to Produce Fuels and Chemicals. ChemSusChem 2020, 13, 1764–1774. [Google Scholar] [CrossRef] [PubMed]
- Bridgwater, A.V. Review of Fast Pyrolysis of Biomass and Product Upgrading. Biomass Bioenergy 2012, 38, 68–94. [Google Scholar] [CrossRef]
- Lu, Q.; Li, W.-Z.; Zhu, X.-F. Overview of Fuel Properties of Biomass Fast Pyrolysis Oils. Energy Convers. Manag. 2009, 50, 1376–1383. [Google Scholar] [CrossRef]
- Fernandes, F.; Matos, S.; Gaspar, D.; Silva, L.; Paulo, I.; Vieira, S.; Pinto, P.C.R.; Bordado, J.; Galhano dos Santos, R. Boosting the Higher Heating Value of Eucalyptus Globulus via Thermochemical Liquefaction. Sustainability 2021, 13, 3717. [Google Scholar] [CrossRef]
- Pinto, F.; Paradela, F.; Costa, P.; André, R.; Rodrigues, T.; Snape, C.; Herrador, J.M.H.; Fratczak, J. The Role of Solvent and Catalysts on Co-Liquefaction of Coal and Waste. Chem. Eng. Trans. 2018, 70, 1735. [Google Scholar] [CrossRef]
- Behrendt, F.; Neubauer, Y.; Oevermann, M.; Wilmes, B.; Zobel, N. Direct Liquefaction of Biomass. Chem. Eng. Technol. 2008, 31, 667–677. [Google Scholar] [CrossRef]
- Czajczyńska, D.; Anguilano, L.; Ghazal, H.; Krzyżyńska, R.; Reynolds, A.J.; Spencer, N.; Jouhara, H. Potential of Pyrolysis Processes in the Waste Management Sector. Therm. Sci. Eng. Prog. 2017, 3, 171–197. [Google Scholar] [CrossRef]
- Miandad, R.; Barakat, M.A.; Aburiazaiza, A.S.; Rehan, M.; Nizami, A.S. Catalytic Pyrolysis of Plastic Waste: A Review. Process Saf. Environ. Prot. 2016, 102, 822–838. [Google Scholar] [CrossRef]
- Huo, E.; Lei, H.; Liu, C.; Zhang, Y.; Xin, L.; Zhao, Y.; Qian, M.; Zhang, Q.; Lin, X.; Wang, C. Jet Fuel and Hydrogen Produced from Waste Plastics Catalytic Pyrolysis with Activated Carbon and MgO. Sci. Total Environ. 2020, 727, 138411. [Google Scholar] [CrossRef]
- Ding, K.; Zhong, Z.; Wang, J.; Zhang, B.; Fan, L.; Liu, S.; Wang, Y.; Liu, Y.; Zhong, D.; Chen, P. Improving Hydrocarbon Yield from Catalytic Fast Co-Pyrolysis of Hemicellulose and Plastic in the Dual-Catalyst Bed of CaO and HZSM-5. Bioresour. Technol. 2018, 261, 86–92. [Google Scholar] [CrossRef]
- Nobre, J.; Ahmed, H.; Bravo, M.; Evangelista, L.; de Brito, J. Magnesia (MgO) Production and Characterization, and Its Influence on the Performance of Cementitious Materials: A Review. Materials 2020, 13, 4752. [Google Scholar] [CrossRef] [PubMed]
- HDPE LITEN Is a Linear Polyethylene Produced Using UNIPOL™ Gas Phase Technology with a Capacity of 200 kta, Producing Natural, Unimodal Homopolymers. Available online: https://www.pe-liten.com/about-us (accessed on 24 November 2021).
- PP MOSTEN Is Produced by ORLEN Unipetrol RPA Using Innovene™ PP Gas Phase Technology with a Capacity 300 kt/Year. Available online: https://www.pp-mosten.com/about-us (accessed on 24 November 2021).
- ASTM D7169-0Standard Test Method for Boiling Point Distribution of Samples with Residues Such as Crude Oils and Atmospheric and Vacuum Residues by High Temperature Gas Chromatography; Developed by Subcommittee: 04.0H. ICS Code: 71.040.50, ASTM International: West Conshohocken, PA, USA, 2018. [CrossRef]
- ASTM D1218-21Standard Test Method for Refractive Index and Refractive Dispersion of Hydrocarbon Liquids, ASTM International: West Conshohocken, PA, USA, 2021. [CrossRef]
- ISO/TC 28/SC 2Measurement of petroleum and related products ICS: 75.080 Petroleum products in general ČSN EN ISO 12185, International Organization for Standardization: Geneva, Switzerland, 1996.
- Agilent Technologies. Agilent 720/725 ICP-OES—RELIABLE. PRODUCTIVE. ROBUST; Agilent Technologies: Santa Clara, CA, USA, 2012. [Google Scholar]
- Al-Maari, M.A.; Ahmad, M.A.; Din, A.T.M. Co-pyrolysis of oil palm empty fruit bunch and oil palm frond with low-density polyethylene and polypropylene for bio-oil production. Arab. J. Chem. 2021, 14, 103282. [Google Scholar] [CrossRef]
- Esmizadeh, E.; Tzoganakis, C.; Mekonnen, T.H. Degradation Behavior of Polypropylene during Reprocessing and Its Biocomposites: Thermal and Oxidative Degradation Kinetics. Polymers 2020, 12, 1627. [Google Scholar] [CrossRef] [PubMed]
- Vohlídal, J. Polymer degradation: A short review. Chem. Teach. Int. 2021, 3, 213–220. [Google Scholar] [CrossRef]
- Xing, H.; Wan, D.; Qiu, J.; Wang, Y.; Ma, L.; Jiang, Z.; Tang, T. Combined effects between activating group Z and leaving group R in dithiocarbamates for controlling degradation and branching reactions of polypropylene. Polymer 2014, 55, 5435–5444. [Google Scholar] [CrossRef]
- Ouchi, T.; Yamazaki, M.; Maeda, T.; Hotta, A. Mechanical Property of Polypropylene Gels Associated with That of Molten Polypropylenes. Gels 2021, 7, 99. [Google Scholar] [CrossRef]
- Vlachos, N.; Skopelitis, Y.; Psaroudaki, M.; Konstantinidou, V.; Chatzilazarou, A.; Tegou, E. Applications of Fourier transform-infrared spectroscopy to edible oils. Anal. Chim. Acta 2006, 573, 459–465. [Google Scholar] [CrossRef]
- Rafati, A.; Tahvildari, K.; Nozari, M. Production of biodiesel by electrolysis method from waste cooking oil using heterogeneous MgO-NaOH nano catalyst. Energy Sources Part A Recovery Util. Environ. Eff. 2019, 41, 1062–1074. [Google Scholar] [CrossRef]
- Rosson, E.; Sgarbossa, P.; Pedrielli, F.; Mozzon, M.; Bertani, R. Bioliquids from raw waste animal fats: An alternative renewable energy source. Biomass Convers 2021, 11, 1475–1490. [Google Scholar] [CrossRef]
- Toteva, V.; Georgiev, A.; Topalova, L. Oxidative desulphurization of light cycle oil: Monitoring by FTIR spectroscopy. Fuel Process Technol. 2009, 90, 965–970. [Google Scholar] [CrossRef]
- Poppy, P.; Faiz Fauzi, A.; Hendra, S.; Permanasari, A.; Gayatri, A.; Rara, W. Synthesis and characterization of CaCO3/CaO from Achatina fulica in various sintering time. In IOP Conference Series: Materials Science and Engineering; IOP Publishing: Bristol, UK, 2021; Volume 1034, p. 012093. [Google Scholar] [CrossRef]
- Poppy, P.; Faiz Fauzi, A.; Hendra, S.; Permanasari, A.; Gayatri, A.; Rara, W. Phase identification and morphology of CaCO3/CaO from Achatina Fulica snail shell as the base material for Hydroxyapatite. In IOP Conference Series: Materials Science and Engineering; IOP Publishing: Bristol, UK, 2021; Volume 1034, p. 012128. [Google Scholar] [CrossRef]
- Tang, S.; Zheng, C.; Yan, F.; Shao, N.; Tang, Y.; Zhang, Z. Product characteristics and kinetics of sewage sludge pyrolysis driven by alkaline earth metals. Energy 2018, 153, 921–932. [Google Scholar] [CrossRef]
- Shatskiy, A.; Litasov, K.D.; Sharygin, I.S.; Egonin, I.A.; Mironov, A.M.; Palyanov, Y.N.; Ohtani, E. The system Na2CO3-CaCO3-MgCO3 at 6 GPa and 900–1250 °C and its relation to the partial melting of carbonated mantle. High Press. Res. 2016, 36, 23–41. [Google Scholar] [CrossRef]
- Karuppusamy, I.; Samuel, M.S.; Selvarajan, E.; Shanmugam, S.; Kumar, P.S.M.; Brindhadevi, K.; Pugazhendhi, A. Ultrasound-assisted synthesis of mixed calcium magnesium oxide (CaMgO2) nanoflakes for photocatalytic degradation of methylene blue. J. Colloid Interface Sci. 2021, 584, 770–778. [Google Scholar] [CrossRef]
- Lopez-Urionabarrenechea, A.; de Marco, I.; Caballero, B.M.; Laresgoiti, M.F.; Adrados, A. Catalytic stepwise pyrolysis of packaging plastic waste. J. Anal. Appl. Pyrolysis 2012, 96, 54–62. [Google Scholar] [CrossRef]
- López, A.; de Marco, I.; Caballero, B.M.; Laresgoiti, M.F.; Adrados, A. Influence of time and temperature on pyrolysis of plastic wastes in a semi-batch reactor. Chem. Eng. J. 2011, 173, 62–71. [Google Scholar] [CrossRef]
- Pathak, S.J.; Gangal, A.; Prabu, V. Direct liquefaction of discarded printer cartridge plastics and its Kinetic Modelling. Fuel Processing Technol. 2022, 228, 107147. [Google Scholar] [CrossRef]
- Baraniec-Mazurek, I.; Mianowski, A. Liquid fuel from waste polyolefins part I: Thermal and pressure degradation of waste polyolefins in tetralin as H-donor model system. Chem. Eng. J. 2010, 163, 284–292. [Google Scholar] [CrossRef]
- Feng, Z.; Zhao, J.; Rockwell, J.; Bailey, D.; Huffman, G. Direct liquefaction of waste plastics and coliquefaction of coal-plastic mixtures. Fuel Processing Technol. 1996, 49, 17–30. [Google Scholar] [CrossRef]
- Murty, M.V.S.; Rangarajan, P.; Grulke, E.A.; Bhattacharyya, D. Thermal degradation/hydrogenation of commodity plastics and characterization of their liquefaction products. Fuel Processing Technol. 1996, 49, 75–90. [Google Scholar] [CrossRef]
- Niu, S.; Zhou, Y.; Zhu, S.; Ren, L.; Yan, L.; Li, F.; Bai, Y. Investigation into the yields and characteristics of products from lignite low-temperature pyrolysis under CO2 and N2 atmospheres. J. Anal. Appl. Pyrolysis 2019, 138, 161–169. [Google Scholar] [CrossRef]


| Analysis, wt% | PP | PE |
|---|---|---|
| N | <0.05 | <0.05 |
| S | <0.05 | <0.05 |
| C | 85.0 | 85.3 |
| H | 14.9 | 14.6 |
| Al | 55.8 × 10⁻⁴ | 1.44 × 10⁻⁴ |
| Ca | 24.2 × 10⁻⁴ | 8.56 × 10⁻⁴ |
| Fe | 23.3 × 10⁻⁴ | 45.5 × 10⁻⁴ |
| K | 11.9 × 10⁻⁴ | 2.41 × 10⁻⁴ |
| Li | <0.2 × 10⁻⁴ | <0.2 × 10⁻⁴ |
| Mg | 33.7 × 10⁻⁴ | 0.347 × 10⁻⁴ |
| Mn | 0.238 × 10⁻⁴ | 0.284 × 10⁻⁴ |
| Na | 64.5 × 10⁻⁴ | 1.20 × 10⁻⁴ |
| P, | 12.9 × 10⁻⁴ | 2.93 × 10⁻⁴ |
| Si, wt% | 22.9 × 10⁻⁴ | 4.02 × 10⁻⁴ |
| Test Abbreviate Name | Liquid | Semisolid | Gas | Losses 1 |
|---|---|---|---|---|
| PP-N2 | 0.0 | 96.9 | 1.7 | 1.4 |
| PE-N2 | 0.0 | 97.2 | 2.8 | 0.0 |
| PP-MgO-N2 | 78.6 | 10.3 | 4.4 | 6.7 |
| PE-MgO-N2 | 71.8 | 21.5 | 3.1 | 3.6 |
| PP-CaO-N2 | 83.8 | 6.6 | 1.3 | 8.3 |
| PE-CaO-N2 | 57.3 | 15.0 | 3.6 | 24.1 |
| PP-CO2 | 0.0 | 89.0 | 1.0 | 10.0 |
| PE-CO2 | 0.0 | 96.7 | 3.0 | 0.3 |
| PP-MgO-CO2 | 79.5 | 7.3 | 3.6 | 9.6 |
| PE-MgO-CO2 | 81.9 | 6.9 | 2.1 | 9.1 |
| PP-CaO-CO2 | 84.7 | 10.8 | 1.2 | 3.3 |
| PE-CaO-CO2 | 49.4 | 14.6 | 7.1 | 28.9 |
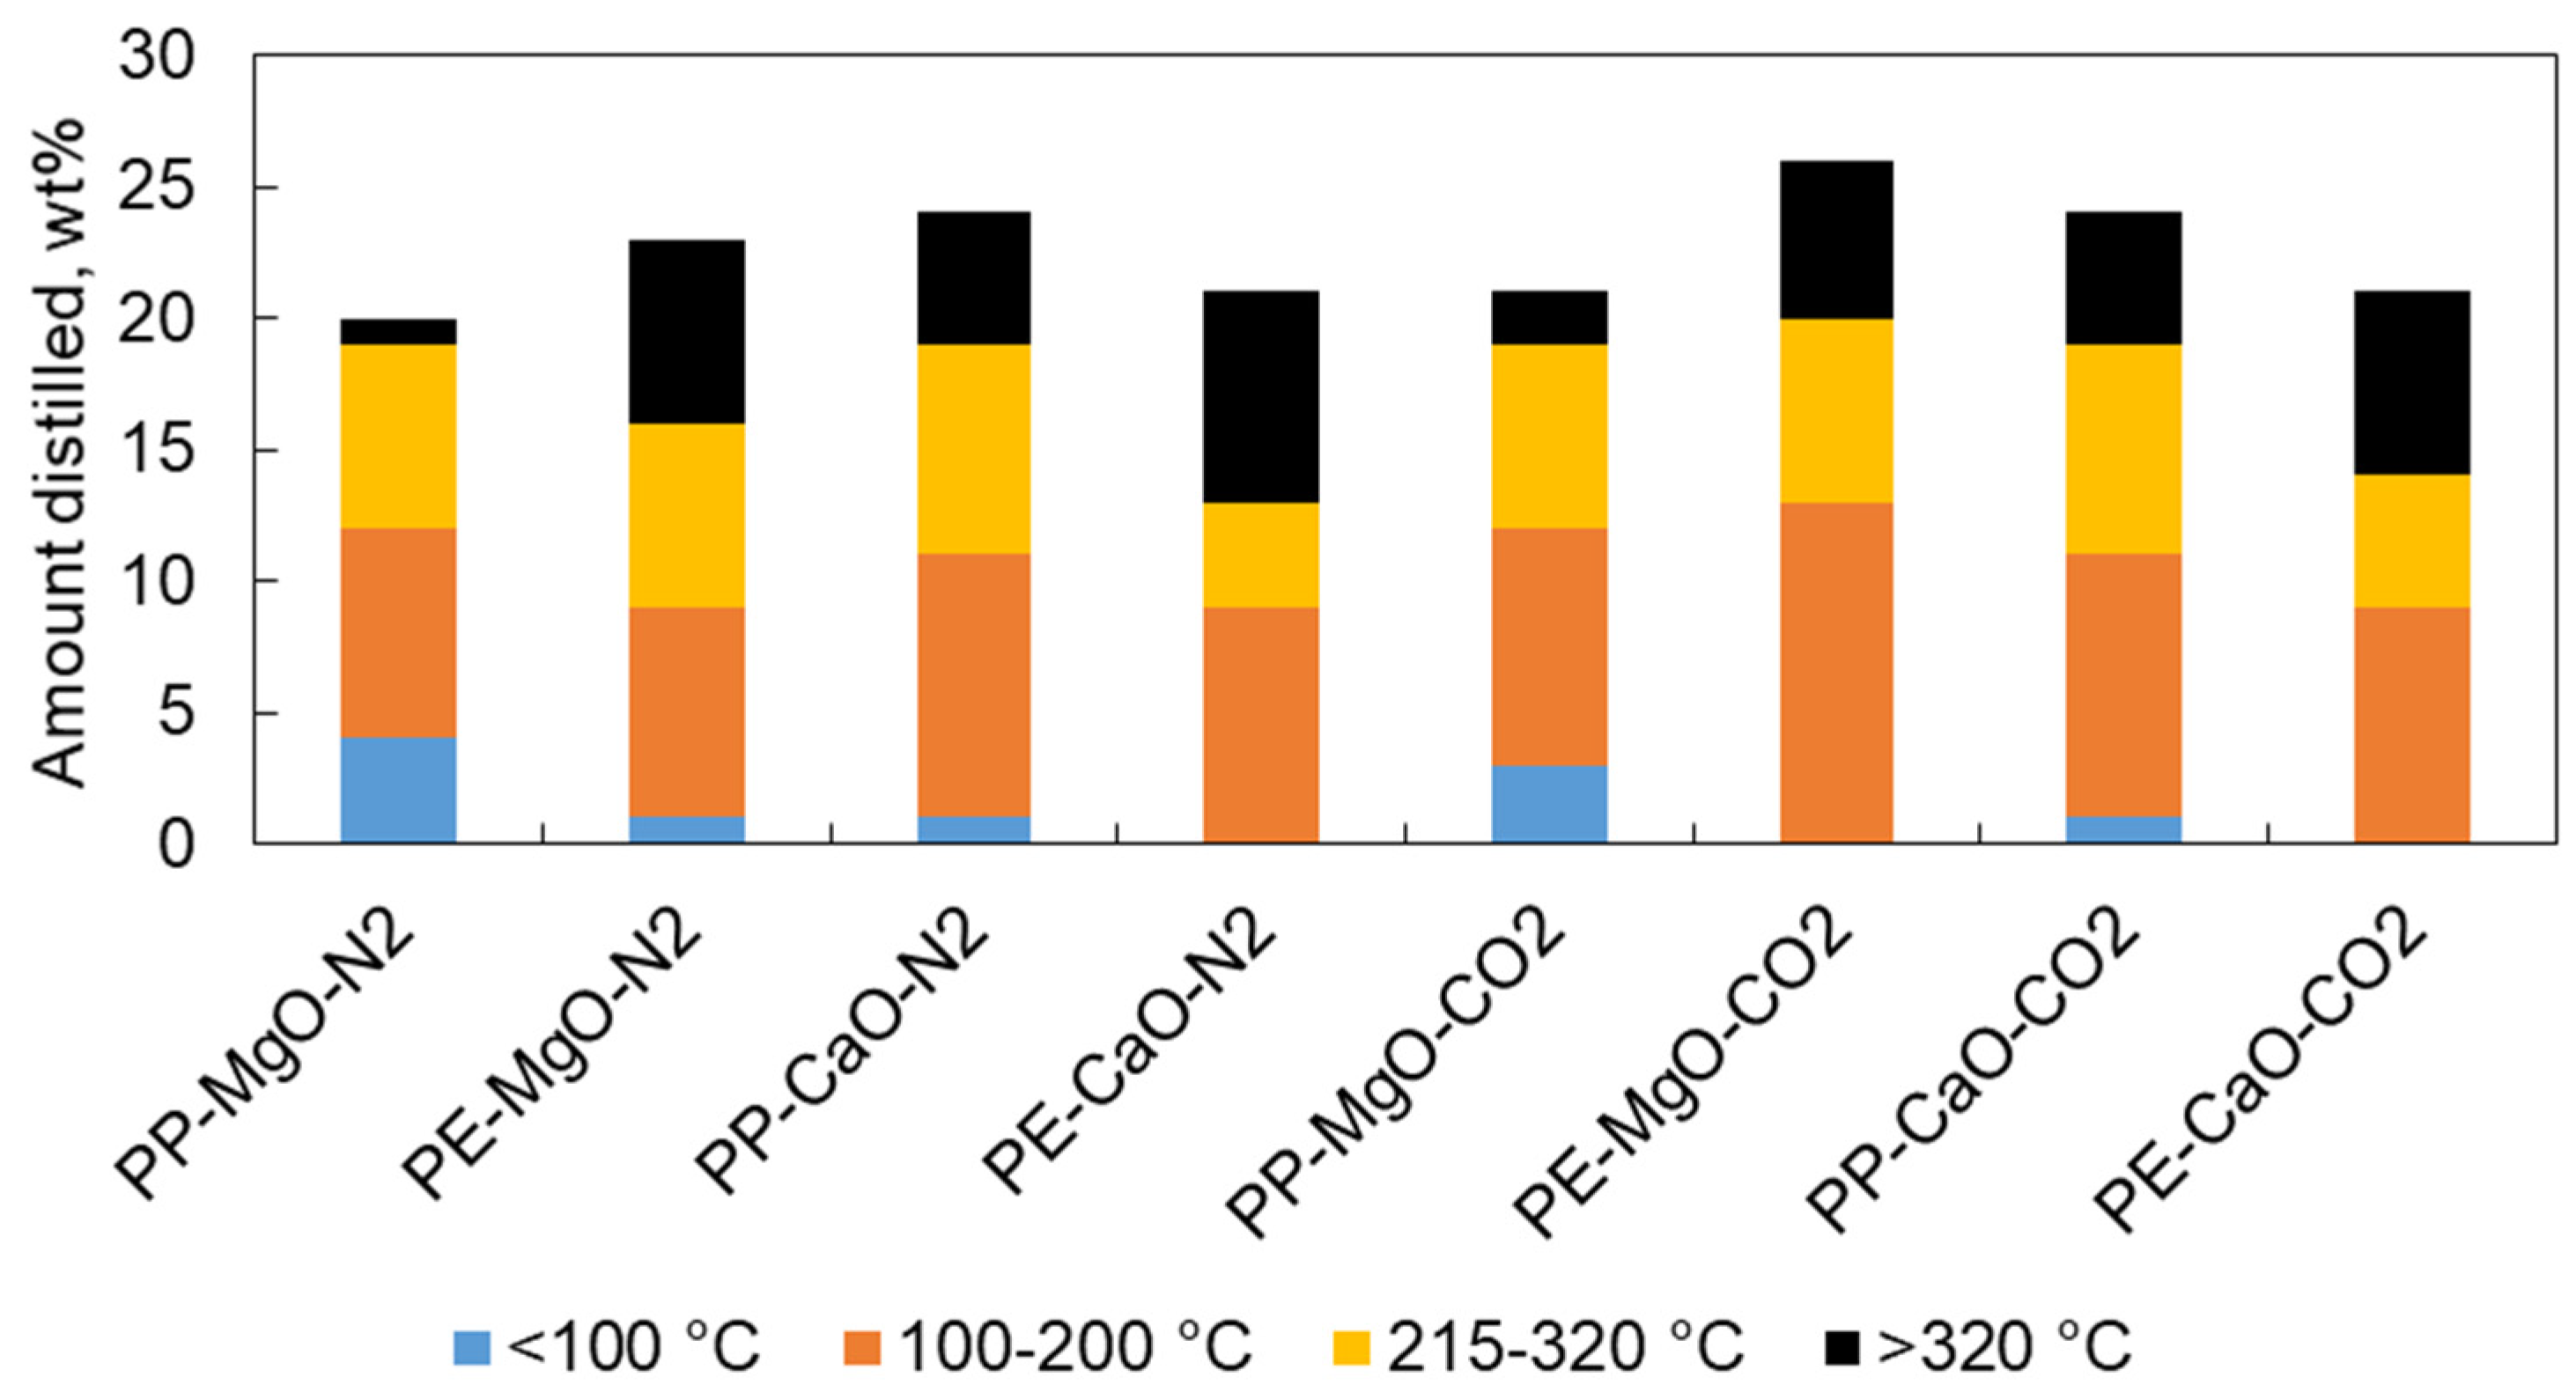
| Test Name | <100 °C | 100–200 °C | 200–215 °C | 215–320 °C | >320 °C |
|---|---|---|---|---|---|
| PP-MgO-N2, wt% | 4 | 8 | 80 | 7 | 1 |
| PE-MgO-N2, wt% | 1 | 8 | 77 | 7 | 7 |
| PP-CaO-N2, wt% | 1 | 10 | 76 | 8 | 5 |
| PE-CaO-N2, wt% | 0 | 9 | 79 | 4 | 8 |
| PP-MgO-CO2, wt% | 3 | 9 | 79 | 7 | 2 |
| PE-MgO-CO2, wt% | 0 | 13 | 74 | 7 | 6 |
| PP-CaO-CO2, wt% | 1 | 10 | 76 | 8 | 5 |
| PE-CaO-CO2, wt% | 0 | 9 | 79 | 5 | 7 |
| PP-N2 | PE-N2 | PP-CO2 | PE-CO2 | |
|---|---|---|---|---|
| C1, wt% | 0.12 | 0.13 | 0.06 | 0.12 |
| C2, wt% | 0.21 | 0.21 | 0.11 | 0.20 |
| Ethylene, wt% | 0.01 | 0.04 | 0.00 | 0.06 |
| Propylene, wt% | 0.24 | 0.23 | 0.15 | 0.29 |
| C3, wt% | 0.21 | 0.23 | 0.12 | 0.29 |
| C4, wt% | 0.37 | 0.17 | 0.23 | 0.26 |
| C5-C6, wt% | 0.27 | 0.19 | 0.15 | 0.35 |
| C6+, wt% | 0.03 | 0.06 | 0.01 | 0.03 |
| Unknown, wt% | 0.08 | 0.75 | 0.06 | 0.43 |
| H2, wt% | 0.17 | 0.79 | 0.06 | 0.49 |
| CO, wt% | 0.00 | 0.00 | 0.05 | 0.49 |
| PP-MgO-N2 | PE-MgO-N2 | PP-CaO-N2 | PE-CaO-N2 | |
|---|---|---|---|---|
| C1, wt% | 0.37 | 0.24 | 0.10 | 0.24 |
| C2, wt% | 0.79 | 0.57 | 0.19 | 0.52 |
| Ethylene, wt% | 0.02 | 0.09 | 0.01 | 0.06 |
| Propylene, wt% | 0.71 | 0.38 | 0.20 | 0.36 |
| C3, wt% | 0.83 | 0.70 | 0.18 | 0.57 |
| C4, wt% | 0.67 | 0.43 | 0.28 | 0.37 |
| C5–C6, wt% | 0.54 | 0.36 | 0.17 | 0.23 |
| C6+, wt% | 0.01 | 0.01 | 0.01 | 0.10 |
| Unknown, wt% | 0.10 | 0.06 | 0.10 | 0.65 |
| H2, wt% | 0.36 | 0.26 | 0.07 | 0.52 |
| PP-MgO-CO2 | PE-MgO-CO2 | PP-CaO-CO2 | PE-CaO-CO2 | |
|---|---|---|---|---|
| C1, wt% | 0.34 | 0.58 | 0.09 | 0.56 |
| C2, wt% | 0.72 | 0.33 | 0.17 | 1.16 |
| Ethylene, wt% | 0.03 | 0.06 | 0.01 | 0.15 |
| Propylene, wt% | 0.74 | 0.19 | 0.21 | 0.81 |
| C3, wt% | 0.62 | 0.39 | 0.15 | 1.22 |
| C4, wt% | 0.65 | 0.26 | 0.27 | 0.81 |
| C5-C6, wt% | 0.36 | 0.15 | 0.21 | 0.39 |
| C6+, wt% | 0.04 | 0.01 | 0.03 | 0.12 |
| Unknown, wt% | 0.13 | 0.06 | 0.04 | 0.75 |
| H2, wt% | 0.13 | 0.13 | 0.07 | 1.25 |
| CO, wt% | 0.17 | 0.51 | 0.04 | 0.44 |
| Refractive Index (20 °C) | Density (15 °C), kg m−3 | |
| PP-MgO-N2 | 1.5238 | 933.10 |
| PE-MgO-N2 | 1.5265 | 934.54 |
| PP-CaO-N2 | 1.5238 | 934.98 |
| PE-CaO-N2 | 1.5174 (50 °C) | 947.33 (50 °C) |
| Refractive Index (20 °C) | Density (15 °C), kg m−3 | |
| PP-MgO-CO2 | 1.5254 | 938.89 |
| PE-MgO-CO2 | 1.5263 | 942.40 |
| PP-CaO-CO2 | 1.5251 | 939.62 |
| PE-CaO-CO2 | 1.5181 (50 °C) | 949.12 (50 °C) |
| Catalyst | Catalyst wt% | Feed | T °C | Liquid wt% | Gas wt% | Solid wt% | Ref. |
|---|---|---|---|---|---|---|---|
| ZSM-5 | 10 | PE, PP, PS, PET, PVC | 450 | 56.9 | 40.4 | 3.2 | [12,32] |
| ZSM-5 | 10 | PE, PP, PS, PET, PVC | 440 | 39.8 | 58.4 | 1.8 | [12,32] |
| Red Mud | 10 | PE, PP, PS, PET, PVC | 500 | 57.0 | 41.3 | 1.7 | [12,32] |
| BAC/MgO 1 | 66.6 | PE | 500 | 81.0 | 15.1 | 3.9 | [13] |
| CaO | 20 | PP | 420 | 84.7 | 1.2 | 14.1 | This work |
| MgO | 20 | PE | 420 | 81.9 | 6.9 | 2.1 | This work |
| p-toluene sulfonic acid 2 | 3 | Biomass | 120–180 | 96.2 | -- | -- | [8] |
| Mo/C 3 | 0.5 | Coal + PE | 420 | 90 | 8 | 2 | [9] |
| No catalyst | -- | Waste plastic | 400 | 49 | 30 | 21 | [34] |
| CoMo/Al2O3 | 5 | Waste polyolefins | 400–500 | 81 | 19 | -- | [35] |
| HZSM-5 | 3 | PE | 430 | 95–99 | -- | -- | [36] |
| No catalyst | -- | PE, PV, PET | 440 | 85 | -- | -- | [37] |
Publisher’s Note: MDPI stays neutral with regard to jurisdictional claims in published maps and institutional affiliations. |
© 2022 by the authors. Licensee MDPI, Basel, Switzerland. This article is an open access article distributed under the terms and conditions of the Creative Commons Attribution (CC BY) license (https://creativecommons.org/licenses/by/4.0/).
Share and Cite
Hidalgo Herrador, J.M.; Murat, M.; Tišler, Z.; Frątczak, J.; de Paz Carmona, H. Direct Polypropylene and Polyethylene Liquefaction in CO2 and N2 Atmospheres Using MgO Light and CaO as Catalysts. Materials 2022, 15, 844. https://doi.org/10.3390/ma15030844
Hidalgo Herrador JM, Murat M, Tišler Z, Frątczak J, de Paz Carmona H. Direct Polypropylene and Polyethylene Liquefaction in CO2 and N2 Atmospheres Using MgO Light and CaO as Catalysts. Materials. 2022; 15(3):844. https://doi.org/10.3390/ma15030844
Chicago/Turabian StyleHidalgo Herrador, José Miguel, Martyna Murat, Zdeněk Tišler, Jakub Frątczak, and Héctor de Paz Carmona. 2022. "Direct Polypropylene and Polyethylene Liquefaction in CO2 and N2 Atmospheres Using MgO Light and CaO as Catalysts" Materials 15, no. 3: 844. https://doi.org/10.3390/ma15030844