An A- and B-Site Substitutional Study of SrFeO3−δ Perovskites for Solar Thermochemical Air Separation
by
 , , ,
, , ,
Tyler P. Farr
1 ,
,
Nhu Pailes Nguyen
1,
H. Evan Bush
2 ,
,
Andrea Ambrosini
2 and
Peter G. Loutzenhiser
1,* 1
George W. Woodruff School of Mechanical Engineering, Georgia Institute of Technology, Atlanta, GA 30332, USA
2
Concentrating Solar Technologies, Sandia National Laboratories, Albuquerque, NM 87185, USA
*
Author to whom correspondence should be addressed.
Materials 2020, 13(22), 5123; https://doi.org/10.3390/ma13225123
Submission received: 19 October 2020
/
Revised: 3 November 2020
/
Accepted: 9 November 2020
/
Published: 13 November 2020
(This article belongs to the Section Energy Materials)
Abstract
:An A‑ and B‑site substitutional study of SrFeO3−δ perovskites (A’xA1−xB’yB1−yO3−δ, where A = Sr and B = Fe) was performed for a two‑step solar thermochemical air separation cycle. The cycle steps encompass (1) the thermal reduction of A’xSr1−xB’yFe1−yO3−δ driven by concentrated solar irradiation and (2) the oxidation of A’xSr1−xB’yFe1−yO3−δ in air to remove O2, leaving N2. The oxidized A’xSr1−xB’yFe1−yO3−δ is recycled back to the first step to complete the cycle, resulting in the separation of N2 from air and concentrated solar irradiation. A-site substitution fractions between 0 ≤ x ≤ 0.2 were examined for A’ = Ba, Ca, and La. B-site substitution fractions between 0 ≤ y ≤ 0.2 were examined for B’ = Cr, Cu, Co, and Mn. Samples were prepared with a modified Pechini method and characterized with X-ray diffractometry. The mass changes and deviations from stoichiometry were evaluated with thermogravimetry in three screenings with temperature- and O2 pressure-swings between 573 and 1473 K and 20% O2/Ar and 100% Ar at 1 bar, respectively. A’ = Ba or La and B’ = Co resulted in the most improved redox capacities amongst temperature- and O2 pressure-swing experiments.
1. Introduction
N2 is an industrial gas with a wide array of chemical and medical applications, including in the production of ammonia via the Haber–Bosch process [1]. Current practice to obtain N2 employs cryogenic air separation to compress and liquefy the air followed by distillation to separate O2 and N2. The best cryogenic separation processes operate with energy demands three times higher than the thermodynamic minimum energy required for N2/O2 separation [2]. Pressure-swing adsorption is another air separation process utilizing activated carbon, but with the limitation of not producing high-purity N2 [3,4]. Inorganic membranes provide energy-efficient and scalable means of gas separation but are often tailored towards CO2, with little effectiveness for air separation [5]. Chemical looping air separation relies on reversible reduction/oxidation (redox) reactions to cyclically adsorb O2 from the air to produce high-purity N2 [6].
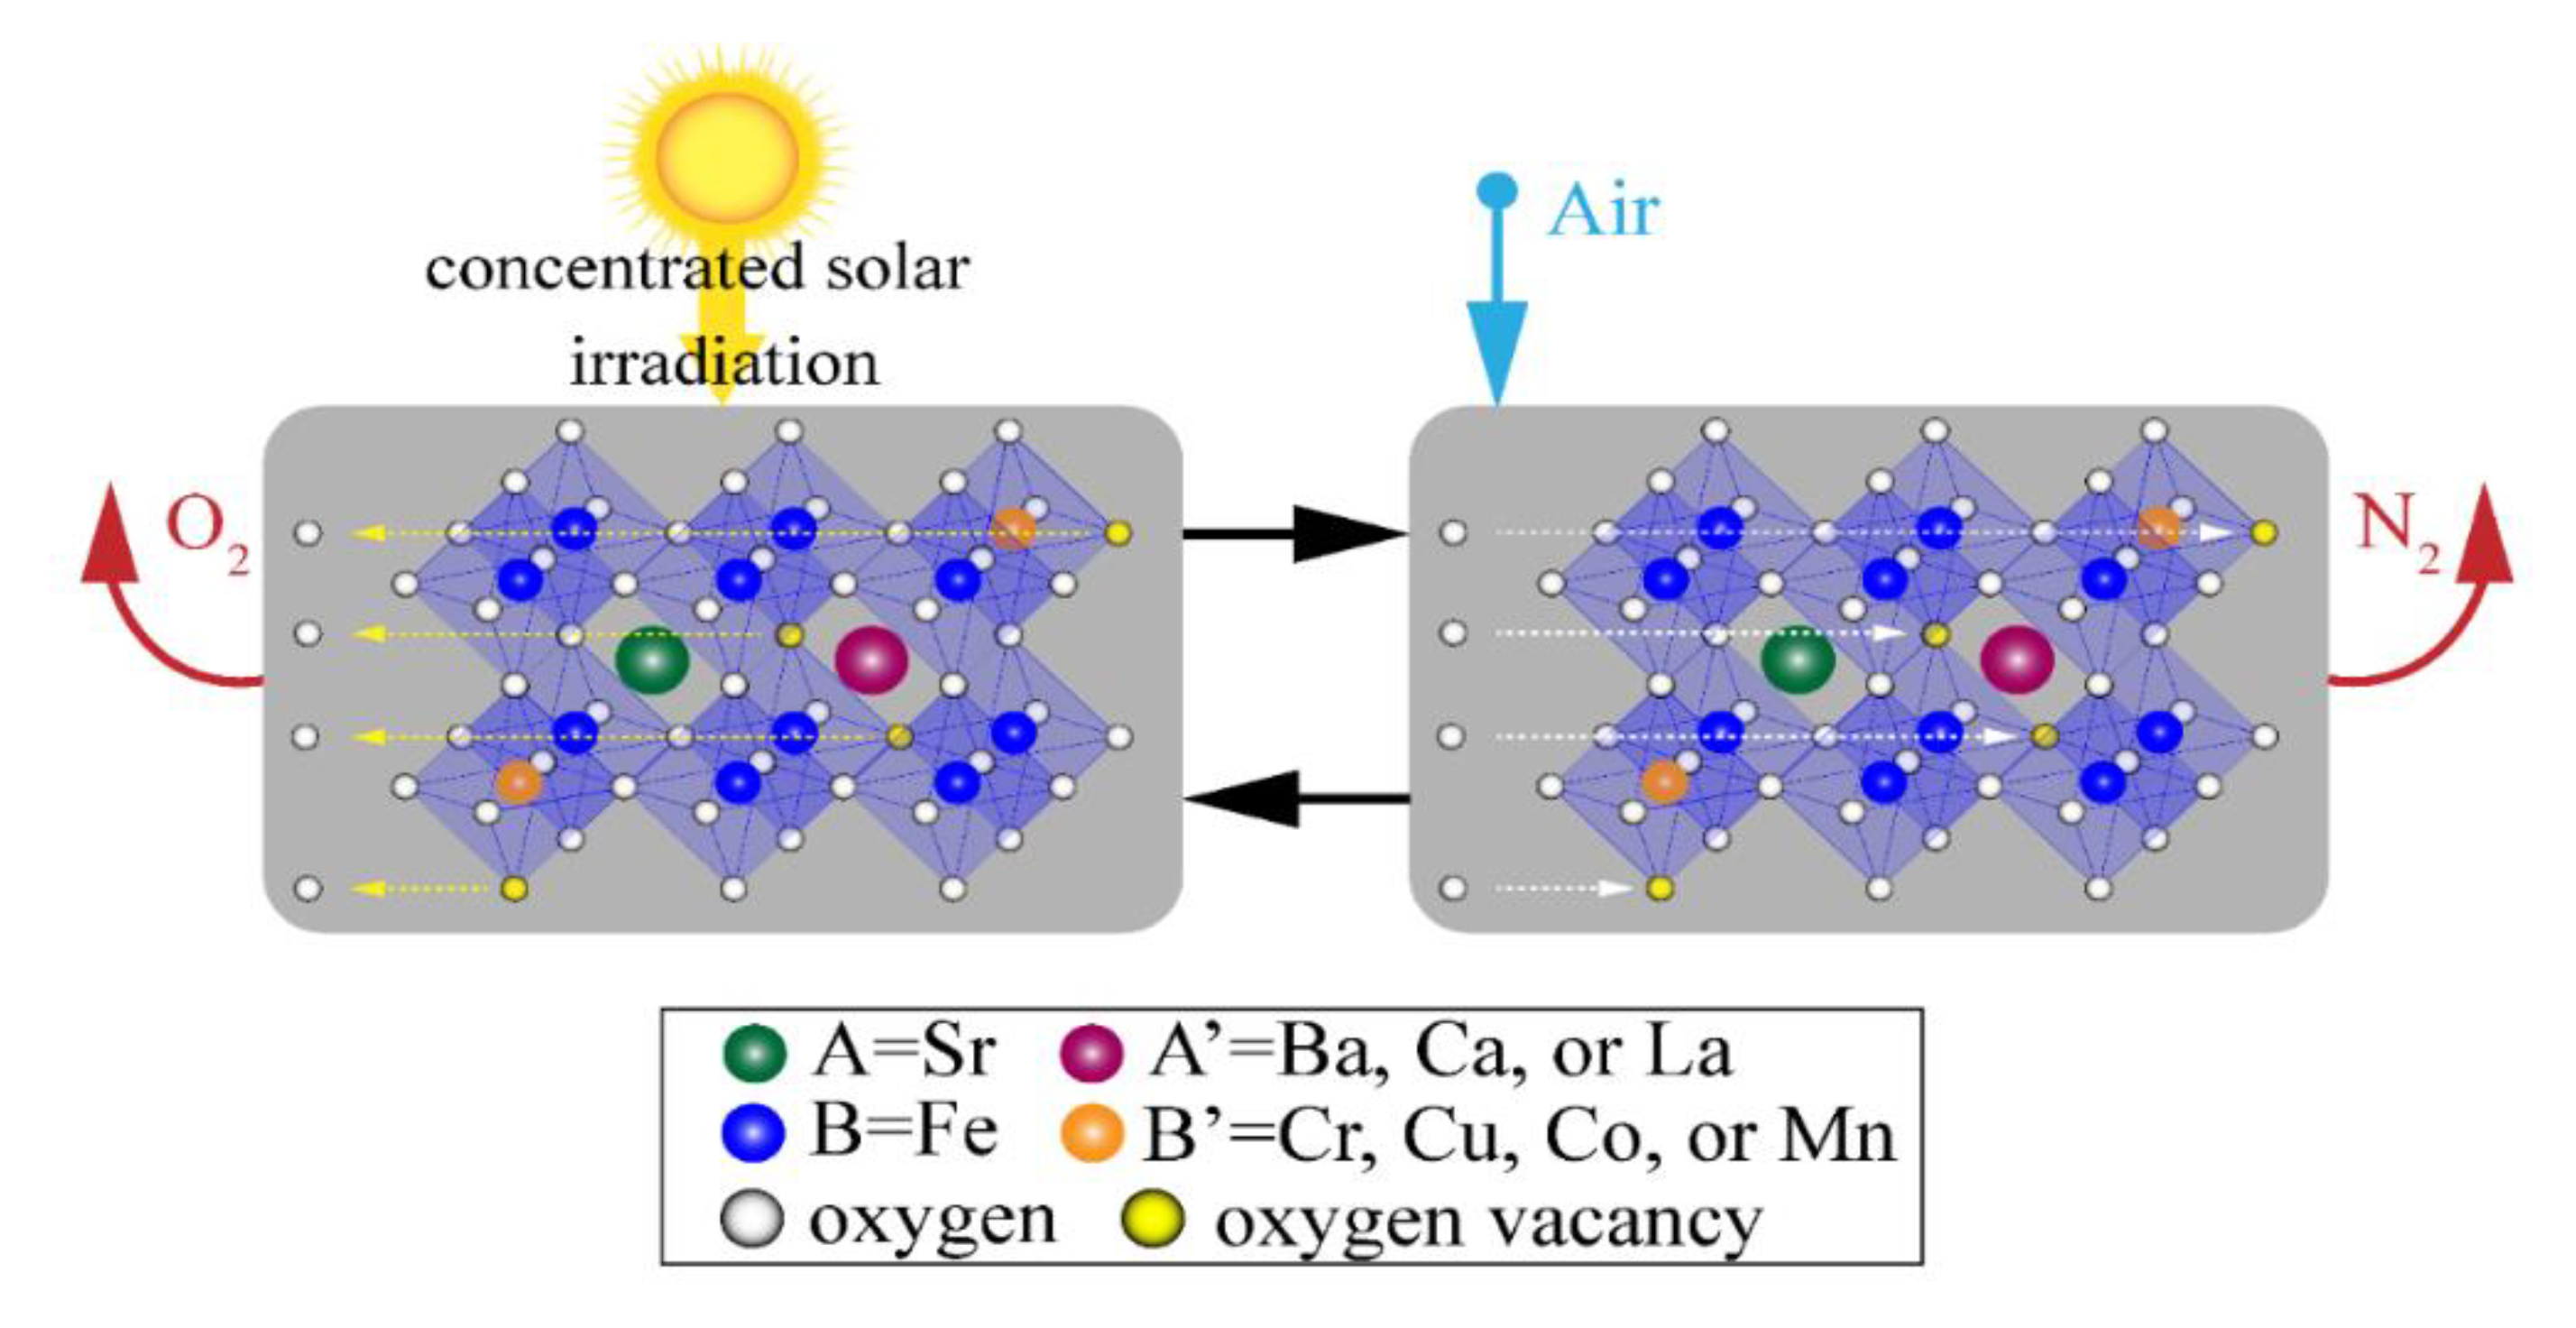
SrFeO3−δ (δ ≡ deviation from stoichiometry) is a redox-active mixed ionic-electronic conducting material that is particularly attractive for reversible redox cycling. High redox capacities in the absence of crystal structure changes and thermal stability over a large range of temperature- and O2 partial pressure make SrFeO3−δ ideal for solar thermochemical air separation [7,8]. Rapid kinetics result, in part, from the facile conduction of electrons and O2− ions through the sublattice at elevated temperatures. This phenomenon produces charge imbalances which create O2− vacancies in the sublattice. The two-step solar thermochemical cycle to produce N2 from air operates via the reversible SrFeO3−δ redox reaction, represented in Kröger–Vink notation as:
where VÖ represents an oxygen vacancy; and are the neutral charged ions; is the negatively charged ion; and the non-labile Sr2+ is omitted. The two-step solar thermochemical cycle for air separation depicted in Figure 1 encompasses the following steps:
- The thermal reduction of Fe4+ → Fe3+ on the B-site using concentrated solar irradiation as process heat at elevated temperatures and low O2 partial pressures, where VÖ are formed as 2O2− → O2(g) to maintain electroneutrality.
- The oxidation in air at lower temperatures and elevated O2 partial pressure to produce N2 as Fe3+ → Fe4+, VÖ sites are filled, and the SrFeO3−δ is recycled back to the first step to complete the cycle.
The net result of the cycle is that O2 is removed from the air with concentrated solar irradiation to produce N2. A- and B-site cation substitutions are useful levers to tune the thermodynamic properties of SrFeO3−δ. Important thermodynamic properties for solar thermochemical air separation are low thermal reduction temperature, high redox capacity, and low reaction enthalpy. A low average reaction enthalpy of 166 ± 5 kJ per mol O2 from δ = 0 to 0.5 was determined for SrFeO3−δ [9], which corresponds to a lower energy input per mol of O2 captured compared to CaMnO3−δ [10]. This results in a decrease in the concentrated solar irradiation necessary to drive the cycle. A comprehensive understanding of the thermodynamics and rate limiting mechanism(s) is foundational for designing solar thermochemical reactors coupled to solar concentrating facilities. Thermodynamic and kinetic characterizations are necessary to optimize absorption efficiencies coupled to operating temperatures, reaction extents, and residence times in a reactor design [11,12].
Examination of A- and B-site substitution in SrFeO3−δ (A’xA1−xB’yB1−yO3−δ where A = Sr, for A-site substitution fractions of 0 ≤ x ≤ 0.2, and B = Fe for B-site substitution fractions of 0 ≤ y ≤ 0.2) is necessary to further refine performance aimed at increasing redox capacity and promoting long term cyclability, structural stability, and enhanced kinetics. Isovalent A-site substitutions with alkaline earth metals have been shown to improve oxygen vacancy formation [13] and varying the A-site atomic radii shows a strong trend with O2− ion conductivity [14]. Aliovalent A-site substitutions (e.g., La3+) have been explored as a mechanism to alter the thermodynamic properties by changing the average site charge on the B-site [15]. Previous studies conducted with LaxSr1−xCoy[Mn, Fe]1−yO3−δ and BaxSr1−xCoO3−δ have demonstrated the influence of crystal structure and substituent concentration on redox performance [16,17]. B-site substitution with Co, Cu, and other metal cations are potential levers towards increased reducibility while maintaining the crystallographic stability of SrFeO3−δ [8]. B’ = Al compounds have been investigated, resulting in a decrease in the deviation from stoichiometry and in the reduction extent [9]. A’ = Ca and B’ = Co compounds have been investigated and showed improved oxidation kinetics with comparable redox capacities to that of SrFeO3−δ [18,19]. Other studies of B’ = Co and Cu have been conducted due to the relatively low reaction enthalpies; however, they were not thermodynamically stable [8,20].
In this work, A’xSr1−xB’yFe1−yO3−δ was investigated for solar thermochemical air separation cycles where A’ = La, Ba, and Ca for A-site fractions of 0 ≤ x ≤ 0.2; and B’ = Co, Cr, Cu, and Mn for B-site fractions of 0 ≤ y ≤ 0.2. Samples were synthesized using a modified sol-gel method and characterized with X-ray diffractometry and scanning electron microscopy with energy dispersive spectroscopy. Temperature- and O2 pressure-swing thermogravimetry was performed to analyze the redox capacity and identify promising candidates for solar thermochemical air separation applications. The schematic for a two-step solar thermochemical air separation cycle is depicted in Figure 1.
2. Materials and Methods
Synthesis Methodology: Samples were synthesized using a modified Pechini method [21] from metal nitrate salt precursors (ALFA AESAR, ≥98% purity), dissolved in stoichiometric ratios in ultrapure H2O, with citric acid as the chelating agent. The solutions were continuously heated and stirred on a hotplate to just below 373 K to promote evaporation. The stirring was halted at the onset of gel formation. The samples were dehydrated for 16 h in a drying oven at 373 K, broken up into powders, and heated on a hotplate to above 523 K to induce auto-ignition. The resulting powder was ground with an agate mortar and pestle and placed in alumina crucibles for calcination in a high‑temperature box furnace (Muffle Box Furnace, 4 × 4 × 5 in3, SentroTech, Strongville, OH, USA). The samples were first heated to 1073 K for 5 h to remove any remaining organic or nitrate compounds, re-ground, then subsequently heated to between 1473 and 1573 K for 24 to 48 h to produce the perovskite oxides.
Characterization: The crystal structure of each sample was determined via X-ray diffractometry (XRD, PANalytical X’Pert PRO Alpha-1 diffractometer with Cu Kα radiation, PANalytical, Malvern, UK) and compared against entries in the PDF-4+ Database [22]. Secondary phases were found to be <5% by mass when present. Particle morphology and elemental distribution were analyzed with scanning electron microscopy (SEM, Zeiss Ultra60 FE, Oberkochen, Germany) and energy-dispersive X-ray spectroscopy (EDS/EDX, Zeiss Ultra60 FE, Oberkochen, Germany). Scanning voltages of 8 to10 kV were utilized due to the low sample conductivity.
Thermogravimetry: Thermogravimetry (TGA, Netzsch STA 449 F3 Jupiter ±1 µg with three integrated mass flow controllers with precisions of ±1 mLN∙min−1 and accuracies of less than ±2% for N2, Selb, Germany) was used to examine redox capacities as a function of temperature- and O2 partial pressure. Powder samples were placed on an Al2O3 crucible shielded with a platinum foil (Sigma Aldrich 0.025MM Thick 99% Pt Foil 267244-1.4G, St. Louis, MO, USA) to prevent unwanted reactions with the sample holder, and sample temperatures were measured by an S-type thermocouple (±1.5 K) directly in contact with the crucible. The initial and final sample masses were measured with an analytical balance (Mettler Toledo ML54, ±0.1 mg, Columbus, OH, USA) to verify the total mass change measured with the TGA. A blank run with an empty crucible was run under identical conditions for each experiment to correct for the effects of buoyancy and gas dynamics.
Three suites of TGA screenings were run under different conditions to assess the viability of different A’xSr1−xB’yFe1−yO3−δ: (1) temperature-swing cycles to compare redox capacities; (2) temperature- and O2 pressure-swing cycles to examine redox capacities over multiple cycles for promising materials from TGA Screening 1; and (3) temperature- and O2 pressure-swings with additional cycles to examine structural stability and redox capacities for promising materials from the second TGA screening.
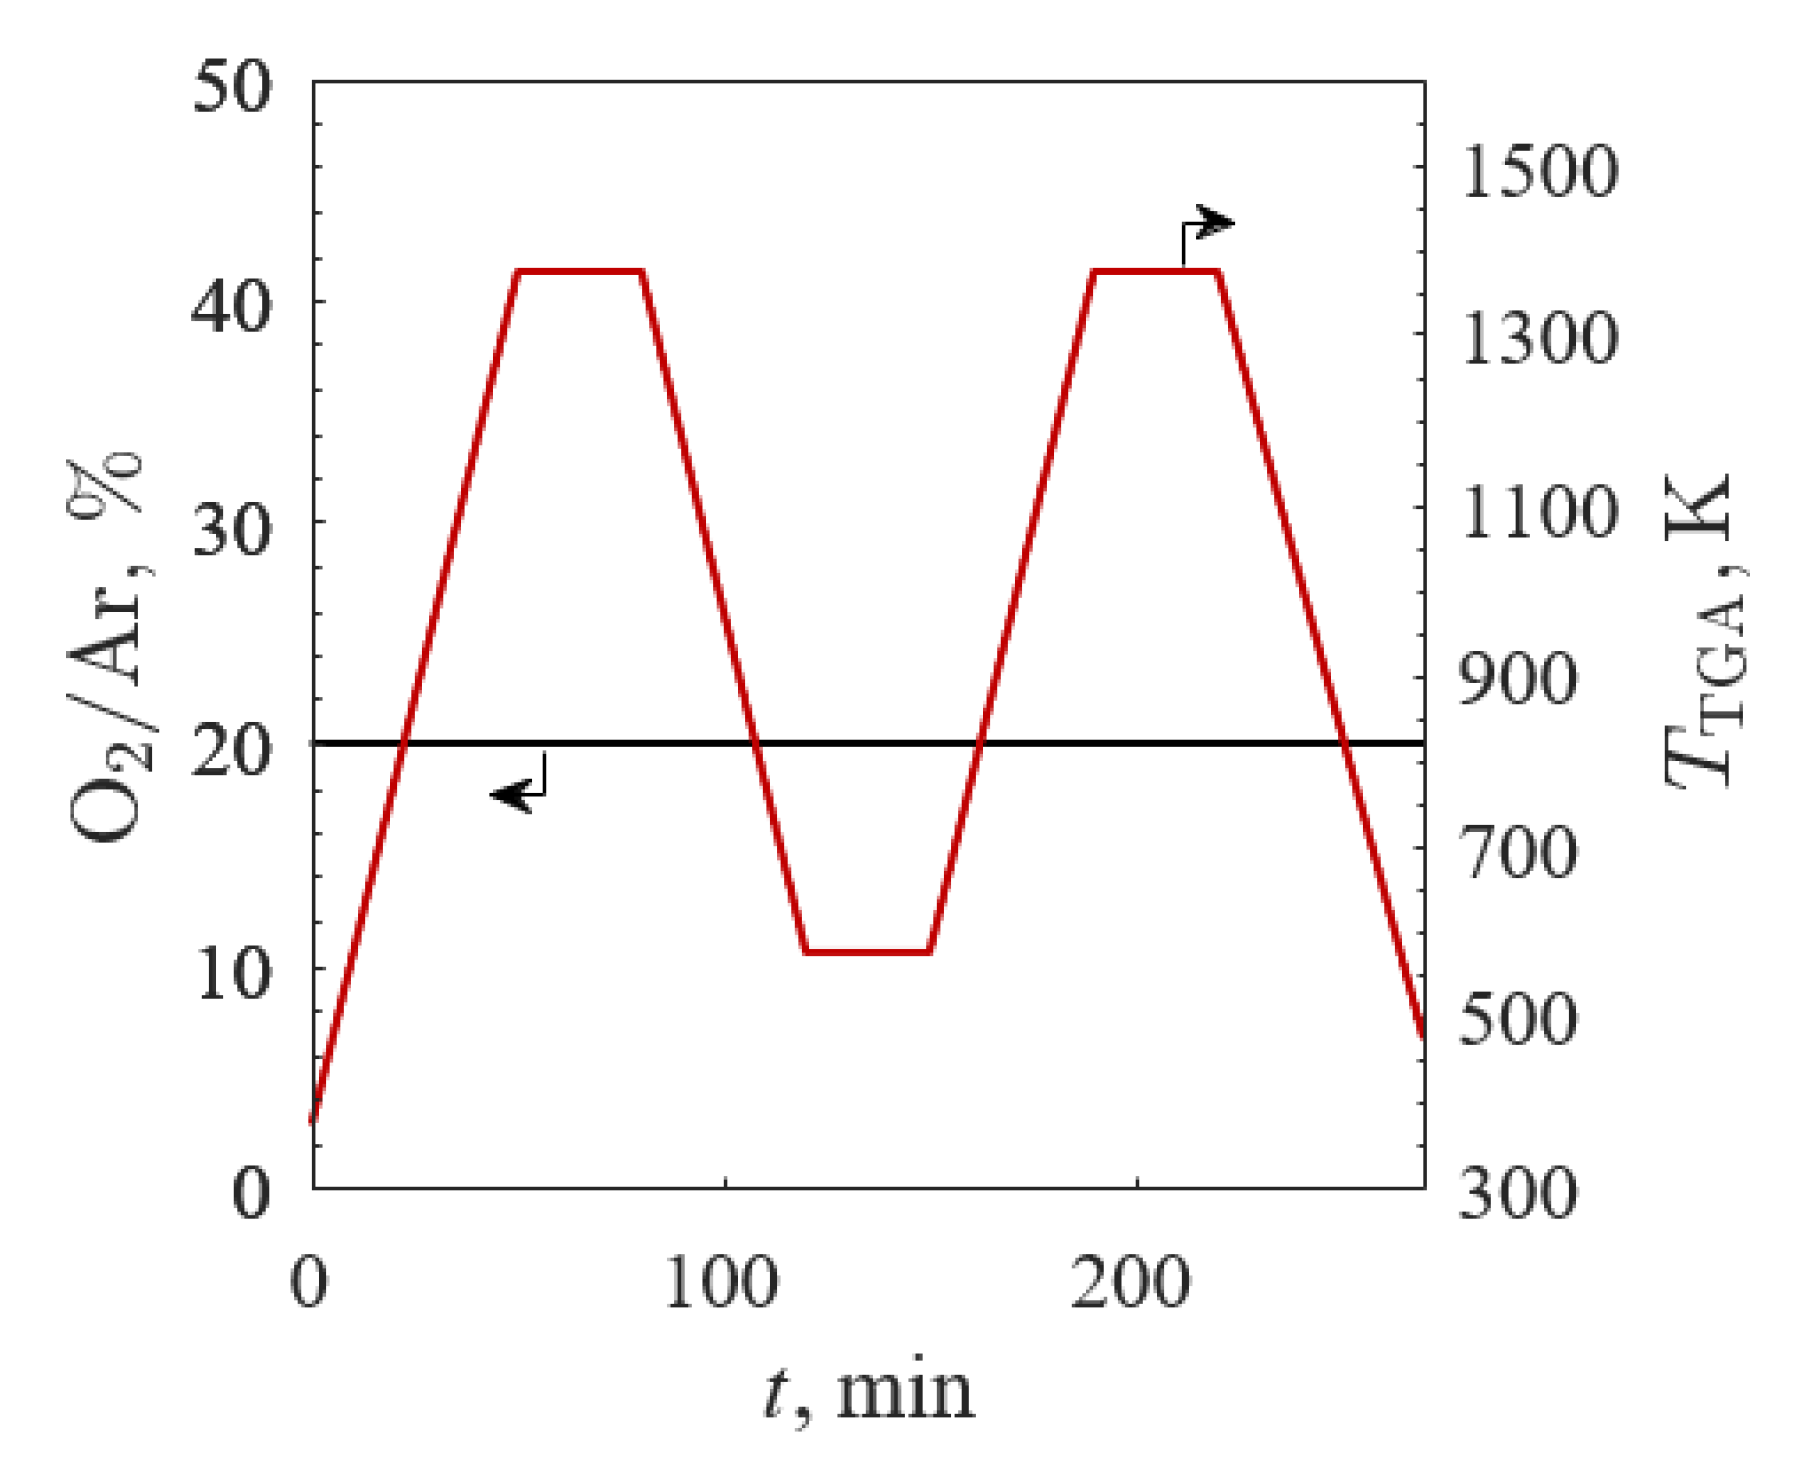
The first TGA screening examined all samples by varying the temperature between 573 K ≤ TTGA ≤ 1373 K in 20% O2/Ar for two cycles, as depicted in Figure 2 with the O2/Ar (black line) and TTGA (red line) profiles. TGA was run in 20% O2/Ar with a total gas flow of 100 mLN∙min−1 (where LN refers to liters at standard conditions: 273 K and 1 bar) for all experiments. The samples were heated to 1373 K at 20 K/min and held isothermally for 30 min to allow the sample masses to equilibrate. The samples were then cooled to 573 K at 20 K/min and held isothermally for 30 min. This cycle was repeated to produce two identical stages, the first serving as the break-in cycle to off-gas unwanted adsorbed species and normalize the starting deviation from stoichiometry.
The second TGA screening was conducted for A’ = Ba, Ca, and La and B’ = Co, with O2/Ar (black line) and TTGA (red line) profiles shown in Figure 3. The samples underwent three temperature-swing cycles between 523 and 1473 K. The first stage was a break-in cycle in 20% O2/Ar with a total gas flow of 100 mLN∙min−1 and a 20 K/min ramp rate. This was followed by an identical 20% O2/Ar cycle and a third cycle in 100% Ar. The 100% Ar reduction step was implemented to increase the reduction extent via O2 pressure-swing according to Le Chatelier’s Principle. The 100% Ar environment at 1473 K was maintained for 5 min before 20% O2/Ar was reintroduced with a total gas flow of 100 mLN∙min−1 and then cooled down to the ambient temperature at 20 K/min.
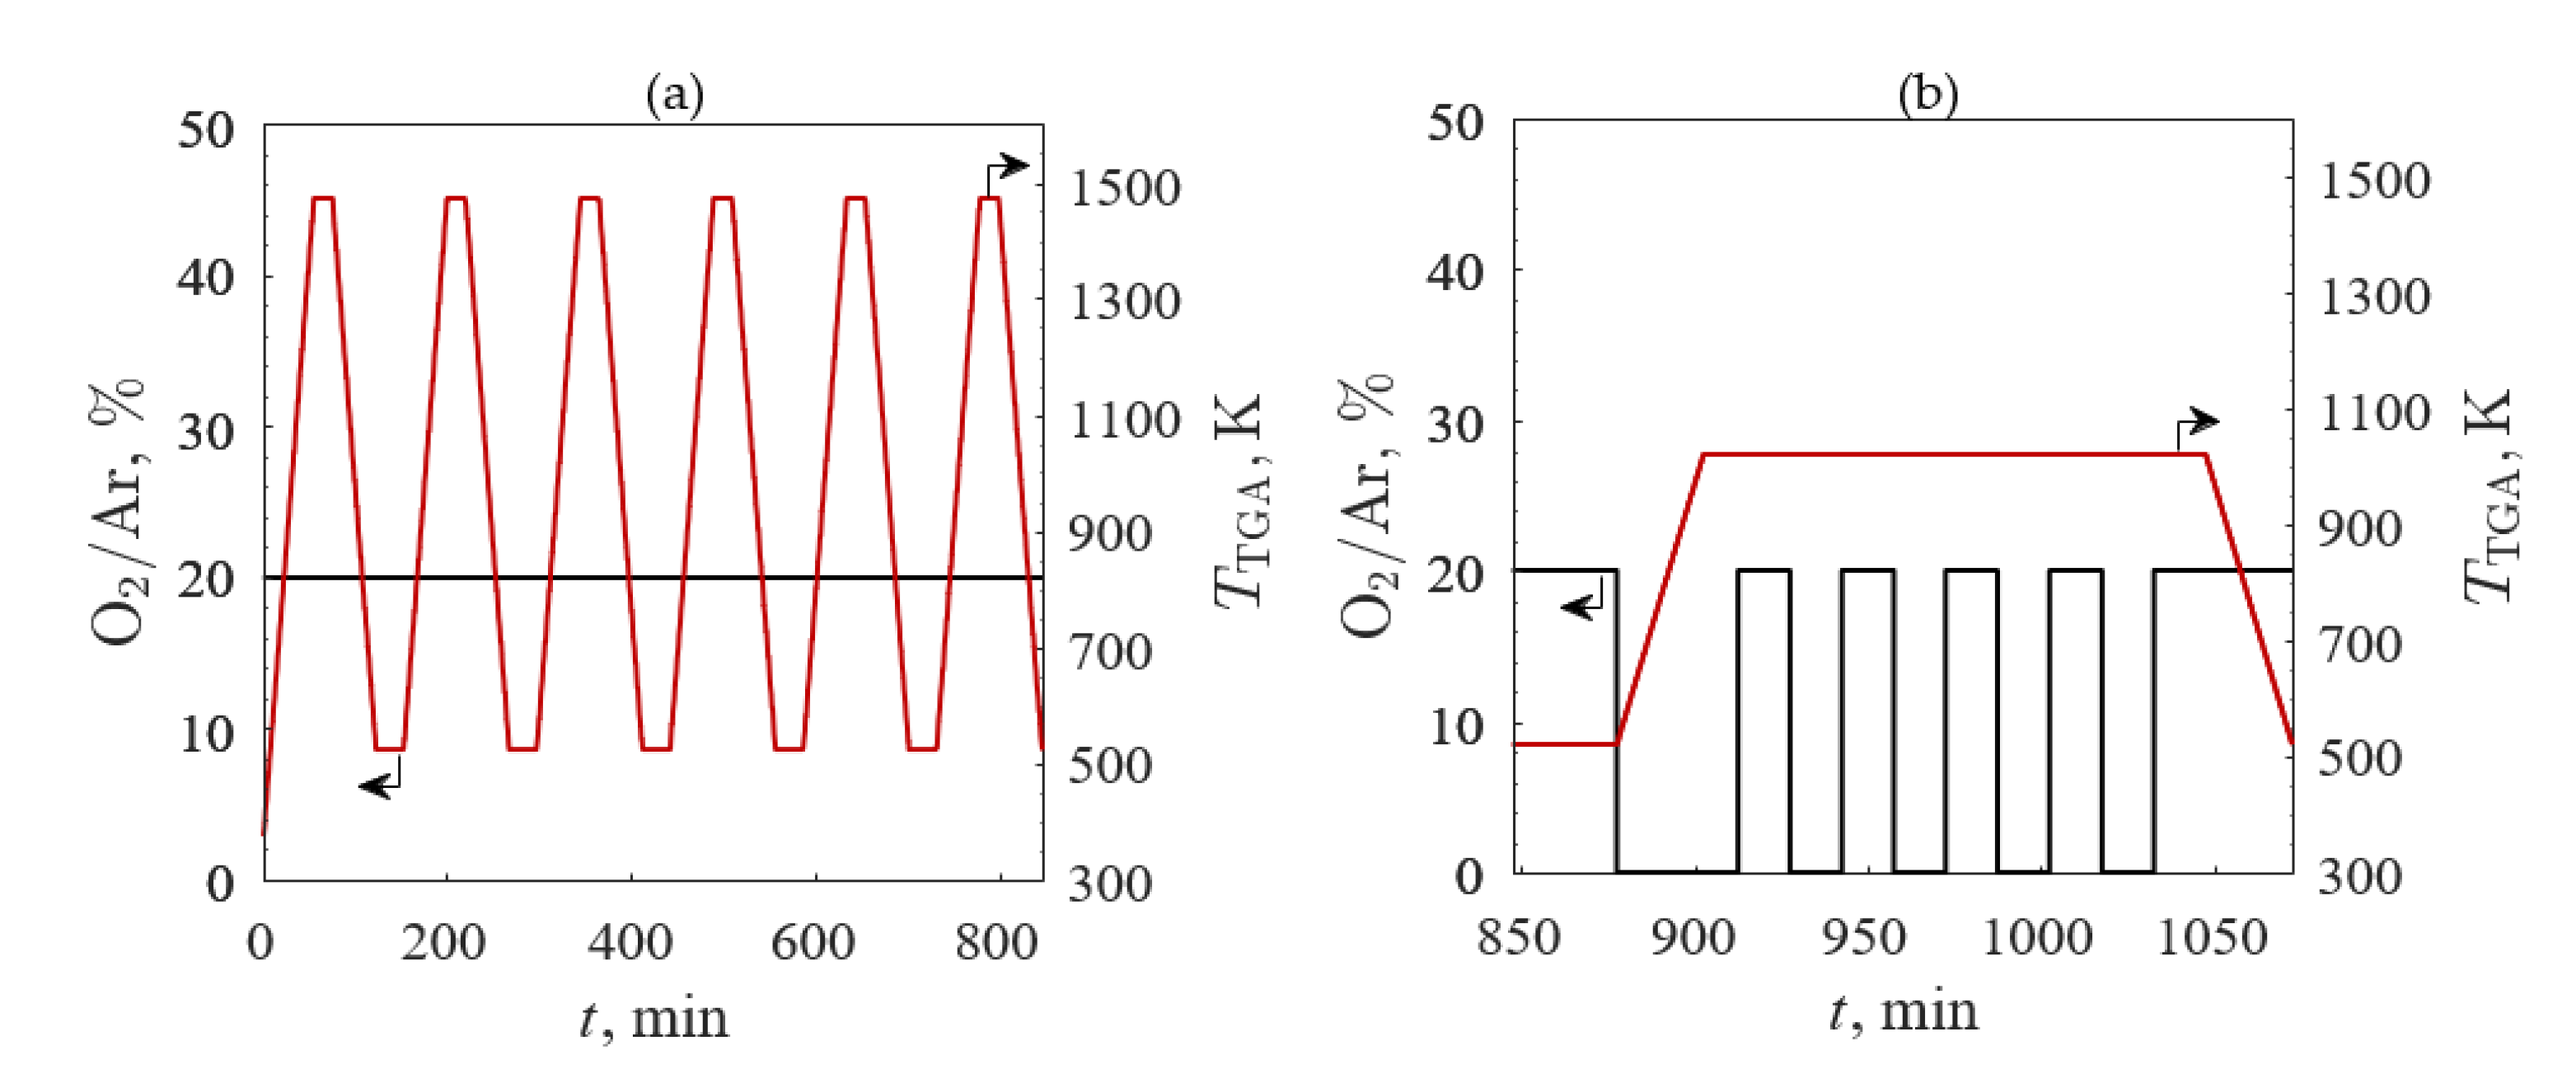
The third TGA screening evaluated redox repeatability for the four samples with the highest redox capacities: (1) A’ = Ba, (2) A’ = Ba and B’ = Co, (3) A’ = La, and (4) A’ = La and B’ = Co. The O2/Ar (black line) and TTGA (red line) profiles are shown in Figure 4 for (a) temperature- and (b) O2 pressure-swing cycles. TGA temperature- and O2 pressure-swings were performed to evaluate the redox capacity of each sample. After the initial break-in cycle, the samples were cycled between 523 and 1473 K in 20% O2/Ar five times with heating and cooling rates of 20 K/min and held isothermally for 20 min between heating and cooling steps. Five O2 pressure-swing cycles at an isotherm of 1023 K were consecutively completed for 20% O2/Ar and 100% Ar with the gas flow changed every 15 min. The samples were then cooled in 20% O2/Ar to ambient temperature at 20 K/min.
3. Results
A’xSr1−xB’yFe1−yO3−δ with 0 ≤ x,y ≤ 0.2 was synthesized. Synthesis was limited to x and y ≤ 0.2 to study incremental changes in the SrFeO3 structure. Higher x and y did not always result in single phase perovskite oxides and were not examined further. Ba2+ and Ca2+ were selected as A-site substituents based on similar ionic radii to Sr2+ (ionic radii of 135, 100, and 118 pm, respectively [23]). La3+ (ionic radii of 103 pm [23]) was selected as an A-site substituent to examine the impact of increasing average A-site charge while decreasing average B-site charge. First-row transition metals with multiple oxidation states (e.g., Co, Cr, Cu, and Mn) were selected for B-site substitution due to strong favorability for forming stable perovskite oxides as predicted from density functional theory modeling [24]. The standard first letter convention for perovskite oxides, followed by the site fractions (e.g., Ba0.2Sr0.8FeO3−δ ≡ BSF280 and SrCo0.1Fe0.9O3−δ ≡ SCF019), was used in this work to identify different A’xSr1−xB’yFe1−yO3−δ. The convention was adjusted to include the full elemental symbols for Ca, Cr, and Cu with C representing Co.
3.1. Characterization
XRD was used to determine the crystal structures of A’xSr1−xB’yFe1−yO3−δ. The diffractograms are shown in Figure 5 for SCoF019 (top blue), LSF190 (middle red), and LSF280 (bottom yellow) compared with SrFeO3−δ (vertical dashed lines). Single-phase tetragonal or cubic perovskites with peaks similar to cubic SrFeO3−δ were observed, except for LSF190, which shows a peak at 2θ = 32.3° that presumably corresponds to Sr3Fe2O7−δ. Peak splitting at 2θ = 69.6° for SCoF019 is indicative of a distortion from the cubic structure. An additional peak before the highest-intensity peak at 2θ = 32.3° for LSF190 indicative of a small amount of secondary phase. Some samples showed slight peak shifting from the cubic SrFeO3−δ peaks, as seen in LSF280. This was due to an increase (shift to lower 2θ) or decrease (shift to higher 2θ) of the lattice parameters [15].
A summary of the identified crystal structures for all of the A’xSr1−xB’yFe1−yO3−δ compositions is provided in Table 1. Melting was observed for B’ = Cu samples during synthesis with some samples such as SCuF280 experiencing incongruent melting during screenings, resulting in secondary phases of CuO and Fe2O3. Peak splitting in several of the patterns was indicative of lattice distortion. Peak splitting at 2θ = 69.6° as detailed in Figure 5 for SCoF019 was indicative of an orthorhombic structure.
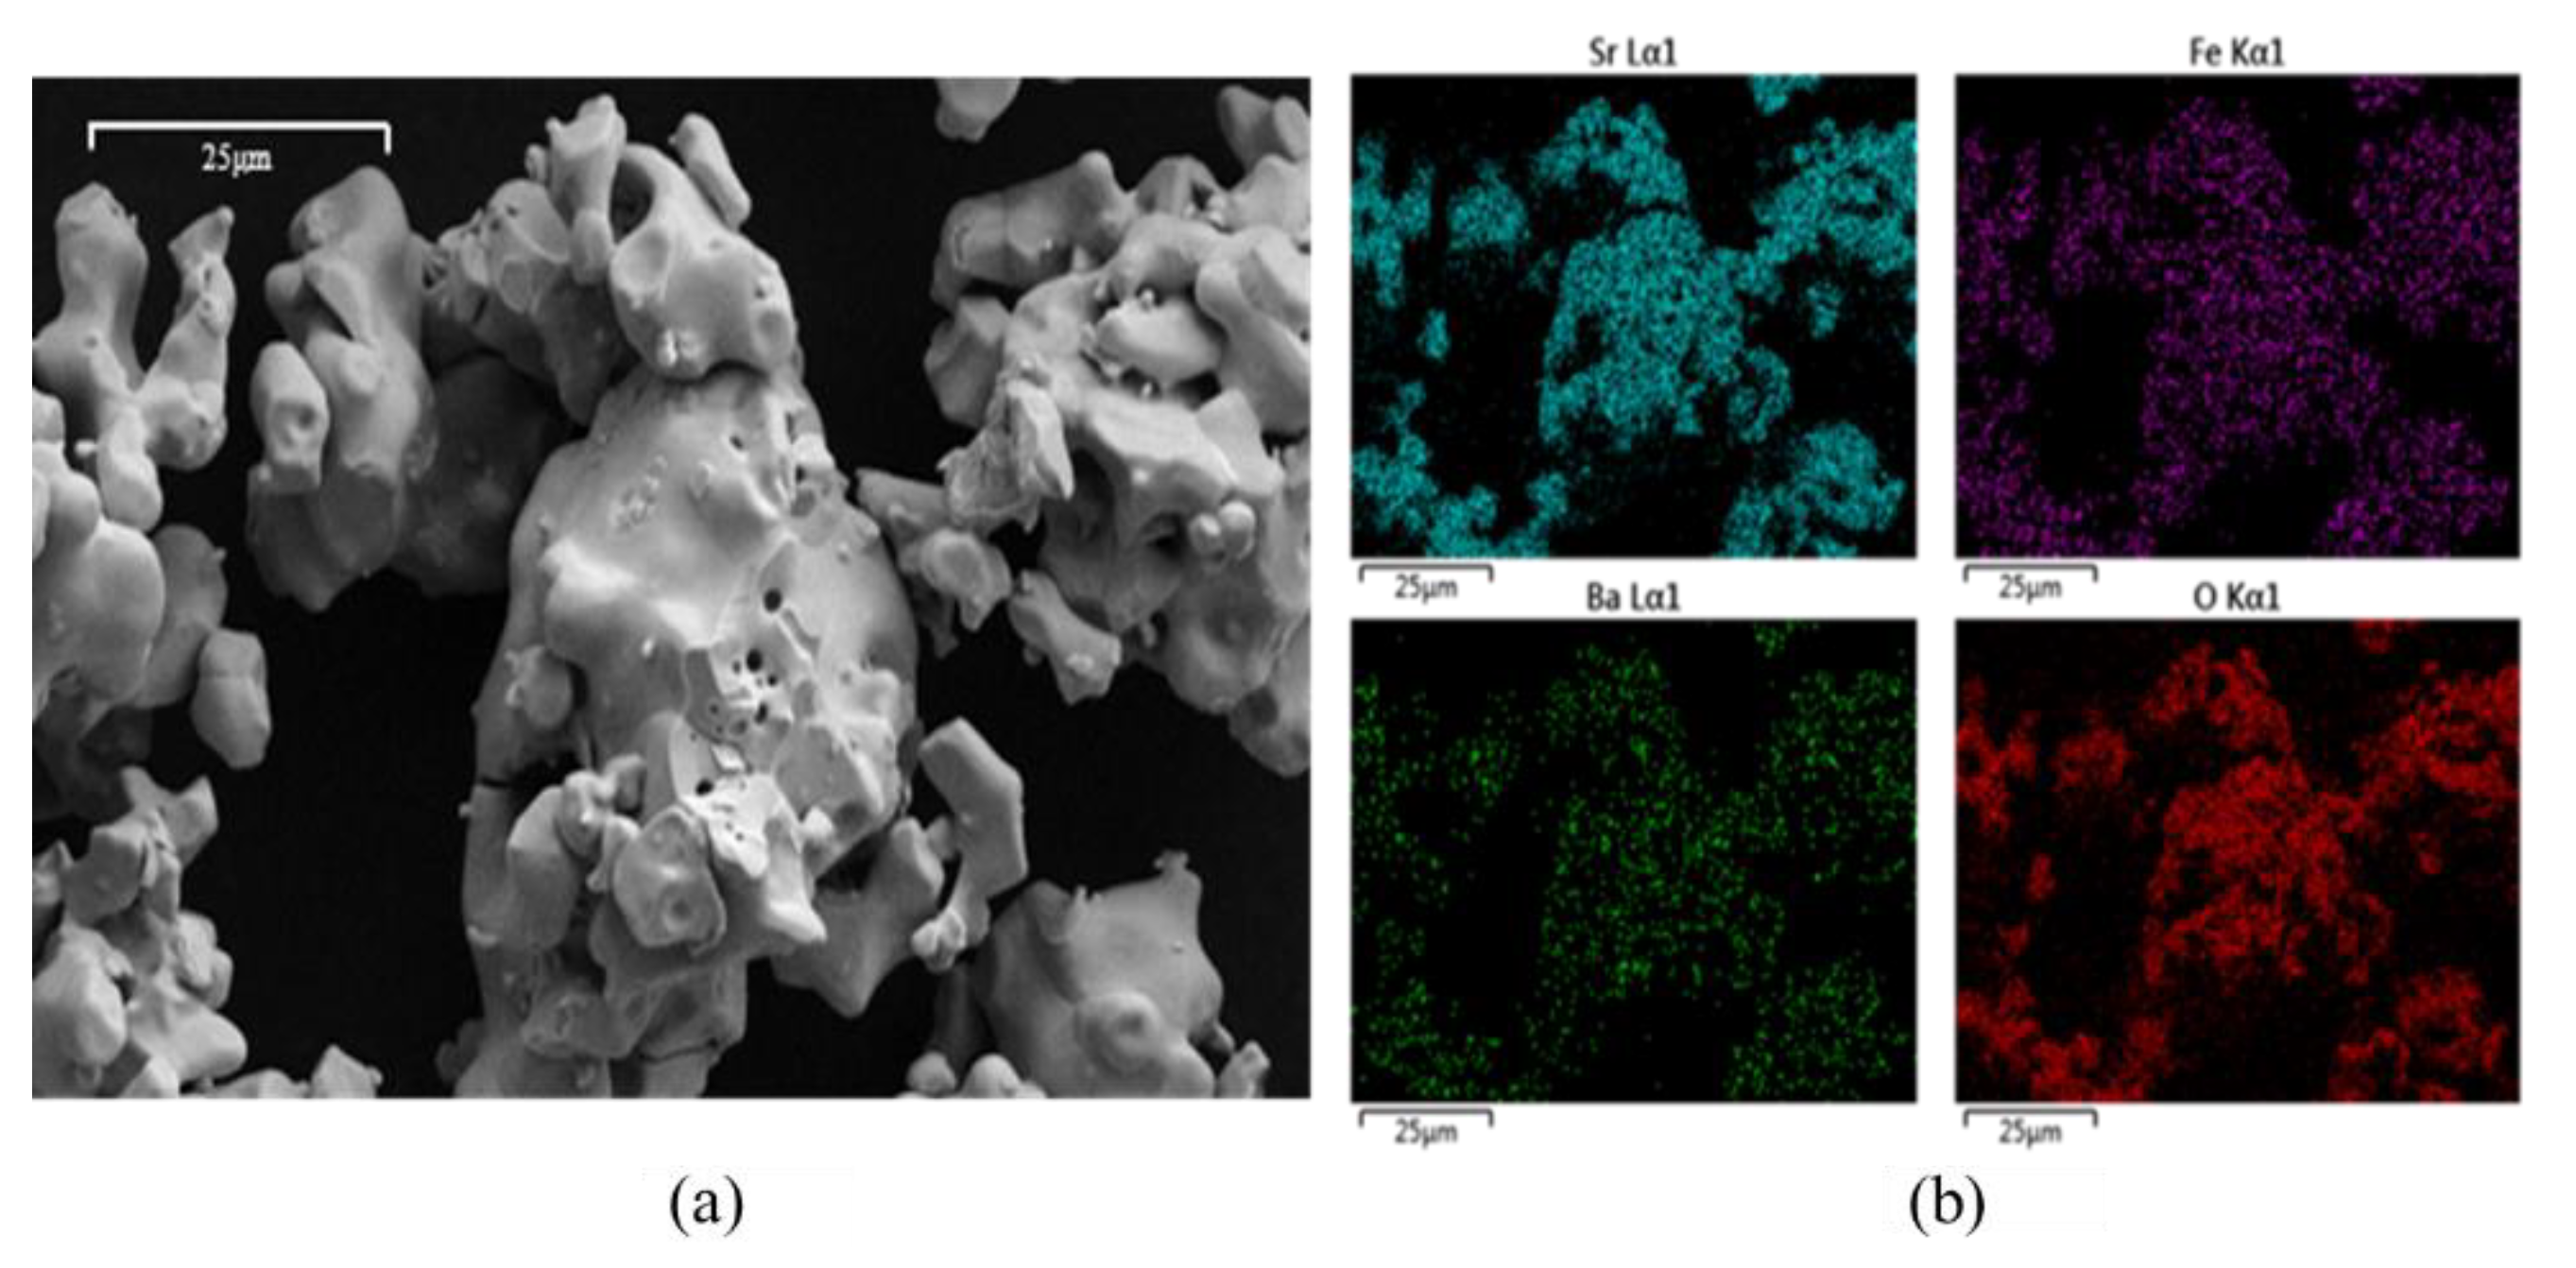
The particle morphology and elemental distribution for BSF190 were examined with SEM and EDS, shown in Figure 6 for (a) an SEM scan and (b) atomic distributions of Sr (blue), Fe (purple), Ba (green), and O (red) from EDS. SEM scans showed some particle rounding after cycling experiments with no evident changes in the particle size, suggesting no significant sintering. EDS maps showed uniform elemental distributions before and after the cycles. SEM and EDS showed similar effects for LSF190.
3.2. Thermogravimetry
The relative mass change and the deviation from stoichiometry change were used as metrics for determining redox capacity. The deviation from stoichiometry change is defined as:
where Δm is the mass change relative to the initial mass corrected with the blank run; minitial is the initial sample mass; is the molar mass of O2; and Minitial is the initial sample molar mass assuming stoichiometric oxygen in the sublattice.
3.2.1. TGA Screening 1
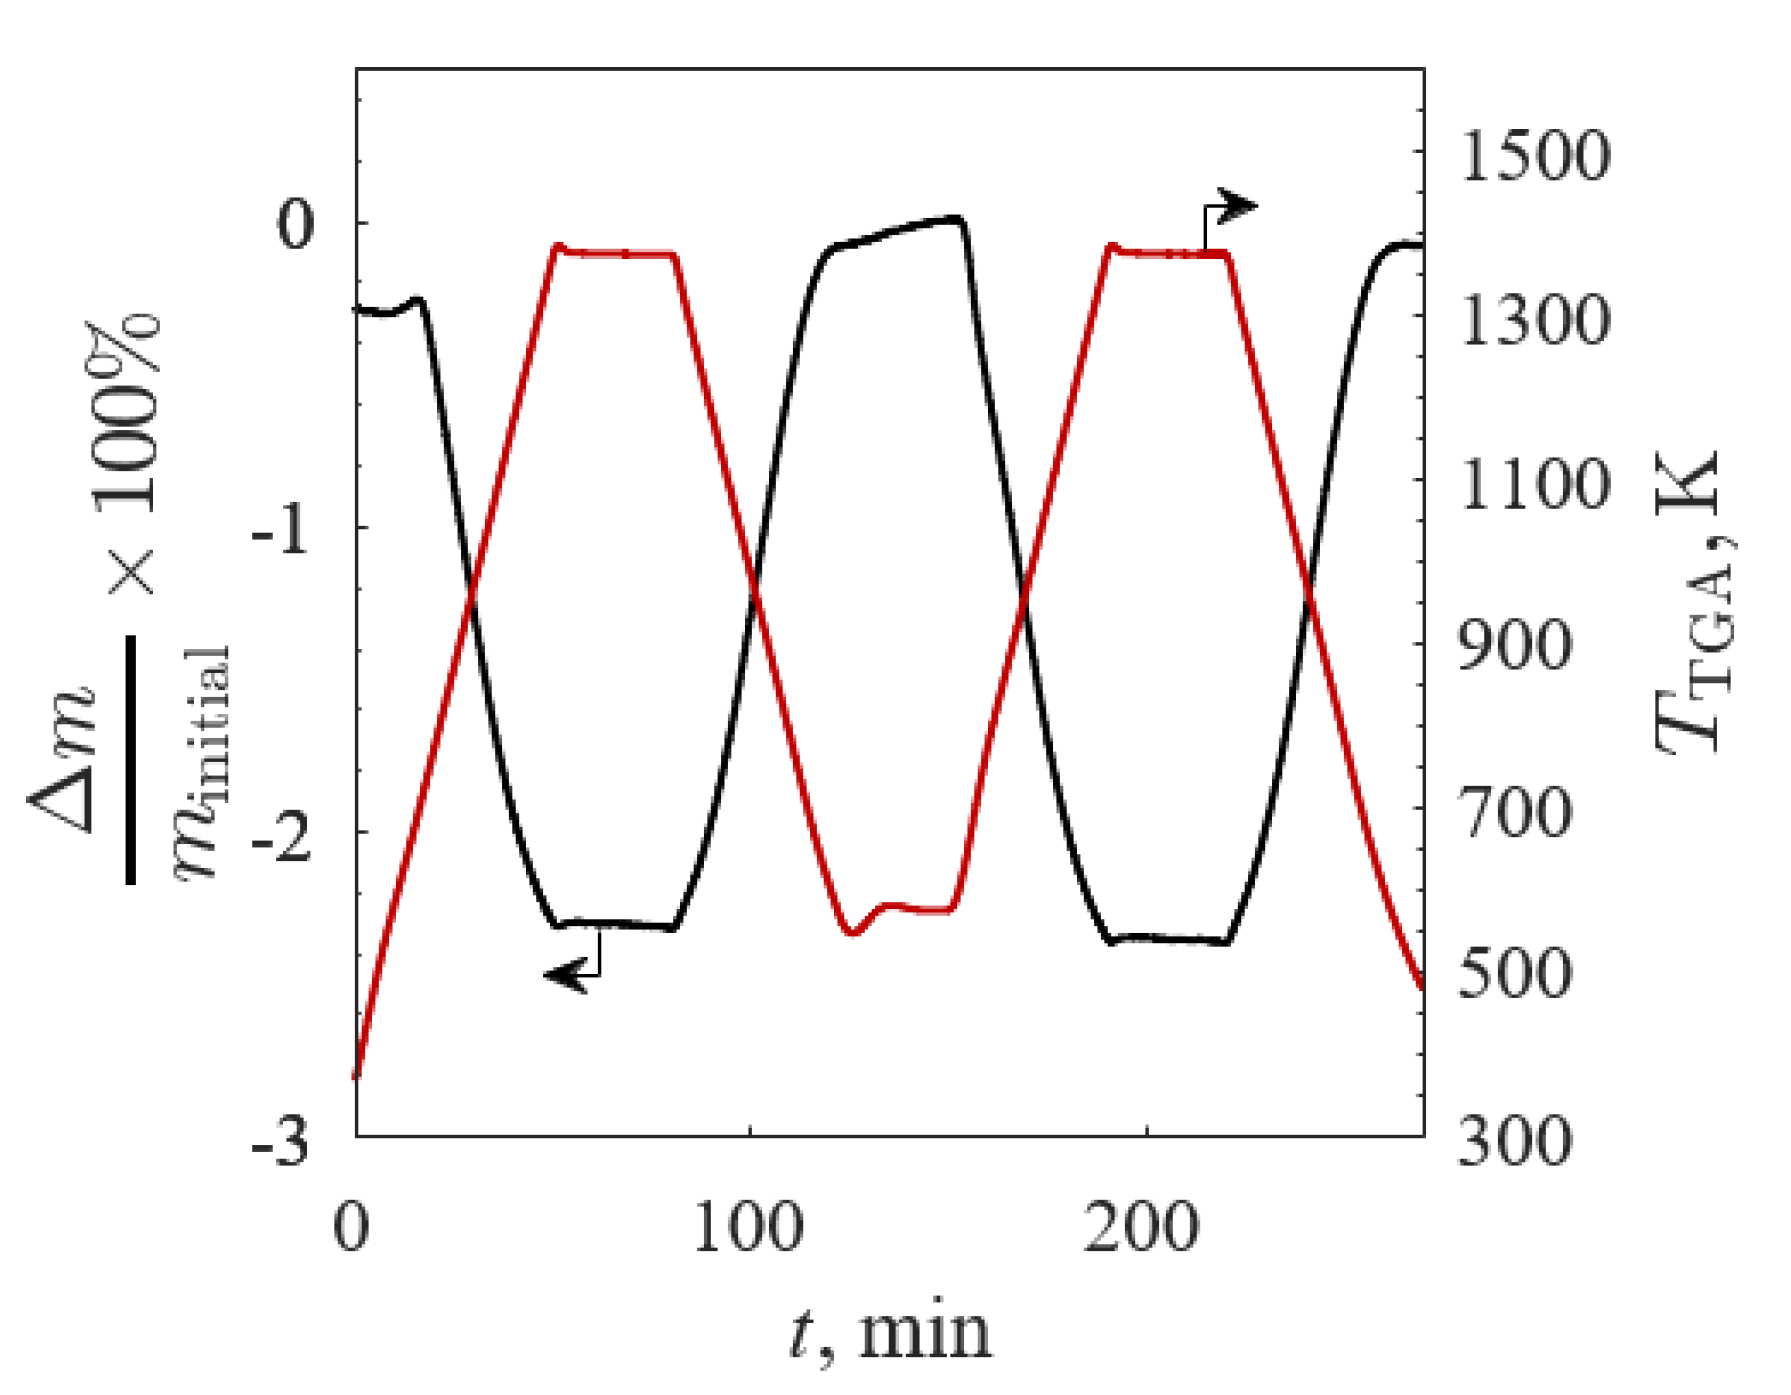
The Δm/minitial (black line) and TTGA (red line) versus time for BSCF190 for TGA Screening 1 are shown in Figure 7 (minitial = 108.8 mg to ensure no mass transfer limitations). Decreasing and increasing Δm/minitial were directly correlated to increasing and decreasing TTGA, respectively, with virtually no lag during the changes from isothermal to non-isothermal steps, suggesting a heat transfer limited reaction. The differences between Δm/minitial for the successive cycles were small, indicative of little to no degradation in redox capacity between cycles.
A summary of the results for all the samples is given in Table 2 for TGA Screening 1 in terms of Δm/minitial and Δδ. Continuous redox behavior was observed for most samples as a function of TTGA. SCuF028 was the exception with sudden mass changes around 1473 K, presumably due to redox reactions of the secondary CuO/Cu2O phases. A-site substitution generally increased the redox capacities of every B-site substituted compound, most notably for A’ = Ba and La. The decreased redox capacity between LSF190 and LSF280 was in agreement with previously published work on LSF [25]. B-site substitution only increased the redox capacity for B’ = Co, and the redox capacities for B’ = Cr, Cu, and Mn were significantly reduced. The B’ = Mn and Cu redox capacities were consistent with previously published literature [26,27]. The results showed no significant dependence with x or y on the redox capacity except for B’ = Cr, which reduced the overall Δm/minitial from 1.78% (Δδ = 0.21) to 1.37% (Δδ = 0.16) as y increased from 0.10 to 0.20. B’ = Cr, Cu, and Mn were eliminated from subsequent TGA screenings due to their low redox capacities compared to SrFeO3−δ.
3.2.2. TGA Screening 2
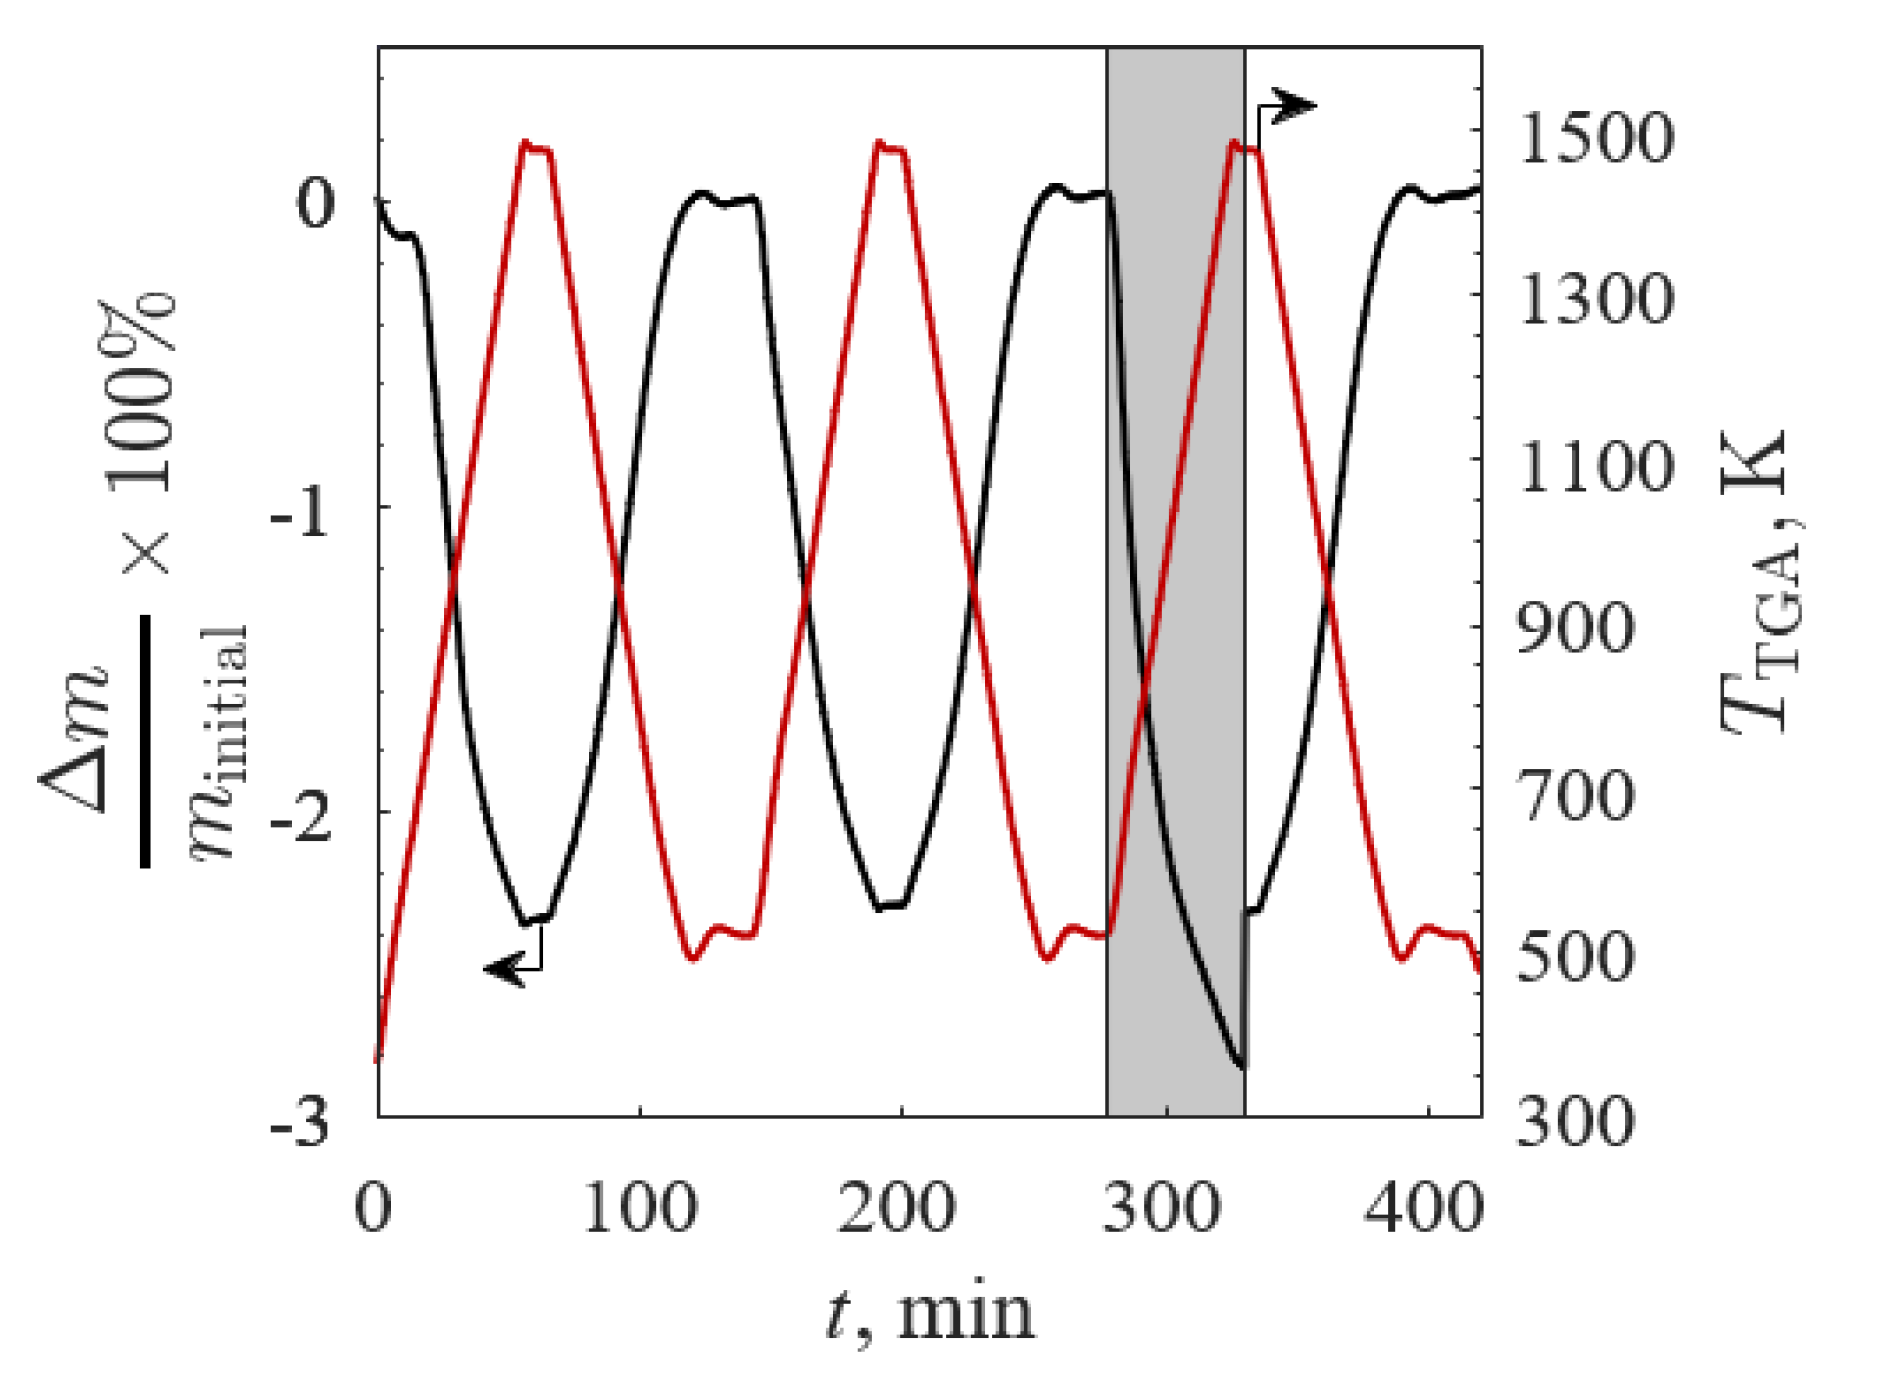
The Δm/minitial (black line) and TTGA (red line) versus time for BSCF2828 for TGA Screening 2 are shown in Figure 8 (minitial = 117.3 mg to ensure no mass transfer limitations), where 100% Ar is denoted by the gray shaded region. The profiles for Δm/minitial and Δδ were similar for each sample reoxidation as Δm → 0 and Δδ → 0 in each of the three low temperature steps. The drop in Δm/minitial was caused by the gas switch during the isothermal stage from 100% Ar to 20% O2/Ar with a shift in chemical equilibrium according to Le Chatelier’s principle. The immediate response of Δm/minitial to the changing gas atmosphere was evidence of rapid oxidation. The Δm/minitial did not equilibrate during the allotted time for thermal reduction after switching to 100% Ar due to residual O2 during the gas changeover. The Δm/minitial for all samples closely followed the temperature and O2 pressure changes and quickly equilibrated under 20% O2/Ar, indicative of rapid reduction and oxidation reactions.
A summary of the results from TGA Screening 2 is given in Table 3 for Δm/minitial and Δδ. While B’ = Co improved the redox capacity in TGA Screening 1, this result was inconsistent with further analyses of analogs at higher TTGA in both 100% Ar and 20% O2/Ar in the TGA Screening 2. All A-site substitutions improved the redox capacity in 20% O2/Ar with equal or improved results in 100% Ar. A’ = Ba and La had the greatest improvements in redox capacity. In all samples, x = 0.10 corresponded to a higher redox capacity compared to x = 0.20 except for CaSF190, which showed an increased redox capacity with increased x. Previous work has shown a positive trend for x for A’ = La and B’ = Co with sample redox capacity when reducing in 100% Ar from 473 to 1523 K [16]. While most samples did not equilibrate during the thermal reduction in 100% Ar, all A’ = Ca samples equilibrated faster for greater x. LSF and BSF190 (highlighted in Table 3) were the highest reducing samples.
A departure from the continuous reduction (and not oxidation) with TTGA was observed for CaSCF1919 and CaSCF2828. XRD showed that A’ = Ca samples remained in the perovskite phase with little crystal structure changes before and after TGA. Incongruent Δm was observed upon reduction under low O2/Ar in the TGA, potentially due to a reversible phase change, reversible dissociation [28], or induced order/disorder (e.g., in oxygen vacancy) in the material. Post-TGA XRD at room temperature revealed no changes from pre-TGA scans.
3.2.3. TGA Screening 3
The Δm/minitial (black line) and TTGA (red line) versus time for BSCF1919 for TGA Screening 3 are shown in Figure 9 (minitial = 107.0 mg) for (a) temperature- and (b) O2 pressure-swing cycles. The five temperature-swing cycles between 523 and 1473 K at 20% O2/Ar were consistent with TGA Screenings 1 and 2, where the Δm/minitial closely followed TTGA and equilibrated during the isothermal steps (Figure 9a). During the isothermal O2 pressure-swing cycles between 20% O2/Ar and 100% Ar (denoted in gray) at 1023 K (Figure 9b), the mass change of the sample was due to Le Chatelier’s Principle. The sample reached equilibrium during oxidation but not during reduction. This was due to the same phenomena observed in TGA Screening 2 where residual O2 during the changeover to 100% Ar hindered reduction potential.
The mean Δm/minitial, mean Δδ and the standard deviation for all the temperature- and O2 pressure-swing cycles are presented in Table 4. All A’xSr1−xB’yFe1−yO3−δ had higher redox capacities during the temperature-swings compared to SrFeO3−δ but lower redox capacities compared to SrFeO3−δ during the O2 pressure-swings at 1023 K. This was possibly caused by the increased disorder and changes in fugacity associated with A- and/or B-site substitutions compared to SrFeO3−δ. The mean Δδ was highest for LSCF1919 during temperature-swings, and all A’xSr1−xB’yFe1−yO3−δ had a lower mean Δδ compared to SrFeO3−δ for the O2 pressure-swings. The standard deviations were three orders of magnitude smaller than mean Δδ, indicative of little cycle degradation and a high level of repeatability.
4. Discussion
This work outlines a foundational study to examine the redox capacities of SrFeO3−δ with different A- and B-site substitutions. The aim of the study was to identify promising materials to increase redox capacity and stability at reduced temperatures and reaction enthalpies for thermochemical air separation. Systematic analyses extended previous work that examined A’ = La, Ba, Ca and B’ = Co, Cu, Mn. The A-site substitutions assessed the impact of ionic radii and aliovalent substitutions that alter the average B-site oxidation state for site factions of 0 ≤ x ≤ 0.2 with A’ = La, Ba, and Ca. B-site substitutions investigated different transitional metal ions capable of increasing redox capacities for B’ = Co, Cr, Cu, and Mn for site fractions of 0 ≤ y ≤ 0.2. The stability of promising A- and B-site substitutions over multiple cycles for different O2 pressure- and temperature-swings was examined along with changes in morphology with SEM, elemental distributions with EDS, and crystallography and phase identification with XRD. This work provides a strong foundation for developing the solar thermochemical reactors and off-sun oxidation reactors to separate O2 from air. A framework for identifying the rate-limiting mechanism(s) for both oxidation and reduction reactions through detailed kinetic analyses was also outlined.
5. Conclusions
An A- and B-site substitutional study in SrFeO3−δ (A’xSr1−xB’yFe1−yO3−δ) was performed to examine the potential of removing O2 from air to produce N2 in a two-step solar thermochemical cycle based on reversible reduction/oxidation (redox) reactions. Thermogravimetry was used in three screening studies using temperature- and O2 pressures-swings to assess redox capacities and chemical stability. X-ray diffractometry and scanning electron microscopy/energy dispersive spectroscopy were used to characterize particle morphology and elemental dispersion. A’ = Ba and La compositions showed a homogenous distribution of the cations, indicating no phase segregation. A’ = Ba and La compositions showed no evident changes in the particle size, indicating no significant sintering. B’ = Cu, Cr, and Mn substitutions were found to diminish redox capacities compared with SrFeO3−δ. La0.1Sr0.9Co0.1Fe0.9O3−δ showed the greatest improvement in redox capacities with induced deviation from stoichiometry changes of 0.37 upon reduction, followed by Ba0.1Sr0.9FeO3−δ and La0.1Sr0.9FeO3−δ with equal deviation from stoichiometry changes of 0.34. All samples except for A’ = Ca showed continuous and reversible reaction. There is evidence that samples with A’ = Ca underwent reversible phase changes at high temperatures and low O2 pressures. Little to no redox capacity degradation was observed during temperature- and pressure-swing cycling for all samples. The high redox capacities, rapid reaction rates, and structural stability are promising initial results for solar thermochemical air separation cycles based on A’xSr1−xB’yFe1−yO3−δ redox reactions.
Author Contributions
Conceptualization, all authors; methodology, all authors.; formal analysis, T.P.F., N.P.N., and H.E.B.; investigation, all authors.; resources, A.A. and P.G.L.; data curation, T.P.F. and N.P.N.; writing—original draft preparation, T.P.F. and N.P.N.; writing—review and editing, all authors.; visualization, T.P.F., N.P.N., and P.G.L.; supervision, A.A. and P.G.L.; project administration, A.A. and P.G.L.; funding acquisition, A.A. and P.G.L. All authors have read and agreed to the published version of the manuscript.
Funding
This research was funded by U.S. Department of Energy’s Office of Energy Efficiency and Renewable Energy (EERE) under the Solar Energy Technologies Office (SETO) Award Number DE-EE0034250.
Acknowledgments
This material is based upon work supported by the U.S. Department of Energy’s Office of Energy Efficiency and Renewable Energy (EERE) under the Solar Energy Technologies Office (SETO) Award Number DE-EE0034250. Sandia National Laboratories is a multimission laboratory managed and operated by National Technology & Engineering Solutions of Sandia, LLC, a wholly owned subsidiary of Honeywell International Inc., for the U.S. Department of Energy’s National Nuclear Security Administration under contract DE-NA0003525.
Conflicts of Interest
The authors declare no conflict of interest.
Nomenclature
| δ | deviation from stoichiometry |
| σΔδ | standard deviation of the change in deviation from stoichiometry |
| 2θ | X-ray diffraction angle |
| A | A-site cation |
| A’ | A-site cation substitution |
| B | B-site cation |
| B’ | B-site cation substitution |
| C | cubic lattice structure |
| neutral charged Fe ion | |
| negatively charged Fe ion | |
| I | X-ray diffraction peak intensity |
| M | monoclinic lattice structure |
| Minitial | stochiometric molar mass of sample |
| minitial | initial mass |
| Δm | change in mass |
| molar mass of O2 | |
| O | orthorhombic lattice structure |
| neutral charged O ion | |
| T | tetragonal lattice structure |
| t | time |
| TTGA | measured temperature of the TGA |
| VÖ | O2− vacancy |
| x | A-site substitution fraction |
| y | B-site substitution fraction |
References
- Modak, J.M. Haber process for ammonia synthesis. Resonance 2002, 7, 69–77. [Google Scholar] [CrossRef]
- Banaszkiewicz, T.; Chorowski, M.; Gizicki, W. Comparative analysis of cryogenic and PTSA technologies for systems of oxygen production. In Proceedings of the AIP Conference Proceedings, Surakarta, Indonesia, 12 May 2018; pp. 1373–1378. [Google Scholar]
- Hassan, M.; Ruthven, D.; Raghavan, N. Air separation by pressure swing adsorption on a carbon molecular sieve. Chem. Eng. Sci. 1986, 41, 1333–1343. [Google Scholar] [CrossRef]
- Grande, C.A. Advances in pressure swing adsorption for gas separation. ISRN Chem. Eng. 2012, 2012, 982934. [Google Scholar] [CrossRef] [Green Version]
- Kosinov, N.; Gascon, J.; Kapteijn, F.; Hensen, E.J.M. Recent developments in zeolite membranes for gas separation. J. Membr. Sci. 2016, 499, 65–79. [Google Scholar] [CrossRef]
- Bulfin, B.; Lapp, J.; Richter, S.; Gubàn, D.; Vieten, J.; Brendelberger, S.; Roeb, M.; Sattler, C. Air separation and selective oxygen pumping via temperature and pressure swing oxygen adsorption using a redox cycle of SrFeO3 perovskite. Chem. Eng. Sci. 2019, 203, 68–75. [Google Scholar] [CrossRef]
- Marek, E.; Hu, W.; Gaultois, M.; Grey, C.P.; Scott, S.A. The use of strontium ferrite in chemical looping systems. Appl. Energy 2018, 223, 369–382. [Google Scholar] [CrossRef]
- Vieten, J.; Bulfin, B.; Call, F.; Lange, M.; Schmücker, M.; Francke, A.; Roeb, M.; Sattler, C. Perovskite oxides for application in thermochemical air separation and oxygen storage. J. Mater. Chem. A 2016, 4, 13652–13659. [Google Scholar] [CrossRef]
- Bush, H.E.; Datta, R.; Loutzenhiser, P.G. Aluminum-doped strontium ferrites for a two-step solar thermochemical air separation cycle: Thermodynamic characterization and cycle analysis. Sol. Energy 2019, 188, 775–786. [Google Scholar] [CrossRef]
- Babiniec, S.M.; Coker, E.N.; Miller, J.E.; Ambrosini, A. Doped calcium manganites for advanced high-temperature thermochemical energy storage. Int. J. Energy Res. 2016, 40, 280–284. [Google Scholar] [CrossRef]
- Schrader, A.J.; Bush, H.E.; Ranjan, D.; Loutzenhiser, P.G. Aluminum-doped calcium manganite particles for solar thermochemical energy storage: Reactor design, particle characterization, and heat and mass transfer modeling. Int. J. Heat Mass Transf. 2020, 152, 119461. [Google Scholar] [CrossRef]
- Schrader, A.J.; Schieber, G.L.; Ambrosini, A.; Loutzenhiser, P.G. Experimental demonstration of a 5 kWth granular-flow reactor for solar thermochemical energy storage with aluminum-doped calcium manganite particles. Appl. Therm. Eng. 2020, 173, 115257. [Google Scholar] [CrossRef]
- Curnan, M.T.; Kitchin, J.R. Effects of concentration, crystal structure, magnetism, and electronic structure method on first-principles oxygen vacancy formation energy trends in perovskites. J. Phys. Chem. C 2014, 118, 28776–28790. [Google Scholar] [CrossRef]
- Pena, M.A.; Fierro, J.L. Chemical structures and performance of perovskite oxides. Chem. Rev. 2001, 101, 1981–2017. [Google Scholar] [CrossRef] [PubMed]
- Varadaraju, V.B.U.V. Effect of La3+ substitution on the structure and superconductivity in TlBa2−xLaxCaCu2O7 (x = 0.0 − 1.0). Solid State Commun. 1995, 93, 1003–1007. [Google Scholar]
- Babiniec, S.M.; Coker, E.N.; Miller, J.E.; Ambrosini, A. Investigation of LaxSr1−xCoyM1−yO3−δ (M = Mn, Fe) perovskite materials as thermochemical energy storage media. Sol. Energy 2015, 118, 451–459. [Google Scholar] [CrossRef] [Green Version]
- Gokon, N.; Yawata, T.; Bellan, S.; Kodama, T.; Cho, H.-S. Thermochemical behavior of perovskite oxides based on LaxSr1−x(Mn, Fe, Co)O3−δ and BaySr1−yCoO3−δ. Energy Procedia 2019, 171, 971–980. [Google Scholar] [CrossRef]
- Bulfin, B.; Vieten, J.; Richter, S.; Naik, J.M.; Patzke, G.R.; Roeb, M.; Sattler, C.; Steinfeld, A. Isothermal relaxation kinetics for the reduction and oxidation of SrFeO3 based perovskites. Phys. Chem. Chem. Phys. 2020, 22, 2466–2474. [Google Scholar] [CrossRef] [Green Version]
- Dou, J.; Krzystowczyk, E.; Wang, X.; Robbins, T.; Ma, L.; Liu, X.; Li, F. A- and B-site codoped SrFeO3 oxygen sorbents for enhanced chemical looping air separation. ChemSusChem 2020, 13, 385–393. [Google Scholar] [CrossRef]
- Ezbiri, M.; Allen, K.M.; Galvez, M.E.; Michalsky, R.; Steinfeld, A. Design principles of perovskites for thermochemical oxygen separation. ChemSusChem 2015, 8, 1966–1971. [Google Scholar] [CrossRef] [Green Version]
- Pechini, M.P. Method of Preparing Lead and Alkaline Earth Titanates and Niobates and Coating Method Using the Same to Form a Capacitor. U.S. Patent 3330697, 11 July 1967. [Google Scholar]
- Gates-Rector, S.; Blanton, T. The powder diffraction file: A quality materials characterization database. Powder Diffr. 2019, 34, 352–360. [Google Scholar] [CrossRef] [Green Version]
- Shannon, R.D. Revised effective ionic radii and systematic studies of interatomic distances in halides and chalcogenides. Acta Crystallogr. 1976, 32, 751–767. [Google Scholar] [CrossRef]
- Emery, A.A.; Saal, J.E.; Kirklin, S.; Hegde, V.I.; Wolverton, C. High-throughput computational screening of perovskites for thermochemical water splitting applications. Chem. Mater. 2016, 28, 5621–5634. [Google Scholar] [CrossRef]
- Sastre, D.; Serrano, D.P.; Pizarro, P.; Coronado, J.M. Chemical insights on the activity of La1−xSrxFeO3 perovskites for chemical looping reforming of methane coupled with CO2-splitting. J. CO2 Util. 2019, 31, 16–26. [Google Scholar] [CrossRef]
- Vieten, J.; Bulfin, B.; Senholdt, M.; Roeb, M.; Sattler, C.; Schmücker, M. Redox thermodynamics and phase composition in the system SrFeO3−δ—SrMnO3−δ. Solid State Ion. 2017, 308, 149–155. [Google Scholar] [CrossRef]
- Vieten, J.; Bulfin, B.; Starr, D.E.; Hariki, A.; de Groot, F.M.F.; Azarpira, A.; Zachäus, C.; Hävecker, M.; Skorupska, K.; Knoblauch, N.; et al. Redox behavior of solid solutions in the SrFe1−xCuxO3−δ system for application in thermochemical oxygen storage and air separation. Energy Technol. 2019, 7, 131–139. [Google Scholar] [CrossRef] [Green Version]
- Muhich, C.L.; Evanko, B.W.; Weston, K.C.; Lichty, P.; Liang, X.; Martinek, J.; Musgrave, C.B.; Weimer, A.W. Efficient generation of H2 by splitting water with an isothermal redox cycle. Science 2013, 341, 540–542. [Google Scholar] [CrossRef]
Figure 1.
Schematic of the two-step solar thermochemical air separation cycle based on reversible reduction/oxidation SrFeO3−δ perovskite reactions with different A- and/or B-site substitutions.
Figure 1.
Schematic of the two-step solar thermochemical air separation cycle based on reversible reduction/oxidation SrFeO3−δ perovskite reactions with different A- and/or B-site substitutions.

Figure 2.
O2 concentration in Ar (black line) and temperature (red line) profiles versus time between 573 and 1373 K in 20% O2/Ar for the first TGA screening.
Figure 2.
O2 concentration in Ar (black line) and temperature (red line) profiles versus time between 573 and 1373 K in 20% O2/Ar for the first TGA screening.

Figure 3.
O2 concentration in Ar (black line) and temperature (red line) profiles versus time between 523 and 1473 K in 20% O2/Ar and 100% Ar for second TGA screening.
Figure 3.
O2 concentration in Ar (black line) and temperature (red line) profiles versus time between 523 and 1473 K in 20% O2/Ar and 100% Ar for second TGA screening.

Figure 4.
O2 concentration in Ar (black line) and temperature (red line) profiles versus time with the (a) temperature-swing between 523 and 1473 K in 20% O2/Ar and (b) O2 pressure-swing between 20% O2/Ar and 100% Ar at 1023 K for the third TGA screening.
Figure 4.
O2 concentration in Ar (black line) and temperature (red line) profiles versus time with the (a) temperature-swing between 523 and 1473 K in 20% O2/Ar and (b) O2 pressure-swing between 20% O2/Ar and 100% Ar at 1023 K for the third TGA screening.

Figure 5.
Intensity as function of 2θ from X-ray diffraction where the vertical dashed lines represent cubic SrFeO3−δ (PDF 04 007 9408) compared with SrCo0.1Fe0.9O3−δ (top blue), La0.1Sr0.9FeO3−δ (middle red), and La0.2Sr0.8FeO3−δ (bottom yellow).
Figure 5.
Intensity as function of 2θ from X-ray diffraction where the vertical dashed lines represent cubic SrFeO3−δ (PDF 04 007 9408) compared with SrCo0.1Fe0.9O3−δ (top blue), La0.1Sr0.9FeO3−δ (middle red), and La0.2Sr0.8FeO3−δ (bottom yellow).

Figure 6.
Images of Ba0.1Sr0.9FeO3−δ from (a) scanning electron microscopy and (b) atomic distribution of Sr (blue), Fe (purple), and Ba (green) cations and O (red) anions from energy dispersive X-ray spectroscopy.
Figure 6.
Images of Ba0.1Sr0.9FeO3−δ from (a) scanning electron microscopy and (b) atomic distribution of Sr (blue), Fe (purple), and Ba (green) cations and O (red) anions from energy dispersive X-ray spectroscopy.

Figure 7.
Relative mass change (black line) and temperature (red line) versus time of Ba0.2Sr0.8FeO3−δ between 573 and 1373 K in 20% O2/Ar for TGA Screening 1.
Figure 7.
Relative mass change (black line) and temperature (red line) versus time of Ba0.2Sr0.8FeO3−δ between 573 and 1373 K in 20% O2/Ar for TGA Screening 1.

Figure 8.
Relative mass change (black line) and temperature (red line) versus time of Ba0.2Sr0.8Co0.2Fe0.8O3−δ between 523 and 1473 K in 20% O2/Ar and 100% Ar (gray region) for TGA Screening 2.
Figure 8.
Relative mass change (black line) and temperature (red line) versus time of Ba0.2Sr0.8Co0.2Fe0.8O3−δ between 523 and 1473 K in 20% O2/Ar and 100% Ar (gray region) for TGA Screening 2.

Figure 9.
Relative mass change (black line) and temperature (red line) versus time for Ba0.1Sr0.9Co0.1Fe0.9O3−δ with five reduction/oxidation cycles with the (a) temperature-swing from 523 and 1473 K in 20% O2/Ar and (b) O2 pressure-swing from 20% O2/Ar to 100% Ar (gray region) O2/Ar at 1023 K for TGA Screening 3.


Table 1.
Lattice structures from X-ray diffractometry for A- and/or B-site substitutions in SrFeO3−δ (C ≡ cubic, T ≡ tetragonal, O ≡ orthorhombic, M ≡ monoclinic) with secondary phase (s).
Table 1.
Lattice structures from X-ray diffractometry for A- and/or B-site substitutions in SrFeO3−δ (C ≡ cubic, T ≡ tetragonal, O ≡ orthorhombic, M ≡ monoclinic) with secondary phase (s).
| Sample | Crystal Structure | PDF-4+ Card # | Secondary Phase (s) |
|---|---|---|---|
| SrFeO3−δ | T | 04-023-5157 | N |
| BSF190 | C | 00-059-0658 | N |
| BSF280 | C | 00-059-0658 | N |
| CaSF190 | T | 04-011-5465 | N |
| CaSF280 | O | 01-083-3533 | N |
| LSF190 | C | 04-023-5157 | Y |
| LSF280 | C | 04-023-5157 | Y |
| SCF019 | O | 04-011-5466 | N |
| SCF028 | T | 04-002-0279 | N |
| SCrF019 | O | 04-020-6506 | N |
| SCrF028 | T | 04-006-9226 | N |
| SCuF019 | T | 04-018-8743 | N |
| SCuF028 | T | 04-021-6591 | Y |
| SMF019 | C | 04-007-9930 | N |
| SMF028 | C | 04-006-6180 | Y |
| BSCF1919 | C | 04-013-0029 | Y |
| BSCF2828 | C | 04-013-0029 | N |
| CaSCF1919 | C | 04-008-4374 | Y |
| CaSCF2828 | C | 04-008-3172 | Y |
| LSCF1919 | T | 04-002-3182 | N |
| LSCF2828 | C | 04-016-4840 | Y |
Table 2.
Relative mass changes and deviation from stoichiometry changes for A- and/or B-site substitutions in SrFeO3−δ for TGA Screening 1 with temperatures between 573 and 1373 K in 20% O2/Ar.
Table 2.
Relative mass changes and deviation from stoichiometry changes for A- and/or B-site substitutions in SrFeO3−δ for TGA Screening 1 with temperatures between 573 and 1373 K in 20% O2/Ar.
| Sample | Δm/minitial × 100% | Δδ | Sample | Δm/minitial × 100% | Δδ |
|---|---|---|---|---|---|
| SrFeO3-δ | −2.33 | 0.28 | - | - | - |
| BSF190 | −2.36 | 0.29 | BSF280 | −2.23 | 0.28 |
| LSF190 | −2.61 | 0.32 | LSF280 | −2.54 | 0.32 |
| CaSF190 | −2.34 | 0.27 | CaSF280 | −2.37 | 0.27 |
| SCF019 | −2.31 | 0.28 | SCF028 | −2.28 | 0.28 |
| SCrF019 | −1.78 | 0.21 | SCrF028 | −1.37 | 0.16 |
| SCuF019 | −1.79 | 0.22 | SCuF028 | −1.85 | 0.23 |
| SMnF019 | −1.85 | 0.22 | SMnF028 | −1.99 | 0.24 |
Table 3.
Relative mass change and deviation from stoichiometry change for A- and/or B-site substitutions in SrFeO3−δ for TGA Screening 1 with temperatures between 573 and 1373 K under 20% O2/Ar and 100% Ar.
Table 3.
Relative mass change and deviation from stoichiometry change for A- and/or B-site substitutions in SrFeO3−δ for TGA Screening 1 with temperatures between 573 and 1373 K under 20% O2/Ar and 100% Ar.
| Sample | Δm/minitial × 100% | Δδ | Sample | Δm/minitial × 100% | Δδ | ||||
|---|---|---|---|---|---|---|---|---|---|
| 20% O2/Ar | 100% Ar | 20% O2/Ar | 100% Ar | 20% O2/Ar | 100% Ar | 20% O2/Ar | 100% Ar | ||
| SrFeO3-δ | −2.34 | −2.71 | 0.28 | 0.32 | - | - | - | - | - |
| BSF190 | −2.90 | −3.25 | 0.36 | 0.40 | BSF280 | −2.32 | −2.57 | 0.29 | 0.32 |
| BSCF1919 | −2.59 | −3.00 | 0.32 | 0.37 | BSCF2828 | −2.33 | −2.84 | 0.29 | 0.36 |
| LSF190 | −2.71 | −3.16 | 0.33 | 0.39 | LSF280 | −2.55 | −2.96 | 0.32 | 0.37 |
| LSCF1919 | −2.91 | −3.37 | 0.36 | 0.42 | LSCF2828 | −2.72 | −3.31 | 0.34 | 0.42 |
| CaSF190 | −2.50 | −2.87 | 0.29 | 0.34 | CaSF280 | −2.53 | −2.88 | 0.29 | 0.33 |
| CaSCF1919 | −2.66 | −3.14 | 0.31 | 0.37 | CaSCF2828 | −2.31 | −2.94 | 0.26 | 0.34 |
| SCF019 | −2.21 | −2.58 | 0.27 | 0.31 | SCF028 | −2.13 | −2.64 | 0.26 | 0.32 |
Table 4.
Relative mass change and mean and standard deviation of deviation from stoichiometry change for A- and B-site substitutions in SrFeO3−δ for TGA Screening 3 during the temperature- and O2 pressure-swings.
Table 4.
Relative mass change and mean and standard deviation of deviation from stoichiometry change for A- and B-site substitutions in SrFeO3−δ for TGA Screening 3 during the temperature- and O2 pressure-swings.
| Sample | Temperature-Swing | O2 Pressure-Swing | ||||
|---|---|---|---|---|---|---|
| Δm/minitial × 100% | σΔδ | Δm/minitial × 100% | σΔδ | |||
| SrFeO3−δ | −2.60 | 0.31 | 0.0015 | −1.16 | 0.14 | 0.0006 |
| BSF190 | −2.75 | 0.34 | 0.0035 | −1.00 | 0.12 | 0.0039 |
| BSCF1919 | −2.62 | 0.33 | 0.0041 | −0.90 | 0.11 | 0.0033 |
| LSF190 | −2.74 | 0.34 | 0.0049 | −1.09 | 0.13 | 0.0042 |
| LSCF1919 | −2.89 | 0.37 | 0.0034 | −1.03 | 0.13 | 0.0045 |
Publisher’s Note: MDPI stays neutral with regard to jurisdictional claims in published maps and institutional affiliations. |
© 2020 by the authors. Licensee MDPI, Basel, Switzerland. This article is an open access article distributed under the terms and conditions of the Creative Commons Attribution (CC BY) license (http://creativecommons.org/licenses/by/4.0/).
Share and Cite
MDPI and ACS Style
Farr, T.P.; Nguyen, N.P.; Bush, H.E.; Ambrosini, A.; Loutzenhiser, P.G. An A- and B-Site Substitutional Study of SrFeO3−δ Perovskites for Solar Thermochemical Air Separation. Materials 2020, 13, 5123. https://doi.org/10.3390/ma13225123
AMA Style
Farr TP, Nguyen NP, Bush HE, Ambrosini A, Loutzenhiser PG. An A- and B-Site Substitutional Study of SrFeO3−δ Perovskites for Solar Thermochemical Air Separation. Materials. 2020; 13(22):5123. https://doi.org/10.3390/ma13225123
Chicago/Turabian StyleFarr, Tyler P., Nhu Pailes Nguyen, H. Evan Bush, Andrea Ambrosini, and Peter G. Loutzenhiser. 2020. "An A- and B-Site Substitutional Study of SrFeO3−δ Perovskites for Solar Thermochemical Air Separation" Materials 13, no. 22: 5123. https://doi.org/10.3390/ma13225123
Note that from the first issue of 2016, this journal uses article numbers instead of page numbers. See further details here.