On The Application of SiO2/SiC Grating on Ag for High-Performance Fiber Optic Plasmonic Sensing of Cortisol Concentration


1
Physics Division, Department of Applied Sciences, National Institute of Technology Delhi, Narela, Delhi 110040, India
2
I3N & Physics Department, University of Aveiro, 3810-193 Aveiro, Portugal
*
Author to whom correspondence should be addressed.
Materials 2020, 13(7), 1623; https://doi.org/10.3390/ma13071623
Submission received: 26 February 2020
/
Revised: 29 March 2020
/
Accepted: 30 March 2020
/
Published: 1 April 2020
(This article belongs to the Special Issue Flexible Sensors and Actuators for Novel Wearable Solutions)
Abstract
:This paper reports on high-accuracy simulation of a grating structure based fiber optic plasmonic sensor for salivary cortisol sensing. Gratings of SiO2 and SiC (one at a time) in combination with a thin Ag layer are considered to be in direct contact with analyte medium (solutions containing different concentrations of cortisol) considering that the groove regions are also filled with analyte. The optimization of Ag layer thickness is carried out to achieve maximum power loss (PL) corresponding to cortisol concentration variation. The variation of PL (in dB) spectra with the angle of incidence (α) is the sensing mechanism of the proposed scheme. Sensing performance is extensively analyzed in terms of sensitivity, limit-of-detection (LOD) and figure-of-merit (FOM) that incorporates both the sensitivity and the width of the corresponding PL curves. While the sensitivity and FOM values are significantly large, the results also reveal that in angular interrogation mode (AIM), an average LOD of 9.9 pg/mL and 9.8 pg/mL is obtained for SiO2 and SiC-based sensor designs, respectively. When the intensity interrogation method (IIM) in place of AIM is considered, an average LOD of 22.6 fg/mL and 68.17 fg/mL is obtained for SiO2 and SiC-based sensor designs, respectively. LOD (with IIM, in particular) is considerably better than the present-state-of-art related to cortisol monitoring. Pragmatic model for possible practical implementation of sensor scheme is also discussed. The involvement of optical fiber in the proposed sensor design makes it possible to implement it as a flexible sensor or for wearable solution for cortisol detection via sweat monitoring as well as for measuring cortisol level in aquaculture tanks where concentration levels are much lower than 10 ng/mL.
1. Introduction
The human immune system is prone to be altered by allostatic stress. This stress level can be identified by the important biomarkers such as, cortisol, norepinephrine (NE), serotonin, neuropeptide Y and epinephrine associated with stress [1]. Hyperglycemia, depression, neurological breakdown and cardiothoracic diseases are the harmful effects of prolonged allostatic stress [2]. Thus, the monitoring and detection of these biomarkers are of the utmost importance for the assessment of stress. The presence of these biomarkers can be identified in different body fluids [1], which plays an important role in evaluation of one’s physical conditions and mental ability. Cortisol being a stress biomarker is a steroid hormone required for several metabolic activities such as cardiovascular functions, blood pressure regulation, etc. [3].
It has been found for a human body that, the cortisol level in saliva varies from 20.7 ± 8.7 (or 7.5037 ± 3.153 ng/mL; highest during morning) to 5.6 ± 1.5 nmol/lt (2.03 ± 0.543 ng/mL lowest before bedtime) as measured by the radioimmunoassay method [4]. The cortisol level in serum varies from 166.605 ± 85.26 (in the morning) to 123.43 ± 75.21 ng/mL (in the afternoon) [5]. Moreover, insufficient cortisol level in the body is the cause of Addison’s disease [6], which results in fatigue, weight loss and skin scars. However, an increase in the cortisol level leads towards Cushing’s syndrome with symptoms such as obesity, bone and skin fragility resulting in cardiovascular disease and cognitive difficulties [7]. It has been reported that, psychological and physical stresses are responsible for variation in the level of cortisol [2], which makes it a prominent stress biomarker. Monitoring the cortisol level in biofluids (sweat, plasma, urine and saliva) can be beneficial for both prognosis and diagnosis of physiological states. The quantification of cortisol is based on arduous separation methods such as, electrochemical immunosensing, or immunoassay in case of conventional laboratory detection techniques [8]. Although, these techniques provide sensitive detection of biosamples, however, several drawbacks are associated with them such as, large sample volume (0.2–2 mL), extensive analyze time, the requirement of skilled personnel and specialized instruments. These often result in high cost and test complexity and avert their applicability for a rapid diagnostic. In addition to conventional detection methods, the detection of cortisol level has also been reported using impedimetric biosensor, surface plasmon resonance (SPR) sensor, electrochemical sensor and chemiresistor [9,10,11,12].
Among several other optical techniques, SPR has witnessed widespread sensing applications [13,14,15]. It measures the refractive index (RI) change occurring due to molecular interactions. The immobilization of specific receptor biomolecules can be opted for the detection of specific analytes in a solution. In context of SPR based cortisol sensors, Stevens et al. reported cortisol detection in human saliva with a detection limit of 0.36 ng/mL [11]. The human saliva holds approximately 90% of free cortisol making it the most opted sample for cortisol detection [12]. Further, SPR based immunosensor was developed for cortisol detection in human saliva and urine with a detection limit of 10 ng/mL [14]. An automatic miniaturized platform for cortisol detection was reported by Zhang et al. [16]. Recently, Jung et al. reported Au nanoparticles (NPs) based localized surface plasmon resonance (LSPR) sensor for detection of cortisol conjugated NPs [15]. Denaturalized bovine serum albumin (dBSA)-SPR-chip with a linear detection limit range of 5–100 ng/mL was reported by Chen et al. [13]. The SPR absorption peak was detected using the prism coupling method (i.e., Kretschmann structure). Thus, most of the SPR based sensing techniques utilize prism configuration due to the ease of fabrication leading to a bulky experimental setup [14,17].
However, the fiber optic (FO) based SPR sensors have gained popularity due to its lightweight sensing configuration [18,19]. Recently, a lossy mode resonance (LMR) based fiber sensor with the ZnO nanocomposite for salivary cortisol detection was reported by Usha et al. [20] with a detection limit of 25.9 fg/mL but fiber SPR sensor for cortisol detection still has a lot of scope of work. Owing to high sensitivity and performance tunability, exploring the plasmonic gratings (either pure metallic or thin metal layer with dielectric grating) for fiber optic detection of cortisol can also be a significant step in this direction. Plasmonic sensors with SiO2 gratings [21], TiO2 gratings [22] and two dimensional HfO2 grating [23] have been reported recently for precise refractive index sensing. Further, Korposh et al. demonstrated optical switching utilizing FO long period grating [24]. Recently, Zhao and Wang summarized the recent advancements in the application of long period fiber grating in chemical and biological sensors [25]. However, a dielectric grating integrated fiber optic sensor needs to be explored.
The present work is focused on the detection of salivary cortisol using a plasmonic grating based fiber optic SPR (FOSPR) sensor using the angular interrogation mode. The analysis is performed based on power loss (PL) spectra aiming at the enhancement of overall sensing performance, i.e., figure-of-merit (FOM). The variation of PL (in dB) spectra with the angle of incidence (α) is the sensing mechanism of the proposed scheme. In addition, the analysis of sensor’s performance in terms of the limit-of-detection (LOD) is also presented based on angular interrogation and intensity interrogation methods.
2. Sensor Configuration and Theoretical Insights
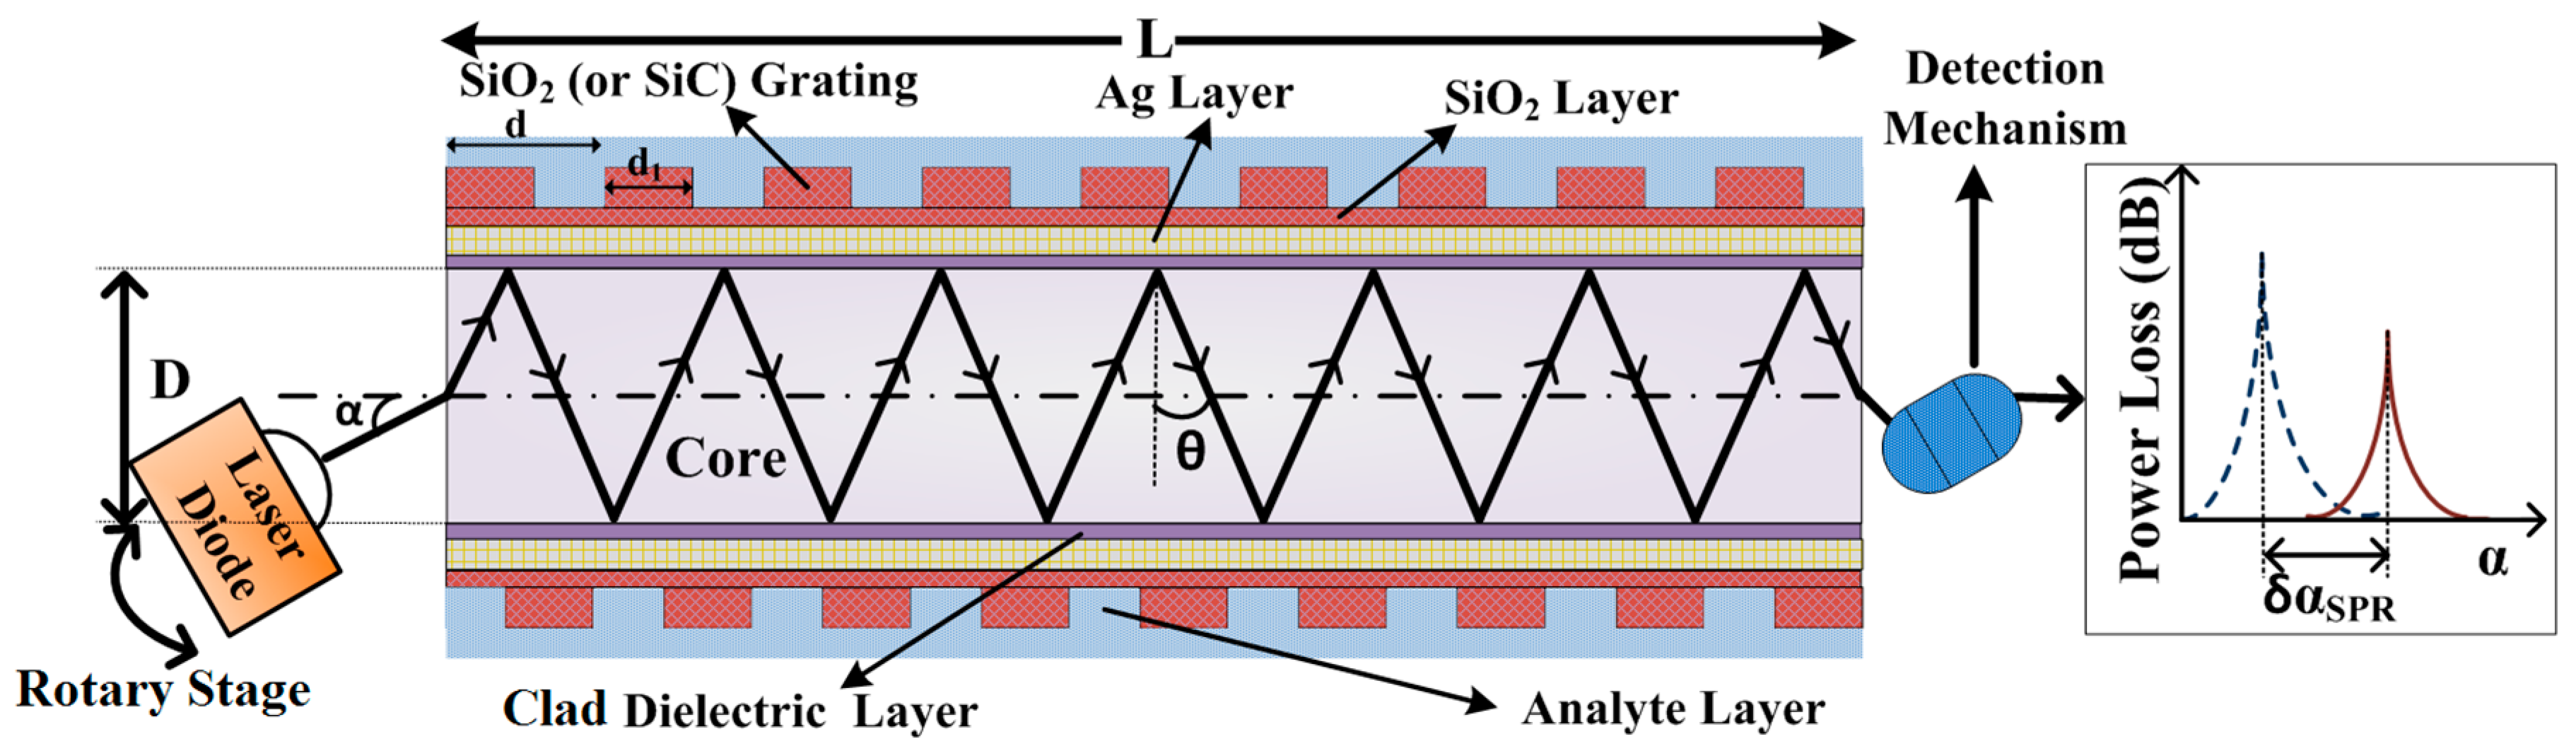
A six-layer probe consisting of (i) fiber core, (ii) clad, (iii) silver (Ag) layer, (iv) SiO2 layer, (v) grating structure (SiO2 or SiC), and (vi) analyte was envisaged (as depicted in Figure 1). Samarium doped chalcogenide (Se95Te5Sm0.25) fiber (core diameter D = 400 µm, and length L = 0.01 m) was considered as the core material. The core material was chosen in view of larger RI than that of frequently used doped SiO2 core. In addition, high transparency of Se95Te5Sm0.25 fiber core will be beneficial for its application in near and mid infrared regions. The clad dielectric material was selected so that a sufficiently large value of incident angle (α) range and numerical aperture (NA) values can be achieved. The maximum acceptable value of α is , where and are the RIs of core and clad region, respectively. Thus, a perfluorinated (PF) homopolymer was chosen to be the clad layer (5 nm). The Ag metal layer was deposited over PF. The Ag layer offers the advantages of tunable biocompatibility and narrower SPR curve compared to its counterparts such as Au. On top of the Ag layer, a layer of SiO2 (with thickness, ts = 5 nm) was deposited. The SiO2 (or SiC) grating structure (thickness tg) was considered as the analyte interacting layer considering its grooves to be filled with analyte. SiO2 or SiC grating materials were used because they had low RI and provided ease of fabrication (CMOS compatibility) [26]. They were stable when exposed to external environment (here, analyte). The salivary cortisol solution (cortisol-conjugated BSA) with different concentration was considered as analyte and the modalities were adapted from Stevens et al. [11]. From an experimental realization viewpoint, it is important to mention that human saliva was collected by cautiously placing Salivette® into rinsed mouth for 10 minutes (as reported in [10]). For later use, the pooled samples should be frozen in 1 mL aliquots [11]. Commonly, Spreetatm 2000 system was used for the detection of cortisol. The system consists of a light source of wavelength 830 nm [11]. The experimental RI of cortisol solution (cortisol-conjugated BSA) with different concentration and operating wavelength (λ) of the well-established system were the motivation behind choosing λ = 830 nm in the present work. Table 1 indicates the RI values of constituent layers at λ = 830 nm. Several laser sources are commercially available at 830 nm [27]. An AlGaAs laser diode operating at 830 nm (100 mW power output) would be a preferable choice for optical sensing application [28]. A temperature control unit is required for the experimental set up (laser diode operating temperature: −10 to +60 °C). The typical value of threshold current was 70–80 mA with operating voltage of 2.2–2.8 V for the suggested laser diode. The power loss curves can be visualized on the connected computer system with SPR graphical toolkit (angular interrogation mode).
The normalized reflection coefficient (R) was calculated based on the transfer matrix method (TMM) with consideration of transverse magnetic (TM) incident light [34]. The calculation of parameters was carried out using MATLAB®. The variation of PL (in dB) spectra with the angle of incidence (α) is the sensing mechanism of the proposed scheme. In the present study, a monochromatic light source with λ = 830 nm was considered to be launched at different angles (angular interrogation). The resonance condition can be identified at the angular position (at α = αspr) where maximum PL (PLmax) is achieved. The change in analyte RI will cause a shift in position of PLmax. The power loss (PL) can be calculated as:
Here, and are the normalized reference power (here, unity magnitude) and the modulated normalized output power, respectively. can be calculated as follows:
Here, represents the number of reflections. The light ray propagates at an angle θ inside the fiber core.
The volume average dielectric constant (εg) of layer consisting of SiO2 grating (or SiC) and grooves filled with analyte is given as follows [35]:
Here, and are the dielectric constant values of analyte and grating, respectively. Initially, the ratio of (fill factor) is taken as 0.5. Here, fill factor is meant for grating layer, which indicates the ratio of grating width (d1) to the grating periodicity (d).
The overall performance of the proposed FOSPR sensor was monitored by considering both the terms, i.e., change in resonance angle () on small change in analyte (here, cortisol) concentration () as well as full width at half maximum (FWHM), i.e., angular PL spectrum width. The overall performance evaluation under angular interrogation method (AIM) can be carried out in terms of figure of merit (FOM) as follows:
The term () is considered as the sensitivity (SA) while 1/FWHM is considered as the detection accuracy of the sensor system. Moreover, the limit of detection (LOD), which indicates the smallest cortisol concentration (Cc) that can be measured under AIM, is defined as:
Here, the change in corresponding to a small change in is taken into consideration and 0.001° is the smallest angular shift that can be detected [36]. Under the intensity interrogation method (IIM), i.e., when the variation in PLmax (in dB) is mapped with the change in analyte RI, the LOD can be defined as:
Here, is the change in PLmax and 0.001 (in dB) is the smallest optical power (i.e., resolution) that can be detected by power meter available commercially [37]. The sensitivity (SI) under IIM can be defined as .
3. Results and Discussion
3.1. Sensor Probe with i) SiO2 and ii) SiC Gratings
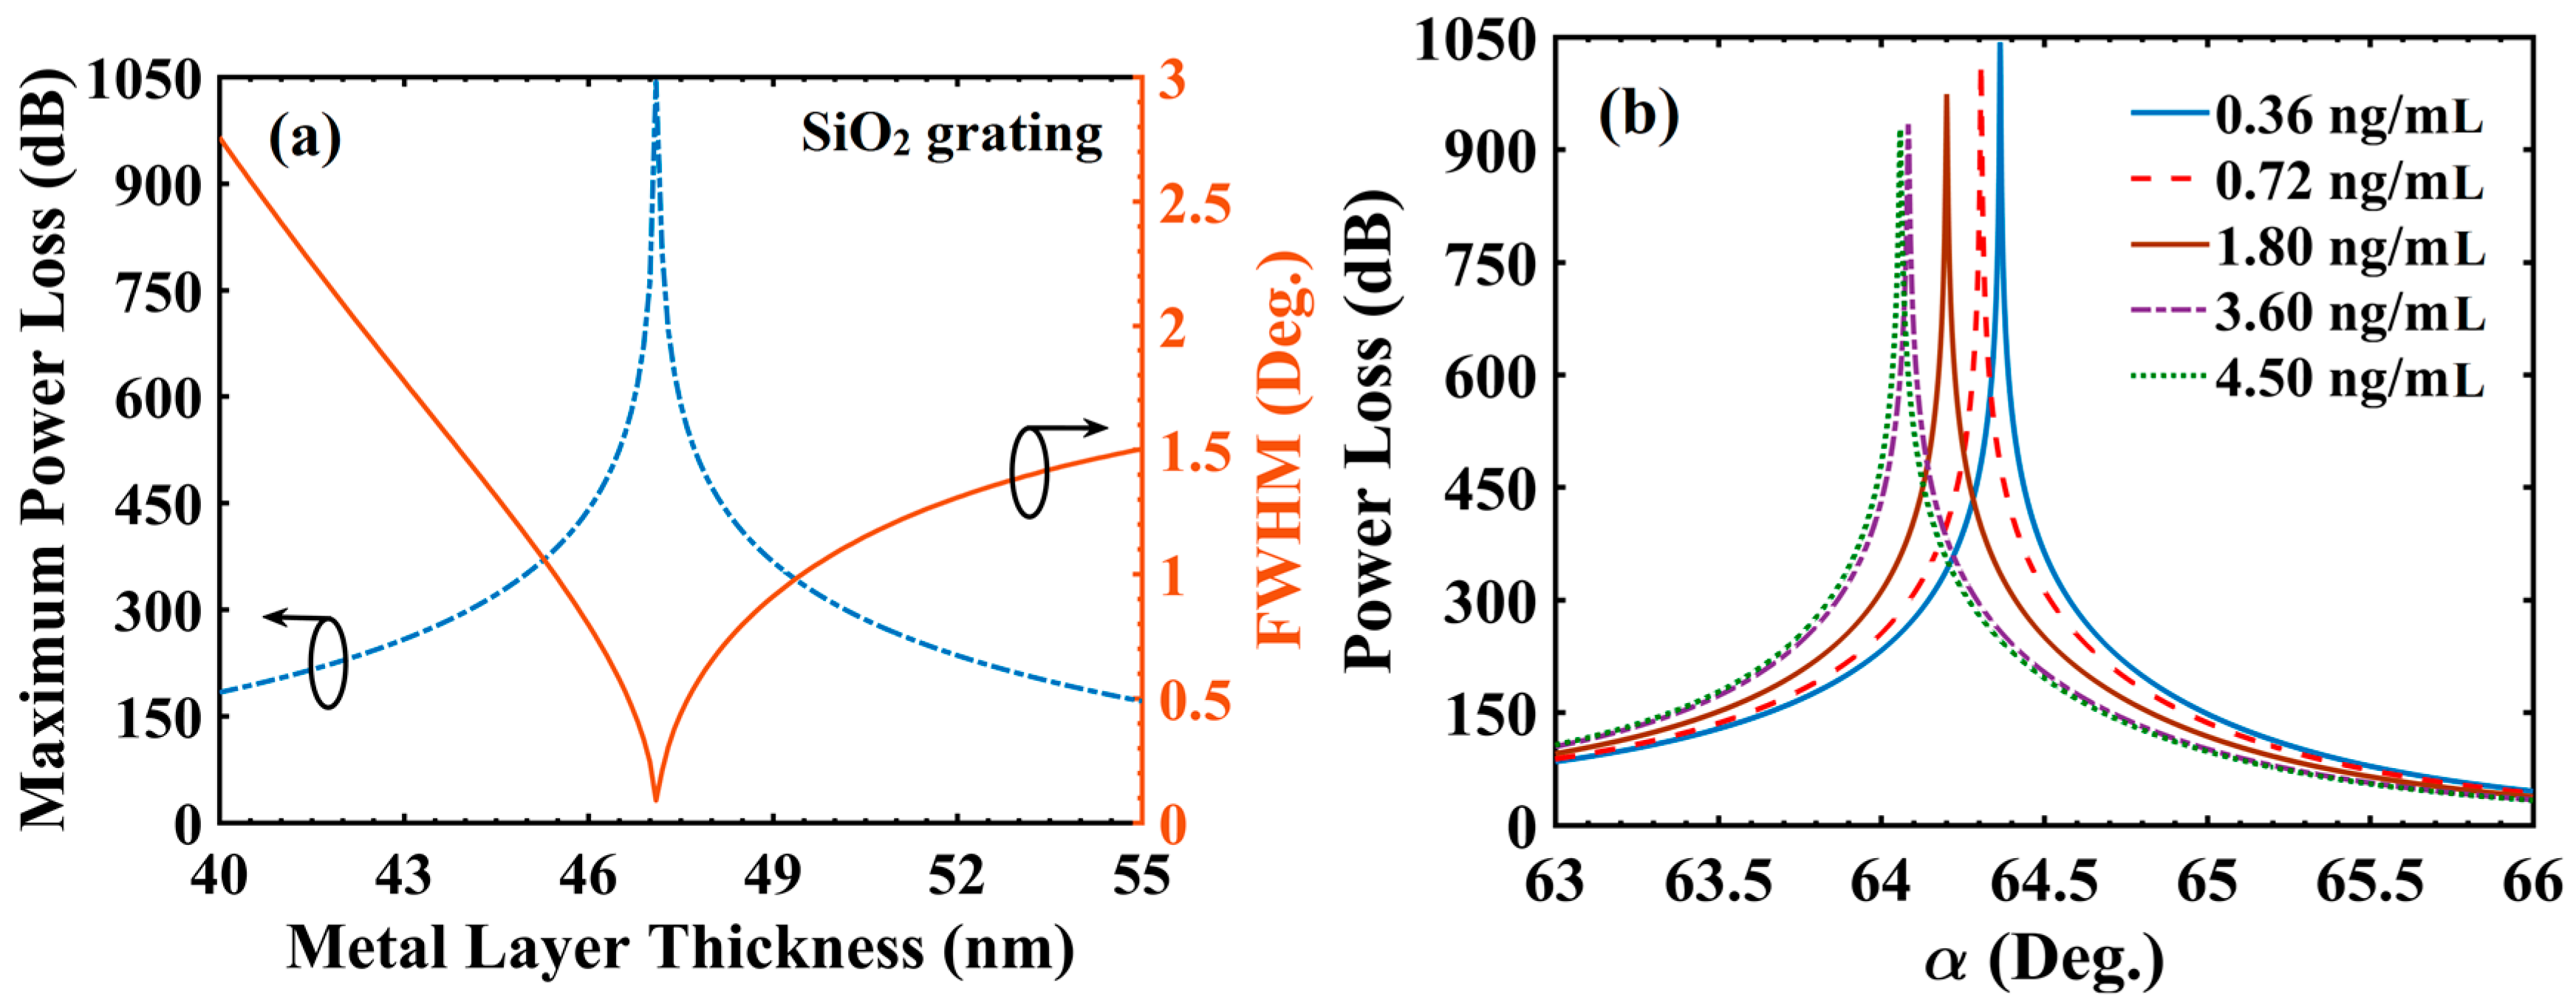
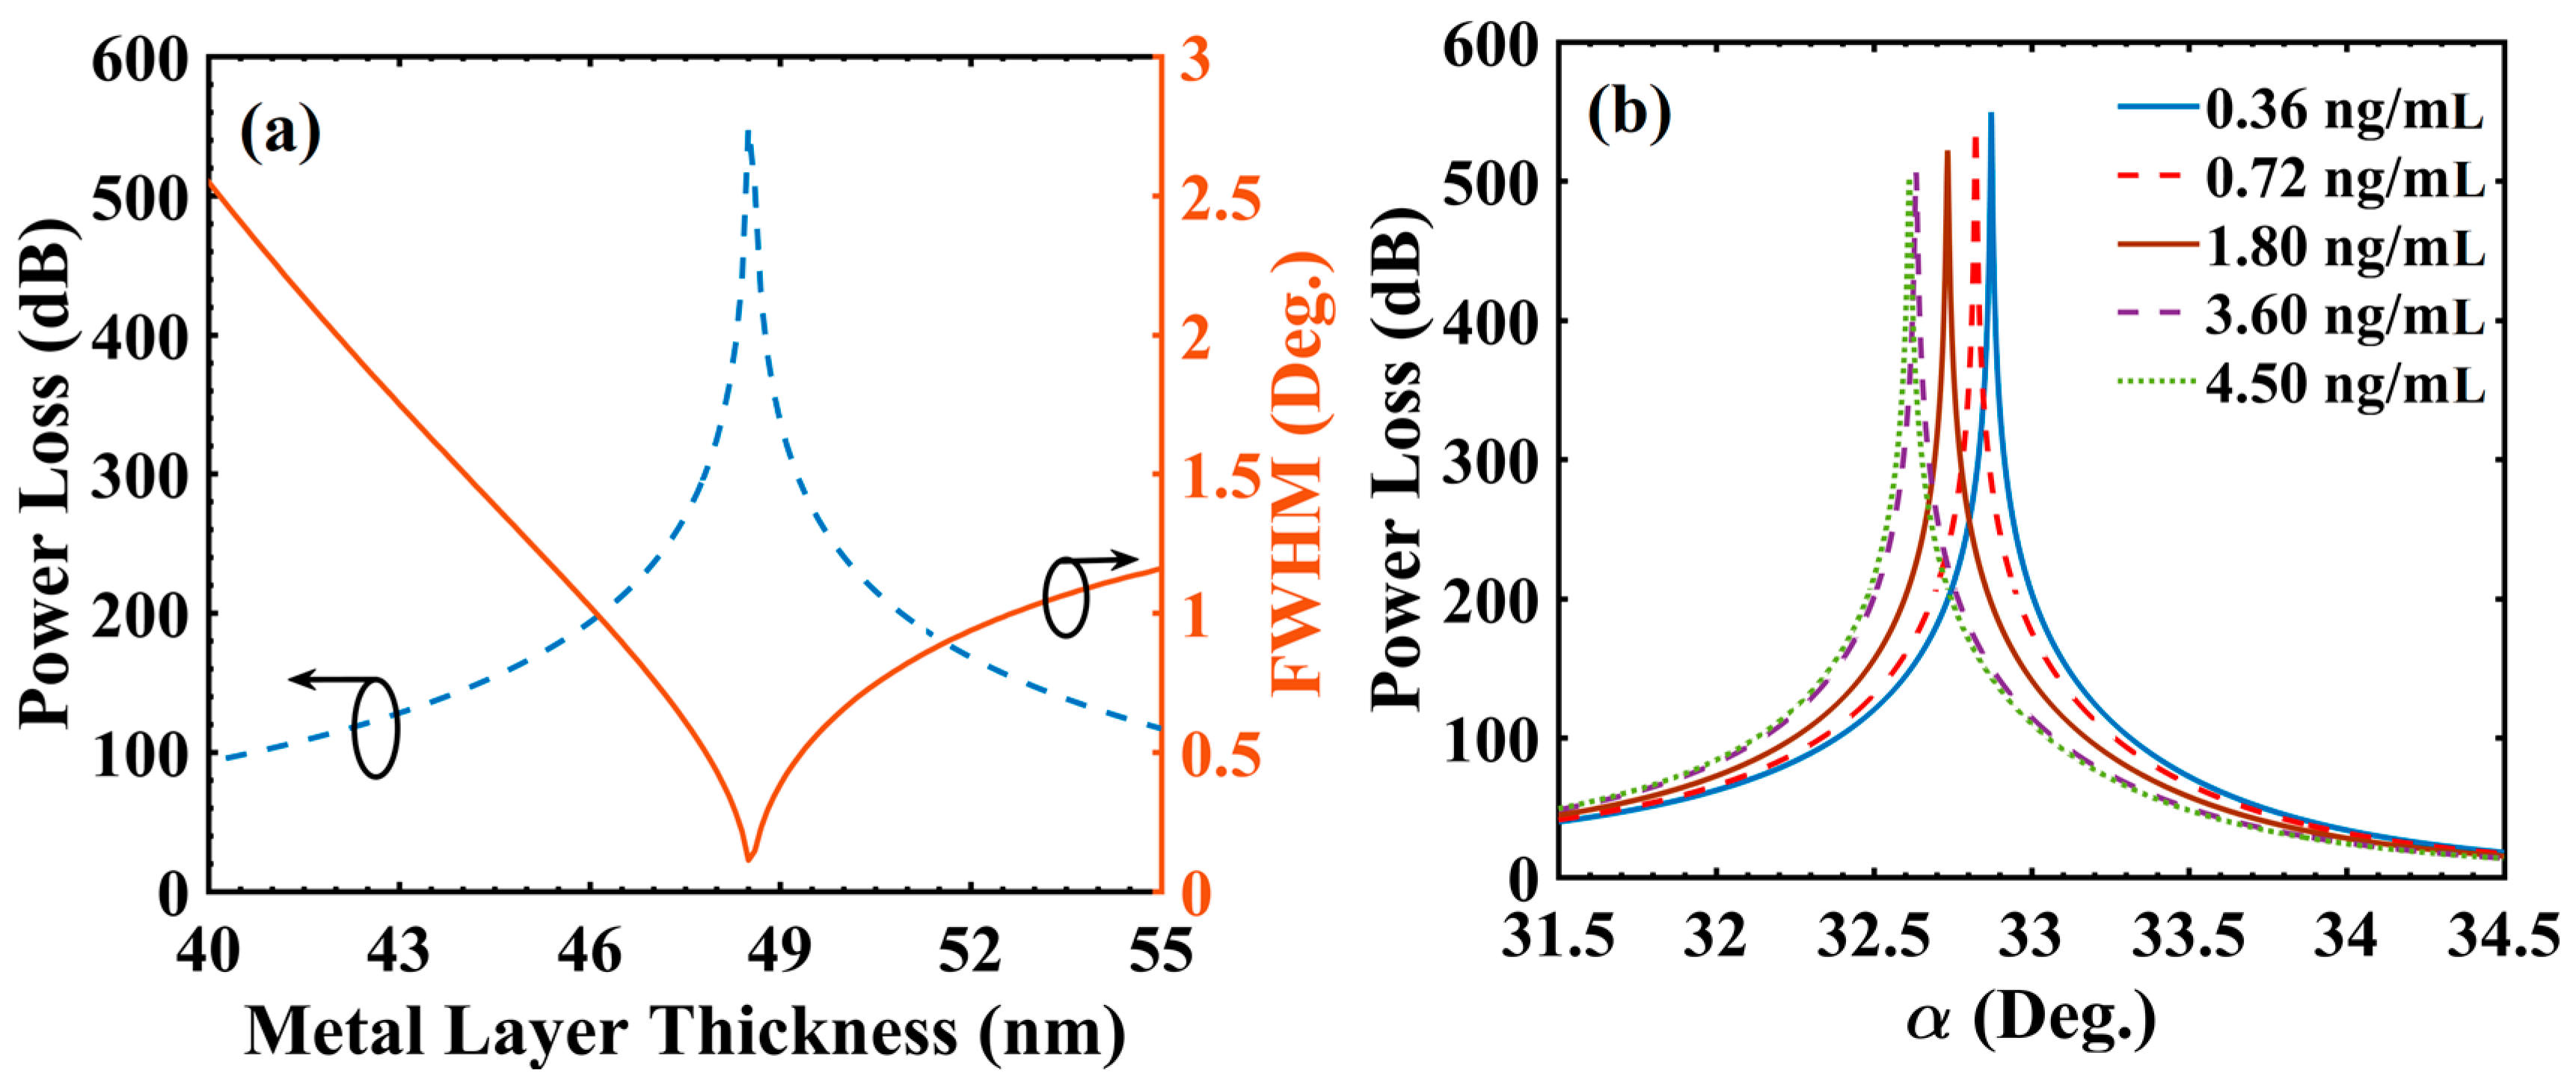
As clear from Equation (4), the FWHM value should be as small as possible for high sensing performance in terms of the detection accuracy and FOM. Arguably, the FWHM of SPR spectrum depends on the value of tAg at a given λ due to dynamic nature of radiation damping in plasmonic structures [38], therefore, it is necessary to optimize tAg leading to minimum possible FWHM at λ = 830 nm. Considering Cc = 0.36 ng/mL as a reference sample, tAg is optimized keeping other layer values fixed (ts = 5 nm, tg= 20 nm and d1/d = 0.5). The variation of PLmax and FWHM with tAg is shown in Figure 2a. The PLmax value was obtained as 1043.264 dB with a narrow FWHM value of 0.088° at optimized tAg = 47.10 nm, which indicate towards the occurrence of optimum radiation damping (ORD) condition in the concerned plasmonic structure. The large values of PL indicate very small output power, which is due to extremely large magnitude of light absorption. Large PL values were particularly useful in achieving ultrafine LOD under ‘IIM’ (as is clear from Equation (6)).
At this moment, it may be investigated to estimate the effect of variation in d1/d (which is a grating parameter) on the optimum value of tAg (at λ = 830 nm), FWHM and PLmax. The corresponding simulation on the above lines indicate that while optimized tAg remained at 47.1 nm, the (FWHM, PLmax) became (0.079°, 1075.37 dB) for d1/d = 0.4 and (0.146°, 897.22 dB) for d1/d = 0.6. The above values suggest that relatively smaller values of d1/d (i.e., 0.4–0.5) should be preferred in view of smaller FWHM, same optimized tAg and larger PLmax as discussed above. So, by opting a pragmatic value of d1/d = 0.5 (and tAg = 47.1 nm), Figure 2b shows the PL spectra for different Cc values. It is evident that value varied significantly on changing the value of Cc (64.365° for 0.36 ng/mL to 64.059° for 4.50 ng/mL). The shifting of towards a lower value was governed by the volume dielectric constant (Equation (3)) of the grating layer. On increasing Cc, the value decreased, this was the cause of shifting. Furthermore, the PLmax value decreased from 1043.264 dB (for Cc = 0.36 ng/mL) to 926.878 dB (for Cc = 4.50 ng/mL), which was a significant variation that could be utilized for tuning the sensor’s performance in terms of LOD under IIM (as per Equation (6)).
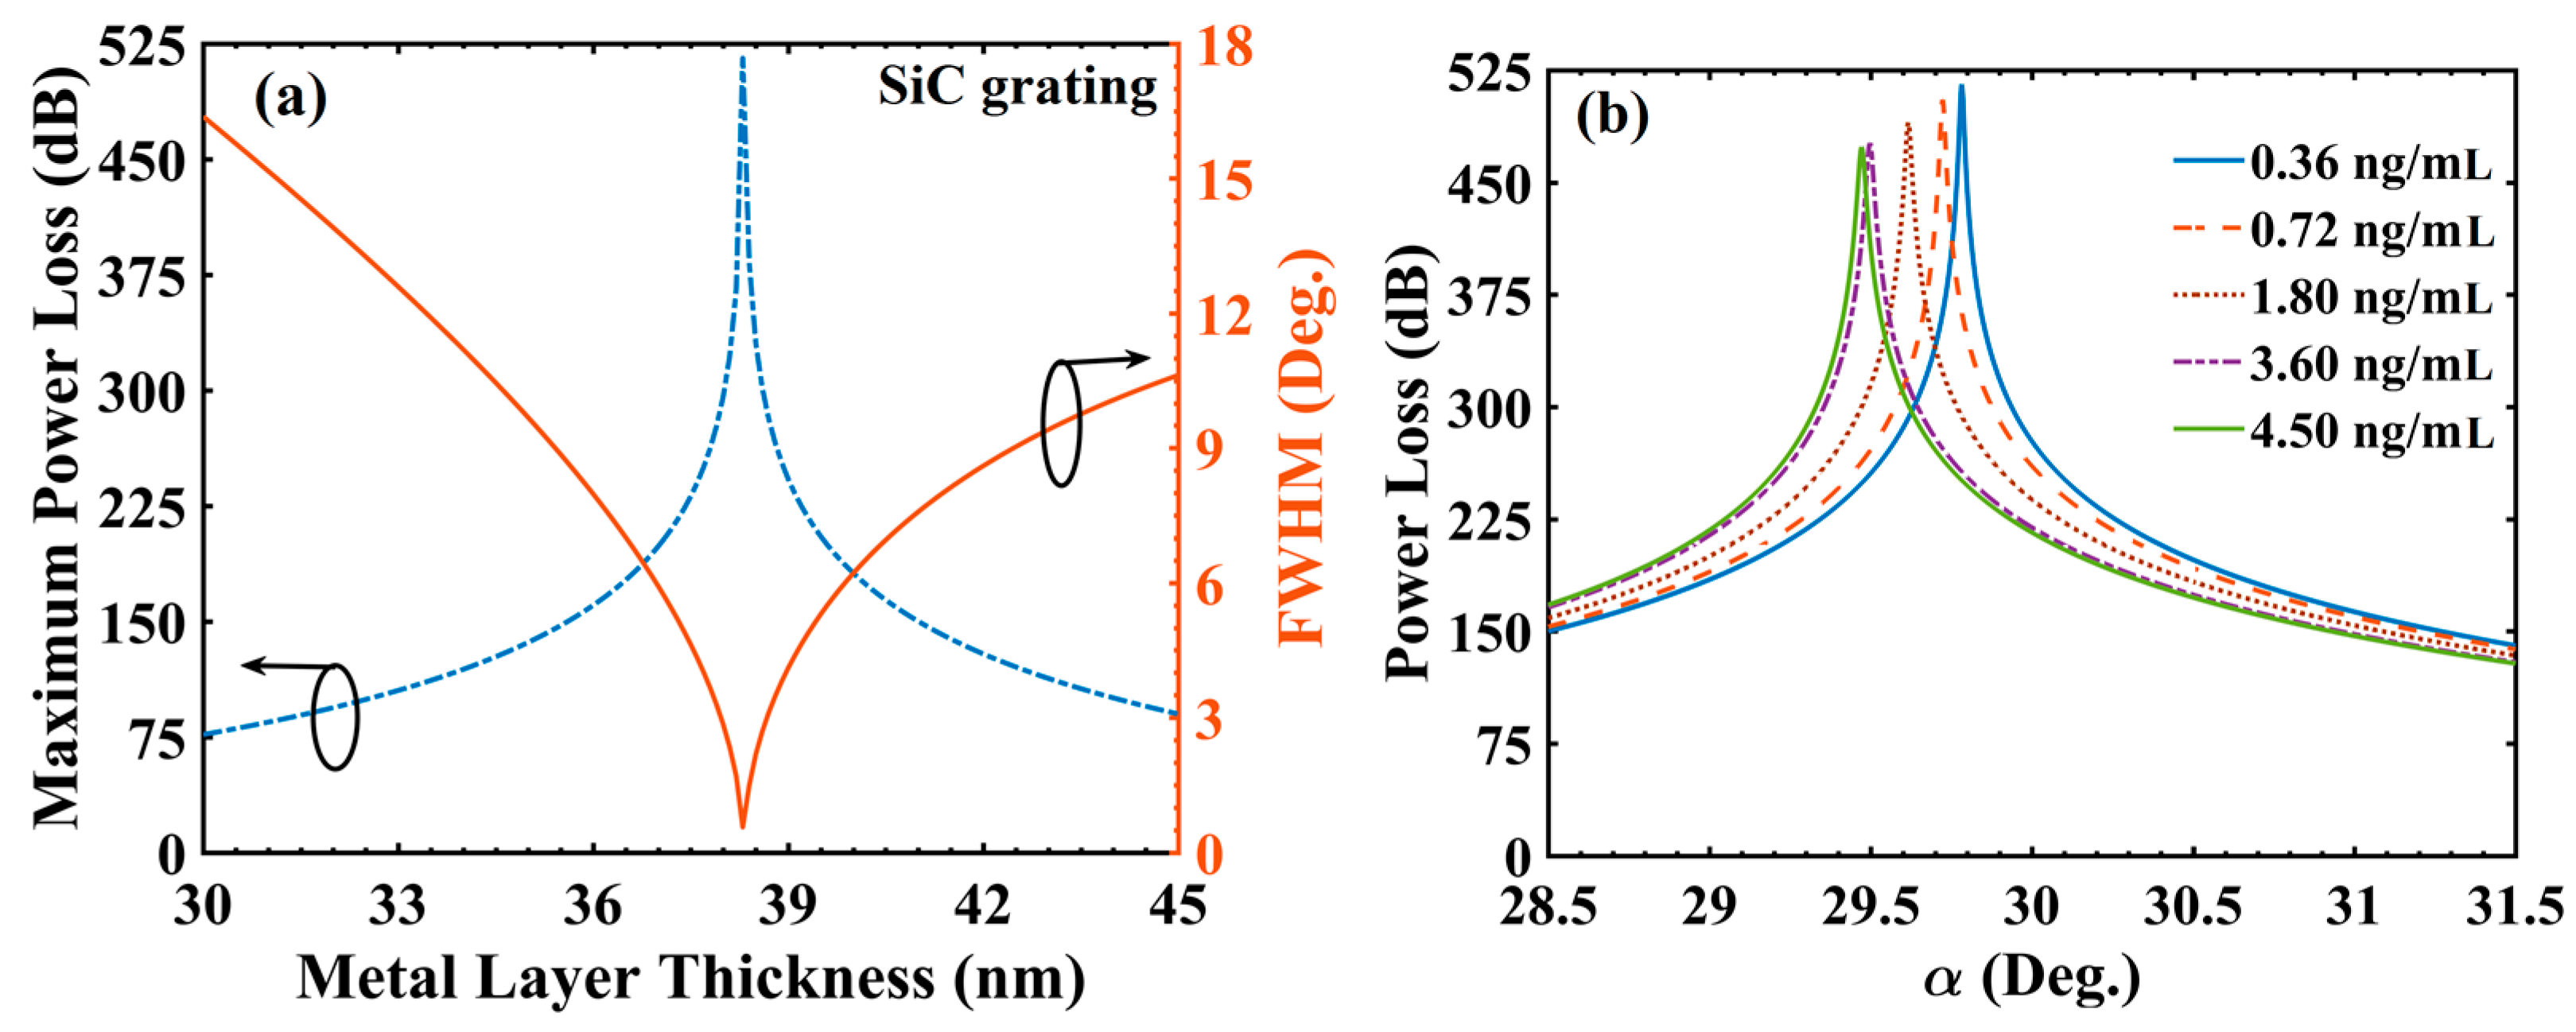
As a next step, the sensing performance analysis was carried out for SiC grating over SiO2 (ts = 5 nm) based configuration. SiC grating thickness (tg) of 29 nm was considered in view of available thin film RI value at 830 nm [33]. Furthermore, the optimization of tAg was carried out considering Cc = 0.36 ng/mL as a reference sample keeping other layer values fixed (ts = 5 nm; tg = 29 nm and d1/d = 0.5). The variation of PLmax and FWHM with tAg is shown in Figure 3a. For d1/d = 0.5, a minimum value of FWHM (0.561°) and the corresponding PLmax value of 515.65 dB (both represented by a sharp dip) were obtained at tAg = 38.3 nm. Clearly, the values of FWHM and PLmax achieved with SiO2 grating based sensor design were superior compared with those corresponding to SiC grating based design (at their corresponding optimized tAg values, of course). Further, at d1/d = 0.5 and tAg = 38.3 nm, Figure 3b shows the PL spectra for different Cc values. Similar to the previous result (Figure 2b), varied from 29.782° for Cc = 0.36 ng/mL to 29.472° for Cc = 4.50 ng/mL. Similarity to Figure 2b was also observed in the effect that PLmax value decreased from 515.65 (for Cc = 0.36 ng/mL) to 473.73 dB (for Cc = 4.50 ng/mL). Table 2 summarizes and compares the above simulation results for SiO2 and SiC grating based sensor designs at their corresponding optimized tAg values.
3.2. Performance in i) Angular and ii) Intensity Interrogation Modes (AIM and IIM)
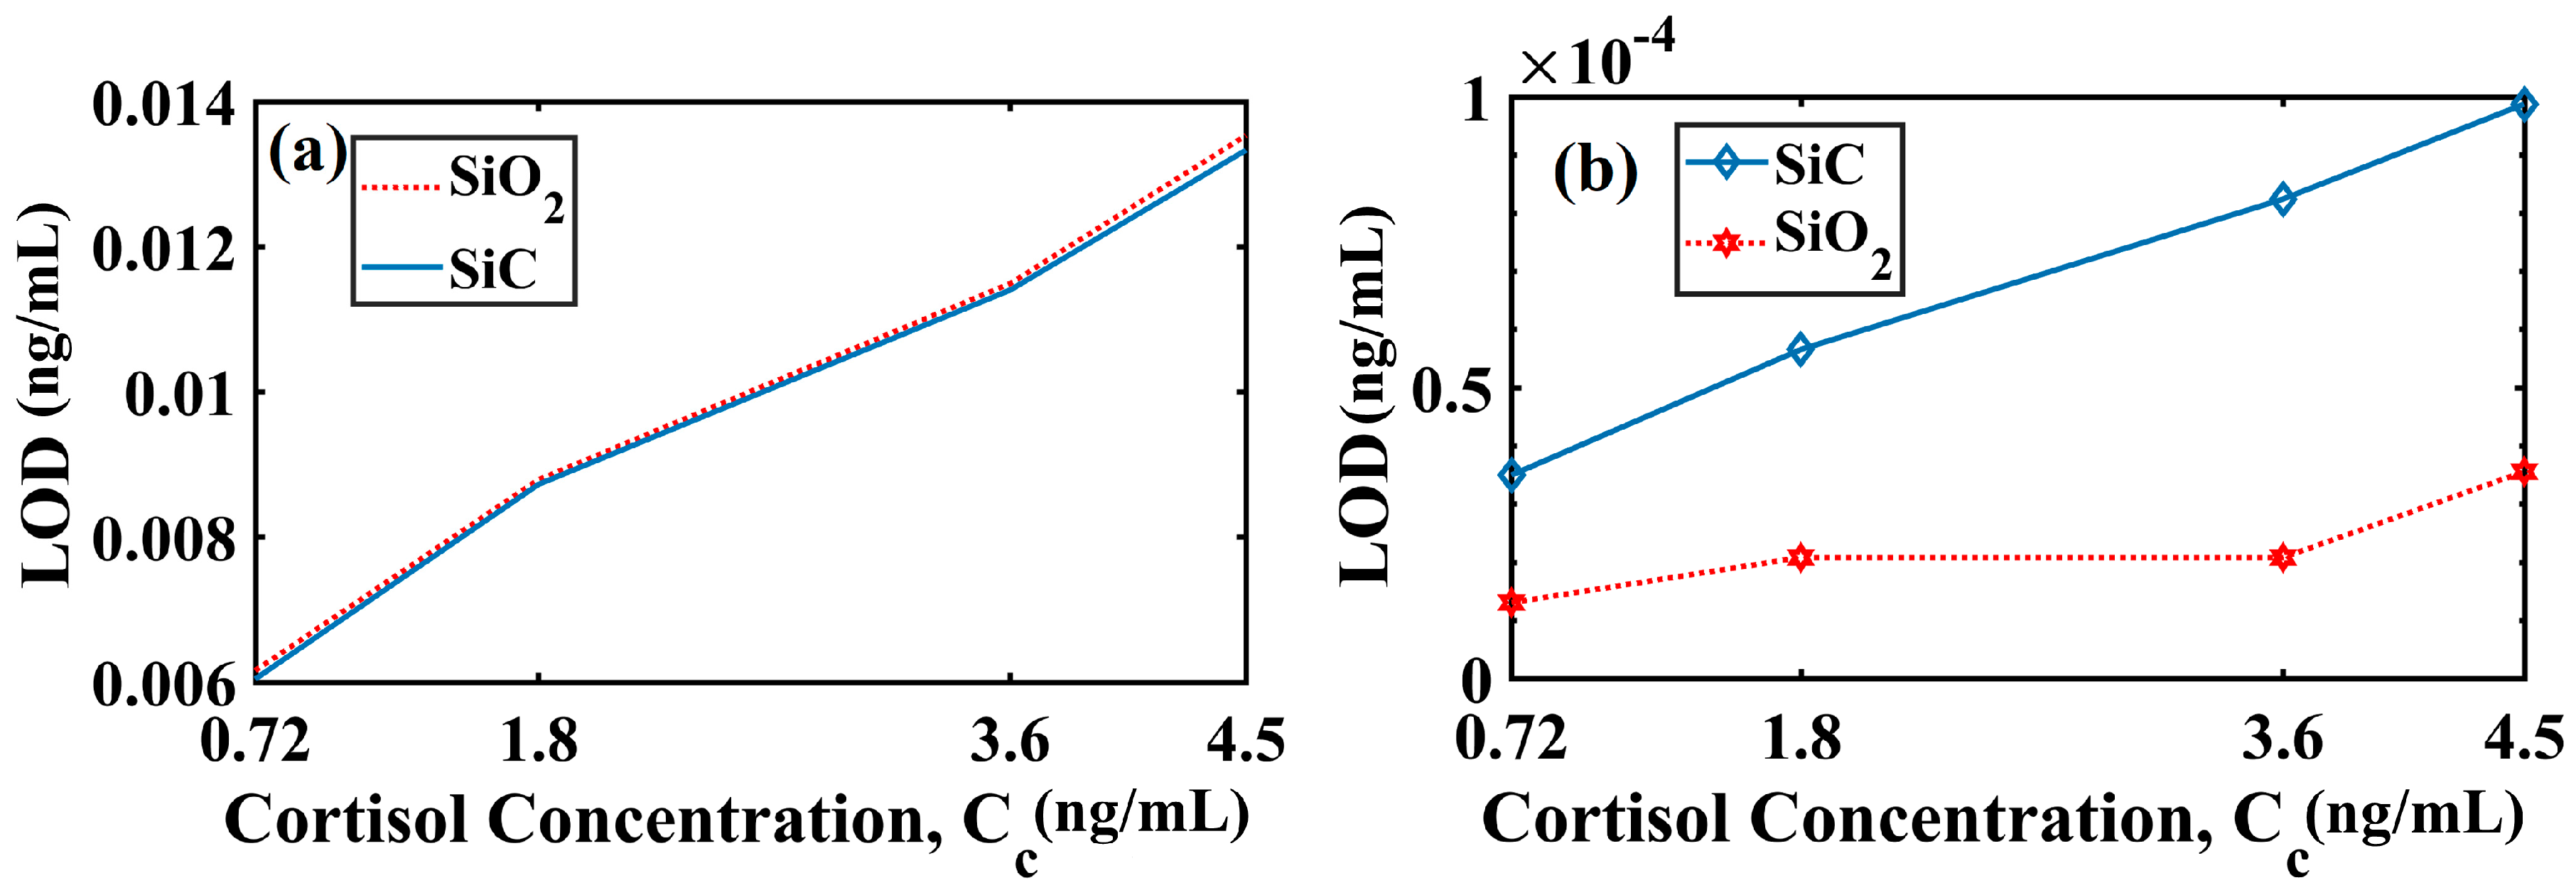
Following the fixation of a pragmatic value of d1/d and optimization of tAg, it is necessary to focus on closely analyzing the sensing performance vis-à-vis cortisol detection. At this moment, we recall that there are two possible methods, namely, AIM and IIM. In AIM, we could determine the LOD as well as FOM (as per Equations (4) and (5)) while in IIM, the LOD and sensitivity (SI) could be chosen as performance evaluation criteria. The variation of LOD with cortisol concentration was shown in Figure 4a under AIM (Equation (5)) assuming that the smallest angular shift that can be detected was 0.001° [36].
Here, it was evident that no significant difference was observed in the LOD values for SiO2 and SiC grating based sensor configurations under AIM. For instance, when Cc = 0.72 ng/mL (the reference sample = 0.36 ng/mL), the LOD values were 0.006161 ng/mL and 0.006046 ng/mL for SiO2 and SiC grating based sensors, respectively. Further, the LOD value deteriorated (i.e., got larger in magnitude) with an increase in the Cc value. For instance, at Cc = 4.50 ng/mL, the LOD values were 0.0135 ng/mL and 0.0133 ng/mL for SiO2 and SiC grating based sensors, respectively.
Further, Figure 4b shows the variation of LOD with Cc for both the cases (SiO2 grating and SiC grating) under IIM (Equation (6)). It is visible for Figure 4b that the SiO2 grating based sensor configuration was able to provide a significantly smaller LOD values than that of the SiC grating based sensor configuration. The aforementioned variation in LOD (IIM) for SiO2- and SiC-based sensor designs was possibly due to complex RI (3.3067 + 0.14839i) of SiC (i.e., a non-zero absorption term) while the RI of SiO2 was only real (i.e., a non-existent absorption term). More precisely, considering 0.36 ng/mL as the reference sample and CC = 0.72 ng/mL, the calculated LOD values were 1.306 10−5 ng/mL and 3.495 10−5 ng/mL for SiO2 and SiC grating designs under IIM. Putting more minutely, the average LOD value in case of SiO2 grating based sensor configuration was 2.2558 10−5 ng/mL, which was nearly one third smaller than that of SiC grating based configuration (6.8174 10−5 ng/mL). Moreover, it is evident from Table 2 that there was a small change in RI value on increasing the Cc value. More precisely, a small change in RI (0.001434) was observed for a significantly large (12 times) variation in Cc (from 0.36 to 4.50 ng/mL). This small change in RI affected the or value. Thus, the corresponding or would increase, which resulted in the LOD increment.
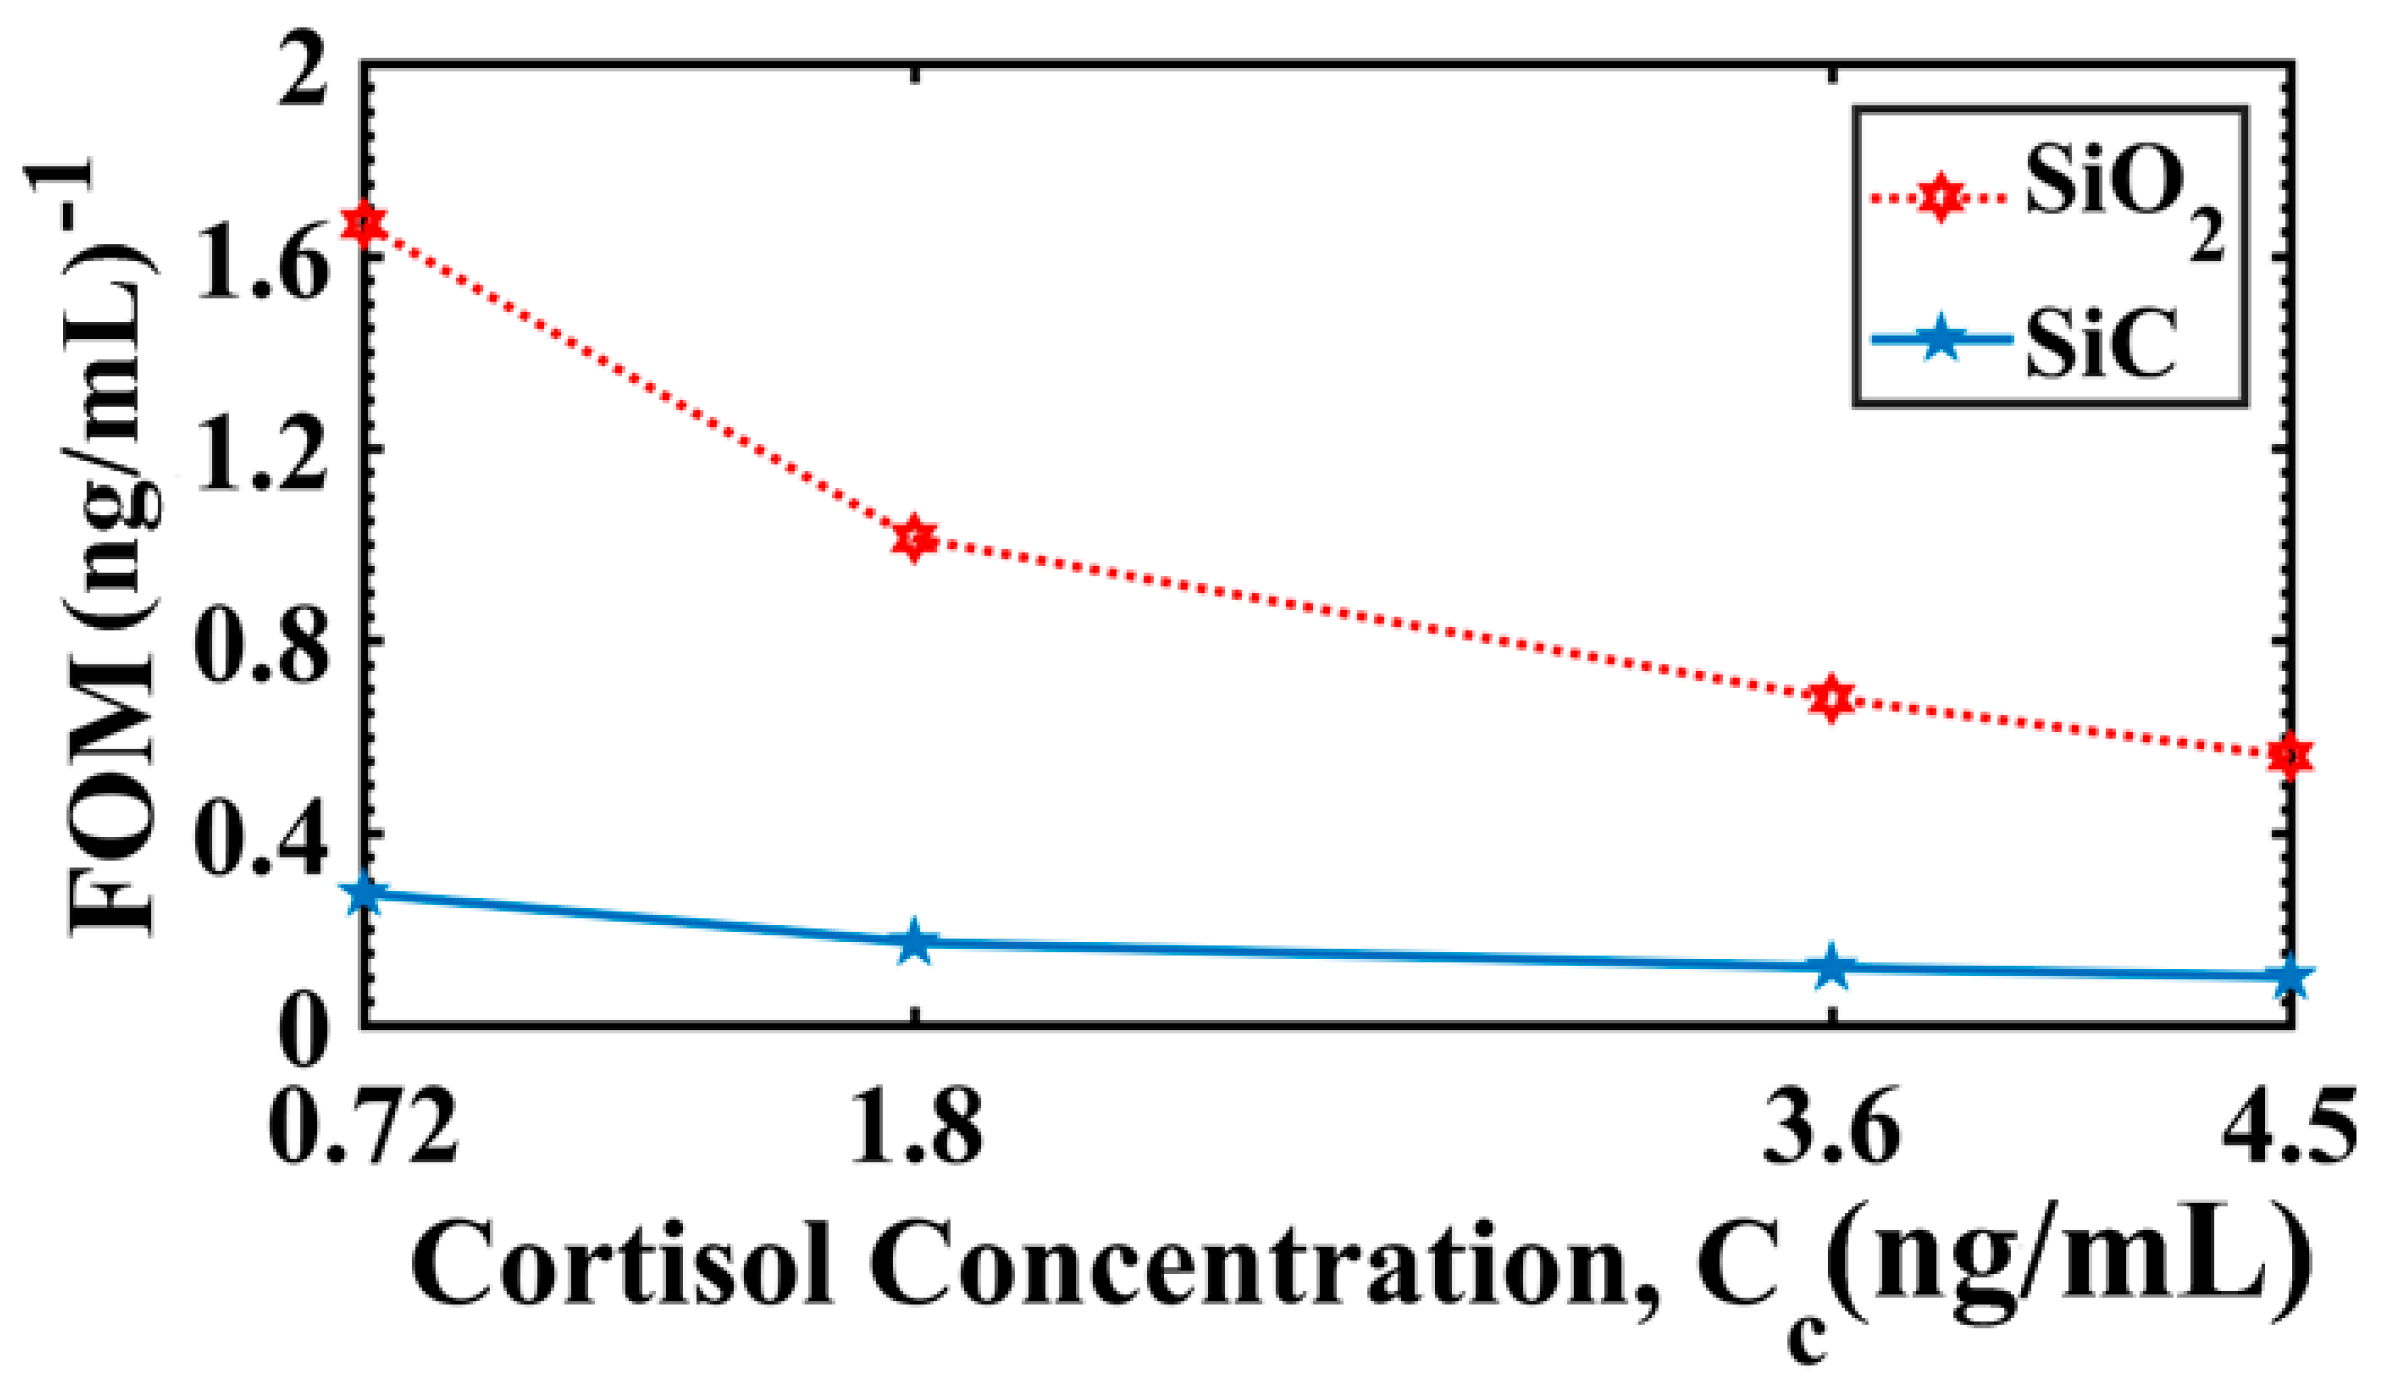
Next in this sequence was the analysis of FOM (under AIM) while considering 0.36 ng/mL as the reference sample. For Cc = 0.72 ng/mL, the simulation results revealed that the FOM values for SiO2 and SiC grating based sensors were 1.6664 (ng/mL)−1 and 0.2749 (ng/mL)−1, respectively. Similarly, for Cc = 4.50 ng/mL, the FOM values were 0.5598 (ng/mL)−1 and 0.1015 (ng/mL)−1 for SiO2 and SiC grating based sensors, respectively. For clear depiction, the FOM variation with Cc is shown in Figure 5. The FOM decreased with Cc, which was mainly due to an increase in FWHM with Cc (as shown in Table 2) because it was found that the term (or SA) had slower variation (compared to corresponding FWHM variation) with Cc. A larger FWHM value for SiC grating-based design than SiO2 grating-based design (as shown in Table 2) explained the difference in FOM between two design variants. Table 3 lists the average values of sensitivities SA (under AIM) and SI (under IIM), and LOD as discussed above.
3.3. Comparison with the Present State-of-the-Art Related to Cortisol Sensors, Steps Needed for Possible Practical Implementation and Possible Limitations
The LOD achievable with the proposed sensor probe was compared with some of the recently reported cortisol sensors (as shown in Table 4).
The above table shows that the proposed sensor probes had the potential of achieving significantly finer LOD in comparison with most of the existing cortisol sensor probes based on diverse sensing techniques.
Now, the practical implementation possibility of the proposed structure sensor configuration was discussed. The commercial availability of different constituents of the sensor probes is an important aspect. In order to take the intended research close to the possible practical realization, the following steps are to be followed:
- Multilayered structure was deposited over the commercially available fiber (discussed further). In general, ion sputtering vapor system was used to deposit Ag layer over bare fiber. Further, deposition of SiO2 layer could be done by using appropriate techniques, such as chemical or physical vapor deposition methods.
- A monochromatic light source (preferably a laser diode, λ = 830 nm) attached with a polarizer was fixed on a rotary stage in order to launch the light into the fiber core. In the angular interrogation method, in order to measure the angular shift of the monochromatic beam, a position-sensitive detector (PSD) was used. At present, 0.001° was the smallest angular shift that can be actually detected [36].
- A wavelength selective photodetector (here, λ = 830 nm) measured the transmitted power, or power meter could be used to measure the PL in dB.
Further, considering the availability of commercially available fibers for application in near infrared (NIR) spectral region, ZBLAN (55.8ZrF4-14.4BaF2-5.2LaF2-3.8AlF3-20.2NaF) fluoride glass could be selected as a core material (with a core diameter 400 µm and N.A. 0.212). The clad portion of ZBLAN fiber could be removed by etching, which usually leaves behind some residual material (say, roughness) but using a combination of acetone and distilled water can remove the residual. Moreover, a mild solution of hydrofluoric acid (HF) may also be used for short durations before or after the etching process. Further, in order to bypass the above process, using a clad-less (bare core) ZBLAN fiber (if available) can be another option. We have done an analysis based on commercially available ZBLAN fiber (bare core fiber, RI = 1.4949 at λ = 830 nm) [42]. Initially, the metal layer thickness was optimized (for SiO2 grating based configurations) in order to achieve minimum FWHM and corresponding PLmax. It is evident from Figure 6a, the minimum FWHM (i.e., 0.111°) was obtained at tAg = 48.50 nm with PLmax = 549.618 dB. Figure 6b shows the variation of PL with α for different values of Cc. Table 5 shows the calculated parameters based on Figure 6.
The above values show that the practical of the ZBLAN fiber SPR cortisol sensor with significantly high values of all performance parameters could be conveniently carried out. It should be appreciated that the selectivity of the sensor was very important. Since we used the experimentally measured RI values of cortisol solutions [10], therefore, we assumed for simulation purposes that the different RI values actually belonged to different cortisol solutions only. However, when the actual experiments are to be carried out, an appropriate cortisol-sensitive layer should be used.
The major limitations related to using multimode fiber are mode-mixing and the skewness (owing to any deviation from collimated launching condition). As far as the mode-mixing is concerned, it is a well-established fact that when the number of modes is excessively large, it tends towards the continuous mode spectrum rather than a discrete one [43], so the effect of mode-mixing may become irrelevant for highly multimoded fibers (which is the case here). For better and constant results, a polarization controller (or polarization maintaining fiber, if available) should be used. Regarding skew rays, it is worth-mentioning that a study on the effect of skew rays on the performance of a step-index multimode fiber SPR sensor [44] had indicated that there is moderate effect of skewness on sensing performance. For collimated launching (as considered in the present study also), there was reported a decrease of about 5% in the sensitivity for a corresponding variation in skewness parameter from 0 (i.e., no skew rays) to 1 (i.e., maximum skew rays). This can be further reduced by ensuring that the launching of laser beam into the fiber core does not deviate much from collimated condition.
4. Conclusions
Grating based fiber optic SPR sensor was simulated and analyzed for salivary cortisol detection at 830 nm wavelength. In this work, grating of SiO2 and SiC (one at a time) was considered to be an analyte interacting layer. Optimized metal layer thicknesses of 47.10 nm and 38.30 nm for SiO2 and SiC grating based configurations, respectively were achieved in view of maximum power loss and minimum value of FWHM at resonance condition. Average LOD values of 9.9 pg/mL and 9.8 pg/mL were obtained for SiO2 and SiC-based sensor configurations, respectively, in angular interrogation mode showing approximately similar trends at different concentrations. Moreover, when the LOD was represented under an intensity interrogation mode (i.e., shift in maximum power loss peaks), the average LOD values of 22.6 fg/mL and 68.17 fg/mL were obtained for SiO2 and SiC configurations, respectively. Thus, SiO2 grating based configuration was able to provide more than three times finer LOD than SiC grating based configuration. The analysis was also performed based on commercially available ZBLAN fiber as the core material. An average sensitivity and FOM values of 0.091°/(ng/mL) and 0.705 (ng/mL)−1 were calculated respectively, which are in considerable range in terms of sensor's performance. Other commercially available fibers such as heavy metal doped fluoride fibers and chalcogenide fibers can also be explored/incorporated in present configuration as core materials for near infrared sensing applications. The proposed sensor configuration can also be used for measuring/monitoring cortisol level in aquaculture [45] (e.g., cortisol level in fish and other aquatic animals where the concentration levels are lower than 10 ng/mL) and as a flexible wearable sensor for cortisol detection in sweat.
Author Contributions
Conceptualization and methodology, A.K.P. and A.K.S.; software, A.K.P.; validation, A.K.S. and C.M.; data curation, A.K.P.; writing—original draft preparation, A.K.P. and A.K.S.; writing—review and editing, A.K.S. and C.M.; visualization, A.K.S. and C.M.; supervision, A.K.S. All authors have read and agreed to the published version of the manuscript.
Funding
The financial support from the Council of Scientific and Industrial Research (CSIR), India, is gratefully acknowledged by A. K. Sharma for research and development project grant (No. 03(1441)/18/EMR II) and by A. K. Pandey for Research Associateship (RA). The research work of C. Marques is partially financed by Fundação para a Ciência e a Tecnologia (FCT) through the CEECIND/00034/2018 (iFish project) and this work was developed within the scope of the project i3N, UIDB/50025/2020 and UIDP/50025/2020, financed by national funds through the FCT/MEC. This work is also funded by national funds (OE), through FCT, I.P., in the scope of the framework contract foreseen in the numbers 4, 5 and 6 of the article 23, of the Decree-Law 57/2016, of August 29, changed by Law 57/2017, of July 19.
Conflicts of Interest
The authors declare no conflict of interest.
References
- Ray, P.; Steckl, A.J. Label-Free Optical Detection of Multiple Biomarkers in Sweat, Plasma, Urine, and Saliva. ACS Sensors 2019, 4, 1346–1357. [Google Scholar] [CrossRef] [PubMed]
- Steptoe, A.; Hamer, M.; Chida, Y. The effects of acute psychological stress on circulating inflammatory factors in humans: A review and meta-analysis. Brain. Behav. Immun. 2007, 21, 901–912. [Google Scholar] [CrossRef] [PubMed]
- Steckl, A.J.; Ray, P. Stress Biomarkers in Biological Fluids and Their Point-of-Use Detection. ACS Sensors 2018, 3, 2025–2044. [Google Scholar] [CrossRef] [PubMed]
- Corbalán-Tutau, D.; Madrid, J.A.; Nicolás, F.; Garaulet, M. Daily profile in two circadian markers “melatonin and cortisol” and associations with metabolic syndrome components. Physiol. Behav. 2014, 123, 231–235. [Google Scholar] [CrossRef] [PubMed]
- Ljubijankić, N.; Popović-Javorić, R.; Šćeta, S. Daily fluctuation of cortisol in the saliva and serum of healthy persons. Bosn. J. Basic Med. Sci. 2008, 8, 110–115. [Google Scholar] [CrossRef] [Green Version]
- Munir, S.; Waseem, M. Addison Disease. Available online: https://www.ncbi.nlm.nih.gov/books/NBK441994/ (accessed on 10 October 2019).
- Raff, H.; Findling, J.W. A Physiologic Approach to Diagnosis of the Cushing Syndrome. Ann. Intern. Med. 2003, 138, 980–991. [Google Scholar] [CrossRef]
- Kaushik, A.; Vasudev, A.; Arya, S.K.; Pasha, S.K.; Bhansali, S. Recent advances in cortisol sensing technologies for point-of-care application. Biosens. Bioelectron. 2014, 53, 499–512. [Google Scholar] [CrossRef]
- Liu, X.; Hsu, S.P.C.; Liu, W.-C.; Wang, Y.; Liu, X.; Lo, C.; Lin, Y.-C.; Nabilla, S.C.; Li, Z.; Hong, Y.; et al. Salivary Electrochemical Cortisol Biosensor Based on Tin Disulfide Nanoflakes. Nanoscale Res. Lett. 2019, 14, 189. [Google Scholar] [CrossRef]
- Arya, S.K.; Chornokur, G.; Venugopal, M.; Bhansali, S. Antibody modified gold micro array electrode based electrochemical immunosensor for ultrasensitive detection of cortisol in saliva and ISF. Proc. Eng. 2010, 5, 804–807. [Google Scholar] [CrossRef] [Green Version]
- Stevens, R.C.; Soelberg, S.D.; Near, S.; Furlong, C.E. Detection of Cortisol in Saliva with a Flow-Filtered, Portable Surface Plasmon Resonance Biosensor System. Anal. Chem. 2008, 80, 6747–6751. [Google Scholar] [CrossRef] [Green Version]
- Tlili, C.; Myung, N.V.; Shetty, V.; Mulchandani, A. Label-free, chemiresistor immunosensor for stress biomarker cortisol in saliva. Biosens. Bioelectron. 2011, 26, 4382–4386. [Google Scholar] [CrossRef] [PubMed]
- Chen, X.; Zhang, L.; Cui, D. Surface plasmon resonance immunoassay for cortisol determination with a self-assembling denaturalised bovine serum albumin layer on surface plasmon resonance chip. Micro Nano Lett. 2016, 11, 20–23. [Google Scholar] [CrossRef]
- Frasconi, M.; Mazzarino, M.; Botrè, F.; Mazzei, F. Surface plasmon resonance immunosensor for cortisol and cortisone determination. Anal. Bioanal. Chem. 2009, 394, 2151–2159. [Google Scholar] [CrossRef] [PubMed]
- Jung, H.; Jung, J.; Kim, Y.H.; Kwon, D.; Kim, B.G.; Na, H.B.; Lee, H.H. Surface Plasmon Resonance Characteristics of Au Nanoparticles Layered Sensor Chip for Direct Detection of Stress Hormone Conjugated by Nanoparticles. Biochip J. 2018, 12, 249–256. [Google Scholar] [CrossRef]
- Zhang, L.; Chen, X.; Wei, W.; Deng, S.; Xu, C.; Cui, D. An Automatic Miniature Surface Plasmon Resonance System for Cortisol Detection. Proc. Technol. 2017, 27, 89–90. [Google Scholar] [CrossRef]
- Pandey, A.K.; Sharma, A.K. Simulation and analysis of plasmonic sensor in NIR with fluoride glass and graphene layer. Photonics Nanostruct. Fundam. Appl. 2018, 28, 94–99. [Google Scholar] [CrossRef]
- Sharma, A.K.; Pandey, A.K.; Kaur, B. A Review of advancements (2007–2017) in plasmonics-based optical fiber sensors. Opt. Fiber Technol. 2018, 43, 20–34. [Google Scholar] [CrossRef]
- Sharma, A.K.; Pandey, A.K.; Kaur, B. Fluoride Fiber-Based Plasmonic Biosensor with Two-Dimensional Material Heterostructures: Enhancement of Overall Figure-of-Merit via Optimization of Radiation Damping in Near Infrared Region. Materials 2019, 12, 1542. [Google Scholar] [CrossRef] [Green Version]
- Usha, S.P.; Shrivastav, A.M.; Gupta, B.D. A contemporary approach for design and characterization of fiber-optic-cortisol sensor tailoring LMR and ZnO/PPY molecularly imprinted film. Biosens. Bioelectron. 2017, 87, 178–186. [Google Scholar] [CrossRef]
- Zeng, L.; Chen, M.; Yan, W.; Li, Z.; Yang, F. Si-grating-assisted SPR sensor with high figure of merit based on Fabry–Pérot cavity. Opt. Commun. 2020, 457, 124641. [Google Scholar] [CrossRef]
- Sharma, A.K.; Pandey, A.K. Self-referenced plasmonic sensor with TiO2 grating on thin Au layer: Simulated performance analysis in optical communication band. J. Opt. Soc. Am. B 2019, 36, F25. [Google Scholar] [CrossRef]
- Sun, P.; Zhou, C.; Jia, W.; Wang, J.; Xiang, C.; Xie, Y.; Zhao, D. Narrowband absorber based on magnetic dipole resonances in two-dimensional metal–dielectric grating for sensing. Opt. Commun. 2020, 459, 124946. [Google Scholar] [CrossRef]
- Korposh, S.; James, S.; Partridge, M.; Sichka, M.; Tatam, R. All-optical switching based on optical fibre long period gratings modified bacteriorhodopsin. Opt. Laser Technol. 2018, 101, 162–171. [Google Scholar] [CrossRef]
- Zhao, X.-W.; Wang, Q. Mini review: Recent advances in long period fiber grating biological and chemical sensors. Instrum. Sci. Technol. 2019, 47, 140–169. [Google Scholar] [CrossRef]
- Tabassum, N.; Kotha, M.; Kaushik, V.; Ford, B.; Dey, S.; Crawford, E.; Nikas, V.; Gallis, S. On-demand CMOS-compatible fabrication of ultrathin self-aligned SiC nanowire arrays. Nanomaterials 2018, 8, 906. [Google Scholar] [CrossRef] [Green Version]
- 830nm Laser Diodes. Available online: https://www.laserdiodesource.com/laser-diodes-filtered-by-wavelength/830nm-laser-diodes (accessed on 30 October 2019).
- Laser Diodes (518303). Available online: https://www.first-sensor.com/en/products/optical-sensors/laser-diodes/ (accessed on 26 March 2020).
- Atayeva, S.U.; Mekhtiyeva, S.I.; Isayev, A.I. Dispersion of the refractive index of a samarium-doped Se95 Te5 chalcogenide glassy semiconductor. Semiconductors 2015, 49, 949–952. [Google Scholar] [CrossRef]
- Ishigure, T.; Koike, Y.; Fleming, J.W. Optimum index profile of the perfluorinated polymer-based GI polymer optical fiber and its dispersion properties. J. Light. Technol. 2000, 18, 178–184. [Google Scholar] [CrossRef]
- Rakic, A.D.; Djurisic, A.B.; Elazar, J.M.; Majewski, M.L. Optical properties of metallic films for vertical-cavity optoelectronic devices. Appl. Opt. 1998, 37, 5271–5283. [Google Scholar] [CrossRef]
- Esfandiyari, M.; Norouzi, M.; Haghdoust, P.; Jarchi, S. Study of a Surface Plasmon Resonance Optical Fiber Sensor Based on Periodically Grating and Graphene. Silicon 2018, 10, 2711–2716. [Google Scholar] [CrossRef]
- Larruquert, J.I.; Pérez-Marín, A.P.; García-Cortés, S.; Rodríguez-de Marcos, L.; Aznárez, J.A.; Méndez, J.A. Self-consistent optical constants of SiC thin films. J. Opt. Soc. Am. A 2011, 28, 2340. [Google Scholar] [CrossRef] [Green Version]
- Sharma, A.K.; Kaur, B. Optical Fiber Technology Chalcogenide fiber-optic SPR chemical sensor with MoS 2 monolayer, polymer clad, and polythiophene layer in NIR using selective ray launching. Opt. Fiber Technol. 2018, 43, 163–168. [Google Scholar] [CrossRef]
- Hammad, H.F.; Antar, Y.M.M.; Freundorfer, A.P.; Sayer, M. A new dielectric grating antenna at millimeter wave frequency. IEEE Trans. Antennas Propag. 2004, 52, 36–44. [Google Scholar] [CrossRef]
- Mao, Y.; Bao, Y.; Wang, W.; Li, Z.; Li, F.; Niu, L. Development and Application of Time-Resolved Surface Plasmon Resonance Spectrometer. Am. J. Anal. Chem. 2011, 2, 589–604. [Google Scholar] [CrossRef] [Green Version]
- OPTICAL POWER METERS. Available online: https://www.fiberoptics4sale.com/blogs/archive-posts/95051334 -optical-power-meters-the-most-import-thing-you-need-to-know-about-fiber-optic-power-meters#targetText=Optical Power Meter Types&targetText=Lower cost field optical power,chosen according to the (accessed on 22 February 2020).
- Raether, H. Surface Plasmons on Smooth and Rough Surfaces and on Gratings; Springer-Verlag: Berlin, Germany, 1988; Volume 111, ISBN 978-3-540-17363-2. [Google Scholar]
- Vasudev, A.; Kaushik, A.; Tomizawa, Y.; Norena, N.; Bhansali, S. An LTCC-based microfluidic system for label-free, electrochemical detection of cortisol. Sens. Actuators B Chem. 2013, 182, 139–146. [Google Scholar] [CrossRef]
- Kämäräinen, S.; Mäki, M.; Tolonen, T.; Palleschi, G.; Virtanen, V.; Micheli, L.; Sesay, A.M. Disposable electrochemical immunosensor for cortisol determination in human saliva. Talanta 2018, 188, 50–57. [Google Scholar] [CrossRef]
- Dalirirad, S.; Steckl, A.J. Aptamer-based lateral flow assay for point of care cortisol detection in sweat. Sens. Actuators B Chem. 2019, 283, 79–86. [Google Scholar] [CrossRef]
- ZBLAN Fluoride Glass Fibers & Cables. Available online: https://www.fiberlabs.com/fiber_index/ (accessed on 24 February 2020).
- Ghatak, A.; Thyagarajan, K. Introduction to Fiber Optics; Cambridge University Press: Cambridge, CA, USA, 1998. [Google Scholar]
- Dwivedi, Y.S.; Sharma, A.K.; Gupta, B.D. Influence of skew rays on the sensitivity and signal-to-noise ratio of a fiber-optic surface-plasmon-resonance sensor: A theoretical study. App. Opt. 2007, 46, 4563–4569. [Google Scholar] [CrossRef]
- Mota, V.C.; Martins, C.I.M.; Eding, E.H.; Canário, A.V.M.; Verreth, J.A.J. Water cortisol and testosterone in Nile tilapia (Oreochromis niloticus) recirculating aquaculture systems. Aquaculture 2017, 468, 255–261. [Google Scholar] [CrossRef]
Figure 1.
Schematic representation of grating based fiber optic sensor. D is the fiber core diameter and L is the fiber (sensing region) length considered as 1 cm in the present work. d is the grating period and d1 is the groove width. The dielectric layer is the perfluorinated (PF) homopolymer.
Figure 1.
Schematic representation of grating based fiber optic sensor. D is the fiber core diameter and L is the fiber (sensing region) length considered as 1 cm in the present work. d is the grating period and d1 is the groove width. The dielectric layer is the perfluorinated (PF) homopolymer.

Figure 2.
(a) Variation of power loss and full width at half maximum (FWHM) with metal layer thickness and (b) power loss variation with incident angle for different concentration of cortisol in solution (cortisol-conjugated BSA); d1/d = 0.5 (SiO2 gratings), tAg = 47.10 nm and λ = 830 nm.
Figure 2.
(a) Variation of power loss and full width at half maximum (FWHM) with metal layer thickness and (b) power loss variation with incident angle for different concentration of cortisol in solution (cortisol-conjugated BSA); d1/d = 0.5 (SiO2 gratings), tAg = 47.10 nm and λ = 830 nm.

Figure 3.
(a) Variation of power loss and FWHM with metal layer thickness and (b) power loss variation with incident angle for different concentration of cortisol in solution (cortisol-conjugated BSA); d1/d = 0.5 (SiC gratings), tAg = 38.30 nm and λ = 830 nm.
Figure 3.
(a) Variation of power loss and FWHM with metal layer thickness and (b) power loss variation with incident angle for different concentration of cortisol in solution (cortisol-conjugated BSA); d1/d = 0.5 (SiC gratings), tAg = 38.30 nm and λ = 830 nm.

Figure 4.
Limit of detection (LOD) variation with cortisol concentration (solution of cortisol-conjugated BSA) in the case of the (a) angular interrogation mode and (b) intensity interrogation mode for SiO2 and SiC grating based configurations. The reference sample was Cc = 0.36 ng/mL. Here, d1/d = 0.5, tAg = 47.10 nm (for SiO2) and tAg = 38.30 nm (for SiC) and λ = 830 nm.

Figure 5.
Figure of merit (FOM) variation with different concentration of cortisol (solution of cortisol-conjugated BSA) for SiO2 and SiC grating based configurations. The reference sample Cc = 0.36 ng/mL. Here, d1/d = 0.5, tAg = 47.10 nm (for SiO2) and tAg = 38.30 nm (for SiC) and λ = 830 nm.
Figure 5.
Figure of merit (FOM) variation with different concentration of cortisol (solution of cortisol-conjugated BSA) for SiO2 and SiC grating based configurations. The reference sample Cc = 0.36 ng/mL. Here, d1/d = 0.5, tAg = 47.10 nm (for SiO2) and tAg = 38.30 nm (for SiC) and λ = 830 nm.

Figure 6.
(a) Variation of power loss (in dB) and FWHM with metal layer thickness for CC = 0.36 ng/mL) and (b) power loss variation with incident angle for different concentration of cortisol (in solution of cortisol-conjugated BSA); d1/d = 0.5 (SiO2 gratings), tAg = 48.50 nm and λ = 830 nm.
Figure 6.
(a) Variation of power loss (in dB) and FWHM with metal layer thickness for CC = 0.36 ng/mL) and (b) power loss variation with incident angle for different concentration of cortisol (in solution of cortisol-conjugated BSA); d1/d = 0.5 (SiO2 gratings), tAg = 48.50 nm and λ = 830 nm.


Table 1.
830 nm wavelength.
| Layer | Refractive Index | Ref |
|---|---|---|
| Se95Te5Sm0.25 core | 1.6604 | [29] |
| PF homopolymer | 1.3377 | [30] |
| Ag | 0.1795 + 5.2369i | [31] |
| SiO2 | 1.5331 | [32] |
| SiC | 3.3067 + 0.14839i | [33] |
Table 2.
SiC of 20 nm and 29 nm grating based sensor designs at 830 nm wavelength are 47.10 nm and 38.30 nm, respectively.
Table 2.
SiC of 20 nm and 29 nm grating based sensor designs at 830 nm wavelength are 47.10 nm and 38.30 nm, respectively.
| Cc (ng/mL) | 0.36 | 0.72 | 1.80 | 3.60 | 4.50 | |
| RI [11] | 1.3297 | 1.3300 | 1.3305 | 1.3310 | 1.3311 | |
| αSPR (o) | a | 64.365 | 64.306 | 64.201 | 64.083 | 64.059 |
| b | 29.782 | 29.722 | 29.617 | 29.498 | 29.472 | |
| PLmax (dB) | a | 1043.26 | 1015.70 | 974.03 | 934.06 | 926.87 |
| b | 515.65 | 505.30 | 490.19 | 476.35 | 473.73 | |
| FWHM (°) | a | 0.088 | 0.097 | 0.112 | 0.128 | 0.132 |
| b | 0.561 | 0.601 | 0.664 | 0.727 | 0.739 | |
a: SiO2 grating based sensor design; b: SiC grating based sensor design.
Table 3.
Summary of performance parameters for angular interrogation mode (AIM; FOM, SA and LOD) and intensity interrogation method (IIM; SI and LOD).
Table 3.
Summary of performance parameters for angular interrogation mode (AIM; FOM, SA and LOD) and intensity interrogation method (IIM; SI and LOD).
| Performance Parameter | SiO2 gratings; tg = 20 nm and tAg 47.10 nm | SiC gratings; tg = 29 nm and tAg 38.30 nm | |
|---|---|---|---|
| Sensitivity (AIM) | Average SA in deg. (ng/mL)−1 | 0.1092 | 0.1106 |
| Sensitivity (IIM) | Average SI in dB(ng/mL)−1 | 46.615 | 17.136 |
| FOM (ng/mL)−1 | 0.9330 | 0.1610 | |
| LOD (ng/mL) | AIM | 0.0099 | 0.0098 |
| IIM | 2.2558 × 10⁻⁵ | 6.8174 × 10⁻⁵ | |
Table 4.
LOD comparison with prominent cortisol sensors.
| Ref. | Modalities | LOD |
|---|---|---|
| Chen et al. [13] | Denaturalized bovine serum albumin (dBSA)-SPR chip | 1 ng/mL |
| Vasudev et al. [39] | LTCC-based microfluidic system | 10 pg/mL |
| Kämäräinen et al. [40] | Electrochemical immunosensor | 0.6 ng/mL |
| Dalirirada and Steckl [41] | Aptamer functionalized Au nanoparticles | 1 ng/mL |
| Usha et al. [20] | LMR and ZnO/PPY nanocomposite of MIP | 25.9 fg/mL |
| This work | SiO2 Grating based fiber SPR sensor | - |
| (a) angular mode (b) intensity mode | 9.9 pg/mL 22.6 fg/mL | |
| SiC Grating based fiber SPR sensor | - | |
| (a) angular mode (b) intensity mode | 9.8 pg/mL 68.17 fg/mL | |
Table 5.
Gratings and ZBLAN fiber core.
| Cc (ng/mL) | αspr (Deg.) | PLmax (dB) | FOM (ng/mL)−1 | LOD (ng/mL) | |
|---|---|---|---|---|---|
| Angular Mode | Intensity Mode | ||||
| 0.36 | 32.872 | 549.618 | - | - | - |
| 0.72 | 32.824 | 539.130 | 1.127 | 0.0075 | 3.43 × 10⁻⁵ |
| 1.80 | 32.734 | 522.199 | 0.744 | 0.0104 | 5.25 × 10⁻⁵ |
| 3.60 | 32.634 | 506.298 | 0.514 | 0.0136 | 7.47 × 10⁻⁵ |
| 4.50 | 32.612 | 502.855 | 0.434 | 0.0159 | 8.85 × 10⁻⁵ |
© 2020 by the authors. Licensee MDPI, Basel, Switzerland. This article is an open access article distributed under the terms and conditions of the Creative Commons Attribution (CC BY) license (http://creativecommons.org/licenses/by/4.0/).
Share and Cite
MDPI and ACS Style
Pandey, A.K.; Sharma, A.K.; Marques, C. On The Application of SiO2/SiC Grating on Ag for High-Performance Fiber Optic Plasmonic Sensing of Cortisol Concentration. Materials 2020, 13, 1623. https://doi.org/10.3390/ma13071623
AMA Style
Pandey AK, Sharma AK, Marques C. On The Application of SiO2/SiC Grating on Ag for High-Performance Fiber Optic Plasmonic Sensing of Cortisol Concentration. Materials. 2020; 13(7):1623. https://doi.org/10.3390/ma13071623
Chicago/Turabian StylePandey, Ankit Kumar, Anuj K. Sharma, and Carlos Marques. 2020. "On The Application of SiO2/SiC Grating on Ag for High-Performance Fiber Optic Plasmonic Sensing of Cortisol Concentration" Materials 13, no. 7: 1623. https://doi.org/10.3390/ma13071623
Note that from the first issue of 2016, this journal uses article numbers instead of page numbers. See further details here.