In-situ Deposition of Graphene Oxide Catalyst for Efficient Photoelectrochemical Hydrogen Evolution Reaction Using Atmospheric Plasma

Abstract
:1. Introduction
2. Materials and Methods
2.1. Synthesis of Graphene Oxide
2.2. Characterization of Materials
2.3. Photoelectrochemical Measurements
3. Results and Discussion
4. Conclusions
Author Contributions
Funding
Acknowledgments
Conflicts of Interest
References
- Geim, A.K. Graphene: Status and prospects. Science 2009, 324, 1530–1534. [Google Scholar] [CrossRef] [PubMed] [Green Version]
- Zhang, Y.; Zhang, L.; Zhou, C. Review of chemical vapor deposition of graphene and related applications. Acc. Chem. Res. 2013, 46, 2329–2339. [Google Scholar] [CrossRef] [PubMed]
- De Marchi, L.; Pretti, C.; Gabriel, B.; Marques, P.A.; Freitas, R.; Neto, V. An overview of graphene materials: Properties, applications and toxicity on aquatic environments. Sci. Total Environ. 2018, 631, 1440–1456. [Google Scholar] [CrossRef] [PubMed]
- Pei, S.; Cheng, H.-M. The reduction of graphene oxide. Carbon 2012, 50, 3210–3228. [Google Scholar] [CrossRef]
- Askari, M.B.; Salarizadeh, P.; Rozati, S.M.; Seifi, M. Two-dimensional transition metal chalcogenide composite/reduced graphene oxide hybrid materials for hydrogen evolution application. Polyhedron 2019, 162, 201–206. [Google Scholar] [CrossRef]
- Chen, L.; Shi, J. Chemical-assisted hydrogen electrocatalytic evolution reaction (CAHER). J. Mater. Chem. A 2018, 6, 13538–13548. [Google Scholar] [CrossRef]
- Dunn, S. Hydrogen futures: Toward a sustainable energy system. Int. J. Hydrog. Energy 2002, 27, 235–264. [Google Scholar] [CrossRef]
- Ji, L.; McDaniel, M.D.; Wang, S.; Posadas, A.B.; Li, X.; Huang, H.; Lee, J.C.; Demkov, A.A.; Bard, A.J.; Ekerdt, J.G. A silicon-based photocathode for water reduction with an epitaxial SrTiO 3 protection layer and a nanostructured catalyst. Nat. Nanotechnol. 2015, 10, 84. [Google Scholar] [CrossRef] [PubMed]
- Zhang, Q.; Li, T.; Luo, J.; Liu, B.; Liang, J.; Wang, N.; Kong, X.; Li, B.; Wei, C.; Zhao, Y. Ti/Co-S catalyst covered amorphous Si-based photocathodes with high photovoltage for the HER in non-acid environments. J. Mater. Chem. A 2018, 6, 811–816. [Google Scholar] [CrossRef]
- Sim, U.; Jeong, H.-Y.; Yang, T.-Y.; Nam, K.T. Nanostructural dependence of hydrogen production in silicon photocathodes. J. Mater. Chem. A 2013, 1, 5414–5422. [Google Scholar] [CrossRef]
- Luo, Z.; Wang, T.; Gong, J. Single-crystal silicon-based electrodes for unbiased solar water splitting: Current status and prospects. Chem. Soc. Rev. 2019, 48, 2158–2181. [Google Scholar] [CrossRef] [PubMed]
- Warren, E.L.; McKone, J.R.; Atwater, H.A.; Gray, H.B.; Lewis, N.S. Hydrogen-evolution characteristics of Ni–Mo-coated, radial junction, n+ p-silicon microwire array photocathodes. Energy Environ. Sci. 2012, 5, 9653–9661. [Google Scholar] [CrossRef] [Green Version]
- Sim, U.; Yang, T.-Y.; Moon, J.; An, J.; Hwang, J.; Seo, J.-H.; Lee, J.; Kim, K.Y.; Lee, J.; Han, S. N-doped monolayer graphene catalyst on silicon photocathode for hydrogen production. Energy Environ. Sci. 2013, 6, 3658–3664. [Google Scholar] [CrossRef]
- Moon, J.; Sim, U.; Kim, D.J.; Ahn, H.-Y.; An, J.; Ha, H.; Choi, K.S.; Jeon, C.; Lee, J.; Nam, K.T. Hierarchical carbon–silicon nanowire heterostructures for the hydrogen evolution reaction. Nanoscale 2018, 10, 13936–13941. [Google Scholar] [CrossRef] [PubMed]
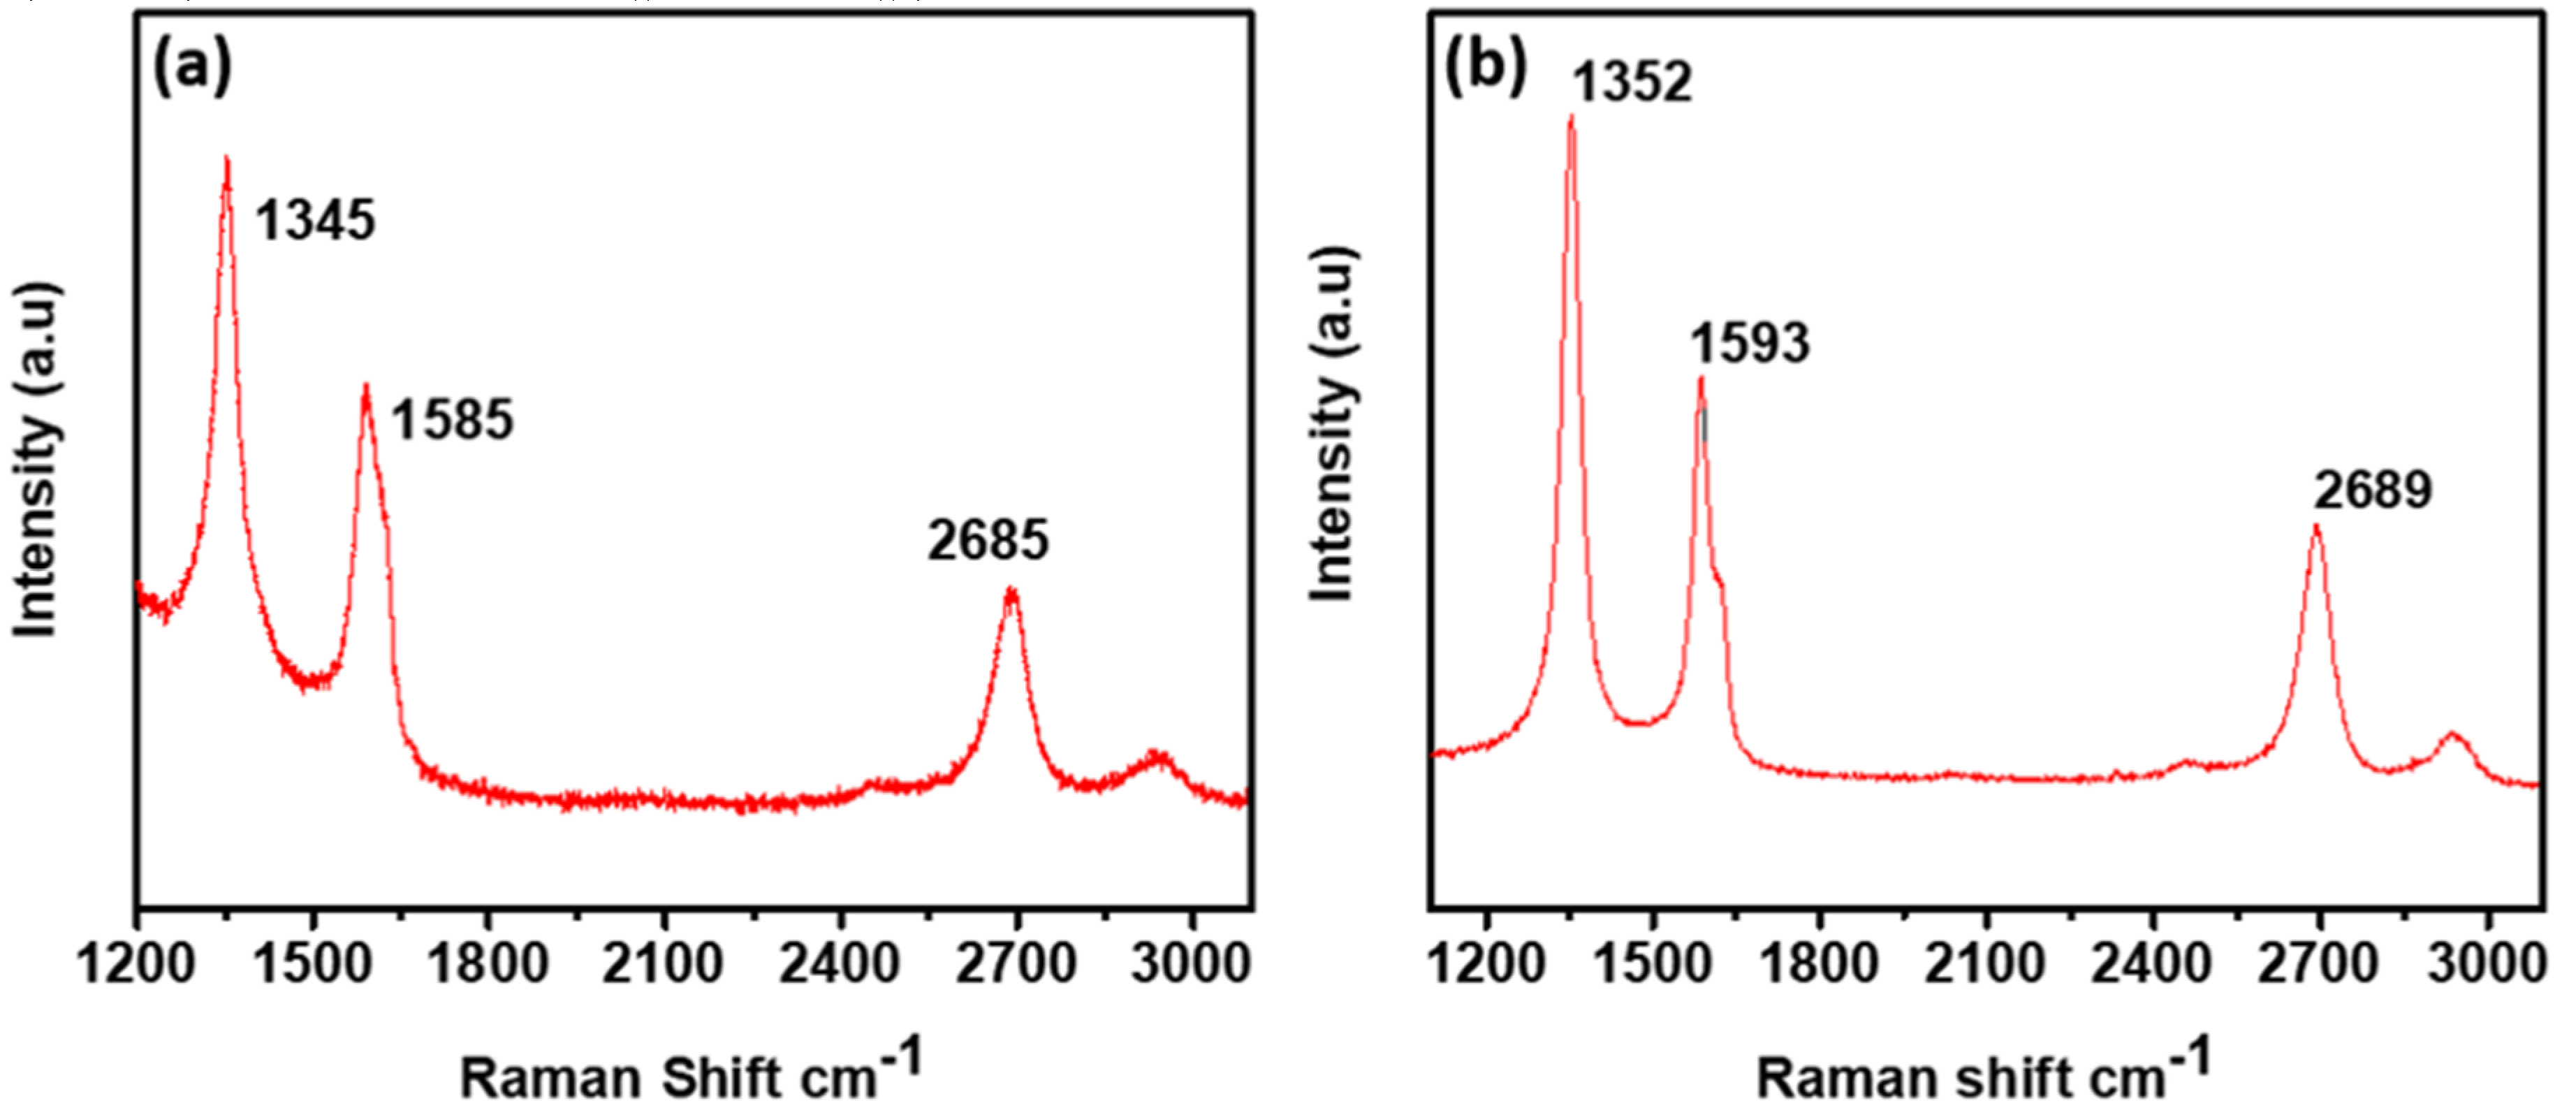
- Nanda, S.S.; Kim, M.J.; Yeom, K.S.; An, S.S.A.; Ju, H.; Yi, D.K. Raman spectrum of graphene with its versatile future perspectives. TrAC Trends Anal. Chem. 2016, 80, 125–131. [Google Scholar] [CrossRef]
- Johra, F.T.; Lee, J.W.; Jung, W.G. Facile and safe graphene preparation on solution based platform. J. Ind. Eng. Chem. 2014, 20, 2883. [Google Scholar]
- Childres, I.; Jauregui, L.A.; Park, W.; Cao, H.; Chen, Y.P. RAMAN SPECTROSCOPY OF GRAPHENE AND RELATED MATERIAL. New Dev. Photon Mater. Res. 2013, 1. [Google Scholar]
- Ferrari, A.C.; Meyer, J.; Scardaci, V.; Casiraghi, C.; Lazzeri, M.; Mauri, F.; Piscanec, S.; Jiang, D.; Novoselov, K.; Roth, S. Raman spectrum of graphene and graphene layers. Phys. Rev. Lett. 2006, 97, 187401. [Google Scholar] [CrossRef] [Green Version]
- Schönfelder, R.; Rümmeli, M.H.; Gruner, W.; Löffler, M. Purification-induced sidewall functionalization of magnetically pure single-walled carbon nanotubes. Nanotechnology 2007, 18, 375601. [Google Scholar] [CrossRef]
- Tuinstra, F.; Koenig, J.L. Raman spectrum of graphite. J. Chem. Phys. 1970, 53, 1126–1130. [Google Scholar] [CrossRef] [Green Version]
- Shen, Y.; Lua, A.C. A facile method for the large-scale continuous synthesis of graphene sheets using a novel catalyst. Sci. Rep. 2013, 3. [Google Scholar] [CrossRef] [PubMed] [Green Version]
- Tran, N.A.; Lee, C.; Lee, D.H.; Cho, K.-H.; Joo, S.-W. Water Molecules on the Epoxide Groups of Graphene Oxide Surfaces: Water Molecules on the Epoxide Groups. Bull. Korean Chem. Soc. 2018, 39, 1320–1323. [Google Scholar] [CrossRef]
- Fan, X.; Zhang, G.; Zhang, F. Multiple roles of graphene in heterogeneous catalysis. Chem. Soc. Rev. 2015, 44, 3023–3035. [Google Scholar] [CrossRef] [PubMed]
- Sui, Y.; Chen, Z.; Zhang, Y.; Hu, S.; Liang, Y.; Ge, X.; Li, J.; Yu, G.; Peng, S.; Jin, Z.; et al. Growth promotion of vertical graphene on SiO2/Si by Ar plasma process in plasma-enhanced chemical vapor deposition. RSC Adv. 2018, 8, 18757. [Google Scholar] [CrossRef] [Green Version]
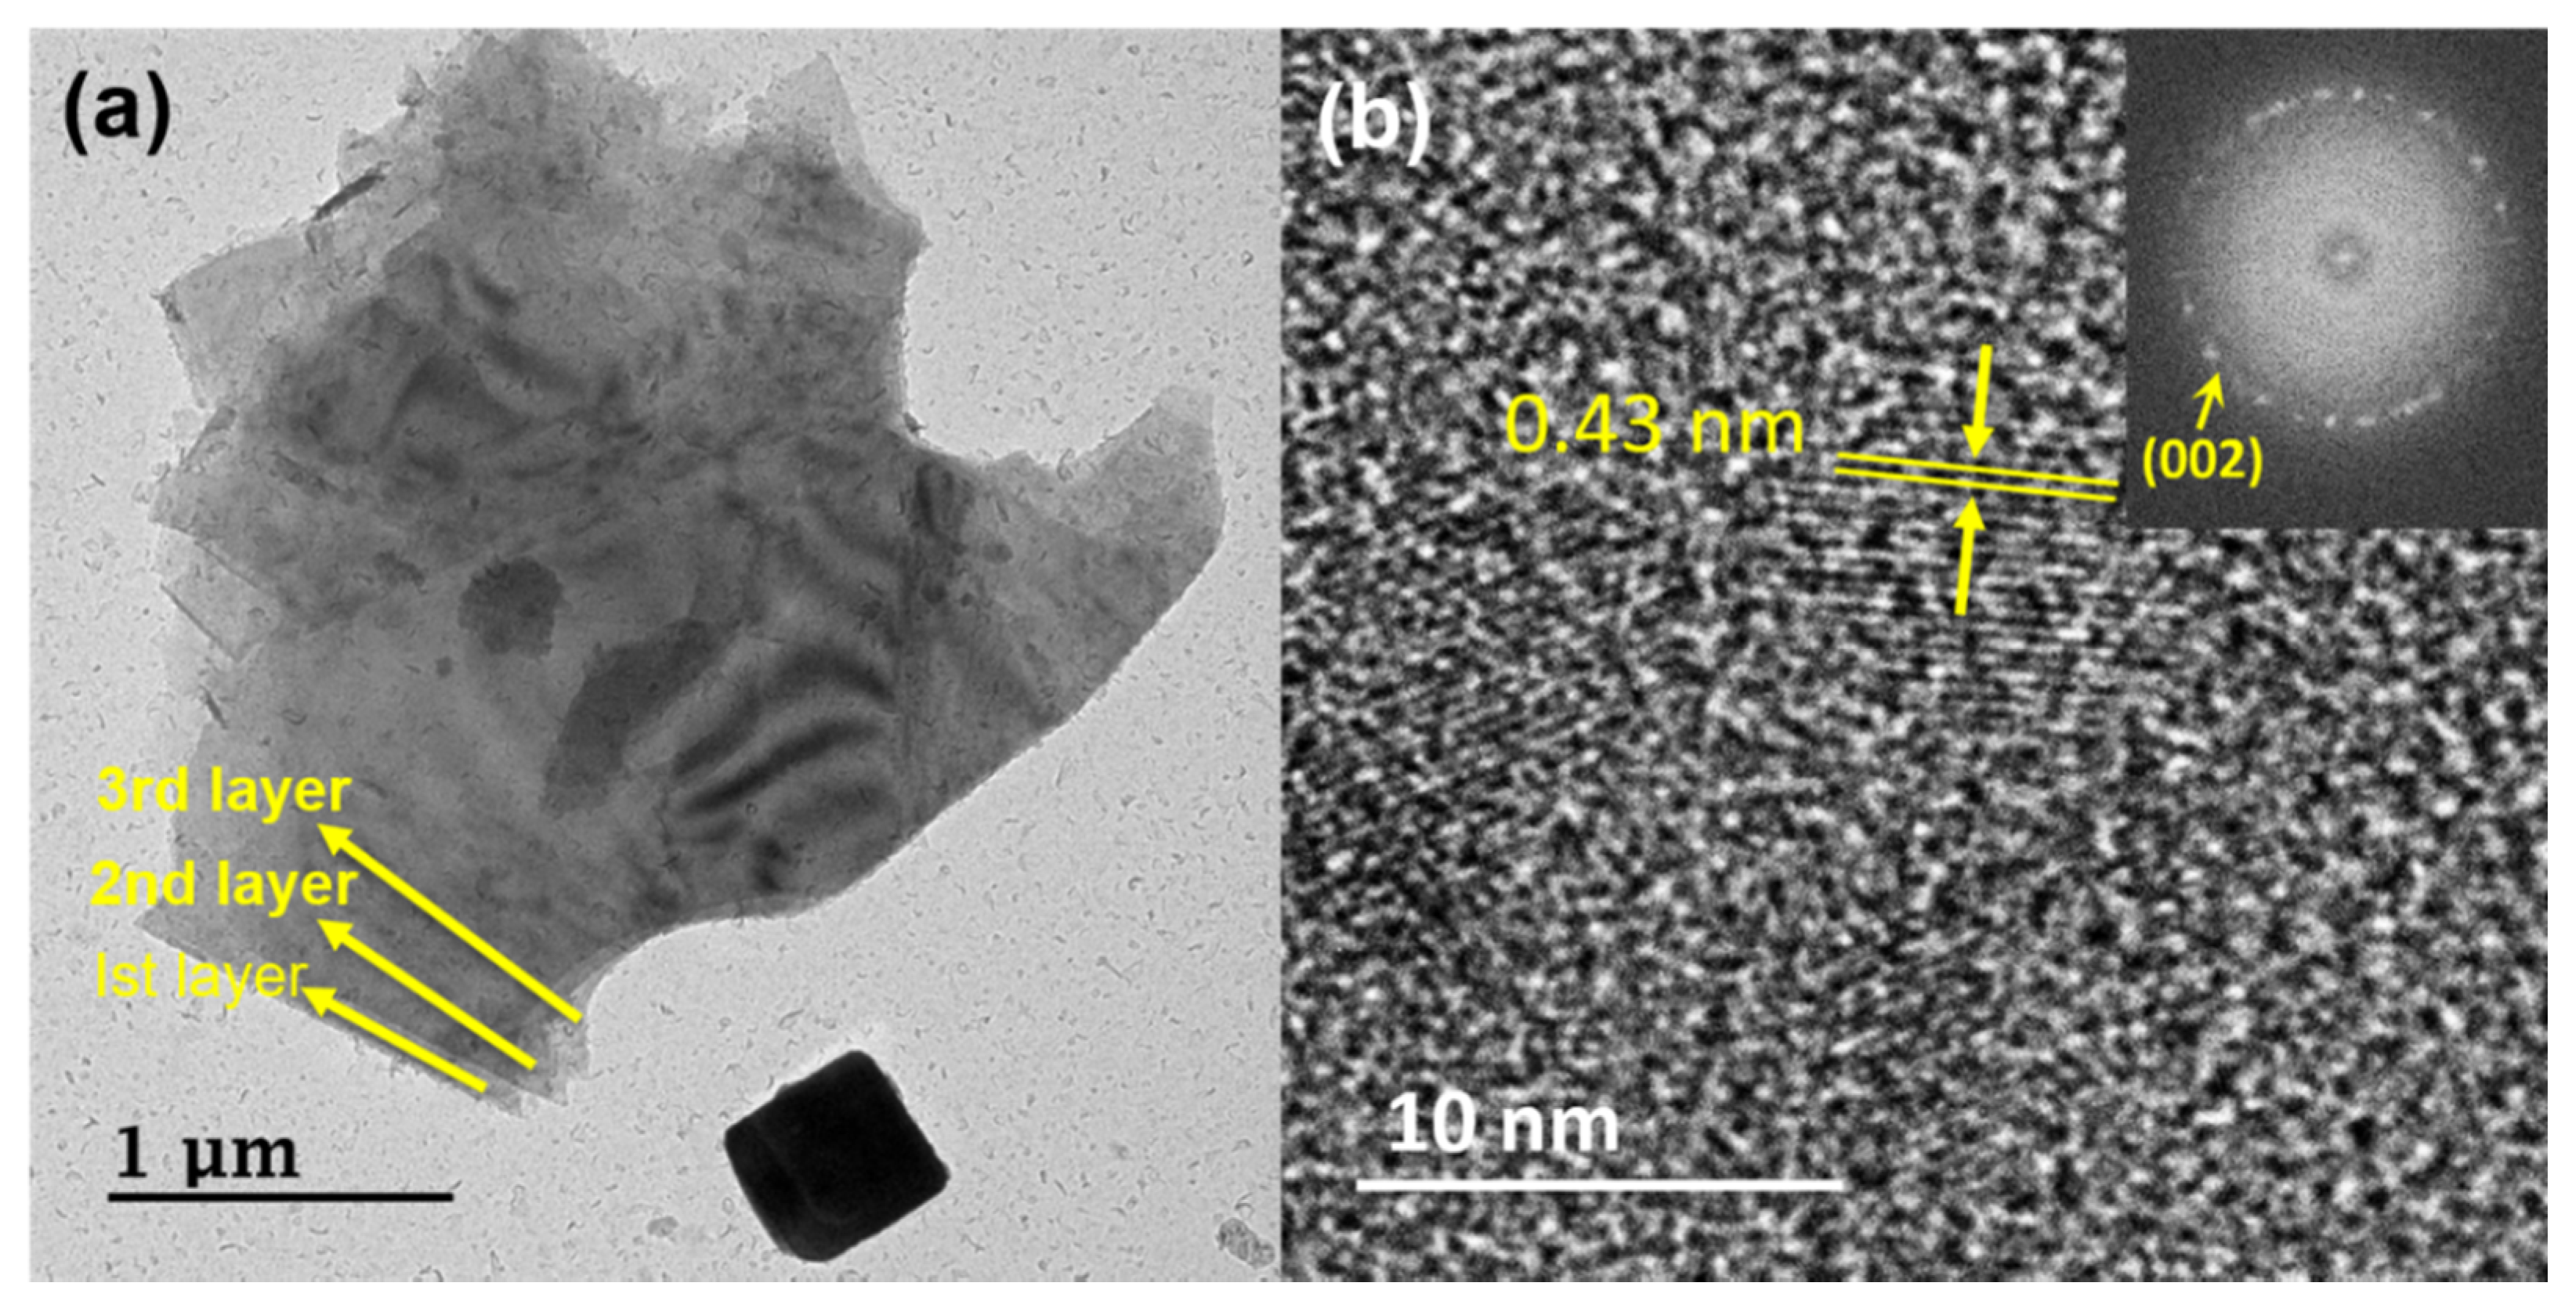
- Tang, B.; Zhang, L.; Li, R.; Wu, J.; Hedhili, M.N.; Wang, P. Are vacuum-filtrated reduced graphene oxide membranes symmetric? Nanoscale 2016, 8, 1108–1116. [Google Scholar] [CrossRef] [Green Version]
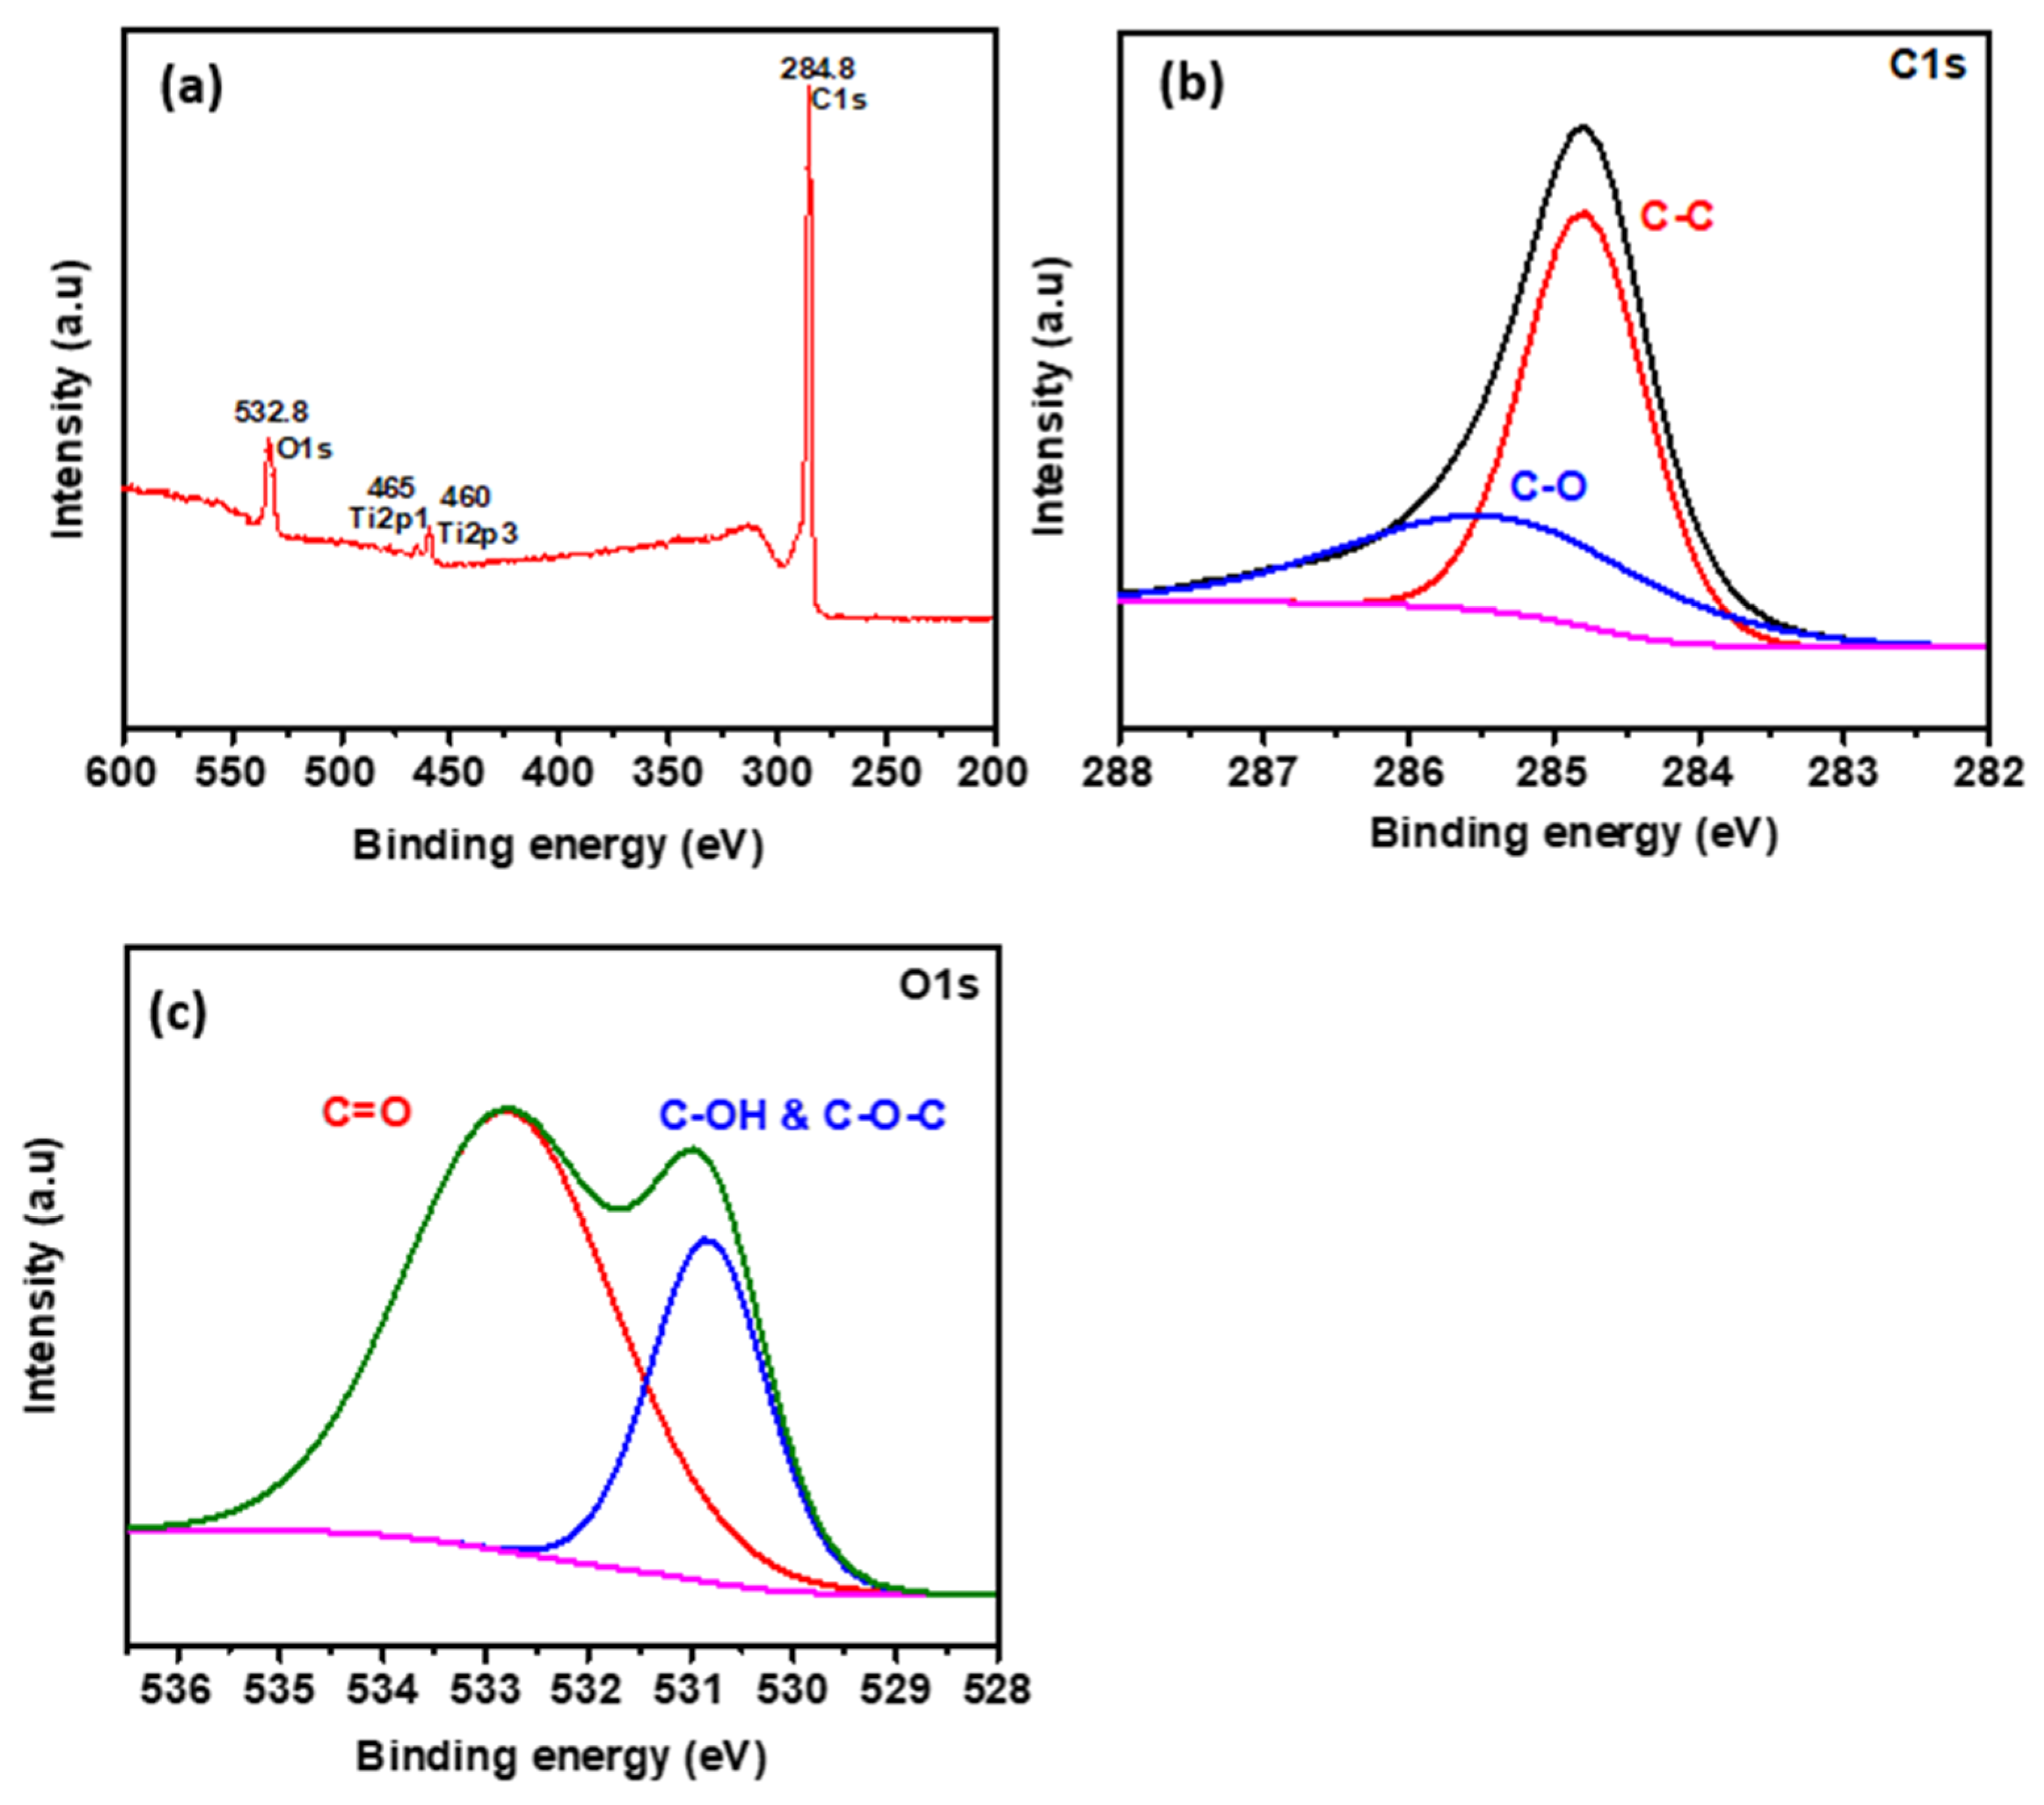
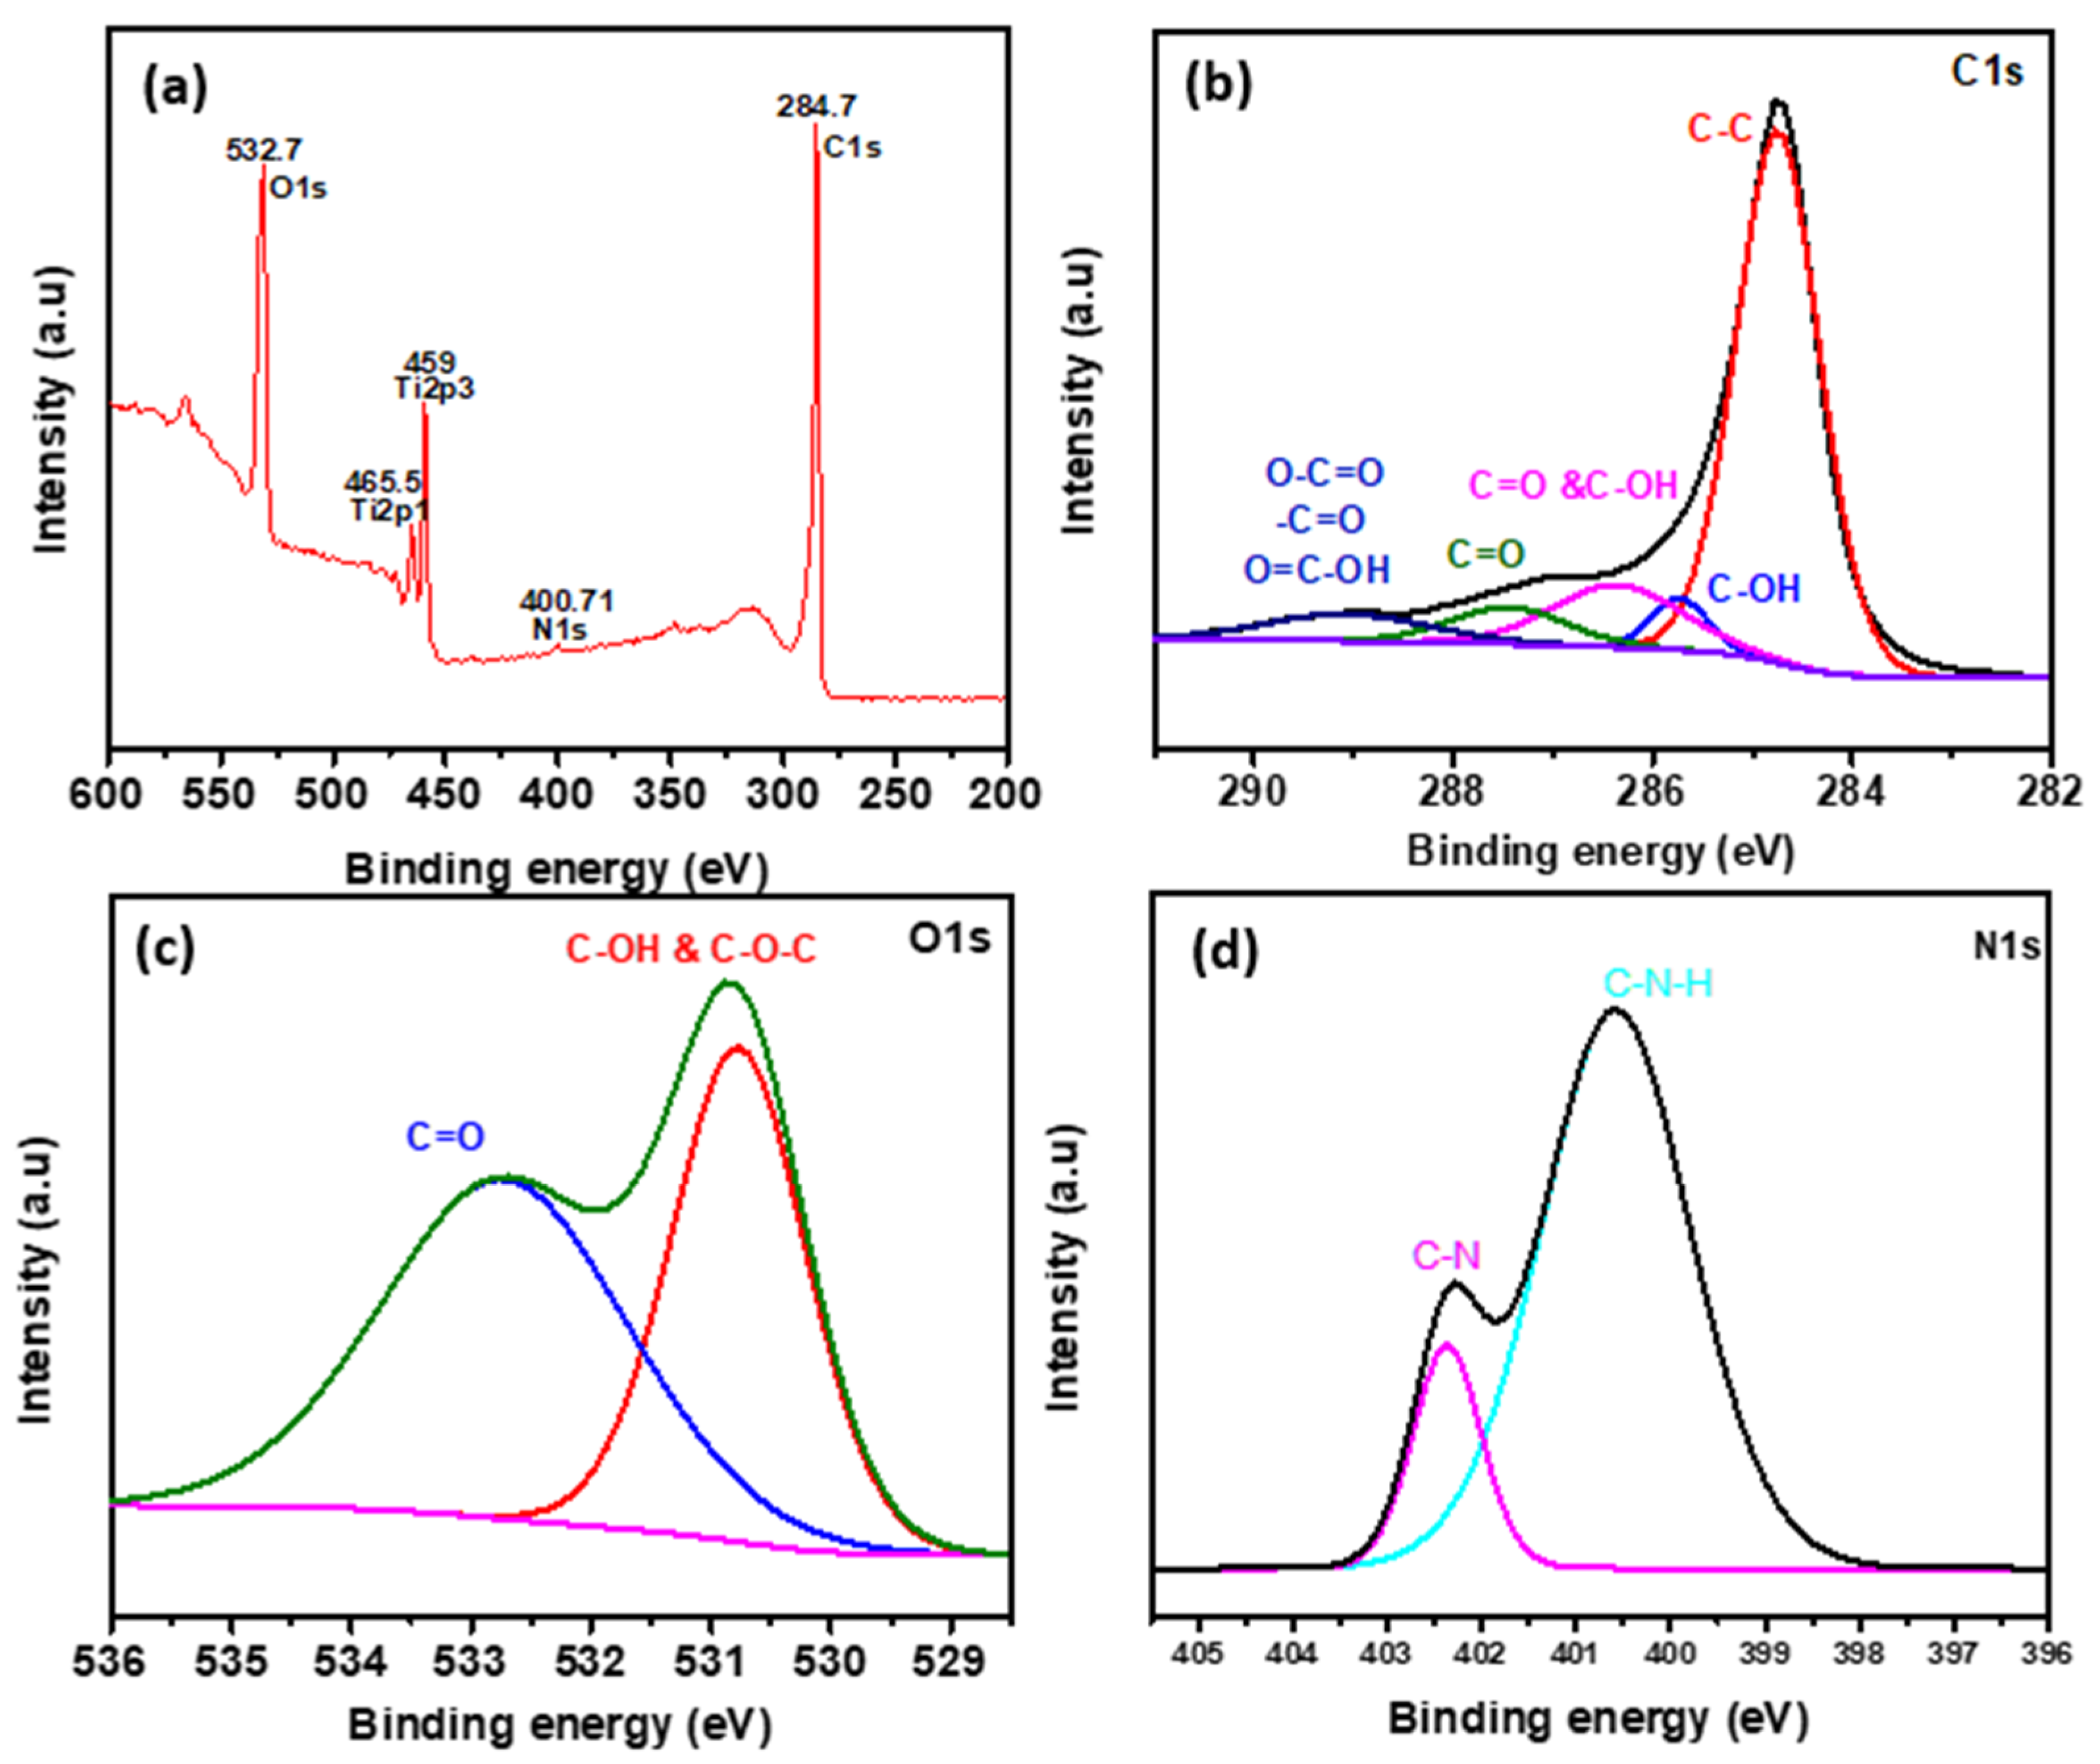
- Ganguly, A.; Sharma, S.; Papakonstantinou, P.; Hamilton, J. Probing the thermal deoxygenation of graphene oxide using high-resolution in situ X-ray-based spectroscopies. J. Phys. Chem. C 2011, 115, 17009–17019. [Google Scholar] [CrossRef] [Green Version]
- Stankovich, S.; Dikin, D.A.; Piner, R.D.; Kohlhaas, K.A.; Kleinhammes, A.; Jia, Y.; Wu, Y.; Nguyen, S.T.; Ruoff, R.S. Synthesis of graphene-based nanosheets via chemical reduction of exfoliated graphite oxide. Carbon 2007, 45, 1558–1565. [Google Scholar] [CrossRef]
- Choi, M.S.; Lee, S.H.; Yoo, W.J. Plasma treatments to improve metal contacts in graphene field effect transistor. J. Appl. PhyS. 2011, 110, 073305. [Google Scholar] [CrossRef] [Green Version]
- Depan, D.; Girase, B.; Shah, J.S.; Misra, R.D.K. Structure–process–property relationship of the polar graphene oxide-mediated cellular response and stimulated growth of osteoblasts on hybrid chitosan network structure nanocomposite scaffolds. Acta Biomater. 2011, 7, 3432. [Google Scholar] [CrossRef]
- Kroning, A.; Furchner, A.; Adam, S.; Uhlmann, P.; Hinrichs, K. Probing carbonyl–water hydrogen-bond interactions in thin polyoxazoline brushes. Biointerphases 2016, 11, 019005. [Google Scholar] [CrossRef] [Green Version]
- Gorbitz, C.H.; Etter, M.C. Hydrogen bonds to carboxylate groups. The question of three-centre interactions. J. Chem. Soc. Perkin Trans. 2 1992, 1992, 131–135. [Google Scholar] [CrossRef]
- Mokhtar, M.; El Enein, S.A.; Hassaan, M.; Morsy, M.; Khalil, M. Thermally reduced graphene oxide: Synthesis, structural and electrical properties. Int. J. Nanopart. Nanotechnol. 2017, 3. [Google Scholar] [CrossRef]
- Mageed, A.K.; AB, D.R.; Salmiaton, A.; Izhar, S.; Razak, M.A.; Yusoff, H.; Yasin, F.; Kamarudin, S. Preparation and characterization of nitrogen doped reduced graphene oxide sheet. Int. J. Appl. Chem. 2016, 12, 104–108. [Google Scholar]
- Zhu, C.; Xu, Q.; Liu, W.; Ren, Y. CO2-assisted fabrication of novel heterostructures of h-MoO3/1T-MoS2 for enhanced photoelectrocatalytic performance. Appl. Surf. Sci. 2017, 425, 56–62. [Google Scholar] [CrossRef]
- Chen, Y.W.; Prange, J.D.; Dühnen, S.; Park, Y.; Gunji, M.; Chidsey, C.E.; McIntyre, P.C. Atomic layer-deposited tunnel oxide stabilizes silicon photoanodes for water oxidation. Nat. Mater. 2011, 10, 539. [Google Scholar] [CrossRef]
- Shanmugapriya, S.; Surendran, S.; Lee, Y.S.; Selvan, R.K. Improved surface charge storage properties of Prosopis juliflora (pods) derived onion–like porous carbon through redox-mediated reactions for electric double layer capacitors. Appl. Surf. Sci. 2019, 492, 896–908. [Google Scholar] [CrossRef]
- Sim, U.; Moon, J.; An, J.; Kang, J.H.; Jerng, S.E.; Moon, J.; Cho, S.-P.; Hong, B.H.; Nam, K.T. N-doped graphene quantum sheets on silicon nanowire photocathodes for hydrogen production. Energy Environ. Sci. 2015, 8, 1329–1338. [Google Scholar] [CrossRef]


| Surface | Average (°) | STD |
|---|---|---|
| Hydrophobic rGO | 67 | 12.5 |
| Hydrophilic GO | 14.3 | 2.3 |
| Si wafer without coating | 53.2 | 8.3 |
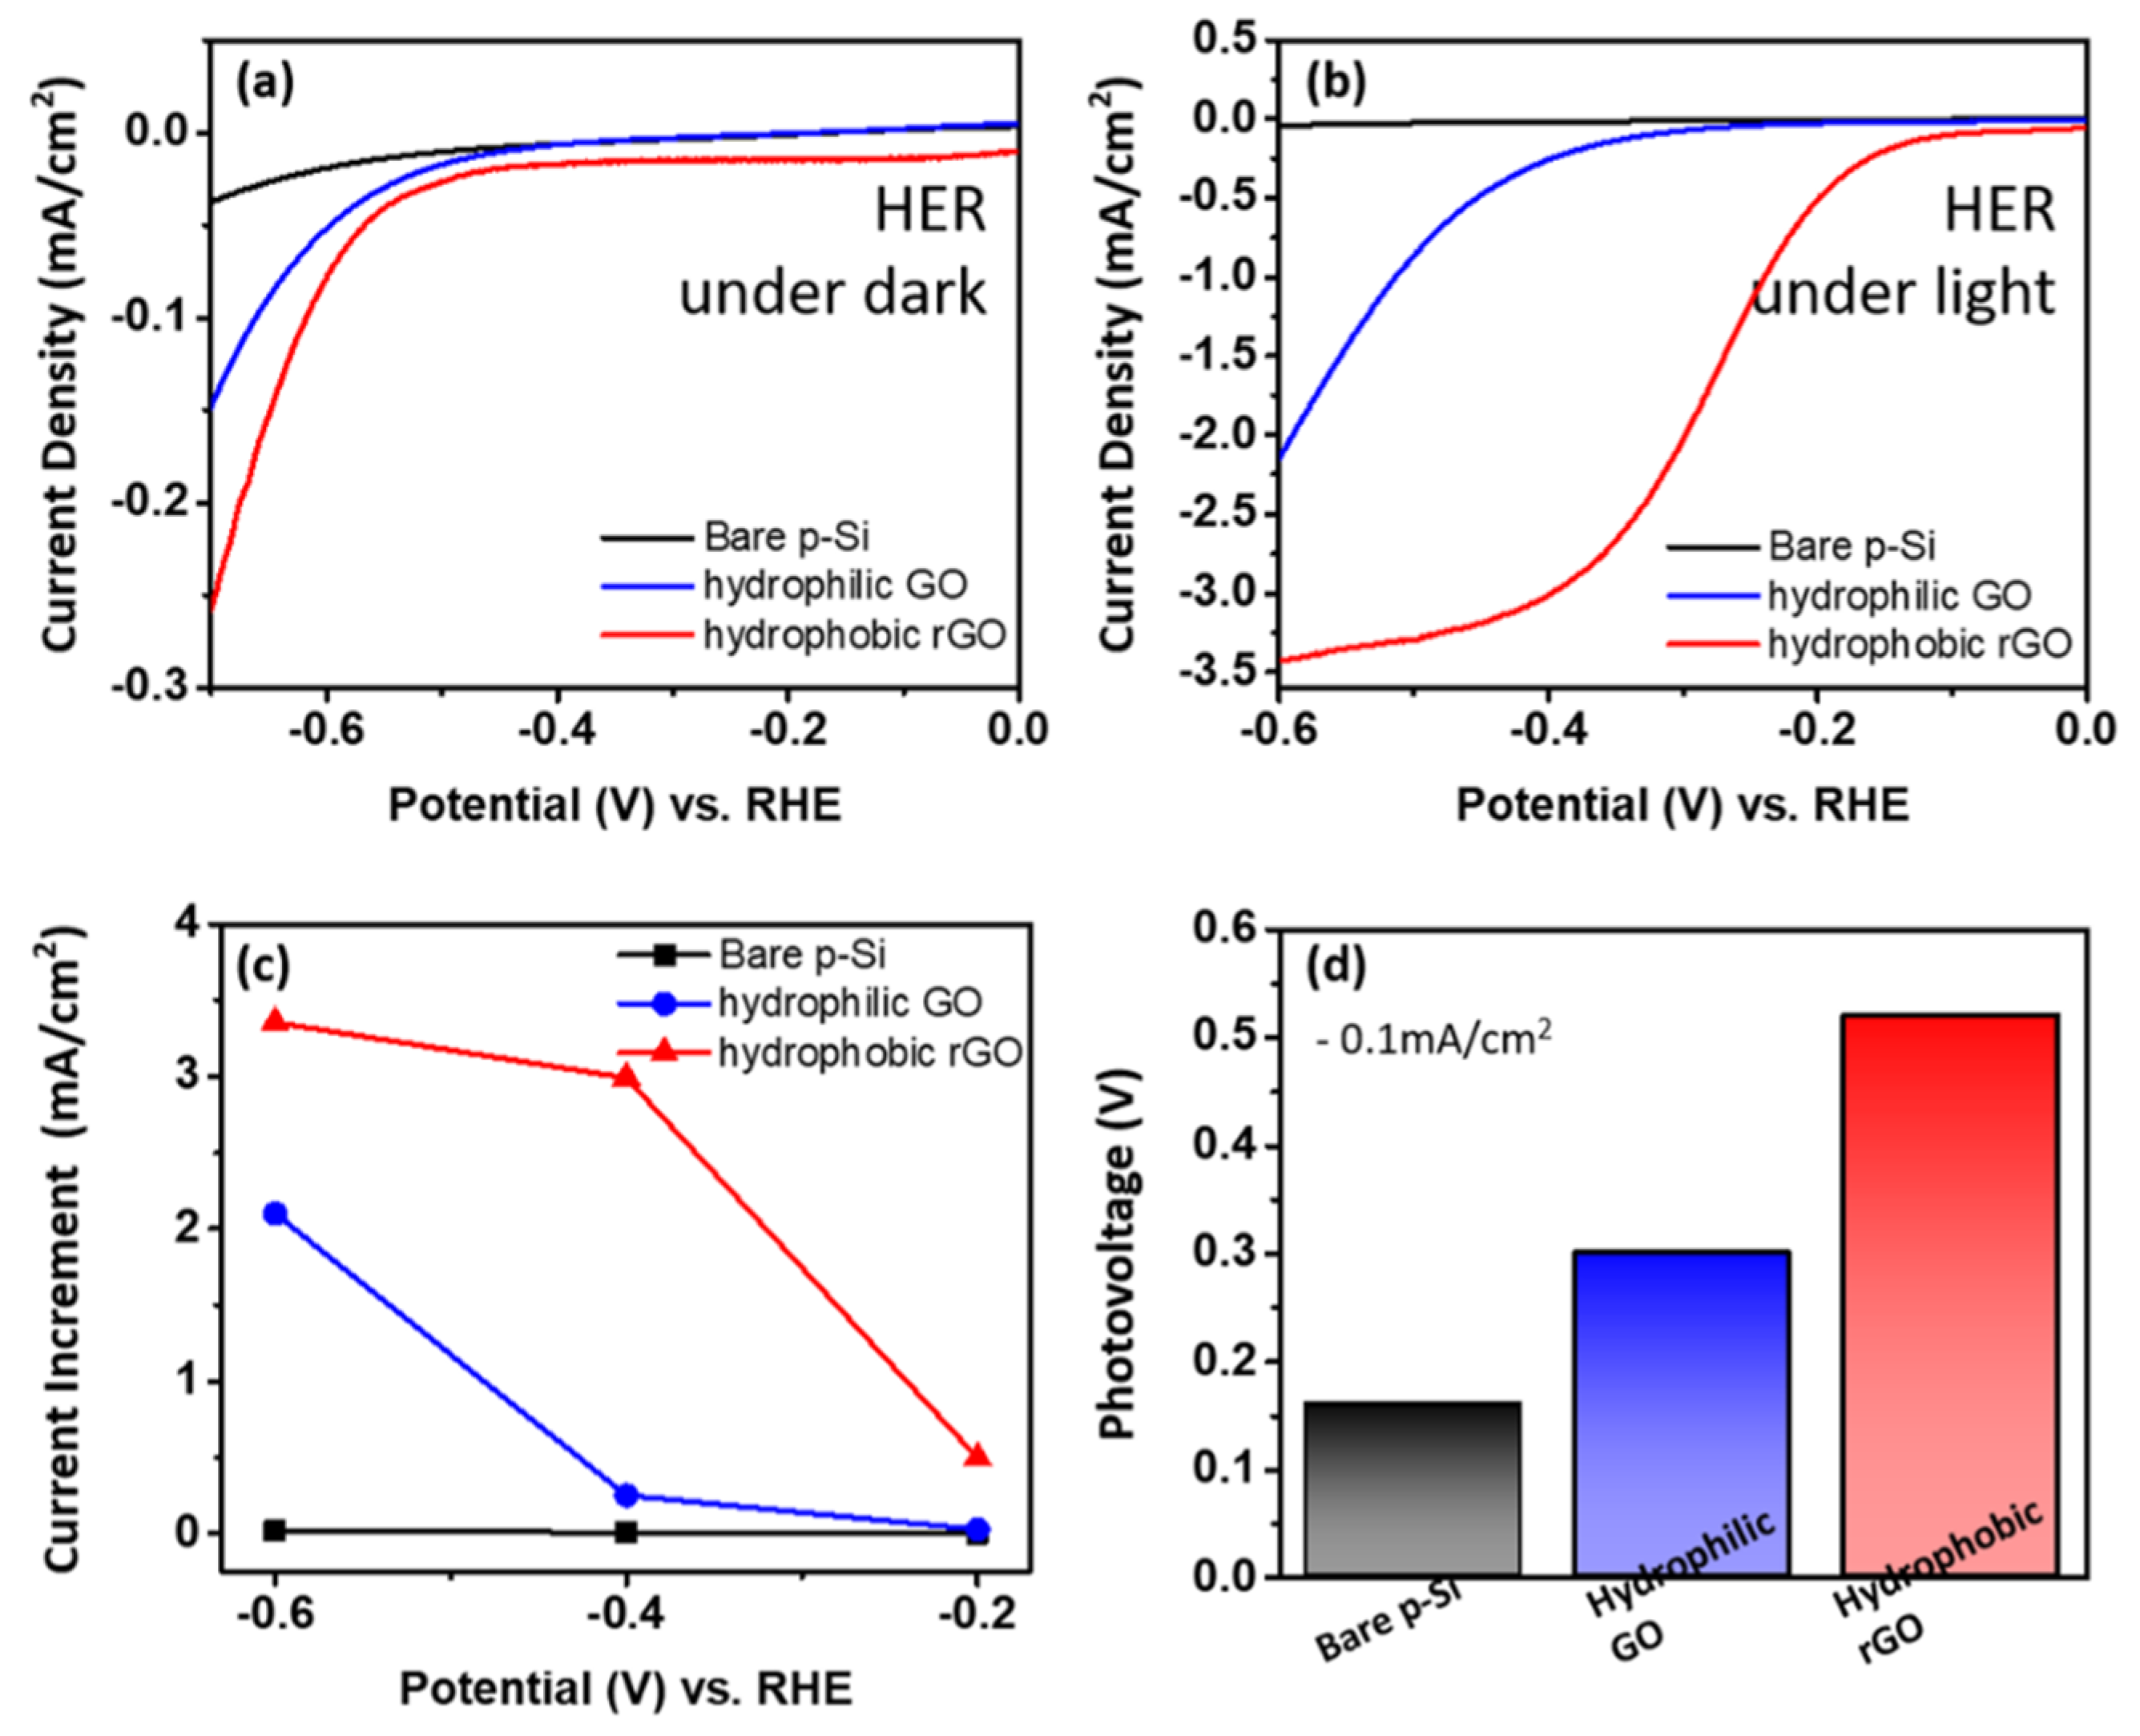
| Condition | Bare p-Si | Hydrophilic GO | Hydrophobic rGO | |
|---|---|---|---|---|
| Onset potential at dark condition (V) | −0.85 † | −0.66 | −0.62 | |
| Potential at −0.1 mA/cm2 at light condition (V) | −0.69 † | −0.33 | −0.1 | |
| Photovoltage* (V) | 0.16 | 0.3 | 0.52 | |
| Current increment at specific potential between dark and light condition (mA/cm2) | at −0.2 VRHE | 0.003 | 0.026 | 0.498 |
| at −0.4 VRHE | 0.007 | 0.251 | 2.991 | |
| at −0.6 VRHE | 0.018 | 2.1 | 3.353 | |
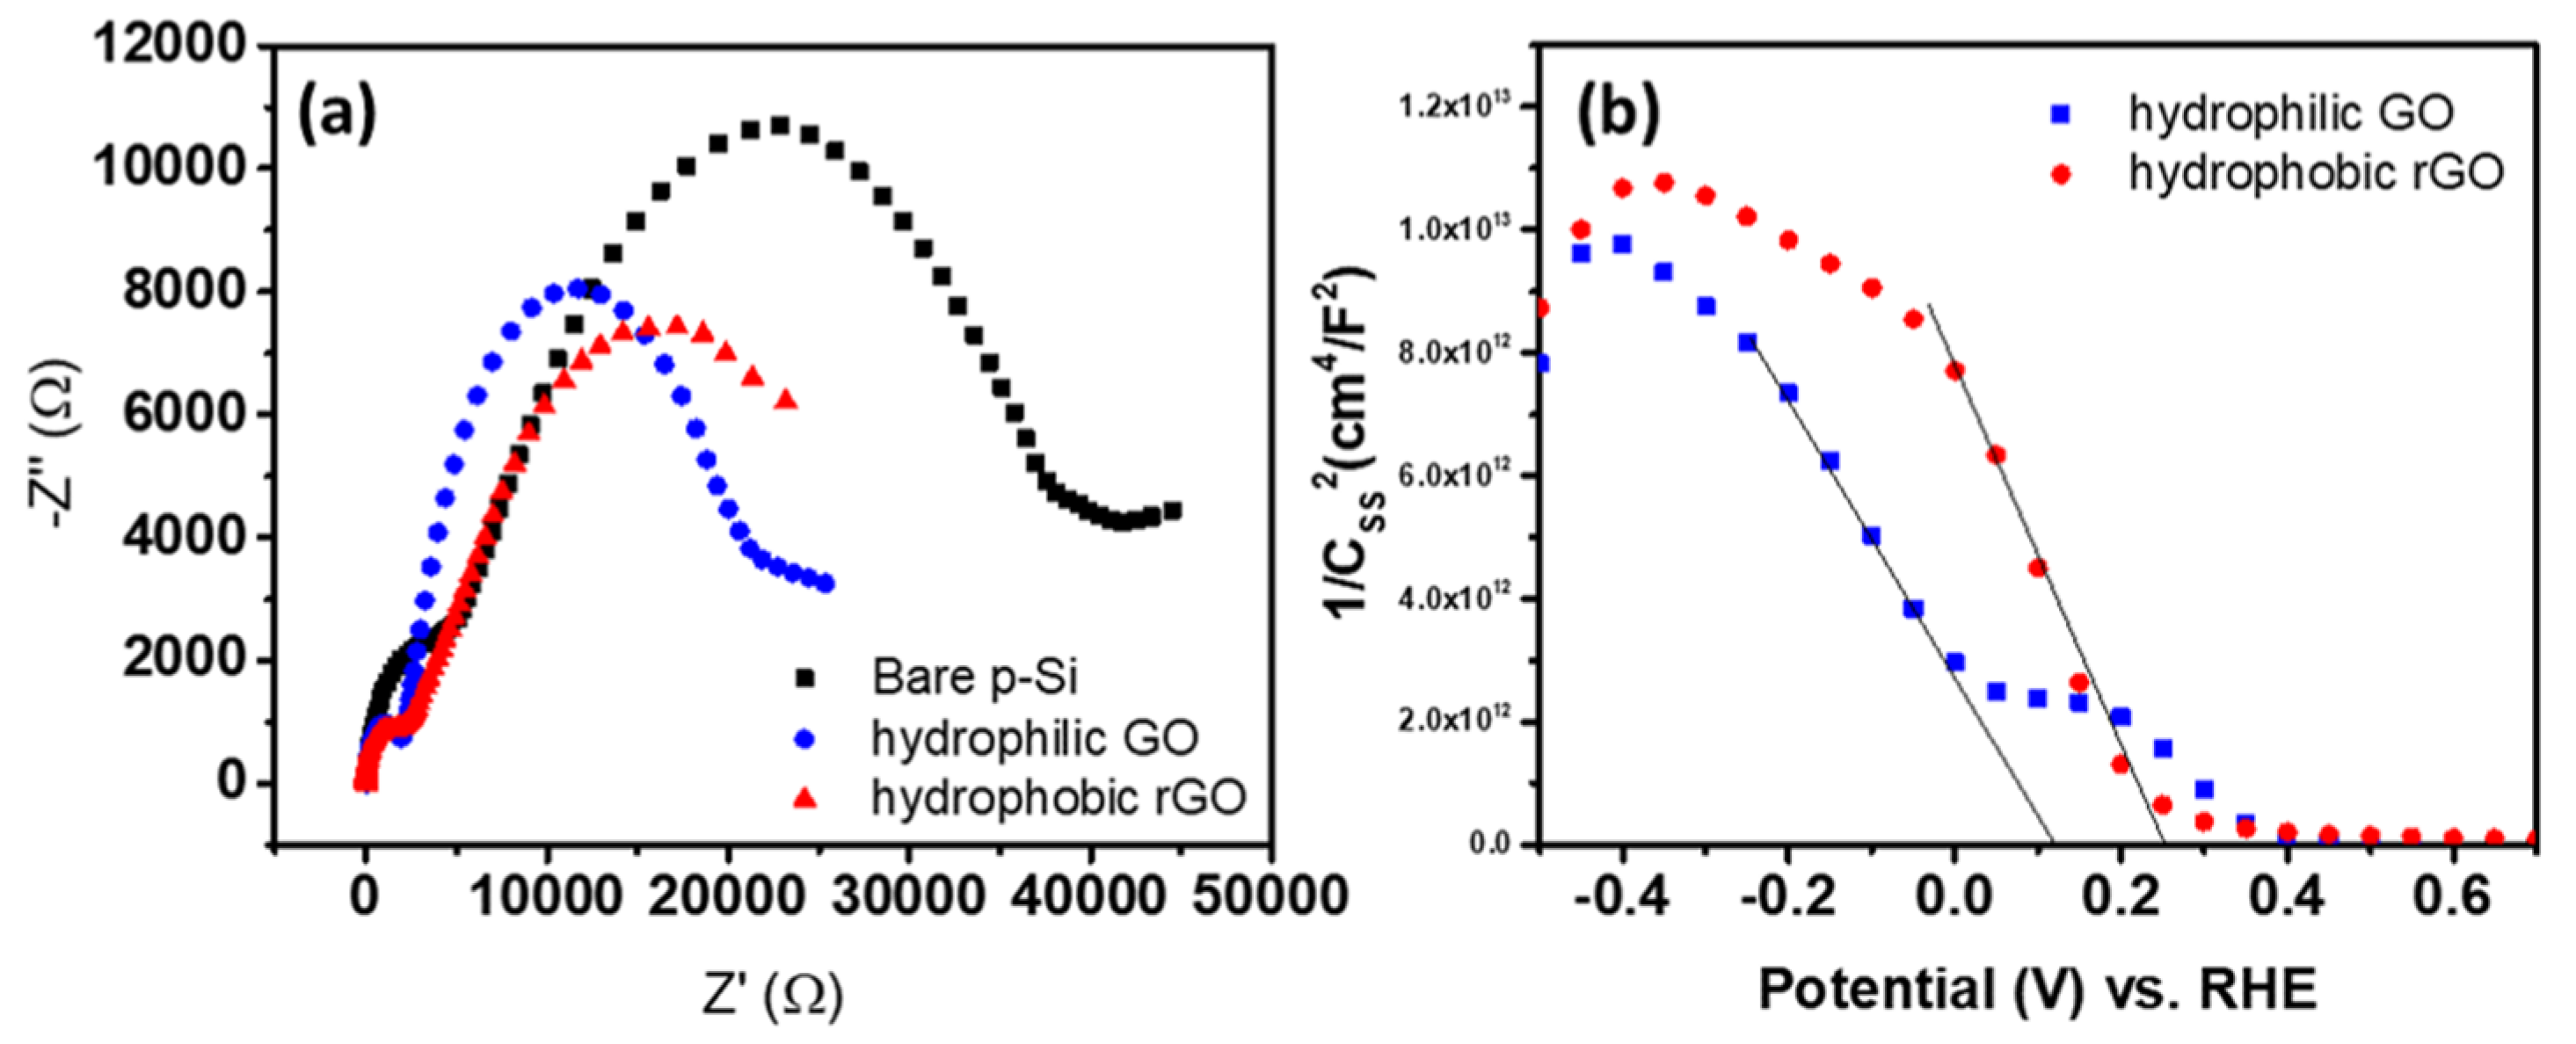
| Sample | Roverall (Ω cm2) | R2 (Ω cm2) | C2 (F/cm2) | R1 (Ω cm2) | C1 (F/cm2) | Error on the Fitting Data |
|---|---|---|---|---|---|---|
| Bare p-Si | 23.05 | 7169 | 6.221 × 10⁻⁸ | - | - | 0.2212 |
| Hydrophilic GO | 1.848 | 2108 | 6.762 × 10⁻⁷ | 1.809 × 10⁴ | 3.165 × 10⁻⁵ | 0.3561 |
| Hydrophobic rGO | 0.4963 | 2561 | 1.809 × 10⁻⁶ | 1.382 × 10⁴ | 1.229 × 10⁻⁴ | 0.105 |
© 2019 by the authors. Licensee MDPI, Basel, Switzerland. This article is an open access article distributed under the terms and conditions of the Creative Commons Attribution (CC BY) license (http://creativecommons.org/licenses/by/4.0/).
Share and Cite
Alam, K.; Sim, Y.; Yu, J.-H.; Gnanaprakasam, J.; Choi, H.; Chae, Y.; Sim, U.; Cho, H. In-situ Deposition of Graphene Oxide Catalyst for Efficient Photoelectrochemical Hydrogen Evolution Reaction Using Atmospheric Plasma. Materials 2020, 13, 12. https://doi.org/10.3390/ma13010012
Alam K, Sim Y, Yu J-H, Gnanaprakasam J, Choi H, Chae Y, Sim U, Cho H. In-situ Deposition of Graphene Oxide Catalyst for Efficient Photoelectrochemical Hydrogen Evolution Reaction Using Atmospheric Plasma. Materials. 2020; 13(1):12. https://doi.org/10.3390/ma13010012
Chicago/Turabian StyleAlam, Khurshed, Yelyn Sim, Ji-Hun Yu, Janani Gnanaprakasam, Hyeonuk Choi, Yujin Chae, Uk Sim, and Hoonsung Cho. 2020. "In-situ Deposition of Graphene Oxide Catalyst for Efficient Photoelectrochemical Hydrogen Evolution Reaction Using Atmospheric Plasma" Materials 13, no. 1: 12. https://doi.org/10.3390/ma13010012