
Metabolomics Analysis of Amniotic Fluid in Euploid Foetuses with Thickened Nuchal Translucency by Gas Chromatography-Mass Spectrometry

 ,
, 
Abstract
:1. Introduction
2. Patients and Methods
2.1. Patients
2.2. Sample Preparation and Data Analysis
2.3. Statistical Analysis
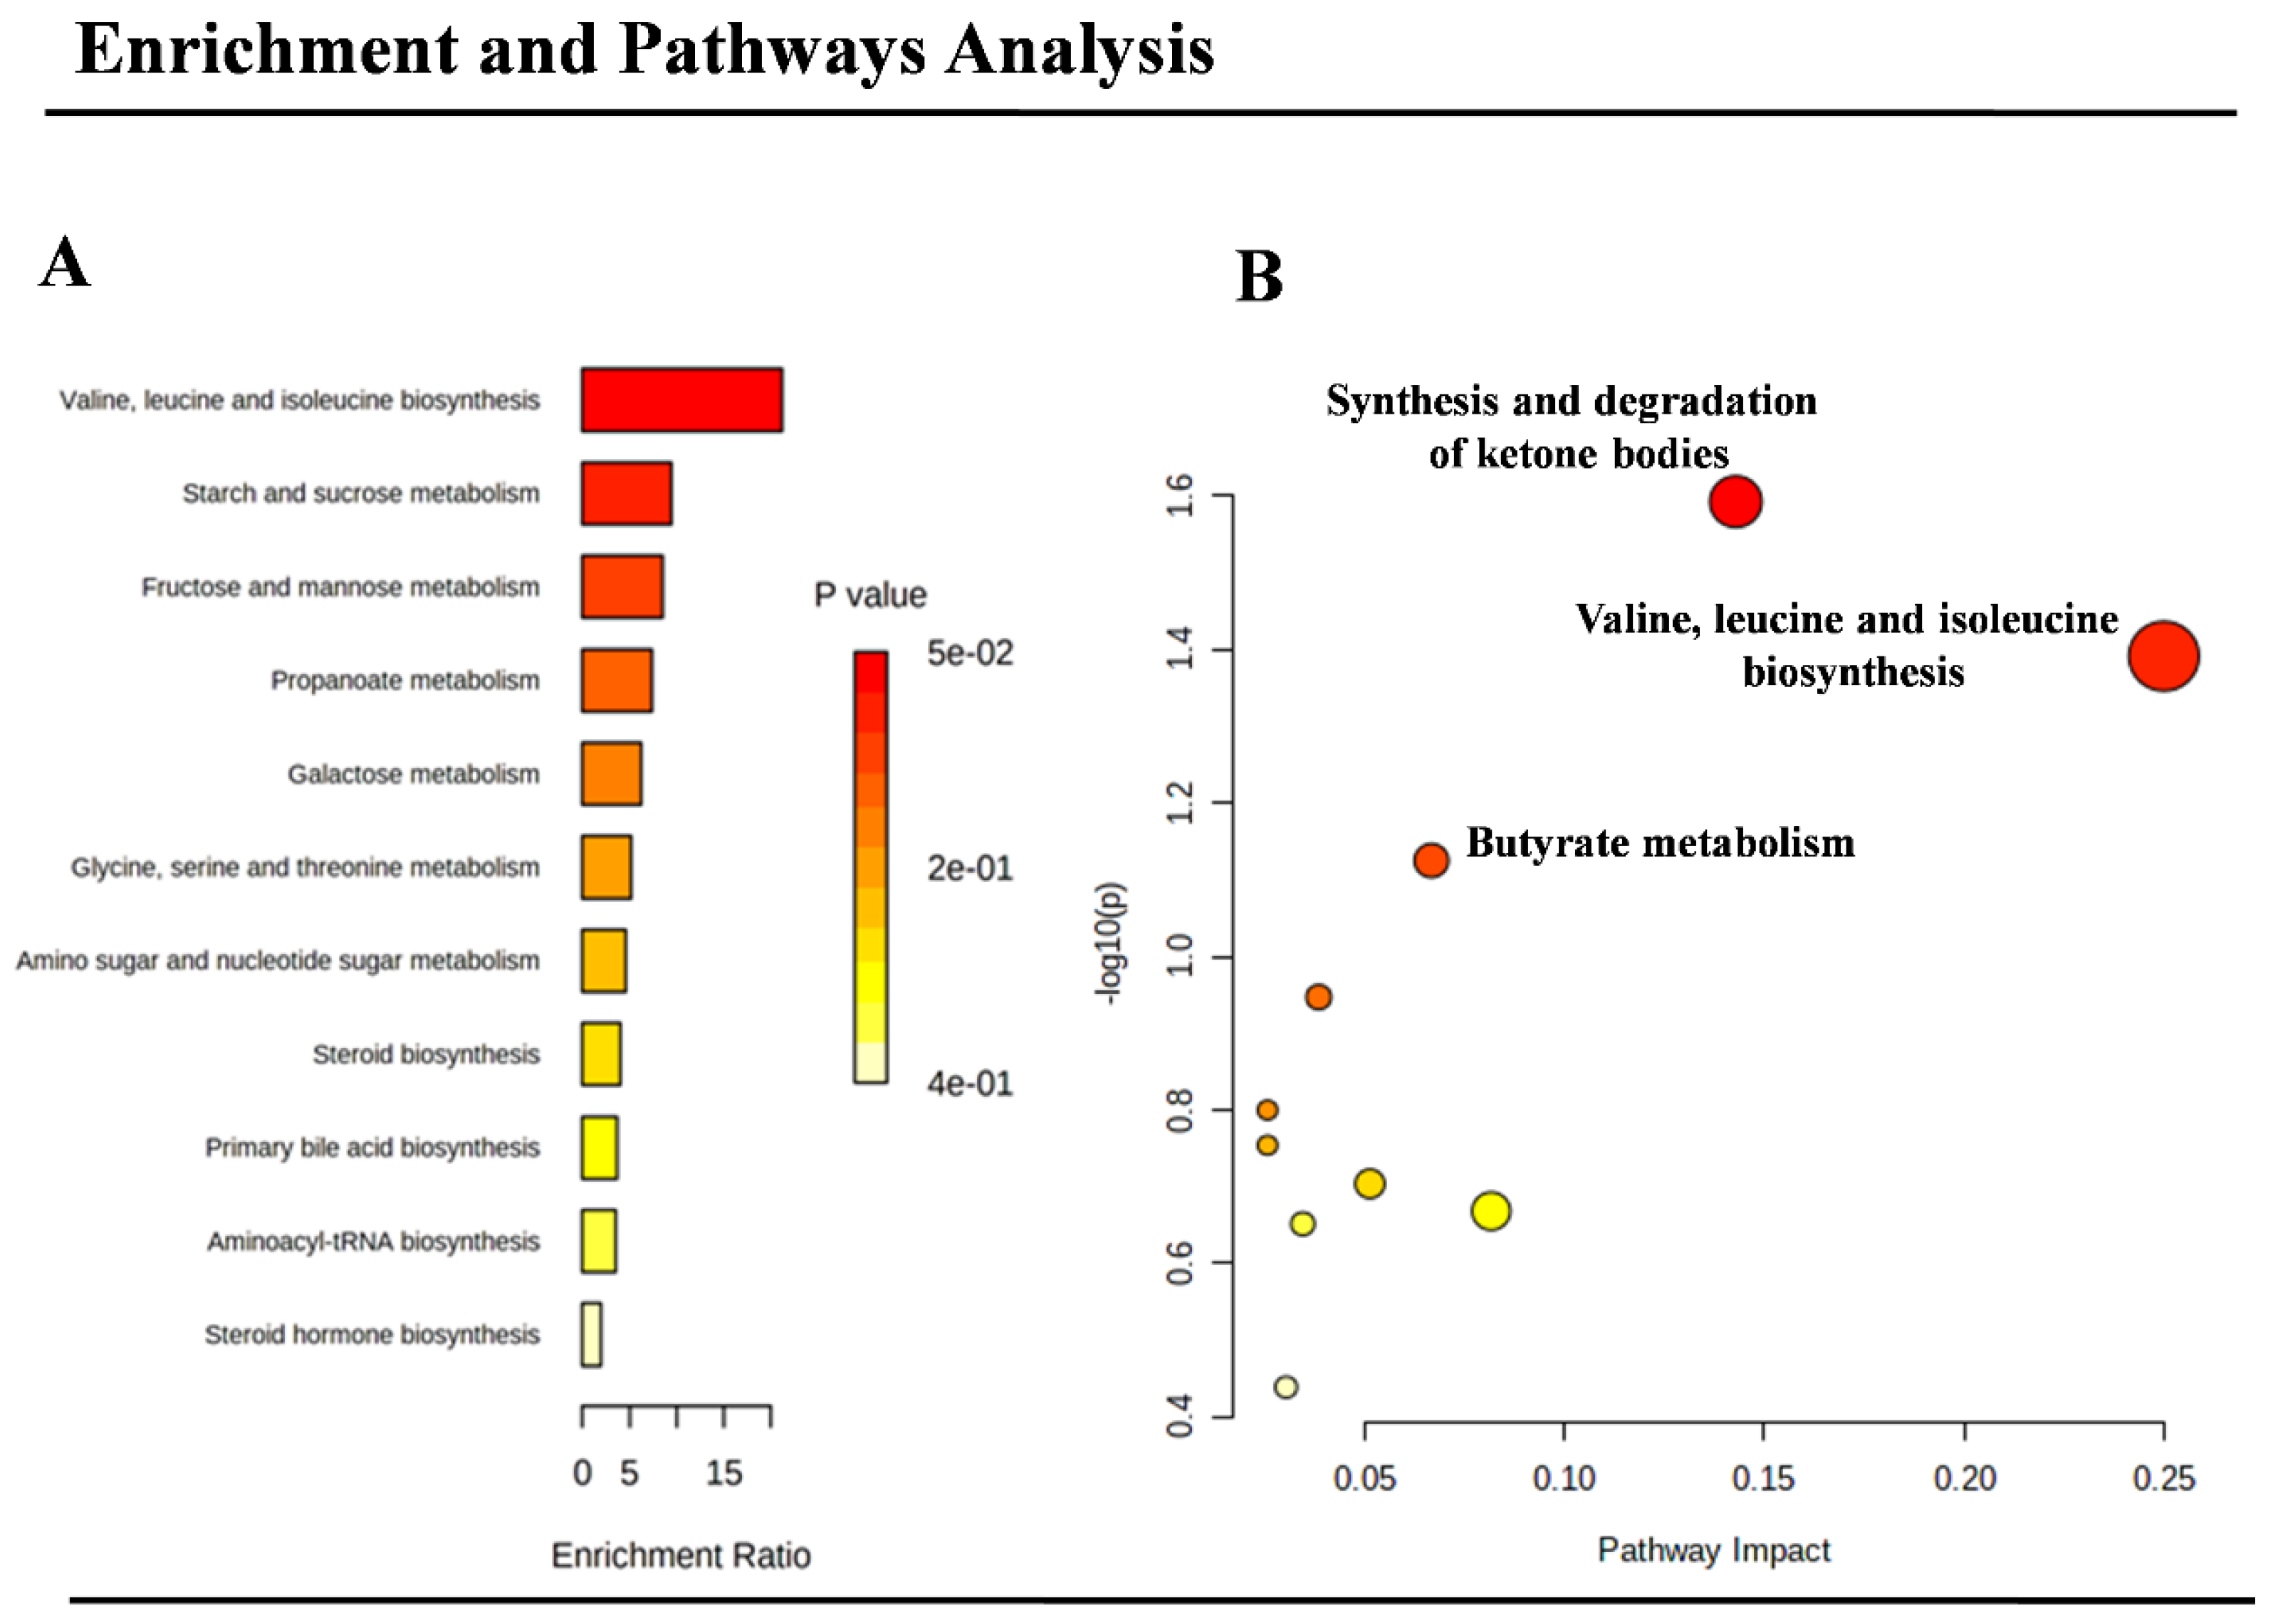
2.4. Pathways’ Analysis
3. Results
4. Discussion
5. Conclusions
Supplementary Materials
Author Contributions
Funding
Institutional Review Board Statement
Informed Consent Statement
Data Availability Statement
Conflicts of Interest
References
- Ferguson-Smith, M.A.; Bianchi, D.W. Prenatal Diagnosis: Past, present, and future. Prenat. Diagn. 2010, 30, 601–604. [Google Scholar] [CrossRef] [PubMed]
- Norton, M.E.; Kuller, J.A.; Dugoff, L. Perinatal Genetics; Elsevier Health Science: Amsterdam, The Netherlands, 2019; p. 207. [Google Scholar]
- Norton, M.E.; Jacobsson, B.; Swamy, G.K.; Laurent, L.C.; Ranzini, A.C.; Brar, H.; Tomlinson, M.K.; Pereira, L.; Spitz, J.L.; Hollemon, D.; et al. Cell-free DNA Analysis for Noninvasive Examination of Trisomy. N. Engl. J. Med. 2015, 372, 1589–1597. [Google Scholar] [CrossRef] [PubMed] [Green Version]
- Monni, G.; Zoppi, M.A.; Iuculano, A.; Piras, A.; Arras, M. Invasive or non-invasive prenatal genetic diagnosis? J. Perinat. Med. 2014, 42, 545–548. [Google Scholar] [CrossRef] [PubMed]
- Levy, B.; Stosic, M. Traditional Prenatal Diagnosis: Past to Present. In Prenatal Diagnosis; Levy, B., Ed.; Springer: New York, NY, USA, 2019; pp. 3–22. [Google Scholar]
- Nicolaides, K.H.; Brizot, M.L.; Snijders, R.J.M. Fetal nuchal translucency: Ultrasound screening for fetal trisomy in the first trimester of pregnancy. BJOG Int. J. Obstet. Gynaecol. 1994, 101, 782–786. [Google Scholar] [CrossRef] [PubMed]
- Nafziger, E.; Vilensky, J.A. The anatomy of nuchal translucency at 10–14 weeks gestation in fetuses with trisomy 21: An incredible medical mystery. Clin. Anat. 2014, 27, 353–359. [Google Scholar] [CrossRef]
- Zoppi, M.A.; Ibba, R.M.; Floris, M.; Manca, F.; Axiana, C.; Monni, G. Changes in nuchal translucency thickness in normal and abnormal karyotype fetuses. BJOG Int. J. Obstet. Gynaecol. 2003, 110, 584–588. [Google Scholar] [CrossRef]
- Kagan, K.O.; Wright, D.; Spencer, K.; Molina, F.S.; Nicolaides, K.H. First-trimester screening for trisomy 21 by free beta-human chorionic gonadotropin and pregnancy-associated plasma protein-A: Impact of maternal and pregnancy characteristics. Ultrasound Obstet. Gynecol. 2008, 31, 493–502. [Google Scholar] [CrossRef] [PubMed]
- Souka, A.P.; Von Kaisenberg, C.S.; Hyett, J.A.; Sonek, J.D.; Nicolaides, K.H. Increased nuchal translucency with normal karyotype. Am. J. Obstet. Gynecol. 2005, 192, 1005–1021. [Google Scholar] [CrossRef]
- Syngelaki, A.; Hammami, A.; Bower, S.; Zidere, V.; Akolekar, R.; Nicolaides, K.H. Diagnosis of fetal non-chromosomal abnormalities on routine ultrasound examination at 11–13 weeks’ gestation. Ultrasound Obstet. Gynecol. 2019, 54, 468–476. [Google Scholar] [CrossRef] [PubMed] [Green Version]
- Monni, G.; Atzori, L.; Corda, V.; Dessolis, F.; Iuculano, A.; Hurt, K.J.; Murgia, F. Metabolomics in prenatal medicine: A review. Front. Med. (Lausanne) 2021, 8, 645118. [Google Scholar] [CrossRef]
- Orczyk-Pawilowicz, M.; Jawien, E.; Deja, S.; Hirnle, L.; Zabek, A.; Mlynarz, P. Metabolomics of Human Amniotic Fluid and Maternal Plasma during Normal Pregnancy. PLoS ONE 2016, 11, e0152740. [Google Scholar] [CrossRef] [Green Version]
- Monni, G.; Murgia, F.; Corda, V.; Peddes, C.; Iuculano, A.; Tronci, L.; Balsamo, A.; Atzori, L. Metabolomic Investigation of β-Thalassemia in Chorionic Villi Samples. J. Clin. Med. 2019, 8, 798. [Google Scholar] [CrossRef] [Green Version]
- Murgia, F.; Iuculano, A.; Peddes, C.; Santoru, M.L.; Tronci, L.; Deiana, M.; Atzori, L.; Monni, G. Metabolic fingerprinting of chorionic villous samples in normal pregnancy and chromosomal disorders. Prenat. Diagn. 2019, 39, 848–858. [Google Scholar] [CrossRef]
- Menon, R.; Jones, J.; Gunst, P.R.; Kacerovsky, M.; Fortunato, S.J.; Saade, G.R.; Basraon, S. Amniotic Fluid Metabolomic Analysis in Spontaneous Preterm Birth. Reprod. Sci. 2014, 21, 791–803. [Google Scholar] [CrossRef]
- Iuculano, A.; Murgia, F.; Peddes, C.; Santoru, M.L.; Tronci, L.; Deiana, M.; Balsamo, A.; Euser, A.; Atzori, L.; Monni, G. Metabolic characterization of amniotic fluids of fetuses with enlarged nuchal translucency. J. Perinat. Med. 2019, 47, 311–318. [Google Scholar] [CrossRef]
- Dettmer, K.; Aronov, P.A.; Hammock, B.D. Mass spectrometry-based metabolomics. Mass Spectrom. Rev. 2007, 26, 51–78. [Google Scholar] [CrossRef]
- Fiehn, O. Metabolomics by Gas Chromatography—Mass Spectrometry: Combined Targeted and Untargeted Profiling. Curr. Protoc. Mol. Biol. 2016, 114, 30.4.1–30.4.32. [Google Scholar] [CrossRef] [PubMed]
- Ellis, D.I.; Dunn, W.B.; Griffin, J.L.; Allwood, J.W.; Goodacre, R. Metabolic fingerprinting as a diagnostic tool. Pharmacogenomics 2007, 8, 1243–1266. [Google Scholar] [CrossRef] [PubMed] [Green Version]
- Poddighe, S.; Murgia, F.; Lorefice, L.; Liggi, S.; Cocco, E.; Marrosu, M.G.; Atzori, L. Metabolomic analysis identifies altered metabolic pathways in Multiple Sclerosis. Int. J. Biochem. Cell Biol. 2017, 93, 148–155. [Google Scholar] [CrossRef] [PubMed]
- Weckwerth, W.; Morgenthal, K. Metabolomics: From pattern recognition to biological interpretation. Drug Discov. Today 2005, 10, 1551–1558. [Google Scholar] [CrossRef]
- Julious, S.A. Sample size of 12 per group rule of thumb for a pilot study. Pharmaceut. Stat. 2005, 4, 287–291. [Google Scholar] [CrossRef]
- Murgia, F.; Atzori, L.; Carboni, E.; Santoru, M.L.; Hendren, A.; Pisanu, A.; Caboni, P.; Boi, L.; Fusco, G.; Carta, A.R. Metabolomics Fingerprint Induced by the Intranigral Inoculation of Exogenous Human Alpha-Synuclein Oligomers in a Rat Model of Parkinson’s Disease. Int. J. Mol. Sci. 2020, 21, 6745. [Google Scholar] [CrossRef]
- Eriksson, L.; Byrne, T.; Johansson, E.; Trygg, J.; Vikström, C. Multi- and Megavariate Data Analysis Basic Principles and Applications. Umetrics Acad. 2013, 1, 509. [Google Scholar]
- Trygg, J.; Holmes, E.; Lundstedt, T. Chemometrics in metabonomics. J. Proteome Res. 2007, 6, 469–479. [Google Scholar] [CrossRef] [PubMed]
- Lindgren, F.; Hansen, B.; Karcher, W.; Sjöström, M.; Eriksson, L. Model validation by permutation tests: Applications to variable selection. J. Chemom. 1996, 10, 521–532. [Google Scholar] [CrossRef]
- Wold, S.; Sjöström, M.; Eriksson, L. PLS-regression: A basic tool of chemometrics. Chemom. Intell. Lab. Syst. 2001, 58, 109–130. [Google Scholar] [CrossRef]
- Chong, J.; Wishart, D.S.; Xia, J. Using MetaboAnalyst 4.0 for Comprehensive and Integrative Metabolomics Data Analysis. Curr. Protoc. Bioinform. 2019, 68, e86. [Google Scholar] [CrossRef]
- Zhang, A.; Sun, H.; Yan, G.; Wang, P.; Wang, X. Metabolomics for Biomarker Discovery: Moving to the Clinic. BioMed Res. Int. 2015, 2015, 354671. [Google Scholar] [CrossRef]
- Cohn, B.R.; Joe, B.N.; Zhao, S.; Kornak, J.; Zhang, V.Y.; Iman, R.; Kurhanewicz, J.; Vahidi, K.; Yu, J.; Caughey, A.B.; et al. Quantitative metabolic profiles of 2nd and 3rd trimester human amniotic fluid using (1) H HR-MAS spectroscopy. MAGMA 2009, 22, 343–352. [Google Scholar] [CrossRef] [Green Version]
- Graca, G.; Duarte, I.F.; Barros, A.S.; Goodfellow, B.J.; Diaz, S.D.O.; Pinto, J.I.M.; Carreira, I.M.; Galhano, E.; Pita, C.; Gil, A.M. Impact of prenatal disorders on the metabolic profile of second trimester amniotic fluid: A nuclear magnetic resonance metabonomic study. J. Proteome Res. 2010, 9, 6016–6024. [Google Scholar] [CrossRef]
- Graça, G.; Goodfellow, B.J.; Barros, A.S.; Diaz, S.; Duarte, I.F.; Spagou, K.; Veselkov, K.; Want, E.J.; Lindon, J.C.; Carreira, I.M.; et al. UPLC-MS metabolic profiling of second trimester amniotic fluid and maternal urine and comparison with NMR spectral profiling for the identification of pregnancy disorder biomarkers. Mol. Biosyst. 2012, 8, 1243–1254. [Google Scholar] [CrossRef] [PubMed]
- Puchalska, P.; Crawford, P.A. Multi-dimensional Roles of Ketone Bodies in Fuel Metabolism, Signaling, and Therapeutics. Cell Metab. 2017, 25, 262–284. [Google Scholar] [CrossRef] [PubMed] [Green Version]
- Zeng, Z.; Liu, F.; Li, S. Metabolic Adaptations in Pregnancy: A Review. Ann. Nutr. Metab. 2017, 70, 59–65. [Google Scholar] [CrossRef]
- Frise, C.J.; Mackillop, L.; Joash, K.; Williamson, C. Starvation ketoacidosis in pregnancy. Eur. J. Obstet. Gynecol. Reprod. Biol. 2013, 167, 1–7. [Google Scholar] [CrossRef]
- Alonso de la Torre, S.R.; Serrano, M.A.; Medina, J.M. Carrier-mediated beta-D-hydroxybutyrate transport in brush-border membrane vesicles from rat placenta. Pediatr. Res. 1992, 32, 317–323. [Google Scholar] [CrossRef] [Green Version]
- Ville, D.; Chiron, C.; Laschet, J.; Dulac, O. The ketogenic diet can be used successfully in combination with corticosteroids for epileptic encephalopathies. Epilepsy Behav. 2015, 48, 61–65. [Google Scholar] [CrossRef]
- Tatone, E.H.; Duffield, T.F.; Capel, M.B.; DeVries, T.J.; LeBlanc, S.J.; Gordon, J.L. A randomized controlled trial of dexamethasone as an adjunctive therapy to propylene glycol for treatment of hyperketonemia in postpartum dairy cattle. J. Dairy Sci. 2016, 99, 8991–9000. [Google Scholar] [CrossRef] [Green Version]
- Dietschy, J.M.; Turley, S.D.; Spady, D.K. Role of liver in the maintenance of cholesterol and low density lipoprotein homeostasis in different animal species, including humans. J. Lipid Res. 1993, 34, 1637–1659. [Google Scholar] [CrossRef]
- Herrera, E. Lipid metabolism in pregnancy and its consequences in the fetus and newborn. Endocrine 2002, 19, 43–55. [Google Scholar] [CrossRef]
- Woollett, L.A.; Heubi, J.E. Fetal and Neonatal Cholesterol Metabolism; Feingold, K.R., Anawalt, B., Boyce, A., Chrousos, V., de Herder, W.W., Dhatariya, K., Dungan, K., Ashley Grossman, A., Hershman, J.M., Hofland, V., et al., Eds.; Endotext [Internet]; MDText.com, Inc.: South Dartmouth, MA, USA, 2000. [Google Scholar]
- Cetin, I.; Marconi, A.M.; Corbetta, C.; Lanfranchi, A.; Baggiani, A.; Battaglia, F.; Pardi, G. Fetal amino acids in normal pregnancies and in pregnancies complicated by intrauterine growth retardation. Early Hum. Dev. 1992, 29, 183–186. [Google Scholar] [CrossRef]
- Jansson, T. Amino acid transporters in the human placenta. Pediatr. Res. 2001, 49, 141–147. [Google Scholar] [CrossRef] [Green Version]
- Cetin, I.; Marconi, A.M.; Bozzetti, P.; Sereni, L.P.; Corbetta, C.; Pardi, G.; Battaglia, F.C. Umbilical amino-acid concentrations in appropriate and small for gestational-age infants: A biochemical difference present in utero. Am. J. Obstet. Gynecol. 1988, 158, 120–126. [Google Scholar] [CrossRef]
- Pantham, P.; Rosario, F.J.; Weintraub, S.T.; Nathanielsz, P.; Powell, T.; Li, C.; Jansson, T. Down-Regulation of Placental Transport of Amino Acids Precedes the Development of Intrauterine Growth Restriction in Maternal Nutrient Restricted Baboons. Biol. Reprod. 2016, 95, 98. [Google Scholar] [CrossRef]
- Paolini, C.L.; Marconi, A.M.; Ronzoni, S.; Di Noio, M.; Fennessey, P.V.; Pardi, G.; Battaglia, F.C. Placental transport of leucine, phenylalanine, glycine, and proline in intrauterine growth-restricted pregnancies. J. Clin. Endocrinol. Metab. 2001, 86, 5427–5432. [Google Scholar] [CrossRef] [PubMed]
- Lisonkova, S.; Joseph, K.S. Incidence of preeclampsia: Risk factors and outcomes associated with early- versus late-onset disease. Am. J. Obstet. Gynecol. 2013, 209, 544.e1–544.e12. [Google Scholar] [CrossRef]
- Mahendran, D.; Donnai, P.; Glazier, J.D.; D’Souza, S.W.; Boyd, R.D.; Sibley, C.P. Amino acid (system A) transporter activity in microvillous membrane vesicles from the placentas of appropriate and small for gestational age babies. Pediatr. Res. 1993, 34, 661–665. [Google Scholar] [CrossRef] [Green Version]
- Jansson, T.; Scholtbach, V.; Powell, T.L. Placental transport of leucine and lysine is reduced in intrauterine growth restriction. Pediatr. Res. 1998, 44, 532–537. [Google Scholar] [CrossRef] [Green Version]
- Wishart, D.S.; Jewison, T.; Guo, A.C.; Wilson, M.; Knox, C.; Liu, Y.; Djoumbou, Y.; Mandal, R.; Aziat, F.; Dong, E.; et al. HMDB 3.0—The Human Metabolome Database in 2013. Nucleic Acids Res. 2013, 41, D801–D807. [Google Scholar] [CrossRef] [PubMed]
- Bahado-Singh, R.O.; Syngelaki, A.; Mandal, R.; Graham, S.F.; Akolekar, R.; Han, B.; Bjondahl, T.C.; Dong, E.; Bauer, S.; Alpay-Savasan, Z.; et al. Metabolomic determination of pathogenesis of late-onset preeclampsia. J. Matern.-Fetal Neonatal Med. 2017, 30, 658–664. [Google Scholar] [CrossRef] [PubMed]
- Battaglia, F.C.; Regnault, T.R.H. Placental Transport and Metabolism of Amino Acids. Placenta 2001, 22, 145–161. [Google Scholar] [CrossRef]
- Cetin, I. Amino acid interconversions in the fetal-placental unit: The animal model and human studies in vivo. Pediatr. Res. 2001, 49, 148–154. [Google Scholar] [CrossRef] [PubMed] [Green Version]


| Classes | N | Age (Range) | Ultrasound | Biochemical Assay | ||
|---|---|---|---|---|---|---|
| NT ± SD (mm) | CRL± SD (mm) | PAPP-A MoM ± SD (UI/L) | Free β-hCG MoM ± SD (mlU/mL) | |||
| Controls | 27 | 35.1 (23–44) | 1.41 ± 0.17 | 54.4 ± 4.3 | 0.77 ± 0.28 | 1.43 ± 1 |
| Enlarge Nuchal Translucency | 12 | 37.2 (29–44) | 2.5 ± 0.3 | 62.1 ± 7.5 | 0.97 ± 0.47 | 1.93 ± 1.7 |
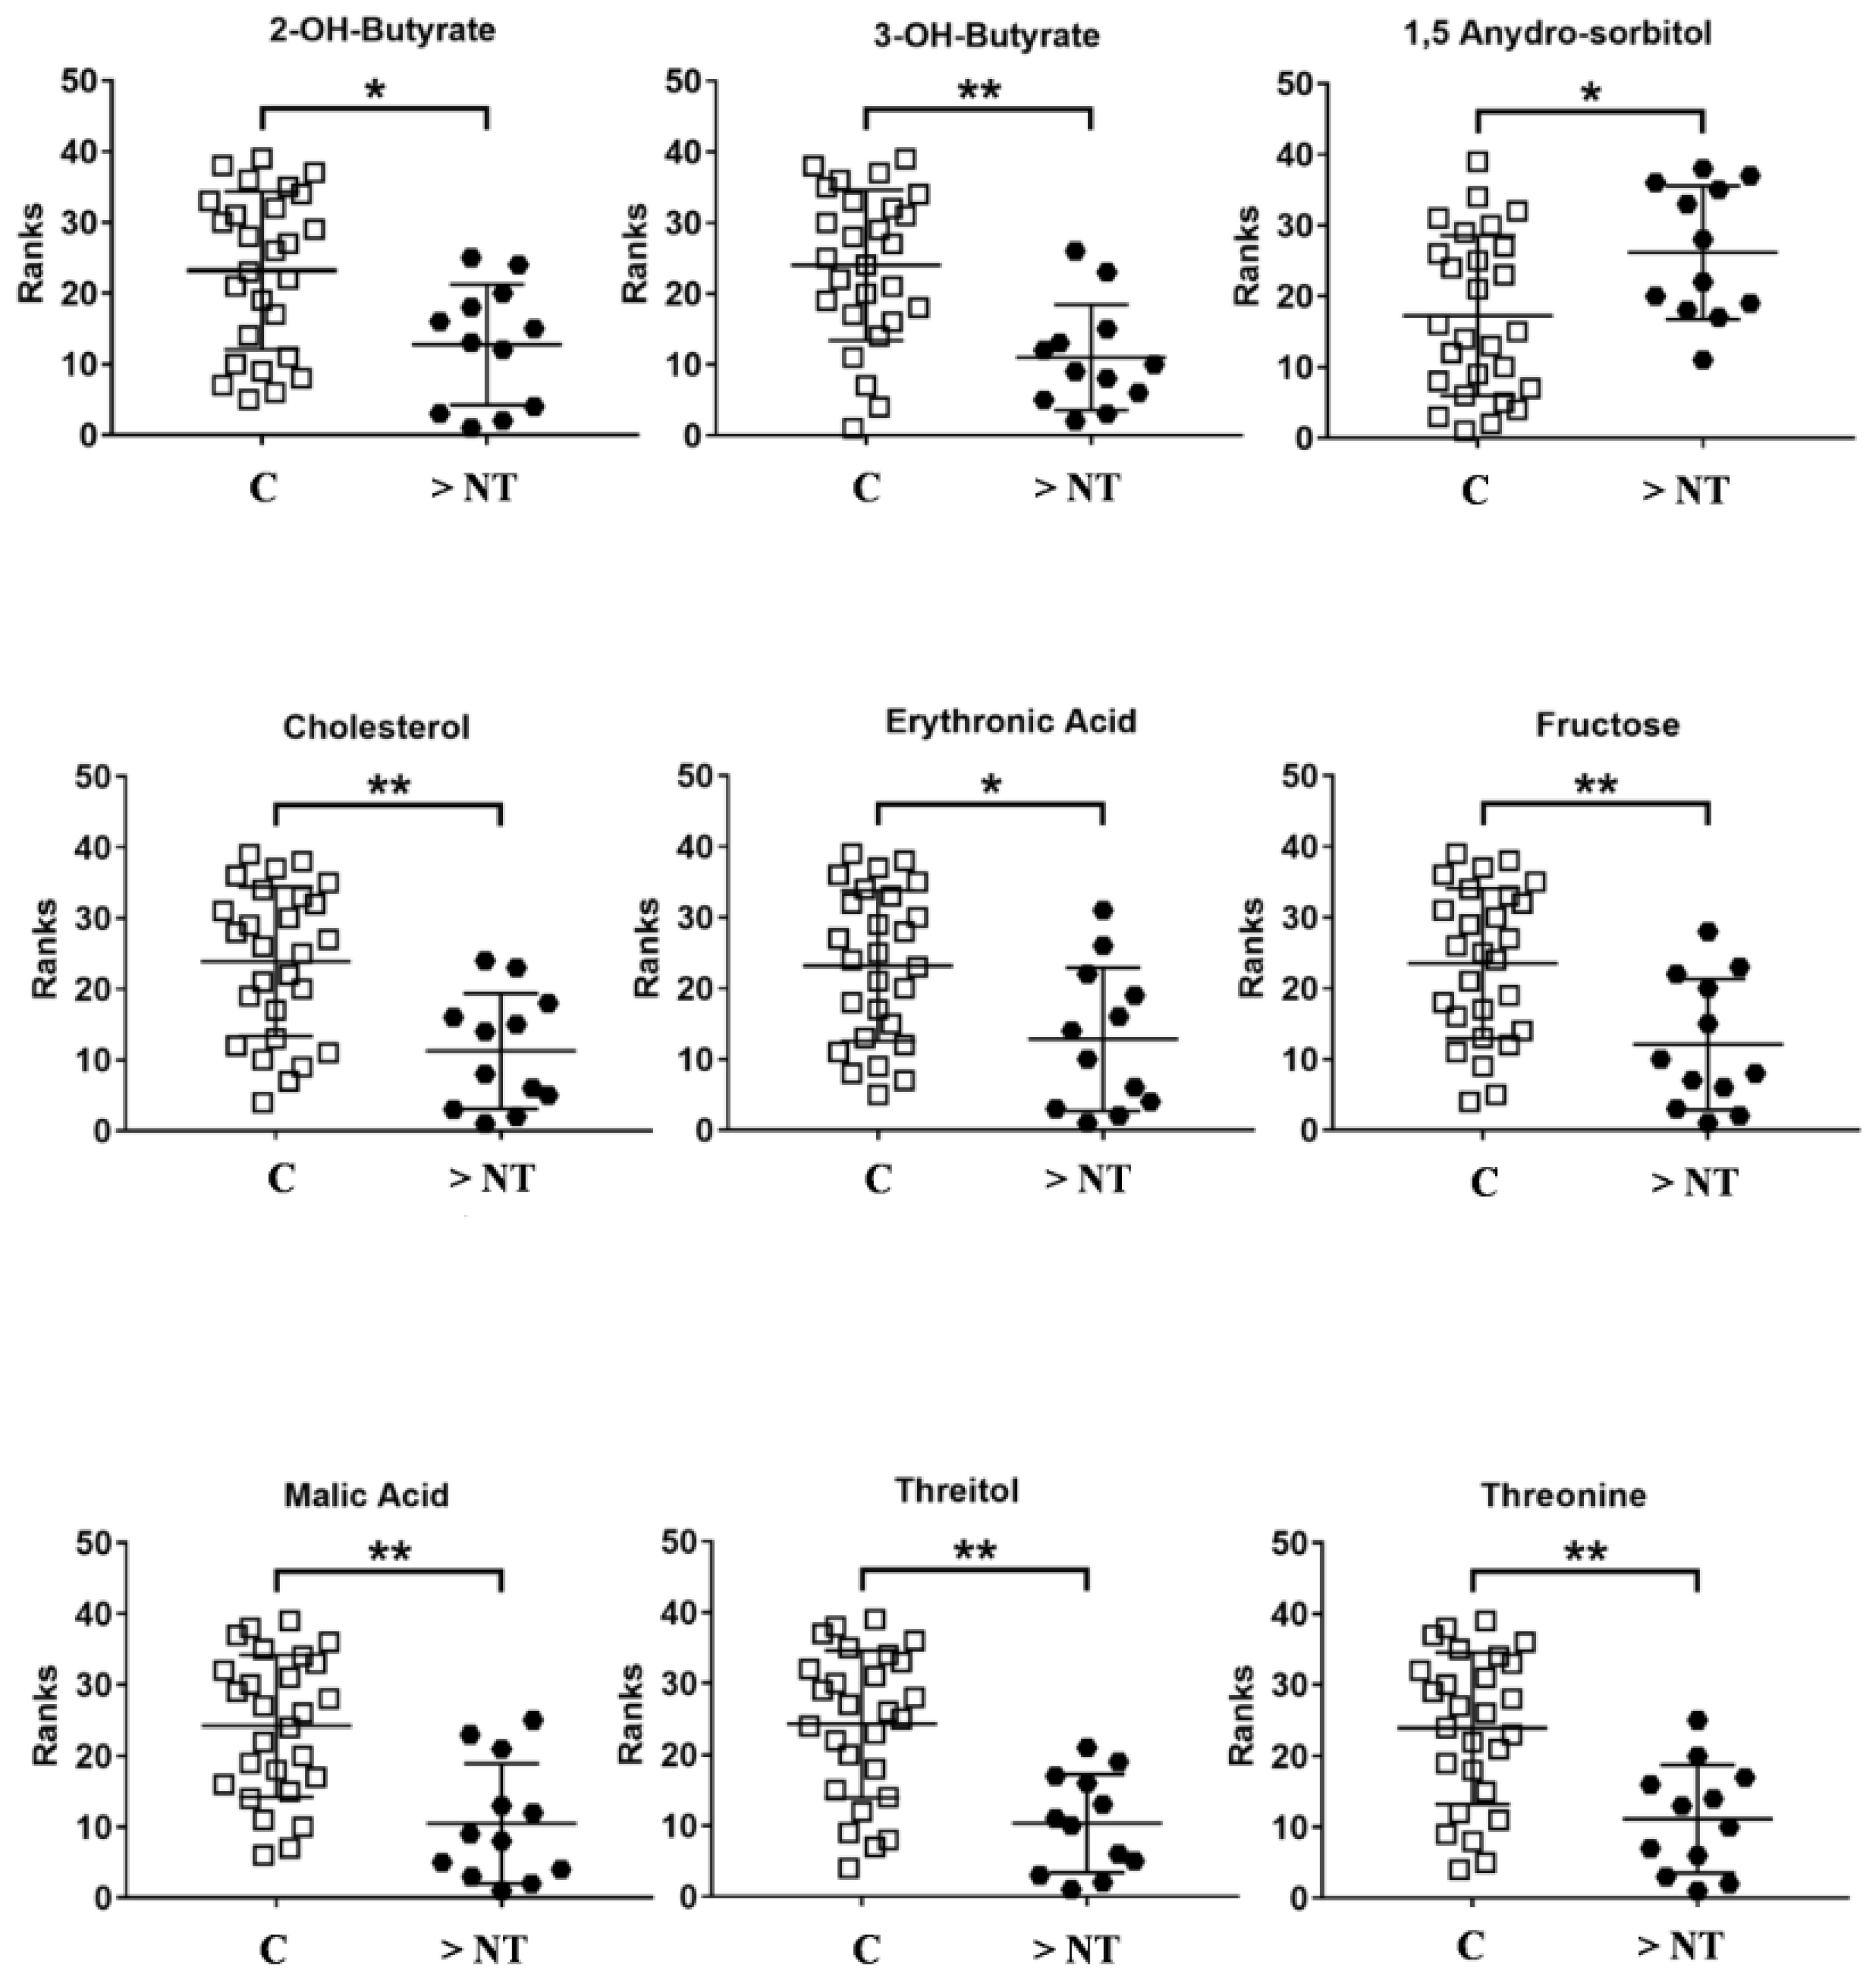
| Metabolites | Trend >NT vs. C | p-Value | Corrected p-Value | ROC Curve | |||
|---|---|---|---|---|---|---|---|
| Area | Std. Error | Confidence Interval | p-Value | ||||
| 2-OH-Butyrate | ↓ | 0.007 | 0.02 | 0.77 | 0.07 | 0.62–0.92 | 0.008 |
| 3-OH-Butyrate | ↓ | 0.0006 | 0.004 | 0.83 | 0.06 | 0.7–0.96 | 0.001 |
| 1,5 Anydro Sorbitol | ↑ | 0.02 | 0.03 | 0.73 | 0.08 | 0.56–0.90 | 0.02 |
| Cholesterol | ↓ | 0.0009 | 0.004 | 0.82 | 0.06 | 0.7–0.95 | 0.001 |
| Erithronic acid | ↓ | 0.007 | 0.02 | 0.76 | 0.08 | 0.6–0.9 | 0.008 |
| Fructose | ↓ | 0.003 | 0.01 | 0.79 | 0.07 | 0.65–0.94 | 0.003 |
| Malic Acid | ↓ | 0.0003 | 0.001 | 0.85 | 0.06 | 0.7–0.97 | 0.0005 |
| Threitol | ↓ | 0.0002 | 0.001 | 0.86 | 0.05 | 0.74–0.97 | 0.0004 |
| Threonine | ↓ | 0.0008 | 0.004 | 0.83 | 0.06 | 0.7–0.95 | 0.001 |
Publisher’s Note: MDPI stays neutral with regard to jurisdictional claims in published maps and institutional affiliations. |
© 2021 by the authors. Licensee MDPI, Basel, Switzerland. This article is an open access article distributed under the terms and conditions of the Creative Commons Attribution (CC BY) license (https://creativecommons.org/licenses/by/4.0/).
Share and Cite
Murgia, F.; Monni, G.; Corda, V.; Hendren, A.J.; Paci, G.; Piras, A.; Ibba, R.M.; Atzori, L. Metabolomics Analysis of Amniotic Fluid in Euploid Foetuses with Thickened Nuchal Translucency by Gas Chromatography-Mass Spectrometry. Life 2021, 11, 913. https://doi.org/10.3390/life11090913
Murgia F, Monni G, Corda V, Hendren AJ, Paci G, Piras A, Ibba RM, Atzori L. Metabolomics Analysis of Amniotic Fluid in Euploid Foetuses with Thickened Nuchal Translucency by Gas Chromatography-Mass Spectrometry. Life. 2021; 11(9):913. https://doi.org/10.3390/life11090913
Chicago/Turabian StyleMurgia, Federica, Giovanni Monni, Valentina Corda, Aran J. Hendren, Giulia Paci, Alba Piras, Rosa M. Ibba, and Luigi Atzori. 2021. "Metabolomics Analysis of Amniotic Fluid in Euploid Foetuses with Thickened Nuchal Translucency by Gas Chromatography-Mass Spectrometry" Life 11, no. 9: 913. https://doi.org/10.3390/life11090913