Detection of City Integration Processes in Rapidly Urbanizing Areas Based on Remote Sensing Imagery


1
Department of Land, Environment, Agriculture and Forestry, University of Padova, 35020 Padova, Italy
2
School of Geographical Sciences and Remote Sensing, Guangzhou University, Guangzhou 510006, China
3
Southern Marine Science and Engineering Guangdong Laboratory, Guangzhou 511458, China
*
Author to whom correspondence should be addressed.
Land 2020, 9(10), 378; https://doi.org/10.3390/land9100378
Submission received: 17 September 2020
/
Revised: 5 October 2020
/
Accepted: 6 October 2020
/
Published: 8 October 2020
(This article belongs to the Special Issue Rural–Urban Gradients: Landscape and Nature Conservation)
Abstract
:Since China’s reform and development commenced, in the context of rapid urbanization and coordinated regional development, Chinese cities with a close geographic proximity and social ties have gradually formed an integrated city development model. As a new phenomenon in China’s urbanization process, existing research on China’s integrated cities mainly focuses on typical case studies, and most research has been limited to literature reviews and theoretical analyses. The growing application of remote sensing technology in urbanization research in recent years has provided new opportunities for the analysis of city integration. Therefore, based on multi-spectral Landsat-8 and nighttime light images (SNPP/VIIRS, Suomi National Polar-orbiting Platform/Visible Infrared Imaging Radiometer Suite), this paper selects four of the most representative integrated cities with different backgrounds in China to analyze the land-use conversion, plot light fluctuation, and light gravity center shift in the boundary zone between cities. The results show that (1) Guangfo has the highest level of integration and urban expansion is mainly concentrated in the south-central part of the boundary area; (2) Guanshen’s level of integration is second to Guangfo’s and is mainly concentrated in the west; (3) HuSu’s integration is still in the initial stage and its increase in light intensity lags behind the expansion of building land during the study period; (4) although the light intensity and building land area increased significantly during the study period in Xixian, the overall development level of Xixian still lagged behind coastal cities due to the restriction of its geographical location. Our application results expand the data sources for integrated city research and the obtained results can potentially support decision-making and planning in the process of urban development.
1. Introduction
Since China’s reform and opening up policies commenced in 1978, the country has experienced a rapid process of urbanization, with the urbanization rate rising from 17.9% in 1978 to 60.34% in 2020 [1]. Considering that there is still a gap between China’s current urbanization rate and the 80% of developed countries, it is foreseeable that China will continue to further promote the urbanization process in the next few decades. On the one hand, continuous and high-intensity urbanization has become the engine that drives China’s rapid economic growth, but on the other hand, problems such as over-concentration of population, tight urban land resources, and ecological environmental impacts that appear in the process of urbanization also constantly restrict and affect the sustainable development of cities [2,3,4]. In order to alleviate the pressure on urban land resources during the urbanization process, the original boundaries of the city are constantly expanding into surrounding areas to meet the growing demand for land. The expansion of urban built-up areas makes cities with adjacent geographic locations gradually form a regional synergistic development pattern, which is often referred to as city clusters, sister cities, and integrated cities in the urban structure.
The research on city integration originated from the “garden city” which was proposed in 1898 [5], and Geddes [6] further developed the concept of the collective city and urban area on this basis. In 1957, Gottman systematically detailed the new concept of “Megalopolis”, which opened up a whole new field of study in urban geography [7]. In 1991, T. G. McGee, after a long-term study of several Asian countries, proposed the concept of "Desakota", which is essentially coordinated and integrated development between urban and rural areas [8]. Corresponding to the theoretical research, the urban expansion boom that occurred in the developed countries in the 1980s gave birth to a number of lists of typically integrated cities, such as Minneapolis and St. Paul, San Francisco, Oakland and Berkeley, Dallas and Fort Worth, and Berlin and Brandenburg in Germany [9]. Meanwhile, the rapid development and practice of urban integration has stimulated research on urban integration, including multi-spatial scale analysis [10,11,12], dynamical mechanisms [13,14,15], spatial organization model analysis [16,17], and derivative urban-rural integration studies [18,19,20].
Compared with traditional developed countries, China’s continuous and rapid urbanization in the last two decades makes it an ideal experimental field for current research on urban integration. At present, research on China’s integrated cities mainly focuses on macro-level qualitative description and planning concepts, such as concept definitions [21], analysis of characteristics and mechanisms [22], development models [23], planning concepts, and countermeasure recommendations [24]; research based on spatial and temporal perspectives is still worth promoting in this context. With the rapid development of remote sensing technology, more and more scholars are applying remote sensing and spatial analysis methods to urbanization studies [25,26,27,28,29]. According to the data sources, remote sensing-based urbanization studies can be broadly divided into multi-spectral image-based analysis and nighttime light image-based analysis [30]. For multi-spectral image-based research, the topics are mostly focused on land classification [31], landcover dynamic changes [32], urban sprawl [33], etc. For nighttime light image-based research, the main focus areas include human settlements identification [34], electricity consumption spatialization [35], urbanization intensity quantification [36], etc. Therefore, by combining daytime and nighttime remote sensing images, it is possible to achieve long-time day and night monitoring of a target area as well as inversion of information on land changes and human activities, which can help to carry out studies such as urban boundary delineation [37], urban environmental assessment [38,39], and urban expansion [40,41]. Considering the timeliness, periodicity, and efficiency of remote sensing technology, this paper is based on a daytime-nighttime remote sensing data source and uses typical integrated cities in China as an example to carry out land surface change monitoring and vitality assessment in the border areas of cities.
2. Study Area and Date Source
2.1. Study Area
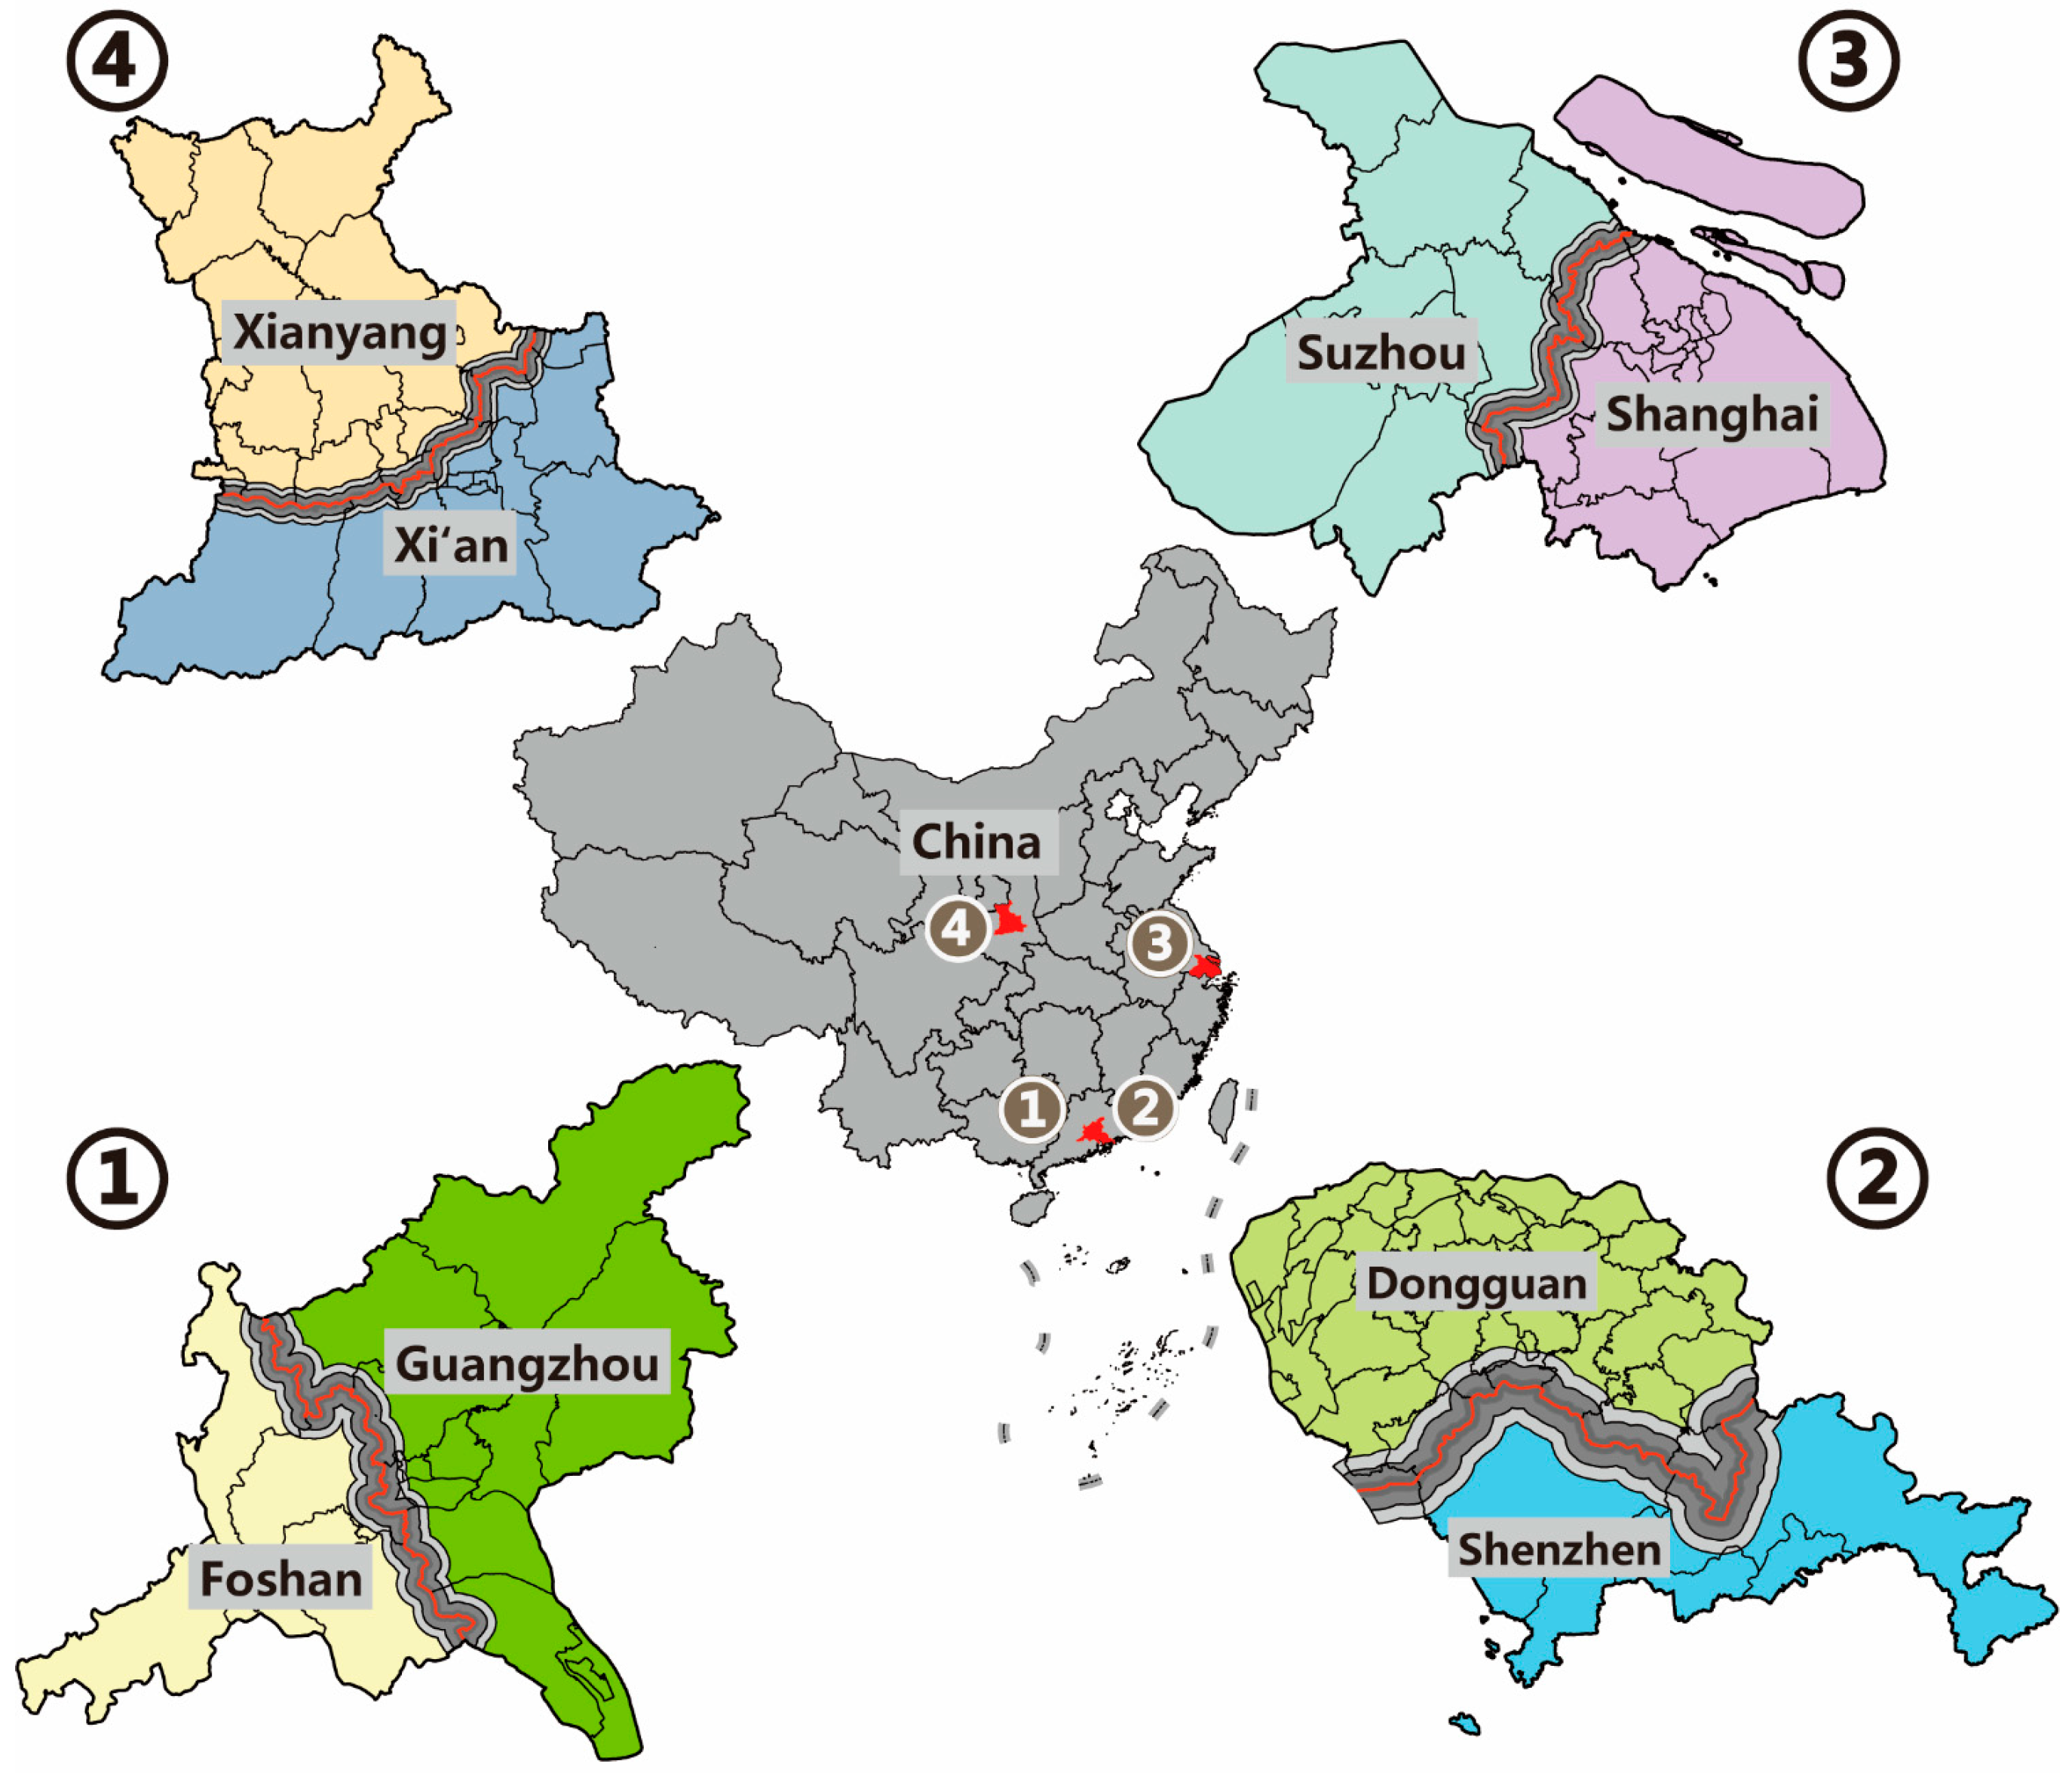
This study takes four of the most representative and well-known integrated cities in China as examples, including Guangfo (composed of Guangzhou and Foshan), Guanshen (composed of Dongguan and Shenzhen), Xixian (composed of Xi’an and Xianyang), and Husu (composed of Shanghai and Suzhou). Among them, Guangfo and Guanshen are located in the Pearl River Delta in southern China; Husu is located in the Yangtze River Delta in eastern China; finally, Xixian is located in the Guanzhong Plain, the hinterland of Northwest China (Figure 1).
With China’s increasing urbanization, these four groups of cities are experiencing rapid urban expansion (Table 1), and the economic, social, natural, and ecological ties between them are becoming close and developing towards city integration.
As a result of the process of integration of neighboring cities, the built-up areas between cities become interconnected and eventually develop into a whole part, also known as a megacity or urban agglomeration. Therefore, as the core area of the integration process, the boundary area of adjacent cities is an excellent window to observe this urban integration. As shown in Figure 1, we especially focus on the border area among the integrated cities, and construct 1 km, 3 km, and 5 km buffer zones at the borders of neighboring cities as the target areas for remote sensing monitoring analysis.
2.2. Data Source
In this paper, the dataset used in the integrated analysis mainly includes four types: nighttime light data, multi-spectral image data, high-resolution satellite street view data, and administrator boundary datasets.
Considering the scale of the study area, we selected the nighttime light data of the Suomi National Polar Orbiting Partnership/Visible Infrared Imaging Radiometer Suite (SNPP/VIIRS) image. As a new generation of nighttime light datasets, VIIRS has significantly improved spatial resolution and data quality compared to a Defense Meteorological Satellite Program/Operational Linescan System (DMSP/OLS). SNPP/VIIRS monthly average light data filter out the stray light, lightning, moonlight, and cloud cover, and the spatial resolution is around 500 m. Specifically, in this paper, the SNPP/VIIRS nighttime light data used was the monthly VIIRS Cloud Mask product (VCM) from April 2012 to May 2018, with a total of 74 images.
In addition, Landsat-8 multi-spectral images in 2013, 2015, and 2017 were used to monitor land cover change in the integrated city boundary zone. Since the spatial resolution of the Landsat-8 multi-spectral band is limited to 30 m, it cannot further support the requirements for the identification of typical features. Therefore, we used time-series high-resolution satellite image on the Google Earth platform to identify the typical plots within the boundary zone.
In addition, the administrative boundary data for the study area is from GADM Version 3.6 (https://gadm.org/). We combined the Open Street Map (OSM) data with partial corrections to ensure the accuracy of the study area boundaries.
3. Methods
3.1. Annual Nighttime Light Composite
As a means of reducing the interference of nighttime light fluctuations with the results, we synthesized annual nighttime light data based on monthly VCM data according to Equation (1), specifically:
where is an annual synthesis of VIIRS nighttime light images; is the month of images; is the nighttime light image of month ; is the selected month; is total number of selected months. It should be noted that due to the inevitable cloud cover in some months, the monthly images with abnormally low-value light radiation were excluded from the annual composite products. In addition, to minimize the instability of the single-year VCM data, this paper smoothed the selected light images according to Equation (2):
where is the mean-smoothed annual synthesized VCM of year A; , and are annual light images for a total of three years before and after year A, respectively. In this paper, we set year A as 2013, 2015, and 2017, and then calculated the difference between the smoothed VCM to get the nighttime light intensity changes of the integrated cities boundary zones.
3.2. Land Surface Feature Extraction
Firstly, this paper performed the necessary mosaic cropping, geometric correction, and atmospheric correction of the acquired Landsat 8 images of the study area for 2013, 2015, and 2017. Based on the time-series Landsat images, the spectral index method was used to extract feature types [42]. Specifically, water bodies were extracted using the Modified Normalized Difference Water Index (MNDWI, Equation (3)), vegetation was extracted using the Normalized Difference Vegetation Index (NDVI, Equation (4)), and land for construction was extracted using the Normalized Difference Building Index (NDBI, Equation (5)). Finally, we used high-resolution Google Earth images to evaluate the accuracy of land classification results using Kappa coefficients. The Kappa coefficients for 2013, 2015, and 2017 were 0.88, 0.86, and 0.85, respectively, which met the accuracy requirements of subsequent studies.
where , , , and are the reflectance of the green band (Band 3), red band (Band 4), near infrared band (Band 5), and short-wave infrared band1 (Band 6) of the Landsat-8 image, respectively.
3.3. Gravity Model Analysis of Nighttime Light
With the purpose of measuring the spatially fluctuating characteristics of nighttime light intensity in the integrated city boundary zone, the nighttime light gravity center (NTLGC) model was introduced to reveal the horizontal shifting of nighttime light. The NTLGC was defined as:
where is the gravity center coordinate of nighttime light; is the nighttime light intensity value of the light pixel ; is the center coordinate of the light pixel . Moreover, the shift distance between the NTLGCs at different periods can indicate the strength and direction of nighttime light migration within the boundary zone. During the study period, the closer the shift distance of the gravity center is, the more stable the light changes in space; the farther the distance is, the stronger the difference of night light changes in space.
3.4. Spatial Correlation Analysis
Quantifying the relationship between surface vegetation and impervious surface with nighttime lighting changes will help reveal the impact of integrated cities on the regional environment. Therefore, ordinary least squares (OLS) and geographically weighted regression (GWR) were used to conduct the correlation analysis in this paper.
OLS is a commonly used statistical method for analyzing the interdependence between interpreted and explanatory variables, which can be calculated as:
where is the dependent variable value of point ; is the intercept; is the value of the independent variable k at point ; is the regression coefficient of the independent variable ; is the residual variable.
Since OLS models may ignore the spatial instability of the relationship between the independent and dependent variables, this paper also introduced the GWR model, which adds geographic locations to the regression parameters and allows for local parameter estimation [39]. The GWR model is as follows:
where is the dependent variable; is the spatial coordinate of point ; is the regression coefficient of the independent variable k at point ; is the impact factors; is the random errors terms.
4. Results
4.1. Land-Use Change in Boundary Zones
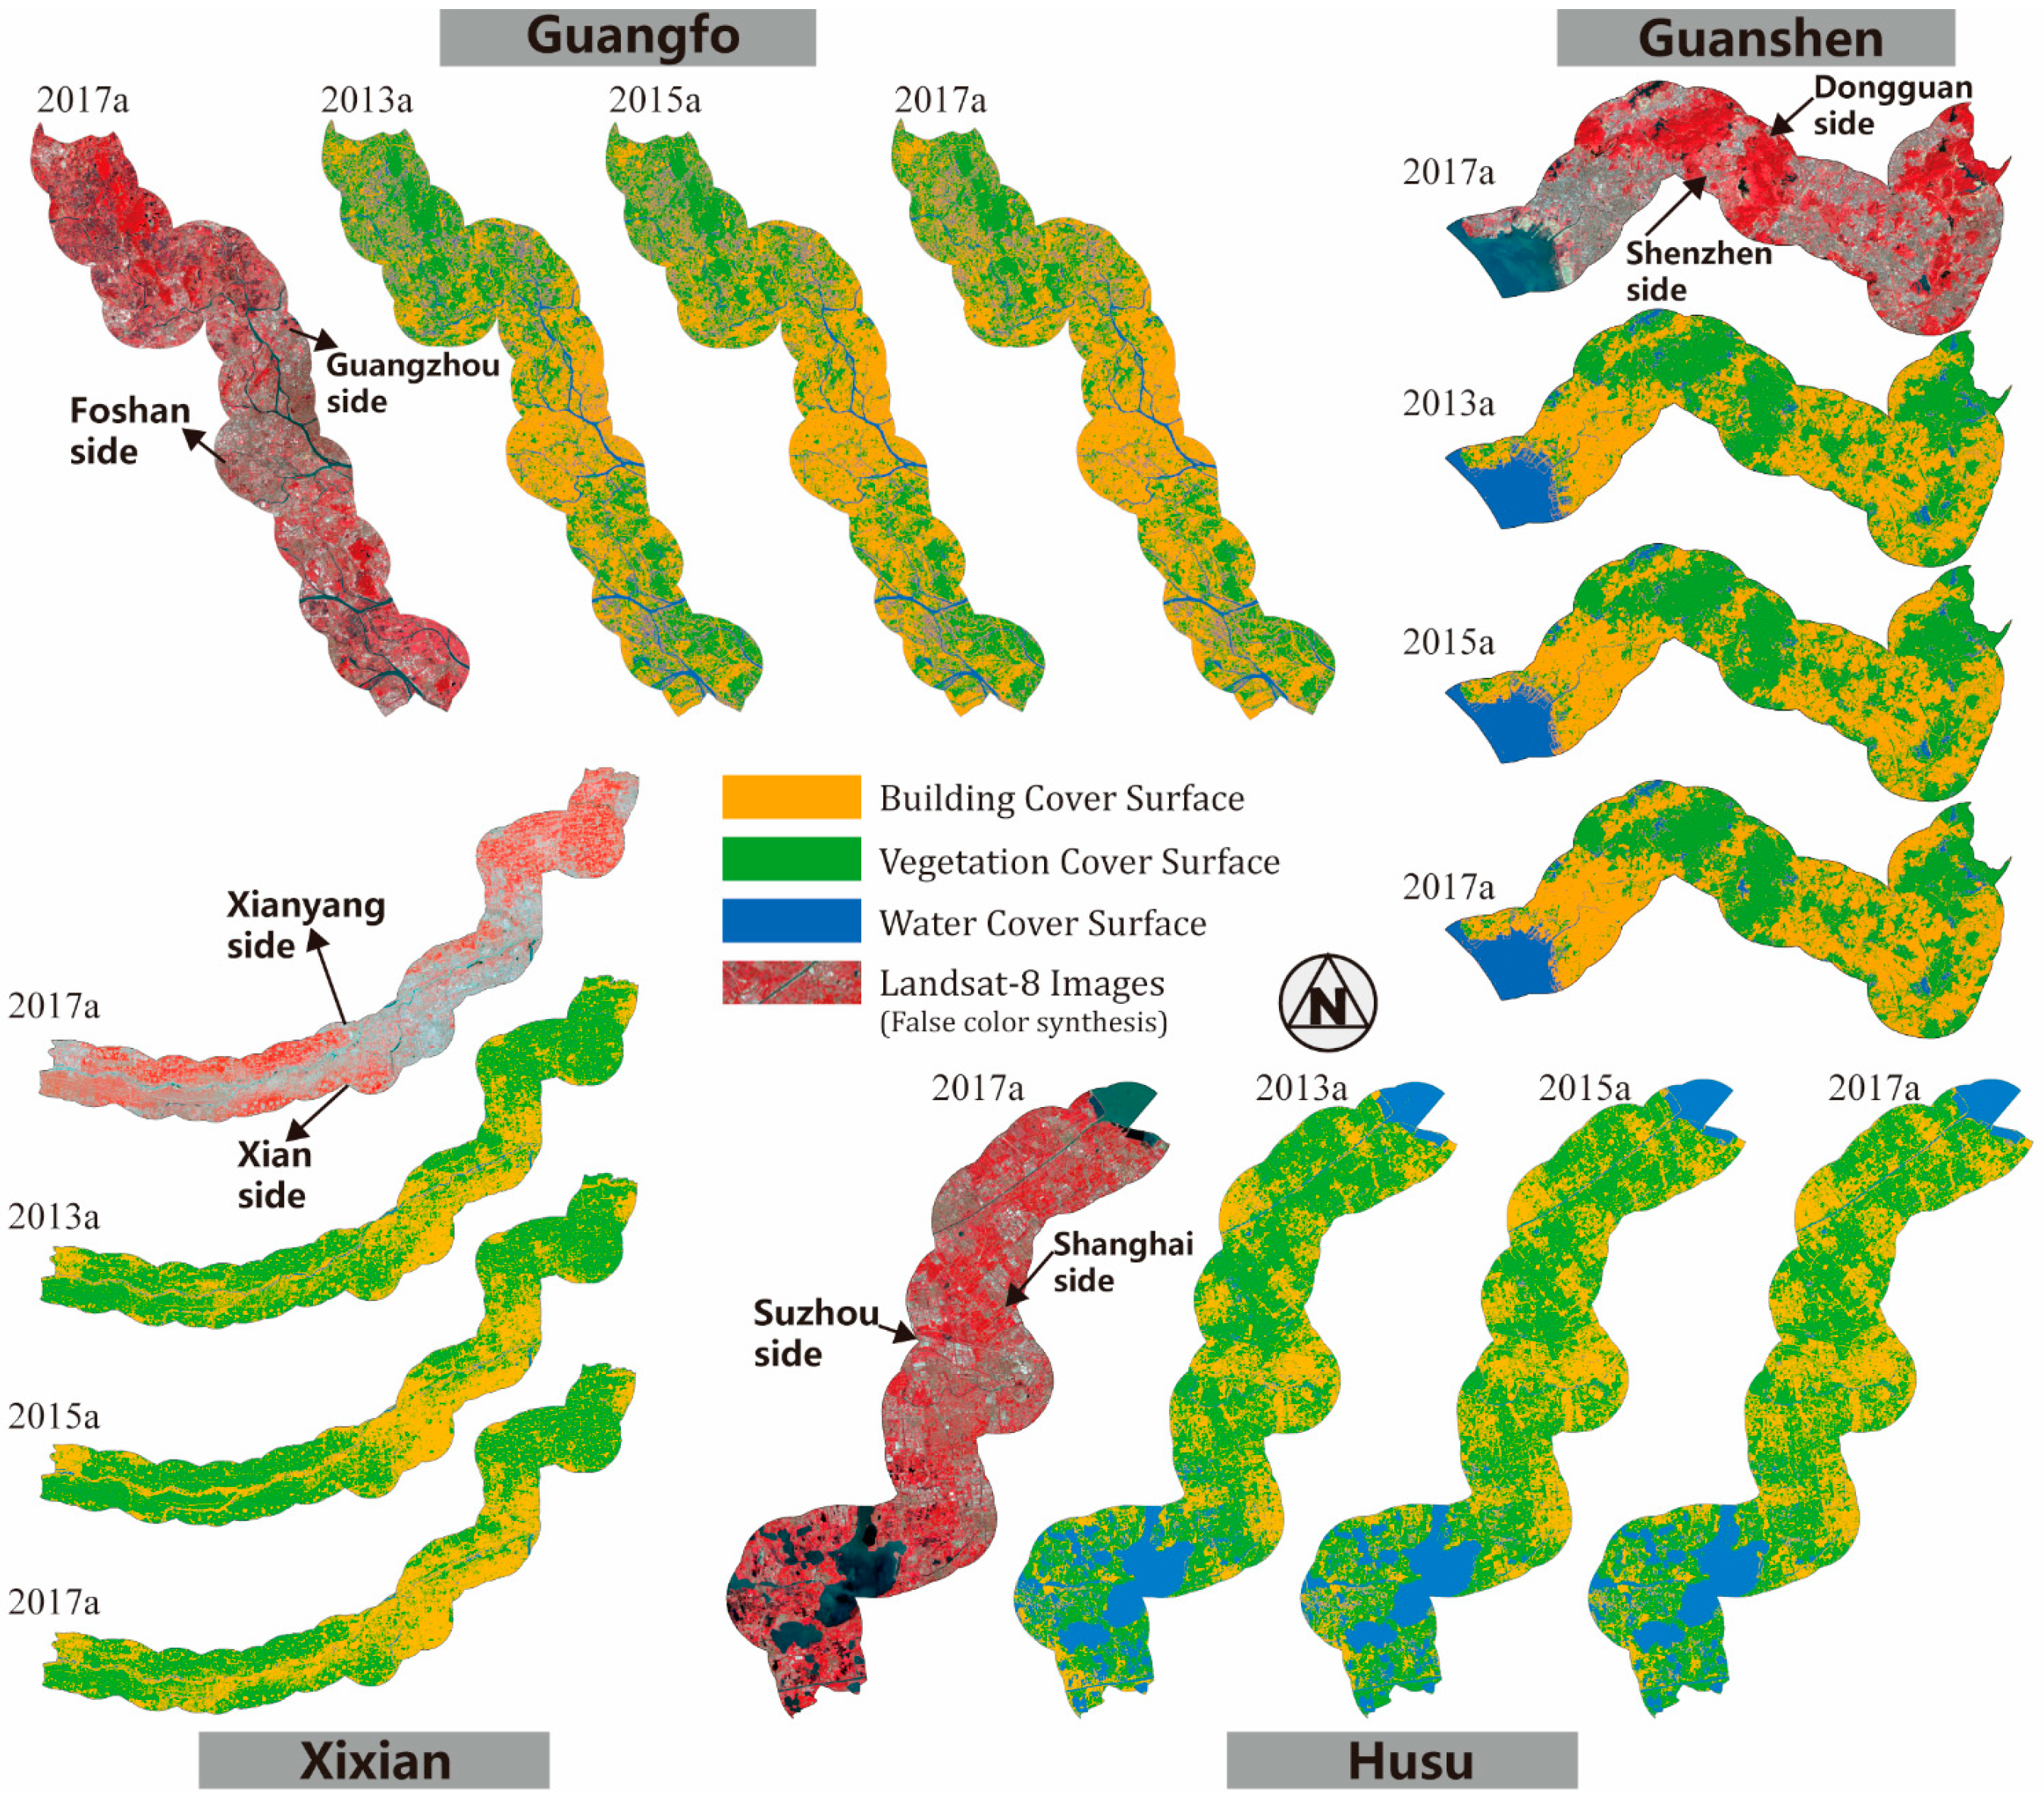
During the integration process, the downtown area of neighboring cities continues to expand and the boundaries of the built-up areas approach the administrative boundaries, leading to significant adjustments in the land-use structure characterizing the urban boundary zones. We extracted the land use within the multi-level buffer zones constructed along the boundary lines of four groups of integrated cities, the results of this extraction are shown in Figure 2.
Based on the classification results, this paper counts the percentage of area within the boundary zone for 1 km, 3 km, and 5 km widths, respectively, as shown in Table 2. During 2013–2017, the surface cover of the above boundary zones of four integrated cities changed significantly. Among them, (1) the building area expanded markedly, with Xixian growing the most and Guanshen growing the least; (2) both vegetation cover and water body were occupied, with the average cover decreasing by 49.59% and 10.61%, respectively. In other words, roughly one-sixth of the new construction land was converted from water cover and one-fifth was converted from vegetation cover. Besides, for the expansion rate of the building area within the boundary zone of different widths, the growth rate of Guangfo and Guanshen was more stable, while the growth rate of Husu and Xixian decreased with the buffer distance increases. The two different growth characteristics above reflect the different stages of integration development: the integration process of Guangfo and Guanshen has entered the stage of overall expansion, while Husu and Xixian are still in the initial stage of local expansion.
4.2. Nighttime Light Intensity Changes
Since nighttime light data are superior in depicting the intensity of human activity (especially in downtown areas), it has been widely used in regional or global-scale urbanization studies. Hence, we carried out the fluctuation analysis of nighttime light intensity in the boundary zone to detect the impact of human activities on the integration process (Table 3). The results show that from 2012 to 2018, the average light intensity within the boundary zone maintained an upward trend, with an increase of 35%, 44%, 36%, and 73% for Guangfo, Guanshen, Husu, and Xixian, respectively. Although Xixian achieved the highest light growth rate (over 70%), the absolute value of light intensity is still apparently lower than that of other integrated cities. In recent years, although the urbanization of Xixian, which is located in the hinterland of northwest China, has been accelerating, the overall development level there is still lagging behind the eastern and southern coastal cities due to the limitation of its non-coastal geographical location and the phased strategy of reform and development. In addition, the fitted equations and coefficient of determination R2 for light changes in Table 3 similarly show that the increase in nighttime light intensity is more stable in the integrated coastal cities than in the integrated inland cities.
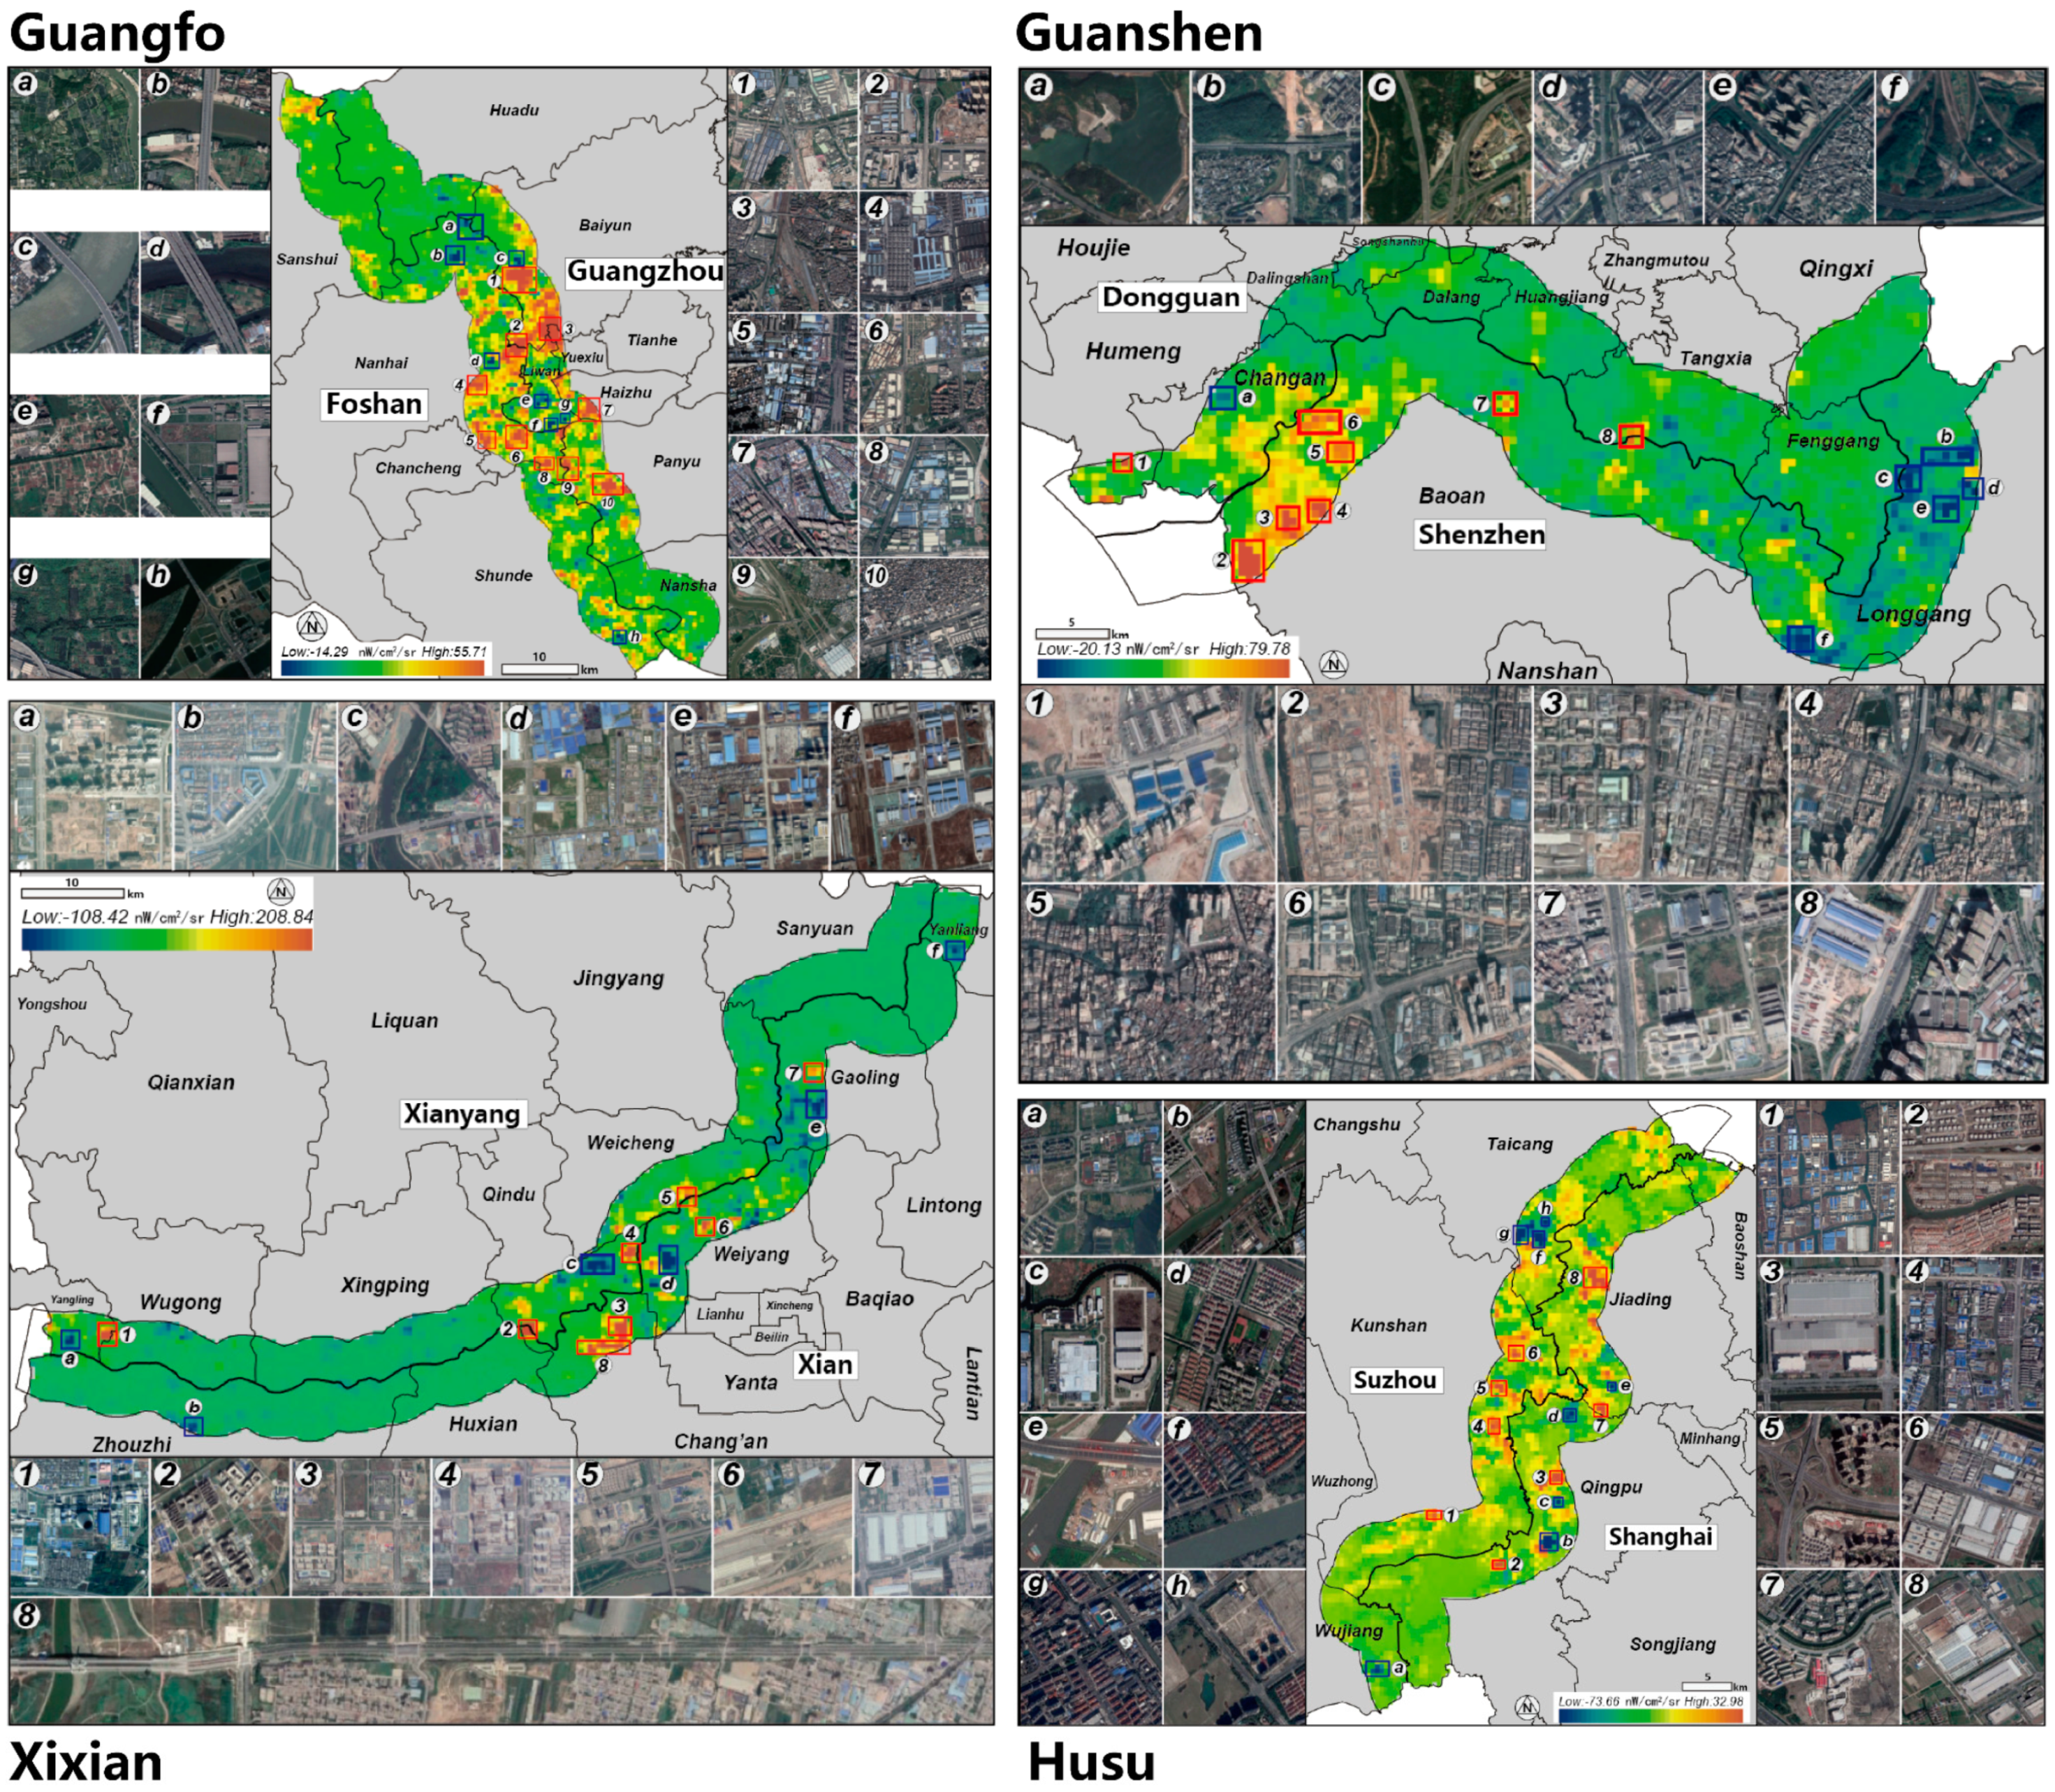
To investigate the triggers of light fluctuations in the boundary area, we selected plots with remarkable changes in light intensity in the study area and combined Google Earth high-resolution satellite images for comparative analysis (Figure 3). Taking Guangfo as an example, the area and distribution density of the light increase area within the boundary zone is larger than the attenuation area. The plots with reduced light intensity in Guangfo’s boundary zone were mainly: unoccupied arable land (a), river bridge blocks (b, c, d, and h), and idle land in urban areas (e, f, and g). Plots with increasing light intensity could be divided into transportation land, industrial land, and commercial land according to the type of use. Among them, Plot 1 is mainly composed of three industrial parks and two logistics parks; Plot 2 includes a large interchange, two shopping malls, and a logistics center; Plot 3 is located at the junction of the three districts and includes two industrial parks and a railway distribution center; Plot 4 is located in Foshan and includes two commercial sites; Plot 5 includes two industrial zones; Plot 6 includes one industrial land area and two commercial land areas; Plot 7 is located in Guangzhou, which is an industrial area mainly used for garment making; Plot 8 mainly includes two industrial parks in Foshan; Plot 9 is located on the boundary line, which includes Guangzhou South Station; Plot 10 is located in Guangzhou and contains two industrial zones. The comparison shows that the land use types in the light attenuation area are mainly vegetation and water bodies, while the light increase area is mainly industrial land (industrial parks and logistics parks), transportation land, and some commercial land. Similarly, Guanshen’s light increase area is mainly located in industrial parks, and its light attenuation area is reservoirs, some urban villages and gardens, etc.; Husu’s light attenuation zone mainly includes water bodies and green land, while the light increase plots mainly are new residential communities, industrial parks, and transportation facilities; Xixian’s light attenuation area mainly includes land to be developed and green land within the city, while the light increase plots are mainly used for industrial and traffic facilities. Generally, in the boundary areas of integrated cities, logistics parks and industrial parks, driven by location and land prices, continue to attract concentrations of people and goods, and the intensity of human activity then increases significantly. Conversely, for cultivated and green land within a border zone, a decreasing trend in light intensity is observed, and we speculated that the shading effect caused by the increase in vegetation cover of green land is the possible cause of the decrease in light radiation.
4.3. The Shifting of the NTLGC
In this paper, the NTLGC model was introduced to reveal the differences in the direction of expansion between cities during the integration process (Figure 4). For the integrated city of Guangfo, the geometric center of the boundary zone is located on the side of Foshan, while the center for the NTLGC is located on the side of Guangzhou, which indicates that Guangzhou is occupying the dominant position for the process of integration. During the study period, the NTLGC’s shift in direction was “southeast–northwest”, and the offset distance increased from 545 m (2013a–2015a) to 695 m (2015a–2017a), reflecting the fact that the NTLGC kept moving towards the Foshan side and the integration process advanced gradually. For the Guanshen city, both the geometric center and the NTLGC were located on the side of Shenzhen. The offset distance of the NTLGC increased from 1699 m (2013a–2015a) to 2086.33 m (2015a–2017a), showing a long-span and incremental characteristic. For Husu city, the geometric center was roughly located on the boundary between Shanghai and Suzhou, while the NTLGC was located in Suzhou. The shift trajectory of NTLGC in Husu presented a “V” structure. Although the gravity center shift direction has changed dramatically, in fact, since the shift distances are kept at about 200 m, the boundary zone’s light intensity of Husu was found to be stable during the research period. Compared with the gathering characteristics of the NTLGC in Husu boundary zone, the shift of the NTLGC in Xixian boundary zone was more significant, and the shift direction was maintained as being “northeast–southwest”.
4.4. Spatial Regression Analysis of Light Intensity Change
Since changes of light intensity in the integrated cite boundary zones are mainly caused by the transformation of construction land and vegetation coverage, we selected the determination construction land and vegetation coverage as the main research objective in the correlation analysis of light intensity and urban surface structure characteristics. We used Peng et al.’s [43] method to construct a grid in the study area as the research unit, and obtained the average values of NDVI (annual synthesis), NDBI (annual synthesis), and VCM of each grid unit.
Table 4 shows the OLS regression results of nighttime light intensity with NDBI and NDVI in four groups of integrated cites (5 km). In general, the effects of buildings and vegetation on nighttime lighting intensity varies significantly in different time and cities. From the comparison of four groups of integrated cities, OLI regression results show two most obvious characteristics: (1) the goodness of fit between NDBI and VCM is higher than that between NDVI and VCM, which reflects that construction land occupies a greater explanatory power in light distribution; (2) based on the slope of the linear fitting equation, there is a negative correlation between NDVI and VCM, while NDVI and VCM show a positive correlation. Specifically, from the results of the linear regression between NDBI and VCM, the goodness of fit and regression coefficients of the Guangfo and Guanshen boundary zones are higher than those of Husu and Xixian, which implies that the newly constructed building plots in the Guangfo and Guanshen border area can provide higher light intensity. Moreover, the difference in the function parameters in 2013 and 2017 reflects that the expansion of regional built-up plots in the Guangfo and Guanshen boundary zones have been accompanied by rapid growth in regional human activity intensity during the process of urbanization, while Husu and Xixian show a declining trend. We speculate that the reason for this difference is due to the early start of the integrated development of Guangfo and Guanshen, which caused more population increases and commercial activities to occur along with the expansion of construction land during their development.
In order to reveal the spatial instability characteristics of the nighttime light intensity distribution due to changes in buildings and vegetation cover, we performed GWR analysis on the above four groups of urban integrated boundary zones. Compared to OLS, the fit goodness of GWR that considers spatial instability was found to be significantly improved, and the R2 of the four integrated cities in 2013 and 2017 were 0.837 and 0.805 (Guangfo), 0.753 and 0.731 (Guanshen), 0.620 and 0.660 (Husu), and 0.484 and 0.212 (Xixian), respectively.
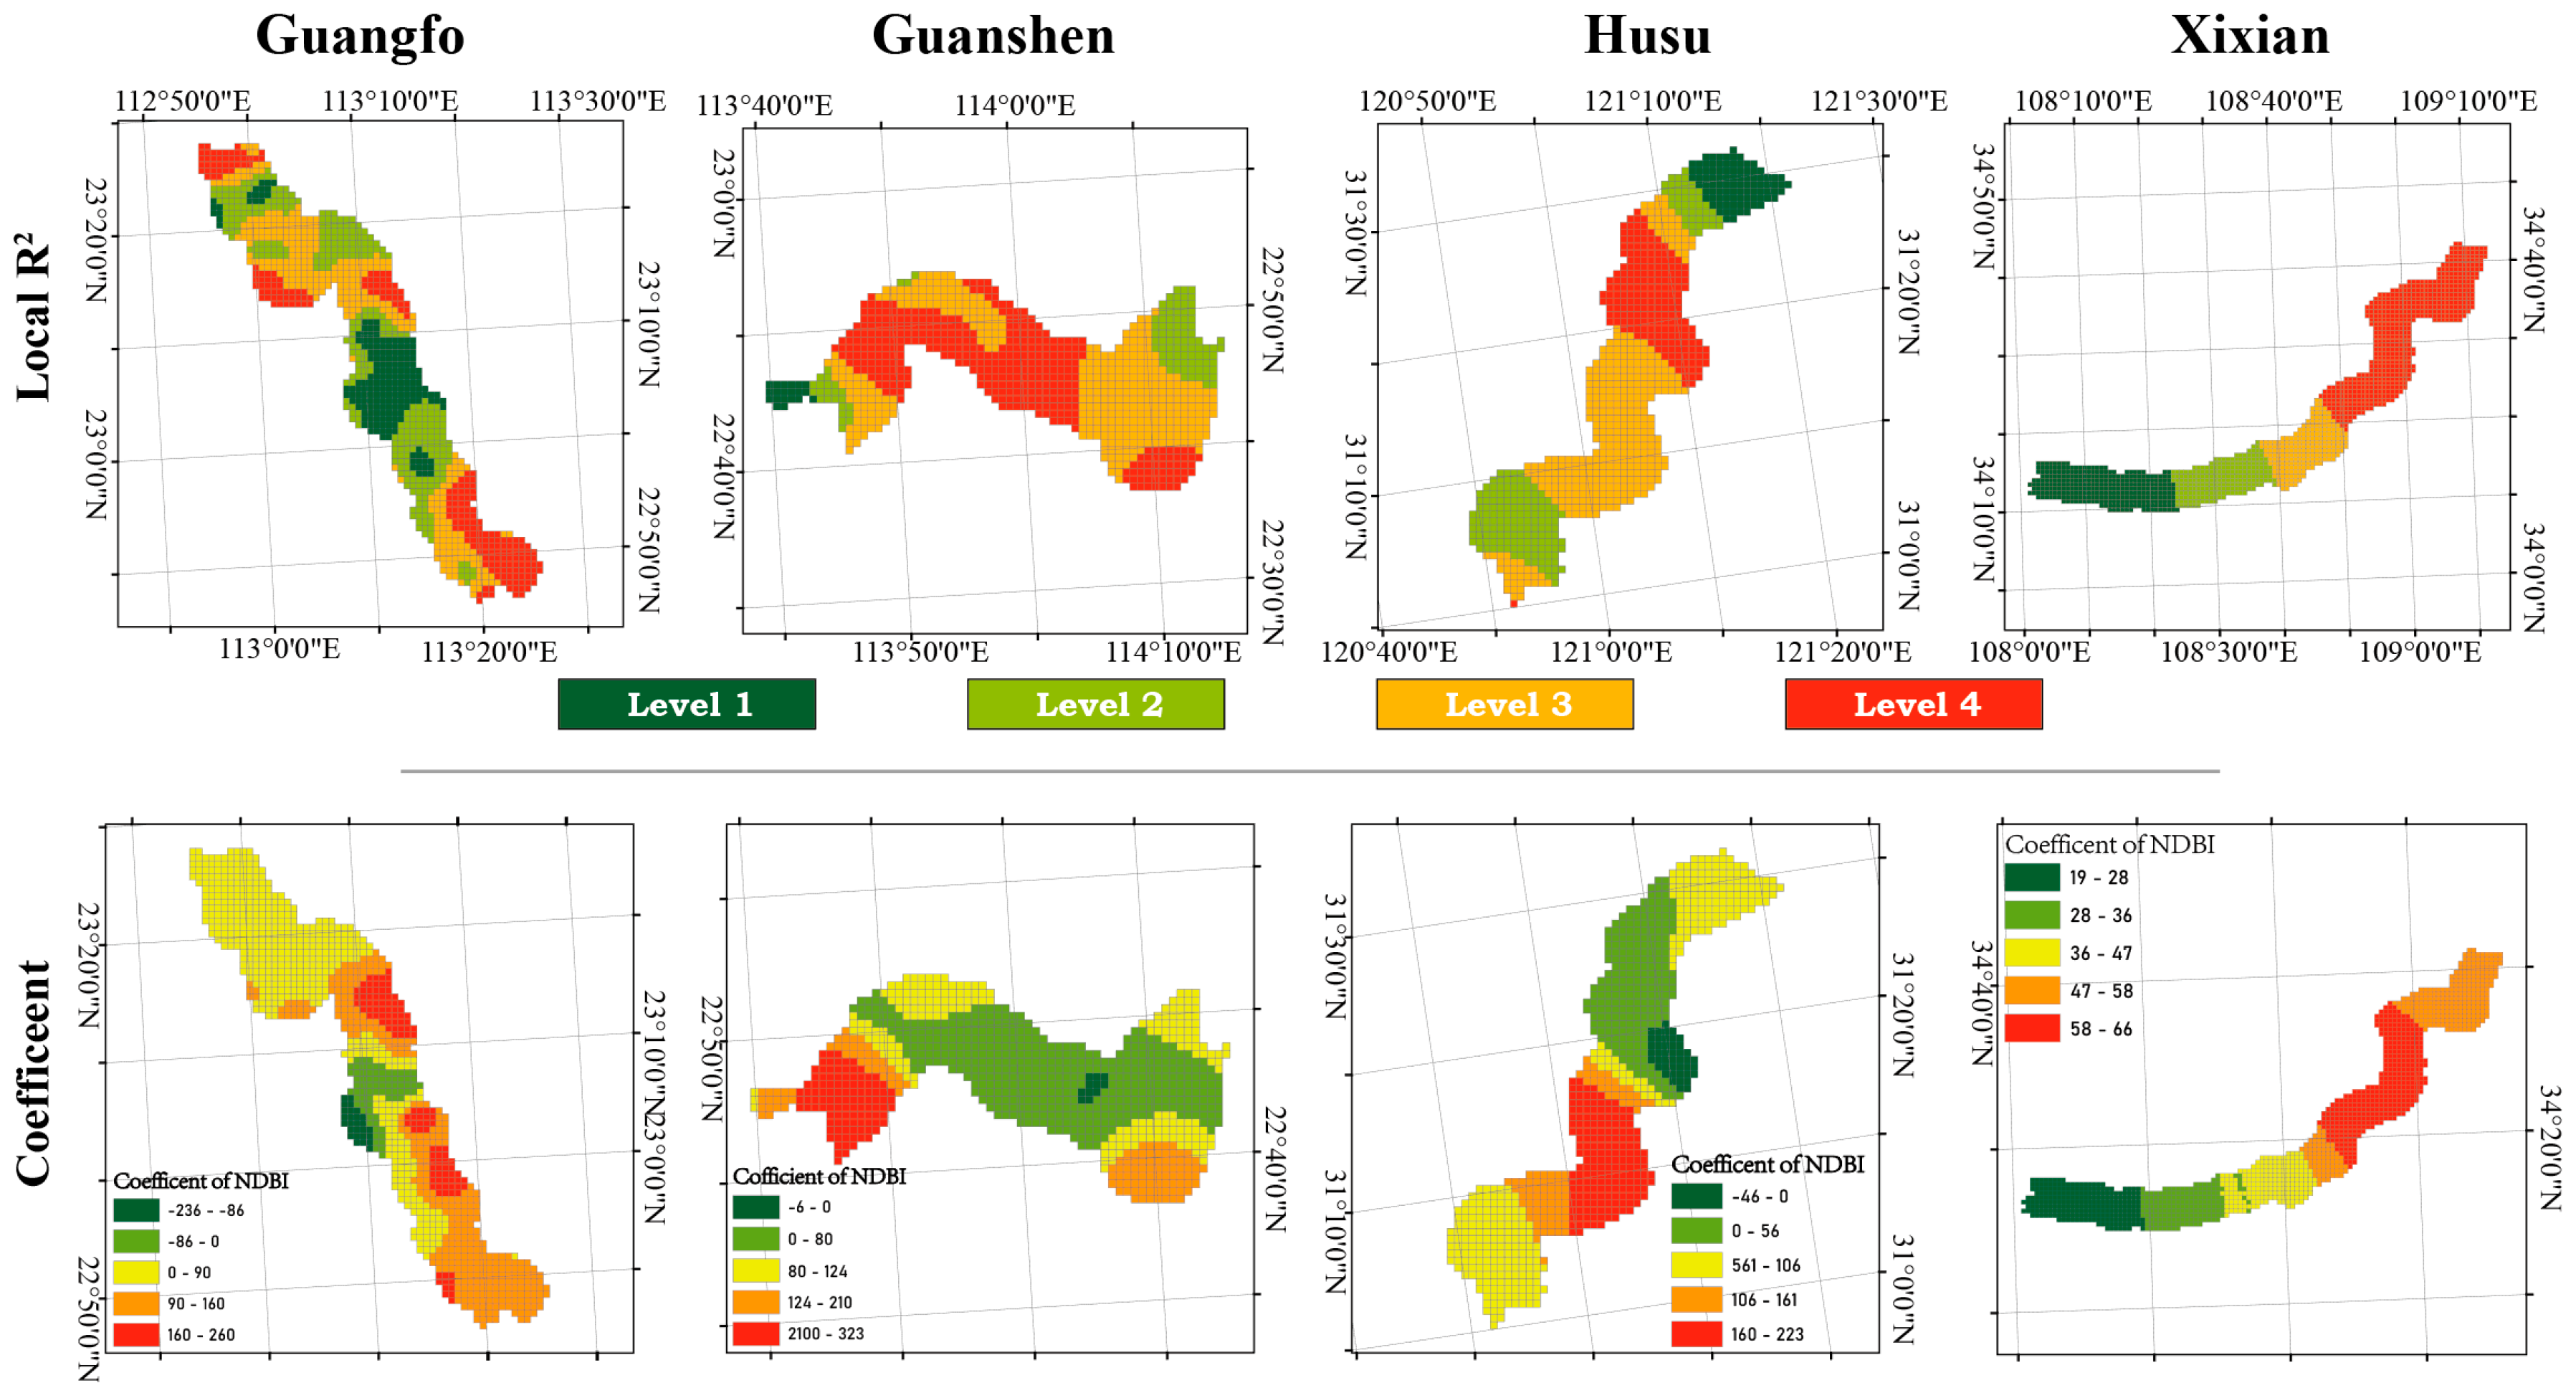
In addition, GWR regression analysis also provided the local R2 and coefficients of independent variables. Figure 5 shows the distribution of local R2 and NDBI’s regression coefficients for the regression analysis of the four groups of integrated cities in 2017. The results showed that the local R2 of the integrated cities gave evidence of obvious spatial differentiation, including that: (1) the high values of the local R2 of the Guangfo were concentrated in the south and north; (2) the high values of the local R2 of the Guanshen were concentrated in the middle of the boundary zone; (3) the local R2 of the Husu showed obvious “segmented” features, decreasing from the central region to the north and south; and (4) the local R2 of the Xixian was also segmented, and decreasing from east to west. In addition, as noted earlier, the expansion of building land is the main contributor to regional changes in light levels. Thus, the regression coefficient for building land represents the change in lighting per unit of construction area, which reflects the level of regional integration. In Figure 5, the high values of NDBI’s coefficients of Guangfo can be seen to be mainly distributed in the west of Baiyun District, the southeast of Liwan District, and the west of Panyu District, while the low values are mainly concentrated in the east side of Nanhai District and the middle part of Liwan District. For Guanshen, high value coefficients are distributed in the west side of the boundary zone, including Changan Town and Baoan District, while the low values are concentrated in the middle part. The high value coefficients for Husu are mainly located in Qingpu District and Kunshan City, while the low values are mainly located in the southern part of Taicang City and the western part of Jiading District. The distribution of the coefficients for Xixian shows a clear east-west difference, with the coefficients being higher in the east than in the west.
5. Discussion
With the continuous development of urbanization in China and the rapid expansion of cities to surrounding areas, many built-up areas of neighboring cities are gradually becoming connected in regional space. The increasing demand for coordinated development among cities promotes the trend of city integration. As an important mode of regional cooperation, city integration is conducive to narrowing the gap between cities and promoting coordinated development within the region. During the process of urban integration, due to China’s distinct regional characteristics and significant differences in socio-economic development levels, the process of urbanization presents a variety of characteristics and stages. Therefore, this paper selected four groups of integrated cities with different backgrounds to carry out monitoring and analysis, which helped to reveal the differences in the process of urban integration. The process of city integration is a rather complex dynamic process, which is reflected in many areas such as society, the economy, transportation, the population, and so on. However, given the advantages of remote sensing in monitoring time-series surface changes, this paper focuses on changes related to surface activity and land use types in integration process monitoring, which can be extracted from remotely sensed images.
The remote sensing-based monitoring results of four groups of representative integrated cities under different natural and social-economic conditions can reflect some characteristics and differences of Chinese cities during the process of integration. Generally, the development level of Guangfo and Guanshen in the integration process are significantly higher than that of Husu and Xixian according to the land-use changes and nighttime light intensity fluctuation in the boundary zone. The integration development level of Guangfo is the most mature and thorough among the four groups of cities. Guangzhou and Foshan are adjacent to each other and belong to the birthplace of Guangfu culture, which has an important history. Since the reform and opening-up, the forces of industrialization and urbanization have accelerated the mobility of resource elements, prompting the continuous development of Fangcun, Huangqi, Yanbu, etc. in the boundary zone, and the city boundary has become increasingly blurred. For the integration process of Guanshen, the most prominent feature is the integration heterogeneity in the East-West direction. In recent years, with the rapid development of Shenzhen, the high land price and the shortage of land supply have accelerated the industrial spillover effect in Shenzhen. With the advantages of geography, industrial support, and urban environment, Dongguan has gradually become the first choice for industrial transfer in Shenzhen. Compared with Guangfo and Guanshen, Husu in the Yangtze River Delta region has a lower level of integrated development than the Pearl River Delta region. As the economic center of China, Shanghai, located in the Yangtze River Delta, has a much larger economy than the neighboring city of Suzhou. Since the city area of Shanghai is 3.2 times that of Shenzhen, the shortage of land supply for urban development is not as prominent as in Shenzhen. Therefore, in the process of Husu integration, there exists the problem of inadequate initiative and enthusiasm, which is reflected in the changes of NTLGC in the boundary zone, showing different migration directions and the smallest migration range. For the Xixian, the changes in land-use, light intensity, and the shift of NTLGC in Xixian reflect that integration is mainly concentrated in the middle of the boundary zone. In addition, although China’s economy and urbanization have made world-renowned achievements in recent decades, the spatial unevenness of development remains prominent. The eastern cities of mainland China, especially the coastal cities, are clearly superior to the inland cities in terms of location, policies, and environmental conditions, leading to serious unbalanced development between “East” and “West”. Therefore, as an inland city, Xixian’s economic development lags behind that of developed coastal areas, but the establishment of Xi Xian New District (located between Xi’an and Xianyang built-up areas) has provided new opportunities for its integrated development.
6. Conclusions
At present, research on city integration is mainly focused on describing the characteristics, formation mechanism, and dynamic mechanism of integration, while relatively little research has been conducted on integration based on remote sensing approach. Therefore, under the background of rapid urbanization in China, this paper chooses four of most representative integrated cities as the research sample, taking the boundary zone as the study area, which is the area with the most drastic surface changes in the integration process. Through the monitoring of changes in land use and nighttime light intensity in the boundary zones over the past five years, the differences in the integrated development of the above cities were revealed. The results show that the process of city integration in China is not only unbalanced in the level of development, but also has significant spatial heterogeneity in its internal development. Specifically, the results show that: (1) Guangfo has the highest level of integration and urban expansion is mainly concentrated in the south-central part of the boundary area; (2) Guanshen’s level of integration is second to Guangfo’s and is mainly concentrated in the west; (3) HuSu’s integration is still in the initial stage and its increase in light intensity lags behind its expansion of building land during the study period; (4) although the light intensity and building land area increased significantly during the study period in Xixian, the overall development level of Xixian still lagged behind coastal cities due to the restriction of geographical location. Considering the aforementioned characteristics of integrated city development, planning decision makers should pay more attention to the rational allocation of resources and ensure that population transfer and infrastructure development are synchronized, which can promote the growth of regional dynamism.
It is worth noting that there are limitations in this study. Due to the limitations of nighttime light data, especially the defects of DMSP/OLS data and its difference with SNPP/VIIRS, both of which limited the width of the time window we studied, it was impossible to analyze the process of urbanization characteristics from a longer time span. Moreover, since policy factors are difficult to quantify, we focused only on the effects of human activities on the land surface during integration and ignored the endogenous factors such as policy and population migration. Therefore, in the following research, we will further improve several points: (1) how to integrate DMSP/OLS and SNPP/VIIRS data to achieve a longer time span of integration process research; (2) develop new data sources, such as POI (Point of Interest) data and land price data, to enhance quantitative research on the impact of policy and demographic changes behind the integration process.
Author Contributions
Conceptualization, Z.Z.; methodology, Z.Z. and Z.Y.; writing—original draft preparation, Z.Z.; writing—review and editing, Z.W. and Y.C.; supervision, F.M.; project administration, Z.W. and F.M. All authors have read and agreed to the published version of the manuscript.
Funding
This research was financially supported by the National Natural Science Foundation of China (No. 41671430), Key Special Project for Introduced Talents Team of Southern Marine Science and Engineering Guangdong Laboratory (Guangzhou) (No. GML2019ZD0301) and NSFC-Guangdong Joint Fund (No. U1901219).
Acknowledgments
The authors would like to express their gratitude to the editors and the anonymous reviewers for their comments and suggestions.
Conflicts of Interest
The authors declare no conflict of interest.
References
- Li, T.P. 40 Years of Chinese urbanization: Key findings and future options. Popul. Res. 2018, 42, 15–24. [Google Scholar]
- Grimmond, S.U. Urbanization and global environmental change: Local effects of urban warming. Geogr. J. 2007, 173, 83–88. [Google Scholar] [CrossRef]
- Cui, L.; Shi, J. Urbanization and its environmental effects in Shanghai, China. Urban Clim. 2012, 2, 1–15. [Google Scholar] [CrossRef] [Green Version]
- Ariken, M.; Zhang, F.; Liu, K.; Fang, C.; Kung, H.T. Coupling coordination analysis of urbanization and eco-environment in Yanqi Basin based on multi-source remote sensing data. Ecol. Indic. 2020, 114, 106331. [Google Scholar] [CrossRef]
- Howard, E. Garden Cities of to-Morrow; Routledge: Abingdon, UK, 2013. [Google Scholar]
- Geddes, P. Cities in Evolution: An Introduction to the Town Planning Movement and to the Study of Civics. Geogr. J. 1916, 47, 309. [Google Scholar]
- Gottmann, J. Megalopolis or the Urbanization of the Northeastern Seaboard. Econ. Geogr. 1957, 33, 189. [Google Scholar] [CrossRef]
- McGee, T.G. The Emergence of Desakota Regions in Asia: Expanding a Hypothesis. In The Extended Metropolis: Settlement Transition in Asia; Ginsberg, N., Koppel, B., McGee, T.G., Eds.; University of Hawaii Press: Honolulu, HI, USA, 1991; pp. 3–26. [Google Scholar]
- Alderson, A.S.; Beckfield, J. Power and Position in the World City System. Am. J. Sociol. 2004, 109, 811–851. [Google Scholar] [CrossRef] [Green Version]
- Ginsburg, N.S.; Koppel, B.; McGee, T.G. The Extended Metropolis: Settlement Transition Is Asia; University of Hawaii Press: Honolulu, HI, USA, 1991. [Google Scholar]
- Thornley, A.; Newman, P. Urban Planning in Europe: International Competition, National Systems and Planning Projects; Routledge: Abingdon, UK, 2002. [Google Scholar]
- Hall, P.G.; Pain, K. (Eds.) The Polycentric Metropolis: Learning from Mega-City Regions in Europe; Routledge: Abingdon, UK, 2006. [Google Scholar]
- Henderson, J.V. The sizes and types of cities. Am. Econ. Rev. 1974, 64, 640–656. [Google Scholar]
- Abdel-Rahman, H.; Fujita, M. Product Variety, Marshallian Externalities, and City Sizes. J. Reg. Sci. 1990, 30, 165–183. [Google Scholar] [CrossRef]
- Duranton, G.; Puga, D.; McCann, P. Diversity and Specialization in Cities: Why, Where and When Does it Matter? Ind. Locat. Econ. 2002, 37, 533–555. [Google Scholar]
- Doxiadis, C.A. Man’s movement and his settlements? Int. J. Environ. Studies 1970, 1, 19–30. [Google Scholar] [CrossRef]
- Wallis, A.D. Evolving structures and challenges of metropolitan regions. Natl. Civ. Rev. 1994, 83, 40–53. [Google Scholar] [CrossRef]
- Cawley, M. Aspects of Rural-Urban Integration in Western Ireland. Ir. Geogr. 1980, 13, 20–32. [Google Scholar] [CrossRef]
- Partridge, M.D.; Ali, K.; Olfert, M.R. Rural-to-Urban Commuting: Three Degrees of Integration. Growth Chang. 2010, 41, 303–335. [Google Scholar] [CrossRef]
- Shieh, L. Becoming Urban: Rural-Urban Integration in Nanjing, Jiangsu Province. Pac. Aff. 2011, 84, 475–494. [Google Scholar] [CrossRef]
- Xing, M. Thoughts over integration of Shenyang-Fushun metropolitan area. City Plan. Rev. 2007, 31, 52–56. [Google Scholar]
- Wang, D.; Song, Y.; Shen, C.; Zhu, C.S. A review on the implementation of city integration strategy. Urban Plan. Forum 2009, 4, 74–78. [Google Scholar]
- Sang, Q.; Zhang, P.Y.; Luo, Y.F.; Gao, X.N. Formation mechanism and countermeasures of cohesion of Shenyang and Fushun. Hum. Geogr. 2009, 3, 32–36. [Google Scholar]
- Xie, J.G.; Liu, L.M. Social function analysis and social planning view point of cities’ synchronization. J. Guangzhou Univ. Soc. Sci. Ed. 2009, 8, 24–28. [Google Scholar]
- Owen, T.W.; Carlson, T.N.; Gillies, R.R. An assessment of satellite remotely-sensed land cover parameters in quantitatively describing the climatic effect of urbanization. Int. J. Remote Sens. 1998, 19, 1663–1681. [Google Scholar] [CrossRef]
- Dewan, A.; Yamaguchi, Y. Land use and land cover change in Greater Dhaka, Bangladesh: Using remote sensing to promote sustainable urbanization. Appl. Geogr. 2009, 29, 390–401. [Google Scholar] [CrossRef]
- Akubia, J.E.K.; Bruns, A. Unravelling the Frontiers of Urban Growth: Spatio-Temporal Dynamics of Land-Use Change and Urban Expansion in Greater Accra Metropolitan Area, Ghana. Land 2019, 8, 131. [Google Scholar] [CrossRef] [Green Version]
- Lv, T.; Wang, L.; Zhang, X.; Xie, H.; Liu, M.; Li, H.; Liu, W.; Zhang, Y. Coupling Coordinated Development and Exploring Its Influencing Factors in Nanchang, China: From the Perspectives of Land Urbanization and Population Urbanization. Land 2019, 8, 178. [Google Scholar] [CrossRef] [Green Version]
- Sofia, G.; Marinello, F.; Tarolli, P. Metrics for quantifying anthropogenic impacts on geomorphology: Road networks. Earth Surf. Process. Landf. 2015, 41, 240–255. [Google Scholar] [CrossRef]
- Tatem, A.J.; Hay, I.S. Measuring urbanization pattern and extent for malaria research: A review of remote sensing approaches. J. Hered. 2004, 81, 363–376. [Google Scholar] [CrossRef]
- Rogan, J.; Chen, D. Remote sensing technology for mapping and monitoring land-cover and land-use change. Prog. Plan. 2004, 61, 301–325. [Google Scholar] [CrossRef]
- Townshend, J.; Justice, C.; Li, W.; Gurney, C.; McManus, J. Global land cover classification by remote sensing: Present capabilities and future possibilities. Remote Sens. Environ. 1991, 35, 243–255. [Google Scholar] [CrossRef]
- Bhatta, B.; Saraswati, S.; Bandyopadhyay, D. Urban sprawl measurement from remote sensing data. Appl. Geogr. 2010, 30, 731–740. [Google Scholar] [CrossRef]
- Lu, D.; Tian, H.; Zhou, G.; Ge, H. Regional mapping of human settlements in southeastern China with multisensor remotely sensed data. Remote Sens. Environ. 2008, 112, 3668–3679. [Google Scholar] [CrossRef]
- Shi, K.; Yu, B.; Huang, C.; Wu, J.; Sun, X. Exploring spatiotemporal patterns of electric power consumption in countries along the Belt and Road. Energy 2018, 150, 847–859. [Google Scholar] [CrossRef]
- Zheng, Z.; Wu, Z.; Chen, Y.; Yang, Z.; Marinello, F. Exploration of eco-environment and urbanization changes in coastal zones: A case study in China over the past 20 years. Ecol. Indic. 2020, 119, 106847. [Google Scholar] [CrossRef]
- Benediktsson, J.A.; Pesaresi, M.; Amason, K. Classification and feature extraction for remote sensing images from urban areas based on morphological transformations. IEEE Trans. Geosci. Remote Sens. 2003, 41, 1940–1949. [Google Scholar] [CrossRef] [Green Version]
- Xiong, Y.; Huang, S.; Chen, F.; Ye, H.; Wang, C.; Zhu, C. The Impacts of Rapid Urbanization on the Thermal Environment: A Remote Sensing Study of Guangzhou, South China. Remote Sens. 2012, 4, 2033–2056. [Google Scholar] [CrossRef] [Green Version]
- Zheng, Z.; Yang, Z.; Wu, Z.; Marinello, F. Spatial Variation of NO2 and Its Impact Factors in China: An Application of Sentinel-5P Products. Remote Sens. 2019, 11, 1939. [Google Scholar] [CrossRef] [Green Version]
- Yuan, F.; Sawaya, K.E.; Loeffelholz, B.C.; Bauer, M.E. Land cover classification and change analysis of the Twin Cities (Minnesota) Metropolitan Area by multitemporal Landsat remote sensing. Remote Sens. Environ. 2005, 98, 317–328. [Google Scholar] [CrossRef]
- Avtar, R.; Tripathi, S.; Aggarwal, A.K. Assessment of Energy–Population–Urbanization Nexus with Changing Energy Industry Scenario in India. Land 2019, 8, 124. [Google Scholar] [CrossRef] [Green Version]
- Zheng, Z.H.; Chen, Y.B.; Wu, Z.F.; Hu, Y.L. The ecological land identification and ecological risk assessment based on multi-source remote sensing image. Urban Insight 2017, 3, 19–30. [Google Scholar]
- Peng, J.; Xie, P.; Liu, Y.; Ma, J. Urban thermal environment dynamics and associated landscape pattern factors: A case study in the Beijing metropolitan region. Remote Sens. Environ. 2016, 173, 145–155. [Google Scholar] [CrossRef]
Figure 1.
Location distribution of four integrated cities in China: Guangfo City (1), Guanshen City (2), Husu City (3), and Xixian City (4).
Figure 1.
Location distribution of four integrated cities in China: Guangfo City (1), Guanshen City (2), Husu City (3), and Xixian City (4).

Figure 2.
The land-use classification results of boundary zones among the integrated cities in 2013, 2015, and 2017.
Figure 2.
The land-use classification results of boundary zones among the integrated cities in 2013, 2015, and 2017.

Figure 3.
Plots with dramatic lighting changes in the boundary zone and their feature structures. Note: light intensity decreases in plots marked by letters and increases in plots marked by numbers.
Figure 3.
Plots with dramatic lighting changes in the boundary zone and their feature structures. Note: light intensity decreases in plots marked by letters and increases in plots marked by numbers.

Figure 4.
The nighttime light gravity center shift trajectories of integrated cities in 2013, 2015, and 2017. Note: the light gravity center shift trajectory is listed as: (a) Guangfo; (b) Guanshen; (c) Husu and (d) Xixian.
Figure 4.
The nighttime light gravity center shift trajectories of integrated cities in 2013, 2015, and 2017. Note: the light gravity center shift trajectory is listed as: (a) Guangfo; (b) Guanshen; (c) Husu and (d) Xixian.

Figure 5.
The local R2 and coefficient distribution map of integrated cities in 2017.


Table 1.
Basic statistic information of sample integrated cities.
| Integrated City | City Composition | Population/million | Area/km2 | GDP/billion |
|---|---|---|---|---|
| Guangfo | Guangzhou | 15.3 | 7434.4 | 2362.9 |
| Foshan | 8.2 | 3797.7 | 1075.1 | |
| Guanshen | Dongguan | 8.4 | 2460.1 | 948.3 |
| Shenzhen | 13.4 | 1997.5 | 2692.7 | |
| Xixian | Xi’an | 10.2 | 10752 | 932.1 |
| Xianyang | 4.4 | 9543.6 | 219.5 | |
| Husu | Shanghai | 24.3 | 6340.5 | 3815.5 |
| Suzhou | 10.75 | 8657.3 | 1923.6 |
Table 2.
Land-use classification results of boundary zones under multiple buffer distances.
| City | Buffer Distance | Land Type | 2013 (km2) | 2015 (km2) | 2017 (km2) | Growth Rate (%) |
|---|---|---|---|---|---|---|
| Guangfo | 1 km | Building | 110.86 | 120.95 | 129.11 | 16.46 |
| Water | 44.21 | 38.29 | 37.02 | −16.27 | ||
| Vegetation | 135.45 | 131.28 | 124.39 | −8.16 | ||
| 3 km | Building | 319.90 | 347.72 | 373.33 | 16.70 | |
| Water | 98.76 | 89.65 | 85.34 | −13.59 | ||
| Vegetation | 364.68 | 345.97 | 324.67 | −10.97 | ||
| 5 km | Building | 518.26 | 559.56 | 603.02 | 16.35 | |
| Water | 143.75 | 140.35 | 135.64 | −5.64 | ||
| Vegetation | 567.53 | 551.12 | 511.51 | −13.51 | ||
| Guanshen | 1 km | Building | 55.56 | 54.70 | 59.41 | 6.92 |
| Water | 26.04 | 24.31 | 24.95 | −4.17 | ||
| Vegetation | 117.17 | 119.76 | 114.41 | −2.36 | ||
| 3 km | Building | 201.45 | 205.32 | 219.79 | 9.11 | |
| Water | 64.89 | 59.24 | 60.18 | −7.27 | ||
| Vegetation | 291.56 | 293.34 | 277.93 | −4.67 | ||
| 5 km | Building | 354.49 | 363.99 | 388.44 | 9.58 | |
| Water | 94.59 | 85.65 | 86.21 | −8.86 | ||
| Vegetation | 446.88 | 446.28 | 421.26 | −5.73 | ||
| Husu | 1 km | Building | 52.76 | 59.17 | 62.71 | 18.84 |
| Water | 38.94 | 34.99 | 32.83 | −15.69 | ||
| Vegetation | 126.90 | 124.45 | 123.07 | −3.02 | ||
| 3 km | Building | 176.83 | 197.54 | 206.45 | 16.75 | |
| Water | 106.22 | 95.18 | 91.92 | −13.46 | ||
| Vegetation | 327.35 | 317.69 | 312.05 | −4.68 | ||
| 5 km | Building | 305.56 | 335.69 | 346.13 | 13.28 | |
| Water | 172.45 | 156.38 | 151.96 | −11.88 | ||
| Vegetation | 505.45 | 491.35 | 485.48 | −3.95 | ||
| Xixian | 1 km | Building | 128.88 | 147.11 | 157.67 | 22.34 |
| Water | 12.85 | 6.27 | 7.59 | −40.96 | ||
| Vegetation | 185.67 | 174.02 | 162.14 | −12.68 | ||
| 3 km | Building | 346.18 | 366.81 | 420.11 | 21.35 | |
| Water | 16.17 | 8.22 | 10.83 | −33.04 | ||
| Vegetation | 569.60 | 556.90 | 501.00 | −12.04 | ||
| 5 km | Building | 570.53 | 604.40 | 672.40 | 17.85 | |
| Water | 20.70 | 11.60 | 15.25 | −26.31 | ||
| Vegetation | 917.07 | 892.22 | 820.32 | −10.55 |
Table 3.
The light intensity fluctuation and its linear regression of boundary zones.
| City | Light Intensity (nW/cm2/sr) | Increase Rate (%) | Fitting Equation | R2 | ||||||
|---|---|---|---|---|---|---|---|---|---|---|
| 2012 | 2013 | 2014 | 2015 | 2016 | 2017 | 2018 | ||||
| Guangfo | 7.95 | 9.12 | 9.52 | 9.98 | 9.51 | 9.88 | 10.79 | 35 | y = 0.34x + 8.10 | 0.79 |
| Guanshen | 8.75 | 9.37 | 10.43 | 10.3 | 10.56 | 11.27 | 12.62 | 44 | y = 0.55x + 8.25 | 0.91 |
| Husu | 6.34 | 6.76 | 7.66 | 7.64 | 7.17 | 8.29 | 8.53 | 36 | y = 0.33x + 6.17 | 0.80 |
| Xixian | 3.42 | 3.75 | 2.72 | 4.02 | 3.88 | 5.74 | 5.93 | 73 | y = 0.45x + 2.40 | 0.67 |
Table 4.
The Operational Linescan System (OLS) analysis results of the Normalized Difference Vegetation Index (NDVI), the Normalized Difference Building Index (NDBI), and VIIRS Cloud Mask product (VCM) in four integrated cities.
Table 4.
The Operational Linescan System (OLS) analysis results of the Normalized Difference Vegetation Index (NDVI), the Normalized Difference Building Index (NDBI), and VIIRS Cloud Mask product (VCM) in four integrated cities.
| Name | Index | Year | OLS | |
|---|---|---|---|---|
| Guangfo | NDVI | 2013 | 0.228 * | |
| 2017 | 0.275 * | |||
| NDBI | 2013 | 0.382 * | ||
| 2017 | 0.445 * | |||
| Guanshen | NDVI | 2013 | 0.373 * | |
| 2017 | 0.495 * | |||
| NDBI | 2013 | 0.449 * | ||
| 2017 | 0.535 * | |||
| Husu | NDVI | 2013 | −0.001 | |
| 2017 | −0.0007 | |||
| NDBI | 2013 | 0.355 * | ||
| 2017 | 0.198 * | |||
| Xixian | NDVI | 2013 | 0.316 * | |
| 2017 | 0.179 * | |||
| NDBI | 2013 | 0.273 * | ||
| 2017 | 0.180 * |
* .
© 2020 by the authors. Licensee MDPI, Basel, Switzerland. This article is an open access article distributed under the terms and conditions of the Creative Commons Attribution (CC BY) license (http://creativecommons.org/licenses/by/4.0/).
Share and Cite
MDPI and ACS Style
Zheng, Z.; Wu, Z.; Chen, Y.; Yang, Z.; Marinello, F. Detection of City Integration Processes in Rapidly Urbanizing Areas Based on Remote Sensing Imagery. Land 2020, 9, 378. https://doi.org/10.3390/land9100378
AMA Style
Zheng Z, Wu Z, Chen Y, Yang Z, Marinello F. Detection of City Integration Processes in Rapidly Urbanizing Areas Based on Remote Sensing Imagery. Land. 2020; 9(10):378. https://doi.org/10.3390/land9100378
Chicago/Turabian StyleZheng, Zihao, Zhifeng Wu, Yingbiao Chen, Zhiwei Yang, and Francesco Marinello. 2020. "Detection of City Integration Processes in Rapidly Urbanizing Areas Based on Remote Sensing Imagery" Land 9, no. 10: 378. https://doi.org/10.3390/land9100378
Note that from the first issue of 2016, this journal uses article numbers instead of page numbers. See further details here.