Assessing the Effect of Land Use Change on Surface Runoff in a Rapidly Urbanized City: A Case Study of the Central Area of Beijing


1
Beijing Laboratory of Water Resources Security, Capital Normal University, Beijing 100048, China
2
State Key Laboratory Incubation Base of Urban Environmental Processes and Digital Simulation, Capital Normal University, Beijing 100048, China
3
College of Resource Environment and Tourism, Capital Normal University, Beijing 100048, China
4
Land Satellite Remote Sensing Application Center (LASAC), Beijing 100048, China
*
Author to whom correspondence should be addressed.
Land 2020, 9(1), 17; https://doi.org/10.3390/land9010017
Submission received: 18 December 2019
/
Revised: 4 January 2020
/
Accepted: 8 January 2020
/
Published: 10 January 2020
(This article belongs to the Section Urban Contexts and Urban-Rural Interactions)
Abstract
:The change in land use during the process of urbanization affects surface runoff and increases flood risk in big cities. This study investigated the impact of land use change on surface runoff in Beijing’s central area during the period of rapid urbanization from 1984 to 2019. Land use maps of 1984, 1999, 2009, and 2019 were generated by image classification of Landsat images. Surface runoffs were calculated with the Soil Conservation Service curve number (SCS-CN) model. Correlation analysis was used to identify the dominant factor of land use change affecting surface runoff. The result showed that the variation trend of surface runoff was consistent with the trend of impervious land in Beijing’s central area, which increased during 1984~2009 and decreased during 2009~2019. Correlation analysis showed that changes in surface runoff were most strongly correlated with changes in impervious surfaces when compared with the correlation of runoff with other types of land use. The results of this study may provide a reference for city flood control and urban planning in fast growing cities worldwide, especially in developing countries.
1. Introduction
Urbanization is the inevitable trend of the development of the world today. It has been estimated that about 64% of developing countries and 86% of developed countries will be urbanized by 2050 [1,2]. In the process of urbanization, large amounts of agricultural or other non-urban land are transformed into impervious land and the land use change totally alters natural hydrological processes [3,4]. Several studies investigated the effects of urbanization-induced land use changes on runoff. The rapid expansion of urban impervious area increased surface runoff yield amount [5,6], peak discharge [7,8], and runoff ratio [9,10], reduced runoff response time [11,12], and changed hydrological regimes [12,13,14]. It also changed the long-term groundwater recharge [15,16] and water balance [17,18]. Quantitative assessment of the impact of urbanization on surface runoff is essential for urban planning, water resources management, and for early flood warning in big cities.
China has experienced rapid urbanization in the last 40 years and floods caused by rapid urbanization have threatened human health and economic development. A great deal of research on urban hydrological processes has been carried out in Shanghai [19], Shenzhen [20,21], Shenyang [22], Nanjing [23], and other cities. As the capital and supercity of China, urban flood and waterlogging in Beijing deserve special attention. Xu et al. [24] evaluated the impact of urbanization on rainfall-runoff processes using the Storm Water Management Model (SWMM) in the Dahongmen catchment in Beijing and the results showed that the volume of surface runoff after urbanization was 3.5-times greater than that before urbanization, where the coefficient of runoff changed from 0.12 to 0.41. Fang et al. [25] used historical data to identify the impact of urbanization on typical rainfall-runoff process in the Liangshui River urban watershed and the results indicated that the runoff coefficient in the lower reaches was one-third of that in the upper reaches and pointed out that the proportion of impermeable area was the key control condition of the flood process.
Several approaches have been used to estimate the urban hydrological effect [26], including hydrological simulation, field experiments, and monitoring data comparison for different underlying surfaces. However, due to the high cost and restrictions imposed by urban management, it is difficult to acquire sufficient monitoring data. Modeling of social-ecological processes offer a possible avenue to deal with these challenges. The social-ecological model provides a process-based understanding of the complex linkages between people and the environment [27,28,29] and has been used by hydrologists for understanding the interaction of human society and hydrological systems. When coupled with land use data, models, such as SCS-CN, Soil and Water Assessment Tool (SWAT), SWMM, The Hydrologic Engineering Center’s-Hydrologic Modeling System (HEC-HMS), and MIKE System Hydrological European (Mike SHE), have been extensively used to assess the effects of land use changes (predominantly urbanization) on hydrologic processes [30,31,32,33,34]. For example, Du et al. [35] coupled a distributed hydrologic and a dynamic land use change model to examine the effects of urbanization on annual runoff and flood events of the Qinhuai River watershed in China. Therefore, the applicability of the hydrological model for the assessment of land use change impact is cost-effective and efficient.
In this study, we selected the inner area within the Fifth Ring Road of Beijing, the core of the rapidly urbanized city, as the study case. We integrated GIS and remote sensing methods with the SCS-CN model to assess the impact of land use change on surface runoff. The main objectives were to: (1) investigate the characteristics of land use change from 1984 to 2019, (2) evaluate the impact of land use change on the temporal and spatial distribution of surface runoff, and (3) identify the main factors affecting surface runoff change.
2. Materials and Methods
2.1. Study Area
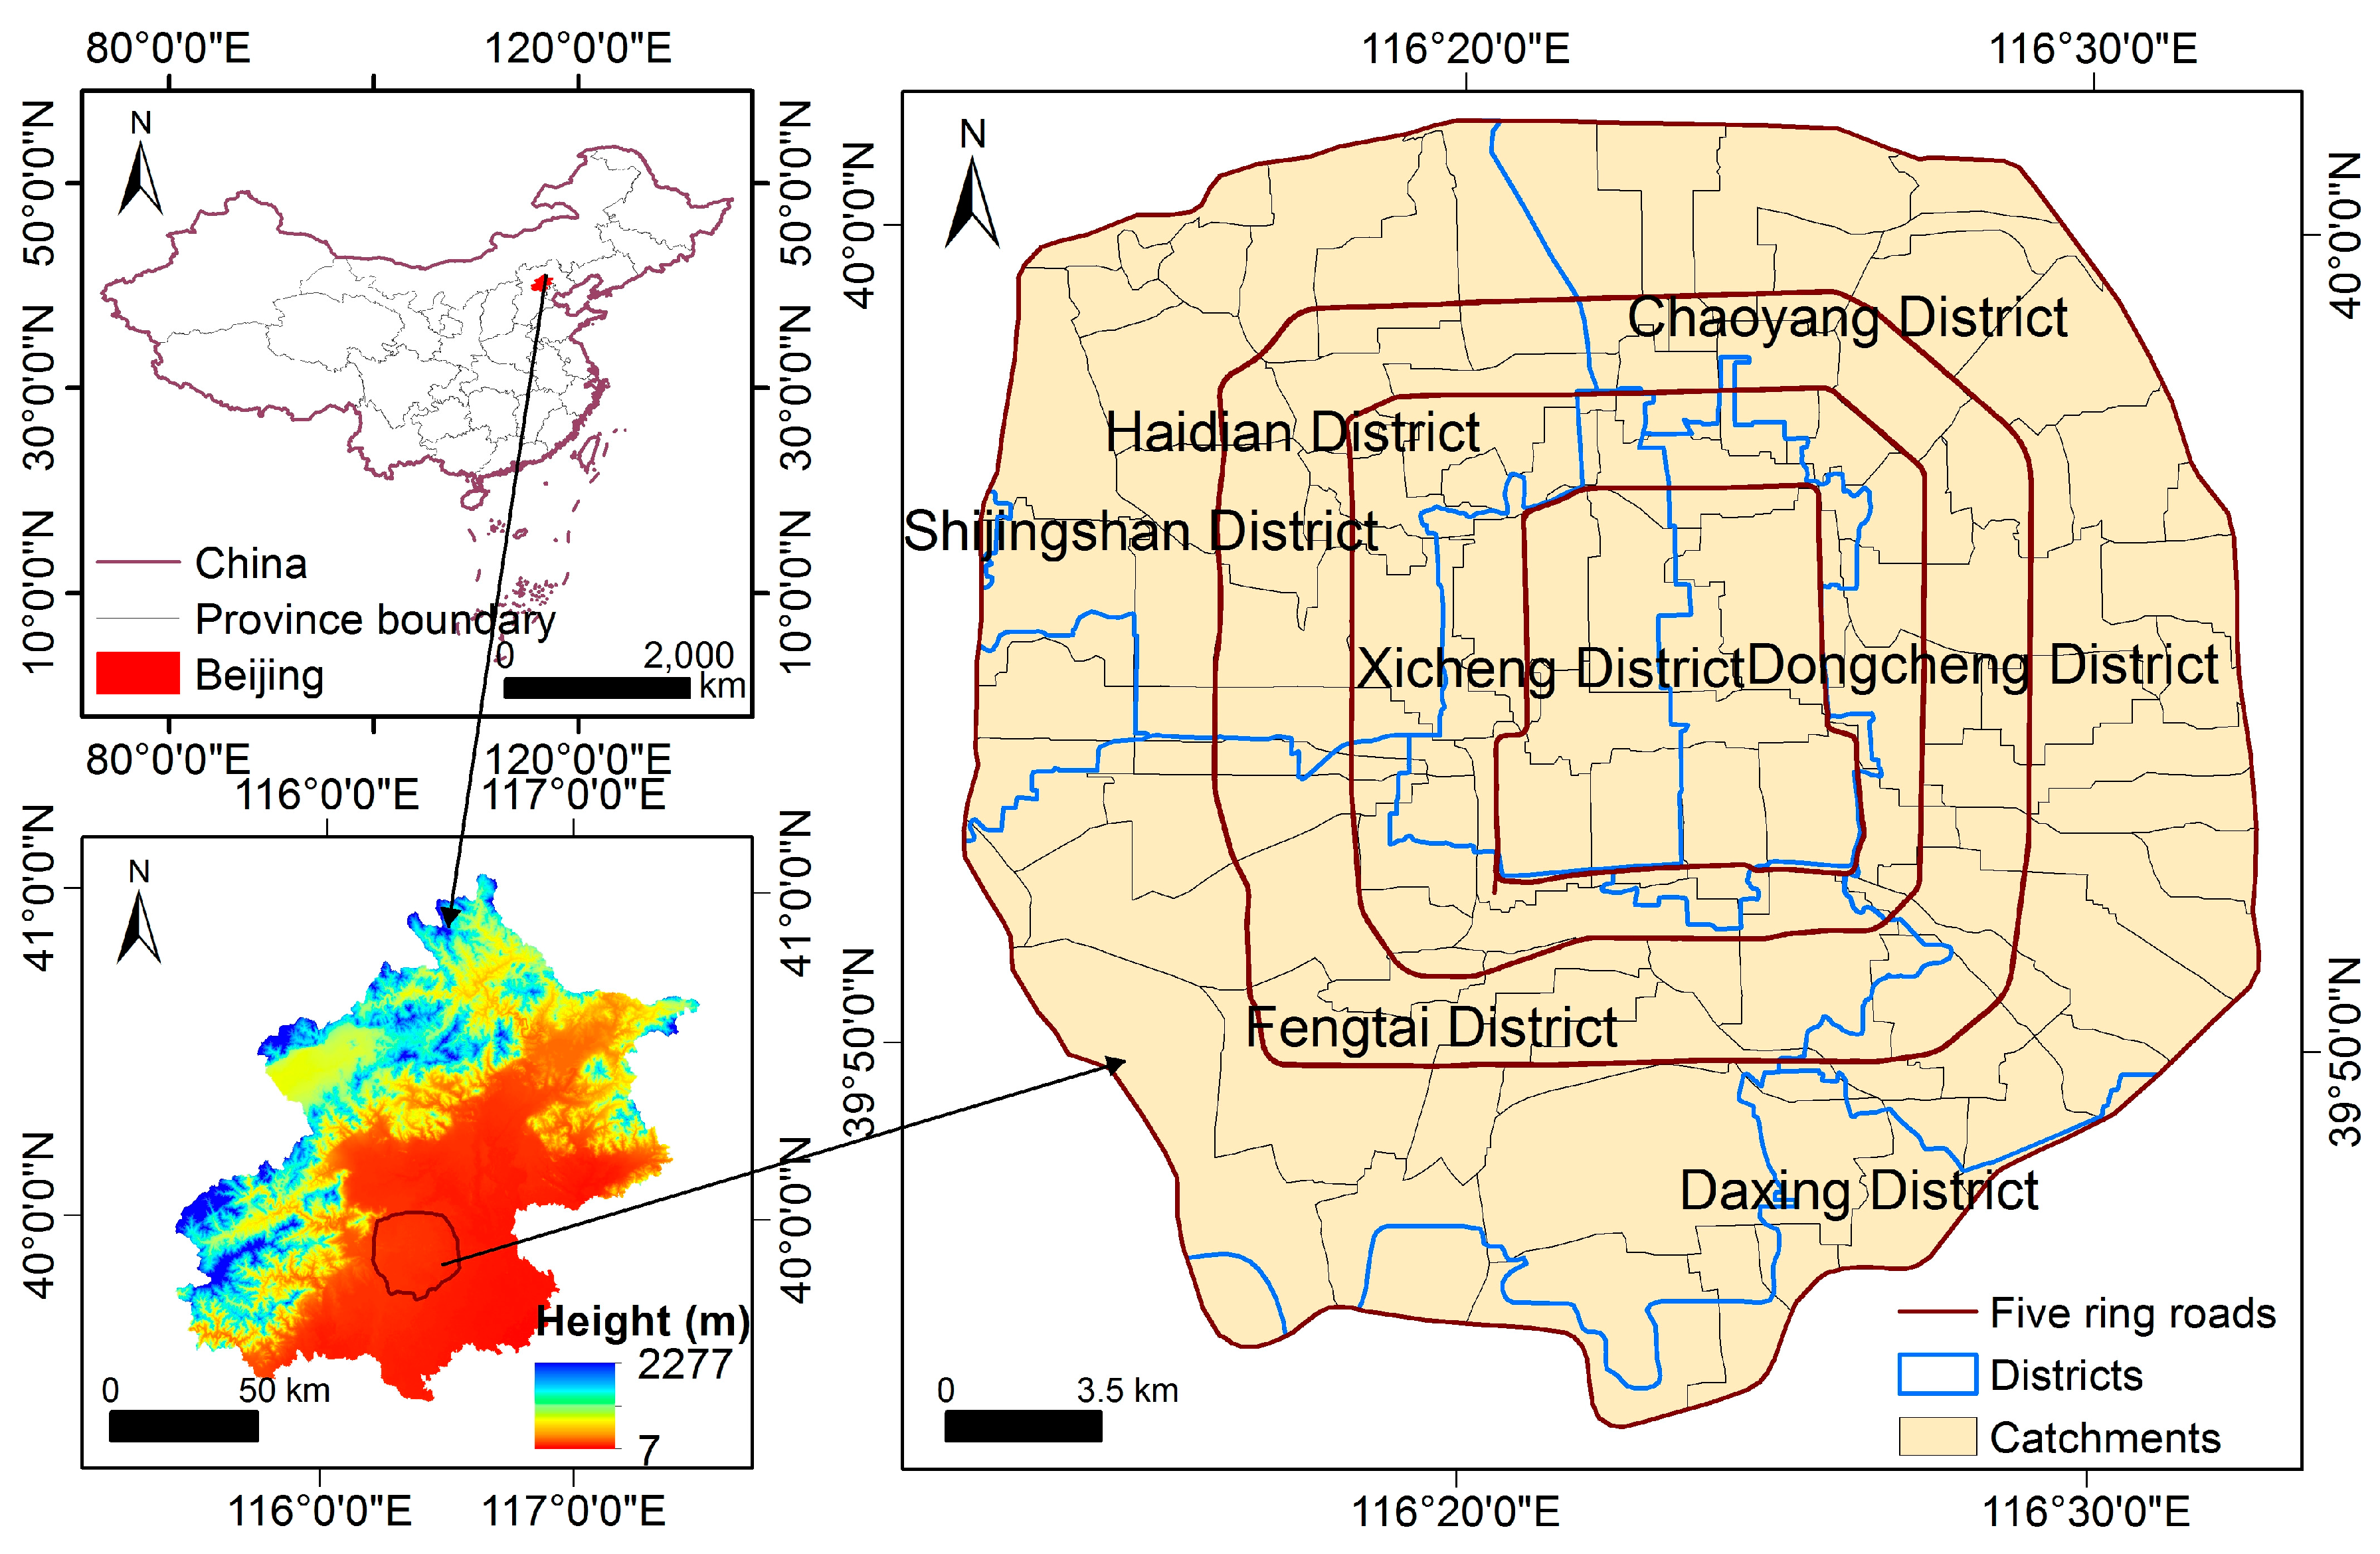
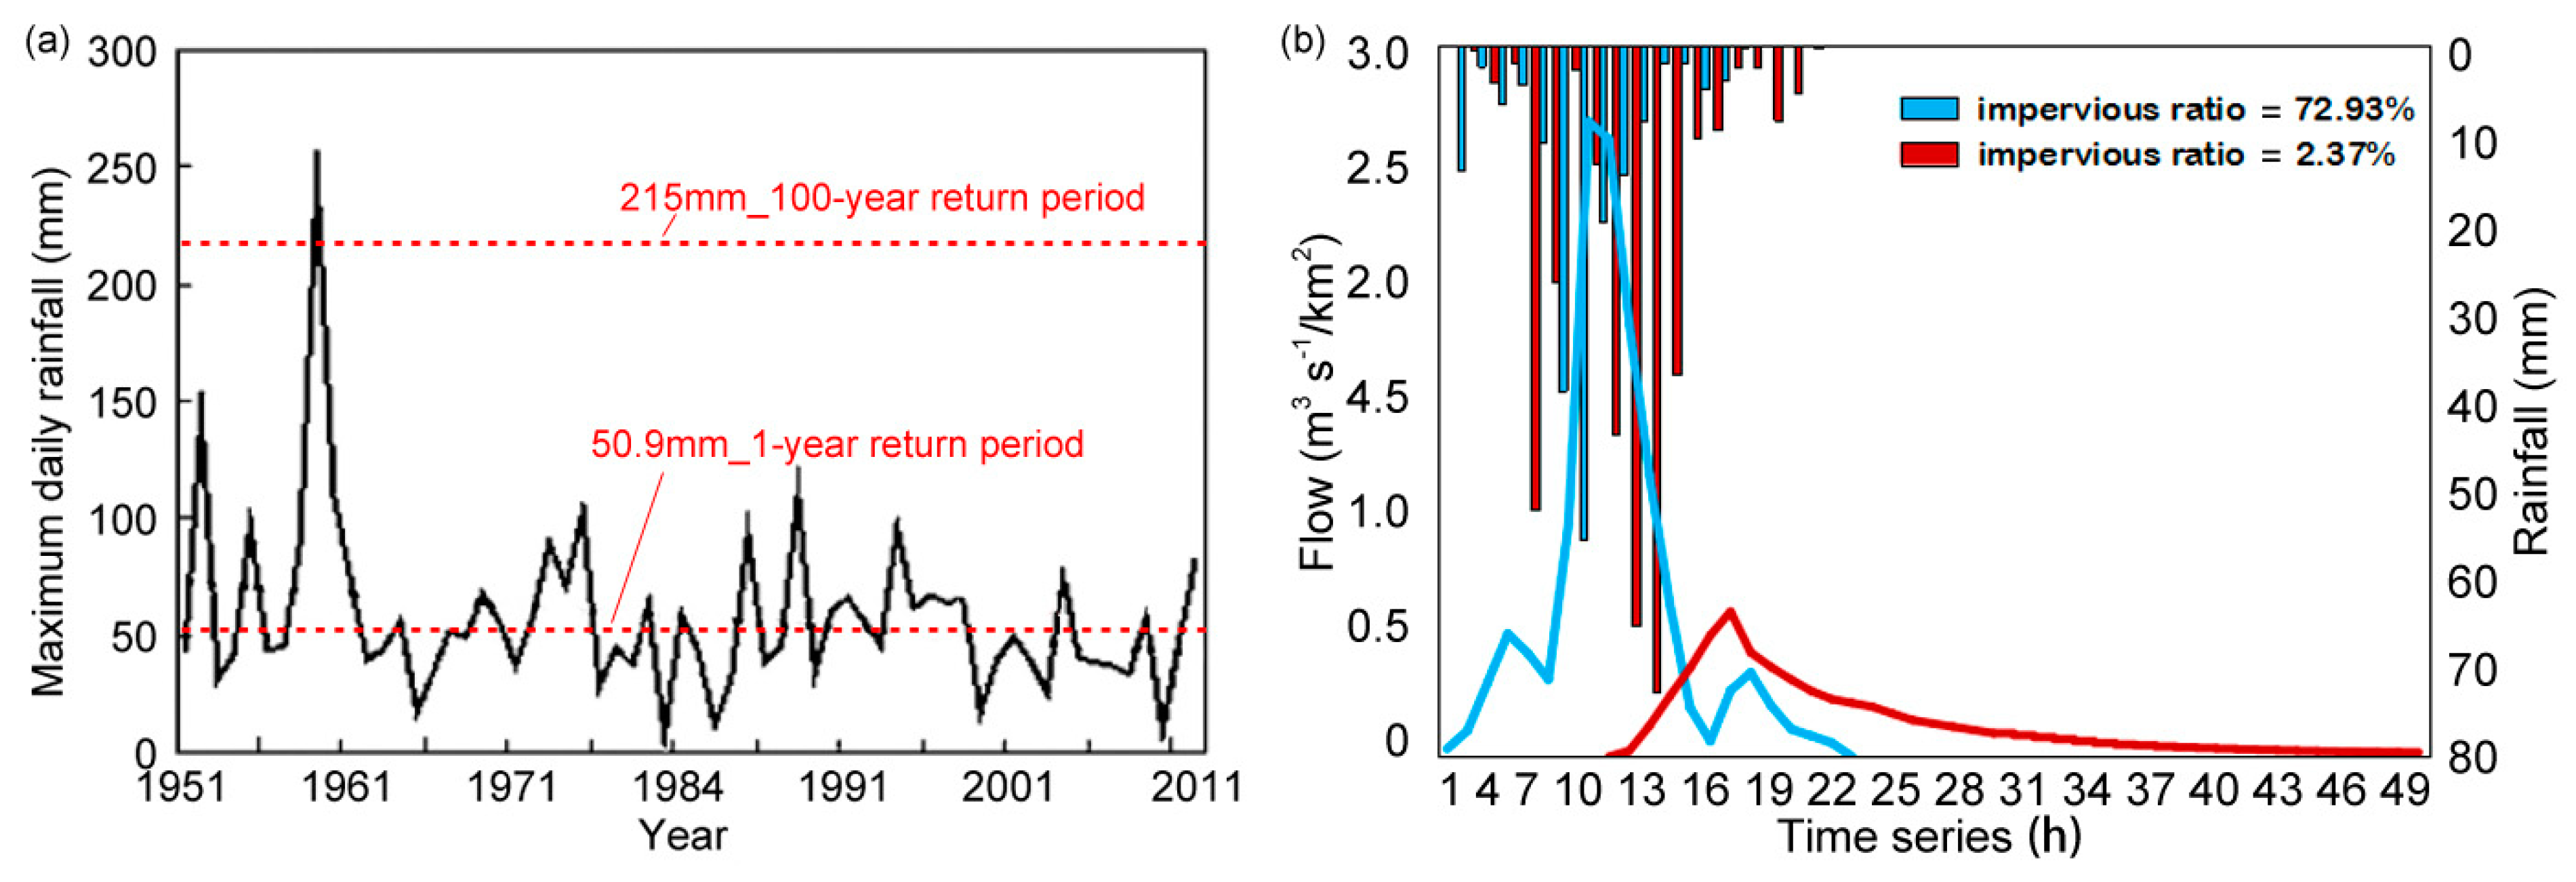
In this research, the area within the Fifth Ring Road of Beijing was chosen as the study area (39°26′–41°03′N, 115°25′–117°30′E). It occupies a total of 675 km2 and belongs to the plain area with an average elevation of 48 m (Figure 1). The study area lies in the temperate monsoon climate region. The annual average precipitation is 548 mm, over 80% of which falls in the flood season (from June to September) [9]. The maximum daily precipitation from 1954 to 2011 in Beijing is shown in Figure 2a. The soil type in the study area is alluvial soil [36], the main soil texture is loam [37], and the average soil hydraulic conductivity in most areas of Beijing is 18–180 mm/h [38].
The urban area of Beijing has gradually expanded from the central to suburban areas and a ring road network was created in the past 30 years. The area within the Fifth Ring Road is the fastest growing urbanized section with most of the population and the greatest built-up areas. The change in land use has an obvious influence on runoff (Figure 2b). Therefore, it is essential and valuable to assess the hydrologic impacts of land use changes in the process of urbanization.
2.2. Data Sources
The data used in this study were derived from three sources:
- (1)
- The Landsat Thematic Mapper (TM) and Operational Land Imager (OLI) remote sensing images of 1984, 1999, 2009, and 2019 were acquired from United States Geological Survey (USGS). The imaging dates for them were 16/08/1984, 01/07/1999, 22/09/2009, and 29/05/2019, respectively [39]. The spatial resolution of the image data is 30 m. These images were used to extract land use information;
- (2)
- Daily precipitation data series at 55 gauges in the urban area of Beijing were provided by the Beijing Meteorological Service [40];
- (3)
- The 1:450,000 map of the small watershed of Beijing was provided by Beijing Hydrological Station. The delineation of the catchments was carried out by combining multi-source data: the 1:10,000 Digital Elevation Model (DEM), the urban drainage pipelines data, sewage outlets, and water dams locations [41]. In this paper, the study area was divided into 77 catchments for surface runoff simulation.
2.3. Methods
2.3.1. Land Use Mapping and Change Analysis
The study area was classified into six types of land use: impervious land, water, unused land, woodland, grassland, and farmland. Detailed descriptions of these land use classes are provided in Table 1. The land use was mapped by support vector machine (SVM) classification method and manual post-editing. The training samples were manually selected from remote sensing images. The accuracy assessment points were generated randomly using ArcGIS and the ground truth classes for these points were manually identified using aerial photos and high-resolution images from Google Earth. The test sample size was 150 for each year.
The confusion matrix method [42] was used to assess the accuracies of land use maps and four measures, namely, the producer’s accuracy (PA, accounting for errors of omission), user’s accuracy (UA, accounting for errors of commission), overall accuracy (OA), and overall kappa were computed to evaluate classification accuracy. In addition, this paper employed a transfer matrix to analyze land use change in different stages of urbanization.
2.3.2. Calculating Surface Runoff
The SCS-CN model was employed to calculate the surface runoff for the 77 catchments. The SCS-CN model is a general empirical hydrological model. Compared with the traditional hydrological models, it requires fewer calculation parameters and fewer observation data [43,44]. In recent years, it has been widely used for runoff estimation at different spatial scales [45,46] and several studies have shown that the SCS-CN model can also be applied to estimate the surface runoff in highly urbanized areas where actual hydrological data are difficult to obtain [47,48].
The SCS-CN model is based on the water balance equation, as shown in Equation (1), and two fundamental hypotheses described by Equations (2) and (3) [49,50,51].
where Q is the surface runoff depth (mm), P is the rainfall depth (mm), Ia is the initial abstraction of the rainfall (mm), F is the cumulative infiltration excluding Ia, S represents potential maximum retention or infiltration, and the initial abstraction coefficient λ is a constant that usually ranges between 0.0 and 0.2, and a value of 0.2 was used in this study according to Natural Resources Conservation Service (NRCS) [52].
The surface runoff depth (Q) could be derived from Equations (1) and (2):
Equation (4) is valid only when the rainfall value is greater than the value of initial abstraction (Ia). When the rainfall is less than the initial abstraction, the flow value is zero. So, Q could be quantified in the following equation:
In Equation (5), S was derived by the dimensionless parameter CN, and the variation range of CN is 0 ≤ CN ≤ 100.
For the SCS-CN model, the parameter CN is the decisive parameter for the size of the runoff, which is primarily related to land use and soil type. The United States Department of Agriculture (USDA) also provides a curve number (CN) look-up table with assignments of different types of land use to facilitate hydrological simulation [52]. Meanwhile, the USDA has created several different hydrologic soil groups (A, B, C, and D) to represent different infiltration capacities of soils [53]. In this paper, we chose B-group soil type and set the antecedent soil moisture condition (AMC) to moderate condition (AMCII). The CN values of different land use types were assigned as: impervious land (98), unused land (86), farmland (78), grassland (61), woodland (58), and water (100). Combining the CN values of different land use types, we used the area weight method to calculate the comprehensive CN values of different catchments to simulate the surface runoff [54].
2.3.3. Analyzing Surface Runoff Changes
The impact of land use change on surface runoff was assessed by evaluating the runoff discrepancies under different land use conditions. The rainstorm on 21 July 2012 (7.21 rainstorm), with a cumulative rainfall of 215 mm, and the rainstorm on 5 July 2017 (7.5 rainstorm), with a cumulative rainfall of 50.9 mm, were chosen for the simulation as the precipitation input (Figure 2). The 7.21 rainstorm, which caused serious losses [55], is considered to be a rainfall event with a 100a return period and the 7.5 rainstorm is considered to be a rainfall event with a 1a return period. These two rainfall events represent extreme precipitation and average precipitation conditions, respectively. The surface runoff of each catchment was simulated by inputting the land use maps of 1984, 1999, 2009, and 2019 individually to drive the SCS-CN model under different rainfall events. Two variables were defined to evaluate the surface runoff changes: the surface runoff depth (Q) and the surface runoff coefficient (α). The impact assessment was conducted by comparing the difference of runoff variables between the initial land use condition and final land use condition. The equations are given as:
where Qa and Qb are the surface runoff depth (mm) in the initial and final land use scenarios of each stage, P is the rainfall depth (mm), ΔQ and Δα represent the absolute amount of runoff change, ΔC represents the relative degree of change. If ΔQ and Δα are positive, it indicates that the land use change at this stage leads to an increase in runoff.
2.3.4. Analyzing the Correlation between Surface Runoff Change and Land Use Change
Correlation analysis was used to examine the relationships between surface runoff change and the land use driving factors. Considering that the data did not satisfy the two conditions of linear correlation in the strict sense that (1) the data is obtained from the normal distribution in pairs and (2) the data must be equally spaced data at least in the logical category, this paper used the spearman correlation analysis. It can be inferred that the larger a correlation coefficient is, the more important that factor is in the change of surface runoff.
3. Results
3.1. Land Use/Land Cover Change
We used the independent reference pixels for accuracy assessment. The result is shown in Table 2. The overall accuracy (OA) of the four land use maps in 1984, 1999, 2009, and 2019 were 90.7%, 92.7%, 93.3%, and 94.7%, respectively. OA measures for all four land use maps were better than 90%, and both the PA and UA measures for all four land use maps were greater than 92%.
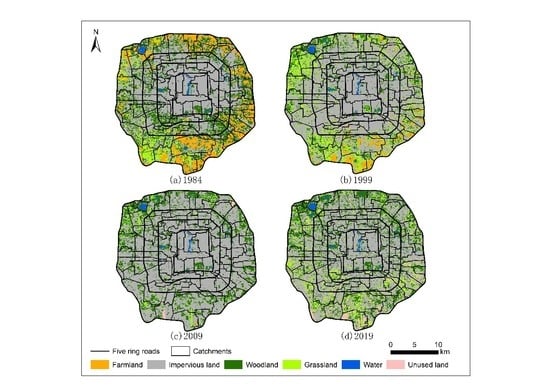
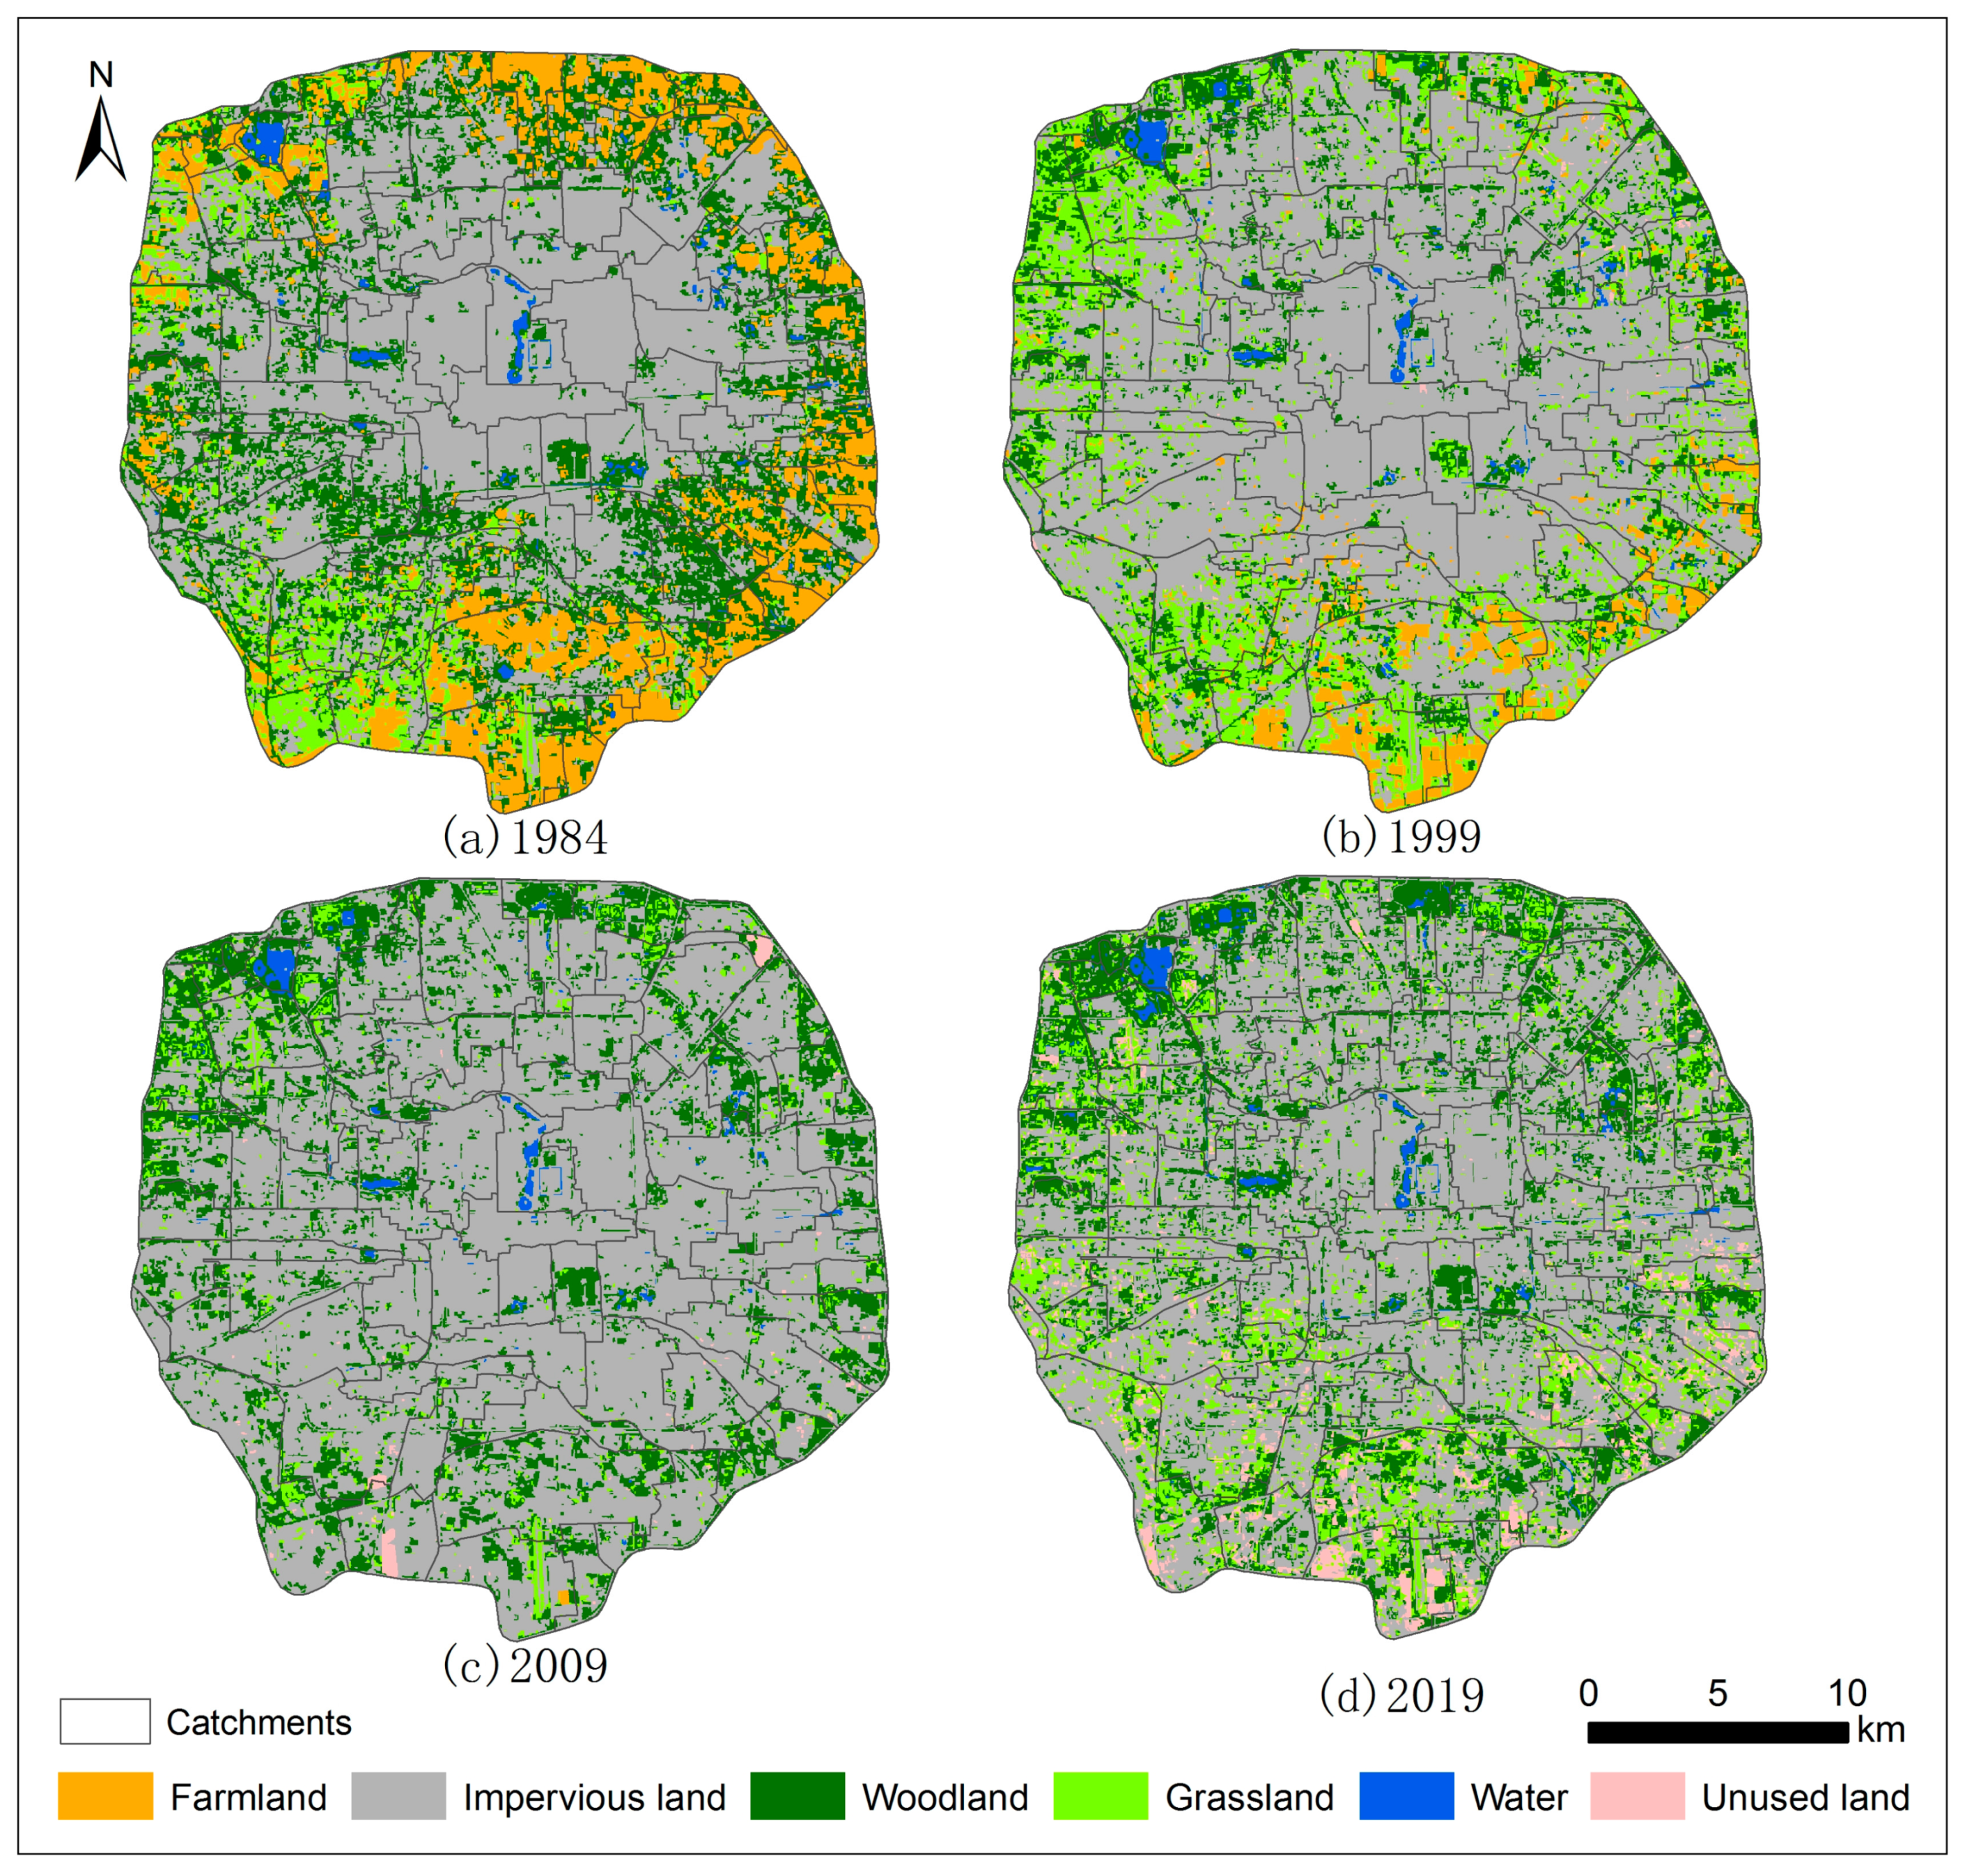
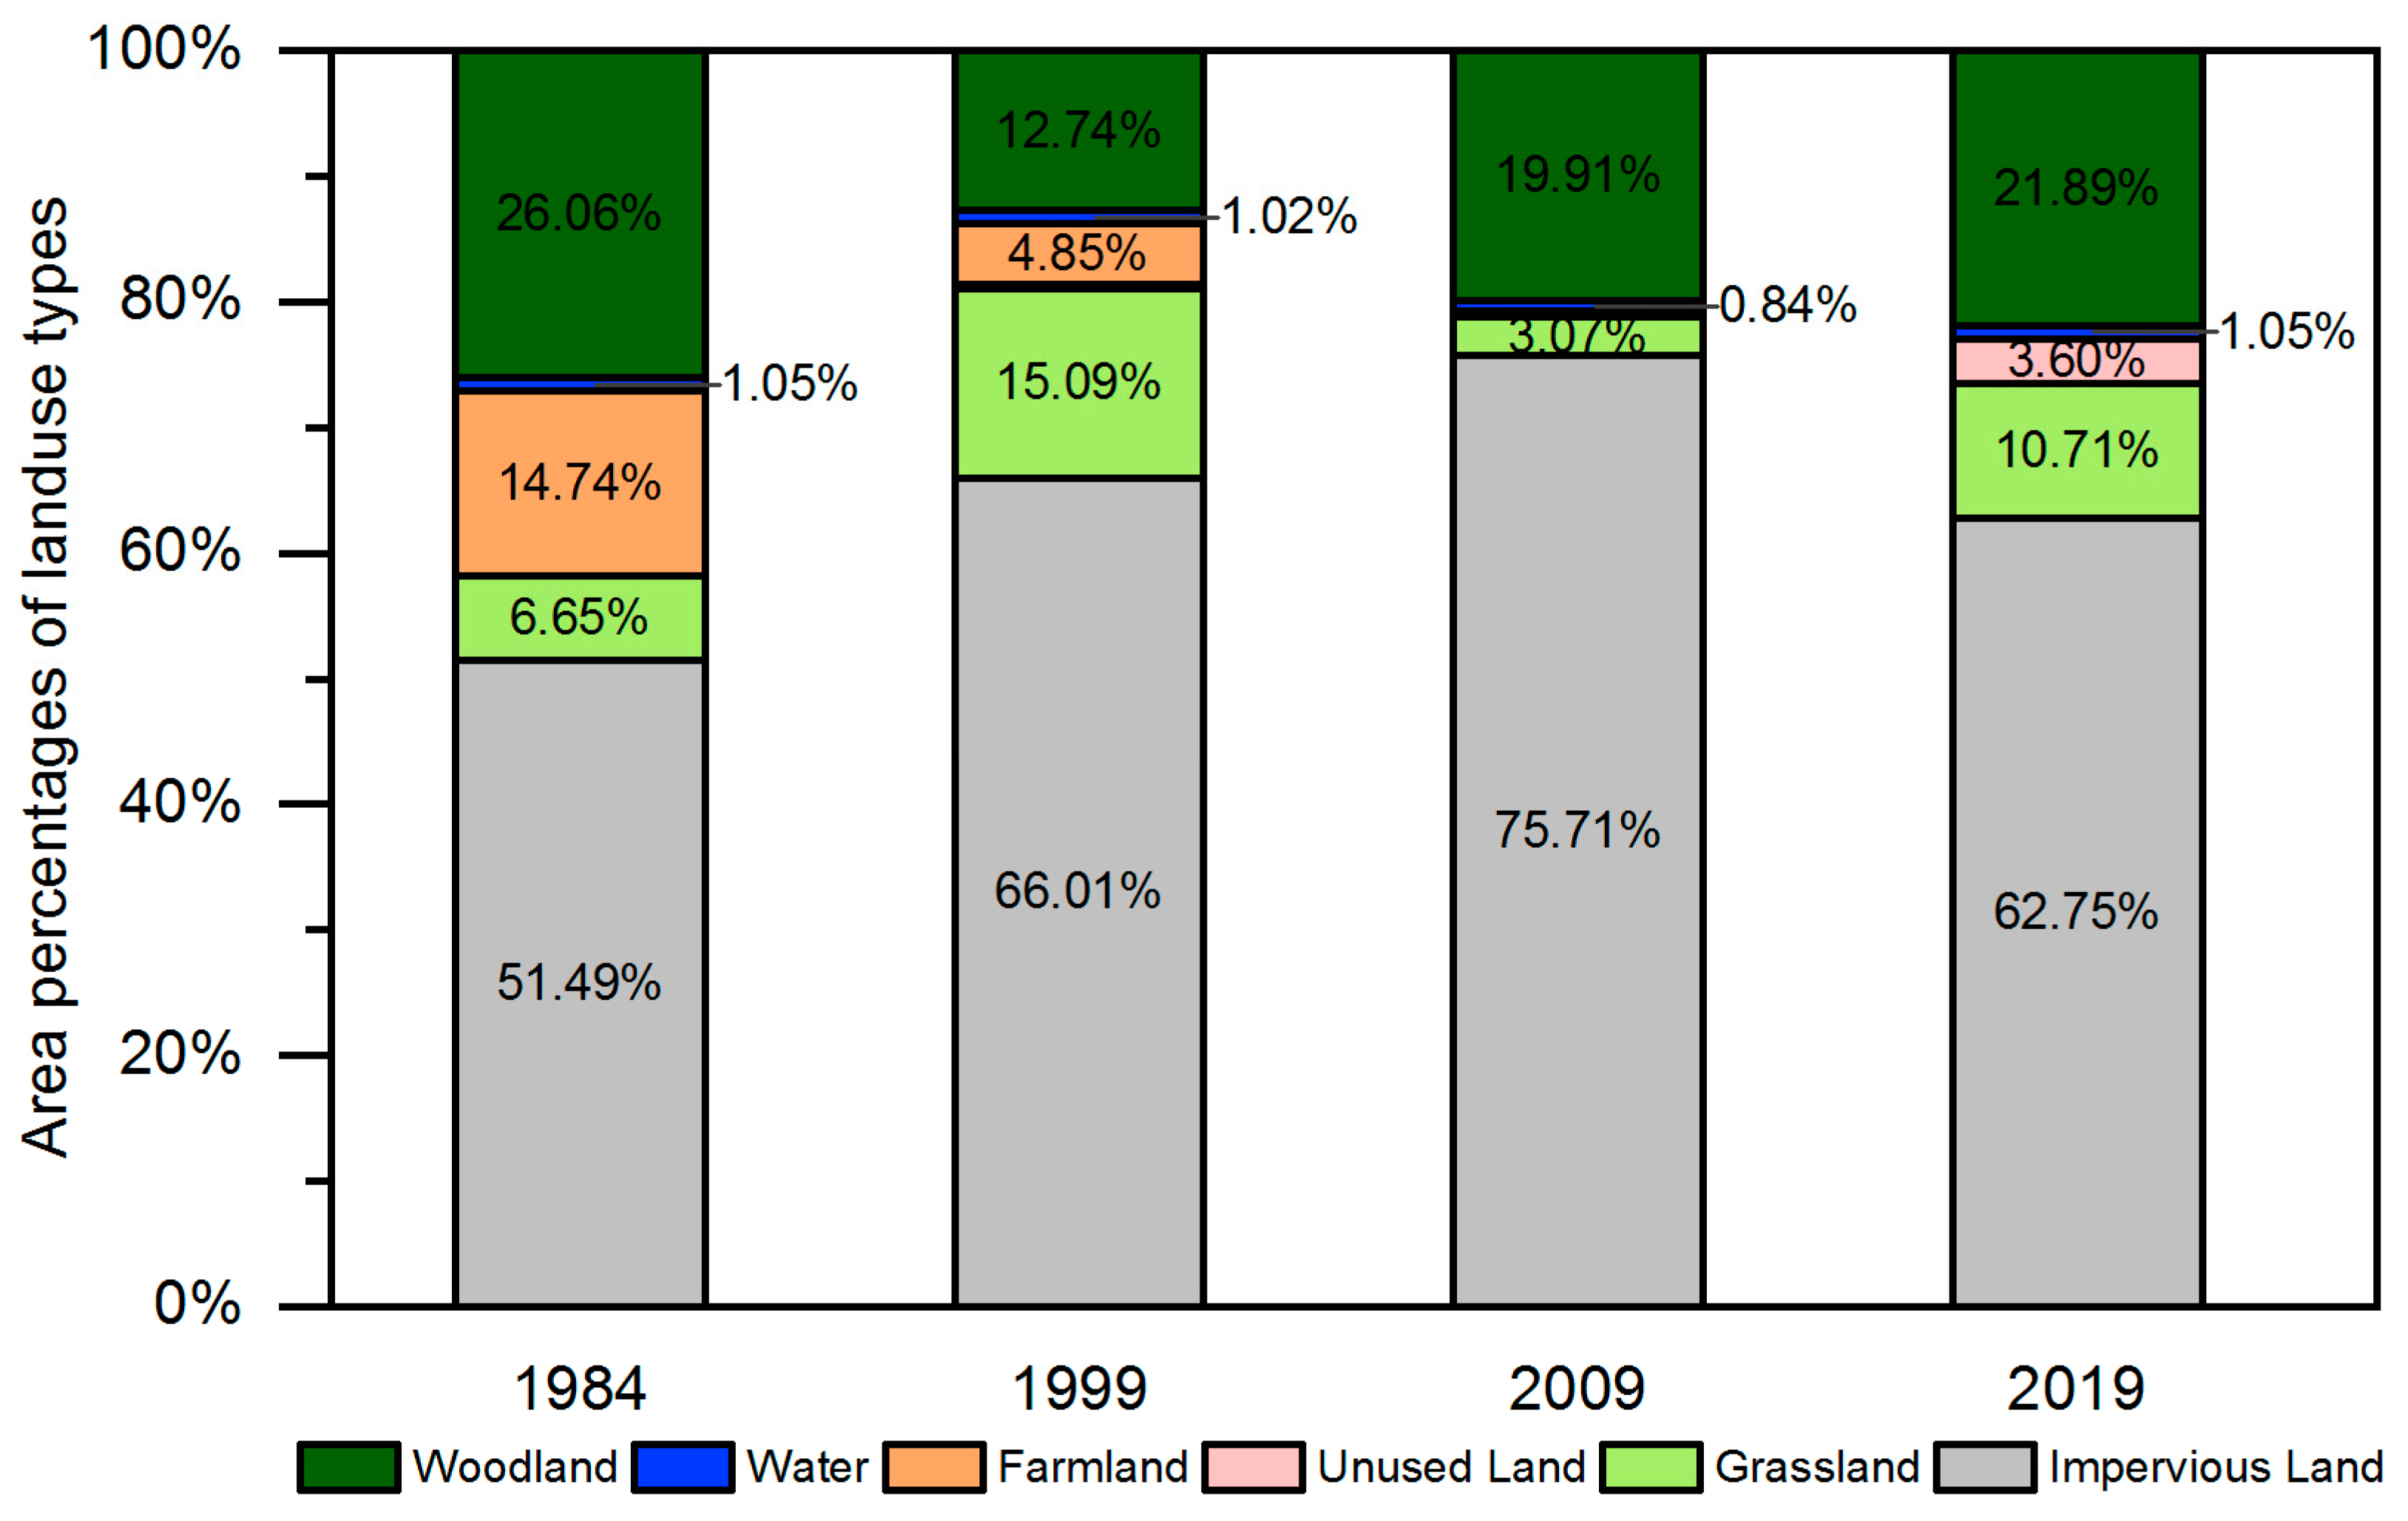
The generated land use maps of the study area are shown in Figure 3. The distribution of land use in the city’s core area experienced an obvious change during the study period. Figure 4 shows the land use types and the corresponding percentages in the watersheds. The impervious surface was the main land use type in the study area and it exceeded 50% during the entire study period. The impervious surface was distributed mainly in the area within the third ring road. Concerning the changes in land use, the conversion of land use types mainly occurred in the reduction of farmland and the increase of impervious surface. From 1984 to 2019, impervious land increased the most, which was from 51.49% to 62.75%, while farmland decreased from 14.74% to zero. It should be noted that land use conversion differed in stages. In the first stage (1984–1999), the area of farmland and woodland decreased by more 10%, while the area of impervious land increased rapidly from 51.49% to 66.01%. In the second stage (1999–2009), the proportion of impervious land rose to 75.71% in 2009 and the area of farmland continued to decrease until it almost disappeared in 2009. In the third stage (2009–2019), the proportion of impervious surface decreased by 12.96% and continued to be converted to other land types. Spatially, the area that changed was mainly located between the third ring and the fifth ring, and the amount of change in the south was relatively larger than that in the north.
3.2. Surface Runoff Characteristics
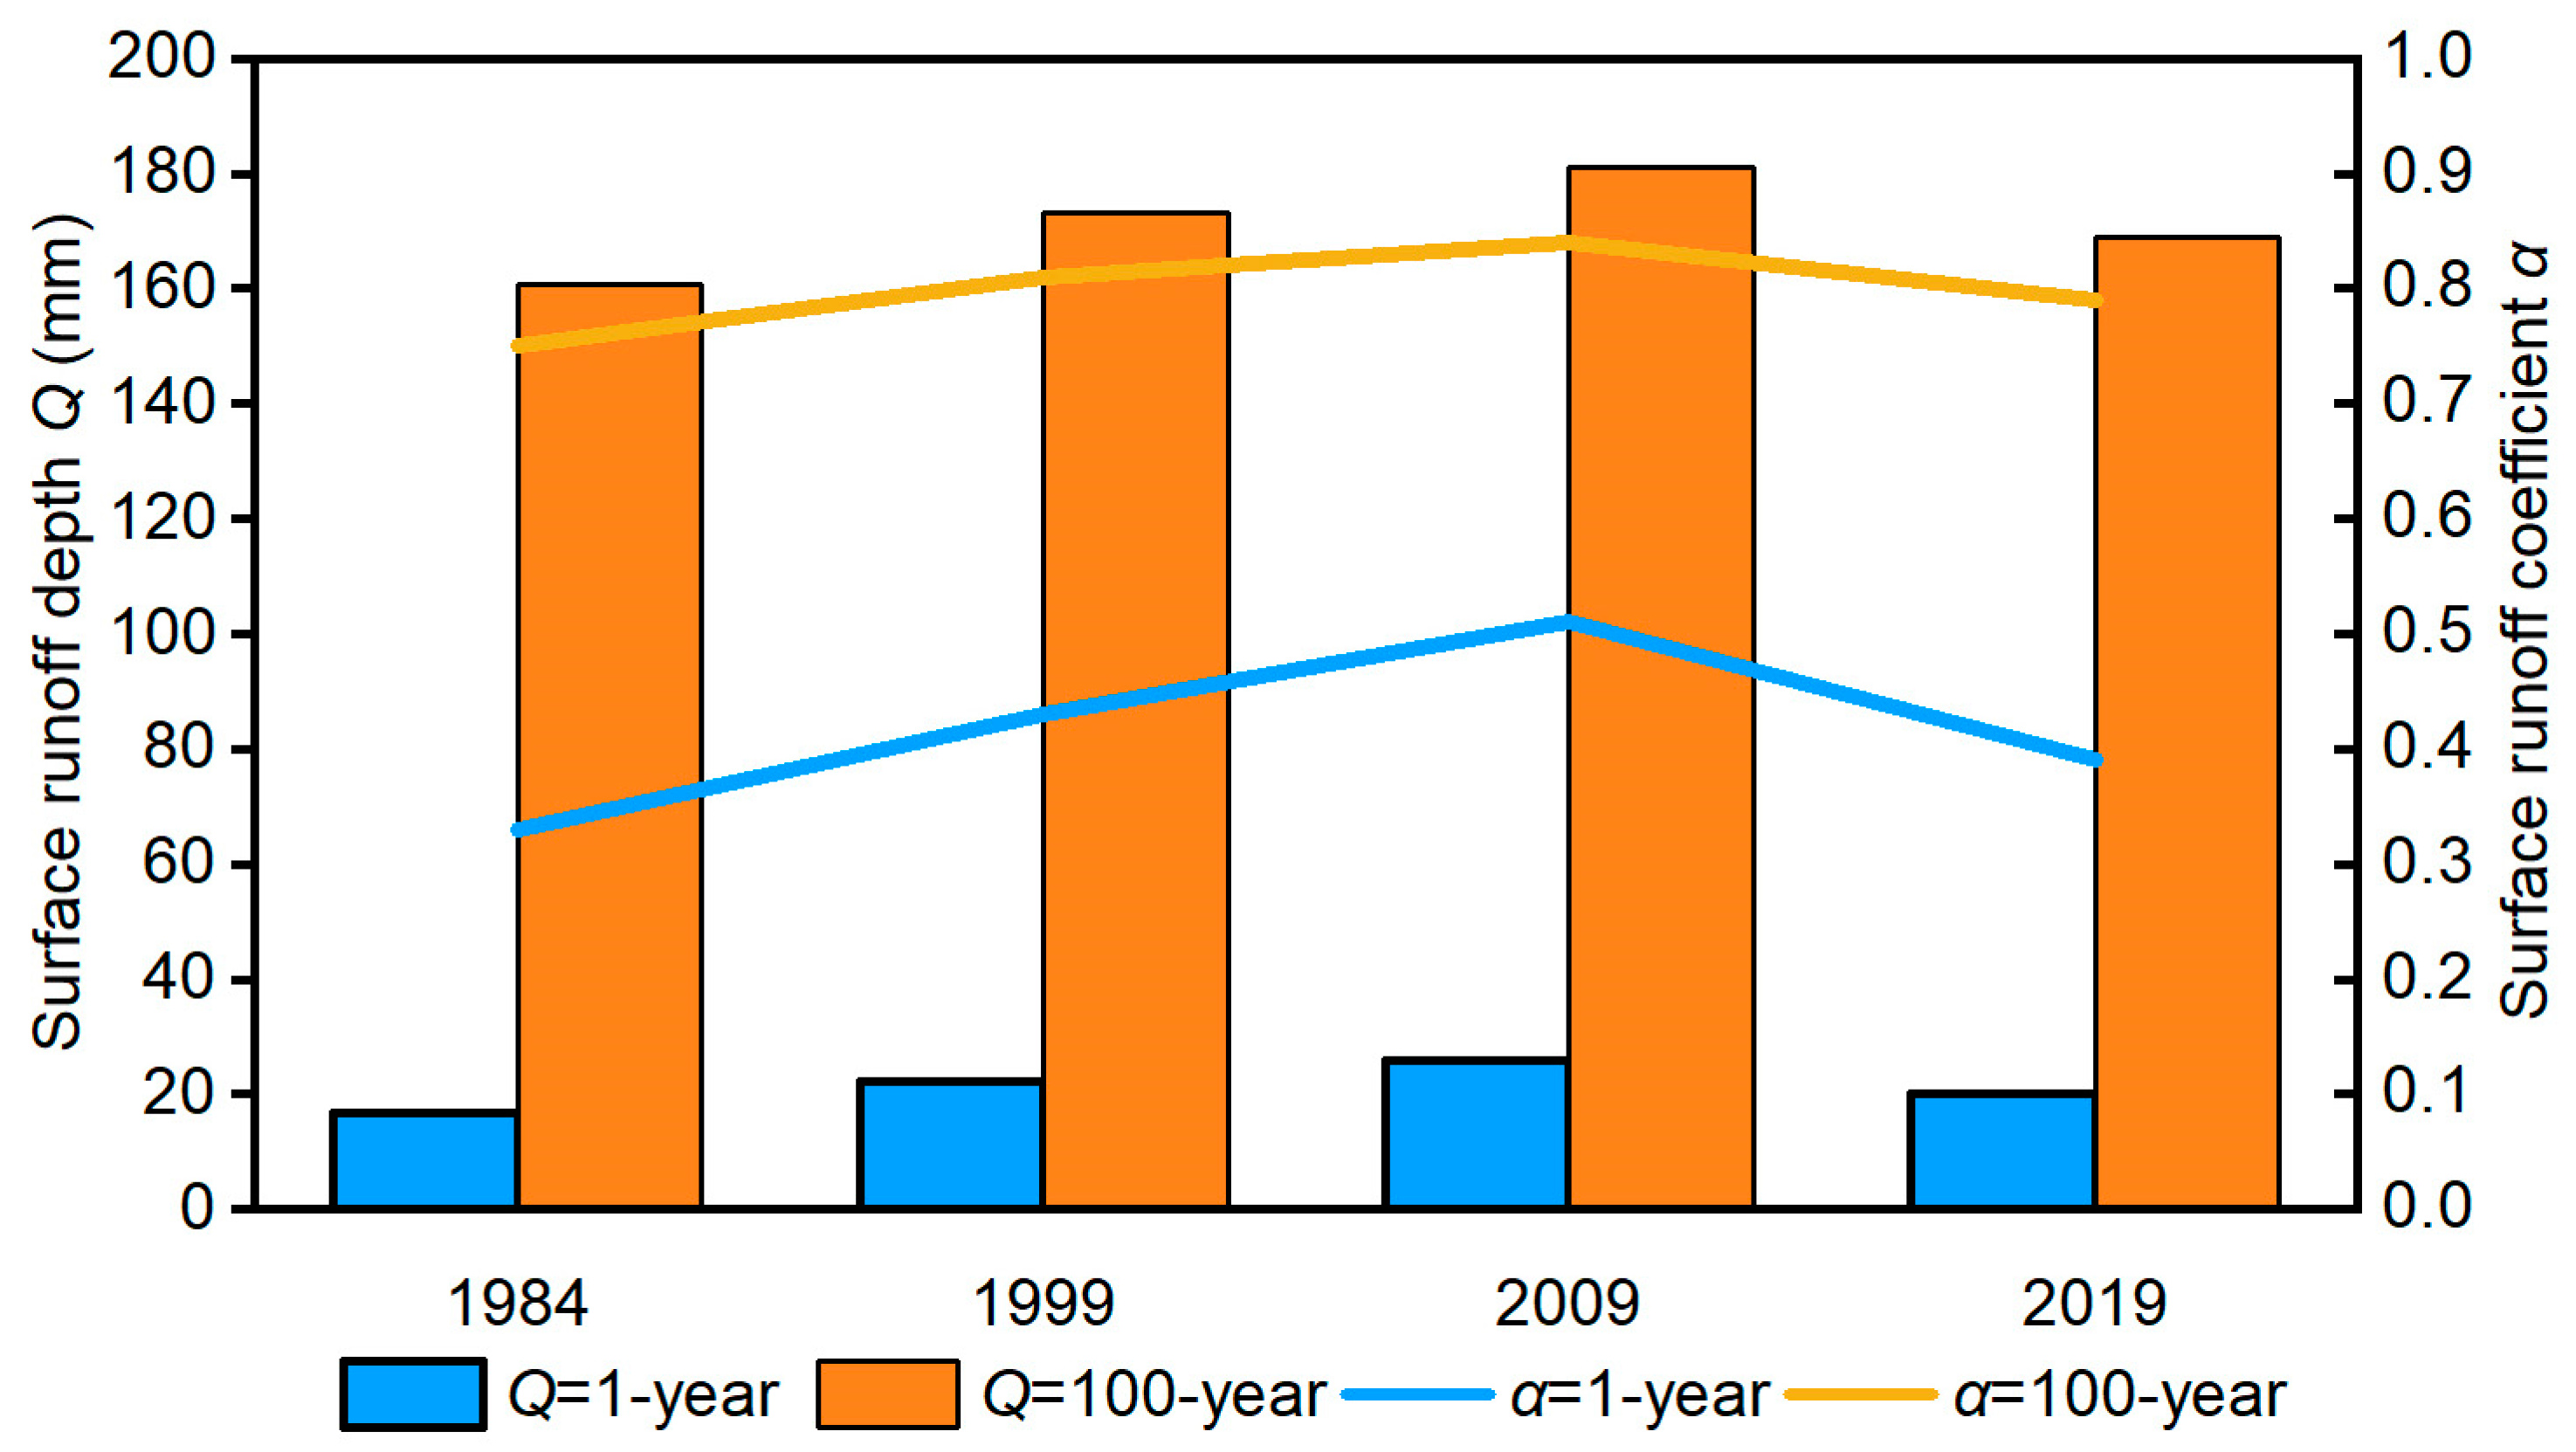
The average surface runoff under different land use conditions and the rainfall return period of 1a and 100a are shown in Figure 5. Under the four different land use conditions, the average surface runoff depth varied from 160.64 to 181.00 mm and the surface runoff coefficient varied from 0.75 to 0.84. Both the average runoff depth and the runoff coefficient at the rainfall return period of 100a were much larger than the values calculated at the rainfall return period of 1a.
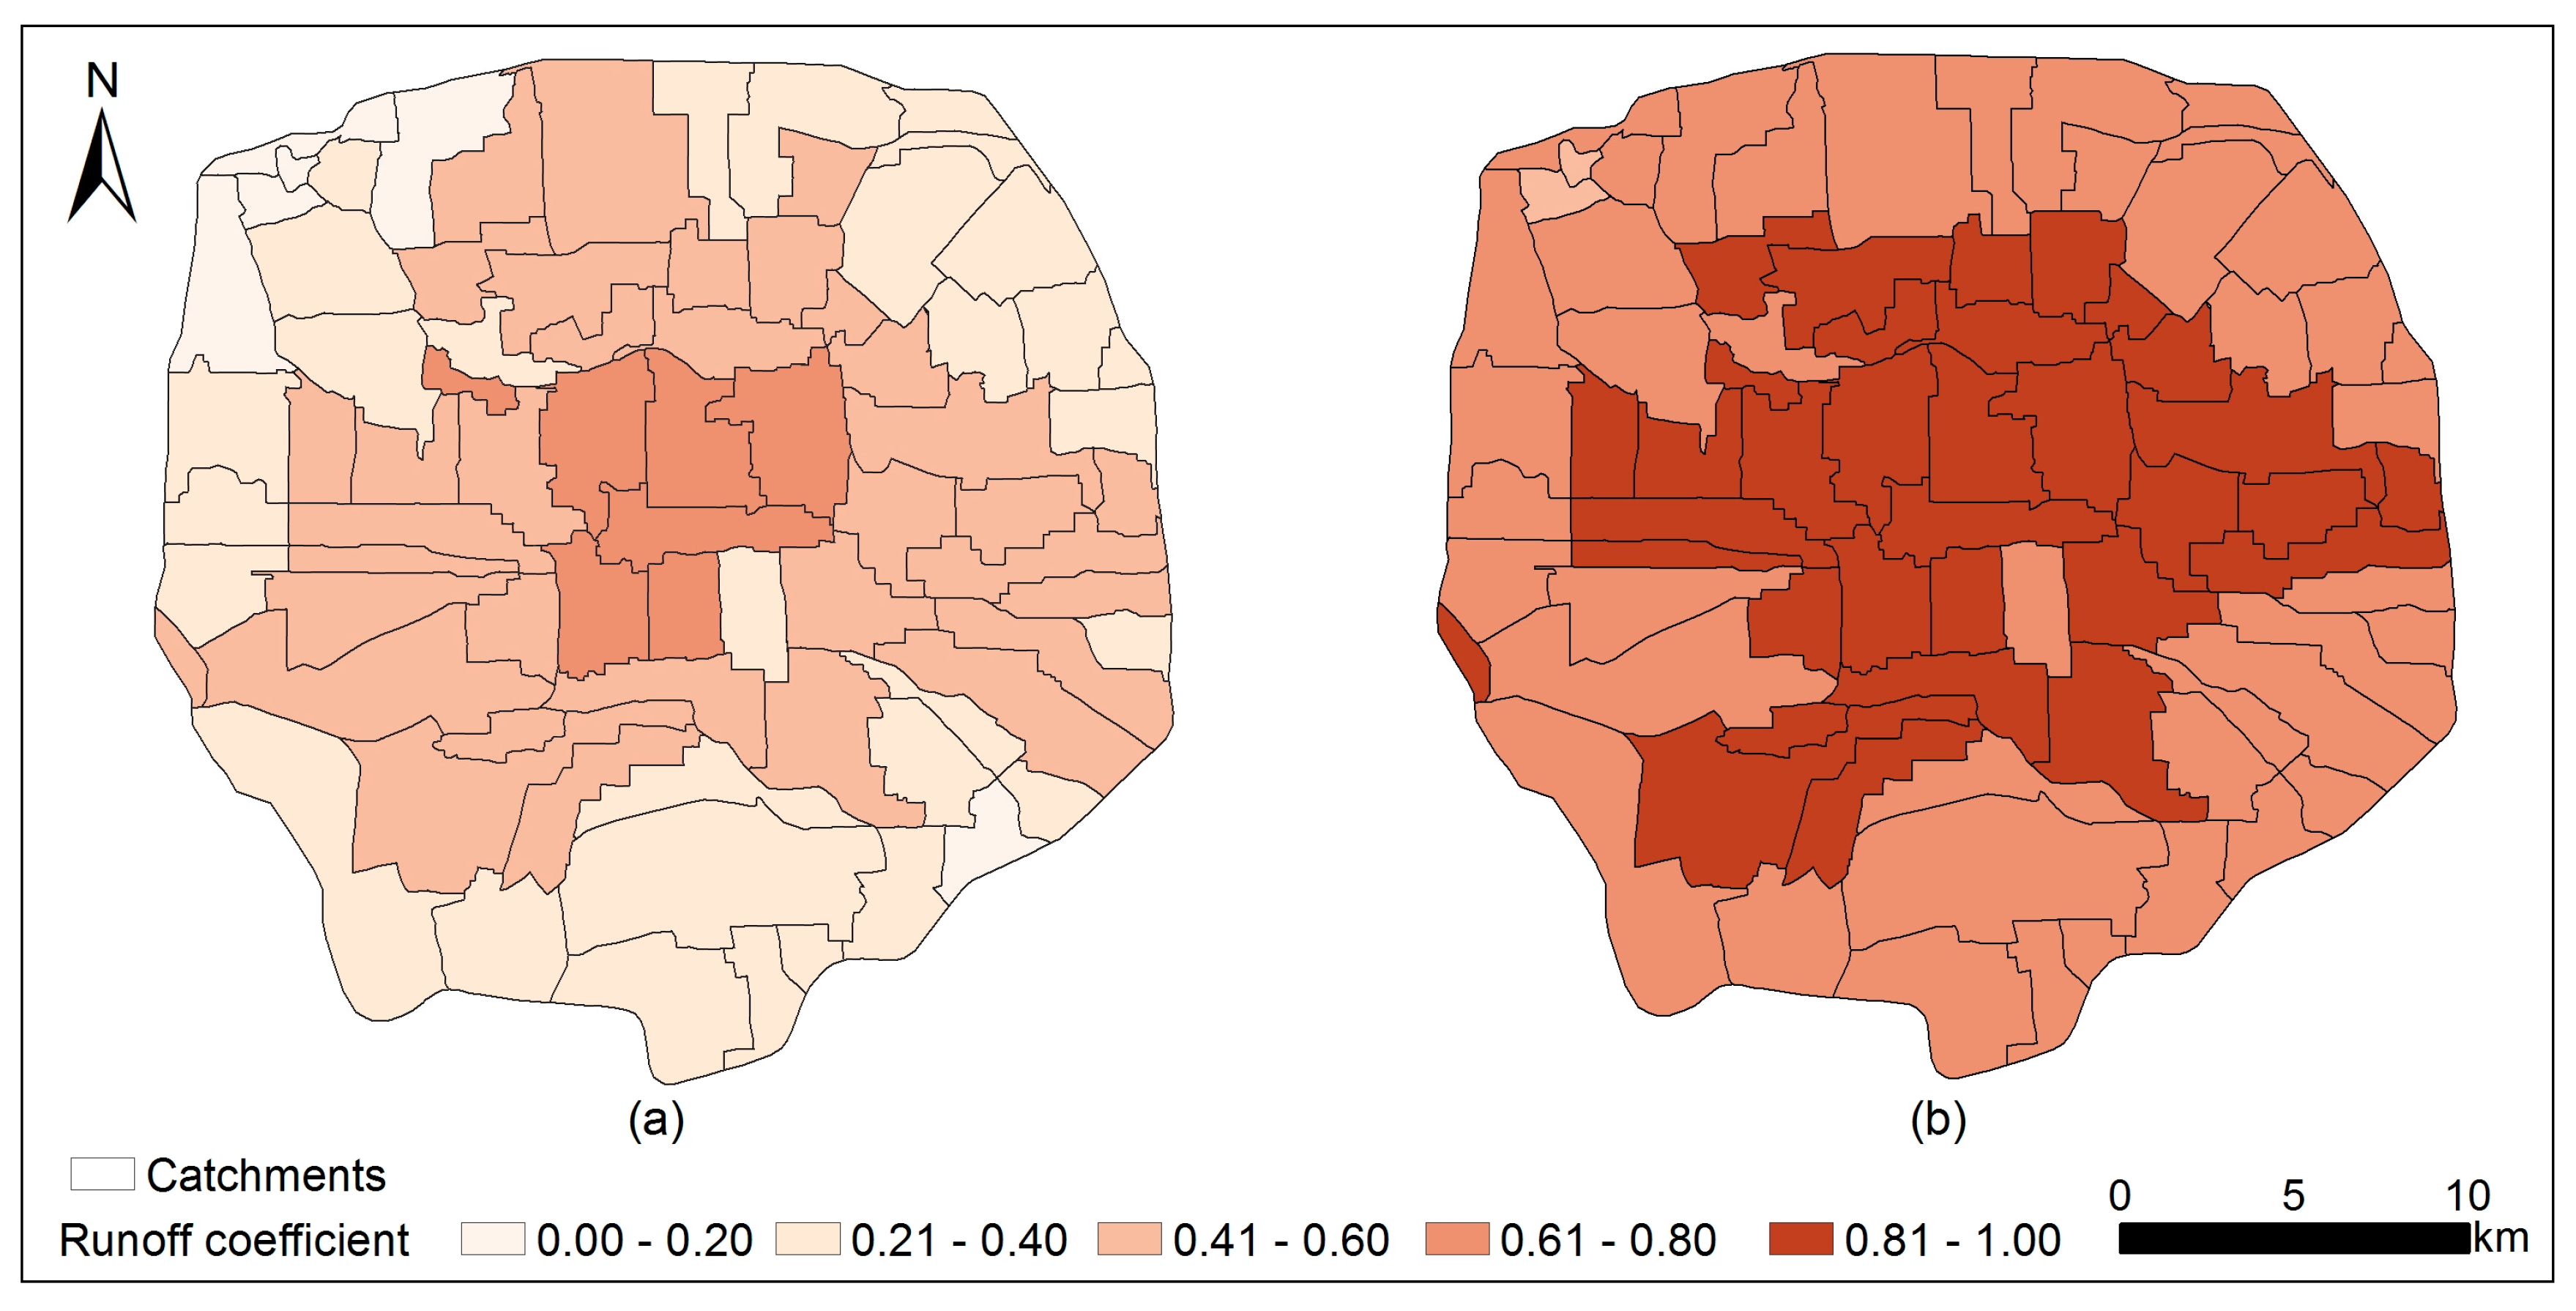
The spatial distribution characteristics of the surface runoff with the rainfall return periods of 1a and 100a based on the land use in 2019 are shown in Figure 6. The surface runoff was basically symmetrical from east to west and the runoff in the north was slightly larger than that in the south. The runoff gradually decreased from the central urban area to the outside rings. Comparing the runoff result with the rainfall return period of 100a to that with the rainfall return period of 1a, the amount of surface runoff was larger and the distribution was more uniform under extreme precipitation condition with the return period of 100a. This means that extreme precipitation would greatly increase the urban flood risk.
3.3. The Impact of Land Use Change on Surface Runoff
Urbanization leads to increased impervious surfaces, resulting in surface runoff increases. Table 3 shows the increments of surface runoff at different stages under the rainfall return periods of 1a and 100a. Taking the rainfall condition for the return period of 100a as an example, the average surface runoff depth increment ΔQ at the three stages was 12.66, 7.7, and −12.18 mm, respectively. The surface runoff coefficient increment Δα at the three stages was 0.06, 0.03 and −0.05, respectively.
Figure 7 shows the spatial distribution of surface runoff variation at different periods under the rainfall return period of 100a. During 1984–1999, 77% of the catchments showed an increasing trend. The catchment area with a large runoff growth rate was mostly located between the third ring and the fifth ring. During 1999–2009, the catchment area with an increased depth of runoff was mainly distributed in the southern part of the fifth ring and the runoff decline area was mainly distributed in the western part of the Fourth Ring Road. During 2009–2019, the runoff coefficient decreased significantly for most catchments, and the changes of the surface runoff in the southern areas were more significant than that in the northern areas.
3.4. Relationship between Land Use Change and Surface Runoff Change
Spearman correlation analysis was used to examine the relationships between surface runoff change (ΔQ) and land use change. The correlation coefficients between ΔQ and change rate of each land use type for 77 catchments during the different periods under the rainfall return period of 100a are provided in Table 4.
These results show that surface runoff change was positively correlated to the change in impervious land and negatively correlated to the change in woodland, grassland, farmland, and water. The results are consistent with common sense that the increase in impervious land probably causes the increase in surface runoff, but the greater amount of woodland, grassland, farmland, and water probably lead to a decrease in surface runoff. During 1984–1999, the degree of correlation between ΔQ and land use factors decreased in the order of PI (0.924), PW1 (−0.912), and PW2 (−0.299), which were significant at the 1% level. During 1999–2009, the most relevant factor with ΔQ was PI (0.920), followed by PG (−0.703), PF (−0.568), and PU (0.305). During 2009–2019, the significant correlations were found between ΔQ and PI (0.894), PW1 (−0.477), PG (−0.474), and PU (0.387). The impervious land change is recognized as the predominant driving factor for the surface runoff change during the whole period.
4. Discussion
In this paper, the SCS-CN model was used to calculate surface runoff. In order to improve the applicability of the model in the study area, the experimental result of Fu et al. [38] on soil types in Beijing were used to set the soil type of the model and the moderate antecedent moisture condition (AMCII) was selected to reflect the average runoff situation in Beijing. The CN values of different land use types were determined according to the CN value list issued by NRCS [52]. The results showed that the SCS-CN model was effective and reasonable. From 1984 to 2019, the surface runoff of Beijing’s central urban area showed a trend of “rapid increase-slight increase-decrease”, which was consistent with the “rapid development-slow development-adjustment” development of Beijing city [56].
The increase of surface runoff in the early stage was mainly caused by the transformation of farmland and woodland to impervious land, while the decrease in surface runoff in the later stage was related to the construction of “sponge city” in Beijing [57]. The term sponge city is similar to the term “low impact development (LID)”, which means that the city, like a sponge, has good flexibility in adapting to environmental changes and responding to natural disasters brought by rainwater. Sponge city construction measures include rain gardens, ecological detention facilities, green roofs. and so on [58,59]. In recent years, Beijing has actively promoted the construction of sponge city and has effectively reduced surface runoff [60].
The existing research on the hydrological effect of urbanization has mainly focused on the community [61,62] or catchment scale [63,64]. This work provided the spatial-temporal variation in runoff at the urban scale. The display of land use development and assessment of surface runoff can help researchers and policymakers to better understand urban development and environmental response [65]. The results also can be used for urban renewal strategy-making for urban rainstorm waterlogging prevention and control. The catchment area with a high value of surface runoff has a high potential of waterlogging risk under the heavy rainfall condition. Therefore, more attention should be paid to these areas during future land use planning. It is necessary to increase rainwater gardens, water-sinking green spaces, green roofs, and other facilities in the high waterlogging risk areas.
The interactions between social and ecological system are complex and non-linear [66]. Besides land use change, human activities that also exert great influences on runoff include the following: irrigation [67,68], construction and operation of dams and reservoirs [69,70], water conservancy projects [71], utilization of groundwater [72], and urban drainage pipe systems [73]. This paper focused on evaluating the impact of land use change on surface runoff and the other human and environmental factors that may affect surface runoff require further exploration in the future.
5. Conclusions
China has experienced a trend of rapid urbanization in the last 40 years. Reducing the urban disaster risk brought about by the urbanization process has been a long-term goal of urban planning and city management. Quantitative research on the runoff changes brought about by the urbanization process is of great significance to urban planning and flood control. This paper used GIS and remote sensing technology, combined with the SCS-CN model, to simulate the changes of runoff and assessed the impact of land use change on surface runoff in the core urban area of Beijing. The conclusions are summarized as follows:
- (1)
- Impervious land was the major land use type in Beijing’s central area. The percentage of impervious land increased by 24.22% from 1984 to 2009 but decreased by 12.96% from 2009 to 2019;
- (2)
- Both of the surface runoffs calculated with the return period of 100a and 1a showed the trend of first increasing then decreasing and the trend was consistent with the variation in impervious land during the three stages of the study area;
- (3)
- The changes in surface runoff were positively correlated with the changes in impervious land, but negatively correlated with the changes in woodland, grassland, farmland, and water. The urbanized impervious land use was the predominant driving factor in the surface runoff change during the period of 1984–2019 in Beijing’s central area.
Author Contributions
Conceptualization, S.H. and T.Z.; Data curation, T.Z.; Formal analysis, Y.F.; Writing—original draft preparation, Y.F.; Writing—review and editing, S.H. and T.Z. All authors have read and agreed to the published version of the manuscript.
Funding
This research was funded by the National Natural Science Foundation of China, grant number 41501027, and the Beijing Municipal Education Commission General Science and Technology Project, grant number KM201810028015.
Acknowledgments
The authors would like to thank the Beijing Hydrological Station for providing the catchment data. We would like to thank Demin Zhou of Capital Normal University for his valuable suggestions on the ideas and structure of the manuscript. We also would like to thank the peer reviewers for their valuable suggestions and comments on improving this paper.
Conflicts of Interest
The authors declare no conflict of interest.
References
- United Nations, Department of Economic and Social Affairs. World Urbanization Prospects-The 2014 Revision; United Nations, Department of Economic and Social Affairs: New York, NY, USA, 2015. [Google Scholar]
- Mei, C.; Liu, J.; Wang, H.; Shao, W.; Xia, L.; Xiang, C.; Zhou, J. Modelling the ability of source control measures to reduce inundation risk in a community-scale urban drainage system. Proc. Int. Assoc. Hydrol. Sci. 2018, 379, 223–229. [Google Scholar] [CrossRef] [Green Version]
- Yang, L.; Feng, Q.; Yin, Z.; Wen, X.; Si, J.; Li, C.; Deo, R. Identifying separate impacts of climate and land use/cover change on hydrological processes in upper stream of Heihe River, Northwest China. Hydrol. Process. 2017, 31, 1100–1112. [Google Scholar] [CrossRef]
- Berihun, M.; Tsunekawa, A.; Haregeweyn, N.; Meshesha, D.; Adgo, E.; Tsubo, M.; Masunaga, T.; Fenta, A.; Sultan, D.; Sebhat, M.; et al. Hydrological responses to land use/land cover change and climate variability in contrasting agro-ecological environments of the Upper Blue Nile basin, Ethiopia. Sci. Total Environ. 2019, 689, 347–365. [Google Scholar] [CrossRef] [PubMed]
- Ansari, T.A.; Katpatal, Y.B.; Vasudeo, A.D. Spatial evaluation of impacts of increase in impervious surface area on SCS-CN and runoff in Nagpur urban watersheds, India. Arab. J. Geosci. 2016, 9, 702. [Google Scholar] [CrossRef]
- Wei, L.; Hubbart, J.A.; Zhou, H. Variable streamflow contributions in nested subwatersheds of a US Midwestern urban watershed. Water Resour. Manag. 2017, 32, 1–16. [Google Scholar] [CrossRef]
- Rose, S.; Peters, N.E. Effects of urbanization on streamflow in the Atlanta area (Georgia, USA): A comparative hydrological approach. Hydrol. Process. 2010, 15, 1441–1457. [Google Scholar] [CrossRef]
- Huang, H.; Cheng, S.; Wen, J.; Lee, J. Effect of growing watershed imperviousness on hydrograph parameters and peak discharge. Hydrol. Process. 2010, 22, 2075–2085. [Google Scholar] [CrossRef]
- Yao, L.; Wei, W.; Yu, Y.; Xiao, J.; Chen, L. Rainfall-runoff risk characteristics of urban function zones in Beijing using the SCS-CN model. J. Geogr. Sci. 2018, 28, 656–668. [Google Scholar] [CrossRef]
- Guan, M.; Sillanpää, N.; Koivusalo, H. Storm runoff response to rainfall pattern, magnitude and urbanization in a developing urban catchment. Hydrol. Process. 2016, 30, 543–557. [Google Scholar] [CrossRef]
- Miller, J.D.; Kim, H.; Kjeldsen, T.R.; Packman, J.; Grebby, S.; Dearden, R. Assessing the impact of urbanization on storm runoff in a peri-urban catchment using historical change in impervious cover. J. Hydrol. 2014, 515, 59–70. [Google Scholar] [CrossRef] [Green Version]
- Melesse, A.; Wang, X. Landsat-Based Impervious Surface Mapping And Storm Runoff Response Modeling. AGU Spring Meet. Abstr. 2007, 1, 1. [Google Scholar]
- Zhang, Y.; Xia, J.; Yu, J.; Randall, M.; Zhang, Y.; Zhao, T.; Pan, X.; Zhai, X.; Shao, Q. Simulation and assessment of urbanization impacts on runoff metrics: Insights from landuse changes. J. Hydrol. 2018, 560, 247–258. [Google Scholar] [CrossRef]
- Braud, I.; Breil, P.; Thollet, F.; Lagouy, M.; Branger, F.; Jacqueminet, C.; Kermadi, S.; Michel, K. Evidence of the impact of urbanization on the hydrological regime of a medium-sized periurban catchment in France. J. Hydrol. 2013, 485, 5–23. [Google Scholar] [CrossRef] [Green Version]
- Michael, O.D.; Sandra, C.; Anne, J.; Alex, M.; Sara, M. Urbanization Effects on Watershed Hydrology and In-Stream Processes in the Southern United States. Water 2010, 2, 605–648. [Google Scholar] [CrossRef]
- Minnig, M.; Moeck, C.; Radny, D.; Schirmer, M. Impact of urbanization on groundwater recharge rates in Dübendorf, Switzerland. J. Hydrol. 2017, 563, 1135–1146. [Google Scholar] [CrossRef] [Green Version]
- Dinka, M.O.; Klik, A. Effect of land use–land cover change on the regimes of surface runoff—the case of Lake Basaka catchment (Ethiopia). Environ. Monit. Assess. 2019, 191, 278. [Google Scholar] [CrossRef] [PubMed]
- Gashaw, T.; Tulu, T.; Argaw, M.; Worqlul, A.W. Modeling the hydrological impacts of land use/land cover changes in the Andassa watershed, Blue Nile Basin, Ethiopia. Sci. Total Environ. 2018, 619–620, 1394–1408. [Google Scholar] [CrossRef]
- Ge, Y.; Shi, P.; Zhou, J.; Zou, M. Simulation of flood disaster scenario under driving action of land use change in urb of Shanghai. J. Nat. Disaster. 2003, 12, 25–30. [Google Scholar] [CrossRef]
- Shi, P.-J.; Yuan, Y.; Zheng, J.; Wang, J.-A.; Ge, Y.; Qiu, G.-Y. The effect of land use/cover change on surface runoff in Shenzhen region, China. CATENA 2007, 69, 31–35. [Google Scholar] [CrossRef]
- Liu, Z.; Zeng, X. Impact of impervious surface expansion on urban runoff in Shenzhen City. Water Resour. Prot. 2013, 29, 44–50. [Google Scholar] [CrossRef]
- Li, C.; Liu, M.; Hu, Y.; Shi, T.; Zong, M.; Walter, M. Assessing the Impact of Urbanization on Direct Runoff Using Improved Composite CN Method in a Large Urban Area. Int. J. Environ. Res. Public Health 2018, 15, 775. [Google Scholar] [CrossRef] [PubMed] [Green Version]
- Wang, Y.; Zeng, Y.; Qiu, X.; Zhu, X.; Wang, Y.; Wang, X. Impact of land use change on urban waterlogging: Case of Nanjing Pukou. J. Meteorol. Sci. 2017, 37, 231–238. [Google Scholar] [CrossRef]
- Xu, Z.; Zhao, G. Impact of urbanization on rainfall-runoff processes: Case study in the Liangshui River Basin in Beijing, China. Proc. Int. Assoc. Hydrol. Sci. 2016, 373, 7–12. [Google Scholar] [CrossRef] [Green Version]
- Fang, Y.; Li, Q.; Pan, X.; Yang, M.; Li, Y. Contrastive analysis of typical rainfall-runoff process in urban watershed:taking Liangshui River Basin in Beijing as an example. J. Shaanxi Norm. Univ. (Nat. Sci. Ed.) 2018, 46, 111–116. [Google Scholar] [CrossRef]
- Dong, G.; Yang, Z.; Yu, Y. Research Progresson Effects of Variations of Underlying Surface on Runoff Yield and Concentration in the River Basin. South North Water Transf. Sand Water Sci. Technol. 2013, 11, 111–117. [Google Scholar] [CrossRef]
- Pan, H.; Page, J.; Zhang, L.; Cong, C.; Ferreira, C.; Jonsson, E.; Näsström, H.; Destouni, G.; Deal, B.; Kalantari, Z. Understanding interactions between urban development policies and GHG emissions: A case study in Stockholm Region. AMBIO 2019. [Google Scholar] [CrossRef] [Green Version]
- Kotzee, I.; Reyers, B. Piloting a social-ecological index for measuring flood resilience: A composite index approach. Ecol. Indic. 2016, 60, 45–53. [Google Scholar] [CrossRef]
- Ban, N.; Mills, M.; Tam, J.; Hicks, C.; Klain, S.; Stoeckl, N.; McKinnon, M.; Levine, J.; Pressey, R.; Satterfield, T.; et al. A social-ecological approach to conservation planning: Embedding social considerations. Front. Ecol. Environ. 2013, 11, 194–202. [Google Scholar] [CrossRef] [Green Version]
- Cho, Y.; Engel, B. Spatially distributed long-term hydrologic simulation using a continuous SCS CN method-based hybrid hydrologic model. Hydrol. Process. 2018, 32, 904–922. [Google Scholar] [CrossRef]
- Chen, W.; Huang, G.; Zhang, H. Urban stormwater inundation simulation based on SWMM and diffusive overland-flow model. Water Sci. Technol. 2017, 76, 3392–3403. [Google Scholar] [CrossRef]
- Liao, R.; Hu, S.; Du, L.; Huang, Z. Hydrological simulation of Wenyu River basin based on HEC-HMS model. South North Water Transf. Sand Water Sci. Technol. 2018, 16, 15–20. [Google Scholar] [CrossRef]
- Asadi Vaighan, A.; Talebbeydokhti, N.; Bavani, A.R. Assessing the impacts of climate and land use change on streamflow, water quality and suspended sediment in the Kor River Basin, Southwest of Iran. Environ. Earth Sci. 2017, 76, 1–18. [Google Scholar] [CrossRef]
- Im, S.; Kim, H.; Kim, C.; Jang, C. Assessing the Impacts of Land Use Changes on Watershed Hydrology Using MIKE SHE. Environ. Geol. 2009, 57, 231–239. [Google Scholar] [CrossRef]
- Du, J.; Qian, L.; Rui, H.; Zuo, T.; Zheng, D.; Xu, Y.; Xu, C.Y. Assessing the effects of urbanization on annual runoff and flood events using an integrated hydrological modeling system for Qinhuai River basin, China. J. Hydrol. 2012, 464–465, 127–139. [Google Scholar] [CrossRef]
- Hu, Y.; Kong, X.; Yao, J. Vertical distribution of soil organic carbon in plains areas of Beijing. Acta Ecologica Sinica 2019, 39, 166–175. [Google Scholar] [CrossRef]
- Soil and Fertilizer Information Network of Beijing. Available online: http://www.bjtf.org/trgl/zttp/trzdt/index.htm (accessed on 13 November 2019).
- Fu, S.; Wang, H.; Wang, X.; Yuan, A.; Lu, B. The runoff curve number of SCS-CN method in Beijing. Geogr. Res. 2013, 32, 797–807. [Google Scholar] [CrossRef]
- USGS. EarthExplorer. Available online: https://earthexplorer.usgs.gov/ (accessed on 30 July 2019).
- Beijing Meteorological Service. Available online: http://bj.cma.gov.cn (accessed on 30 July 2019).
- Zhou, D.; Liu, Y.; Hu, S.; Hu, D.; Neto, S.; Zhang, Y. Assessing the hydrological behaviour of large-scale potential green roofs retrofitting scenarios in Beijing. Urban For. Urban Green. 2017, 40, 105–113. [Google Scholar] [CrossRef] [Green Version]
- Courage, K.; Jonah, G.; Hitomi, M. Mapping Woodland Cover in the Miombo Ecosystem: A Comparison of Machine Learning Classifiers. Land 2014, 3, 524–540. [Google Scholar] [CrossRef] [Green Version]
- Ponce, V.M.; Hawkins, R.H. Runoff Curve Number: Has It Reached Maturity? J. Hydrol. Eng. 1996, 1, 11–19. [Google Scholar] [CrossRef]
- Yang, X. Small Watershed Rainfall Runoff Estimation and Its Application Based on SCS Model. J. Water Resour. Res. 2016. [Google Scholar] [CrossRef]
- Du, S.; Van Rompaey, A.; Shi, P.; Wang, J.A. A dual effect of urban expansion on flood risk in the Pearl River Delta (China) revealed by land-use scenarios and direct runoff simulation. Nat. Hazards 2015, 77, 111–128. [Google Scholar] [CrossRef]
- Wang, X.; Liu, T.; Yang, W. Development of a robust runoff-prediction model by fusing the Rational Equation and a modified SCS-CN method. Hydrol. Sci. J. 2012, 57, 1118–1140. [Google Scholar] [CrossRef] [Green Version]
- Ozdemir, H.; Elbaşı, E. Benchmarking land use change impacts on direct runoff in ungauged urban watersheds. Phys. Chem. Earth. Parts A/B/C 2015, 79–82, 100–107. [Google Scholar] [CrossRef]
- Yang, C.; Lin, Z.; Yu, Z.; Hao, Z.; Liu, S. Analysis and Simulation of Human Activity Impact on Streamflow in the Huaihe River Basin with a Large-Scale Hydrologic Model. J. Hydrometeorol. 2010, 11, 810–821. [Google Scholar] [CrossRef]
- Andrzej, W.; Boguslaw, M.; Agnieszka, C.; Magdalena, G. Comparison of SCS-CN Determination Methodologies in a Heterogeneous Catchment. J. Mt. Sci. 2015, 12, 1084–1094. [Google Scholar] [CrossRef]
- Mishra, S.K.; Singh, V.P. Soil Conservation Service Curve Number (SCS-CN) Methodology. Water Sci. Technol. Libr. 2007, 22, 355–362. [Google Scholar] [CrossRef]
- Wałęga, A.; Rutkowska, A.; Grzebinoga, M. Direct runoff assessment using modified SME method in catchments in the Upper Vistula River Basin. Acta Geophys. 2017, 65, 1–13. [Google Scholar] [CrossRef]
- NRCS. Urban hydrology for small watersheds. Tech. Release 1986, 55, 2–6. [Google Scholar]
- Yao, L.; Wei, W.; Yu, Y.; Xiao, J.; Chen, L. Research on potential runoff risk of urban functional zones in Beijing city based on GIS and RS. Acta Geogr. Sin. 2015, 70, 308–318. [Google Scholar] [CrossRef]
- Su, W. Study of Flood Forecasting Methods at Small Watershed and Appfication; Dalian University of Technology: Liaoning, China, 2016. [Google Scholar]
- Gu, X.; Li, N.; Zhou, Y.; Wu, J. Thinking on urban waterlogging disaster defense initiated by “7·21” extraordinary rainstorm in Beijing. J. Nat. Disasters Sci. 2013, 22, 1–6. [Google Scholar] [CrossRef]
- The People’s Government of Beijing Municipality. Beijing’s Urban Master Plan (2016–2035). Available online: http://www.beijing.gov.cn/zfxxgk/ftq11GJ20/gh32j/2019-05/17/content_1c5698489dfc415098b44d8debb17e6c.shtml (accessed on 12 November 2019).
- Zhang, X.; Liao, Z. Building a sponge city, letting Beijing no longer “see the sea”. Beijing Plan. Rev. 2016, 106–112. [Google Scholar]
- Wang, H.; Mei, C.; Liu, J.H.; Shao, W.W. A new strategy for integrated urban water management in China: Sponge city. Sci. China Technol. Sci. 2018, 61, 317–329. [Google Scholar] [CrossRef]
- Liu, H.; Jia, Y.; Niu, C. “Sponge city” concept helps solve China’s urban water problems. Environ. Earth Sci. 2017, 76, 473. [Google Scholar] [CrossRef]
- The People’s Government of Beijing Municipality. Work Situation of Pilot Construction of Sponge City in Beijing. Available online: http://swj.beijing.gov.cn/bjwater/300795/300797/1113615/index.html (accessed on 20 September 2019).
- Trudeau, M.P.; Richardson, M. Empirical assessment of effects of urbanization on event flow hydrology in watersheds of Canada’s Great Lakes-St Lawrence basin. J. Hydrol. 2016, 541, 1456–1474. [Google Scholar] [CrossRef]
- Mao, X.; Jia, H.; Yu, S.L. Assessing the ecological benefits of aggregate LID-BMPs through modelling. Ecol. Modell. 2017, 353, 139–149. [Google Scholar] [CrossRef]
- Oudin, L.; Salavati, B.; Furusho-Percot, C.; Ribstein, P.; Saadi, M. Hydrological impacts of urbanization at the catchment scale. J. Hydrol. 2018, 559, 774–786. [Google Scholar] [CrossRef] [Green Version]
- Suriya, S.; Mudgal, B.V. Impact of urbanization on flooding: The Thirusoolam sub watershed—A case study. J. Hydrol. 2012, 412–413, 210–219. [Google Scholar] [CrossRef]
- Boongaling, C.G.K.; Faustino-Eslava, D.V.; Lansigan, F.P. Modeling land use change impacts on hydrology and the use of landscape metrics as tools for watershed management: The case of an ungauged catchment in the Philippines. Land Use Policy 2018, 72, 116–128. [Google Scholar] [CrossRef]
- Sugiarto, H.S.; Chung, N.N.; Lai, C.H.; Chew, L.Y. Socioecological regime shifts in the setting of complex social interactions. Phys. Rev. E Stat. Nonlinear Soft Matter Phys. 2015, 91, 62804. [Google Scholar] [CrossRef]
- Sinha, J.; Das, J.; Jha, S.; Goyal, M. Analysing Model Disparity in Diagnosing the Climatic and Human Stresses on Runoff Variability over India. J. Hydrol. 2019, 581, 124407. [Google Scholar] [CrossRef]
- Wang, D.; Hejazi, M. Quantifying the Relative Contribution of the Climate and Direct Human Impacts on Mean Annual Streamflow in the Contiguous United States. Water Resour. Res. 2011, 47. [Google Scholar] [CrossRef] [Green Version]
- Ayalew, T.; Krajewski, W.; Mantilla, R.; Wright, D.; Small, S. Effect of Spatially Distributed Small Dams on Flood Frequency: Insights from the Soap Creek Watershed. J. Hydrol. Eng. 2017, 22. [Google Scholar] [CrossRef]
- Lu, W.; Lei, H.; Yang, D.; Tang, L.; Qinghua, M. Quantifying the impacts of small dam construction on hydrological alterations in the Jiulong River Basin of Southeast China. J. Hydrol. 2018, 567, 382–392. [Google Scholar] [CrossRef]
- Liu, J.; Zang, C.; Tian, S.; Liu, J.; Yang, H.; Jia, S.; You, L.; Liu, B.; Zhang, M. Water conservancy projects in China: Achievements, challenges and way forward. Glob. Environ. Chang. 2013, 23, 633–643. [Google Scholar] [CrossRef] [Green Version]
- Huang, T.; Pang, Z. Groundwater Recharge and Dynamics in Northern China: Implications for Sustainable Utilization of Groundwater. Procedia Earth Planet. Sci. 2013, 7, 369–372. [Google Scholar] [CrossRef] [Green Version]
- Freni, G.; Mannina, G.; Viviani, G. Uncertainty assessment of an integrated urban drainage model. J. Hydrol. 2009, 373, 392–404. [Google Scholar] [CrossRef]
Figure 1.
Location of the study area and the distribution of catchments in study area.

Figure 2.
Characteristics of (a) maximum daily rainfall in July in Beijing and (b) hydrographs of river runoff with different degrees of urbanization.
Figure 2.
Characteristics of (a) maximum daily rainfall in July in Beijing and (b) hydrographs of river runoff with different degrees of urbanization.

Figure 3.
Land use maps of the study area in (a) 1984, (b) 1999, (c) 2009, and (d) 2019.

Figure 4.
Percentage of land use types of the study area in 1984, 1999, 2009, and 2019.

Figure 5.
Average runoff depth Q (mm) and runoff coefficient α with the rainfall return period of 1a and 100a, under the land use conditions of 1984, 1999, 2009 and 2019.
Figure 5.
Average runoff depth Q (mm) and runoff coefficient α with the rainfall return period of 1a and 100a, under the land use conditions of 1984, 1999, 2009 and 2019.

Figure 6.
Spatial distribution characteristics of surface runoff with the rainfall return periods of (a) 1a and (b) 100a under land use condition of 2019.
Figure 6.
Spatial distribution characteristics of surface runoff with the rainfall return periods of (a) 1a and (b) 100a under land use condition of 2019.

Figure 7.
Variation in surface runoff over the periods of (a) 1984–1999, (b) 1999–2009, and (c) 2009–2019 under the rainfall return period of 100a.
Figure 7.
Variation in surface runoff over the periods of (a) 1984–1999, (b) 1999–2009, and (c) 2009–2019 under the rainfall return period of 100a.


Table 1.
Land use classes and description used in this research.
| Land Use | Description |
|---|---|
| Farmland | Areas used for the production of annual crops, such as corn, soybeans, vegetables, tobacco, and cotton. Crop vegetation accounts for greater than 30% of total vegetation. This class also includes all land being actively tilled. |
| Woodland | Areas dominated by trees and shrubs, which generally account for more than 30% percent of total cover. |
| Grassland | Areas dominated by herbaceous vegetation generally greater than 80% of the total vegetation. |
| Water | Areas of open water, generally with less than 25% cover of vegetation or soil, including rivers and reservoirs. |
| Impervious land | Developed areas covered by constructed materials or areas with a mixture of constructed materials and vegetation. Impervious surfaces account for more than 20% percent of total cover. |
| Unused land | Areas of bedrock, gravel, sand, and other accumulations of earthen material. Generally, vegetation accounts for less than 15% of total cover. |
Table 2.
Summary of producer’s accuracy (PA), user’s accuracy (UA), overall accuracy (OA), and kappa for land use classification of 1984, 1999, 2009, and 2019.
Table 2.
Summary of producer’s accuracy (PA), user’s accuracy (UA), overall accuracy (OA), and kappa for land use classification of 1984, 1999, 2009, and 2019.
| Year | Accuracy | Farmland | Woodland | Grassland | Water | Impervious land | Unused land |
|---|---|---|---|---|---|---|---|
| 1984 | PA | 87.0% | 95.8% | 87.5% | 95.7% | 92.1% | 83.3% |
| UA | 83.3% | 92.0% | 91.3% | 95.7% | 92.1% | 88.2% | |
| OA | 90.7% | ||||||
| Kappa | 0.887 | ||||||
| 1999 | PA | 75.0% | 100.0% | 87.5% | 96.2% | 92.1% | 93.8% |
| UA | 85.7% | 93.8% | 93.3% | 96.2% | 92.1% | 88.2% | |
| OA | 92.7% | ||||||
| Kappa | 0.909 | ||||||
| 2009 | PA | - | 96.8% | 90.3% | 96.2% | 93.3% | 88.2% |
| UA | - | 88.2% | 93.3% | 100.0% | 93.3% | 93.8% | |
| OA | 93.3% | ||||||
| Kappa | 0.915 | ||||||
| 2019 | PA | - | 97.1% | 93.8% | 96.2% | 92.7% | 94.1% |
| UA | - | 91.7% | 93.8% | 100.0% | 95.0% | 94.1% | |
| OA | 94.7% | ||||||
| Kappa | 0.932 |
Table 3.
Changes in surface runoff parameters at different stages under the rainfall return periods of 1a and 100a.
Table 3.
Changes in surface runoff parameters at different stages under the rainfall return periods of 1a and 100a.
| Return Period | Stage | ΔQ (mm) | Δα | ΔC (%) |
|---|---|---|---|---|
| 100a | 1984–1999 | 12.66 | 0.06 | 7.88 |
| 1999–2009 | 7.70 | 0.03 | 4.44 | |
| 2009–2019 | −12.18 | −0.05 | −6.73 | |
| 1a | 1984–1999 | 5.36 | 0.11 | 31.96 |
| 1999–2009 | 3.85 | 0.08 | 17.40 | |
| 2009–2019 | −5.87 | −0.12 | −22.59 |
Table 4.
Spearman correlation coefficients between surface runoff change and land use change under the rainfall return period of 100a.
Table 4.
Spearman correlation coefficients between surface runoff change and land use change under the rainfall return period of 100a.
| Period | Impervious Land (PI) | Woodland (PW1) | Grassland (PG) | Farmland (PF) | Unused Land (PU) | Water (PW2) |
|---|---|---|---|---|---|---|
| 1984–1999 | 0.924 ** | −0.912 ** | −0.072 | −0.112 | 0.112 | −0.299 ** |
| 1999–2009 | 0.920 ** | −0.212 | −0.703 ** | −0.568 ** | 0.305 ** | −0.204 |
| 2009–2019 | 0.894 ** | −0.477 ** | −0.474 ** | −0.181 | 0.387 ** | −0.180 |
Note: ** indicate significant at the 0.01 level.
© 2020 by the authors. Licensee MDPI, Basel, Switzerland. This article is an open access article distributed under the terms and conditions of the Creative Commons Attribution (CC BY) license (http://creativecommons.org/licenses/by/4.0/).
Share and Cite
MDPI and ACS Style
Hu, S.; Fan, Y.; Zhang, T. Assessing the Effect of Land Use Change on Surface Runoff in a Rapidly Urbanized City: A Case Study of the Central Area of Beijing. Land 2020, 9, 17. https://doi.org/10.3390/land9010017
AMA Style
Hu S, Fan Y, Zhang T. Assessing the Effect of Land Use Change on Surface Runoff in a Rapidly Urbanized City: A Case Study of the Central Area of Beijing. Land. 2020; 9(1):17. https://doi.org/10.3390/land9010017
Chicago/Turabian StyleHu, Shanshan, Yunyun Fan, and Tao Zhang. 2020. "Assessing the Effect of Land Use Change on Surface Runoff in a Rapidly Urbanized City: A Case Study of the Central Area of Beijing" Land 9, no. 1: 17. https://doi.org/10.3390/land9010017
Note that from the first issue of 2016, this journal uses article numbers instead of page numbers. See further details here.