
Exploring the Barriers to and Potential for Sustainable Transitions in Urban–Rural Systems through Participatory Causal Loop Diagramming of the Food–Energy–Water Nexus


Abstract
:1. Introduction
2. Materials and Methods
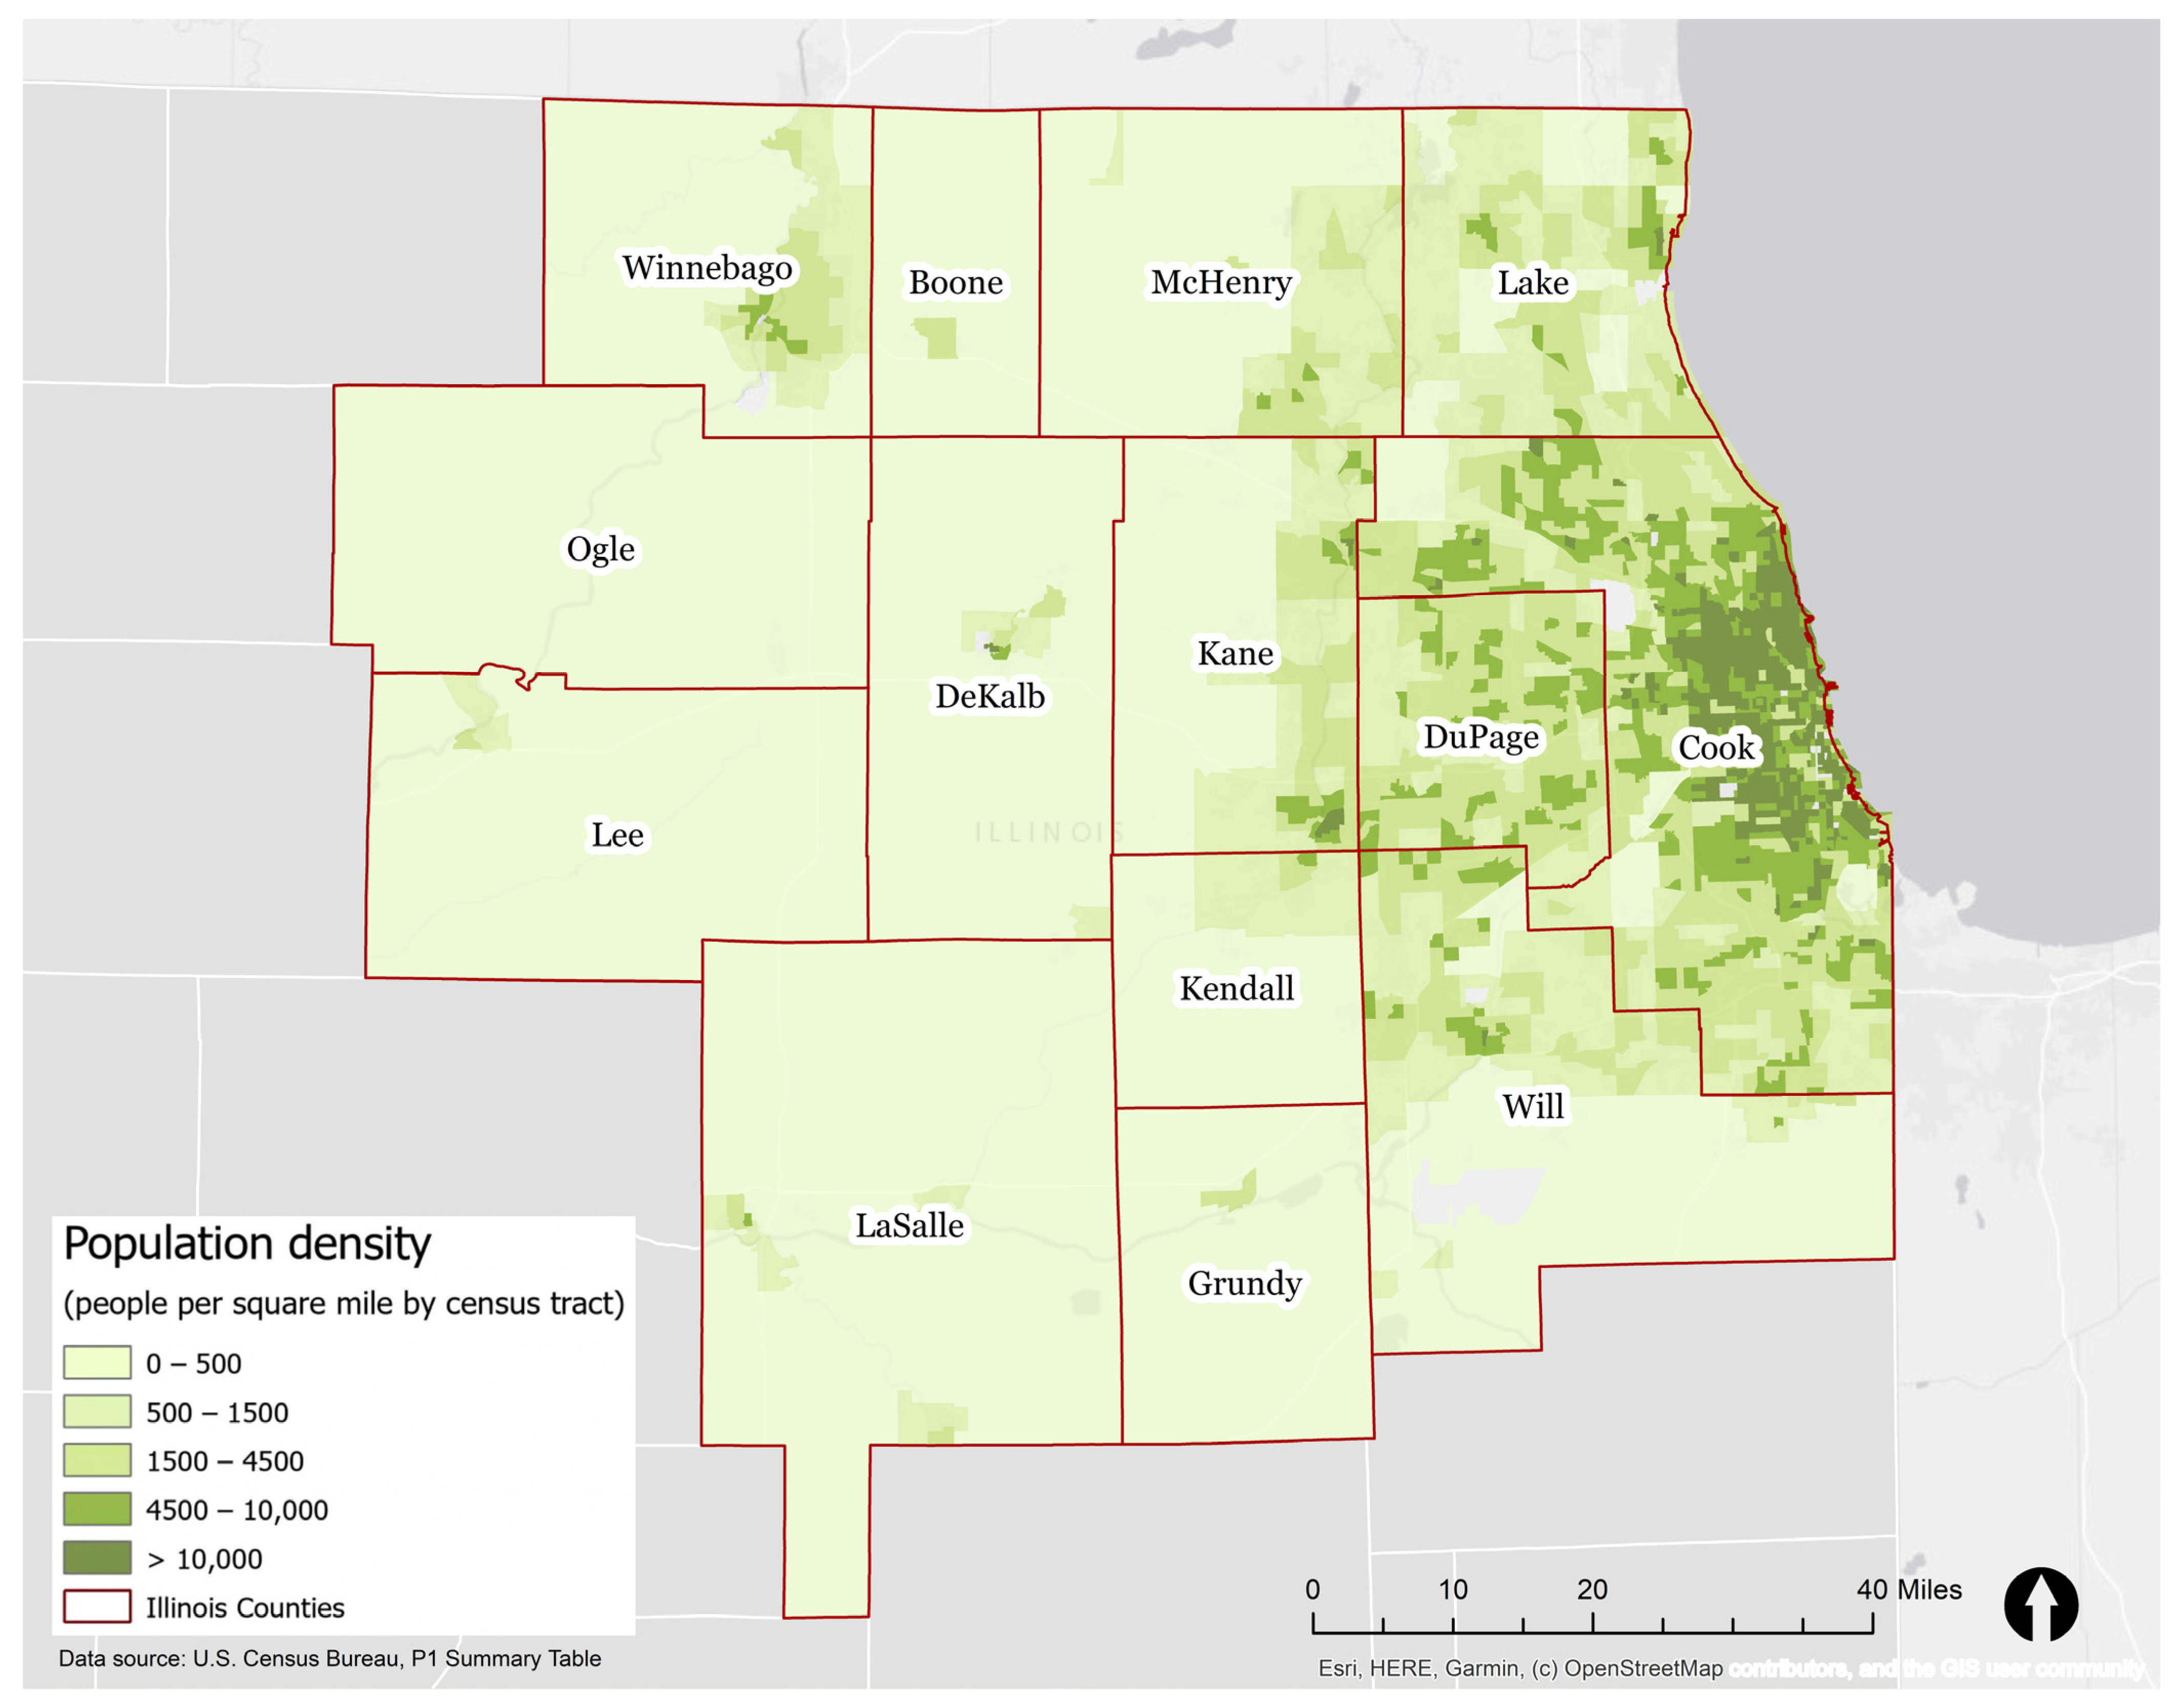
2.1. Case Study
2.2. Purpose
2.3. Partnerships
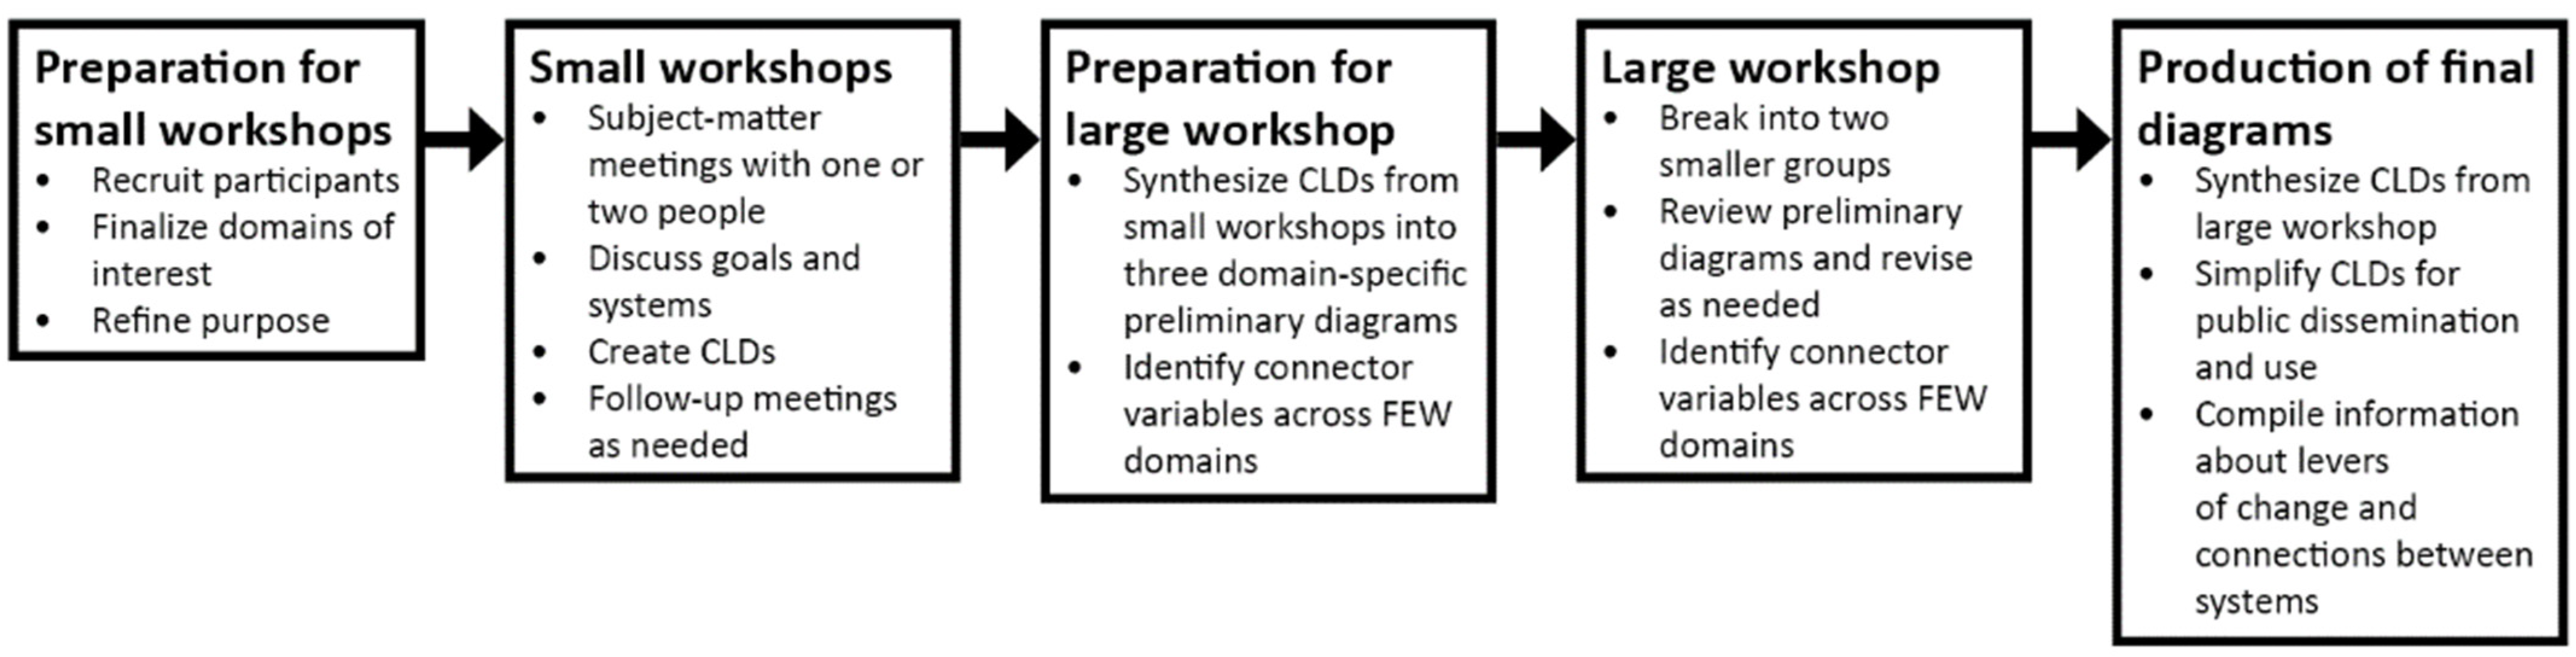
2.4. Process
2.4.1. Preparation for Workshops
2.4.2. Small Domain-Focused Workshops
2.4.3. Large Synthesis Workshop
2.4.4. Finalizing the Diagrams
3. Results
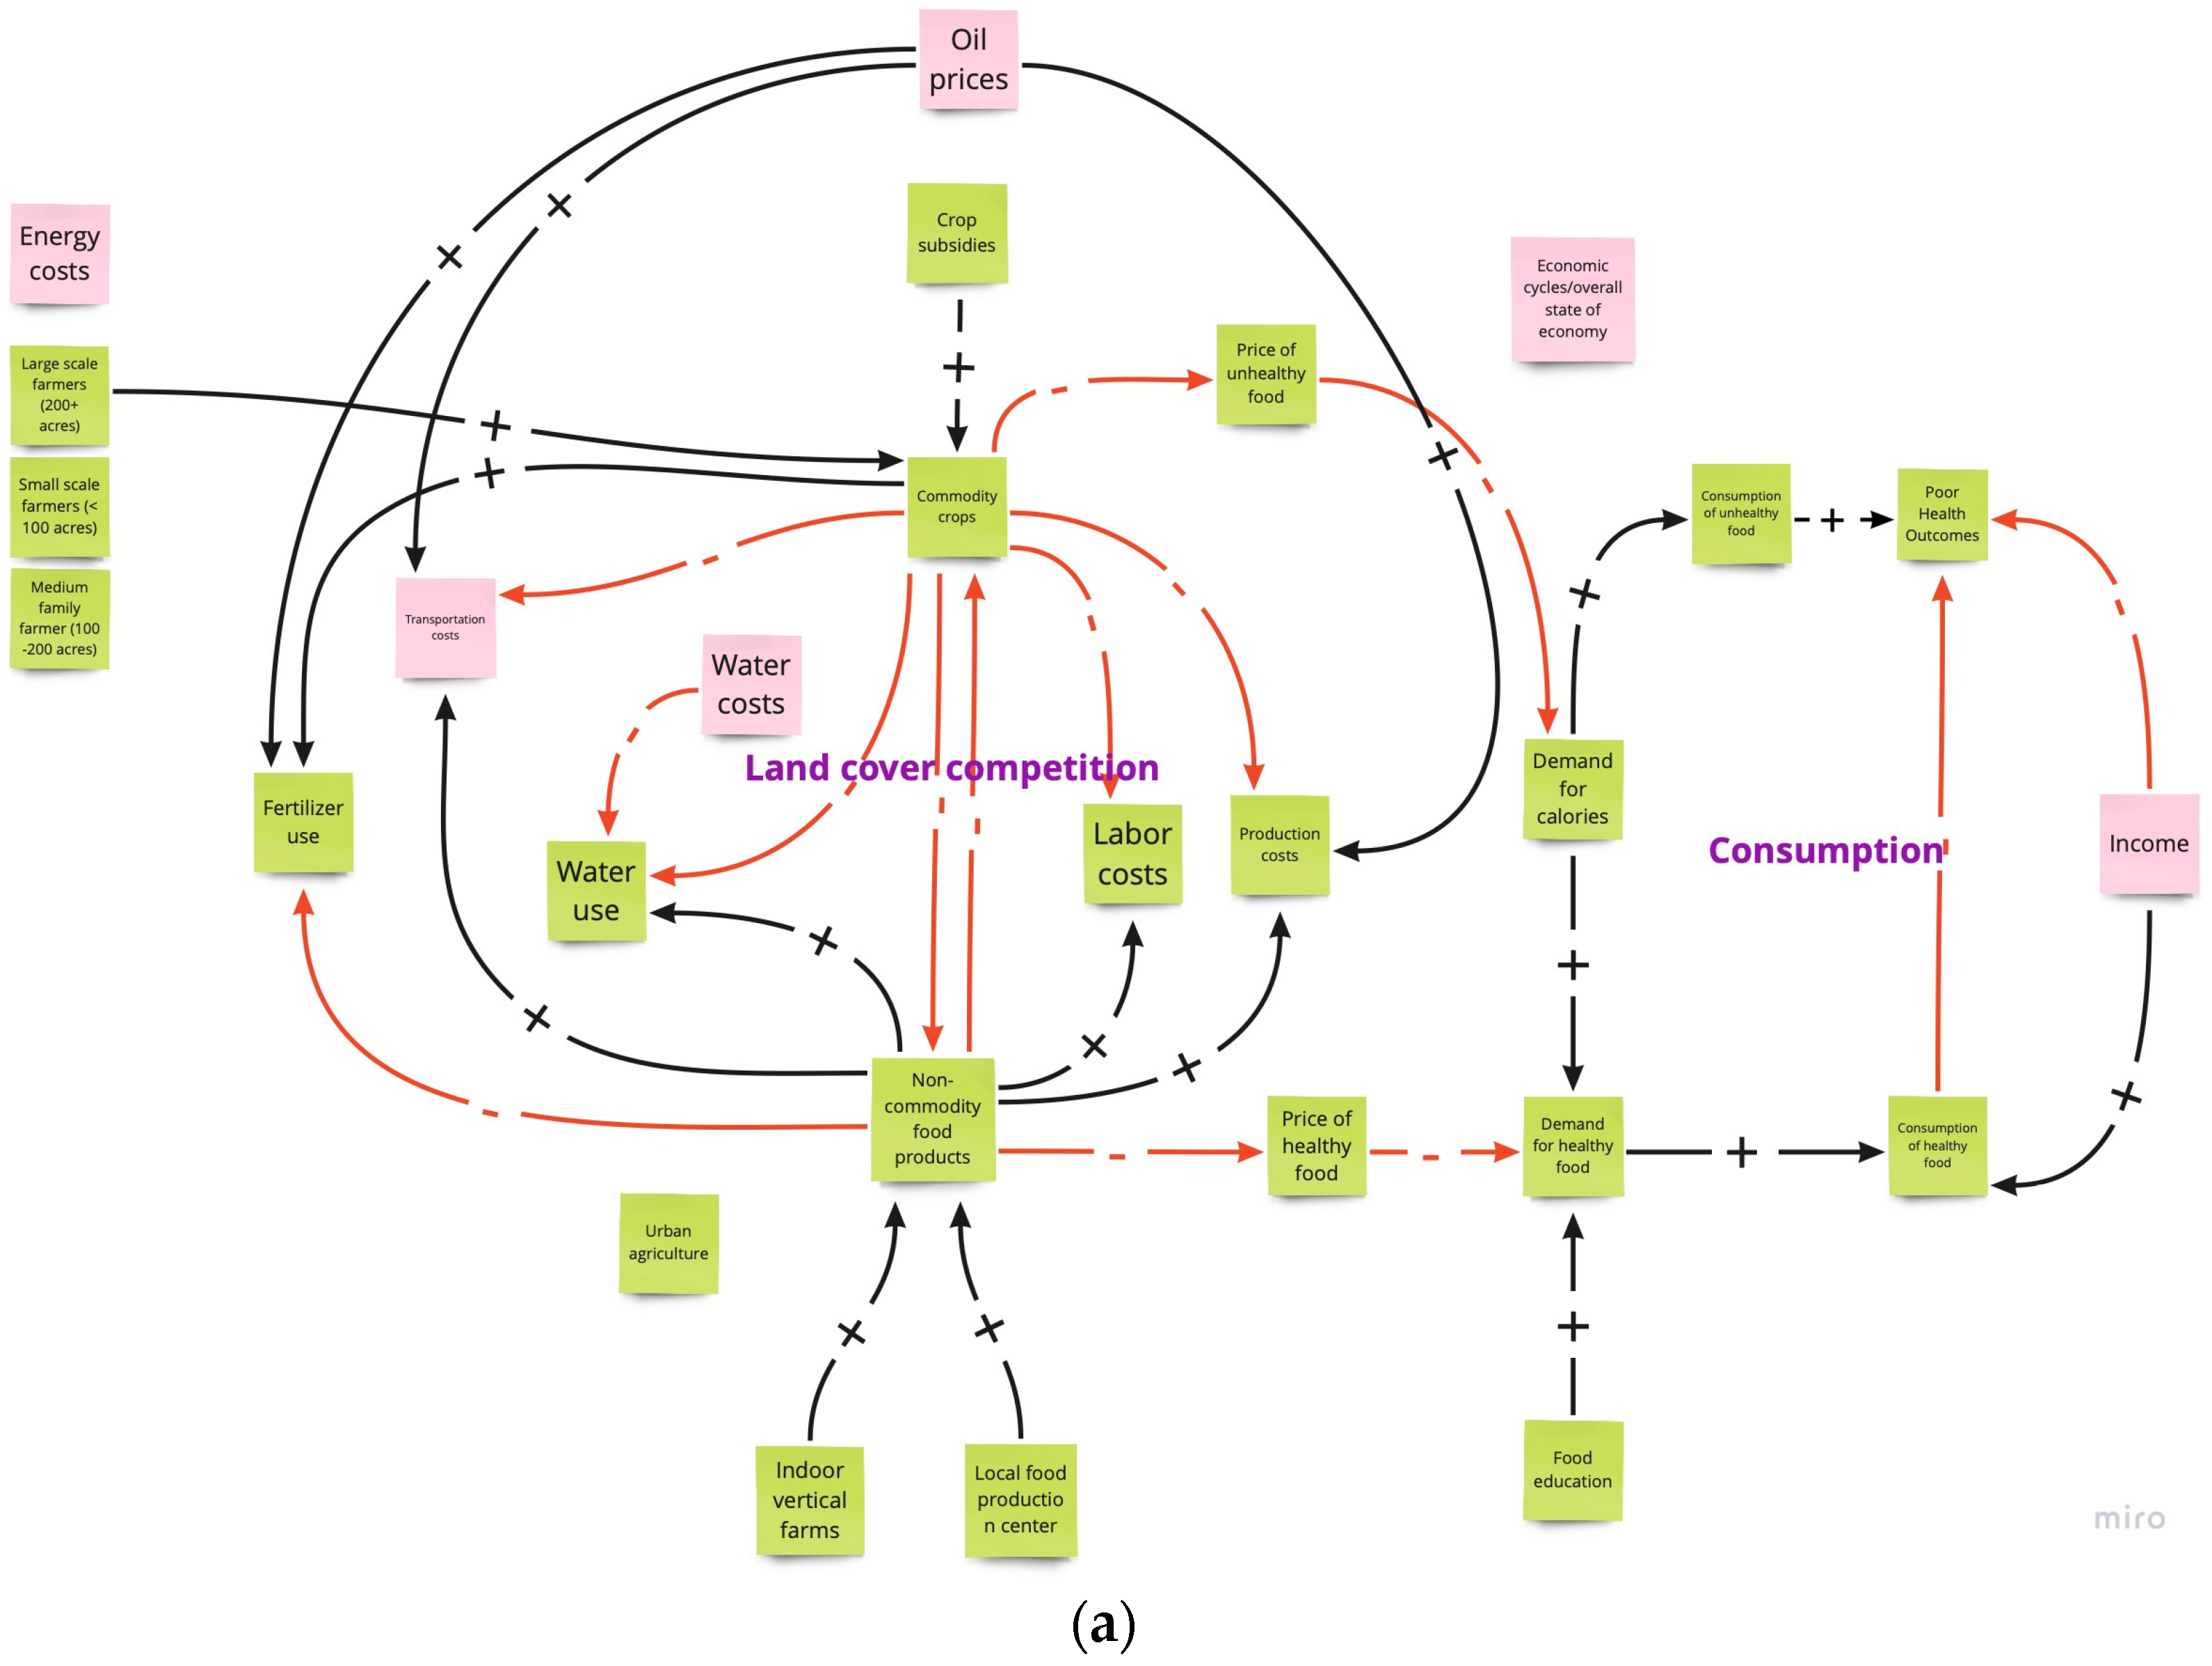
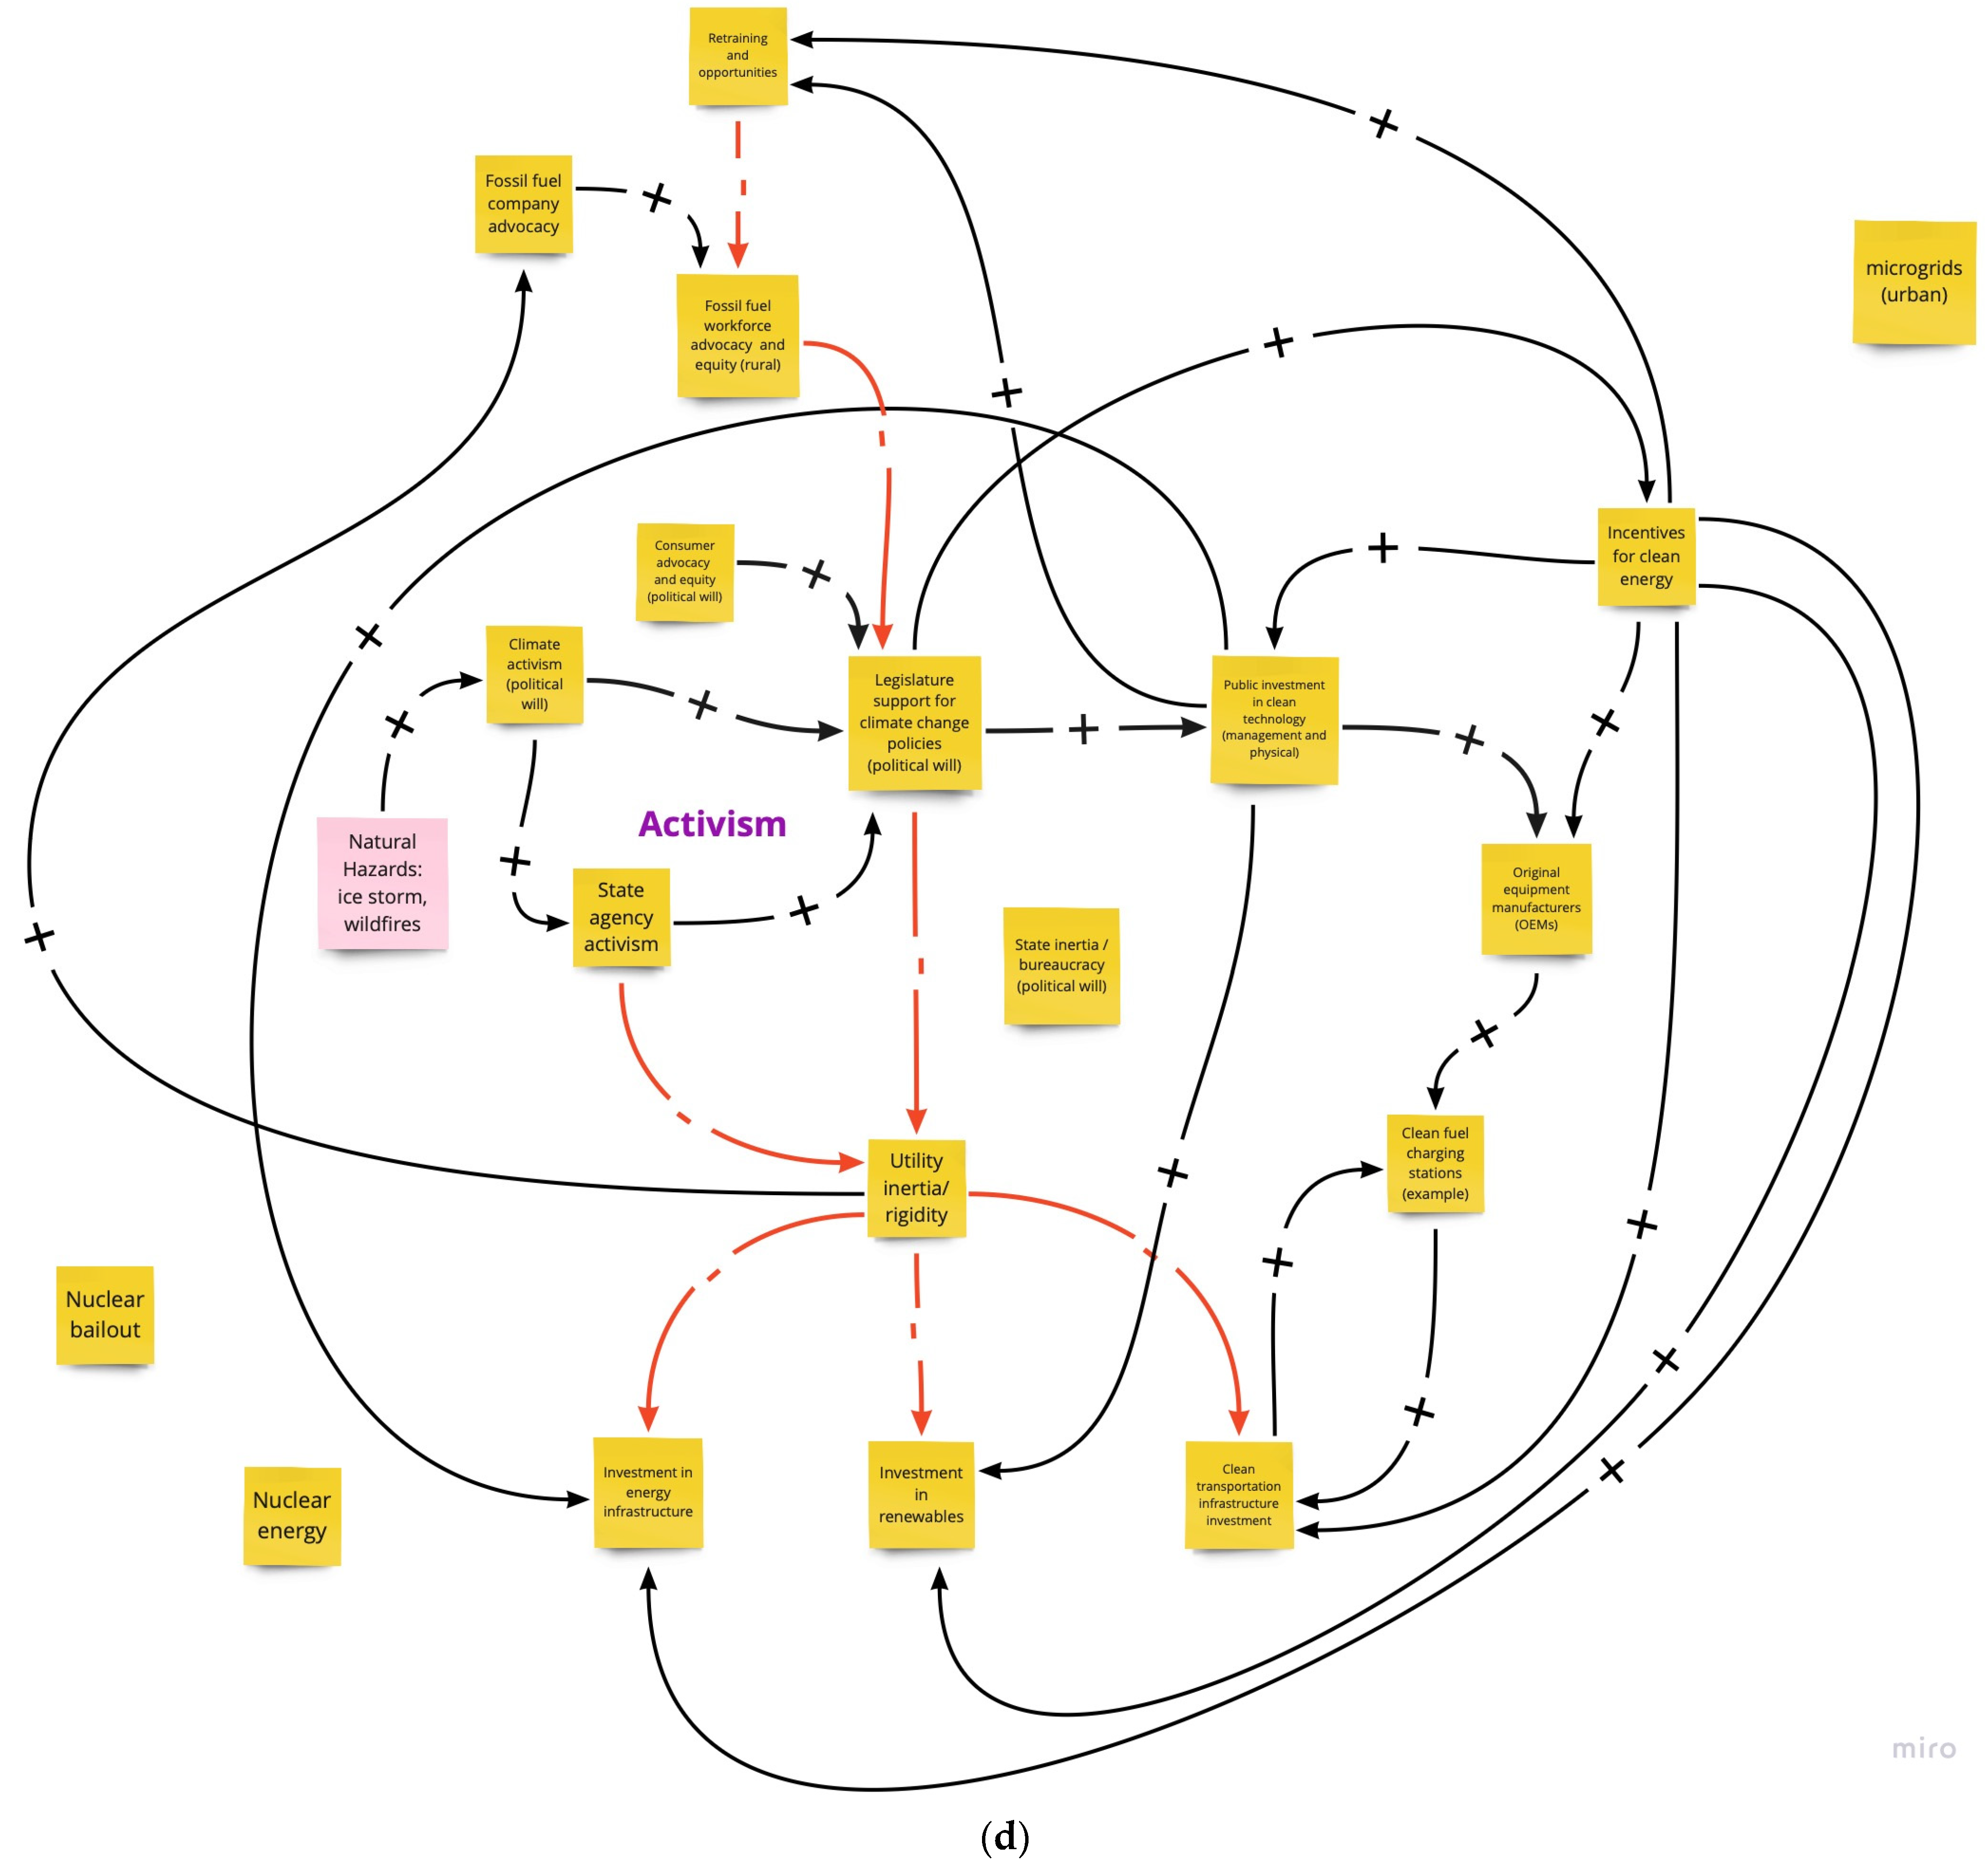
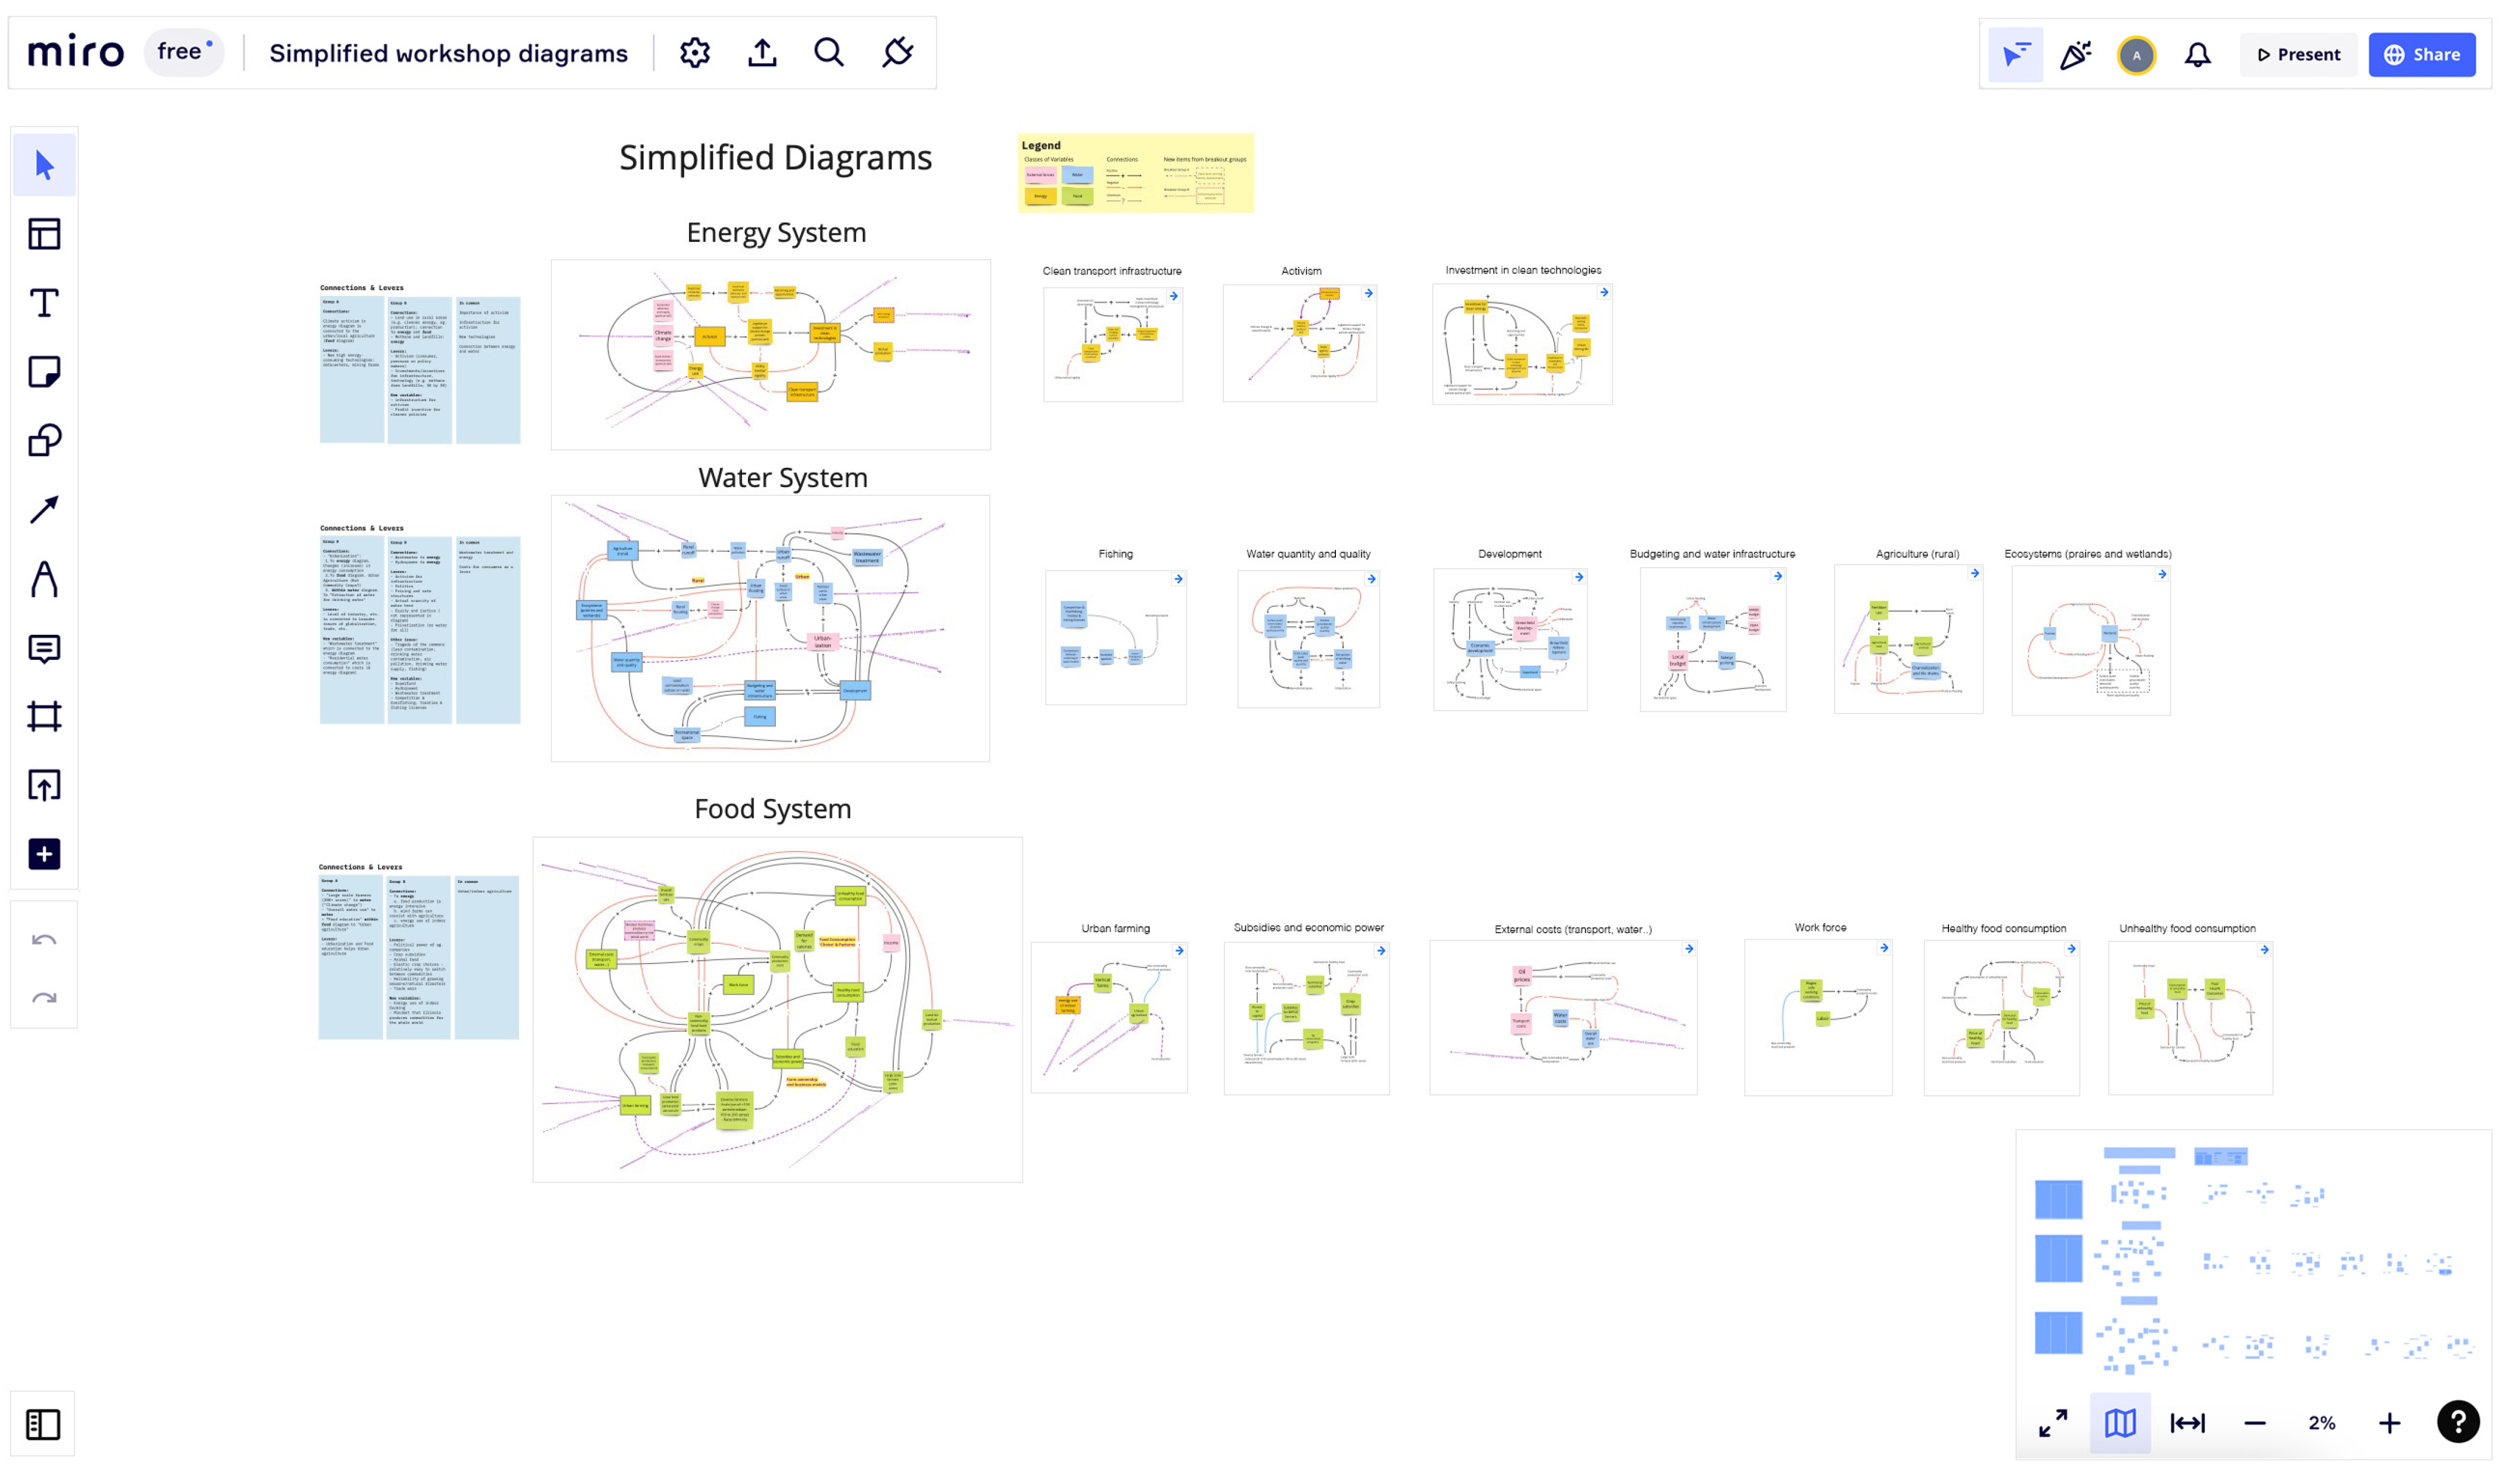
3.1. Modeling Products
3.2. Social Outcomes
3.3. Policy and Management Outcomes
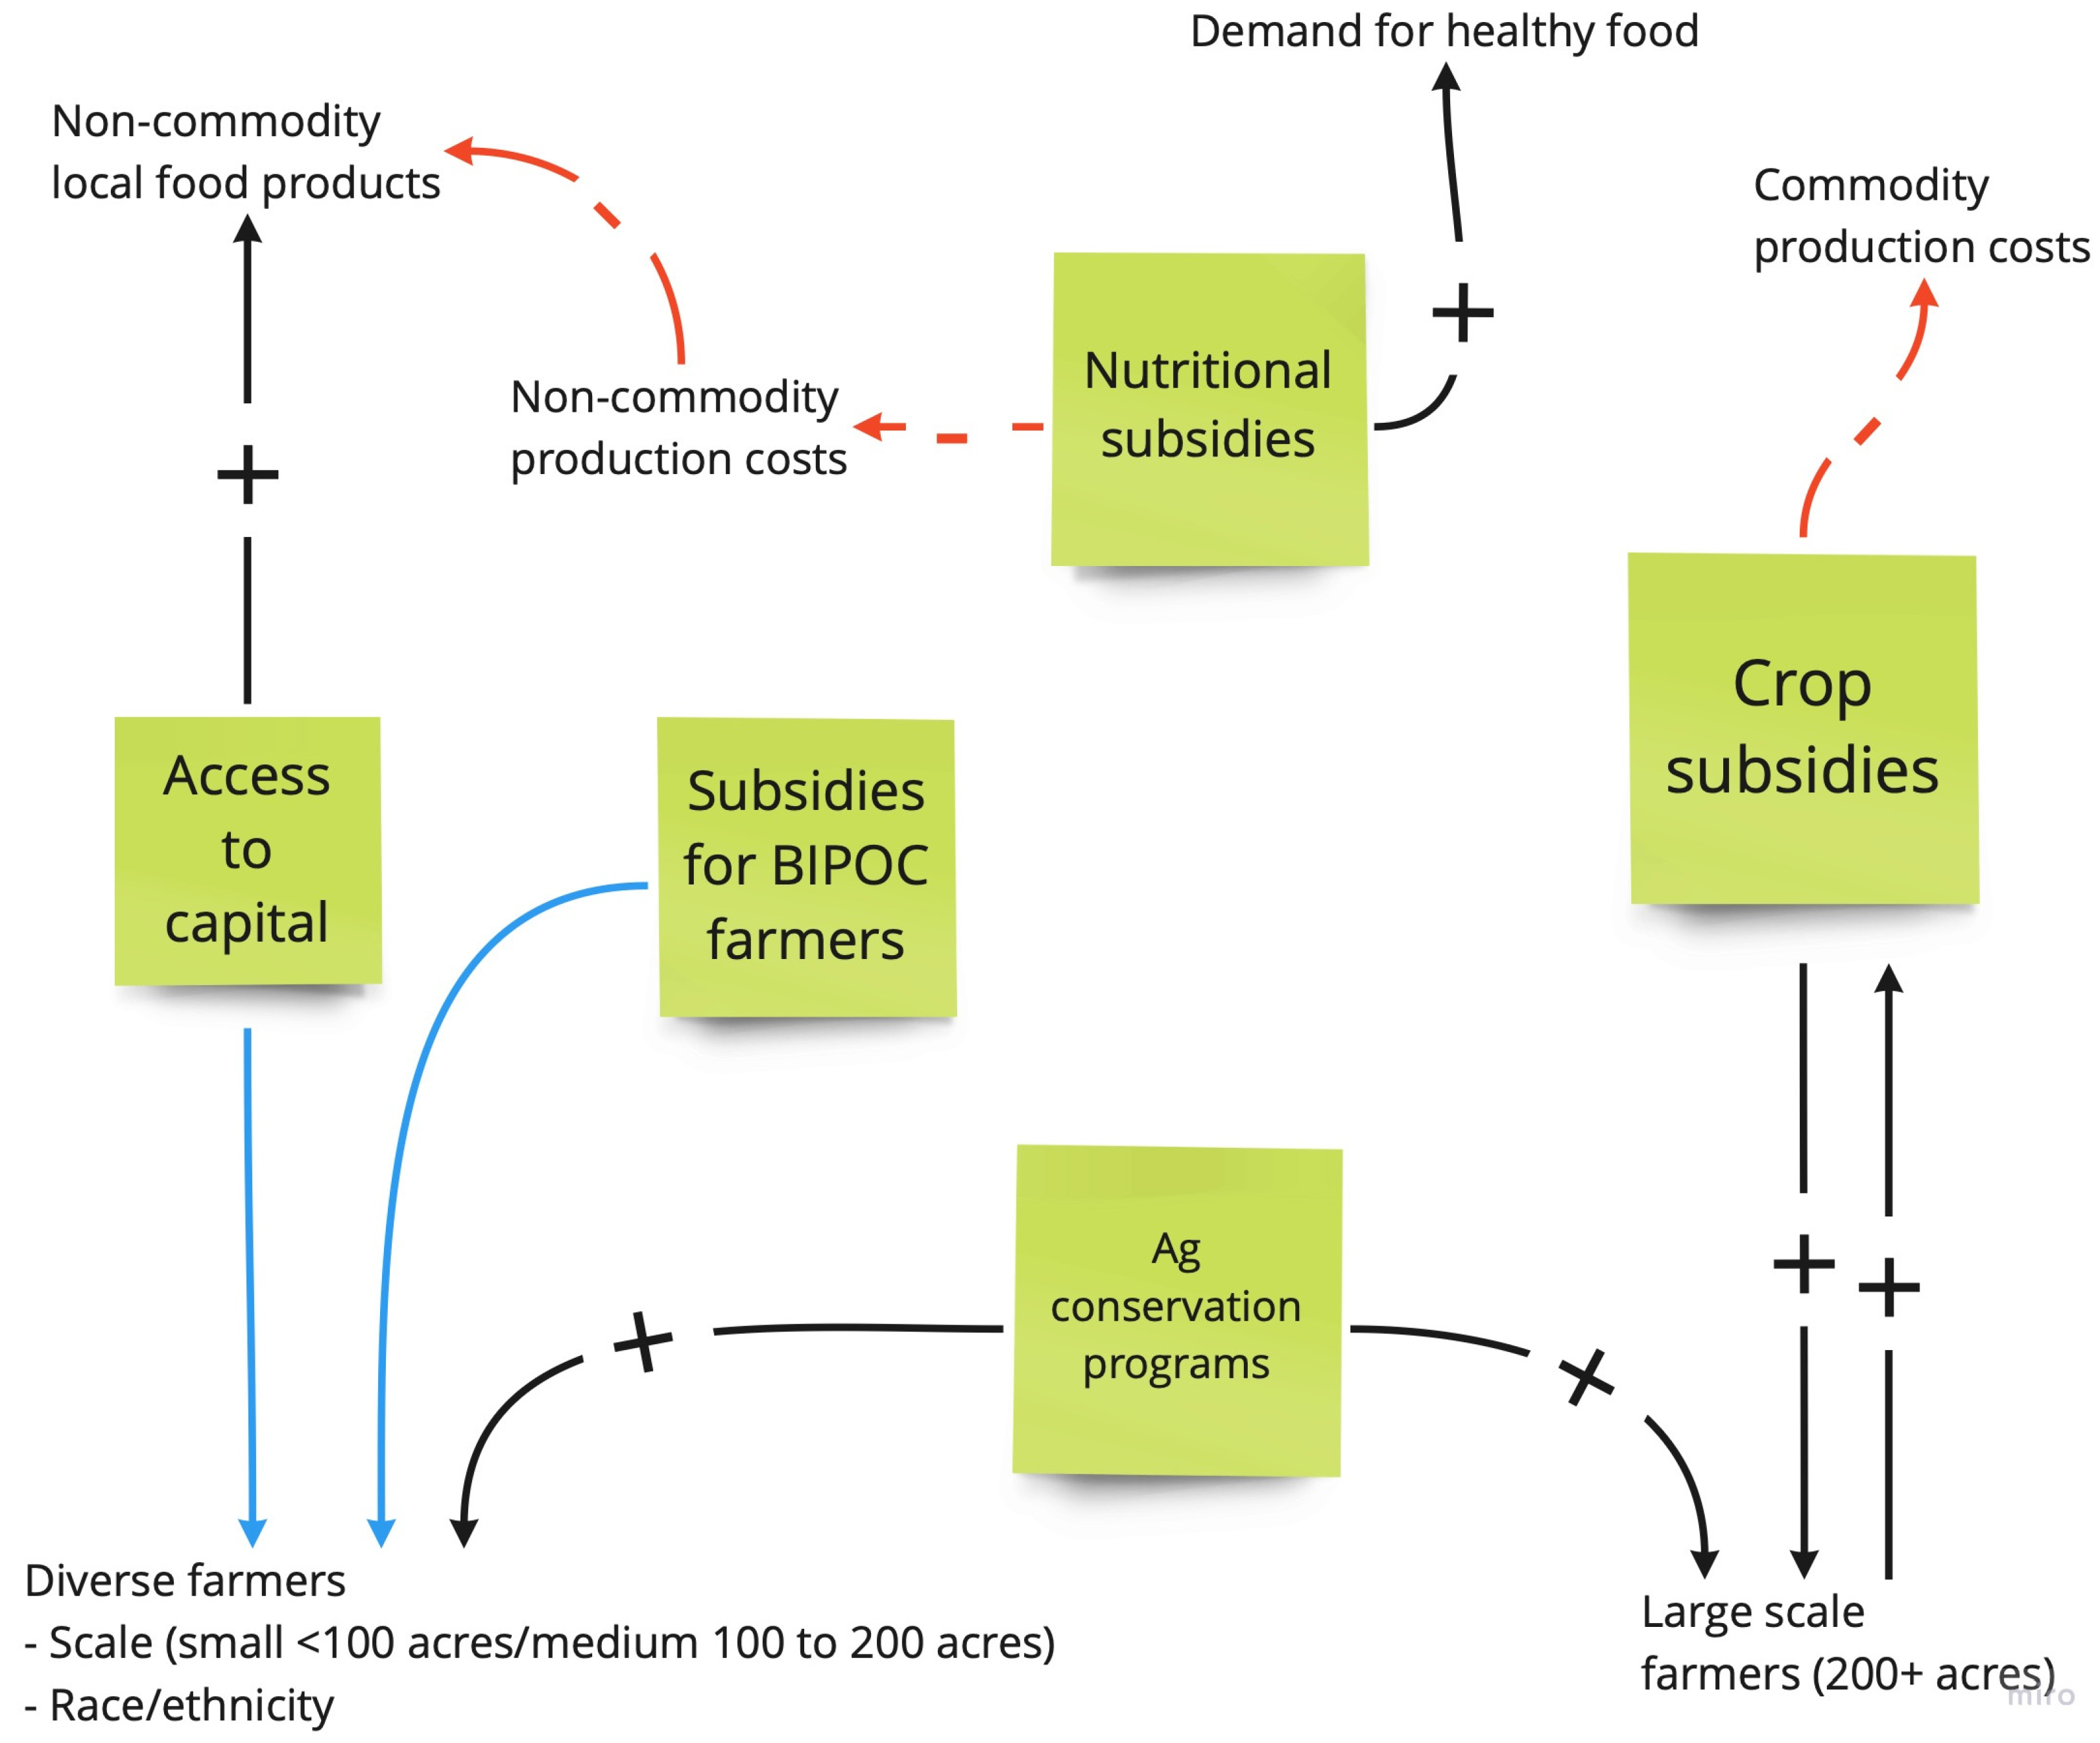
3.3.1. Food Domain
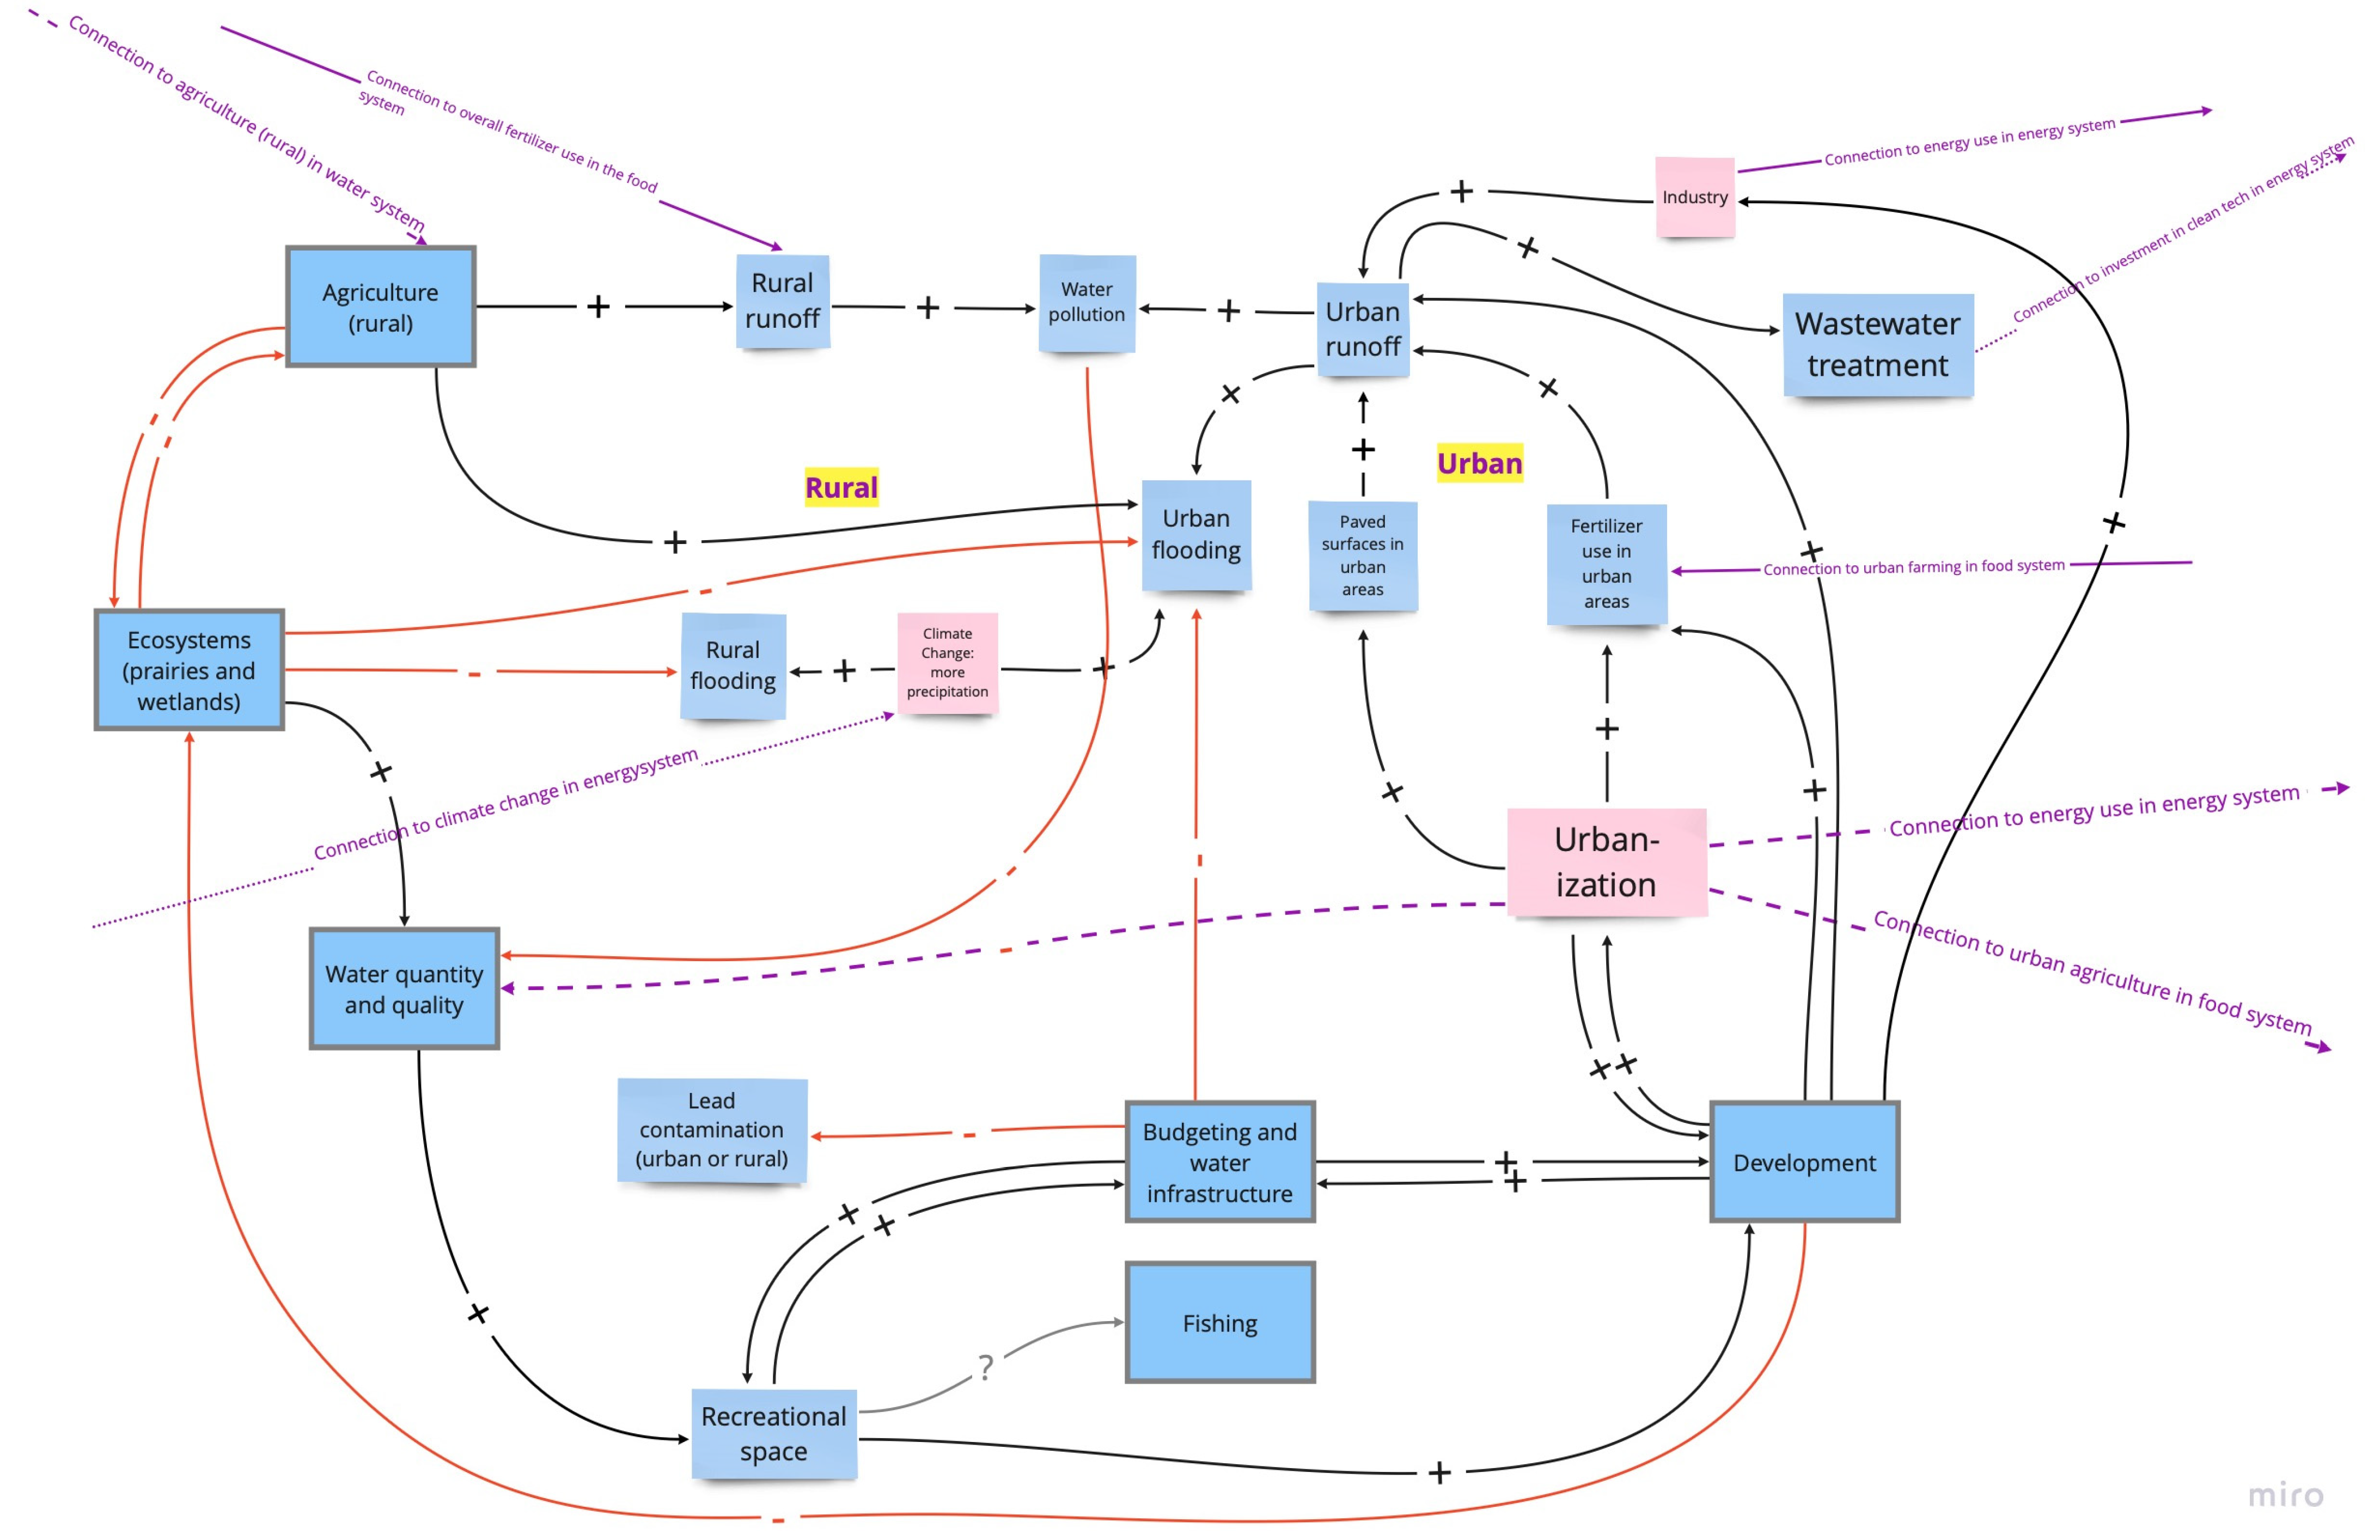
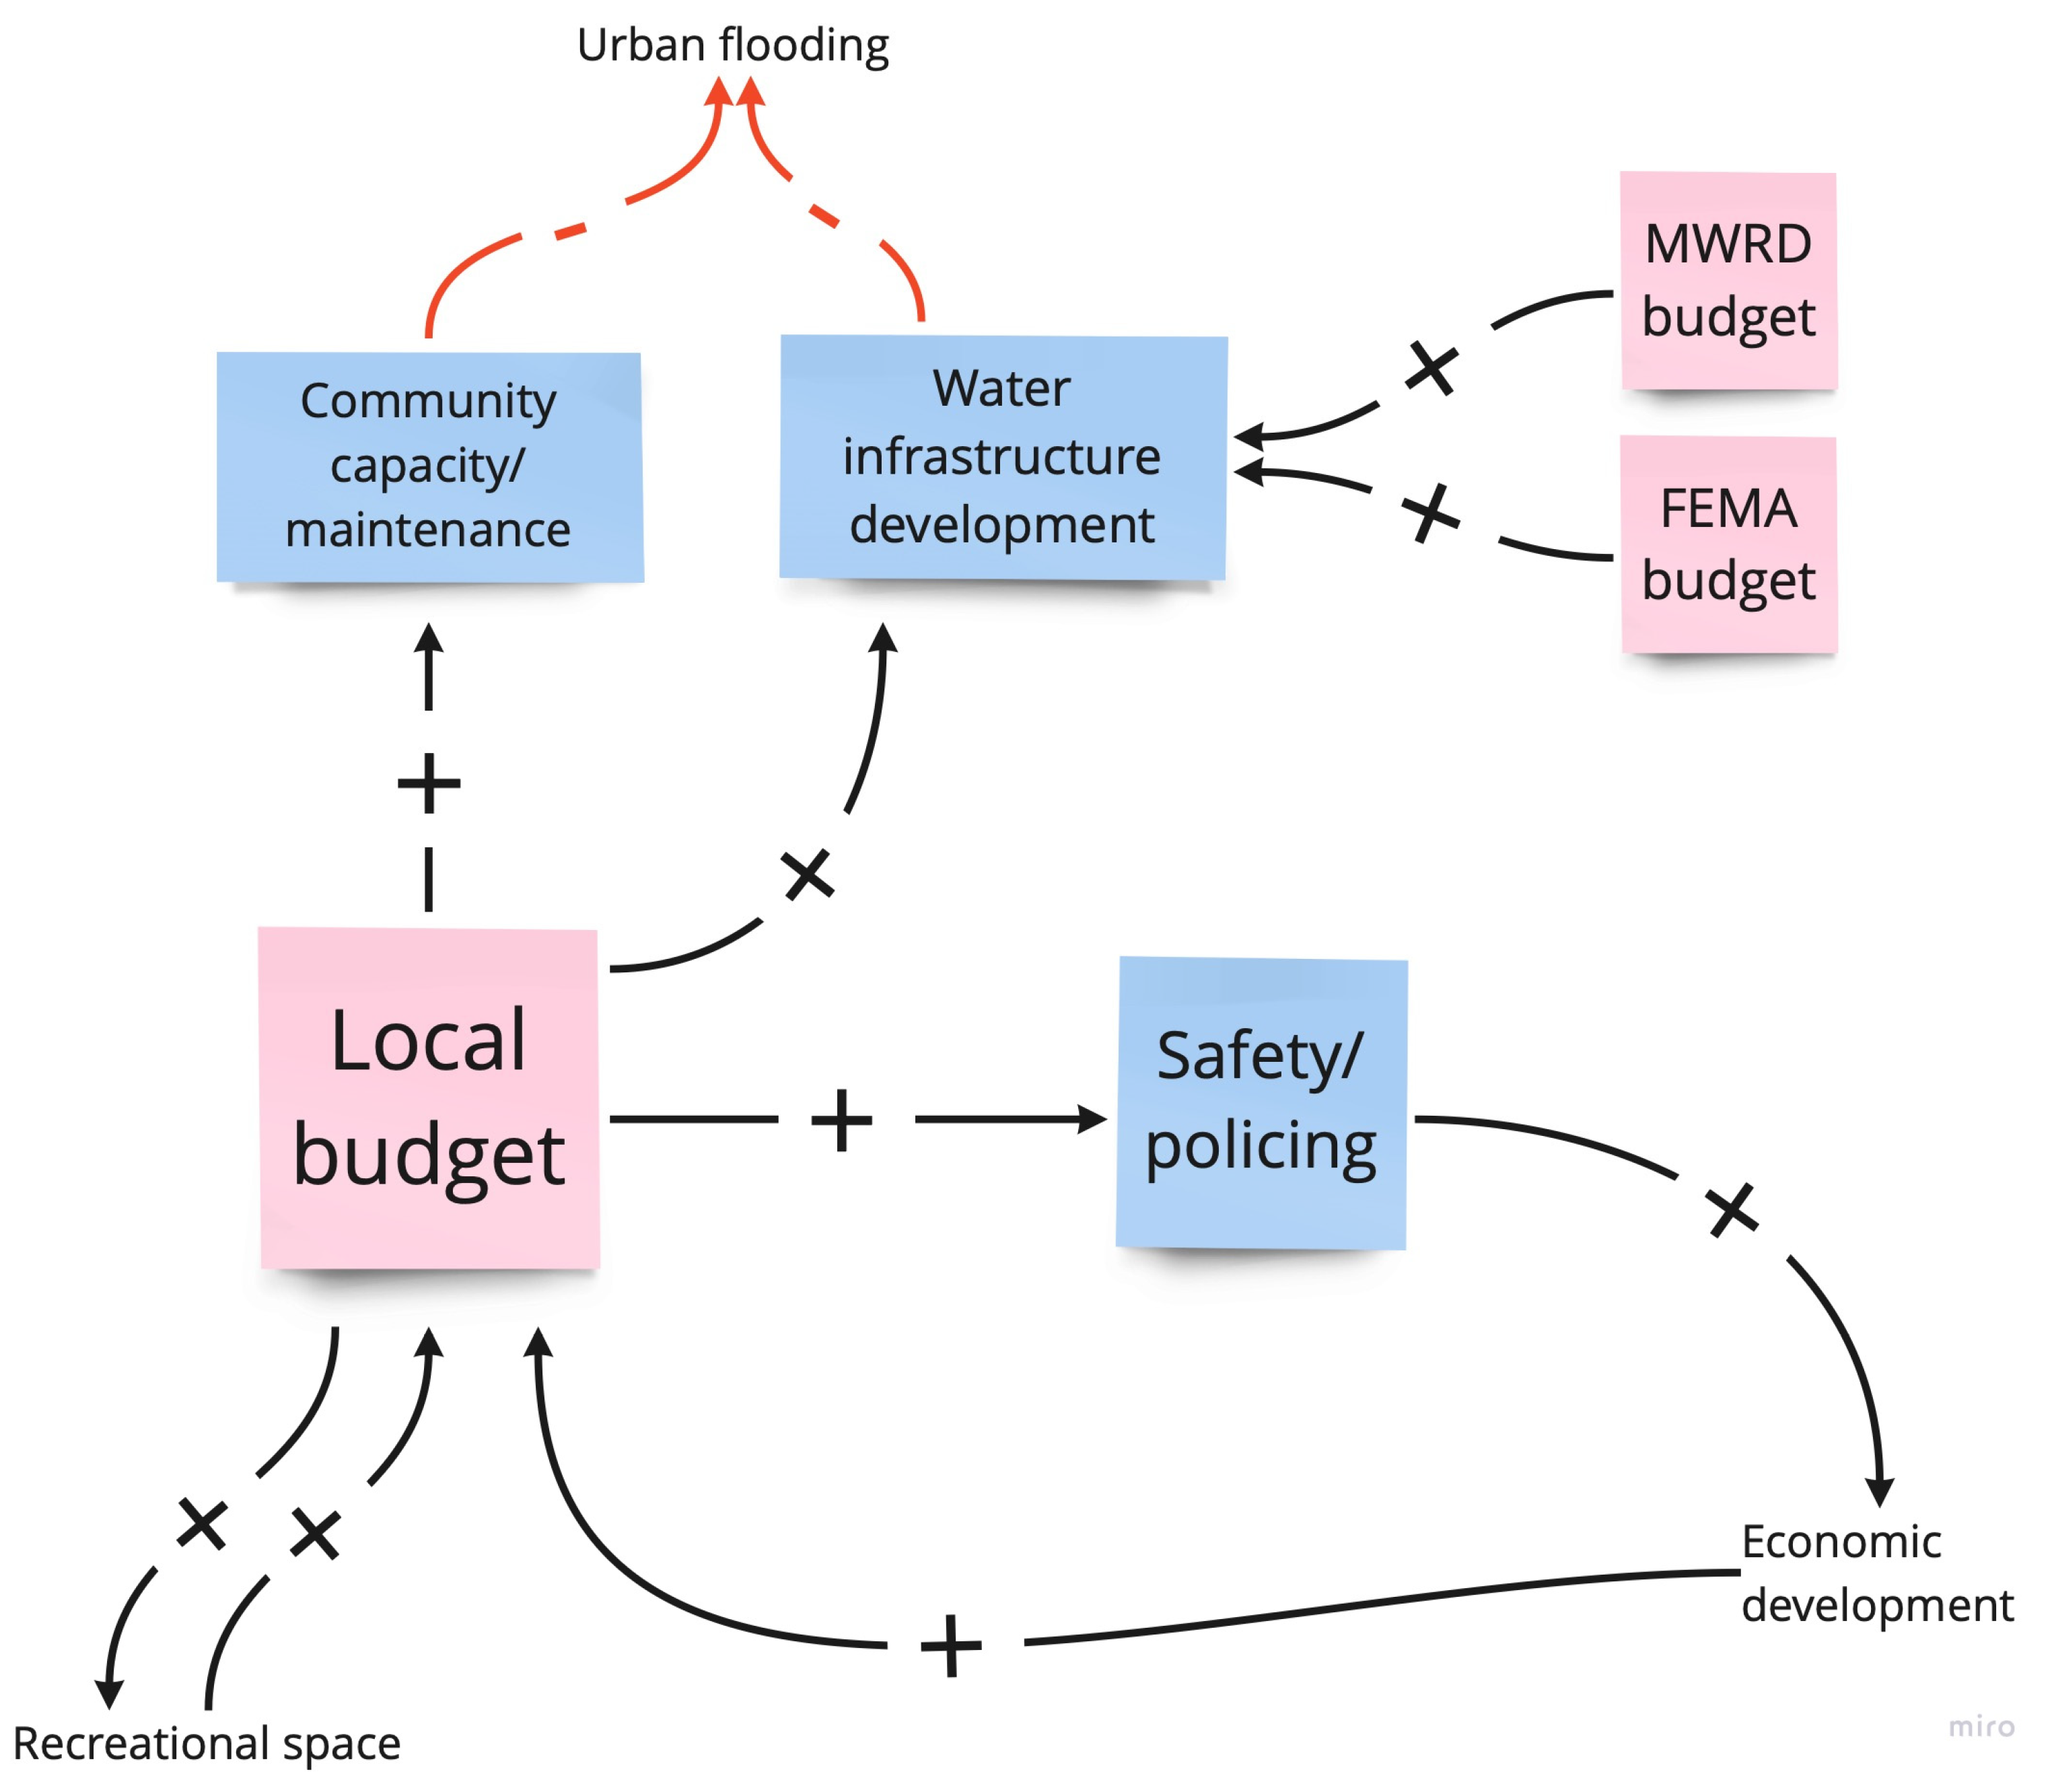
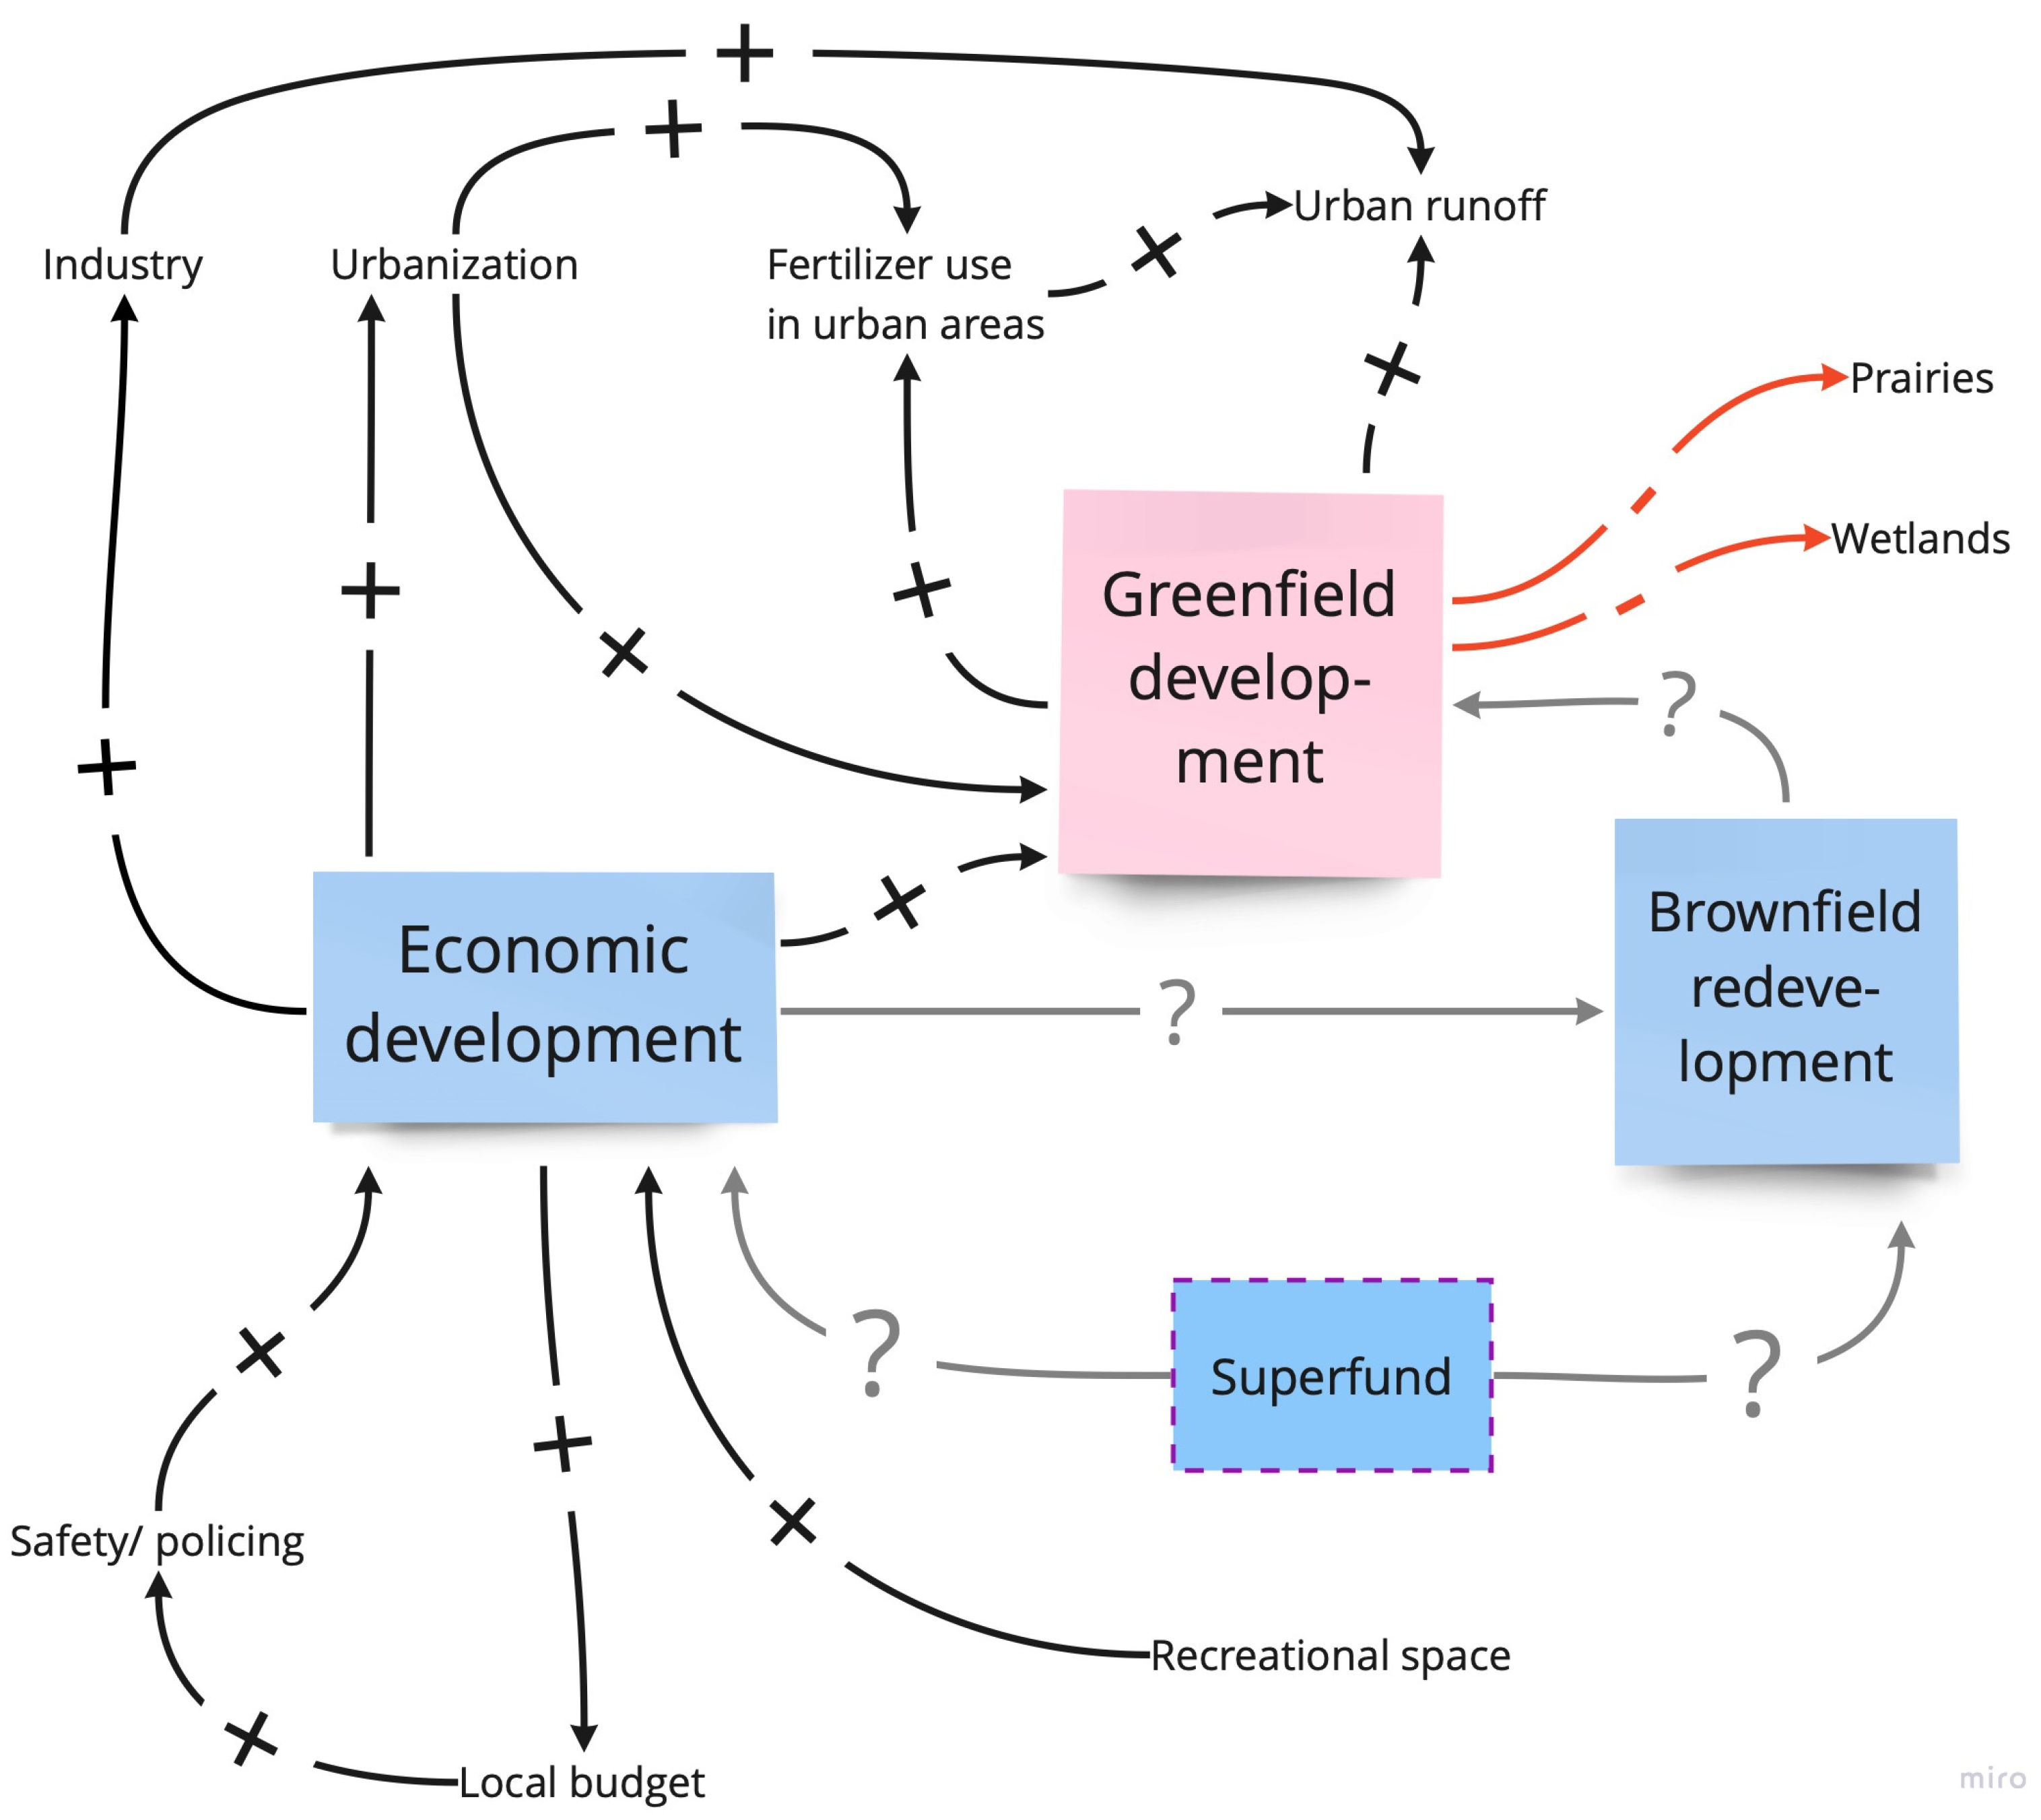
3.3.2. Water Domain
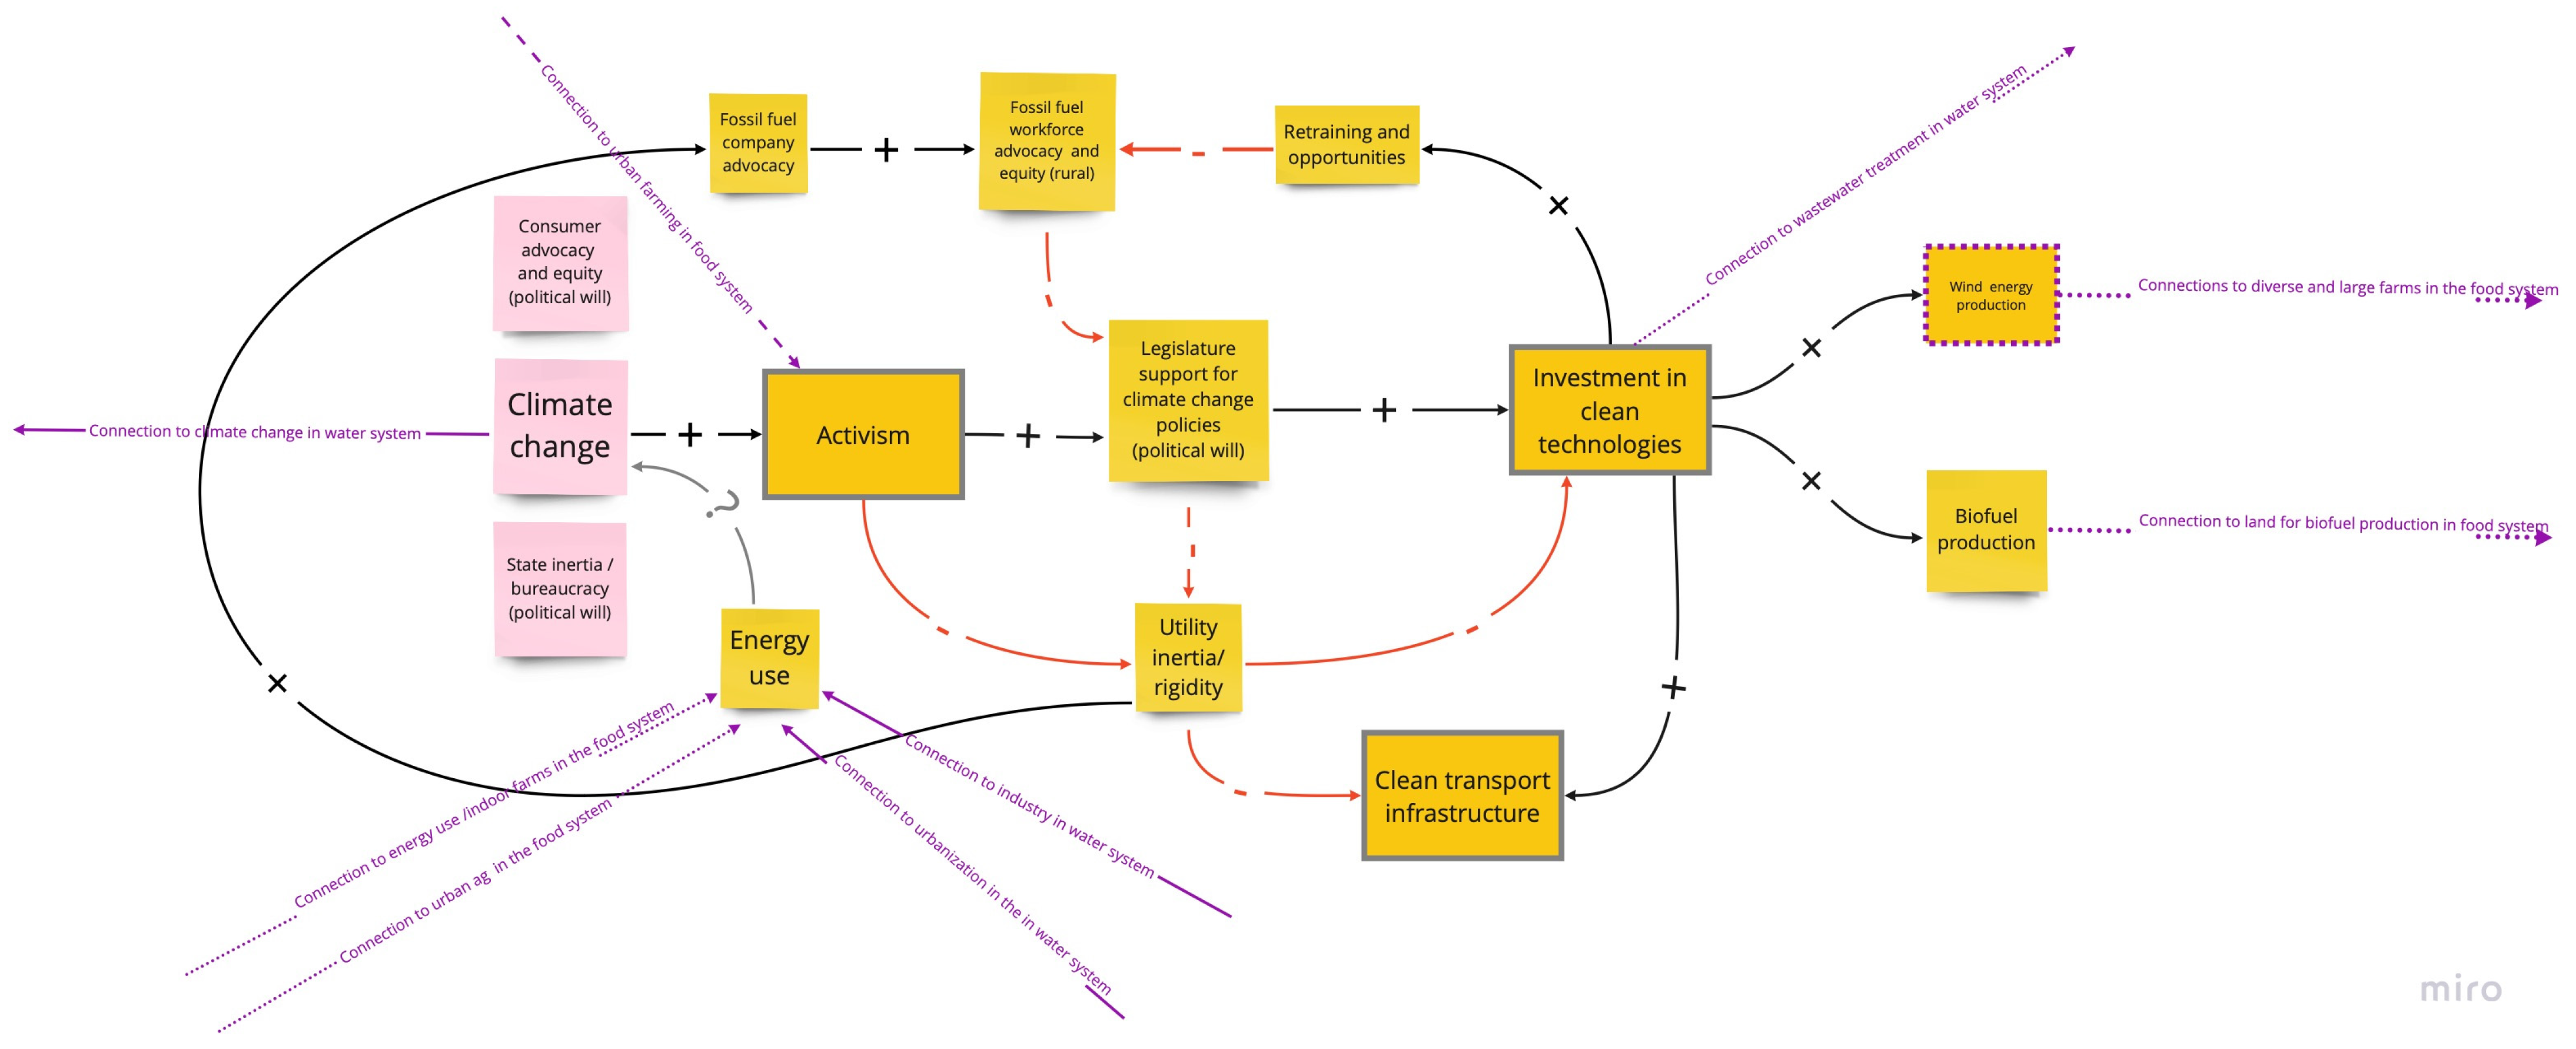
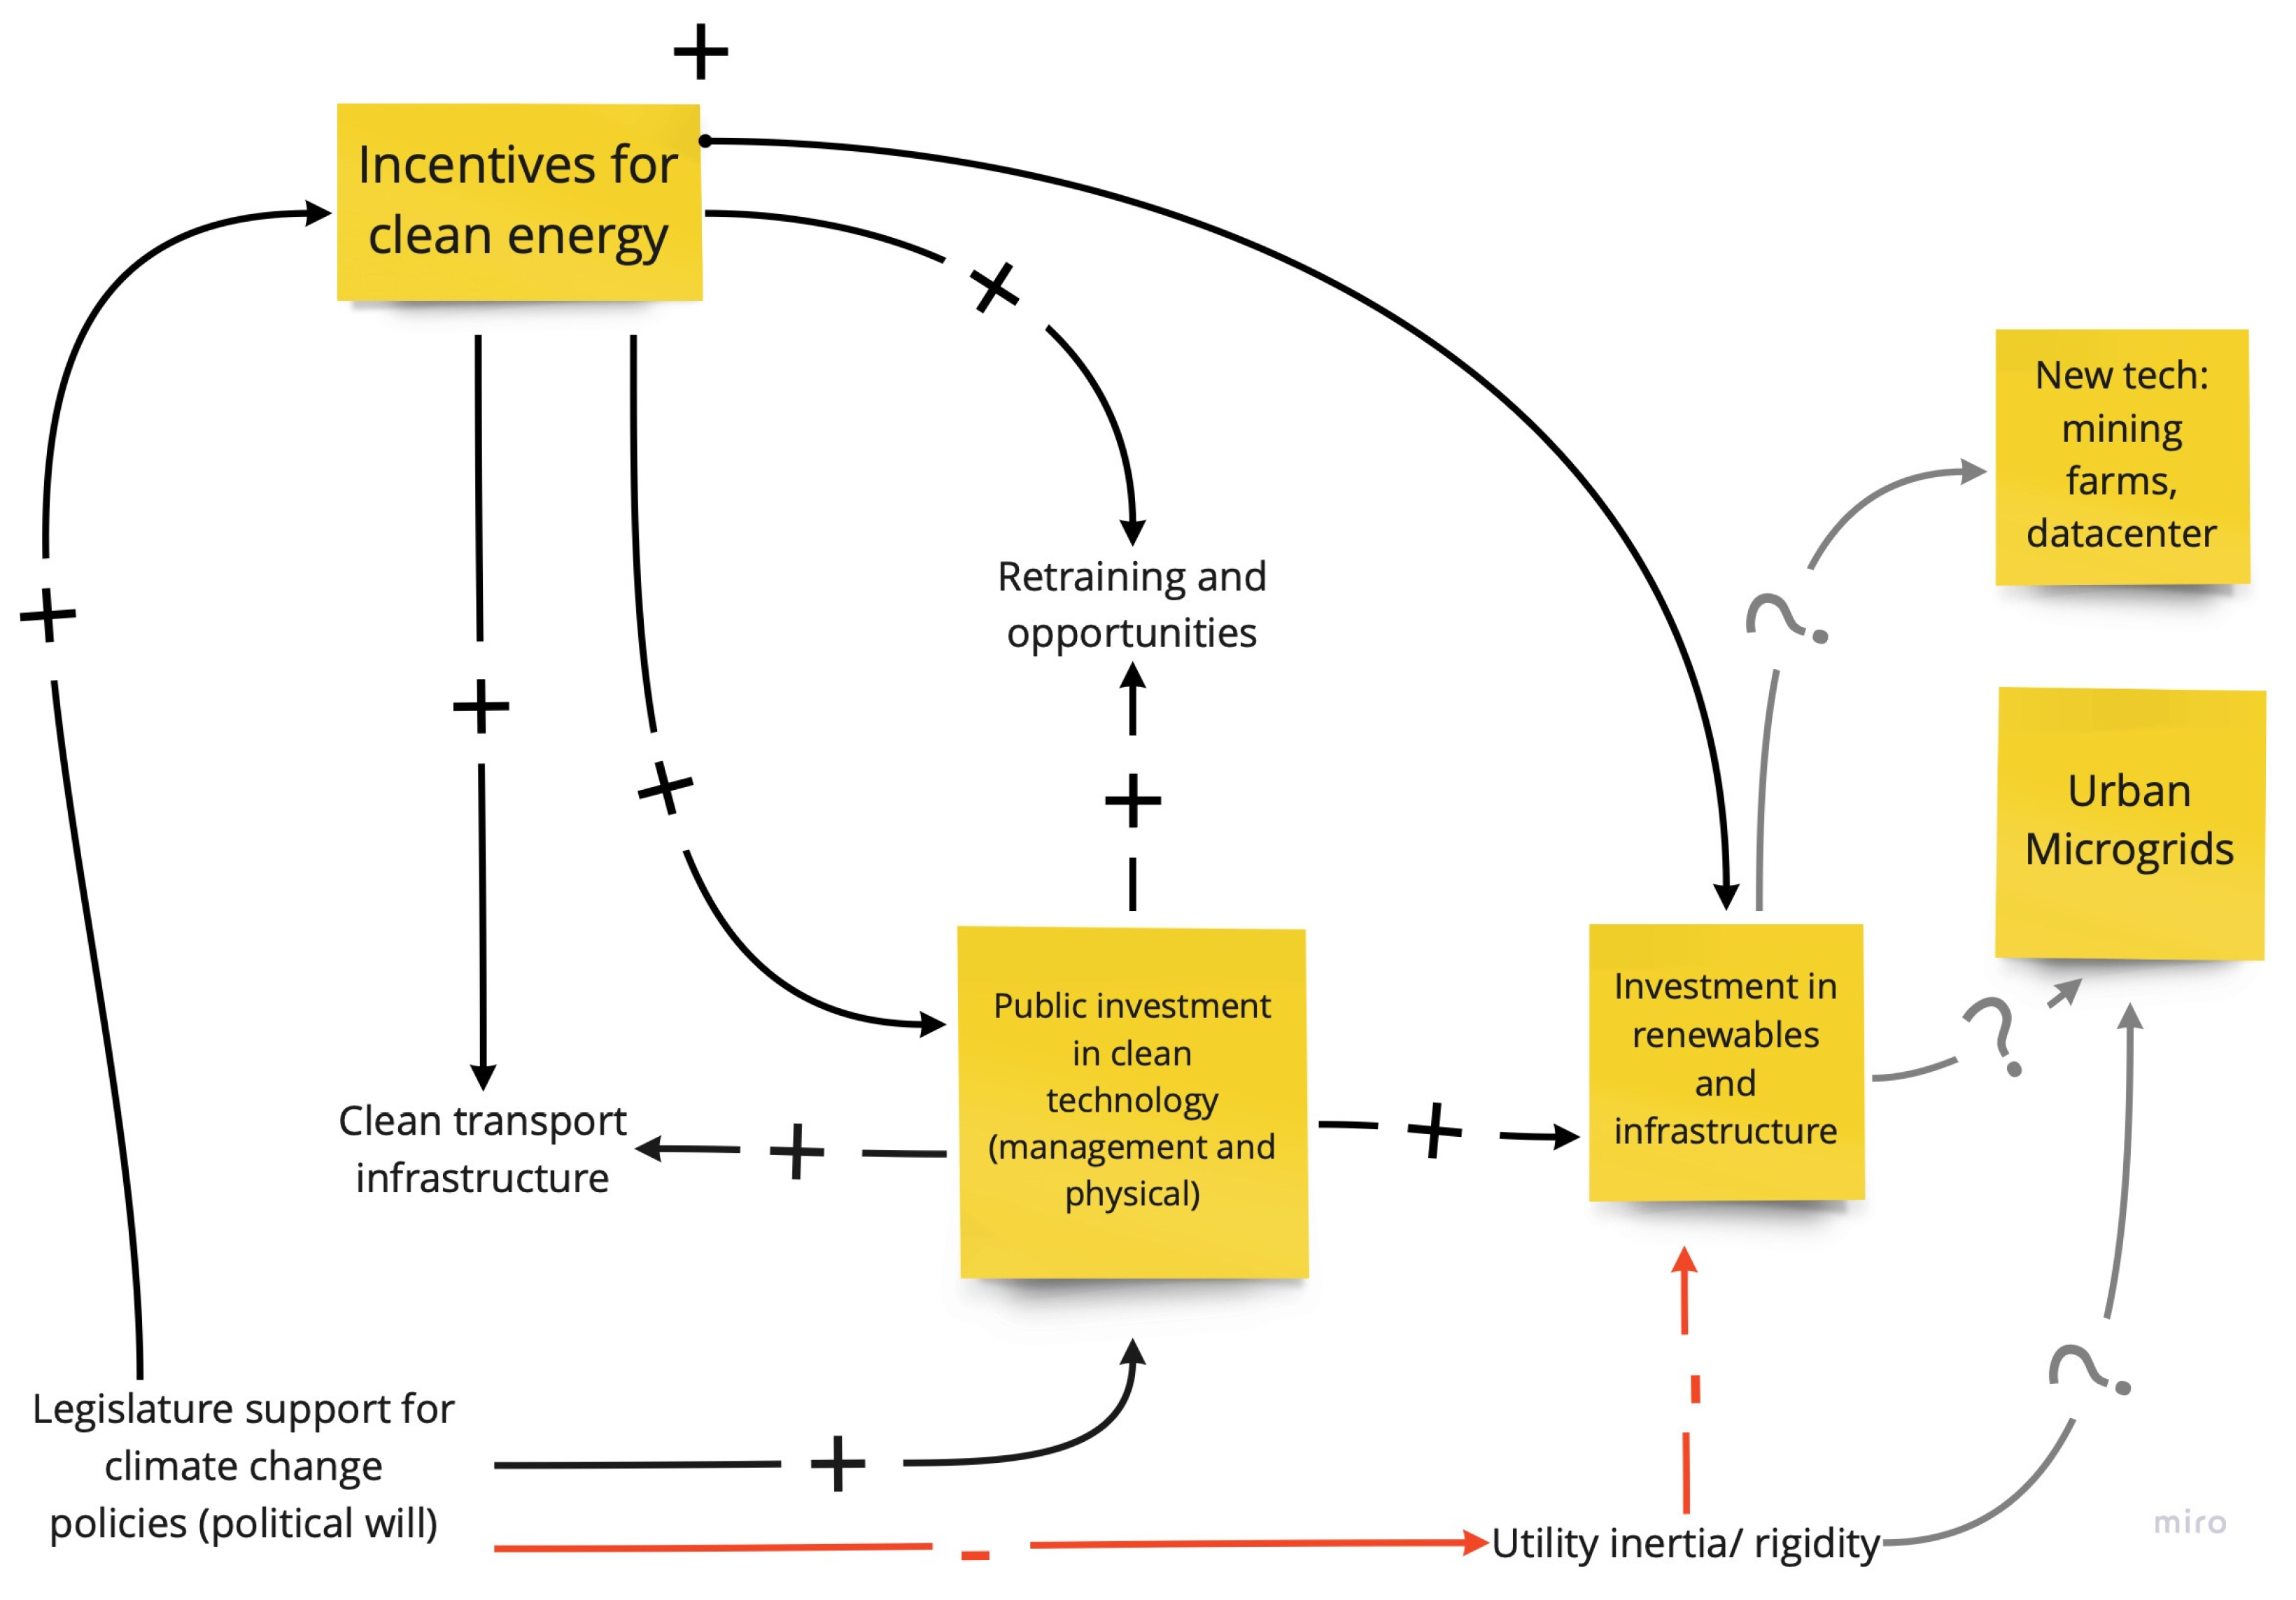
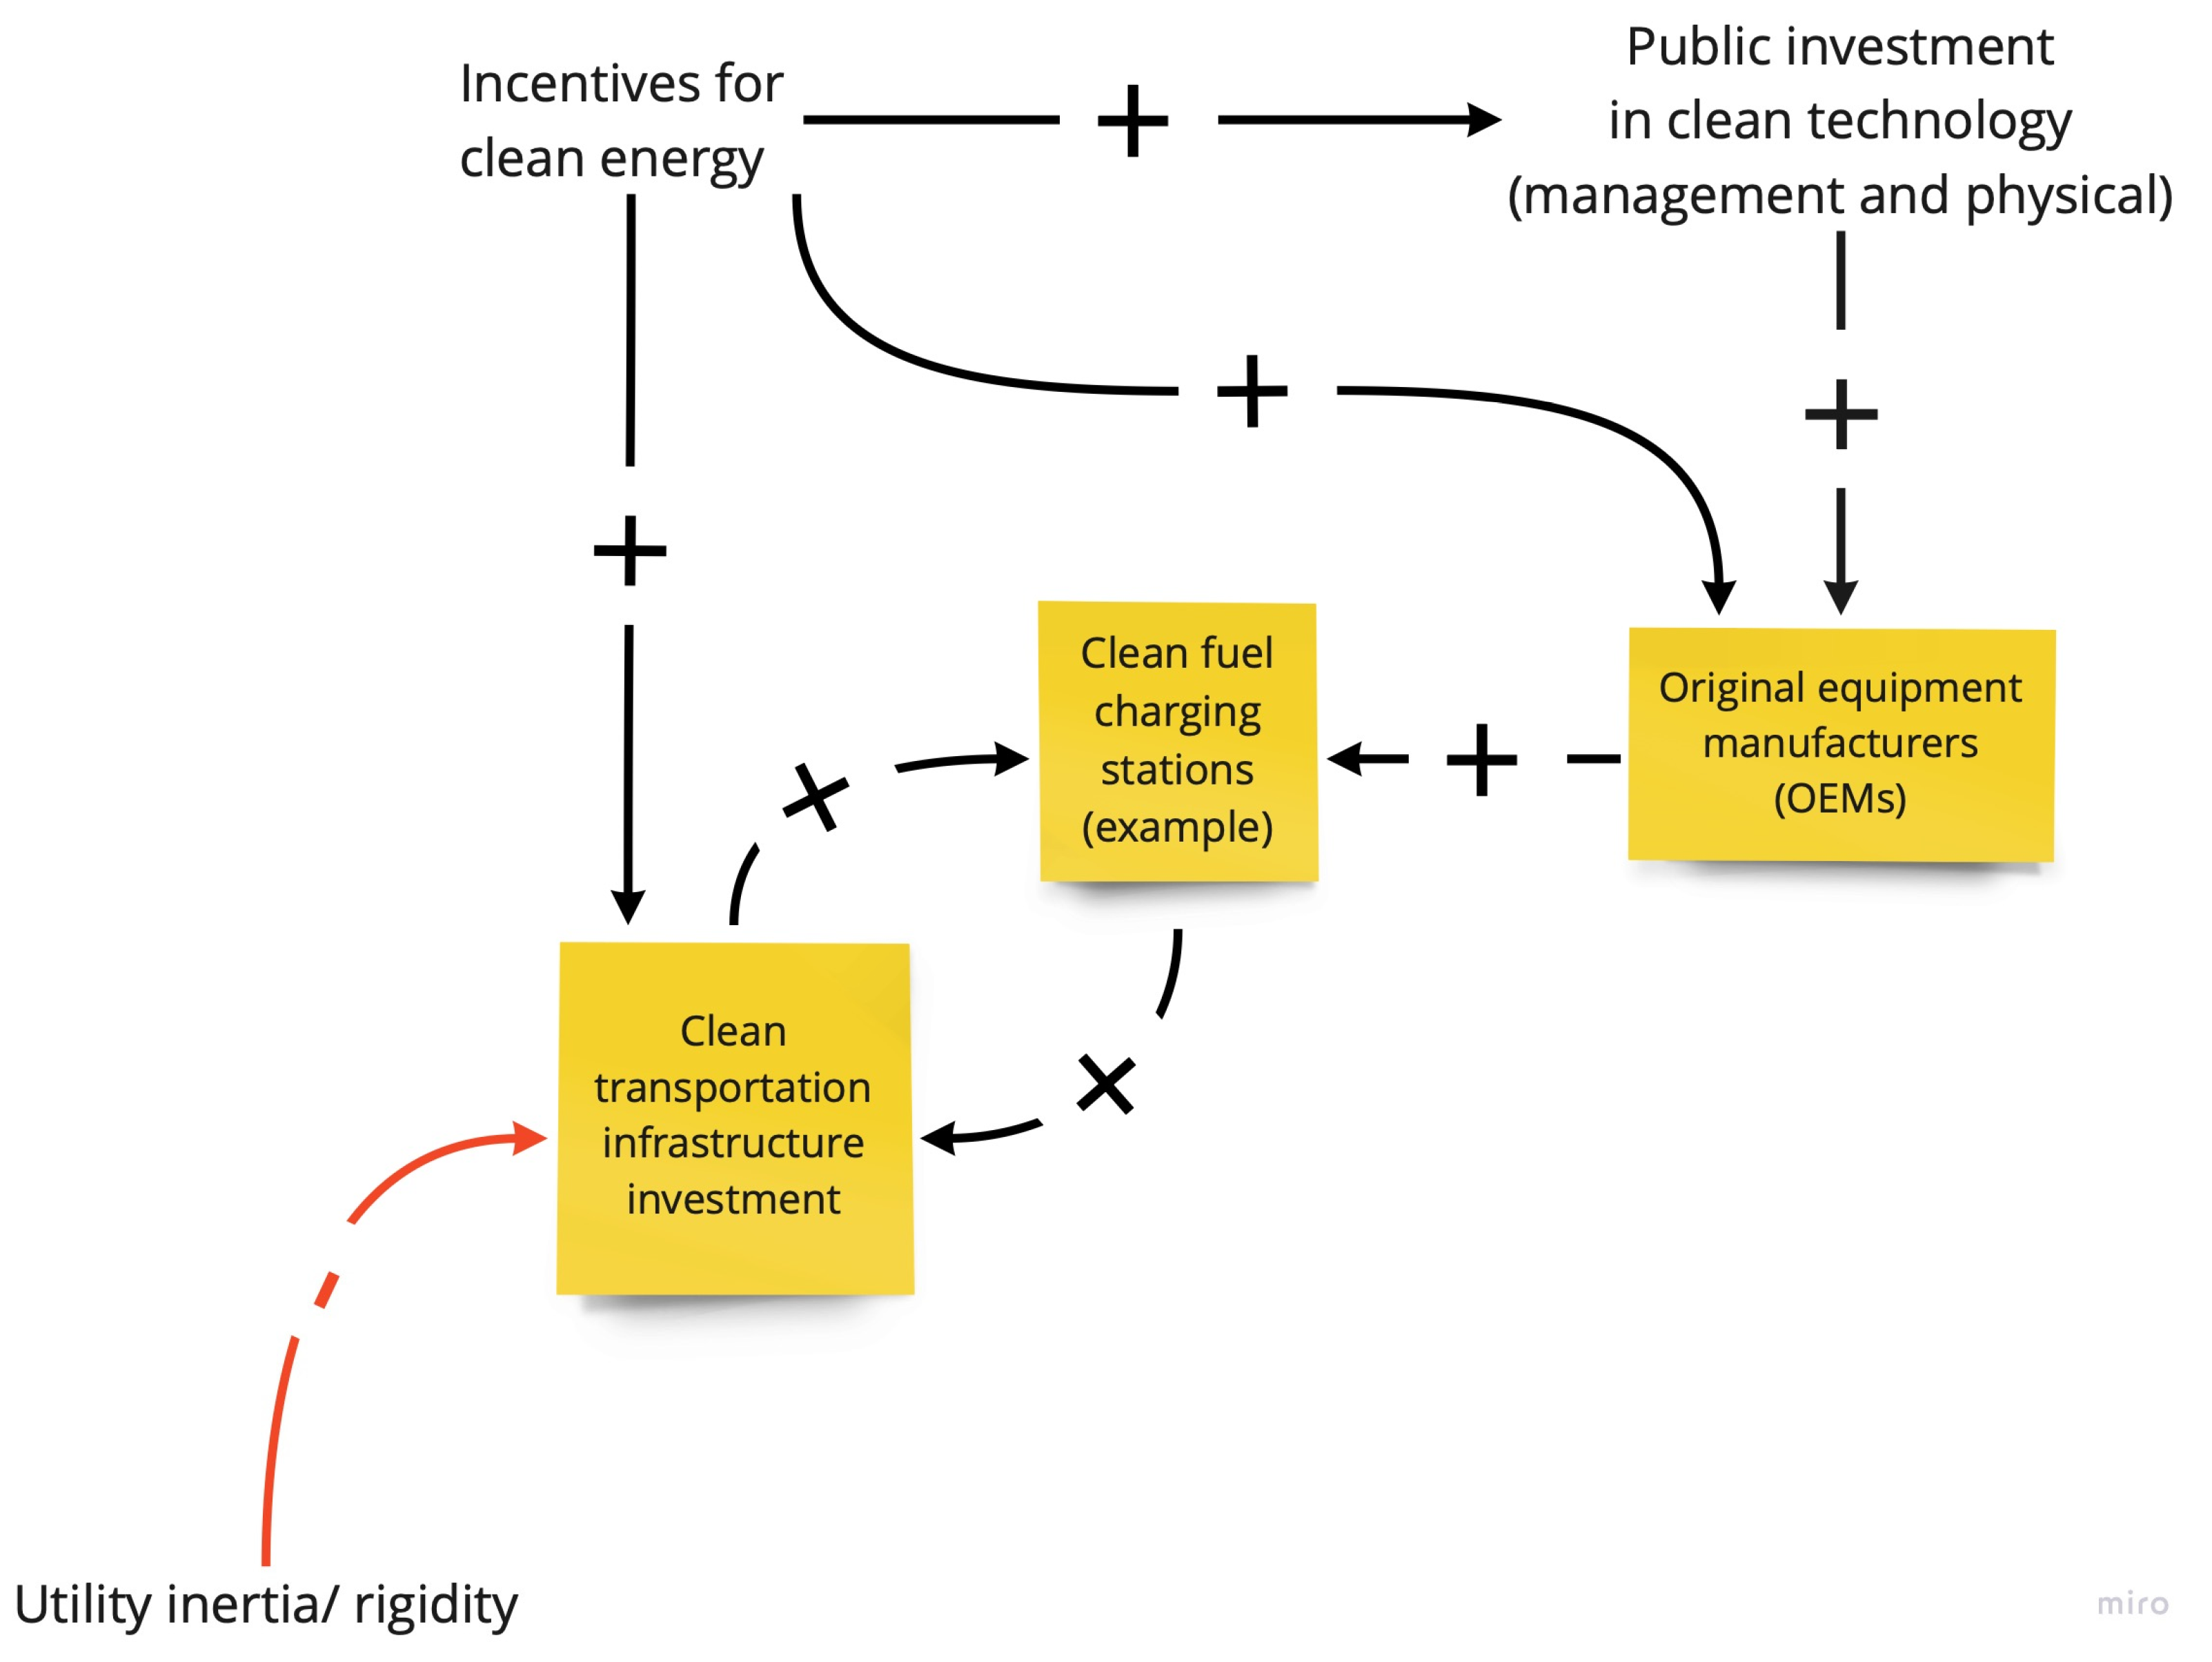
3.3.3. Energy Domain
4. Discussion
Author Contributions
Funding
Data Availability Statement
Acknowledgments
Conflicts of Interest
| 1 | https://miro.com/ (accessed on 16 February 2023). |
| 2 | Northern Illinois University story: https://niutoday.info/2021/09/06/nius-urban-regional-modeling-helps-to-advance-environmental-research-and-policy/ (accessed on 16 February 2023). Public Miro board: https://miro.com/app/board/o9J_lDT6xtY=/ (accessed on 16 February 2023). Video: https://www.youtube.com/watch?v=ogvG9qDAg00 (accessed on 16 February 2023). |
| 3 | Our participants considered a large-scale farmer to be a farmer operating on an area of 200 acres and more; medium-scale farmer to be operating in 100-200 acres, and small-scale farmer, in less than 100 acres. |
References
- Sukhwani, V.; Shaw, R.; Mitra, B.K.; Yan, W. Optimizing Food-Energy-Water (FEW) nexus to foster collective resilience in urban-rural systems. Prog. Disaster Sci. 2019, 1, 100005. [Google Scholar] [CrossRef]
- Fedorca, A.; Popa, M.; Jurj, R.; Ionescu, G.; Fedorca, M. Assessing the regional landscape connectivity for multispecies to coordinate on-the-ground needs for mitigating linear infrastructure impact in Brasov–Prahova region. J. Nat. Conserv. 2020, 58, 125903. [Google Scholar] [CrossRef]
- Gao, C.; Feng, Y.; Tong, X.; Jin, Y.; Liu, S.; Wu, P.; Ye, Z.; Gu, C. Modeling urban encroachment on ecological land using cellular automata and cross-entropy optimization rules. Sci. Total Environ. 2020, 744, 140996. [Google Scholar] [CrossRef] [PubMed]
- Hertz, T.; Silva, A. Rurality and Income Inequality in the United States, 1975–2015. Rural Sociol. 2020, 85, 436–467. [Google Scholar] [CrossRef] [Green Version]
- Li, N.; Feng, T.; Wu, R. Flexible distributed heterogeneous computing in traffic noise mapping. Comput. Environ. Urban Syst. 2017, 65, 1–14. [Google Scholar] [CrossRef]
- Messager, M.L.; Davies, I.P.; Levin, P.S. Low-cost biomonitoring and high-resolution, scalable models of urban metal pollution. Sci. Total Environ. 2020, 767, 144280. [Google Scholar] [CrossRef]
- Tao, Y.; Zhang, Z.; Ou, W.; Guo, J.; Pueppke, S.G. How does urban form influence PM2.5 concentrations: Insights from 350 different-sized cities in the rapidly urbanizing Yangtze River Delta region of China, 1998–2015. Cities 2020, 98, 102581. [Google Scholar] [CrossRef]
- Hendrickson, C.; Muro, M.; Galston, W.A. Countering the Geography of Discontent: Strategies for Left-Behind Places; Brookings Institution: Washington, DC, USA, 2018. [Google Scholar]
- Douglass, M.A. Regional Network Strategy for Reciprocal Rural-Urban Linkages: An Agenda for Policy Research with Reference to Indonesia. Third World Plan. Rev. 1998, 20, 1. [Google Scholar] [CrossRef]
- Friedmann, J. The Strategy of Deliberate Urbanization. J. Am. Inst. Plan. 1968, 34, 364–373. [Google Scholar] [CrossRef]
- Walker, R.E.; Keane, C.R.; Burke, J.G. Disparities and access to healthy food in the United States: A review of food deserts literature. Health Place 2010, 16, 876–884. [Google Scholar] [CrossRef]
- Romero-Lankao, P.; McPhearson, T.; Davidson, D.J. The food-energy-water nexus and urban complexity. Nat. Clim. Change 2017, 7, 233–235. [Google Scholar] [CrossRef]
- Hoff, H. Understanding the nexus: Background paper for the Bonn2011 Nexus Conference. In Proceedings of the Bonn 2011 Conference: The Water, Energy and Food Security Nexus Solutions for the Green Economy, Bonn, Germany, 16–18 November 2011. [Google Scholar]
- US National Science Foundation. News Release 15-090: New Grants Foster Research on Food, Energy and Water: A Linked System. 2015. Available online: https://www.nsf.gov/news/news_summ.jsp?cntn_id=135642 (accessed on 20 January 2022).
- Weitz, N.; Nilsson, M.; Davis, M. A Nexus Approach to the Post-2015 Agenda. SAIS Rev. Int. Aff. 2014, 34, 37–50. [Google Scholar] [CrossRef]
- Bazilian, M.; Rogner, H.; Howells, M.; Hermann, S.; Arent, D.; Gielen, D.; Steduto, P.; Mueller, A.; Komor, P.; Tol, R.S.; et al. Considering the energy, water and food nexus: Towards an integrated modelling approach. Energy Policy 2011, 39, 7896–7906. [Google Scholar] [CrossRef]
- Liu, J.; Chai, Y.; Xiang, Y.; Zhang, X.; Gou, S.; Liu, Y. Clean energy consumption of power systems towards smart agriculture: Roadmap, bottlenecks and technologies. CSEE J. Power Energy Syst. 2018, 4, 273–282. [Google Scholar] [CrossRef]
- Simpson, G.B.; Jewitt, G.P.W. The Development of the Water-Energy-Food Nexus as a Framework for Achieving Resource Security: A Review. Front. Environ. Sci. 2019, 7, 8. [Google Scholar] [CrossRef] [Green Version]
- Allouche, J.; Middleton, C.; Gyawali, D. Technical veil, hidden politics: Interrogating the power linkages behind the nexus. Water Altern. 2015, 8, 610–626. [Google Scholar]
- Mabhaudhi, T.; Nhamo, L.; Mpandeli, S.; Nhemachena, C.; Senzanje, A.; Sobratee, N.; Chivenge, P.P.; Slotow, R.; Naidoo, D.; Liphadzi, S.; et al. The Water–Energy–Food Nexus as a Tool to Transform Rural Livelihoods and Well-Being in Southern Africa. Int. J. Environ. Res. Public Health 2019, 20, 2970. [Google Scholar] [CrossRef] [Green Version]
- Proctor, K.; Tabatabaie, S.M.H.; Murthy, G.S. Gateway to the perspectives of the Food-Energy-Water nexus. Sci. Total Environ. 2021, 764, 142852. [Google Scholar] [CrossRef]
- Mohtar, R.H.; Daher, B. Water, energy, and food: The ultimate nexus. In Encyclopedia of Agricultural, Food, and Biological Engineering; CRC Press, Taylor and Francis Group: Abingdon, UK, 2012. [Google Scholar]
- Vogt, C.; Zimmermann, M.; Brekke, K. Operationalizing the Urban NEXUS: Towards Resource-Efficient and Integrated Cities and Metropolitan Regions. In Deutsche Gesellschaft für Internationale Zusammenarbeit (GIZ) GmbH.; ICLEI Local Governments for Sustainabilty; 2014; Available online: https://www.local2030.org/library/280/Operationalizing-the-Urban-NEXUS.pdf (accessed on 23 April 2021).
- Dodds, F. Implementing a Nexus Approach to Sustainable Development in Urban Areas. Available online: https://www.urbanet.info/urban-nexus-conference/ (accessed on 23 April 2021).
- Gray, S.; Voinov, A.; Paolisso, M.; Jordan, R.; BenDor, T.; Bommel, P.; Glynn, P.; Hedelin, B.; Hubacek, K.; Introne, J.; et al. Purpose, processes, partnerships, and products: Four Ps to advance participatory socio-environmental modeling. Ecol. Appl. 2018, 28, 46–61. [Google Scholar] [CrossRef] [Green Version]
- Sterling, E.J.; Zellner, M.; Jenni, K.E.; Leong, K.; Glynn, P.D.; BenDor, T.K.; Bommel, P.; Hubacek, K.; Jetter, A.J.; Jordan, R.; et al. Try, try again: Lessons learned from success and failure in participatory modeling. Elem. Sci. Anthr. 2019, 7, 9. [Google Scholar] [CrossRef] [Green Version]
- Voinov, A.; Bousquet, F. Modelling with stakeholders. Environ. Model. Softw. Environ. Data News 2010, 25, 1268–1281. [Google Scholar] [CrossRef]
- Hedelin, B.; Evers, M.; Alkan-Olsson, J.; Jonsson, A. Participatory modelling for sustainable development: Key issues derived from five cases of natural resource and disaster risk management. Environ. Sci. Policy 2017, 76, 185–196. [Google Scholar] [CrossRef]
- Hedelin, B.; Gray, S.; Woehlke, S.; BenDor, T.K.; Singer, A.; Jordan, R.; Zellner, M.; Giabbanelli, P.; Glynn, P.; Jenni, K.; et al. What’s left before participatory modeling can fully support real-world environmental planning processes: A case study review. Environ. Model. Softw. 2021, 143, 105073. [Google Scholar] [CrossRef]
- Schmitt Olabisi, L.K.; Kapuscinski, A.R.; Johnson, K.A.; Reich, P.B.; Stenquist, B.; Draeger, K.J. Using Scenario Visioning and Participatory System Dynamics Modeling to Investigate the Future: Lessons from Minnesota 2050. Sustainability 2010, 2, 2686–2706. [Google Scholar] [CrossRef] [Green Version]
- Zellner, M.; Lyons, L.; Milz, D.; Shelley, J.T.R.; Hoch, C.; Massey, D.; Radinsky, J. Participatory Complex Systems Modeling for Environmental Planning. In Innovations in Collaborative Modeling; Olabisi, L.S., McNall, M., Porter, W., Eds.; Michigan State University Press: East Lansing, MI, USA, 2020; pp. 189–214. ISBN 978-1-61186-354-3. [Google Scholar] [CrossRef]
- Haraldsson, H.V. Introduction to System Thinking and Causal Loop Diagrams; Department of Chemical Engineering, Lund University: Lund, Sweden, 2004. [Google Scholar]
- Ford, A. Modeling the Environment: An Introduction to System Dynamics Models of Environmental Systems; Island Press: Washington, DC, USA, 1999. [Google Scholar]
- Mendoza, A.J.; Clemen, R.T. Outsourcing sustainability: A game-theoretic modeling approach. Environ. Syst. Decis. 2013, 33, 224–236. [Google Scholar] [CrossRef]
- Wiek, A.; Withycombe, L.; Redman, C.; Mills, S.B. Moving forward on competence in sustainability research and problem solving. Environment 2011, 53, 3–13. [Google Scholar] [CrossRef]
- Seager, T.P.; Collier, Z.A.; Linkov, I.; Lambert, J.H. Environmental sustainability, complex systems, and the disruptive imagination. Environ. Syst. Decis. 2013, 33, 181–183. [Google Scholar] [CrossRef] [Green Version]
- de Rosnay, J. The Macroscope: A New World Scientific System; HarperCollins Publishers: New York, NY, USA, 1979. [Google Scholar]
- Forrester, J.W. Industrial Dynamics; MIT Press: Boston, MA, USA, 1961; p. 464. [Google Scholar]
- Lane, D.C. The emergence and use of diagramming in system dynamics: A critical account. Syst. Res. Behav. Sci. 2008, 13, 3–23. [Google Scholar] [CrossRef]
- Sterman, J. Business Dynamics; McGraw-Hill, Inc.: New York, NY, USA, 2000. [Google Scholar]
- Hannon, B.; Ruth, M. Modeling Dynamic Systems. In Dynamic Modeling; Hannon, B., Ruth, M., Eds.; Springer US: New York, NY, USA, 1994; pp. 3–15. ISBN 978-1-4684-0224-7. [Google Scholar]
- Senge, P.M. The Fifth Discipline: The Art and Practice of the Learning Organization; Currency Doubleday: New York, NY, USA, 1994; ISBN 978-0-385-26095-4. [Google Scholar]
- Hjorth, P.; Bagheri, A. Navigating towards sustainable development: A system dynamics approach. Futur. J. Policy Plan. Futur. Stud. 2006, 38, 74–92. [Google Scholar] [CrossRef]
- US Census Bureau. Cumulative Estimates of Resident Population Change and Rankings for Counties in Illinois: 1 April 2010 to 1 July 2019. 2020. Available online: https://www2.census.gov/programs-surveys/popest/tables/2010-2019/counties/totals/co-est2019-cumchg-17.xlsx (accessed on 20 January 2022).
- US Census Bureau. State of Illinois Counties. 2020. Available online: https://tigerweb.geo.census.gov/tigerwebmain/Files/tab20/tigerweb_tab20_county_il.html (accessed on 21 January 2022).
- Bibby, P.; Shepherd, J. Developing a New Classification of Urban and Rural Areas for Policy Purposes—The Methodology; DEFRA: London, UK, 2004. [Google Scholar]
- Gallego, F.J. Mapping Rural/Urban Areas from Population Density Grids; Institute for Environment and Sustainability, JRC-EC: Ispra, Italy, 2004; Volume 6. [Google Scholar]
- Ottensmann, J.R. Density of large urban areas in the US, 1950–2010. 2015. Available online: https://ssrn.com/abstract=2881702 (accessed on 30 August 2021).
- Yang, T.; Hillier, B. The fuzzy boundary: The spatial definition of urban areas. In Proceedings of the 6th International Space Syntax Symposium, İstanbul, Turkey, 12–15 June 2007; Istanbul Technical University: Istanbul, Turkey, 2007; pp. 091.01–091.16. [Google Scholar]
- Ahlfeldt, G.M.; Pietrostefani, E. The economic effects of density: A synthesis. J. Urban Econ. 2019, 111, 93–107. [Google Scholar] [CrossRef] [Green Version]
- Estevez, E.; Lopes, N.; Janowski, T. Smart Sustainable Cities: Reconnaissance Study; United Nations University Operating Unit on Policy-Driven Electronic Governance: Guimarães, Portugal, 2016. [Google Scholar]
- Glaeser, E.L.; Kahn, M.E. The greenness of cities: Carbon dioxide emissions and urban development. J. Urban Econ. 2010, 67, 404–418. [Google Scholar] [CrossRef] [Green Version]
- Wimberley, R.C.; Morris, L.V. The Poor Rural Areas that Must Support the Cities of the Future. Sociation Today 2006, 4, 2. [Google Scholar]
- Allender, S.; Owen, B.; Kuhlberg, J.; Lowe, J.; Nagorcka-Smith, P.; Whelan, J.; Bell, C. A community based systems diagram of obesity causes. PLoS ONE 2015, 10, e0129683. [Google Scholar] [CrossRef] [Green Version]
- McGlashan, J.; Johnstone, M.; Creighton, D.; de la Haye, K.; Allender, S. Quantifying a systems map: Network analysis of a childhood obesity causal loop diagram. PLoS ONE 2016, 11, e0165459. [Google Scholar] [CrossRef] [Green Version]
- Friel, S.; Pescud, M.; Malbon, E.; Lee, A.; Carter, R.; Greenfield, J.; Cobcroft, M.; Potter, J.; Rychetnik, L.; Meertens, B. Using systems science to understand the determinants of inequities in healthy eating. PLoS ONE 2017, 12, e0188872. [Google Scholar] [CrossRef] [Green Version]
- Frannek, L.; Nagaoka, H.; Nakagawa, T. Network simplification and visualization through System Dynamics-based network centrality. In Proceedings of the 34th International Conference of the System Dynamics Society, Delft, The Netherlands, 17–21 July 2016; pp. 17–21. [Google Scholar]
- Bielicki, J.M.; Beetstra, M.A.; Kast, J.B.; Wang, Y.; Tang, S. Stakeholder perspectives on sustainability in the food-energy-water nexus. Front. Environ. Sci. 2019, 7, 7. [Google Scholar] [CrossRef] [Green Version]
- Kerr, J.M.; DePinto, J.V.; McGrath, D.; Sowa, S.P.; Swinton, S.M. Sustainable management of Great Lakes watersheds dominated by agricultural land use. J. Great Lakes Res. 2016, 42, 1252–1259. [Google Scholar] [CrossRef] [Green Version]
- Mo, W.; Nasiri, F.; Eckelman, M.J.; Zhang, Q.; Zimmerman, J.B. Measuring the embodied energy in drinking water supply systems: A case study in the Great Lakes Region. Environ. Sci. Technol. 2010, 44, 9516–9521. [Google Scholar] [CrossRef]
- Allan, J.A. Water in the environment/socio-economic development discourse: Sustainability, changing management paradigms and policy responses in a global system. Gov. Oppos. 2005, 40, 181–199. [Google Scholar] [CrossRef]
- Greenwood, D.T.; Holt, R.P. Local Economic Development in the 21st Century: Quality of Life and Sustainability; Routledge: London, UK, 2014. [Google Scholar]
- Zellner, M.; Massey, D.; Minor, E.; Gonzalez-Meler, M. Exploring the effects of green infrastructure placement on neighborhood-level flooding via spatially explicit simulations. Comput. Environ. Urban Syst. 2016, 59, 116–128. [Google Scholar] [CrossRef] [Green Version]
- Rasul, G.; Sharma, B. The nexus approach to water–energy–food security: An option for adaptation to climate change. Clim. Policy 2016, 16, 682–702. [Google Scholar] [CrossRef] [Green Version]
- Saundry, P.; Ruddell, B.L. The Food-Energy-Water Nexus; Springer Nature: Berlin/Heidelberg, Germany, 2020. [Google Scholar]
- Haines, A.; Smith, K.R.; Anderson, D.; Epstein, P.R.; McMichael, A.J.; Roberts, I.; Wilkinson, P.; Woodcock, J.; Woods, J. Policies for accelerating access to clean energy, improving health, advancing development, and mitigating climate change. Lancet 2007, 370, 1264–1281. [Google Scholar] [CrossRef] [PubMed]
- Heller, M.C.; Keoleian, G.A. Assessing the sustainability of the US food system: A life cycle perspective. Agric. Syst. 2003, 76, 1007–1041. [Google Scholar] [CrossRef]
- Piccinini, A.; Loseby, M. Agricultural Policies in Europe and the USA: Farmers between Subsidies and the Market; Springer: Berlin/Heidelberg, Germany, 2001. [Google Scholar]
- Stuart, E. Truth or Consequences: Why the EU and the USA Must Reform Their Subsidies, or Pay the Price; Oxfam International: Oxford, UK, 2005. [Google Scholar]
- Arbuckle, J.G. Ecological Embeddedness, Agricultural “Modernization”, and Land Use Change in the US Midwest: Past, Present, and Future. In Soil and Water Conservation: A Celebration of 75 Years; Soil and Water Conservation Society: Ankeny, IA, USA, 2020. [Google Scholar]
- Prokopy, L.S.; Gramig, B.M.; Bower, A.; Church, S.P.; Ellison, B.; Gassman, P.W.; Genskow, K.; Gucker, D.; Hallett, S.G.; Hill, J. The urgency of transforming the Midwestern US landscape into more than corn and soybean. Agric. Hum. Values 2020, 37, 537–539. [Google Scholar] [CrossRef]
- Hovmand, P.S.; Rouwette, E.; Andersen, D.F.; Richardson, G.P.; Kraus, A. Scriptapedia 4.0.6. In Proceedings of the 31st International Conference of the System Dynamics Society, Cambridge, MA, USA, 21–25 July 2013. [Google Scholar]
- Angel, J.; Swanston, C.; Boustead, B.M.; Conlon, K.C.; Hall, K.R.; Jorns, J.L.; Kunkel, K.E.; Lemos, M.C.; Lofgren, B.; Ontl, T.A. Midwest. In Impacts, Risks, and Adaptation in the United States: Fourth National Climate Assessment, Volume II.; Reidmiller, D.R., Avery, C.W., Easterling, D.R., Kunkel, K.E., Lewis, K.L.M., Maycock, T.K., Stewart, B.C., Eds.; U.S. Global Change Research Program: Washington, DC, USA, 2018; pp. 872–940. [Google Scholar]
- D’souza, G.; Ikerd, J. Small farms and sustainable development: Is small more sustainable? J. Agric. Appl. Econ. 1996, 28, 73–83. [Google Scholar] [CrossRef] [Green Version]
- Nicholls, E.; Ely, A.; Birkin, L.; Basu, P.; Goulson, D. The contribution of small-scale food production in urban areas to the sustainable development goals: A review and case study. Sustain. Sci. 2020, 15, 1585–1599. [Google Scholar] [CrossRef] [Green Version]
- Mougeot, L.J. Growing Better Cities: Urban Agriculture for Sustainable Development; IDRC: Ottawa, ON, Canada, 2006. [Google Scholar]
- Hardin, G. The tragedy of the commons: The population problem has no technical solution; it requires a fundamental extension in morality. Science 1968, 162, 1243–1248. [Google Scholar] [CrossRef] [Green Version]
- Zellner, M.; Boria, E.; Massey, D.; Keller, J. Building Social and Environmental Capital through Participatory Modeling: The case of the Robbins Renewal and Resilience Project. In UIC Justice and Community Disparities Anthology Project; University of Illinois Press: Champaign, IL, USA, forthcoming.
- Fisher, D.R.; Nasrin, S. Climate activism and its effects. Wiley Interdiscip. Rev. Clim. Change 2021, 12, 683. [Google Scholar] [CrossRef]
- Gessen, M. The Fifteen-Year-Old Climate Activist Who Is Demanding a New Kind of Politics. Available online: https://www.newyorker.com/news/our-colxumnists/the-fifteen-year-old-climate-activist-who-is-demanding-a-new-kind-of-politics (accessed on 22 November 2021).
- North, P. The politics of climate activism in the UK: A social movement analysis. Environ. Plan. A 2011, 43, 1581–1598. [Google Scholar] [CrossRef]


| Geographic Focus | Area of Expertise | Sector | Years of Experience |
|---|---|---|---|
| Rural | Energy | Academia | 20–30 |
| Rural | Energy | Local government | 30–40 |
| Rural | Food | Academia | 10–20 |
| Rural | Agriculture/Food | Academia | 20–30 |
| Rural | Water | Public agency | 20–30 |
| Urban | Economics/FEW Nexus | Academia | 10–20 |
| Urban | Food | Academia | 10–20 |
| Urban | Food | Non-profit/private | 20–30 |
| Urban | Government | Academia | 0–10 |
| Urban | Water/Energy | Academia | 20–30 |
| Number of External Participants | Type of Workshop | Topics: FEW Domain | |
|---|---|---|---|
| Workshop 1 | 2 | Domain-focused | Water |
| Workshop 2 | 2 | Domain-focused | Food |
| Workshop 3 | 1 | Follow-up | Water |
| Workshop 4 | 2 | Domain-focused | Food |
| Workshop 5 | 2 | Domain-focused | Energy |
| Workshop 6 | 2 | Follow-up | Food |
| Workshop 7 | 7 | Synthesis workshop | Food, energy, and water |
| Group A | Group B | In Common | ||
|---|---|---|---|---|
| Energy | Connections |
|
|
|
| Levers |
|
| ||
| New variables |
| |||
| Water | Connections |
|
|
|
| Levers |
|
| ||
| New variables |
|
| ||
| Other issues |
| |||
| Food | Connections |
|
|
|
| Levers |
|
| ||
| New variables |
|
Disclaimer/Publisher’s Note: The statements, opinions and data contained in all publications are solely those of the individual author(s) and contributor(s) and not of MDPI and/or the editor(s). MDPI and/or the editor(s) disclaim responsibility for any injury to people or property resulting from any ideas, methods, instructions or products referred to in the content. |
© 2023 by the authors. Licensee MDPI, Basel, Switzerland. This article is an open access article distributed under the terms and conditions of the Creative Commons Attribution (CC BY) license (https://creativecommons.org/licenses/by/4.0/).
Share and Cite
Zellner, M.; Massey, D.; Rozhkov, A.; Murphy, J.T. Exploring the Barriers to and Potential for Sustainable Transitions in Urban–Rural Systems through Participatory Causal Loop Diagramming of the Food–Energy–Water Nexus. Land 2023, 12, 551. https://doi.org/10.3390/land12030551
Zellner M, Massey D, Rozhkov A, Murphy JT. Exploring the Barriers to and Potential for Sustainable Transitions in Urban–Rural Systems through Participatory Causal Loop Diagramming of the Food–Energy–Water Nexus. Land. 2023; 12(3):551. https://doi.org/10.3390/land12030551
Chicago/Turabian StyleZellner, Moira, Dean Massey, Anton Rozhkov, and John T. Murphy. 2023. "Exploring the Barriers to and Potential for Sustainable Transitions in Urban–Rural Systems through Participatory Causal Loop Diagramming of the Food–Energy–Water Nexus" Land 12, no. 3: 551. https://doi.org/10.3390/land12030551