
Morphodynamics of Gully Development on the Platform–Slope System of Spoil Dumps under Platform Concentrated Flow
by
 ,
,
Yun Bai
1,2,3, 
Mingming Guo
1,4,
Hongliang Kang
5,
Wenlong Wang
1,3,5,*,
Huan Su
6,
Wenzhao Guo
1,5 and
Chunyan Ma
2 1
Institute of Soil and Water Conservation, Chinese Academy of Sciences and Ministry of Water Resources, Xianyang 712100, China
2
Shaanxi Key Laboratory of Ecological Restoration in Shanbei Mining Area, Yulin University, Yulin 719000, China
3
University of Chinese Academy of Sciences, Beijing 100049, China
4
Key Laboratory of Mollisols Agroecology, Northeast Institute of Geography and Agroecology, Chinese Academy of Sciences, Harbin 150081, China
5
State Key Laboratory of Soil Erosion and Dryland Farming on the Loess Plateau, Institute of Water and Soil Conservation, Northwest A&F University, Xianyang 712100, China
6
Yunnan Institute of Water & Hydropower Engineering Investigation, Design & Research, Kunming 650021, China
*
Author to whom correspondence should be addressed.
Land 2021, 10(11), 1270; https://doi.org/10.3390/land10111270
Submission received: 27 October 2021
/
Revised: 15 November 2021
/
Accepted: 16 November 2021
/
Published: 19 November 2021
(This article belongs to the Special Issue Managing and Restoring of Degraded Land in Post-mining Areas)
Abstract
:Severe gully erosion on spoil dumps, caused by dense concentrated flow derived from platforms, poses a significant threat to the land management of mining areas. However, little is known about the development processes and mechanisms of gullies on spoil dumps. A flow scouring experiment was conducted on an established platform–slope system under 3.6–5.04 m3 h−1. The soils of the system consisted of a surface sandy loam A layer and anunderlying clay loam B layer. The results showed that the platform exhibited a gully development process of headcut-incision–headcut-expansion–stabilization and the steep slope experienced gully development of A-layer incision–A-layer expansion–B-layer incision–stabilization. The results showed 88.97–100% of Froude Number (Fr) decrement and 47.90–88.97% of Darcy–Weisbach roughness coefficient increment finished in the two incision stages on the steep slope. Gully depth has the most sensitive response to flow hydraulics. A significant linear correlation exists between gully depth and shear stress, runoff power, Fr, and Reynolds Number (R2 > 0.337). Overall, the optimal hydraulic indicator varies within different stages for describing the gully morphology development, illustrating the different action mechanism between flow hydraulics and gully morphology. Our findings provide a theoretical support for future mechanistic studies of gully erosion and the land management on spoil dump.
1. Introduction
Soil erosion has become a global issue. The environmental problems caused by man-made accelerated soil erosion are becoming serious, and will strongly affect regional, social, and economic development. Spoil dumps are the main source of sediment during road construction and coalfield development. Characterized by a lack of soil structure and low vegetation productivity [1,2], spoil dump output has 11.19–138.67 times the sediment of the original earth [3]. Gully erosion accounts for 69.2–86.6% of the total sediment [4]. More seriously, secondary disasters, such as landslides and debris flows, evolve and increase the sediment transport load in the nearby fluvial networks and their ecosystems [2]. However, the research on the mechanism of gully erosion on spoil dumps is weak. More research is required to optimize the design and layout of soil and water conservation measures in spoil dumps.
Water erosion progresses from sheets, to rills, gullies, and in-stream erosion [5]. Gullies are easily formed under concentrated flow without effective protection. Gullies develop very rapidly, with their length, depth, width, area, and volume becoming stable within about 5% of their lifetime [6]. Previous studies have indicated that gullies experience the development processes of headcuts, bed deep cutting, and sidewall expansion [7,8]. Concentrated flow is the main driver of gully formation and development. Froude number (Fr) and flow velocity increase with rainfall intensity, catchment area, and inflow rate [9,10]. The flow regime is turbulent and supercritical with greater flow force, power, and energy [11,12], which favors the formation of headcuts. Once headcut flows dominate, runoff velocity decreases because of the feedback between the flow and the bed [13]. Gong et al. suggested that hydrodynamic parameters change frequently in space and time owing to the energy consumption concentrated in step pools [14]. A mechanical relationship exists between flow hydrodynamics and gully morphology. Gully length development has been systematically studied in terms of its correlation with average daily rainfall, flow discharge, and catchment area [15,16,17]. Gully depth and width increase with flow discharge [18]. A dynamic model of gully erosion, established by Sidorchuk et al., is used to predict the development of gully depth and width, and involves longitudinal profile, flow velocity, water shear stress, and coefficient of flow resistance [6]. The EGEM mode is also used to predict gully width, gully area, and sediment, established by considering rainfall property, Manning coefficient, and catchment area [19]. The development of gully morphology is affected by catchment area [20], topography [21,22], soil texture [23], and land use [16], which results in complex development and difficult prediction [24].
The platform–slope system is the typical topography of spoil dumps in opencast mining. The upslope inflow is the main force driving the serious erosion of steep slopes on spoil dumps [25]. The undulating platform acts as a catchment area with low infiltration and high soil bulk density with uneven subsidence. The steep slope undergoes severe gully erosion due to poor ridge protection and concentrated inflows from the platform, which have been reported in mine dumps of coal and Uranium [26,27]. Su et al. found that the formation of gully follows the sequence of sheet, rill, and gully on the platform-slope system of spoil dump [4]. Lv et al. found that gullies are formed by a combination of water and gravity, which provides a favorable topography for further gully development on the platform–slope system [28]. More studies have focused on rill erosion and its erosion mechanism on spoil dumps [29,30,31,32]. However, the morphological development of a gully and its response to channel flow hydraulics are still poorly understood.
Given the above scientific gaps, field scouring tests were conducted with inflow rates of 3.6, 4.32, and 5.04 m3 h−1 on the runoff plots of the platform–slope system. This paper aims to (1) clarify gully morphological variation and development of the platform–slope system, (2) clarify the response of gully morphology to flow hydraulics, and (3) establish the relationship between gully morphology and hydrodynamic parameters to illustrate the morphodynamic mechanism of gully development on the platform–slope system of spoil dumps.
2. Materials and Methods
2.1. Study Area
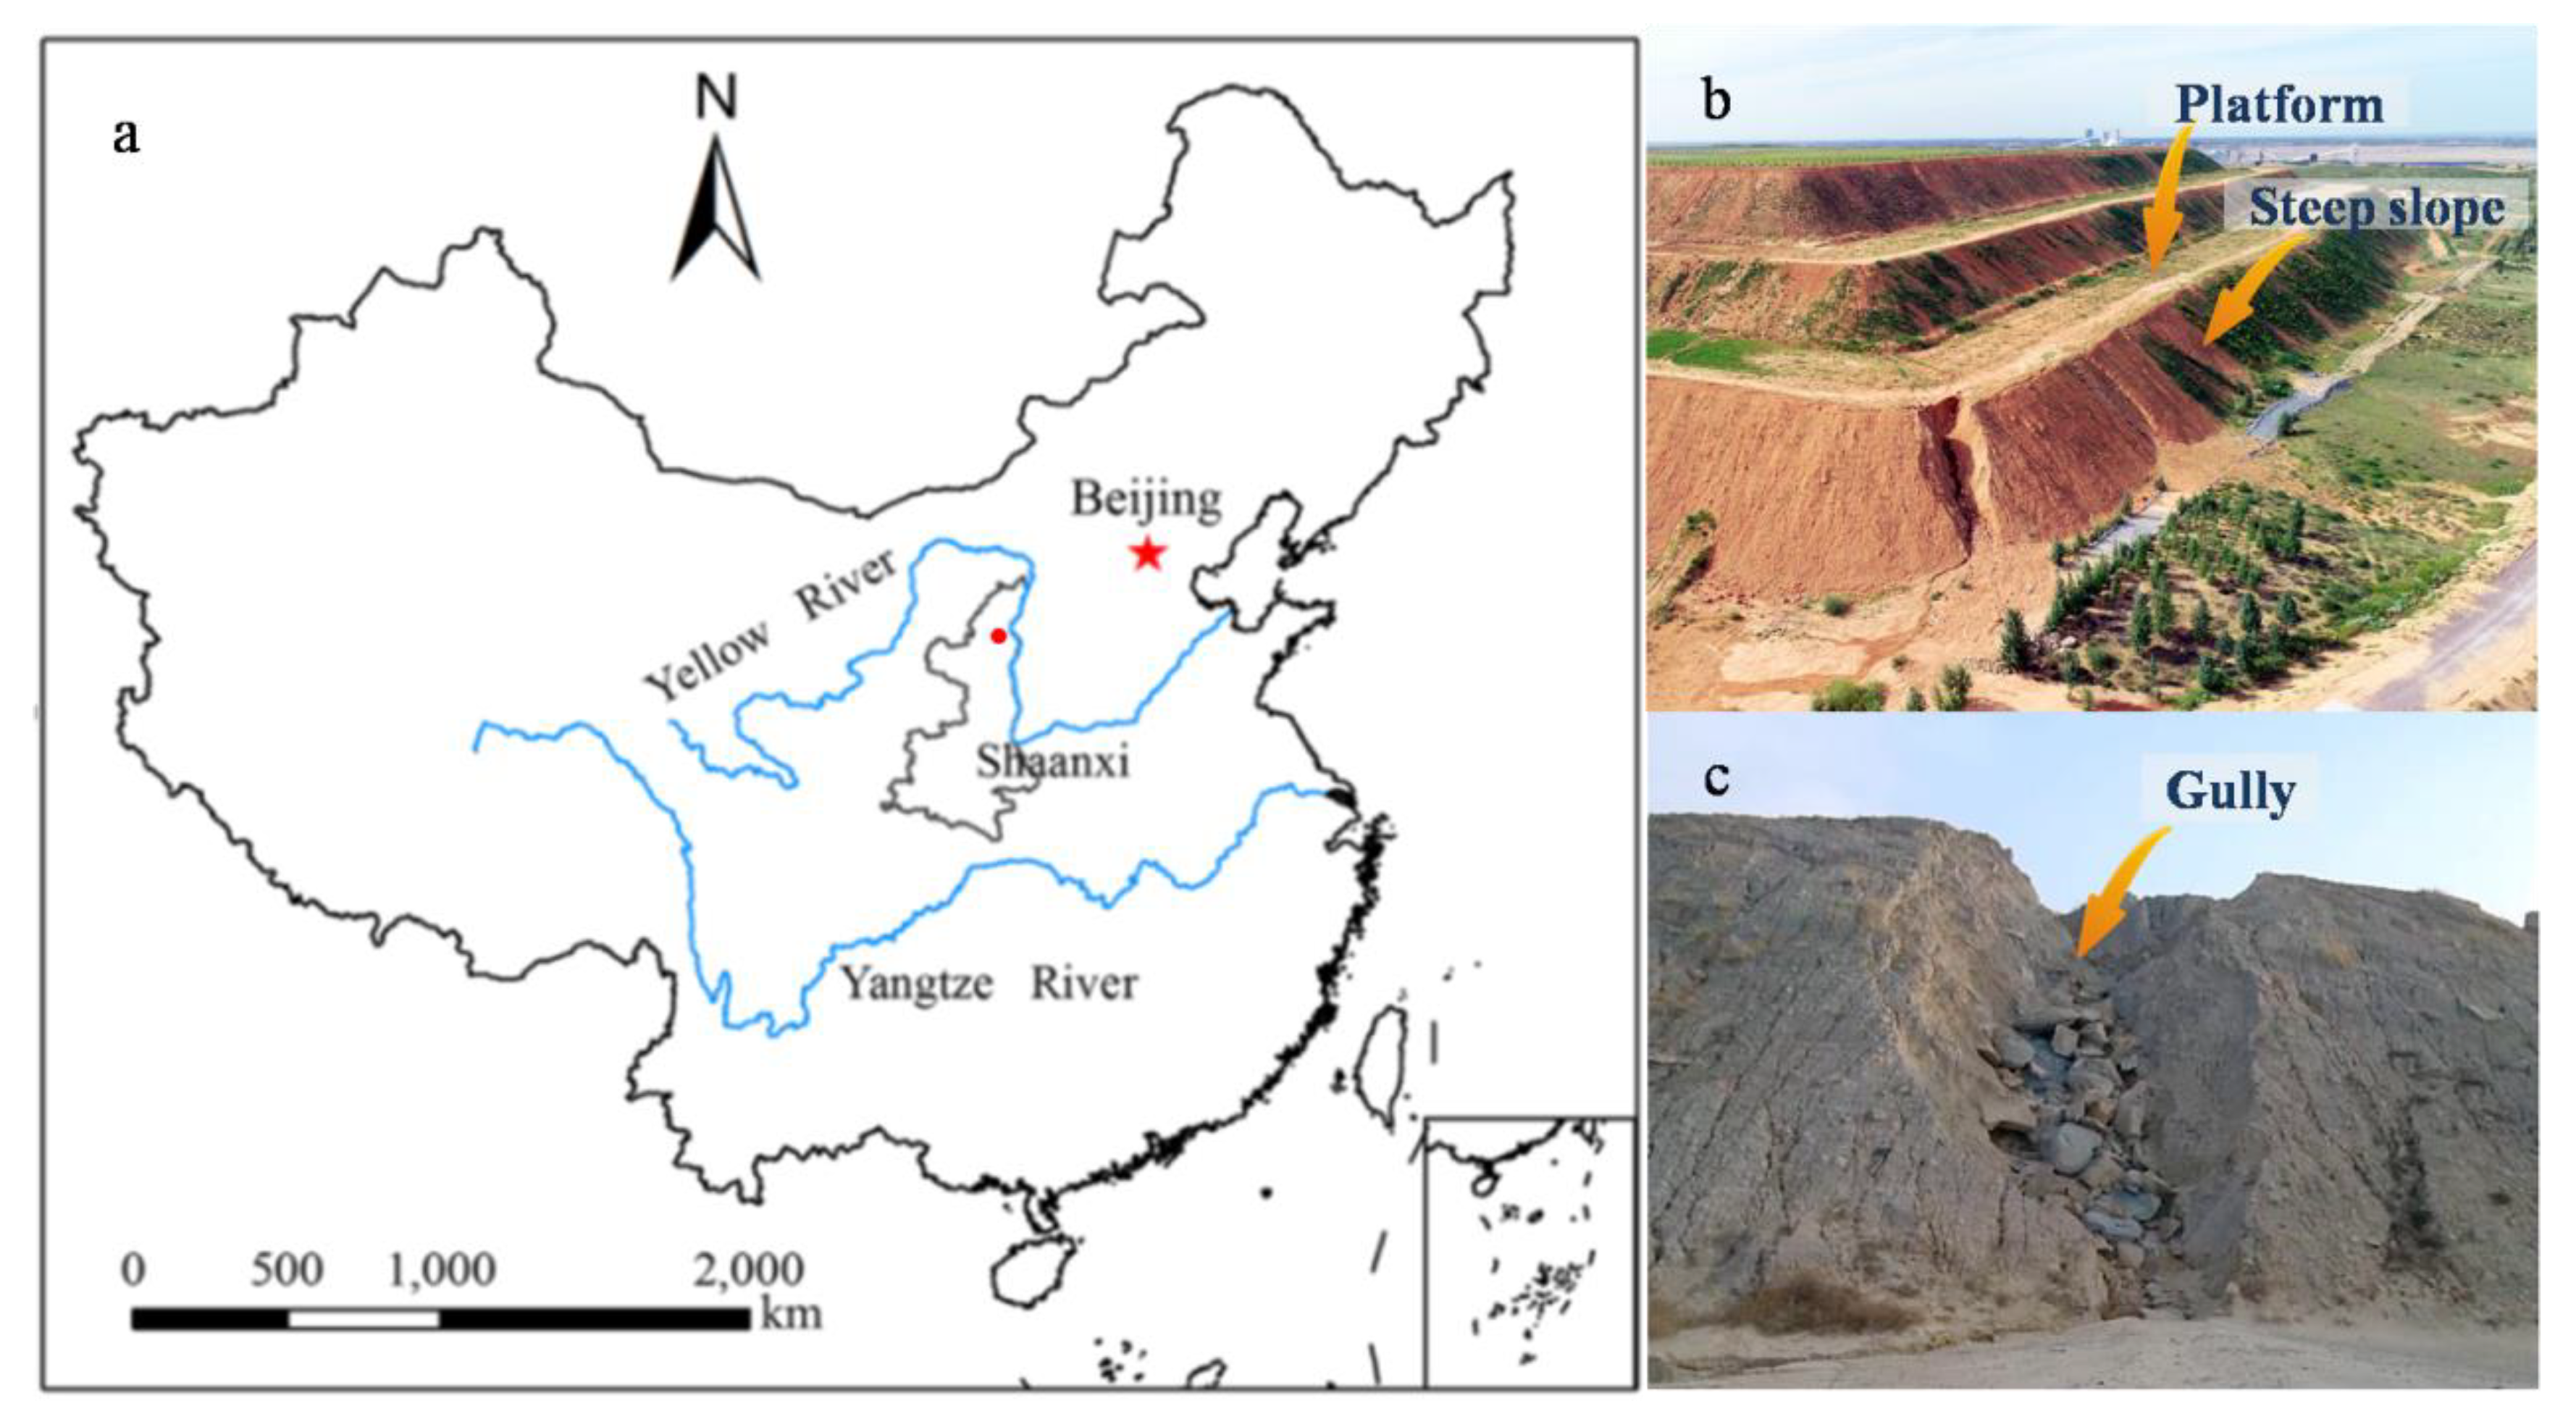
Field scouring experiments were conducted at the Huayuangou Soil and Water Conservation Experimental Station of Shaanxi Key Laboratory of Ecological Restoration in the Shanbei mining area, which is located in Yulin City, Shaanxi Province, China (Figure 1). A total of 80 spoil dumps belonging to 27 opening coal mines were investigated before the scouring experiments. The investigation region, belonging to the Shenfu–Dongsheng Coalfield, is at the junction of the provinces of Shanxi, Shaanxi, and Inner Mongolia, and the transition zone of the Loess Plateau and Mu Us Desert of China. The mining region has an arid and semiarid continental monsoon climate [33]. The annual precipitation in the study area is 400 mm, mostly occurring between July and September as short-duration high-intensity rainstorms. All the investigated open-pit coal mining dumps consist of two domains: platform and steep slope. The platform approximately covers an area of 3.2 to 125.0 hm2. The steep slope varies from 10 m to 40 m (22.5 m on average) in length, with gradients ranging from 53.2% to 100% (70.6% on average). The soil of opencast mine dumps is divided into two layers: covered topsoil and sublayer spoil. Topsoil, 20–30 cm thick for better vegetation restoration, is named A layer in this study. The topsoil is stripped from the original earth before being mined with a thickness of 20–50 cm that depends on the fertility of the soil. Sublayer spoil, named B layer in this study, is mainly the Tertiary Red Clay in northern China. The spoil dumps, underlying the Tertiary Red Clay, account for 62.5% of the total investigated sites. The Tertiary Red Clay mainly contains quartz and clay minerals with a small amount of feldspar, calcite, and heavy minerals. The dominant restored species are Chenopodium album L. and Medicago sativa L. Owing to uneven subsidence, the platform concentrates inflow from different areas of the catchment, which ranges from 65.6 m2 to 492.3 m2, leading to severe gully erosion. Gullies generally occur at the transition section between the platform and the steep slope, with an evident headcut near the transition point. Gully depth and width gradually reduce along the steep slope with maximum values of 2.8 m in depth and 5.2 m in width among all surveyed spoil dumps. Statistics show that the steep slope, 3–8 m away from the transition point, has the most severe erosion. Therefore, the steep slope length of the plot is set at 6 m in this experiment. Moreover, the mining area is located in the water–wind erosion cross-zone, which causes high soil and water losses in the region.
2.2. Experimental Design and Procedures
2.2.1. Inflow Discharge
Three inflow rates of 3.60, 4.32, 5.04 m3 h−1 were used in the experiment, which were the upstream discharges from 120, 145, 170 m2 platform catchments under once in 5 years’ rainstorm conditions, following the equation for average rainfall intensity with rainfall duration according to the statistical analysis of 1710 typical heavy rainfall events in the Loess Plateau [34]. Before a test was launched, the inflow rate was calibrated 2–3 times using a flow meter, and the desired quantity for the test was controlled by adjusting the installed valves. The relative error between the measured and the designed inflow rates was required to be less than 5%. The duration of each test was set as 45 min. The soil moisture of each plot was modified to ensure the same levels in all plots before the experiment.
2.2.2. Plot Set-Up
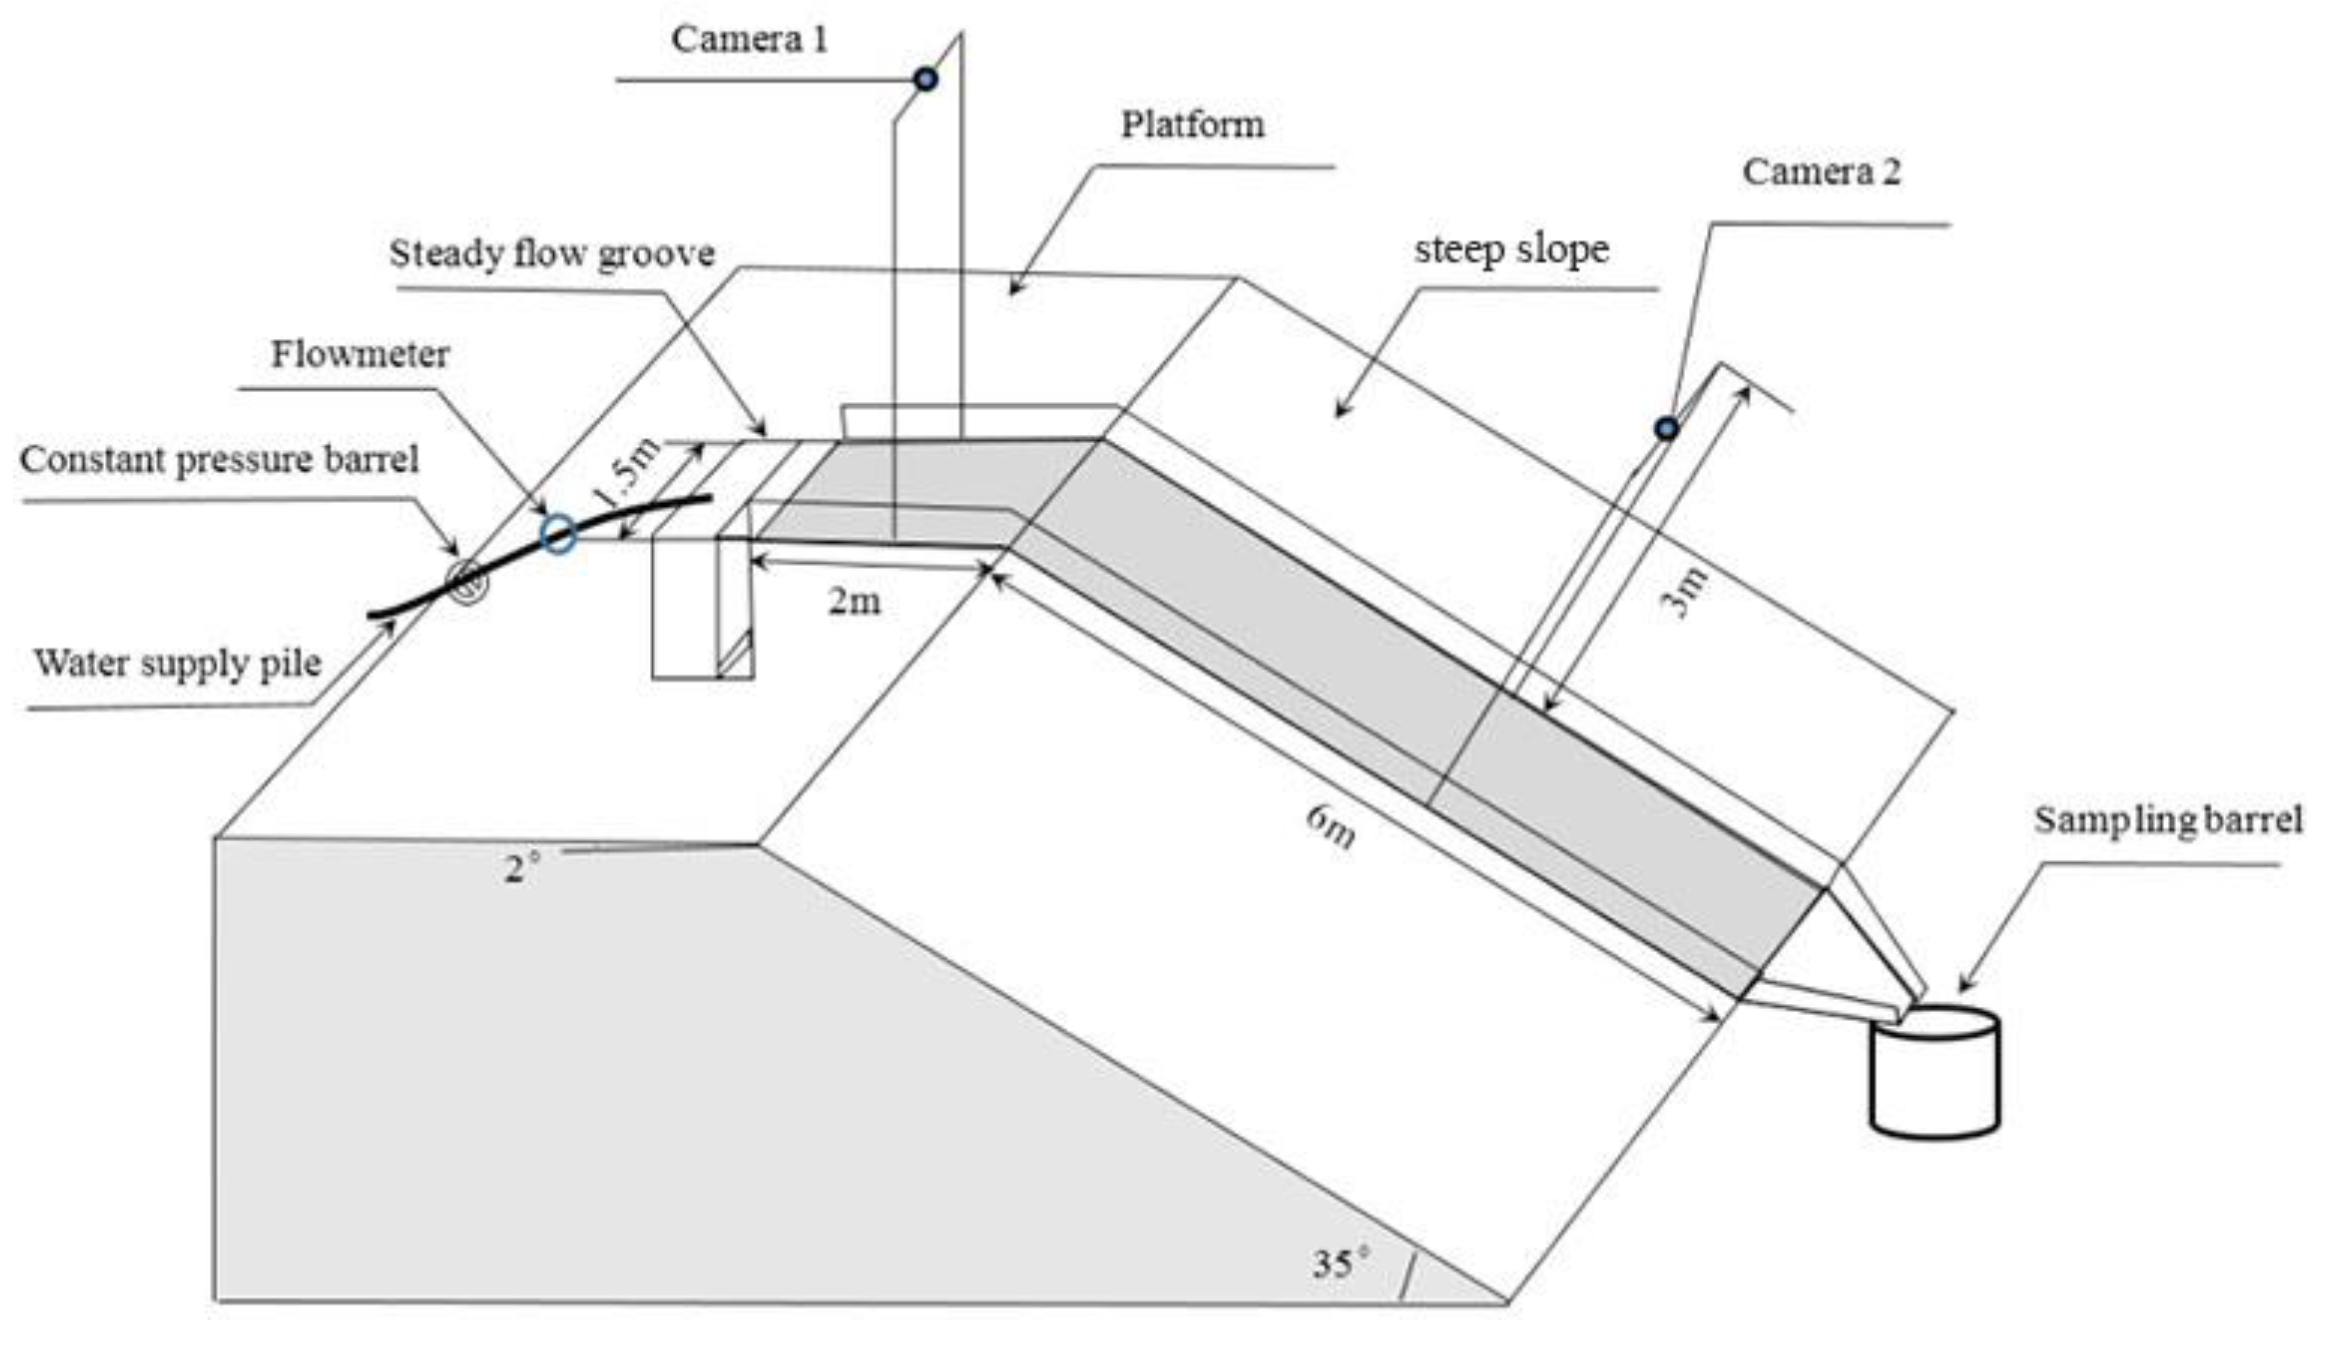
In April 2019, three experimental plots were established. Each experimental plot consisted of a platform domain and a steep slope domain. The width of the plot was 1.5 m. The length and the gradient of the steep slope were 6 m and 35°, with 2 m and 35° as the platform. The plot was bordered using 60 cm high and 2 mm thick steel, and all plot borders were inserted 50 cm into the soil to prevent water from exchanging across the plot boundaries. The soil of the A and B layers used in the experiments was obtained from the spoil dump of Xiwan open-pit mine (38°37′ N, 109°57′ E). The A-layer soil is classified as sandy loam, and the B-layer soil is clay loam based on the international soil taxonomy classification. Basic physical properties are shown in Table 1. In the course of filling plots, 80 cm was packed in eight 10 cm layers. Two of the surface layers were filled in the sandy loam and called A layers. The six bottom layers were filled with clay loam and defined as B layers. The platform bulk density of A and B layers were controlled at 1.40–1.45 and 1.50–1.60 g cm−3, respectively. The soil bulk density of the steep slope was controlled at 1.25–1.35 and 1.40–1.50 g cm−3 (Table 1). The soil surface was raked between layers to promote cohesion. The earth was allowed to settle naturally for 2 weeks after all the plots were filled. Before the experiment, the soil surface was repaired to make it concave in the middle of the plot to ensure that the gully developed in the middle of the plot. A runoff gathering pit was dug in the outlet of each plot for collecting runoff and sediment samples.
2.2.3. Experimental Devices
The experimental installation was a combined system of watering equipment, runoff plot, and collection devices (Figure 2). Specifically, the watering equipment was composed of a submersible pump, reservoir (length × width × height: 3 m × 3 m × 1 m), valves, switches, flow meter, overflow flume, and impermeable fabric. Inlet and return pipes were installed, with valves, switches, and flow meters attached to the reservoir for controlling and reading the inflow rate. At the upper end of the plot, an overflow flume with an outlet in a tilted zigzag–shape was installed to dissipate water energy for a steady-state flow condition. Attached to the outlet of the overflow flume, a piece of 15 cm long impermeable fabric, with the same width as the plot, was used to naturally simulate the random afflux upstream of the dump platform catch pit as uniformly as possible. The field plot was seamlessly connected to the impermeable fabric. As the platform steep slope system deformed over time, erosion was recorded by two Logitech Pro920 video cameras with a resolution of 2.0 megapixels, and then the images and videos were imported into a computer. A soft ruler with 1 mm accuracy was laid along one side of the plot boundary to provide the reference object.
2.2.4. Experimental Procedure
Three observation sections were set at 2 m intervals for measuring the downward flow velocity along the steep slope, and one at 1 m intervals on the platform. The flow velocities were measured under given conditions, and sheet flow, typically short in duration, was dominant on the platform and the steep slope in the early phase. Gully flow, appearing 2–3 min after the test began, extended along the flow direction on the steep slope but traced the flow source on the platform. Thus, the sheet flow ahead of the gully head was selected to be measured first. Afterward, gully flow velocity was measured once the gully was longer than 50 cm in each independent observation section. Measurements of flow velocity on the steep slope were nearly identical. Flow velocities in the flume experiment were measured using the dye tracing method (Coloration of KMnO4), with the aid of a digital stop-watch. The velocity in each section was derived by dividing the section distance by the traveling time with distance. The flow velocities were measured at 1-min intervals during the first five minutes, and at 2-min intervals thereafter. The mean value of the four sectional flow velocities, modified by a correction factor of 0.75 according to the flow regimes [35], was considered as the actual flow velocity. Gully depth was measured at 2-min intervals in all the test times except the first minute (Figure A1). All measurements were carried out two times at each observation section using a steel ruler with 1 mm accuracy. The gully depth observation sections were set at 50 cm intervals along the steep slope.
2.3. Data Calculation and Statistical Analysis
Captured and saved from videos recorded, screenshots of the moment of gully depth measurement, were imported into Digimezer 2.0. A meter reference was qualitied according to the soft ruler placed on the in-border of the plot, and the gully width was measured at each observation section set at 50 cm intervals along the steep slope, and at 25 cm intervals along the platform. Gully length was equal to the length of the smooth curve in the middle of the gully.
Hydrodynamic parameters used in the paper were Reynolds Number (Re), Fr, Darcy–Weisbach roughness coefficient (ƒ), shear stress (τ, Pa), runoff power (ω, N m−1 s−1)), runoff kinetic energy (e, J), and unit steam power (W, m s−1).
Re is calculated by Equation (1):
where V (m s−1) is the mean flow velocity; ν (m2 s−1) is the kinematic viscosity; and R (m) is the hydraulic radius, which was given for a rectangular rill by Equation (2):
where b (m) is the average flow width; and h (m) is the flow depth, which was calculated for a relatively shallow rill by Equation (3):
where q (m3) is the runoff volume measured at the plot outlet at the given sampling time, T (s) is the given sampling time, and ν is calculated directly from water temperature with Equation (4):
where t (°C) is the water temperature.
Fr is calculated by Equation (5):
where g (m s−2) is the acceleration due to gravity, namely, 9.8 m s−2.
ƒ is given by Equation (6):
where J is the hydraulic gradient, which is approximately substituted by the sine of the slope gradient.
τ is calculated by Equation (7):
where γm (Kg m−3) is the mass density of the water–sediment mixture, which is given by Equation (8):
where S (Kg m−3) is the sediment concentration, γ (Kg m−3) is the mass density of clean water, and γs (Kg m−3) is the sediment density.
ω is calculated by Equation (9):
e and unit W are calculated by Equations (10) and (11):
The correlations between gully depth, gully width, and flow hydrodynamic parameters were detected using Pearson correlation analysis. The fitted results were evaluated by coefficient of determination (R2). All statistical analysis and other graphics were carried out with SPSS 23.0, R 3.5.4 and Origin 8.5 software, respectively.
3. Results
3.1. Gully Morphological Development
3.1.1. Gully Dimension
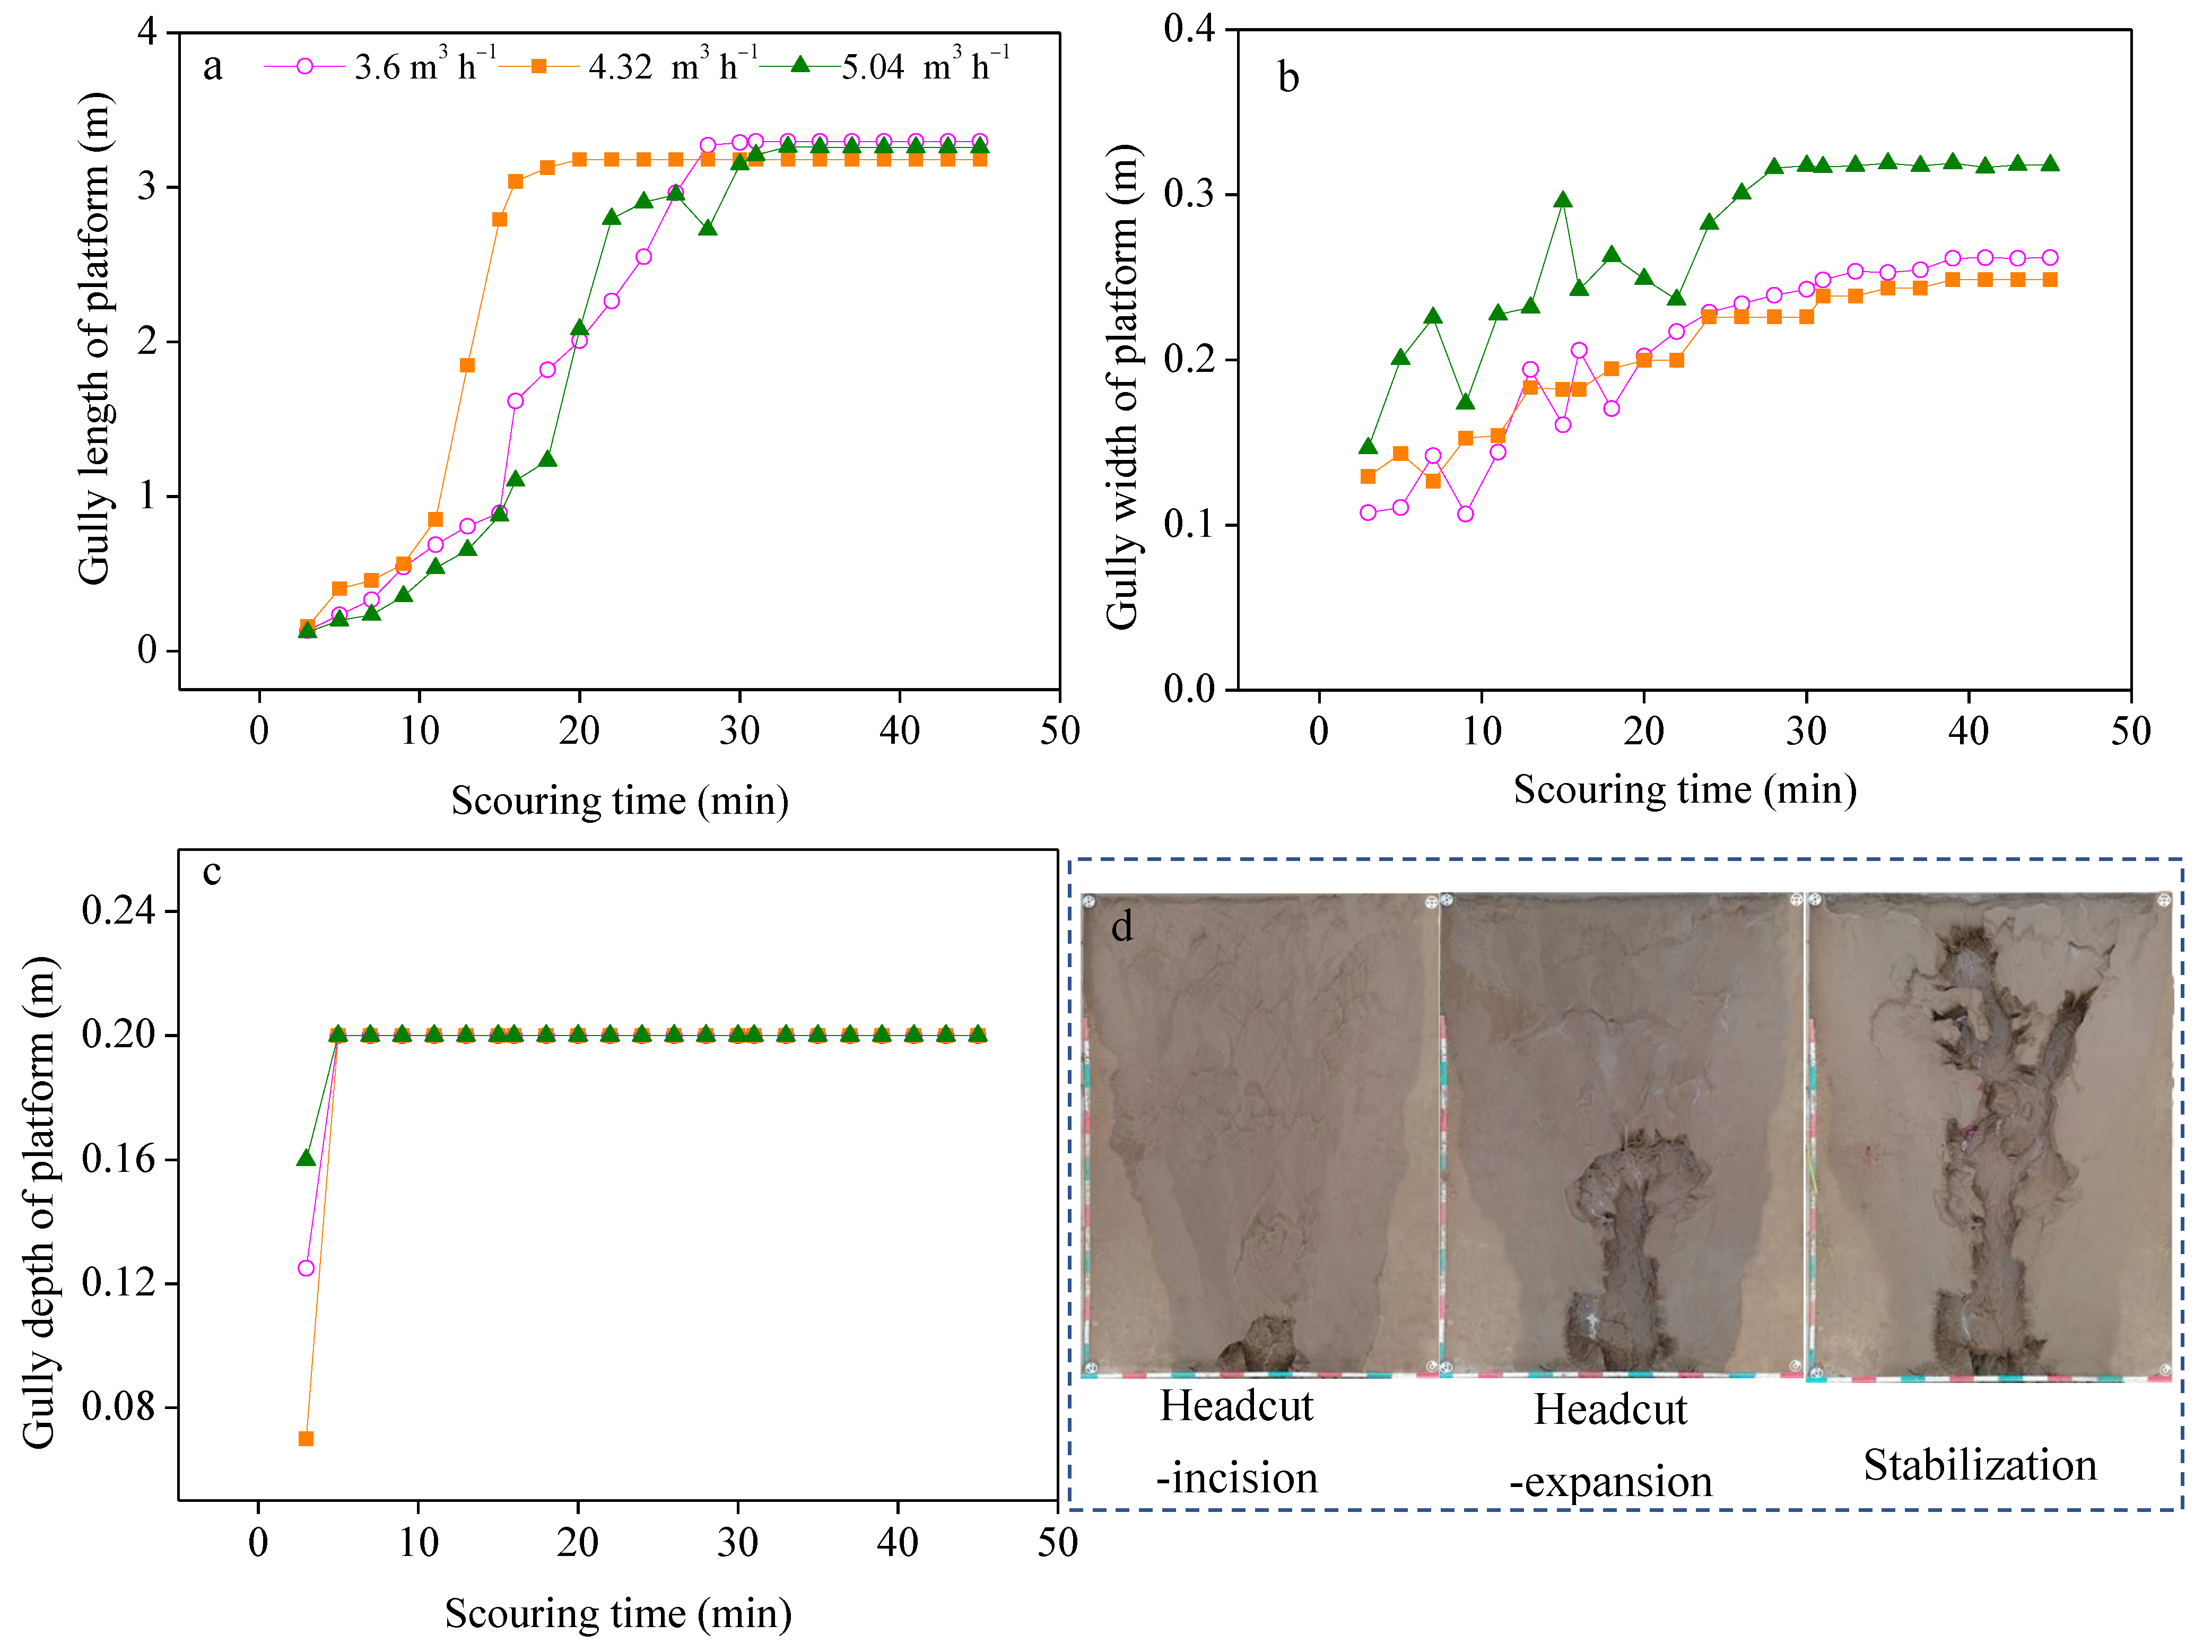
Gully development was triggered by the incision at the bend between the platform and the slope. The incision became larger in three dimensions, resulting in the morphological development of gullies. The final gully length, width, and depth were 3.18–3.30 m, 0.25–0.32 m and 0.2 m on the platform, respectively. The platform gully length (PL) experienced three development stages. PL first increased slowly below 0.8 m and then increased sharply from 0.8 m to 3.0 m, causing the runoff to bifurcate, and finally remained stable at 3.0 m (Figure 3a). The migration velocity of the headcut, on average, was 7.31–10.63, 16.59–43.74, and 0.57–1.76 cm min−1 in the three stages. The headcut migration length in the three stages accounted for 24.48–26.91%, 63.65–68.78% and 4.48–10.12%. No steady headcut migration was observed. The gully depth on the platform (PD) increased rapidly at the rate of 4 cm min−1 within 5 min and then remained stable (Figure 3b). The platform gully width (PW) experienced two stages (Figure 3c). In the first 28 min, PW showed an increase trend at the speed of 0.09–1.16 cm min−1, with fluctuation between 0.11 m and 0.30 m. In the following stable stage, PW no longer changed. PW significantly increased with the discharge (p < 0.01).
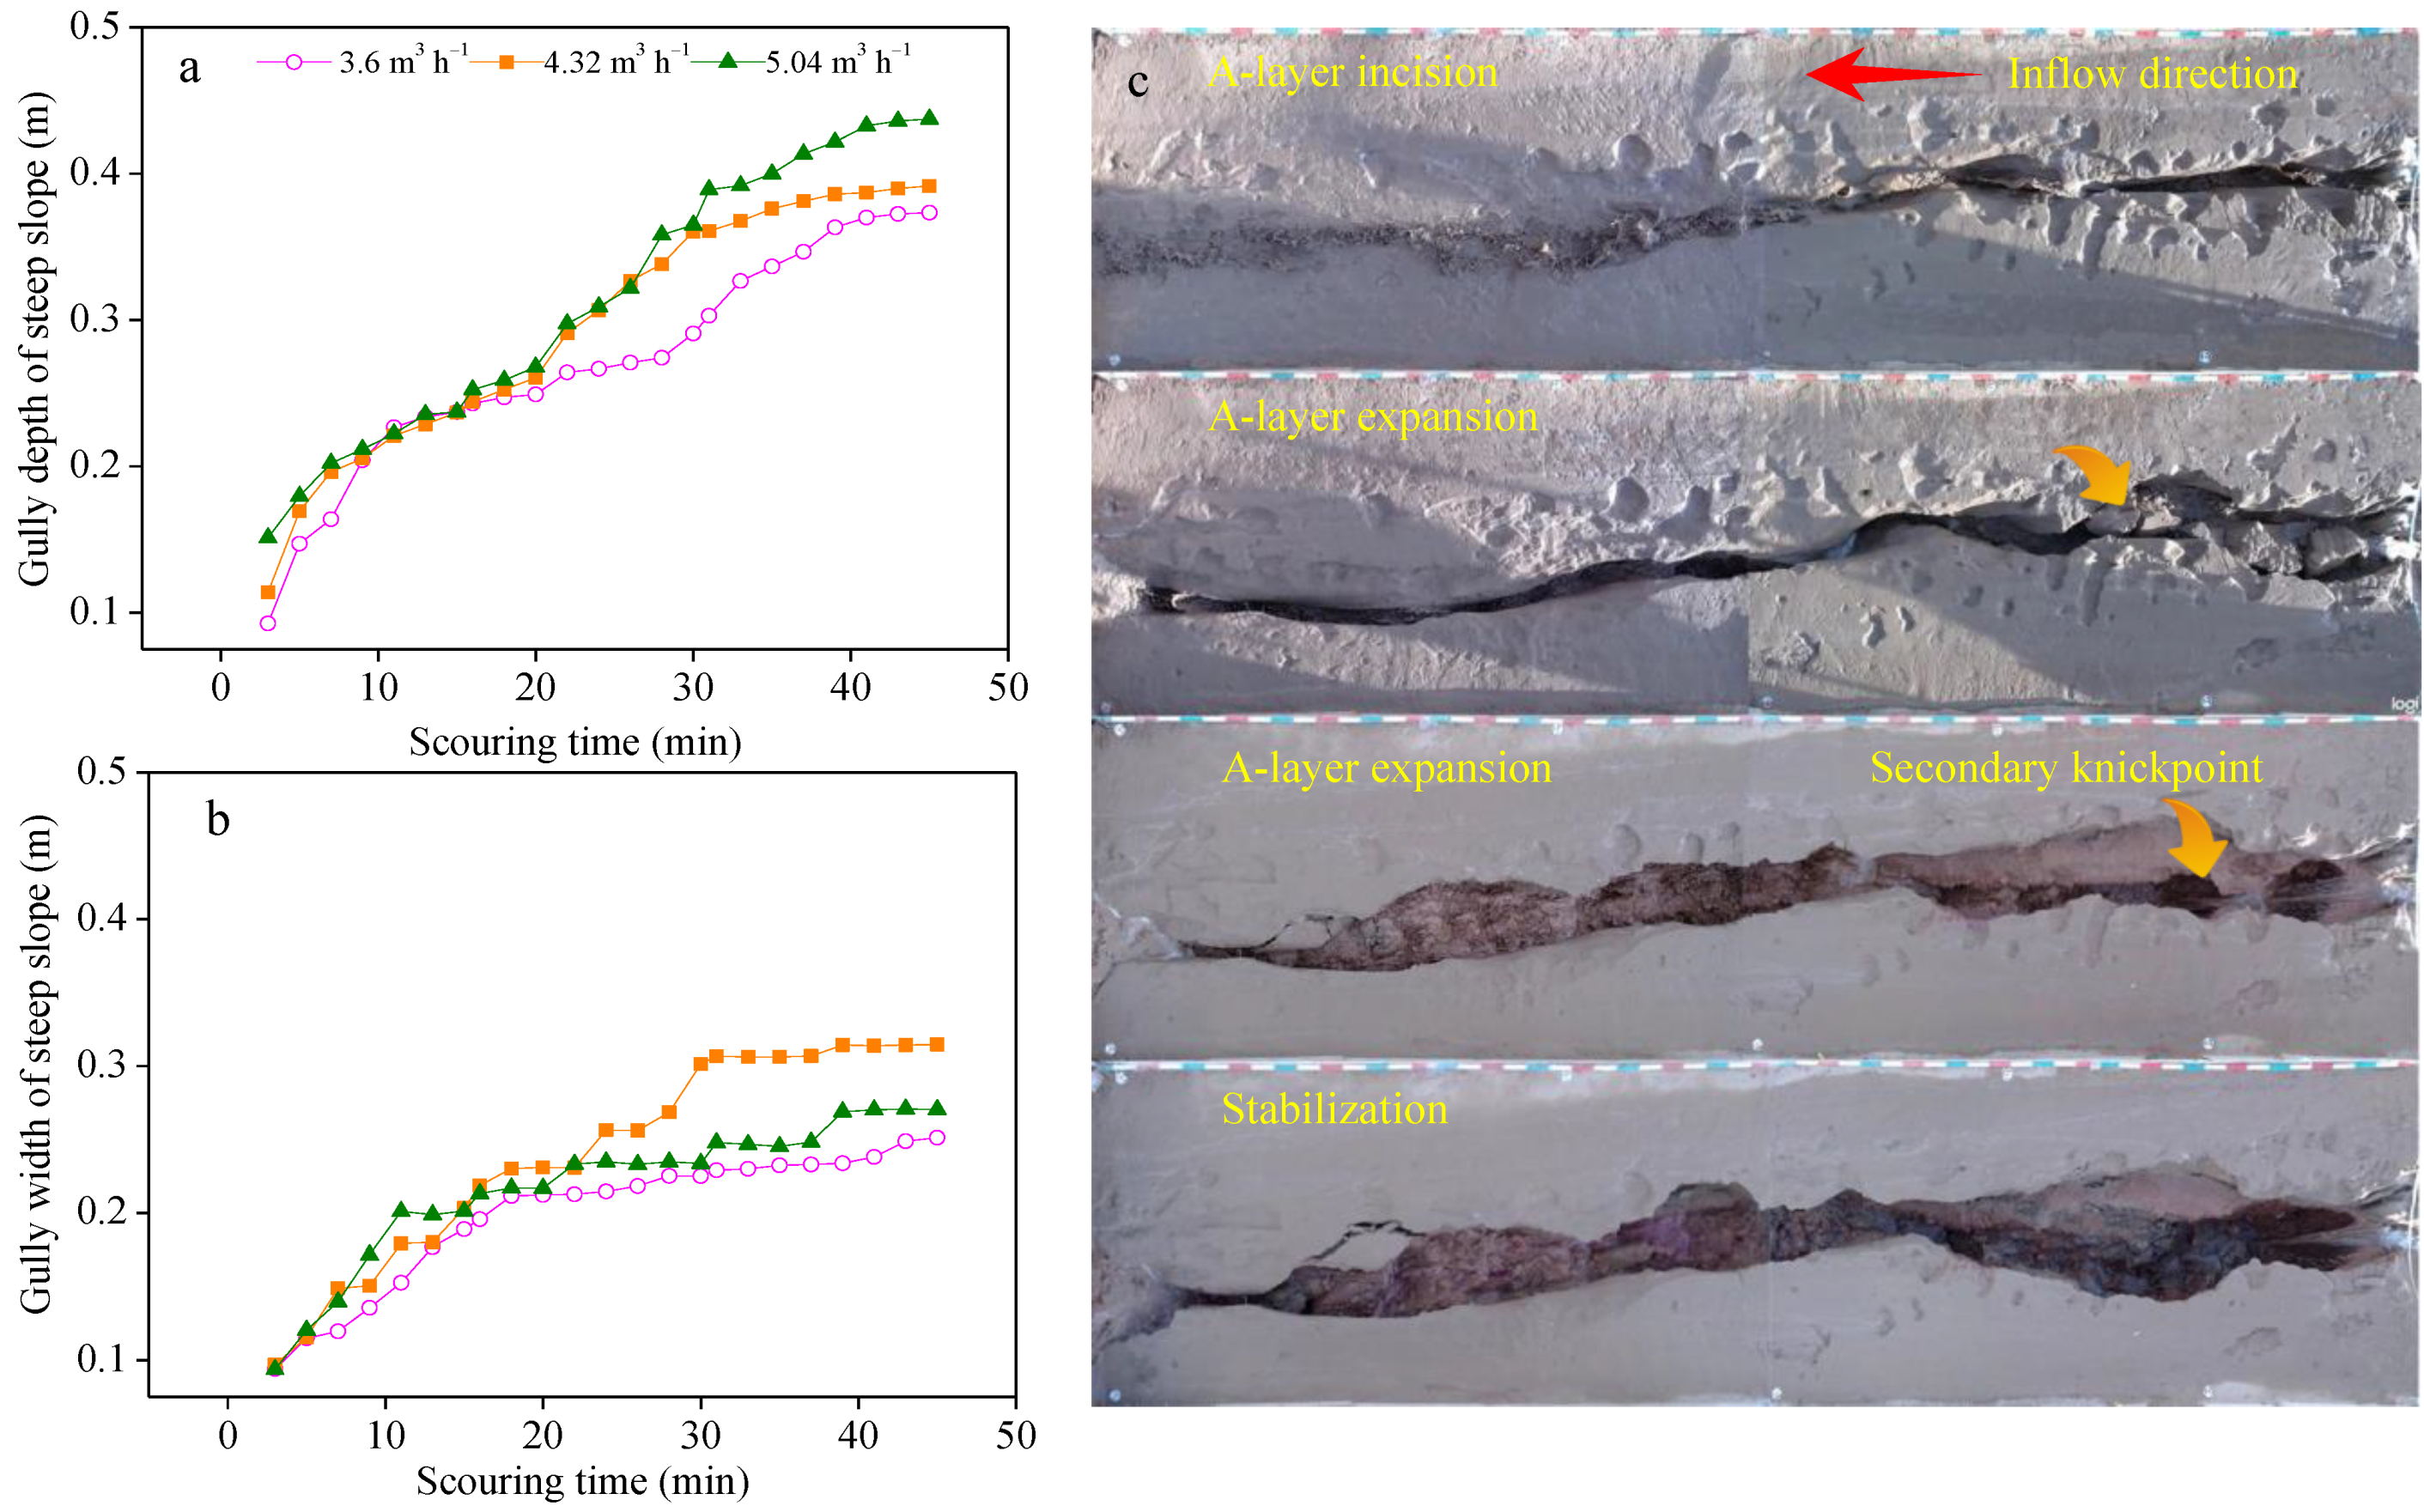
The development of gully depth on the steep slope (SD) was divided into four stages (Figure 4a). SD quickly increased within 0.2 m, which was equal to the thickness of A layers. The increasing speed was 2.27–2.89 cm min−1. Then, SD increased slowly at a speed of 0.36–0.51 cm min−1 after the gully beds reached the B-layer. After the flow began to concentrate in the B layer completely, SD increased rapidly again with a speed of 0.81–1.10 cm min−1. Finally, SD stabilized. The development of gully width of the steep slope (SW) was divided into three phases (Figure 4b). In the first phase, SW sharply increased at the speed of 1.17–1.33 cm min−1 within 0.2–0.22 m. Once the inflow incised in the B-layer successfully and concentrated on the new gully bed, the sidewall expansion slowed down. SW showed a slowly stepped growth caused by the gravitational collapse of the gully sidewall. The step height was between 1.64 and 3.29 cm. Finally, SW stabilized. No significant difference in SW was found between different inflow rates in the first phase (p > 0.05), but the differences did exist in the two latter stages (p < 0.01).
3.1.2. Gully Development
Gully development was a coordinated process of gully width and gully depth. However, the development of gully width and depth were not completely synchronous. Considering the development characteristics of gully length, width, and depth, gully development was divided into three stages on the platform (Figure 3d). First, PL, PD, and PW increased rapidly within 5 min, which was called the headcut-incision stage. The second stage, in which PL increased gradually and PW increased with fluctuation from 5 min to 28 min, was called headcut-expansion. Lastly, PD and PW remained stable after 28 min, which was called the stabilization stage.
On the steep slope, gully development was divided into four stages, considering variation in gully width and depth (Figure 4c). In the first 7 min, SD and SW increased rapidly, and SD was less than 0.2 m. The development occurring in the A layer was called A-layer incision. From 9 min to 16 min, SD increased slowly while SW increased rapidly. The second development, characterized by sidewall expansion of A layer, was called A-layer expansion. From 18 min to 39 min, SD increased rapidly again while SW increased in the shape of step with small increment. This development is called B-layer incision. In the first three stages, the increment of gully depth accounted for 46.19–54.69%, 12.95–18.75% and 25.67–39.77% of the total values. In order, the gully width increment accounted for 47.87–54.00%, 25.49–35.61% and 5.14–26.52% of the total score. SD and SW had the fastest growth of 2.24–2.89 and 1.50–1.67 cm min−1 in A-layer incision, respectively. In the end, the gully morphological development stagnated. The stage was defined as the stabilization stage. Linear positive relationships were observed between SW and SD in the first three stages. The regression equations are Equations (12)–(14).
The slopes in Equations (12) and (14), substantially less than 1.0, indicated that the gully developed deeper in the A-layer and B-layer incision stages. However, the slope was greater than 1.0 in Equation (13), indicating that the gully development was wider in the A-layer expansion. There was no correlation between SW and SD in the stabilization stage.
3.2. Flow Hydraulics
3.2.1. Variations in Flow Velocity
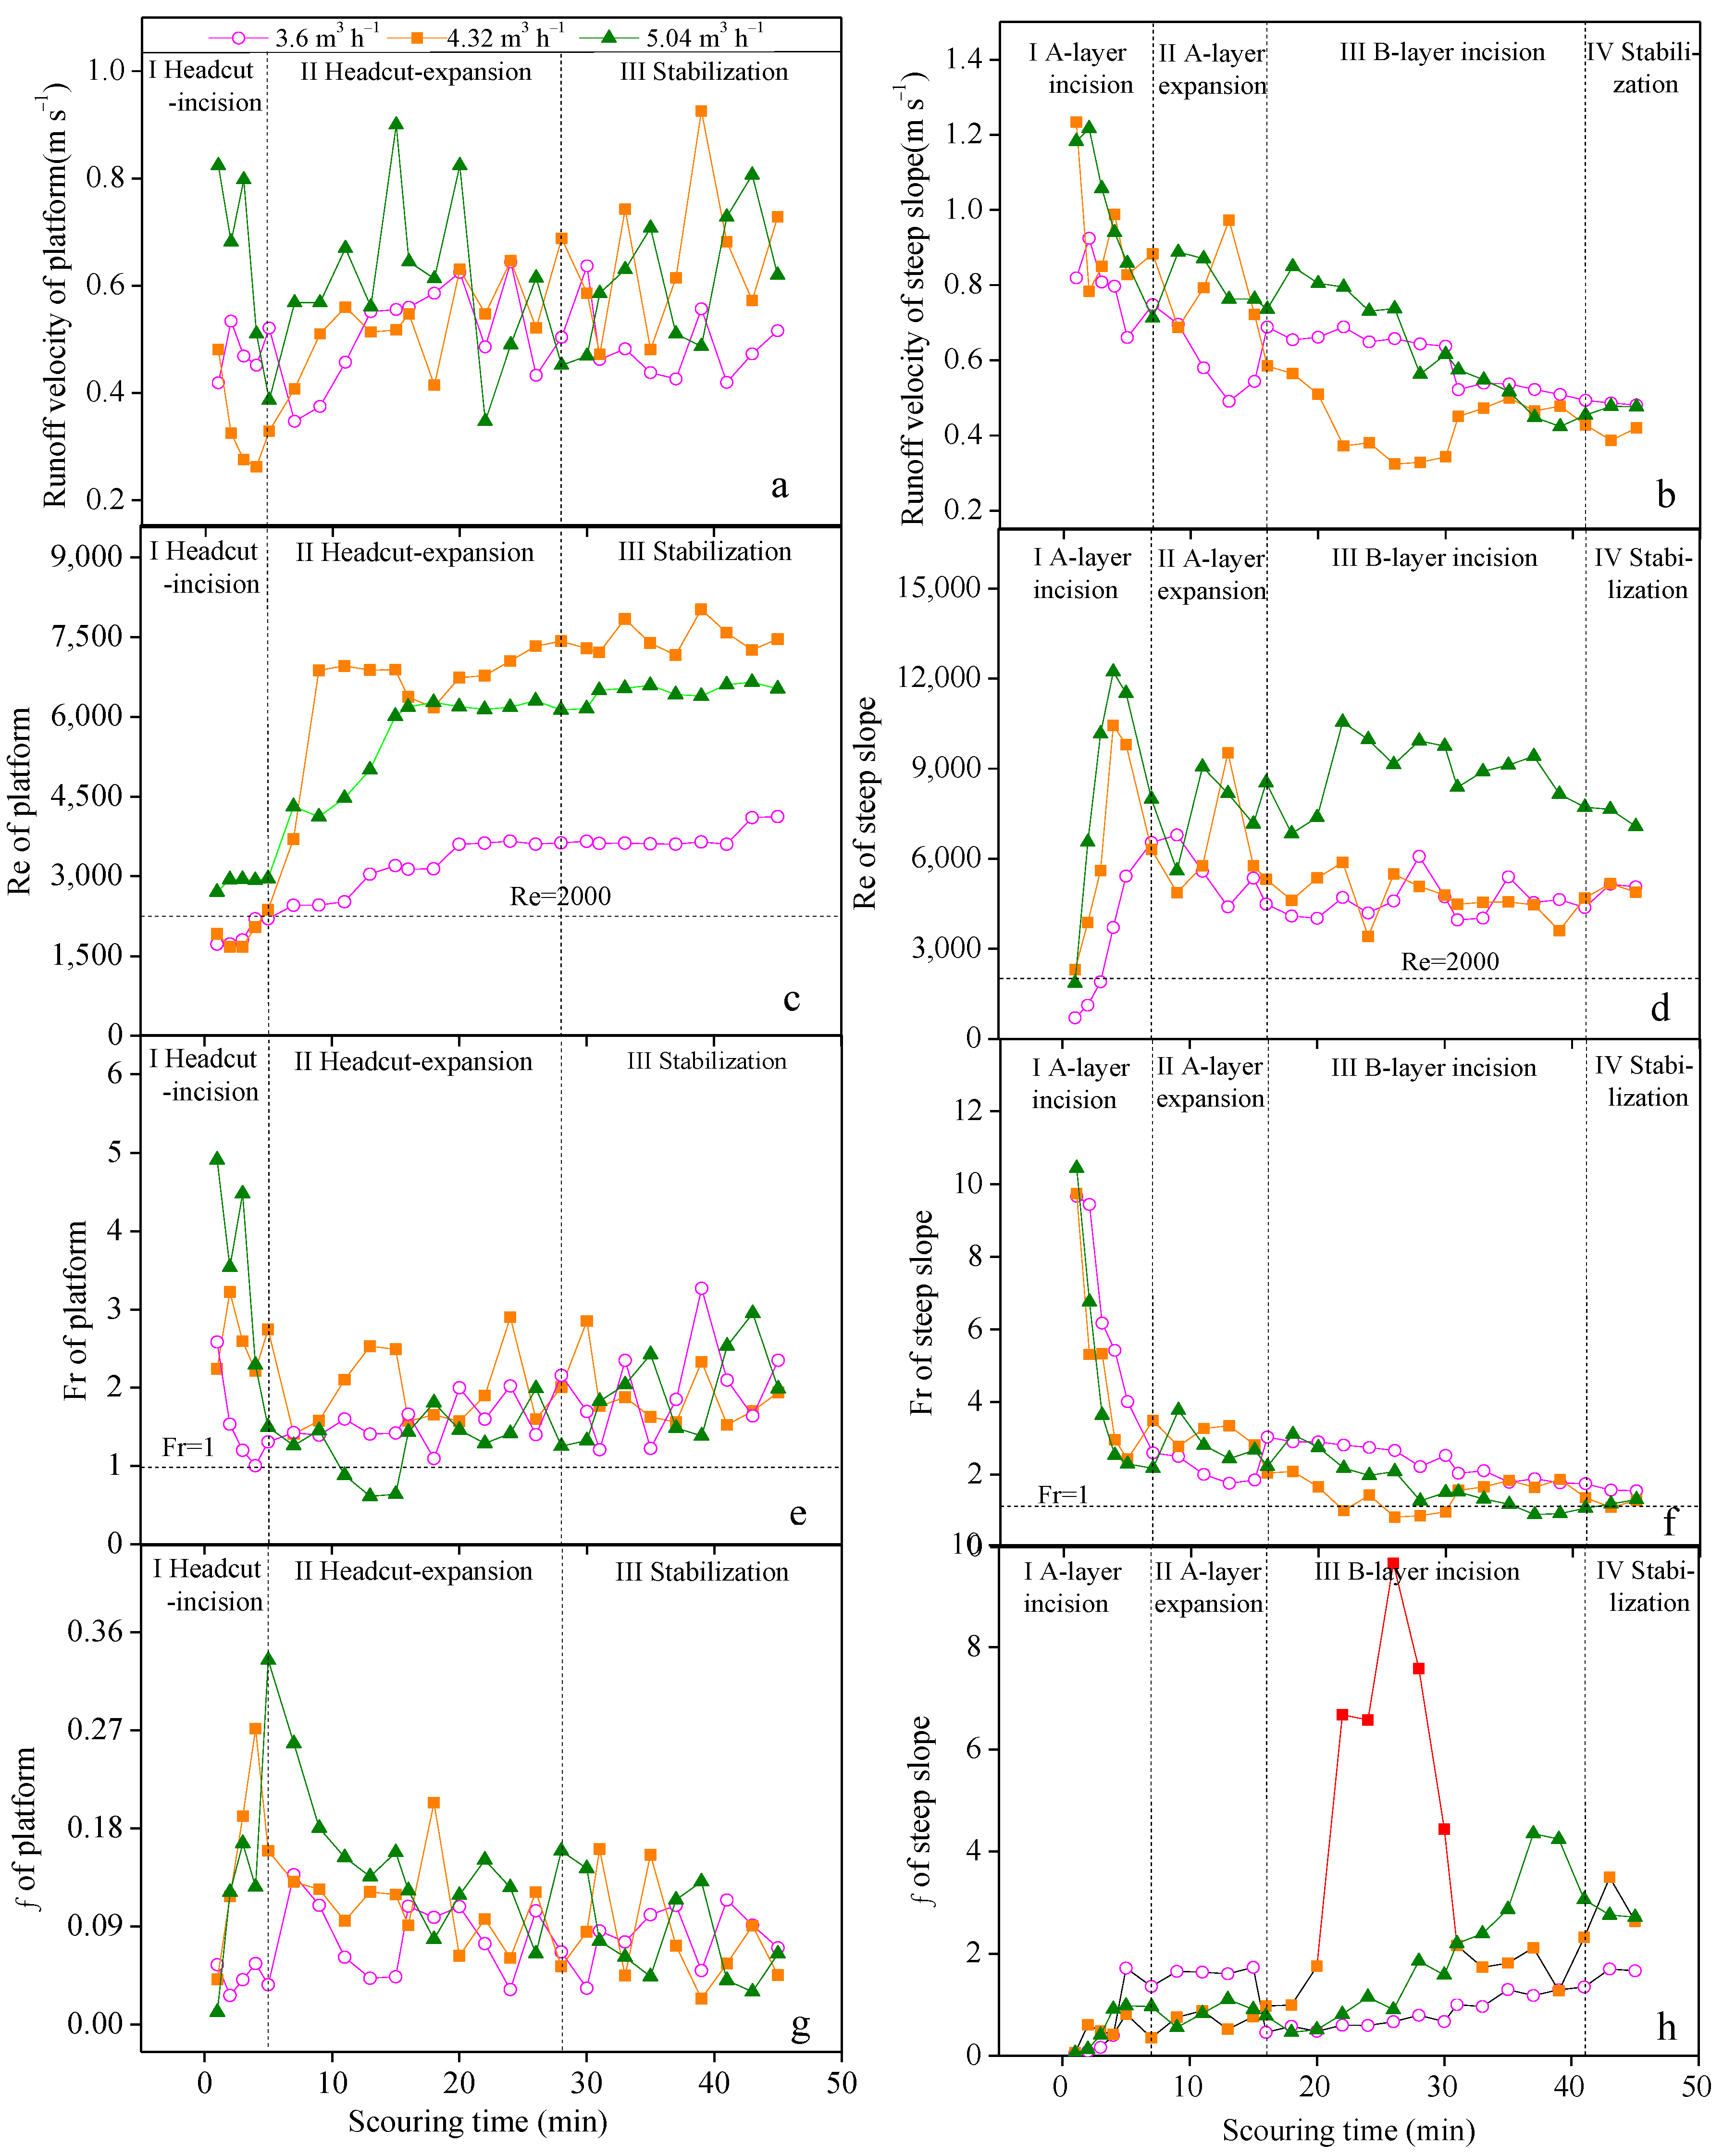
The flow velocity on the platform presented a transitory decrease first, followed by an increasing change (Figure 5a). In the headcut-incision stage, flow velocity decreased by 34.95–53.09%. In the headcut- expansion stage, flow velocity increased from 0.33–0.39 m s−1 to 0.61–0.69 m s−1. Finally, flow velocity increased slowly to a steady level in the stabilization stage.
Flow velocity generally decreased on the steep slope (Figure 5b). The gully bed had a low resistance due to the smooth surface in the initial process. Flow velocity increased moderately at first, and soon decreased by 28.54–41.43% in the A-layer incision stage. In the A-layer expansion stage, flow velocity decreased by −1.91–21.32% with fluctuation. Then, flow velocity decreased by 8.01–25.67% in the B-layer incision stage. Eventually, in the stabilization stage, flow velocity reduced slowly to achieve a steady level, about 0.33–0.53 m s−1, as well as SD and SW. The steady velocity was 33.36–52.65% of the maximum value.
The flow velocity of the platform and the steep slope significantly increased with the discharge (p < 0.01). The average flow velocities of the steep slope were 1.40–1.70 times that of the platform in the first 22 min, which indicated that the flow kinetic energy increased significantly after entering the steep slope from the platform. However, the average flow velocities of the steep slope were 0.62–1.03 times those of the platform in the stabilization stage.
3.2.2. Hydraulic Regime
For open-channel hydraulics, the flow is laminar when Re < 500, turbulent when Re > 2000, and transitional when Re is between 500 and 2000. The change in platform Re was divided into three stages (Figure 5c). Re increased rapidly in the headcut-incision stage, indicating that the flow converted from transitional flow to turbulent flow. Then, Re had the greatest increase in the headcut-expansion stage. The values at the end of headcut-expansion were 1.63 to 2.84 times those of the headcut-incision stage. Finally, Re increased slowly in the stabilization stage. Turbulence flow remained the majority flow type. The Re of the steep slope increased sharply in the A-layer incision stage. Then, Re gradually decreased with fluctuation in the three latter stages (Figure 5d). The decrease process experienced a rising trend from 9 min to 22 min on 5.04 m3 h−1 inflow. Re varied from 702.5 to 12,221.9 in all the runs. The turbulence dominated the duration of the runs. Re < 2000 only occurred within the initial 3 min after runoff generated under conditions of 3.6 m3 h−1. The Re of the steep slope was 0.90–1.56 times that of the platform on each inflow rate, while no significant correlation between them was observed.
The average Fr of the platform ranged from 1.71 to 2.06, belonging to supercritical flow (Figure 5e). Fr decreased sharply in the headcut-incision stage. Then, Fr showed an evident upward trend in the headcut-expansion and stabilization stage. Fr varied from 0.83 to 10.44 for the steep slope flow, which indicated that the flow belonged to supercritical flow and barely appeared as subcritical flow (Figure 5f). In the A-layer incision stage, Fr varied from 2.17 to 10.44, and its minimum values decreased by 74.11%, 73.03%, and 79.17% on 3.60, 4.32, and 5.04 m3 h−1, respectively. In the A-layer expansion stage, Fr fluctuated due to the sidewall collapse impaction. During the B-layer incision stage, Fr, ranging from 0.92 to 3.12, decreased by 8.54%, 4.49%, and 9.47%. Fr values in the stabilization stage were only 16.83%, 12.87%, and 11.45% of the maximum value, which meant that decrements of Fr in the two incisions accounted for the 88.97–100% of the total reduction. The relationship between Fr and scouring time is expressed by a logarithm function as follows:
where, Fr is the Froude Number of the steep slope.
3.2.3. Hydraulic Friction
Platform ƒ ranged from 0.01 to 0.33 (Figure 5g). ƒ increased sharply in the headcut-incision stage and then rapidly decreased in the headcut-expansion stage. Finally, platform ƒ decreased slowly in the stabilization stage. The ƒ of the steep slope generally increased with fluctuation (Figure 5h). ƒ varied from 0.05 to 1.72 in the A-layer incision stage. Their maximum values increased by 30.19, 12.91, and 17.56 times compared to the minimum values on 3.60, 4.32, and 5.04 m3 h−1, respectively. In the A-layer expansion stage, ƒ remained approximately unchanged. Up to the B-layer incision stage, ƒ ranged from 0.46 to 4.24. Their maximum values increased by 1.23, 0.28, and 8.19 times compared to the minimum values, which had a smaller decrementthan the A-layer incision stage. ƒ increased mainly in the two incision stages as its increments accounted for 47.90–88.97% of the total. The average ƒ of the steep slope was 12.45–22.11 times that of the platform in each inflow treatment. Regression analysis showed that ƒ varied with time as a power function:
where ƒ is the Darcy–Weisbach roughness coefficient of the steep slope.
3.2.4. Interrelation of Hydraulic Parameters
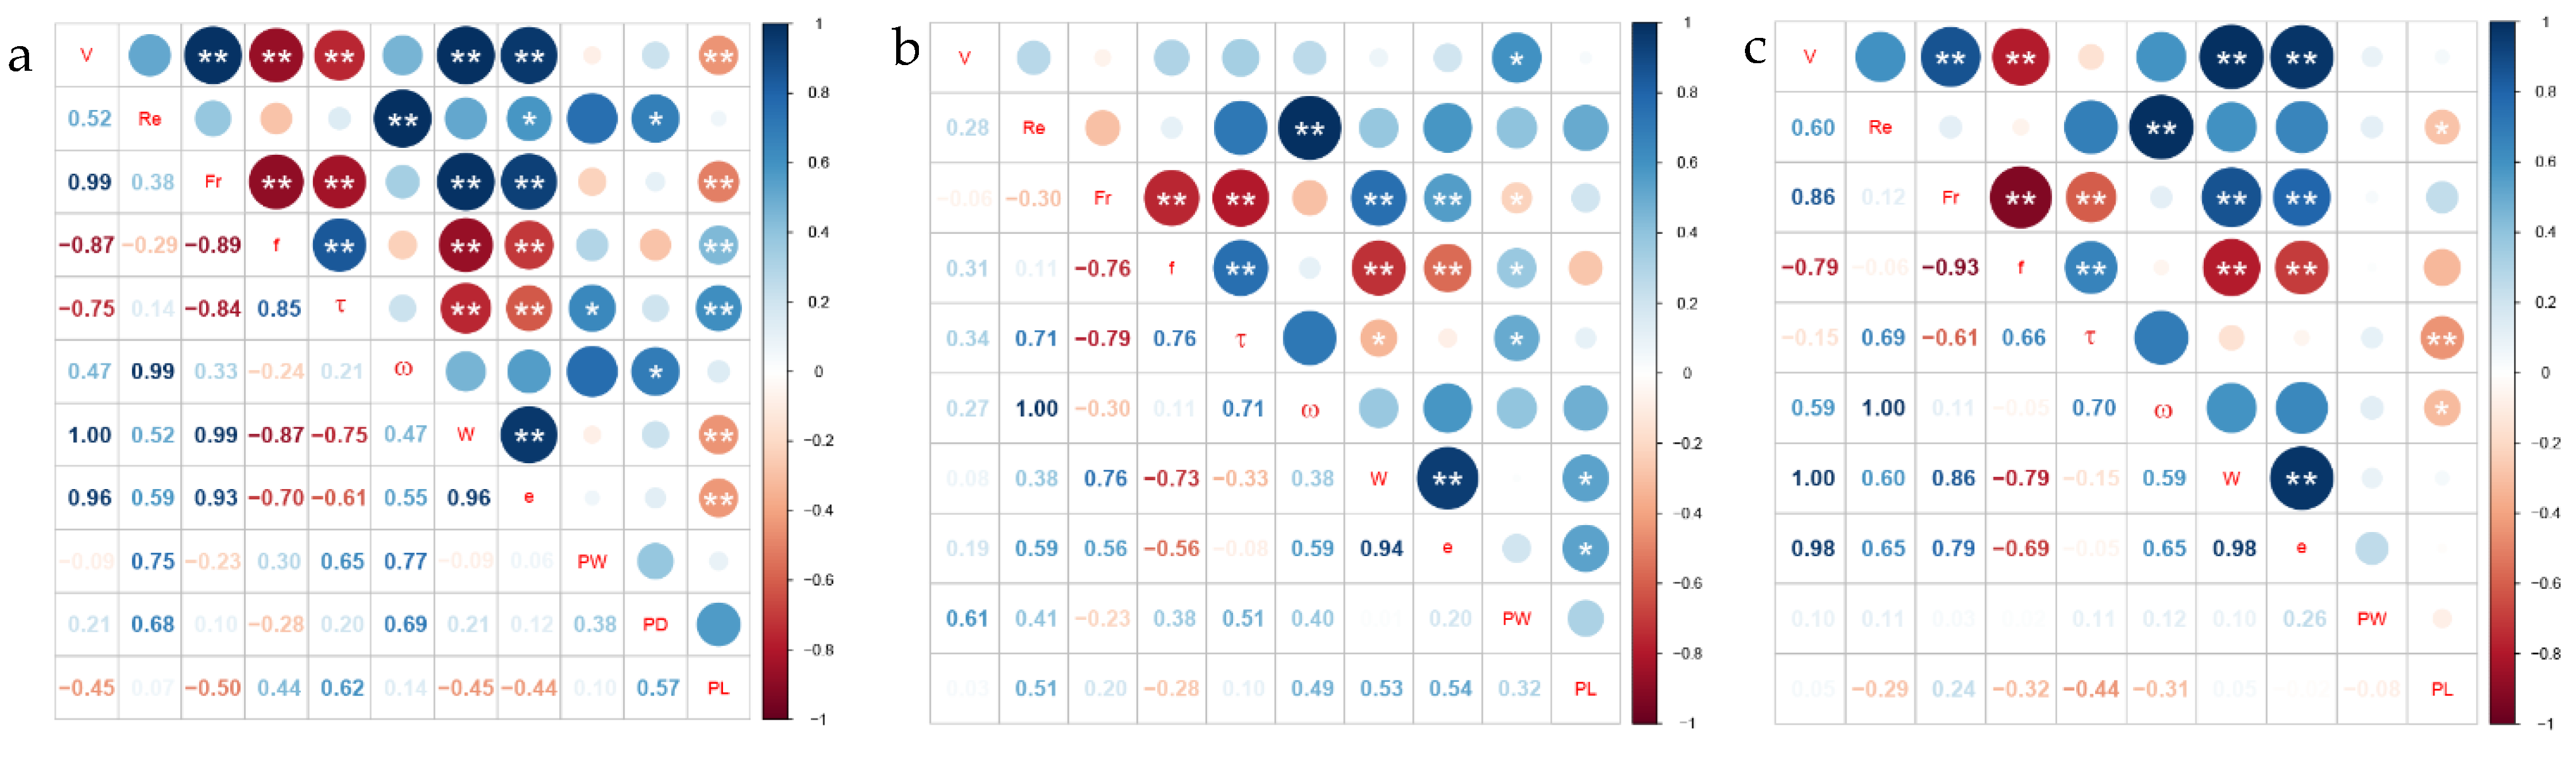
For the platform, the correlation between flow velocity and W was the strongest in the headcut-incision stage and the stabilization stage (Figure 6). Re had the best positive linear relationship with ω in all three stages (r > 0.99). Fr had a better negative correlation with ƒ (p < 0.01, r < −0.74) and τ (p < 0.01, r < −0.61), and was positively correlated with W (p < 0.01, r > 0.76). ƒ had a better relationship with τ and W, and was negatively correlated with W (p < 0.01, r < −0.73) and positively correlated with τ (p < 0.01, r > 0.62).
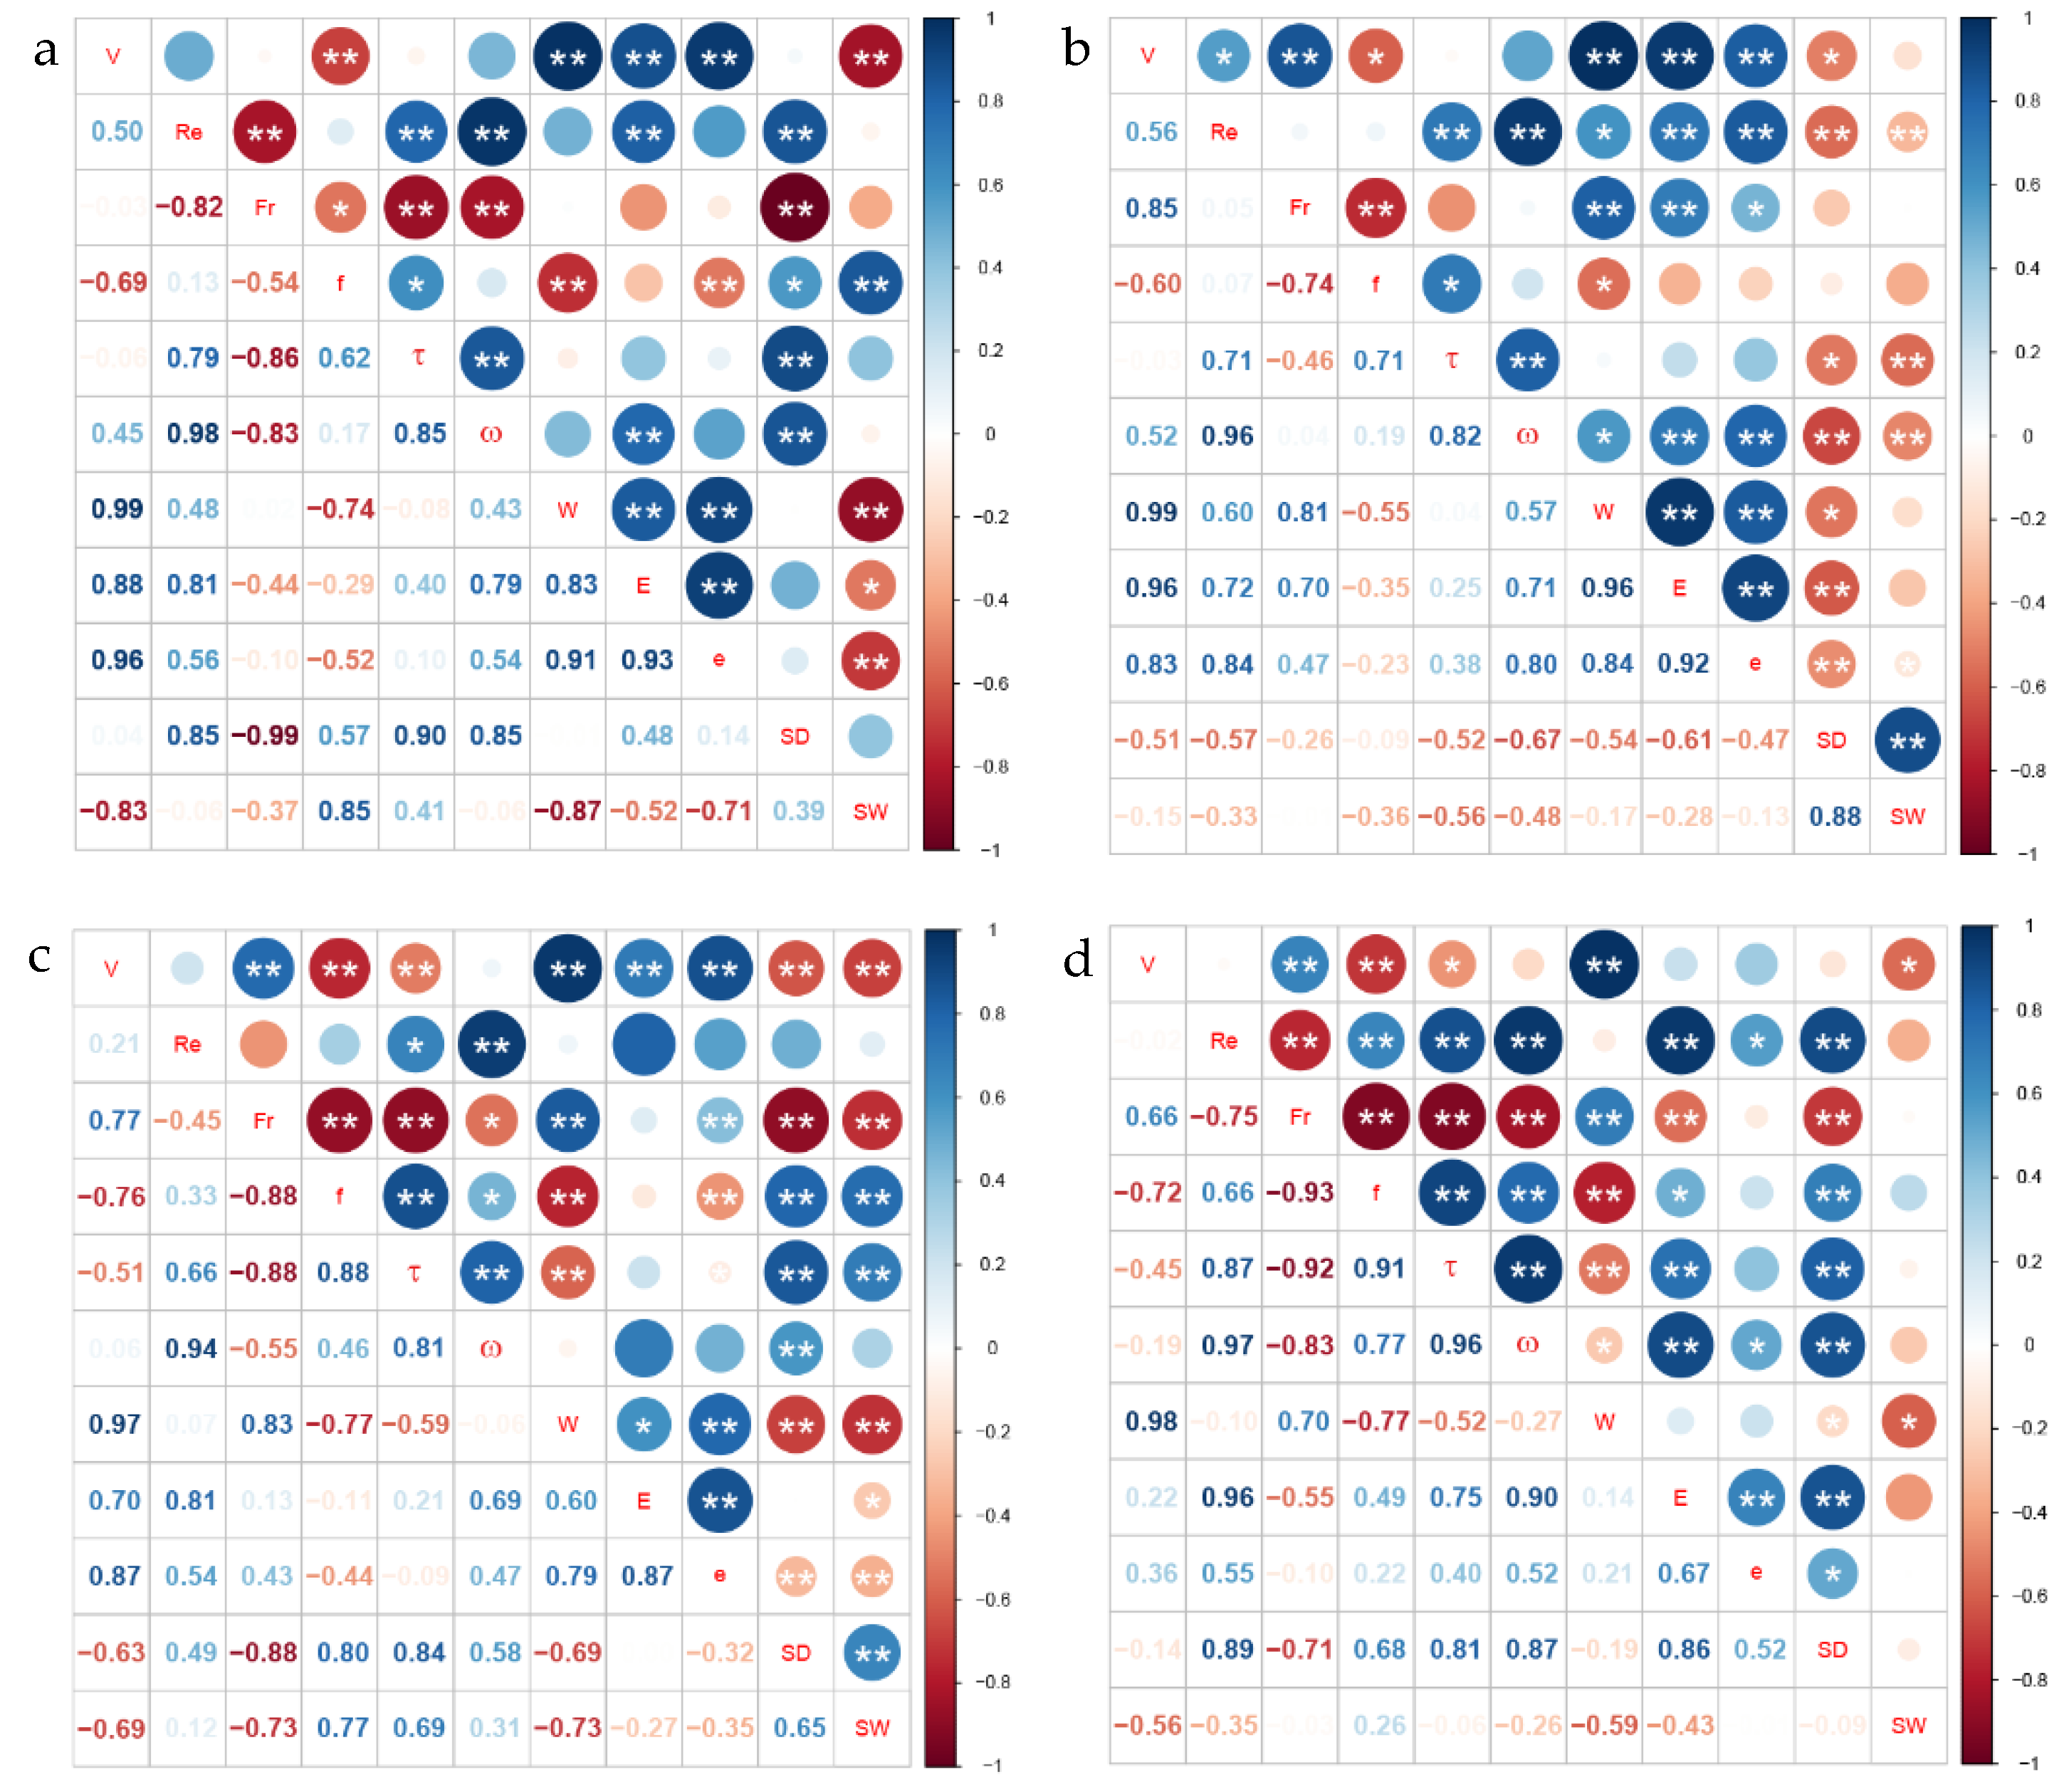
The flow velocity of the steep slope had a significant positive linear correlation with W, E, and e in all the four development stages (Figure 7). Re had the best positive relationship with ω (p < 0.01, r > 0.94). Fr was best correlated with τ (p < 0.05, r < −0.46). ƒ had a better negative correlation with Fr (p < 0.01, r < −0.54) and was positively correlated with τ (p < 0.01, r > 0.62). A significant positive relationship was observed between τ and ω (p < 0.01, r > 0.81). For the platform and the steep slope, Fr decreased with ƒ and τ, ƒ decreased with τ, and Re had the best relationship with ω (Table 2).
3.3. Hydrodynamic Processes of Gully Development
In the headcut-incision stage, PW and PD were positively correlated with Re and ω (Figure 6a). PW was better related to Re (0.75 > 0.68) and ω (0.77 > 0.69) than PD. ω was the best parameter for predicting PW development in this stage. PL had a good relationship with τ (r = 0.62). In the headcut-expansion stage, a significant correlation was observed between PW and flow velocity (r = 0.61). PL had a good relationship with ω (r = 0.49). No correlations were found between PW and PL and hydrodynamic parameters in the stabilization stage. In short, no stable correlation existed between the gully dimension and hydrodynamic parameters on the platform. Especially in the stages dominated by the headcut, the response of gully length to hydrodynamic parameters was insensitive.
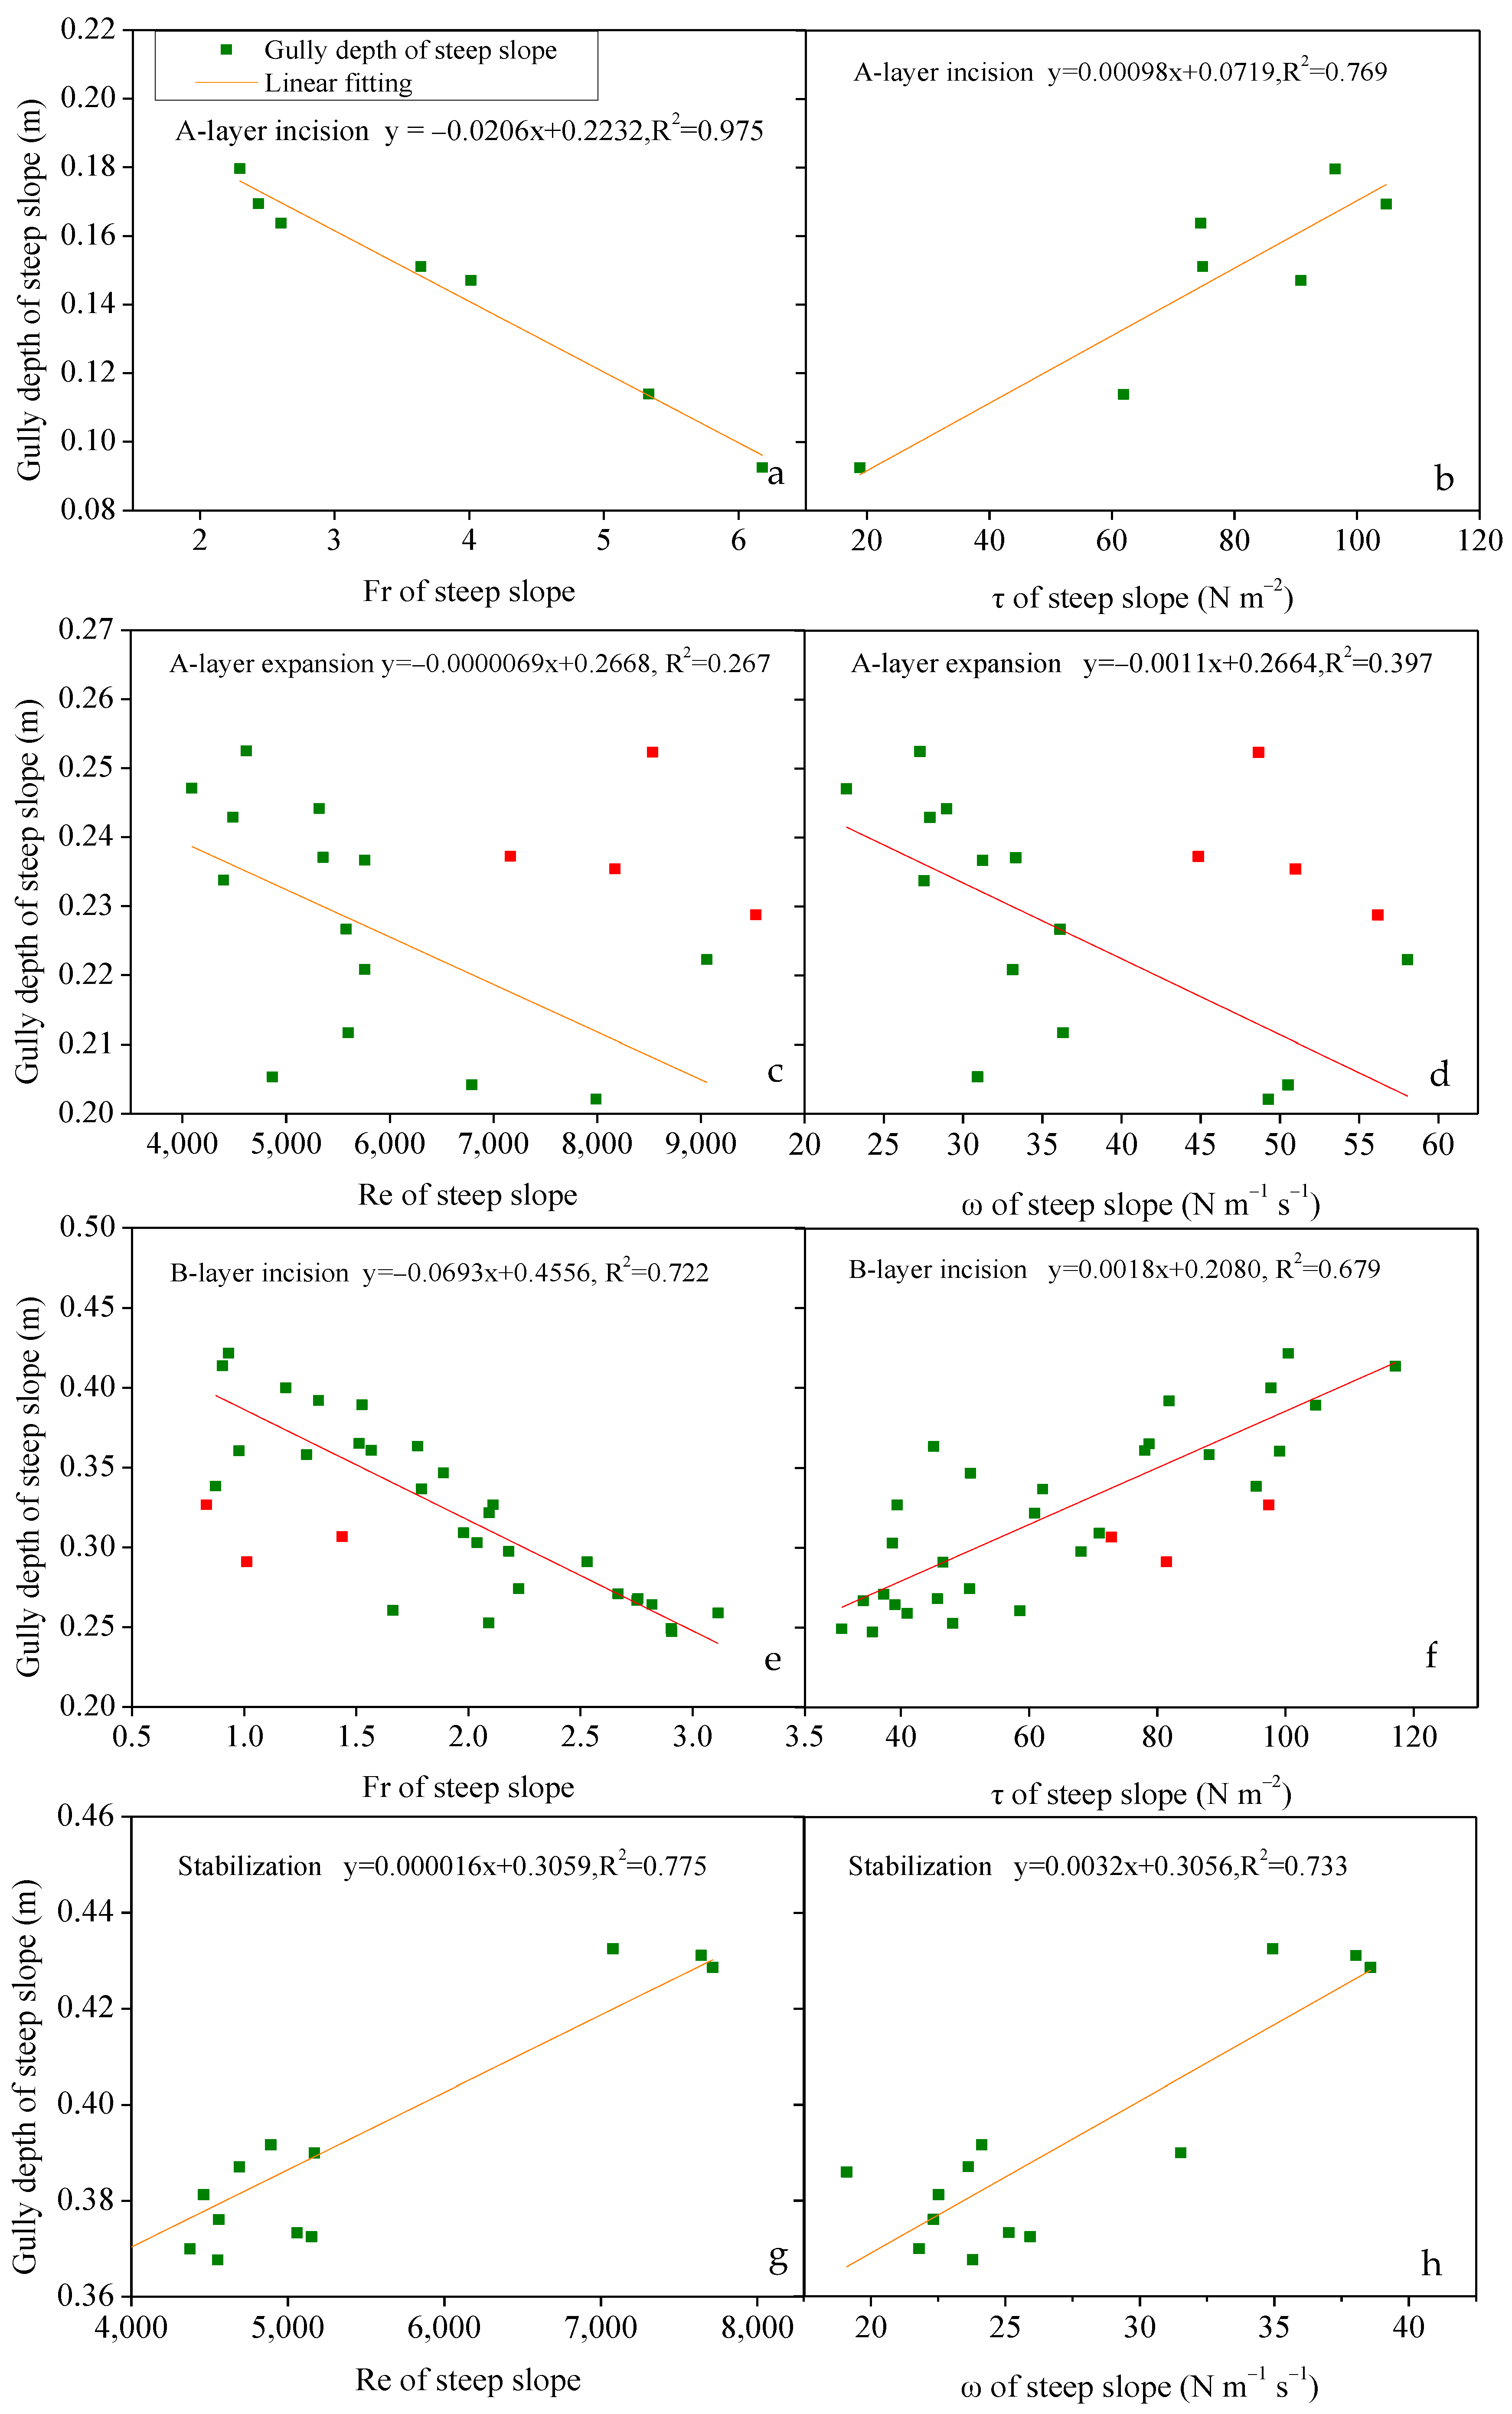
Figure 7 showed that the SD had a negative correlation with V, Fr, W, E, and e, and a positive correlation with Re, ƒ, τ, and ω except for the A-layer expansion stage. SW was positively correlated with ƒ and τ except for the A-layer expansion stage, and was negatively correlated with the other hydrodynamic parameters. The response sensitivity of SW and SD to hydrodynamic parameters was different between the four erosion stages. In general, SD, with larger correlation coefficients, was more sensitive to hydrodynamic parameters than SW. Moreover, SD had a fixed linear correlation with Fr (Figure 8a,e, p < 0.01, R2 > 0.72) and τ (Figure 8b,f, p < 0.01, R2 > 0.67) in the A-layer and B-layer incision stages, and ω (Figure 8d,h, p < 0.01, R2 > 0.39) and Re (Figure 8c,g, p < 0.05, R2 > 0.26) in the A-layer expansion and stabilization stages. By contrast, the hydrodynamic parameters, the closest related to SW, varied greatly in different erosion stages. Hence, the relationships between SD and hydrodynamic parameters were more reliable. Studying the hydrodynamic mechanism of gully depth development is more meaningful.
4. Discussion
4.1. Gully Morphological Development on Spoil Dump
The results showed that the gully erosion of spoil dumps exhibited a development process of headcut-incision–headcut-expansion–stabilization on the platform, and experienced a development process of A-layer incision–A-layer expansion–B-layer incision–stabilization on the steep slope. The development process of gully morphology significantly differed between platform and steep slope. This difference is mainly related to soil bulk density, slope gradient and flow hydraulics. The processes and characteristics of gully erosion on the platform–slope system were supported by some previous studies. Xu et al. also classified gully erosion into stages of headcutting, bed deep cutting and sidewall expansion [9]. Other studies suggested gully initiation and development involve episodes of downward scour, headward cutting, rapid enlargement, and stabilization [36]. The division of gully development stages depends on the dominant erosion forms of incision, headcut migration, and sidewall expansion. Gully development is a physical process that involves a certain one, or combination of the gully erosion forms [8]. The gullies were initiated by flow incision at the transition point between the platform and the steep slope where the flow hydraulic conditions suddenly changed. A headcut first formed at the transition point. The headcut migrated upstream on the platform. Meanwhile, the deepening incision developed to a flow drop, which accelerated the bed incision downslope on the steep slope. On the platform, the erosion form experienced from the headcut-incision interaction to headcut-expansion interaction after incision showed on the transition point of the platform and the steep slope. The bed incision had a short duration due to the limitation of the highly corrosion-resistant B-layer. The gully formed rapidly on the top of the steep slope within 1 min, with a headcut migration that had a short duration. Consequently, bed incision was the main erosion form in the A-layer incision stage. The incision speed at this stage was the greatest due to the higher soil erodibility of the A layer. In the A-layer expansion stage, sidewall expansion dominated the erosion. The flow concentrated in the B layer and eroded the sidewall toe, which accelerated gully expansion [37]. In the B-layer incision stage, gully erosion was again dominated by bed incision, which was mainly due to the step-pools developed on the gully bed [38,39,40]. With scour depth increasing, the roughness of the bed surface and the flow energy consumption increased significantly [41]. The positive feedback was confirmed by the variation of flow hydraulics in this paper, which verified the results of the hydrodynamic processes of ephemeral gully erosion [14]. In the stabilization stage, the soil detachment slowed down toward an equilibrium between the flow eroding and soil resistive stresses [42]. However, the equilibrium is only maintained on experimental flow hydraulics. Neglecting the management of concentrated flow and gully existence may lead to an upgraded gully development in the next rainfall event. Notably, the linear relationship between gully depth and gully width varied stage by stage, which implied that the interaction of incision and expansion varied. A further integrated study on the interactions among the different erosion forms is warranted to precisely clarify the gully evolution.
4.2. Morphodynamics of Gully Development on Spoil Dump
Gully depth had the relatively more sensitive response to flow hydraulics than gully length, width and depth (Figure 7). Ni et al. found the consistent result that rill depth had better relationships with hydrodynamic parameters than rill width [43]. This comparison fully indicates that the depth of rills and gullies is directly controlled by flow hydraulics for both rill and gully. This is related to the different mechanisms among gully lengthening, expansion and deepening. Gully lengthening was caused by headcut migration, which relied on upstream flow incision, headwall erosion by on-wall flow and plunge pool erosion by jet flow [44]. Gully flow was not the direct driver of gully lengthening. Gully expansion is driven not only by flow incision but also by lateral erosion [45] and mass failure of the bank [46]. In particular, the expansion was accelerated due to soil layers with higher anti-erodibility [44,47], such as the loam clay B layer. By contrast, gully deepening was more dependent on the flow hydraulics. The bed incision occurred when the shear force was greater than the soil resistance [48]. The staged variation in flow velocity, Fr, and ƒ convinced the different response of gully length, width and depth to flow hydraulics. Flow velocity and Fr had an increasing trend during gully lengthening in the incision-expansion stage on the platform (Figure 5a,e). Similarly, the flow velocity and Fr fluctuated around the average values (Figure 5b,f), which were caused by backwater or transient debris flow after the collapses. However, 88.97–100% of Fr decrement and 47.90–88.97% of ƒ increment finished in the A-layer incision and B-layer incision stages (Figure 5f,h), indicating that the gully depth has more evident response to flow hydraulics.
The shear stress, runoff power, Froude number, and Reynolds number can be used to predict gully depth in the four gully development stages on the steep slope. The optimal hydraulic indicator varied in different stages. The relationship between gully depth and shear stress was better than runoff power in the two incision stages (Figure 8b,f). The critical shear stress is also used as a key factor to estimate gully depth in CREAMS [49]. Besides, Zhang et al. found consistent results in the rill erosion [50]. All of these results are based on the same physics [48]. Nevertheless, gully depth had a better relationship with runoff power than shear stress in the A-layer expansion and stabilization stages (Figure 8d,h), which indicated that the feedback between gully morphology and flow hydraulics varied with erosion form. The selection of an optimal hydraulic indicator should be considered when establishing a process-based predicted model of gully erosion.
4.3. Gully Control on Spoil Dump
Concentrated runoff from a platform is the decisive driver of gully development on spoil dumps. Gullies complete the active development of the initiation period, and transition to a relatively stable stage in a heavy rainfall incident. The land management of spoil dumps should focus on the runoff control on the platform. Segmentation of the platform is the first priority on an unrestored spoil dump. The measurement aims to increase infiltration and decrease runoff. Drainage measures based on terrain are another option to control runoff on the platform. Building the drains after the dump has settled is suggested in this paper. Storage measures on the platform are more conducive to the efficient utilization of water resources in restored spoil dumps. Moreover, existing gullies should be buried in a timely manner to prevent their continuous development and secondary disaster. The transformation of gullies into drains is a good choice.
5. Conclusions
This paper explored gully morphology development and its response to flow hydraulics. A series of scouring experiments were carried out. The gully morphology developments of the platform and the steep slope have clear staged characteristics due to changes in the dominant erosion form. Gully depth has a more sensitive response to flow hydraulics than gully width and length. A significant linear correlation was observed between gully depth and ω, τ, Fr, and Re. The response of gully morphology to flow hydraulics varies with the dominant erosion form. Management of concentrated flow is the key factor in gully control on spoil dumps. Our paper reveals the staged characteristics of gully development and provides insights into its morphodynamic mechanisms. The research results provide theoretical support for future mechanistic studies of gully erosion and land management on spoil dumps.
Author Contributions
Conceptualization, Y.B., M.G. and H.K.; methodology, Y.B. and M.G.; software, Y.B. and W.G.; validation, W.W., M.G. and H.K.; formal analysis, Y.B. and M.G.; investigation, H.S. and H.K.; resources, Y.B. and W.W.; data curation, Y.B. and H.S.; writing—original draft preparation, Y.B.; writing—review and editing, Y.B., M.G. and H.K.; visualization, Y.B. and H.S.; supervision, W.W. and W.G.; project administration, Y.B., W.W. and C.M.; funding acquisition, Y.B., W.W. and C.M. All authors have read and agreed to the published version of the manuscript.
Funding
This research was funded by National Natural Science Foundation of China (grant number 41761062, 41867015), the National Key Research and Development Program of China (grant number 2016YFC0501604), and the State Key Laboratory of Soil Erosion and Dryland Farming on the Loess Plateau (grant number A314021402-202102).
Data Availability Statement
Summarized data are presented and available in this manuscript and rest of the data used and/or analyzed are available from the corresponding author on reasonable request.
Conflicts of Interest
The authors declare no conflict of interest.
Appendix A
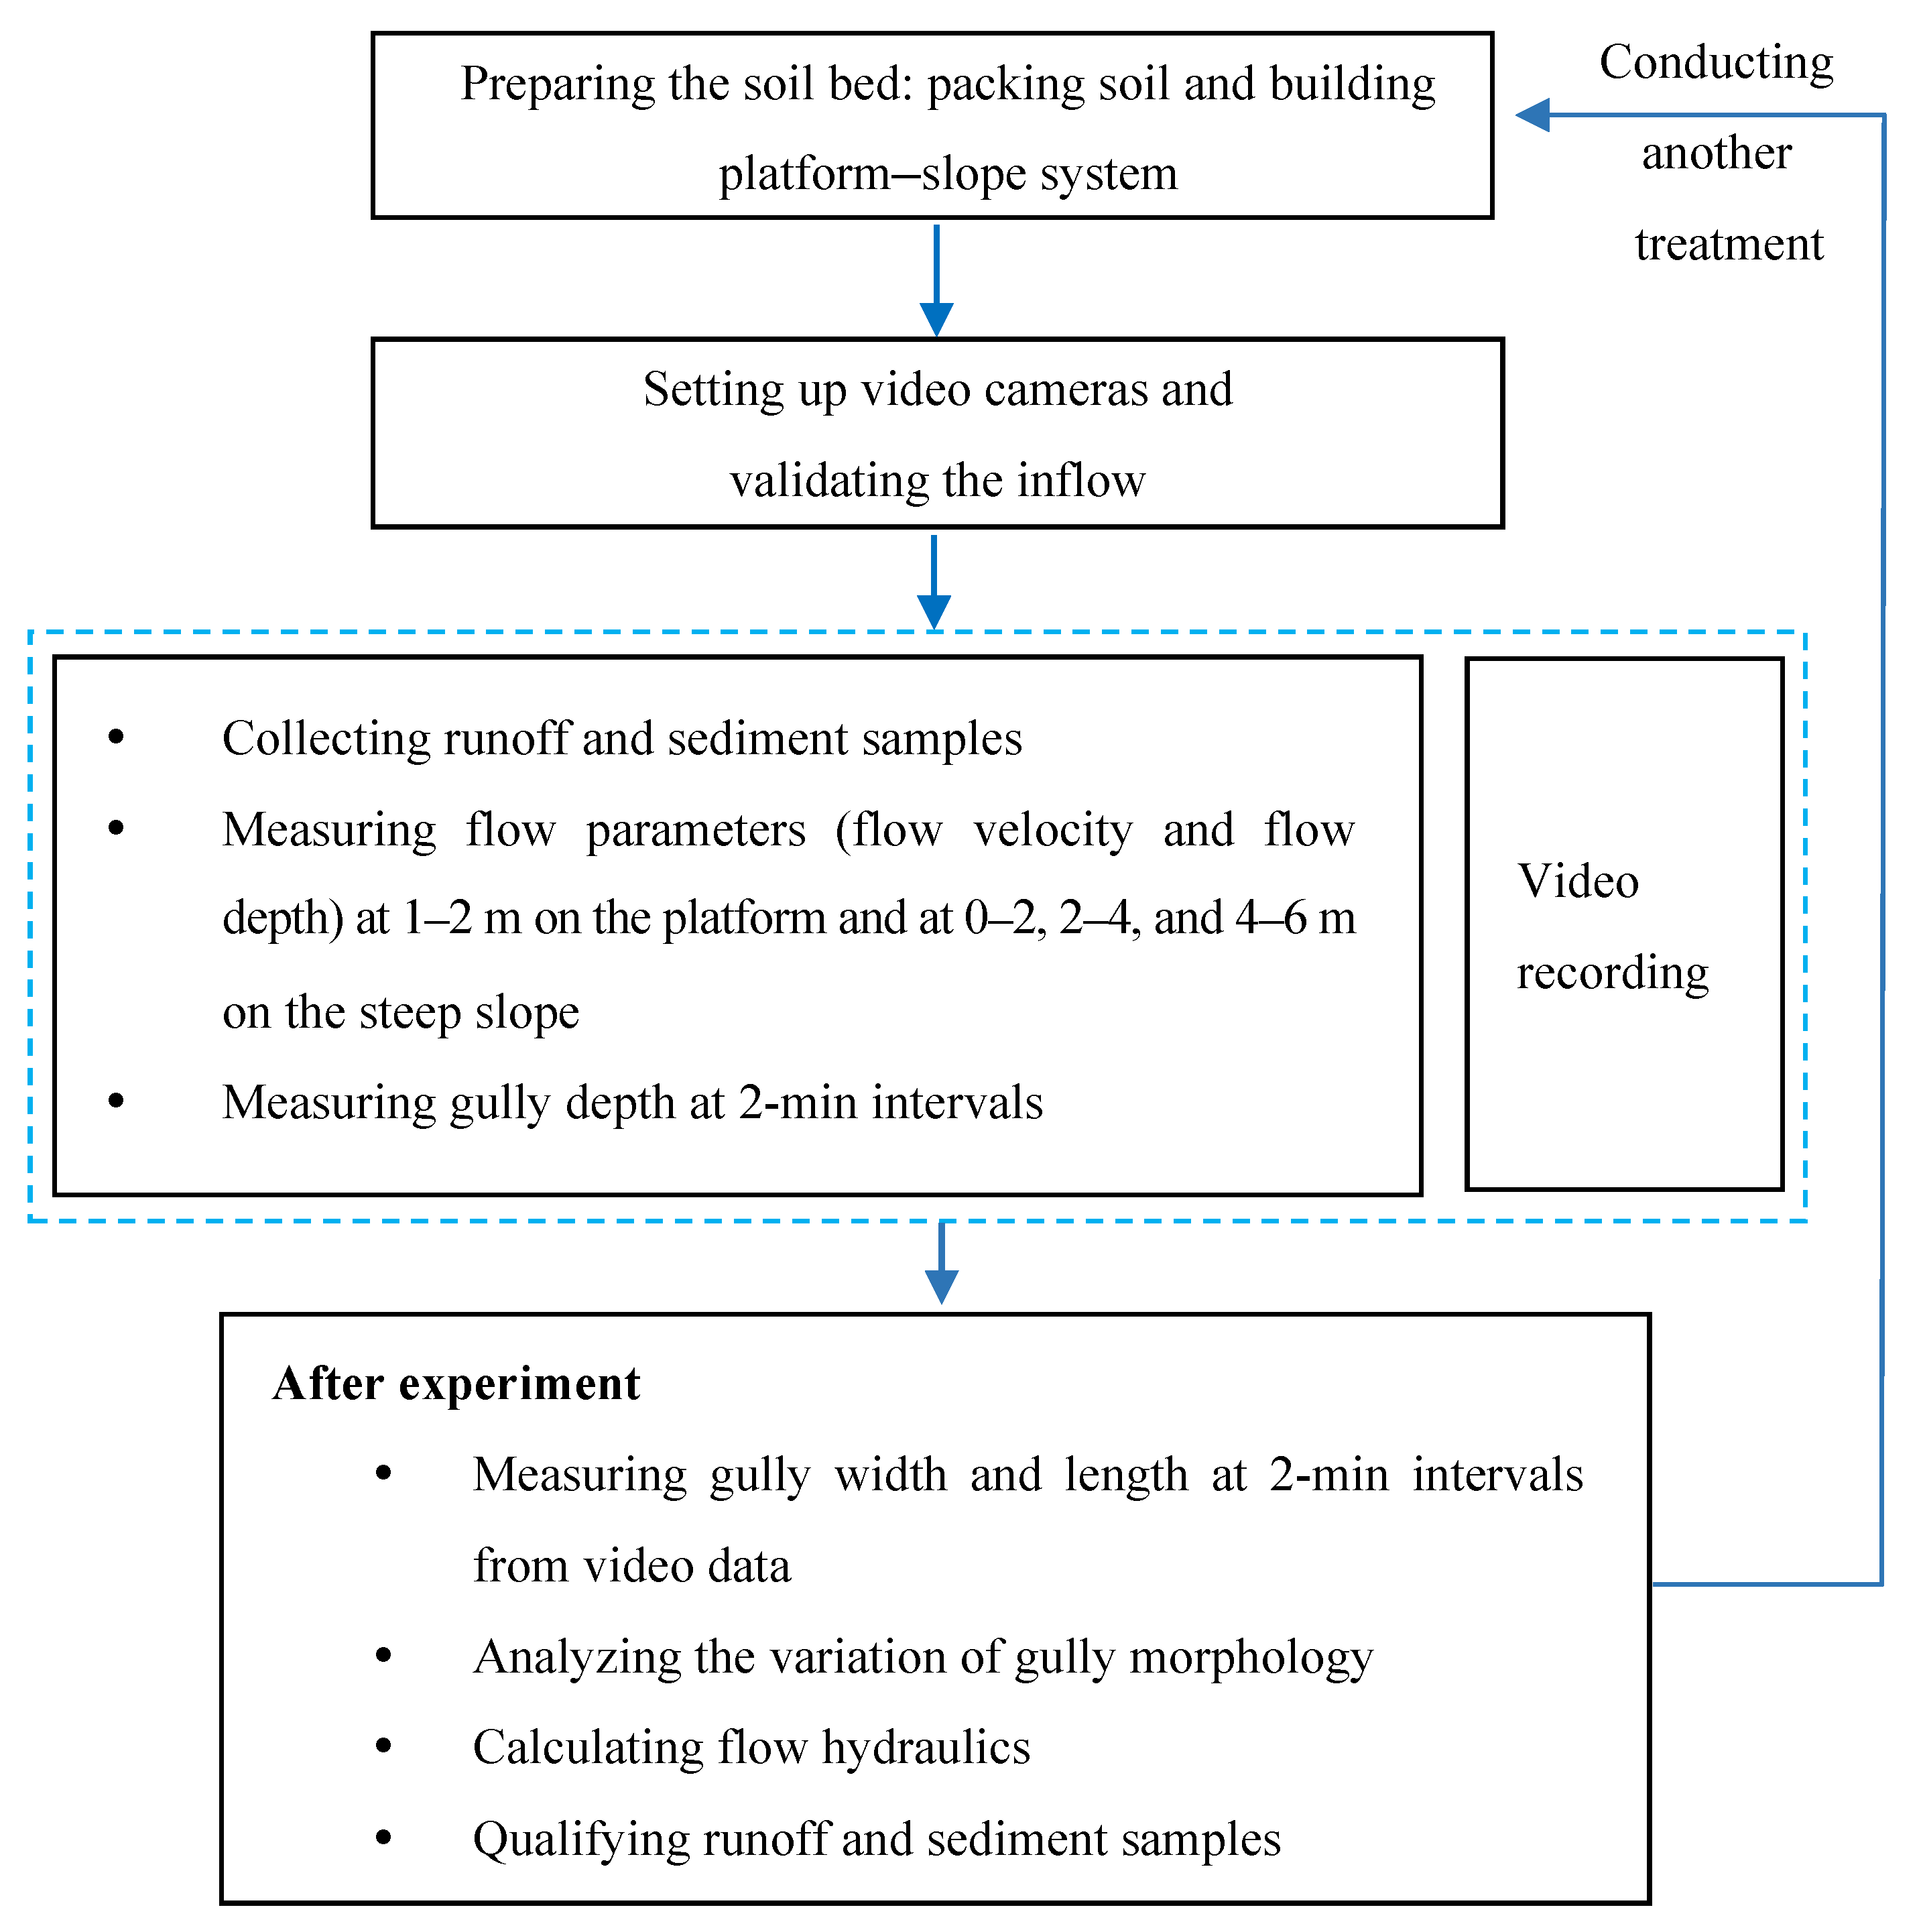
Figure A1.
The flow chart of conducting the experiment.

References
- Rimmer, D.L. Soil physical conditions on reclaimed colliery spoil heaps. Eur. J. Soil Sci. 2010, 33, 567–579. [Google Scholar] [CrossRef]
- Cristina, M.M.; José, F.M.D.; José, M.N.I.; Néstor, H.R.; Sanz Santos, M.Á.; Lázaro, S.C. Effects of Topography and Surface Soil Cover on Erosion for Mining Reclamation: The Experimental Spoil Heap at El Machorro Mine (Central Spain). Land Degrad. Dev. 2013, 24, 145–159. [Google Scholar] [CrossRef] [Green Version]
- Guo, M.M.; Wang, W.L.; Li, J.M.; Bai, Y.; Kang, H.L.; Yang, B. Runoff characteristics and soil erosion dynamic processes on four typical engineered landforms of coalfields: An in-situ simulated rainfall experimental study. Geomorphology 2020, 349, 106896. [Google Scholar] [CrossRef]
- Su, H.; Wang, W.L.; Kang, H.L.; Bai, Y.; Guo, M.M.; Chen, Z.X. Erosion morphology and runoff and sediment yielding characteristics of platform-slope system in opencast coal mine. Chin. J. Appl. Ecol. 2020, 31, 3194–3206. [Google Scholar] [CrossRef]
- Gilley, J. Water Erosion; Academic Press: London, UK, 2003. [Google Scholar]
- Sidorchuk, A. Dynamic and static models of gully erosion. Catena 1999, 37, 401–414. [Google Scholar] [CrossRef]
- Xu, X.; Zheng, F.; Wilson, G.V.; Zhang, X.J.; He, X. Quantification of upslope and lateral inflow impacts on runoff discharge and soil loss in ephemeral gully systems under laboratory conditions. J. Hydrol. 2019, 579, 124174. [Google Scholar] [CrossRef]
- Bingner, R.L.; Wells, R.R.; Momm, H.G.; Rigby, J.R.; Theurer, F.D. Ephemeral gully channel width and erosion simulation technology. Nat. Hazards 2016, 80, 1949–1966. [Google Scholar] [CrossRef]
- Xu, X.M.; Zheng, F.L.; Wilson, G.V.; Wu, M. Upslope inflow, hillslope gradient and rainfall intensity impacts on ephemeral gully erosion. Land Degrad. Dev. 2017, 28, 2623–2635. [Google Scholar] [CrossRef]
- Wu, T.; Pan, C.; Li, C.; Luo, M.; Wang, X. A field investigation on ephemeral gully erosion processes under different upslope inflow and sediment conditions. J. Hydrol. 2019, 572, 517–527. [Google Scholar] [CrossRef]
- Xu, X.M.; Zheng, F.L.; Wilson, G.V. Flow hydraulics in an ephemeral gully system under different slope gradients, rainfall intensities and inflow conditions. Catena 2021, 203, 105359. [Google Scholar] [CrossRef]
- Liu, G.; Zheng, F.; Wilson, G.V.; Xu, X.; Liu, C. Three decades of ephemeral gully erosion studies. Soil Tillage Res. 2021, 212, 105046. [Google Scholar] [CrossRef]
- Shi, Q.; Wang, W.; Guo, M.; Chen, Z.; Feng, L.; Zhao, M.; Xiao, H. The impact of flow discharge on the hydraulic characteristics of headcut erosion processes in the gully region of the Loess Plateau. Hydrol. Process. 2020, 34, 718–729. [Google Scholar] [CrossRef]
- Gong, J.G.; Jia, Y.W.; Zhou, Z.H.; Wang, Y.; Wang, W.L.; Peng, H. An experimental study on dynamic processes of ephemeral gully erosion in loess landscapes. Geomorphology 2011, 125, 203–213. [Google Scholar] [CrossRef]
- Ionita, I. Gully development in the Moldavian Plateau of Romania. Catena 2006, 68, 133–140. [Google Scholar] [CrossRef]
- Samani, A.N.; Ahmadi, H.; Mohammadi, A.; Ghoddousi, J.; Salajegheh, A.; Boggs, G.; Pishyar, R. Factors Controlling Gully Advancement and Models Evaluation (Hableh Rood Basin, Iran). Water Resour. Manag. 2010, 24, 1531–1549. [Google Scholar] [CrossRef]
- Nachtergaele, J.; Poesen, J.; Wijdenes, D.O.; Vandekerckhove, L. Medium-term evolution of a gully developed in a loess-derived soil. Geomorphology 2002, 46, 223–239. [Google Scholar] [CrossRef]
- Kang, H.L.; Guo, M.M.; Wang, W.L. Ephemeral gully erosion in concentrated flow channels induced by rainfall and upslope inflow on steep loessial slopes. Land Degrad. Dev. 2021, 32, 5037–5051. [Google Scholar] [CrossRef]
- Capra, A.; Mazzara, L.M.; Scicolone, B. Application of the EGEM model to predict ephemeral gully erosion in Sicily, Italy. Catena 2005, 59, 133–146. [Google Scholar] [CrossRef]
- Zhao, Y.Y.; Zhang, Y.; Yuan, M.T.; Yang, M.; Deng, J.Y. Estimation of initiation thresholds and soil loss from gully erosion on unpaved roads on China’s Loess Plateau. Earth Surf. Process. Landf. 2021, 46, 1713–1724. [Google Scholar] [CrossRef]
- Garosi, Y.; Sheklabadi, M.; Conoscenti, C.; Pourghasemi, H.R.; Van, O.K. Assessing the performance of GIS- based machine learning models with different accuracy measures for determining susceptibility to gully erosion. Sci. Total Environ. 2019, 664, 1117–1132. [Google Scholar] [CrossRef]
- Selkimäki, M.; González-Olabarria, J.R. Assessing Gully Erosion Occurrence in Forest Lands in Catalonia (Spain). Land Degrad. Dev. 2017, 28, 616–627. [Google Scholar] [CrossRef]
- Wells, R.R.; Bennett, S.J.; Alonso, C.V. Effect of soil texture, tailwater height, and pore-water pressure on the morphodynamics of migrating headcuts in upland concentrated flows. Earth Surf. Process. Landf. 2010, 34, 1867–1877. [Google Scholar] [CrossRef]
- Zhang, G.H. Advances and prospects for gully erosion researches. J. Soil Water Conserv. 2020, 34, 1–13. [Google Scholar] [CrossRef]
- Zhang, L.; Wang, J.M.; Bai, Z.K.; Lv, C.J. Effects of vegetation on runoff and soil erosion on reclaimed land in an opencast coal-mine dump in a loess area. Catena 2015, 128, 44–53. [Google Scholar] [CrossRef]
- Gong, C.G.; Lei, S.G.; Bian, Z.F.; Liu, Y.R.S. Analysis of the Development of an Erosion Gully in an Open-Pit Coal Mine Dump During a Winter Freeze-Thaw Cycle by Using Low-Cost UAVs. Remote Sens. 2019, 11, 1356. [Google Scholar] [CrossRef] [Green Version]
- Lowry, B.C.J.; Narayan, M.; Hancock, G.R.; Evans, K.G. Understanding post-mining landforms: Utilising pre-mine geomorphology to improve rehabilitation outcomes. Geomorphology 2019, 328, 93–107. [Google Scholar] [CrossRef]
- Lv, G.; Li, Y.X.; Ning, B.K.; Wei, Z.P.; Wang, D.H. Soil erosion process of platform-slope system of dump under heavy rain. J. China Coal Soc. 2021, 46, 1463–1476. [Google Scholar] [CrossRef]
- Hancock, G.R.; Crawter, D.S.; Fityus, S.G.; Chandler, J.A.; Wells, T. The measurement and modelling of rill erosion at angle of repose slopes in mine spoil. Earth Surf. Process. Landf. 2010, 33, 1006–1020. [Google Scholar] [CrossRef]
- Niu, Y.B.; Gao, Z.L.; Li, Y.H.; Lou, Y.C.; Zhang, S.; Zhang, L.T.; Du, J.; Zhang, X.; Luo, K. Characteristics of rill erosion in spoil heaps under simulated inflow: A field runoff plot experiment. Soil Tillage Res. 2020, 202, 104655. [Google Scholar] [CrossRef]
- Nyssen, J.; Vermeersch, D. Slope aspect affects geomorphic dynamics of coal mining spoil heaps in Belgium. Geomorphology 2010, 123, 109–121. [Google Scholar] [CrossRef] [Green Version]
- Ran, H.; Deng, Q.C.; Zhang, B.; Liu, H.; Wang, L.; Luo, M.L.; Qin, F.C. Morphology and influencing factors of rills in the steep slope in Yuanmou Dry-Hot Valley (SW China). Catena 2018, 165, 54–62. [Google Scholar] [CrossRef]
- Zhang, H.X.; Wang, Z.L. The influence of Shenfu-Dongsheng coal mining on river bed siltation and sediment load of Wulanmulun river. Res. Soil Water Conserv. 1994, 1, 60–71. [Google Scholar]
- Zhang, H.X. The characteristics of hard rain and its distribution over the Loess Plateau. Acta Geogr. Sin. 1983, 38, 416–425. [Google Scholar]
- Luk, S.H.; Merz, W. Use of the salt tracing technique to determine the velocity of overland flow. Soil Technol. 1992, 5, 289–301. [Google Scholar]
- Harvey, M.D.; Watson, C.C.; Schumm, S.A. GullyErosion; USDI Bureauof Reclamation: FortCollins, CO, USA, 1985; p. 181.
- Stefanovic, J.R.; Bryan, R.B. Experimental study of rill bank collapse. Earth Surf. Process. Landf. 2007, 32, 180–196. [Google Scholar] [CrossRef]
- Govindaraju, R.S.; Kavvas, M.L. Characterization of the rill geometry over straight hillslopes through spatial scales. J. Hydrol 1992, 130, 339–365. [Google Scholar] [CrossRef]
- Brayan, R.B.; Poesen, J. Laboratory experiments on the influence of slope length on runoff, percolation and rill development. Earth Surf. Process. Landf. 1989, 14, 211–231. [Google Scholar] [CrossRef]
- Slattery, M.C.; Bryan, R.B. Hydraulic conditions for rill incision under simulated rainfall: A laboratory experiment. Earth Surf. Process. Landf. 1992, 17, 127–146. [Google Scholar] [CrossRef]
- Zhang, B.; Xiong, D.; Su, Z.; Yang, D.; Dong, Y.; Xiao, L.; Zhang, S.; Shi, L. Effects of initial step height on the headcut erosion of bank gullies: A case study using a 3D photo-reconstruction method in the dry-hot valley region of southwest China. Phys. Geogr. 2016, 37, 1–21. [Google Scholar] [CrossRef]
- Stein, O.R.; Julien, P.Y.; Alonso, C.V. Mechanics of jet scour downstream of a headcut. J. Hydraul. Res. 1993, 31, 723–738. [Google Scholar] [CrossRef]
- Ni, S.M.; Feng, S.Y.; Wang, J.G.; Cai, C.F. Relationship between rill erosion morphology and hydraulic characteristics and sediment yield on artificial soils slope with different textures. Trans. Chin. Soc. Agric. Eng. 2018, 34, 149–156. [Google Scholar] [CrossRef]
- Guo, M.M.; Wang, W.L.; Shi, Q.H.; Chen, T.D.; Li, J.M. An experimental study on the effects of grass root density on gully headcut erosion in the gully region of China’s Loess Plateau. Land Degrad. Dev. 2019, 30, 2107–2125. [Google Scholar] [CrossRef]
- Larionov, G.A.; Bushueva, O.G.; Dobrovol’Skaya, N.G.; Kiryukhina, Z.P.; Krasnov, S.F.; Litvin, L.F. Effect of gravity on the erosion of model samples. Eurasian Soil Sci. 2015, 48, 759–763. [Google Scholar] [CrossRef]
- Rinaldi, M.; Mengoni, B.; Luppi, L.; Darby, S.E.; Mosselman, E. Numerical simulation of hydrodynamics and bank erosion in a river bend. Water Resour. Res. 2008, 44. [Google Scholar] [CrossRef] [Green Version]
- Robert, R.W.; Henrique, G.M.; James, R.R.; Sean, J.B.; Ronald, L.B.; Seth, M.D. An empirical investigation of gully widening rates in upland concentrated flows. Catena 2013, 101, 114–121. [Google Scholar] [CrossRef]
- Foster, G.R.; Meyer, L.D. Transport of soil particles by shallow flow. ASAE 1972, 15, 99–102. [Google Scholar] [CrossRef]
- Gordon, L.; Bennett, S.; Bingner, R.; Theurer, F.; Alonso, C. REGEM: The revised ephemeral gully erosion model. In Proceedings of the 8th Federal Interagency Sedimentation Conf (FISC), Reno, NV, USA, 2–6 April 2006; pp. 313–319. [Google Scholar]
- Zhang, H.; Gao, Z.L.; Niu, Y.B.; Li, Y.H.; Zhao, J.; Chen, Z.; Su, Y. A comparative study on relationship between rill morphology and sediment yield on slopes of two types of engineering mounds. Acta Pedol. Sin. 2020, 58, 115–127. [Google Scholar] [CrossRef]
Figure 1.
(a) Locations of the experimental soils; (b) The platform-slope system of spoil dump; (c) The gully developed on platform-slope system.
Figure 1.
(a) Locations of the experimental soils; (b) The platform-slope system of spoil dump; (c) The gully developed on platform-slope system.

Figure 2.
Runoff plot of platform-steep slope system.

Figure 3.
(a) Variation in gully length; (b) Variation in gully depth; (c) Variation in gully width; (d) Images of gully morphology on the platform in the stages of headcut-incision, headcut- expansion and stabilization, respectively.
Figure 3.
(a) Variation in gully length; (b) Variation in gully depth; (c) Variation in gully width; (d) Images of gully morphology on the platform in the stages of headcut-incision, headcut- expansion and stabilization, respectively.

Figure 4.
(a) Variation in gully depth; (b) Variation in gully width; (c) Images of gully morphology on the steep slope in the stages of A–layer incision, A–layer expansion, B–layer incision and stabilization, respectively.
Figure 4.
(a) Variation in gully depth; (b) Variation in gully width; (c) Images of gully morphology on the steep slope in the stages of A–layer incision, A–layer expansion, B–layer incision and stabilization, respectively.

Figure 5.
Temporal variations in flow hydraulics. Note: The red point represents the abnormal point of the hydrodynamic parameters after the collapse of gully sidewalls.
Figure 5.
Temporal variations in flow hydraulics. Note: The red point represents the abnormal point of the hydrodynamic parameters after the collapse of gully sidewalls.

Figure 6.
(a–c) represent the correlation matrices of hydraulics in the gully development process of headcut-incision, headcut-expansion and stabilization on the platform, respectively. V is flow velocity, ** represents p < 0.01, * represents p < 0.05.
Figure 6.
(a–c) represent the correlation matrices of hydraulics in the gully development process of headcut-incision, headcut-expansion and stabilization on the platform, respectively. V is flow velocity, ** represents p < 0.01, * represents p < 0.05.

Figure 7.
(a–d) represent the correlation matrices of hydraulics in the gully development processes of A-layer incision, A-layer expansion, B-layer incision, stabilization on the steep slope, respectively. V is flow velocity, ** represents p < 0.01, * represents p < 0.05.
Figure 7.
(a–d) represent the correlation matrices of hydraulics in the gully development processes of A-layer incision, A-layer expansion, B-layer incision, stabilization on the steep slope, respectively. V is flow velocity, ** represents p < 0.01, * represents p < 0.05.

Figure 8.
(a,b,e,f) are the linear fitting between SD and Fr and τ in the A-layer incision and B-layer incision; (c,d,g,h) are the linear fitting between SD and Re and ω in the A-layer expansion and stabilization. Note: The red point represents the abnormal point after sidewall collapse.
Figure 8.
(a,b,e,f) are the linear fitting between SD and Fr and τ in the A-layer incision and B-layer incision; (c,d,g,h) are the linear fitting between SD and Re and ω in the A-layer expansion and stabilization. Note: The red point represents the abnormal point after sidewall collapse.


Table 1.
Physical properties of experimental soil.
| Soil Type | Soil Particle Composition (%) | Soil Bulk Density (g cm−3) | Antecedent Soil Moisture (%) | ||||
|---|---|---|---|---|---|---|---|
| Sand (0.02–2 mm) | Silt (0.002–0.02) | Clay (<0.002) | Platform | Steep Slope | Platform | Steep Slope | |
| Sandy Loess | 67.815 | 17.545 | 14.640 | 1.42 ± 0.02 | 1.23 ± 0.02 | 13.75 ± 3.02 | 11.63 ± 2.63 |
| Clay loam | 42.721 | 33.089 | 24.190 | 1.55 ± 0.03 | 1.43 ± 0.02 | 18.57 ± 2.02 | 17.95 ± 2.34 |
Table 2.
Correlation of hydraulic parameters.
| Parameters | Fitted Equation of Platform | Fitted Equation of Steep Slope |
|---|---|---|
| Fr with ƒ | Fr = 0.492 ƒ−0.510, R2 = 0.996 ** | Fr = 2.195 ƒ−0.530, R2 = 0.900 ** |
| Fr with τ | Fr = 3.601 e−0.240τ, R2 = 0.549 ** | Fr = 36.59 τ−0.720, R2 = 0.500 ** |
| ƒ with τ | ƒ = 0.022 e0.453τ, R2 = 0.493 ** | ƒ = 0.006 τ1.293, R2 = 0.491 ** |
| Re with ω | Re = 3325 ω − 31.29, R2 = 0.998 ** | Re = 308.9 ω0.835, R2 = 0.826 ** |
** represents p < 0.01, * represents p < 0.05.
Publisher’s Note: MDPI stays neutral with regard to jurisdictional claims in published maps and institutional affiliations. |
© 2021 by the authors. Licensee MDPI, Basel, Switzerland. This article is an open access article distributed under the terms and conditions of the Creative Commons Attribution (CC BY) license (https://creativecommons.org/licenses/by/4.0/).
Share and Cite
MDPI and ACS Style
Bai, Y.; Guo, M.; Kang, H.; Wang, W.; Su, H.; Guo, W.; Ma, C. Morphodynamics of Gully Development on the Platform–Slope System of Spoil Dumps under Platform Concentrated Flow. Land 2021, 10, 1270. https://doi.org/10.3390/land10111270
AMA Style
Bai Y, Guo M, Kang H, Wang W, Su H, Guo W, Ma C. Morphodynamics of Gully Development on the Platform–Slope System of Spoil Dumps under Platform Concentrated Flow. Land. 2021; 10(11):1270. https://doi.org/10.3390/land10111270
Chicago/Turabian StyleBai, Yun, Mingming Guo, Hongliang Kang, Wenlong Wang, Huan Su, Wenzhao Guo, and Chunyan Ma. 2021. "Morphodynamics of Gully Development on the Platform–Slope System of Spoil Dumps under Platform Concentrated Flow" Land 10, no. 11: 1270. https://doi.org/10.3390/land10111270
Note that from the first issue of 2016, this journal uses article numbers instead of page numbers. See further details here.