
Urban Land Use Efficiency under Resource-Based Economic Transformation—A Case Study of Shanxi Province


1
School of Built Environment, University of Technology Sydney, Ultimo, NSW 2007, Australia
2
Faculty of Public Management, Shanxi University of Finance and Economics, Taiyuan 030006, China
*
Author to whom correspondence should be addressed.
Land 2021, 10(8), 850; https://doi.org/10.3390/land10080850
Submission received: 26 May 2021
/
Revised: 22 July 2021
/
Accepted: 10 August 2021
/
Published: 14 August 2021
(This article belongs to the Special Issue Reflecting on the Future of the Built Environment)
Abstract
:Shanxi, one of China’s provinces, has been approved by the State Council as the only state-level comprehensive reform zone for resource-based economic transformation in 2010. Consequently, the implementation of National Resource-based Cities Sustainable Development Planning (2013–2020) and The State Council on Central and Western Regions Undertaking of Industrial Transformation Guide were also introduced. As a result, many agricultural lands were urbanized. The question is whether the transformed land was used efficiently. Existing research is limited regarding the impact of the government-backed transformation of the resource-based economy, industrial restructuring, and urbanization on land use efficiency. This research investigates urban land use efficiency under the government-backed resource-based economy transformation using the Bootstrap-DEA and Bootstrap-Malmquist methods. The land use efficiency and land productivity indexes were produced. Based on the empirical study of 11 prefectural cities, the results suggest that the level of economic development and industrial upgrading are the main determinants of land use efficiency. The total land productivity index declined after the economic reform was initiated. The findings imply that the government must enhance monitoring and auditing during policy implementation and evaluate the policy effects after for further improvement. With the scarcity of land resources and urban expansion in many cities worldwide, this research also provides an approach to determining the main determinants of land use efficiency that could guide our understanding of the impact of the future built environment.
1. Introduction
Rapid urbanization and industrialization, supported by an extensive land use pattern, have resulted in land urbanization occurring significantly faster than population urbanization in China. From 2005 to 2015, the area of urban built-up areas in China increased from 32,221 km2 to 52,102.31 km2, with an annual growth rate of 5.47%. Meanwhile, the urban resident population increased from 562.1 million to 7711.6 million, with an annual growth rate of 3.38% [1]. Moreover, the inefficient use has coexisted with urban sprawl, which has exacerbated the tensions of the human–land relationship [2,3]. Concurrently, as in many other countries, countless negative effects have emerged in the development mode of urban expansion, including but not limited to the reduction of high-quality farmland and deterioration of the environment and ecosystems [4,5,6], as well as an increase in potential risks relating to food security [7].
Before the economic reform in China, resource-based cities played a significant role in their contribution to the nation’s wealth and local employment. Resource-based cities are cities dominated by extractive industries and heavy industry under a low-tech and extensive economic development model. They depend primarily on the exploiting and processing of natural resources, such as minerals, energy, or virgin forests [8]. In contrast, the economic activities of non-resource-based cities rely on textiles, electrical and electronics, transport equipment, and manufacturing. There are 262 resource-based cities in China according to the Plan of Sustainable Development for Resource-based Cities (2013–2020) [9], where 25 percent of the resource-based cities’ developments are derived from coal mining.
Previously, the central government has dominated the tax rules and distribution of resources. The State collects a major portion of taxes from the state-owned resource industry and sets an unfavorable price for the resource industry. Because of diminished revenue from unfavorable selling prices and tax collection, the local council was seriously deprived of funds for any development, leaving the local community exposed to potential risks from the damaged ecological system and vulnerability for its heavy reliance on employment by the resource-related industry [10]. Together with other centrally-designed strategic plans for the nation’s industry structure, the unfavorable pricing system led to an unbalanced and distorted industry distribution in China. Coastal cities and other energy-consuming heavy industries are the beneficiaries of such a low coal price policy. Studies have shown that coastal cities and eastern China are the regions with relatively high GDP outputs and higher land use efficiencies [10,11,12,13].
The use of natural resources is not sustainable as they are non-renewable. Resource-based cities have encountered more prominent land use problems, as land use is more extensive, and the ecological environment has deteriorated significantly [12]. The root cause of this result is a single energy-intensive, high-emission, and low-tech industrial structure formed by a long-term reliance on resource development [14]. Against this backdrop, the Chinese Government has recognized the importance of developing sustainable resource-based cities. As of 2000, the State started taking initiatives and measures, backed by a series of documentations and billions in financial aid, aiming to improve resource-based cities. The measurements include optimizing the industrial structure by cultivating replacement industries, such as biomedicine and smart manufacturing; recovering the destroyed land by mining into “ecological land”, such as parkland, woodland, grassland, lake, and marsh water surface to improve the living environment; and promoting the urbanization of mined-out and subsided areas through immigration relocation or centralized resettlement. However, the earlier preliminary studies have shown that economic transformation is effective in addressing the conflict of land use and economic development, resulting in a protected and restored ecological environment [10]; the impacts of economic transformation policies on land use efficiency need further testing.
Land use efficiency is an economic concept. From an economic perspective, land supply is inelastic. Improving land use economic efficiency can be interpreted as either the incensement of economic output while maintaining the same land input for economic activities or keeping the same economic output with a lowered land input for economic activities. On the other hand, the rapid progress of urbanization on a global level has seen land use efficiency become an even more pressing worldwide issue for all developed, developing, and underdeveloped countries due to the scarcity of land. From an international perspective, a wide range of policies and regulations has been developed to improve urban land use efficiency and manage urban sprawl. Developed countries, represented by the United States and Europe [15,16,17], have adopted government intervention measures. Some examples are zoning ordinances and urban planning, smart growth by increasing the development density and curbing urban sprawl [16], and spatial planning towards compact urban forms to manage urban growth effectively [17]. They have also established tradeable land development rights to improve land use efficiency [18]. Similarly, a series of policies have been introduced and implemented for managing land use in recent years in China, including cultivated land protection policies [19,20], land use planning, and the allocation of a construction land quota. More toolkits have been introduced to enhance land use efficiency in urban built-up areas, including industrial upgrading policies and urban renewal patterns. Some examples are the reconstruction of “three-old” (old town, old factory house, old village house) in Guangzhou and urban renewal in Shenzhen. However, urban land use efficiency is not only a response to land use management policies and measures, it is also the result of the joint effects of resource endowment, economic development level, industrial structure, and population. The constant land depletion could cause land damage problems, such as collapses, landslides, mudslides, ground subsidence, ground fissures, open pits, and mining pits, and land occupation problems, such as waste rock (soil, slag) yards, coal gangue piles, tailings ponds and industrial squares. The above-mentioned problems cause damage to the topography and landscape and have a serious impact on the land’s function. It is thus important to understand the impact of land use efficiency and the integration of economic, environmental and societal impacts that land use changes have on sustainability.
In recent years, the evaluation of urban land use efficiency and the identification of driving factors responsible for urban land use change has attracted more attention from scholars of various countries. Zitti et al. [21] have examined the direction and intensity of metropolitan growth in post-war Athens, analyzing development drivers using regression models based on 13 indicators. Valerio et al. [22] have studied the pace and dynamics of urban expansion in the Metropolitan City of Rome. Abdullahi et al. [23] have evaluated and forecasted the residential development of Kajang City in Malaysia based on compact development. The investigation of efficiency and drivers of urban land use in China appeared in different research scales—such as national, city circle, provincial, or single cities—and have focused on the construction of an evaluation index system, evaluation method, and analysis of efficiency difference [2,24,25,26]. An evaluation index system is usually constructed using the input-output indicators of the economy, society, and environment. The key indices include investment intensity, labor, financial expenses, urban land release, and economic output. The data envelopment analysis (DEA), a nonparametric frontier approach, has been widely used to model and analyze land use efficiency because it has the advantage of consolidating all relevant indicators into one overall indicator to support a more comprehensive performance comparison. Recently, DEA has been extended to the stochastic production function with improved measurement accuracy, the Malmquist index analysis, and Bootstrap-DEA [27]. The indicators and methods of previous research provide a good foundation for the following research. However, little research has been conducted on urban land use efficiency throughout the resource-based economic transformation. Further, there is a lack of information concerning a targeted evaluation index system. Therefore, developing an index system and tool for measuring urban land use efficiency in a resource-based economy transformation is worthwhile.
This paper studies the impact of urban land use efficiency on the resource-based economy under the transformation period. The research further explores the main influencing factors of a resource-based city in the context of economic transformation. Cities in the Shanxi Province, China, are selected as a case study since most have developed a single industrial structure dominated by coal mining and coal chemical industries. Coal mining has resulted in undesirable land use consequences, such as mined-out subsidence areas, soil contamination, land occupation, and industrial and mining wasteland.
In November 2010, Shanxi Province was approved by the State Council as the only state-level comprehensive reform zone for resource-based economy transformation in the country. Under the premise of protecting and restoring the ecological environment, Shanxi Province was allowed to conduct a series of reforms in various fields, including systems and mechanisms, to promote emerging industries, organic clusters and networks, and enhance economic vitality. In 2017, the State Council further emphasized the economic transformation reform, putting forward suggestions for deepening Shanxi Province’s transformation reform. The aim was to explore a new road of transformation, upgrade innovation-driven development, and form a scalable and replicable experience. This research is significant for the government’s understanding of the effects of implementing economic transformation policy and the factors that affect land use efficiency. The research findings can be used for guiding the planning of land for urban development.
We began developing the input–output indicators according to the goals of resource-economy transformation using the Bootstrap-DEA and Bootstrap-Malmquist index for measuring urban land use efficiency before and after the resource transformation reform. Further, we analyzed dominant factors affecting the changes in urban land use efficiency.
The remainder of the paper is organized as follows. Section 2 introduces the methodology and data consisting of the input-output indicators selected, Bootstrap-DEA, and the Bootstrap-Malmquist index for measuring urban land use efficiency. Section 3 uses the approach described in Section 2 to conduct an empirical study on the change of urban land use efficiency in Shanxi Province from 2006 to 2015. In Section 4, a regression model using panel data is employed to analyze the main determinants that may influence urban land use efficiency. Section 5 concludes this study.
2. Methodology and Data
Urban land use efficiency is an important indicator for measuring the efficient allocation, operating status, and management level of urban input resources. The theoretical framework of land use efficiency concerns an application in economic analysis for comparing the alternatives of recourse allocation doing business and, an analysis of environmental and ecological systems to ensure the protection and the renewability of valuable land resources [28,29,30]. The efficiency is usually explained by the changes in effect compare the land use related activities to the changes in resources consumed to produce the effect. The study of land use efficiency aims for decision-making to optimize business operations and improve the management of land units.
Despite qualitative methods and the cost–benefit analysis method, input–output analysis using the Malmquist index and Bootstrap-DEA [27] is widely used to assess, analyze, and model procedures related to land use. The efficiency is measured by examining whether a maximum output could be achieved by a given mix of inputs (i.e., technical efficiency). The input–output analysis also addresses the issue when it is impossible to increase the output without increasing inputs (i.e., technological efficiency).
We selected a combination of Bootstrap-DEA, Bootstrap-Malmquist indices, and a panel data model with Hausman test regression analysis to derive the scores of land use efficiencies and a land productivity index, which was then further refined into a technological change index and technical efficiency change index. This was done to facilitate a robust and comprehensive analysis of land use efficiency and its relationship with some external explanatory variables, such as the level of economic development, government spending, industrial upgrading, industrial reconstruction and urban population.
2.1. Data Envelopment Analysis
The data envelopment analysis (DEA) is a linear programming methodology that measures the efficiency of multiple decision-making units (DMUs) when the production process presents a structure of multiple inputs and outputs [31], which can deal with multiple inputs and outputs simultaneously and does not require any prior information on the theoretical framework of the production function [32]. In this study, the input-oriented data envelope analysis (DEA) is used to measure the urban land use efficiency of each city at a certain period since the control input is more feasible in this field. Suppose that each city is a decision-making unit (DMU)—each , demands m inputs , to generate s outputs at t period. The piecewise linear production technology can be defined as follows to determine the kth of DMU at the time t:
where denotes the non-negative multiplicative vector of inputs and outputs; t (t = 2006, …, 2015) denotes the year denotes the slack variables of inputs and outputs, respectively. Further, θ denotes the efficiency of DMU estimation, and denotes non-Archimedes infinite small amount in the model, which is 10−4.
When θ = 1, the DMU is at a perfect and efficient position on the production possibility curve. When θ < 1, the DMU is inefficient, and it is necessary to modify the input-output structure.
2.2. Malmquist Indices
We applied the Malmquist productivity index to construct an urban land use efficiency model for the application purposes to study the changes of urban land use efficiency over time. The Malmquist productivity index, first pioneered by Caves et al. [33], relies on distance functions. Färe et al. [34] further developed it by considering technical inefficiency in productivity measurement. The Malmquist index derived from DEA has been widely employed to evaluate productivity growth assessment and its decomposition into technological change and technical efficiency change [35] in many fields. Some examples of the empirical studies were financing and banking [36], farming [37], IT systems [38], environmental studies [39], and other areas. The method is relatively easy to compute and does not require formational form assumptions and price information. One of the pitfalls is that it can only serve binary comparisons since it does not verify the transitivity property [40]. In recent years, its application for evaluating land use efficiency can be found in literature [2,24,25,26,40]. In this paper, the input-oriented DEA-CCR (the CCR model is based on the assumption that the constant return to scale exists at the efficient frontiers) and Malmquist productivity indices are adopted for the sample of cities used here.
2.3. Malmquist Indices Model for the Efficiency of Land Use
Taking Shanxi Province as a decision-making system, each of the 11 prefectural-level cities is a decision-making unit, represented by . In each at time t, there are m inputs and s outputs . From t1 to t2, the Malmquist indices formula in concerning the input-output is described as follows:
where in (2), indicates the Shepard distance function between the combination of input-output factor to the frontier at time t1 to t2, , are defined in the same way under the constant scale of the decision-making unit ; and measures changes in productivity for from t1 to .
According to Worthington [36], productivity improvement over time can be measured by technical efficiency improvements (∆E) or technological improvement (∆T). Technical efficiency is the ability to use a minimal amount of input to make a given output level, whereas technological changes measure the ability to combine inputs and outputs optimally. As a result, the performance of changes in productivity can be further broken down into two parts—changes in efficiency and technological change —which can be described in Formula (3):
or
where in (3) and (4), denotes the extent of efficiency change to the frontier from t1 to t2, representing the change in technical efficiency. Further, denotes the extent of technological change to the frontier from t1 to t2, reflecting the technological change. This research method has been applied to many applications, including the assessment of the productive performance of countries [41], financial institutions [42,43], manufacturing industries [44], and the like.
2.4. Bootstrap-Malmquist Method for the Correction of Urban Land Use Efficiency
Both the traditional DEA and Malmquist models are based on the observed finite samples. The estimated results are subject to sampling variation sensitivity [27,45]. With this in mind, the Bootstrap method is an improved resampling technique; a replacement sample data pool is created by stimulating the formation process of the original sample. This is used for a serious repeatable preformation of statistic calculations, such as the significance test, the original sample empirical distribution, and corrections to the original means and deviation [46].
Based on the principle and method of the Bootstrap-Malmquist method proposed by Simar and Wilson [47], the Bootstrap-Malmquist technique for measuring the efficiency of land is established as follows:
(a) In the original data pool for , the Malmquist indices estimate , , n;
(b) Based on Simar and Wilson [47], the proposed binary Kernel density and Reflection method, the Bootstrap resampling technique is used to obtain a combination of input-output replacement samples from the decision-making unit:
(c) The multivariate linear programming model for solving the pseudo-sample distance function is shown in (6):
where
Based on resamples , we must solve (6) deepening Shanxi Province’s transformation reform, from distance function , and derive Bootstrap estimates . We must change the corresponding factors in (6) at the same period to reconstruct the model and repeat these procedures to solve the equation. The remaining distance function Bootstrap estimates are derived , .
(d) The Malmquist indices Bootstrap estimate is calculated by applying Bootstrap estimates.
(e) Repeating steps (b–d) B times (B = 2000) results in B times of estimate . According to research by [48], if 2000 sampling times of B are obtained, they should ensure a guaranteed coverage of confidence intervals.
A smooth distribution of Bootstrap-Malmquist indices was obtained by adopting the above steps, which were used to replace the original data distribution. Therefore, corrections for deviations to the original Malmquist index can be made using to construct a confidence area at a 5 percent and 10 percent significant level, respectively, followed by a further examination of productivity significance. With the same principles applied, values for technical efficiency change and technological changes can be derived using the same confidence intervals.
2.5. Selection of Variables and Indicators, and the Source of Data
In this paper, 11 prefecture-level cities in Shanxi Province were selected as units for decision-making and analysis including Taiyuan, Datong, Yangquan, Changzhi, Jincheng, Shuozhou, Jinzhong, Yuncheng, Zhangzhou, Linyi, and Luliang. From 2006 to 2015, the year 2010 was chosen as the reference point, at which the State Government initiated the comprehensive reform.
For the state-initiated economic reform policies with financial aids for the resource-based cities, it set major tasks, such as the establishment of long-term incentive measures for sustainable development; the cultivation of alternative industries; the need to solve social problems with a focus on employment; the enhancement of environmental treatment, and ecological system protection; and the reinforcement of the resources survey and mineral rights management.
Therefore, the following input–output variables that measure urban land use efficiency were selected in the model to assess the effectiveness of government reform initiatives, concerning optimizing the ecosystem, industrial upgrading, and industrial restructuring.
Land, capital, and labor were nominated as input variables in non-agricultural industries that impact urban economic benefits and the change of ecologic environment. These input variables can be quantified individually as areas of urban construction land, fixed-capital stock of secondary and tertiary industries, and the number of people employed in secondary and tertiary industries. The added value of secondary and tertiary industries, and the green coverage rate of built-up areas, were chosen as output indicators, measuring urban economic output and ecologic output. Table 1 depicts the details.
The urban construction land area and the green area coverage rate of the built-up areas were sourced from the China Urban Construction Statistical Yearbooks from 2007 to 2016. Others were sourced from the Shanxi Statistical Yearbooks from 2007 to 2016, covering fixed assets investment, employed persons, and added value. All relate to the secondary and tertiary industries, with an additional fixed-asset investment price index and price reduction index. Supplementary data in case of incomplete data were sourced from local city yearbooks or statistical bulletins.
Data Processing
The fixed capital stock of the secondary and tertiary industries is estimated by the perpetual inventory method. The calculation formula is
where , are the fixed capital stocks of j city at the years t and t − 1, respectively. δ is the depreciation rate concerning the recommended value calculated by Zhang et al., [49], which is set at 9.6%. is the investment value of fixed assets of the secondary and tertiary industries for each individual city at the time of t year (price at the year of t). is a calculated fixed-asset investment price index with a baseline starting from 2005. The determination of the baseline concerning the fixed-capital stock in 2005 can be referred to as the inter-provincial fixed-capital stock calculated by Zhang et al. [49]. This derives the total fixed-capital stock of the whole society in Shanxi Province in 2000 (the current year’s price level). Furthermore, the total social fixed-assets investment in 2001–2005 was used to apply the perpetual inventory method. The total fixed capital stock of the whole society in Shanxi Province in 2005 (remaining the constant price level of 2000) was calculated and subsequently restored to the year 2005 price level. Based on this, the weighing of the added value of the second and tertiary industries in Shanxi Province in 2005 was multiplied by the fixed-capital stock of the whole society, resulting in the derivation of the fixed-capital stock of the secondary and tertiary industries in Shanxi Province. Further derivation of each chosen city’s added value of the secondary and tertiary industries is then calculated by its weighting in the province. Similar weighting principles can be repeated to derive the fixed capital stock in the secondary and tertiary industries in the base period for each city. The secondary and tertiary industries’ value added was reduced to the constant price level of 2005 using the price reduction index.
3. Empirical Results and Discussions
The percentage increase of input variables, such as the area of urban construction land, fixed-capital stock for the secondary and tertiary industries, and the number of people employed in the secondary and tertiary industries, are given in Figure 1. The percentage increase of output variables, such as the value added by the secondary and tertiary industries and the percentage of green coverage of the built-up areas, are shown in Figure 2.
It is clear that there is a 300–800% increase in investments into the fixed-capital stock for the secondary and tertiary industries among the cities. The area for urban construction increased from 20% to 100% in 2015 from 2006. Meanwhile, the number of people employed by the secondary and tertiary industries show variations among cities, with 500,000 more people employed in 2015 above the 1.4 million in 2006 for Taiyuan. Figure 2 shows a clear increase from 50 to 200% for value added, with a reduction of 7%, and various increases of up to 180% for the green coverage of built-up areas.
3.1. Differences in Scores of Land Use Efficiency between Cities
Based on the DEA-CCR and Bootstrap-Malmquist models, MATLAB’s DEA analysis tool was used to calculate the Bootstrap-DEA scores of urban land use efficiency, the values of Malmquist indices, the value of Bootstrap-Malmquist indices, the decomposed values of Bootstrap technical efficiency change, and the technological change. The Bootstrap-DEA results appeal different ranges from 0.688 to 0.868, as shown in Table 2, by studying the urban land use efficiency of 11 cities in Shanxi Province between 2006 and 2015. The higher the score, the higher the economic outputs and more green area coverage, thus increased land use efficiency.
Further studies were conducted to evaluate the impact of comprehensive reform on the changes in urban land use efficiency for the chosen 11 cities (refer to Table 3). The estimated results indicate that the estimations of most cities are statistically significant as presented for the significance level at 10% or 5%.
The comprehensive reform was introduced in 2005. Therefore, comparisons of the calculated average scores of land use efficiencies for each of these cities were made between the two periods (i.e., before [2006–2010] and after [2011–2015]). The widened range of the average scores of land use efficiencies among the cities for the two periods is revealed in Figure 3. Four cities (Taiyuan, Yangquan, Changzhi, and Jincheng) have improved their land productivities during 2011–2015. Other cities have reduced their average scores of land use efficiencies after the comprehensive reform.
Note that cities with higher improved average scores of land use efficiencies, such as Taiyuan and Yangquan, generally have a larger increase of value added in the meantime, with a relatively smaller increase of investment in the fixed stock. This effect is vice versa for cities such as Xinzhou, Linfen, and Yunchong, where a drop in land use efficiency is presented.
Figure 4 shows the trend of overall (average) score of land use efficiencies for the total of studied cities in Shanxi Province during 2006–2015. The overall land efficiency scores are marked with a declining trend from 2005 to 2010, then an uptrend after 2010. This finding coincides with Pu et al. [50] who studied industrial land use efficiency in Hunan province. Over the studied period, economic events occurred, such as fluctuations in coal prices, coal demands, and the introduction of economic reform. Nevertheless, the combined factors have inevitably impacted the level of land use efficiency in the area. Further regression analysis on what factors have had a significant impact on the score of land use efficiency is to be demonstrated later in the paper.
3.2. Identifying Trend Changes in Land Use Efficiency
The results demonstrated in Section 3.1 show that the estimated value of urban land productivity in the chosen cities during the observation period is significant in most cases. However, the number of cities and years in which the Malmquist index value is greater than 1 is relatively few, indicating the scarcity of cities and years in which the urban land productivity has increased from the previous year. In fact, the overall level of urban land productivity has declined, especially after the comprehensive reform.
Further decomposed values of Bootstrap technical efficiency change and the technological change derived from the urban land productivity are shown in Table 4 and Table 5 to identify the reasons for the declined urban land productivity.
The results of Table 4 indicate there is no clear pattern before 2011 concerning the values of technical efficiency change of urban land use in Shanxi Province as the pattern fluctuates with alternative upward and downward trends. However, the pattern becomes clear after 2012, with an overall rising trend. Therefore, based on the characteristics of industrial structure dominated by coal production in Shanxi Province, comparison studies were carried out between the technical efficiency changes of urban land use with the coal price factor in the same period. It is found that before 2011, the fluctuation of the technical efficiency change of urban construction land highly coincided with the fluctuated trend of coal prices. This finding suggests that the heavy-weighted coal-based industrial structure during this period could be the significant factor determining the technical efficiency of urban land use. However, in 2011, comprehensive reform on the transformation of the resource-based economy was initiated in Shanxi Province, adversely impacting the coal price. The average price of standard coal dropped from 1260 Yuan/1000 kg at the end of 2011 to 780 Yuan/1000 kg in 2015 [51]. Another important comprehensive reform commenced from 2013–2015, focusing on prompting the transformation of the coal-based economy to an energy-efficient economy. Notably, since 2011, urban land technical efficiency changes in various cities show an overall upward trend; this is especially true from 2013–2015, in which the energy-efficient economy reform was promoted. This finding suggests that the reform from a coal-based economy to an energy-efficient economy has enhanced the improvements of technical efficiency in land use.
The results in Table 5 illustrate that the technological changes in urban land use in Shanxi Province fluctuate with ascending and descending trends before 2011. However, thereafter, a clear declining trend emerges as the values of technological changes drop year by year for all the studied 11 prefectural-level cities, without exceptions. In the meantime, background studies were conducted to analyze the economic status of ShangXi Province. From 2006 to 2011, major programs focusing on the restructuring and integration of the coal industry were in operation [52]. However, there was no material change concerning the predominantly coal-based industrial structure. The fact that change of ownership due to restructuring and integration could harm the industry’s stability, with likely consequences of deterring investors from investing in the industry was apparent. Despite the favorable market condition of coal price, it was evident that preference in the industry was to expand production capacity over technology advancement. Hence, technological improvement was not significant.
From 2012 to 2015, market conditions for coal prices became unfavorable. A series of reforms took place in Shanxi Province, including industrial restructuring, a reduction in raw coal production capacity, extensions to the coal industry chain via focusing on the deep processing of coal, coal–electricity integration, and the development of coal gas [53]. The reform aimed to enhance the improvement of production technology and industrial upgrading. The initial results were positive. However, a minimal impact was expected due to the replacement industries (e.g., tourism and modern logistics) still being in their infancy. At the same time, new strategically important industries, such as modern manufacturing coupled with information technology and industrialization, were still in the planned initial construction stage, with no production ability. Further, the frontiers of the input-output portfolio did not move forward over this time.
In summation, under the background of comprehensive reform, as mentioned above, there are signs of relatively improved technical efficiency of urban land throughout the observation. However, it is still at the early stages of the learning curve, and it is expected that a longer period will be required for the potential impact to occur for the technological progress. This is in agreement with conclusions made by previous relevant research [10] that the economic reforms are not costless. This is especially true when it bears considerable costs at its initial stage [54]. Therefore, further studies are needed to appropriately appraise the extent of the impact that will improve land use efficiency by industrial upgrading and industrial restructuring reform. The sample size employed 11 cities in Shanxi as a case study, which could be a limitation. Further research should collect more data to verify the results of this research.
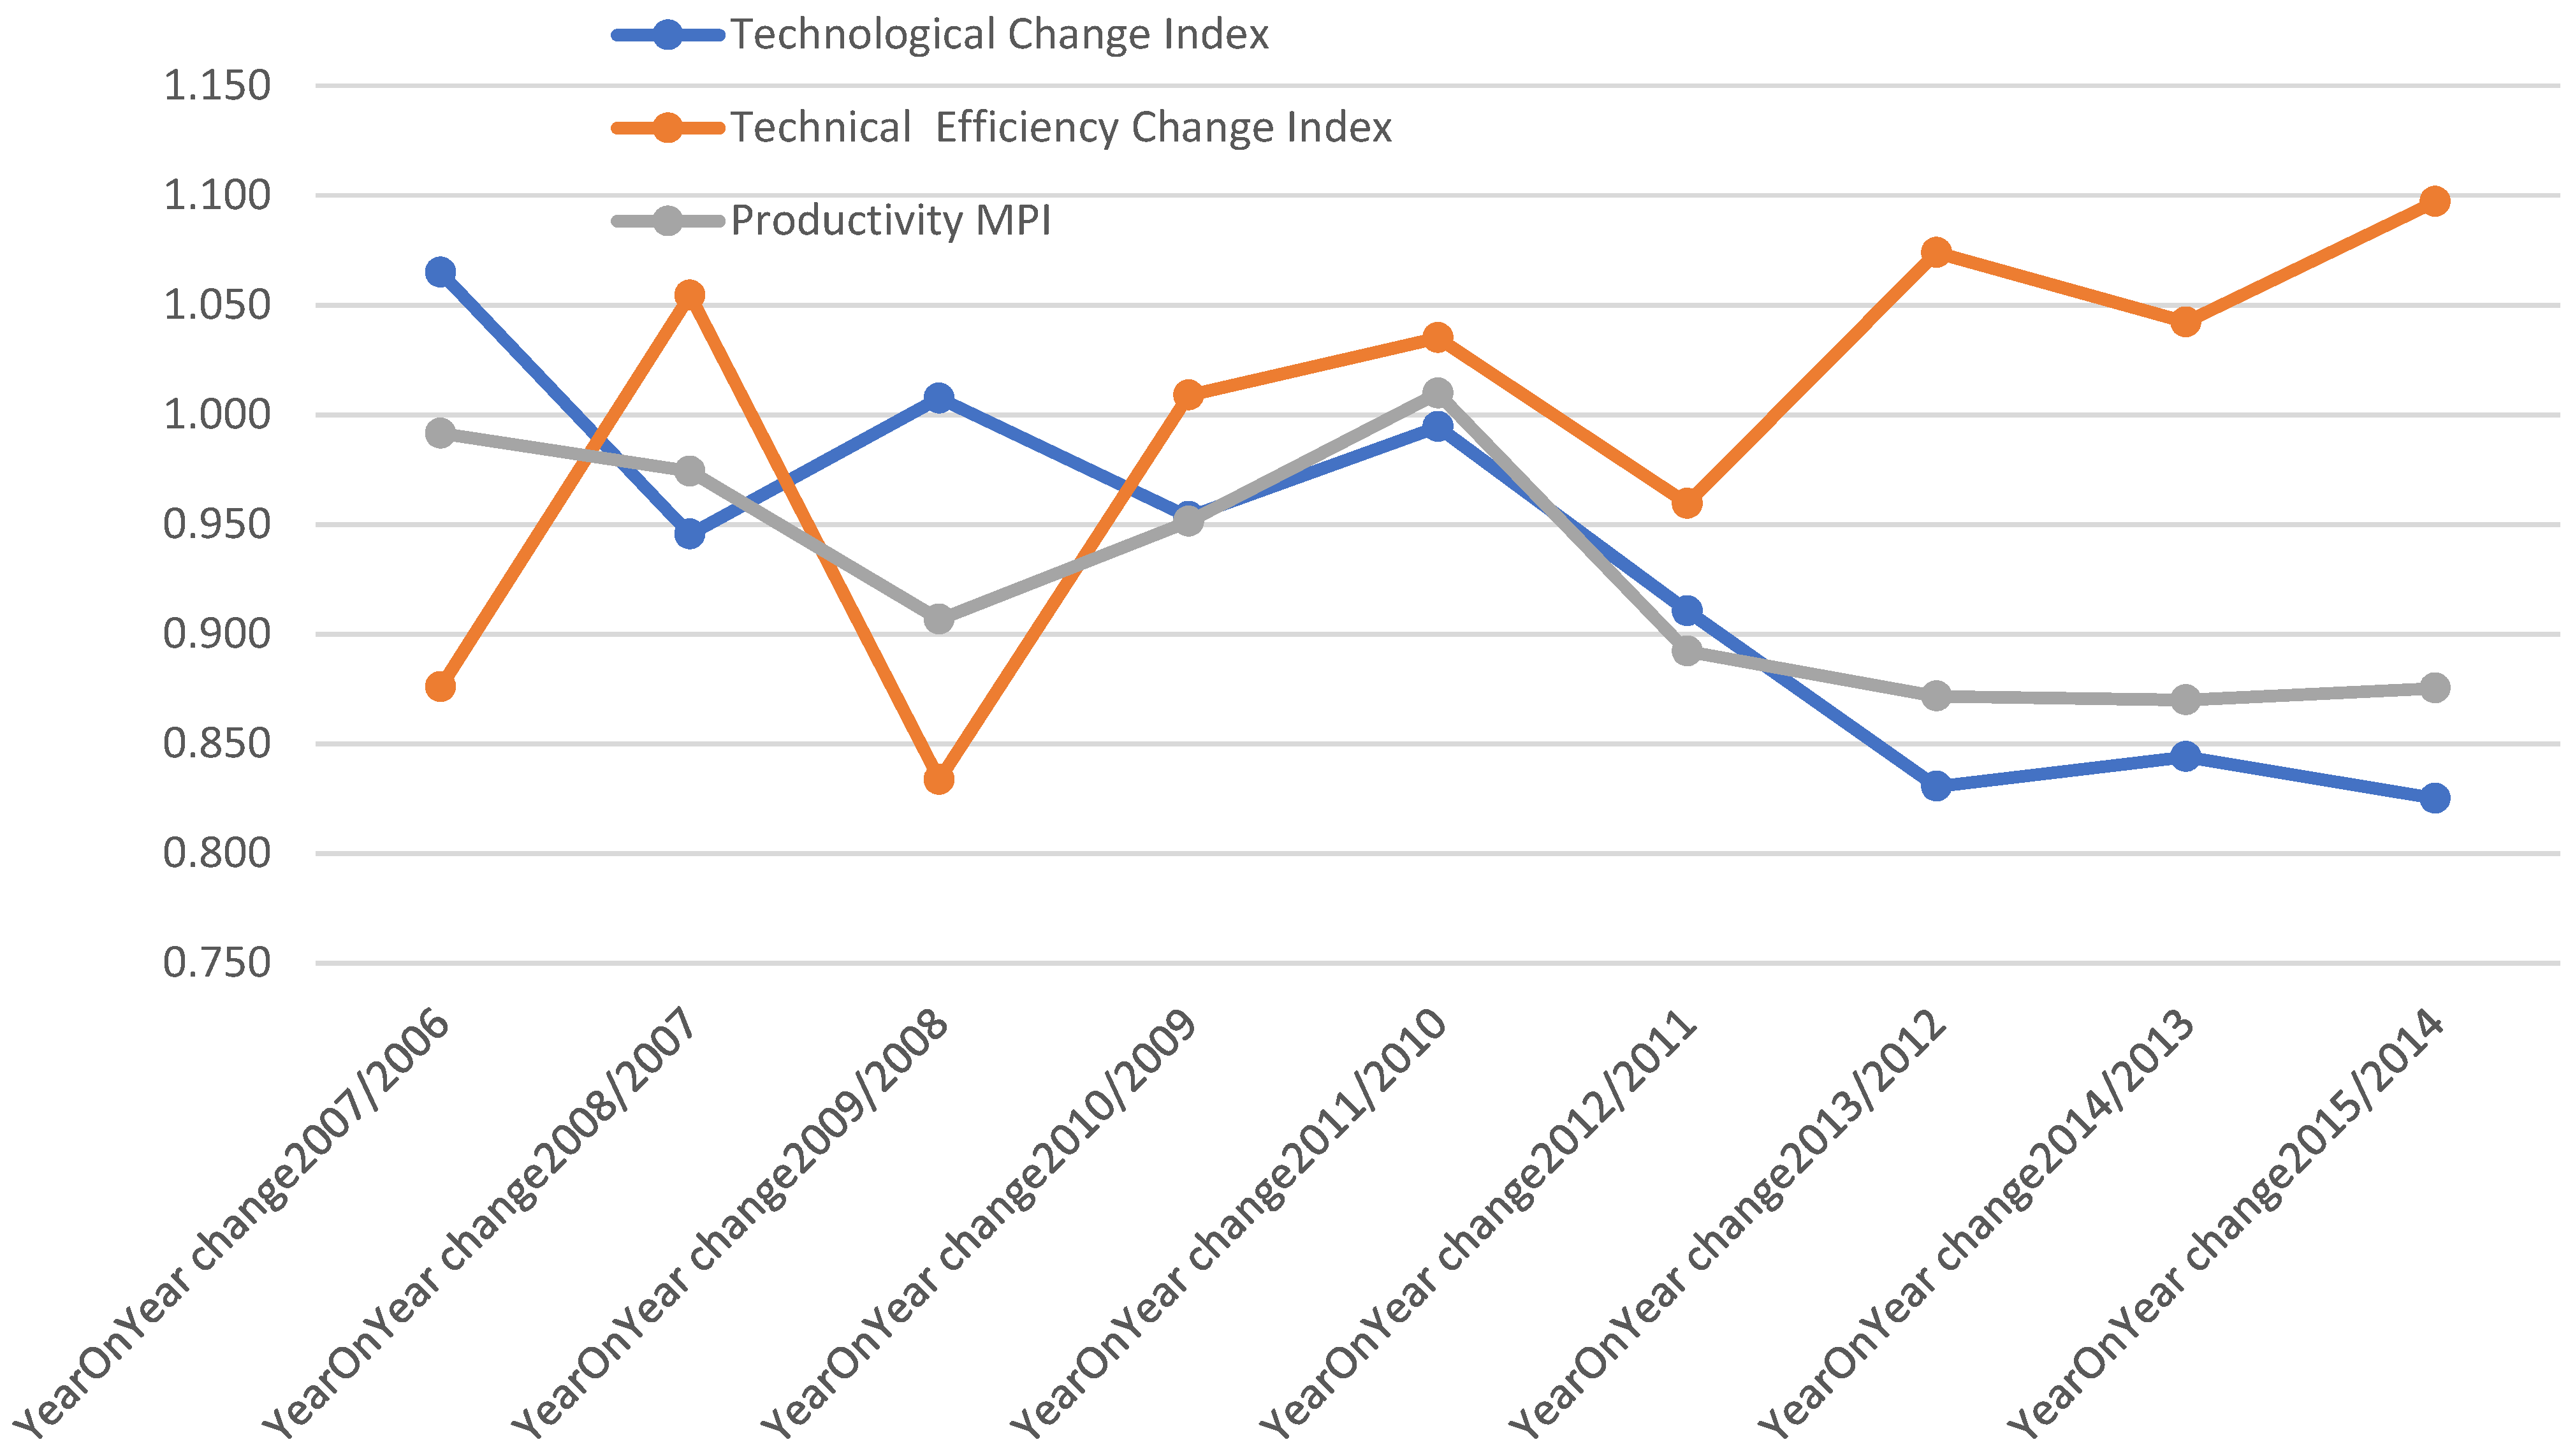
Figure 5 presents the trends of an overall (average) year-on-year change of the Malmquist productivity index (MPI), the technological change index and the technical efficiency change index for the total studied cities during 2006–2015. It shows a negative correlation between the score of land use efficiency (Figure 4) and technological change (Figure 5) after 2011. However, it displays a positive correlation between the score of land use efficiency and technical efficiency change between 2005 and 2015. The fact that the fluctuation of total land productivity coincides positively with the pattern of technological change suggests the importance of technological advancement, although the area will benefit from assistance provided by government funds and transfers of payment [10]. Still, there is a need to examine the efficiency and effectiveness of funds utilization closely. In particular, it is recommended that future focus should be directed towards improving technologies.
4. Analysis of Factors Affecting Land Use Efficiency Change
Relevant research shows that urban land use efficiency is influenced by many factors, such as the level of urban economic development status, industrial structure, level of urbanization, and government management [24]. The econometric regression analysis method was used to identify the main factors affecting the change of urban land use efficiency in Shanxi Province.
4.1. The Explanatory Variables, Source of Data, and Construction of Panel Data Model
The Bootstrap scores of the land use efficiency in each city were treated as explanatory variables, which LE represent. Considering the transitional characteristics of the resource-based economic transformation in Shanxi Province, there were five major aspects selected for close examination: the level of economic development, industrial upgrading, industrial restructuring, the level of urbanization, and potential government influence on economic transformation. The explanatory variables were quantified, including the level of economic development (GDPP), represented by average GDP per head of the prefectural city (10,000 Yuan/person); level of industrial upgrading (CP), represented by coal consumption per unit of GDP (1000 kg of standard coal/10,000 Yuan in GDP), a reverse index to be modified into a positive indicator by using the reciprocal method; industrial restructuring (IS), represented by the weighing of the added value generated by the tertiary industry to the regional GDP; the urbanization level (UPL), represented by the proportion of the urban population to the number of residents living in the prefectural-level city; and government influence (GOV), represented by the ratio of budgeted government expenditure to GDP for the fiscal year. The raw data of the above variables were sourced from the Shanxi Statistical Yearbook (2006–2016).
A regression analysis model was constructed using panel data from 2006 to 2015. First, the Hausman test was conducted to test the hypothesis of the random effect model, with test results rejecting the random-effects model. Further efforts were made by establishing the fixed effect model, subsequently followed by performing the redundant fixed effect test. It was found that these test results accept the individual fixed-effects model. The model was constructed as follows:
where indicates the economic efficiency of the construction land for the city i in the year t. Further, the main explanatory variables , , , , , and indicate the level of economic development, industrial upgrading, industrial restructuring, urbanization, and potential government influence, respectively, for the city i in the year t. C is the common intercept term and is the individual difference; in the model, the intercepted item for each city shows its irrelevance to the change of time. It is challenging to observe and reach a conclusion on how and to what extent the selected variants can impact land use efficiency due to the complexity and individuality of each city. is a random error term.
4.2. Results and Analysis
Figure 6 shows the percentage increase of explanatory variables, such as GDPP, coal consumption CP, IS, GOV, and UPL, from 2006 to 2015.
As for GDPP, it had an increase of 50–150% for all cities, with Taiyuan achieving the highest GDPP of 48,000 Yuan per capital and Xinzhou have the lowest of 16,000 Yuan per capital in 2015. On the other hand, a reduction of coal consumption of between 7% and 65% for all cities was observed. Linfen had the highest consumption of coal at 4200 kg per 10,000 Yuan GDP generated in 2006, with 2600 kg for Taiyuan being the lowest. Both cities improved by 2015, with 2200 kg for Linfen and just 1000 kg for Taiyuan. In regard to the change of value added by the tertiary industry, there was an increase of 20% (Taiyuan) to 60% (Shuozhou). The percentage of value added by the tertiary industry to GDP varied among those studied cities, with the highest being 61% for Taiyuan in 2015, which increased from 50% in 2006. In contrast, Luliang had the lowest percentage of 26% and 37% in 2006 and 2015, respectively. As for the government influence factor, the percentage of government spending to GDP had increased up to 130% for Xinzhou and 50% for Taiyuan, with little variation for Jincheng and Shuozhou. The percentage increase of the urbanization level varied between 9% (Taiyuan) and 43% (Yuencheng) among the 11 cities, with Taiyuan at 81% and 84% for 2006 and 2015, respectively—the highest level for an urbanized city. Luliang was among the lowest urbanized cities, with 33% and 46% for 2006 and 2015, respectively.
The estimates using EVIEWS9.0 software for the random-effects model (model I) and the individual fixed-effects model (model II) are shown in Table 6. The Hausman test results reject the random effect model, indicating the existence of an individual or time difference. Further tests followed on the constructed individual fixed-effects model (model II). The redundant fixed-effects test showed the following: statistic value for F at 6.75, which is significant at the 1% significance level. Therefore, test results from the individual fixed-effects model (model II) suggest a reasonable fit with the regression analysis that the F statistics are significant, and the hypothesis is found to be true.
According to the regression results of model II using the Hausman estimator, the determinants for the changes in urban land use efficiency in Shanxi Province are analyzed as follows.
First, the economic development level coefficient expressed as GDPP at 0.056 was positive and significant (at 5%), indicating that the level of economic development improves urban land use efficiency. It is suggested by Chen et al. [11], Sun et al. [12], and Yang et al. [13] that the urban economic agglomeration effect and the scale of urban economy effect could have played an important role in improving land use efficiency. Their studies found that Western cities tend to have relatively low land use efficiency and discovered higher land use efficiency for eastern areas, aligning with the distribution of economic development in China.
Second, the output per unit energy consumption coefficient expressed as CP at 0.301 was positive and significant (at the 1% level). The upper grading of basic industrial structure in Shanxi Province, especially with the predominance of coal and heavy industry structure and the comprehensive reform focusing on introducing energy-efficient technology and general improvement of industrial technology, has inevitably contributed to the increase in land use efficiency.
Third, the industrial restructuring (IS) coefficient was derived with a positive value of 0.0046 at the significant level of 10%; nevertheless, the low coefficient value indicates that the impact from the service industry was minimal for land use efficiency. Research results on the formulation of the third industry within the province suggest that traditional services—such as wholesale and retail, transportation and warehousing, real estate, and the like—are still the major players, although the weighting of the financial industry is rising year by year. Nevertheless, the weighting added by recent technological development in the service industry, such as information transmission, software, and IT services, is still comparatively low, with its highest contribution towards the tertiary industry achieved at 6.8% in 2015. Therefore, for contribution improvement by the third industry, the focus should be directed towards increasing the weighting of the latest technology developments in the tertiary industry. This holds the key to enhanced land use efficiency [11,13].
Fourth, the urban population level (UPL) coefficient was found to be negative at a non-significant value of 0.007, indicating that the level of population urbanization in the province has yet to form a population agglomeration effect. Additionally, its impact at its current stage is negligible on urban land use efficiency. Further investigation of the urban population density in Shanxi Province demonstrates the existence of differentiation in the population density change. The cities with a decreasing urban population density during the observation period are Datong, Yangquan, Yuncheng, and Linyi. This is especially true for the case of Datong; its urban population density as the number of people per km2 was reduced to 9492 in 2015 from 13,134 in 2006. The contributing reason could be a rapid expansion of land urbanization by enlarged urban areas in some cities, which lag behind in population urbanization. This could lead to a decline in urban land use efficiency.
Last, the government influence (GOV) coefficient was positive at 0.0047 with a significance level of 5%. The Provincial Government has adopted financial interventions to accommodate industrial agglomeration, such as capital investment in improving urban infrastructure construction, financial subsidy policies to support industrial development, industrial upgrades and technological transformation, and establishing a specially-designated park construction zone. This proves to have positively impacted land use efficiency.
5. Conclusions
This study has provided a checkpoint for the policy assessment and guidance for government policy-makers to further enhance the competitiveness and sustainability of the province. The province should make continuous improvements to energy-efficient technology, with further scope for the improvement of industrial structure, such as introducing policies to encourage the establishment of industries with high added value (e.g., high technology industry and financial services). In addition, the province should be prudent in managing the process of population urbanization and industry urbanization. Furthermore, the functional attributes of land use should be assessed by the urban planners for creating reasonable, harmony, and sustainable city that integrates residential, commercial, institutional, and industrial functions.
This paper studied the 11 prefectural cities in Shanxi Province and established an index system to evaluate land use efficiency from an input–output perspective. Based on the statistical data from 2006 to 2015, the changes in urban land use efficiency and total factor productivity in Shanxi Province were measured before and after the comprehensive reform on the transformation of the resource-based economy by applying the Bootstrap-DEA and Bootstrap-Malmquist index method. The panel-data analysis model was also constructed for exploring mechanisms and the dominant factors affecting the change of land use efficiency. The key conclusions are summarized below.
First, during the examining period, the urban land use efficiency of Shanxi Province, on the whole, formed a U-shaped change trend, with the bottom line observed in 2009–2011 and an upward trend after 2012. However, the changes in land use efficiency among cities are quite different. After the comprehensive reform, a significant increase in urban land use efficiency has been observed for Taiyuan and Yangquan, whereas the decline in Zhangzhou, Datong, Linfen, and Yuncheng has been significant.
Second, the dynamic changing process of total factor productivity of urban land does not appear promising. Before the comprehensive reform, productivity improvement had only been noticed for a few cities in a particular year. In particular, a descending trend was prominent for the overall level of total factor productivity after the comprehensive reform, which can mainly be attributed to the lack of technological advancements.
Third, from the perspective of the attributing factors, economic development and industrial upgrading significantly positively impacted urban land use efficiency. Industrial structure and government influence on economic transformation have an enabling influence, while the level of the urban population had a negative and less notable effect. This explains why Taiyuan has the highest score of land use efficiency as a result of being the capital city of the province, with the highest GDPP and value added by the tertiary industry, and the least by coal consumption.
This research is useful for understanding, learning, and evaluating the utilization efficiency of allocated resources. Moreover, it holds potential significance for the State to establish and adjust supporting policies in the future for resources-based cities, especially when the State has further planned to deepen the province’s economic transformation.
With the challenges of the scarcity of resources, climate change, and an increasing population, the improvement of technical efficiency driven by the reform and upgrading of traditionally resource-based industries is insufficient to help improve of the total factor productivity of urban land. In fact, the fundamentals for the improvement of land use efficiency and total factor productivity are to foster and develop the modern tertiary industry and strategically emerging alternative industries and improve the quality of the tertiary industry. However, in the resource-based cities, with limited capital resources, combined with other factors, such as the lack of essential technological innovation, it is even more important to introduce governmental policies to support implementing alternative strategic industries. From the perspective of land use, the blind expansion of the urban land use scales not in synchronization with industry transformation will only lead to inefficient land use. It is necessary to synchronize with transformation projects, develop land stock, integrate existing industrial park zones, and improve the level of urban land saving and intensive use to develop a future sustainable built environment.
Author Contributions
Conceptualization, X.J.G. and X.L.; literature review, X.J.G. and X.L.; methodology and data curation, X.L.; resources, X.J.G.; visualization, X.J.G. and X.L.; writing—original draft preparation, X.L.; writing—re-write, review and editing, X.J.G. All authors have read and agreed to the published version of the manuscript.
Funding
This research received no external funding.
Institutional Review Board Statement
Not applicable.
Informed Consent Statement
Not applicable.
Data Availability Statement
The data presented in this study are available on request from the corresponding author.
Conflicts of Interest
The authors declare no conflict of interest.
References
- China Urban Construction Statistics Yearbook, Various Issues, 2006–2016; China Plans to Press: Beijing, China, 2016.
- Chen, Y.; Chen, Z.; Xu, G.; Tian, Z. Built-up land efficiency in urban China: Insights from the general land use plan (2006–2020). Habitat Int. 2016, 51, 31–38. [Google Scholar] [CrossRef]
- Choy, L.; Lai, Y.; Lok, W. Economic performance of industrial development on collective land in the urbanization process in China: Empirical evidence from Shenzhen. Habitat Int. 2013, 40, 184–193. [Google Scholar] [CrossRef]
- Alberti, M. The Effects of Urban Patterns on Ecosystem Function. Int. Reg. Sci. Rev. 2005, 28, 168–192. [Google Scholar] [CrossRef]
- Delbecq, B.A.; Kuethe, T.H.; Borchers, A.M. Identifying the extent of the urban fringe and its impact on agricultural land values. Land Econ. 2014, 90, 587–600. [Google Scholar] [CrossRef]
- Guastella, G.; Pareglio, S.; Scodeck, P. A spatial econometric analysis of land use efficiency in large and small municipalities. Land Use Policy 2017, 63, 288–297. [Google Scholar] [CrossRef] [Green Version]
- William, J.M.; Andrés, V. Interactions between food security and land use in the context of global change. Land 2018, 7, 53. [Google Scholar] [CrossRef] [Green Version]
- Liu, Y. Introduction to land use and rural sustainability in China. Land Use Policy 2018, 74, 1–4. [Google Scholar] [CrossRef]
- The State Council. The Plan for the Sustainable Development of Resource-Based Cities in China (2013–2020) (In Chinese); Government Document: Beijing, China, 2013. Available online: http://www.gov.cn/zwgk/2013-12/03/content_2540070.htm (accessed on 15 March 2019).
- Li, H.J.; Long, R.Y.; Chen, H. Economic transition policies in Chinese resource-based cities: An overview of government efforts. Energy Policy 2013, 55, 251–260. [Google Scholar] [CrossRef]
- Chen, W.; He, R.; Wu, Q. A Novel efficiency measure model for industrial land use based on subvector data envelope analysis and spatial analysis method. Complexity 2017, 2017, 1–11. [Google Scholar] [CrossRef] [Green Version]
- Sun, W.; Li, Y.; Wang, D.; Fan, J. The efficiencies and their changes of China’s resources-based cities employing DEA and malmquist index models. J. Geogr. Sci. 2012, 22, 509–520. [Google Scholar] [CrossRef]
- Yang, X.D.; Wu, Y.X.; Dang, H. Urban land use efficiency and coordination in China. Sustainability 2017, 9, 410. [Google Scholar] [CrossRef] [Green Version]
- Dong, S.C.; Li, Z.H.; Li, B.; Xue, M. The economic transformation and strategic exploration of resource-based cities in China. China population. Resour. Environ. 2007, 17, 12–17. [Google Scholar]
- Burton, E. The Compact City: Just or Just Compact? A Preliminary Analysis. Urban Stud. 2000, 37, 1969–2006. [Google Scholar] [CrossRef]
- Gabriel, S.A.; Faria, J.A.; Moglen, G.E. A multi-objective optimization approach to smart growth in land development. Socio-Econ. Plan. Sci. 2006, 40, 212–248. [Google Scholar] [CrossRef] [Green Version]
- Rudolf, S.C.; Kienast, F.; Hersperger, A.M. Planning for compact urban forms: Local growth-management approaches and their evolution over time. J. Environ. Plan. Manag. 2018, 61, 474–492. [Google Scholar] [CrossRef]
- Proeger, T.; Meub, L.; Bizer, K. The role of communication on an experimental market for tradable development rights. Land Use Policy 2017, 68, 614–624. [Google Scholar] [CrossRef] [Green Version]
- Ding, C. Land policy reform in China: Assessment and prospects. Land Use Policy 2003, 20, 109–120. [Google Scholar] [CrossRef]
- Meng, Y.; Zhang, F.R.; An, P.L.; Dong, M.L.; Wang, Z.Y.; Zhao, T. Industrial land-use efficiency and planning in Shunyi, Beijing. Landsc. Urban Plan. 2008, 85, 40–48. [Google Scholar] [CrossRef]
- Zitti, M.; Ferrara, C.; Perini, L.; Salvati, L. Long-term urban growth and land use efficiency in southern Europe: Implications for sustainable land management. Sustainability 2015, 7, 3359–3385. [Google Scholar] [CrossRef] [Green Version]
- Valerio, Q.; Anna, B.; Francesco, C. Monitoring land take by point sampling: Pace and dynamics of urban expansion in the metropolitan city of Rome. Landsc. Urban Plan. 2015, 143, 126–133. [Google Scholar] [CrossRef]
- Abdullahi, S.; Pradhan, B.; Mojaddadi, H. City Compactness: Assessing the Influence of the Growth of Residential Land Use. J. Urban Technol. 2018, 25, 21–46. [Google Scholar] [CrossRef]
- Chen, W.; Wu, Q. Economic efficiency of urban construction land in the yangtze river delta and its influencing factors. Econ. Geogr. 2014, 34, 142–149. [Google Scholar]
- Liang, T.; Zhao, Q.L.; Chen, C. Spatial differentiation characteristics and optimization path analysis of urban land use efficiency in China—Based on empirical study of 287 cities above prefectural level. China Land Sci. 2013, 7, 48–54. [Google Scholar]
- Tu, F.; Yu, X.; Ruan, J. Industrial land use efficiency under government intervention: Evidence from hangzhou, China. Habitat Int. 2014, 43, 1–10. [Google Scholar] [CrossRef]
- Simar, L.; Wilson, P.W. Statistical inference in nonparametric frontier models: The state of the art. J. Product. Anal. 2000, 13, 49–78. [Google Scholar] [CrossRef]
- Atstaja, D.Z.; Dimante, D.Z.; Brivers, I.; Malzubris, J.; Keneta, M.; Tambovceva, T.; Sina, I.; Liviņa, A.; Ievins, J.; Grasis, J.; et al. Environment and Economics; Monographic ed.; Academic Press of University of Latvia: Riga, Latvia, 2011. (In Latvian) [Google Scholar]
- Costanza, R.; Perrings, C.; Cleveland, C.J. The Development of Ecological Economics; Edward Elgar Publishing Company: Cheltenham, UK, 1997. [Google Scholar]
- van den Bergh, J.; Barendregt, A.; Gilbert, A. Spatial Ecological-Economic Analysis for Wetland Management: Modelling and Scenario Evaluation of Land-Use; Cambridge University Press: Cambridge, UK, 2004; pp. 36–49. [Google Scholar]
- Charnes, A.; Cooper, W.W.; Rhodes, E. Measuring the efficiency of decision making units. Eur. J. Oper. Res. 1978, 2, 429–444. [Google Scholar] [CrossRef]
- Choi, Y.; Wang, N. the economic efficiency of urban land use with a sequential slack-based model in Korea. Sustainability 2017, 9, 79. [Google Scholar] [CrossRef] [Green Version]
- Caves, D.W.; Christensen, L.R.; Diewert, W.E. The economic theory of index numbers and the measurement of input, output, and productivity. Econom. J. Econom. Soc. 1982, 50, 1393–1414. [Google Scholar] [CrossRef]
- Fӓre, R.; Grosskopf, S.; Lovell, C.A.K. Indirect productivity measurement. J. Product. Anal. 1992, 2, 283–298. [Google Scholar] [CrossRef]
- Färe, R.; Grosskopf, S.; Norris, M.; Zhang, Z. Productivity growth, technical progress, and efficiency change in industrialized countries. Am. Econ. Rev. 1994, 84, 66–83. [Google Scholar]
- Worthington, A.C. Technical efficiency and technological change in Australian Building Societies. Abacus 2000, 36, 180–197. [Google Scholar] [CrossRef] [Green Version]
- Odeck, J. Statistical precision of DEA and malmquist indices: A bootstrap application to Norwegian grain producers. Omega 2009, 37, 1007–1017. [Google Scholar] [CrossRef]
- Ko, J.H.; Park, S.H.; Kim, D.C. Efficiency analysis of project management offices for large-scale information system projects: Insights for construction megaprojects. Constr. Econ. Build. 2015, 15, 34–47. [Google Scholar] [CrossRef]
- Zhou, P.; Ang, B.W.; Han, J.Y. Total factor carbon emission performance: A Malmquist index analysis. Energy Econ. 2010, 32, 194–201. [Google Scholar] [CrossRef]
- Dakpo, K.H.; Desjeux, Y.; Jeanneaux, P.; Latruffe, L. Productivity, technical efficiency and technological change in French agriculture during 2002–2015: A färe-primont index decomposition using group frontiers and meta-frontier. Appl. Econ. 2019, 51, 1166–1182. [Google Scholar] [CrossRef] [Green Version]
- Wu, Y.R. Is China’s economic growth sustainable? A productivity analysis. China Econ. Rev. 2000, 11, 278–296. [Google Scholar] [CrossRef]
- Berg, S.A.; Førsund, F.R.; Jansen, E.S. Malmquist indices of productivity growth during the deregulation of Norwegian banking, 1980–1989. Scand. J. Econ. 1992, S211–S228. [Google Scholar] [CrossRef]
- Fukuyama, H. Measuring efficiency and productivity growth in Japanese banking: A nonparametric frontier approach. Appl. Financ. Econ. 1995, 5, 95–107. [Google Scholar] [CrossRef]
- Jajri, I.; Ismail, R. Technical Efficiency, Technological Change and Total Factor Productivity Growth in Malaysian Manufacturing Sector; MPRA Paper, Munich Personal RePEc Archive, Paper No. 1966, posted 2; University of Malaya: Kuala Lumpur, Malaysia, 2007; pp. 1–19. [Google Scholar]
- Daraio, C.; Simar, L. Advanced Robust and Nonparametric Methods in Efficiency Analysis: Methodology and Applications; Springer: Berlin/Heidelberg, Germany, 2007. [Google Scholar]
- Mo, H.D. Re-sampling technique—Bootstrap method. J. Yangzhou Univ. 2001, 4, 1–6. [Google Scholar]
- Simar, L.; Wilson, P.W. Estimating and bootstrapping Malmquist indices. Eur. J. Oper. Res. 1999, 115, 459–471. [Google Scholar] [CrossRef]
- Hall, P. On the number of bootstrap simulations required to construct a confidence interval. Ann. Stat. 1986, 14, 1453–1462. [Google Scholar] [CrossRef]
- Zhang, J.; Wu, G.Y.; Zhang, J.P. Estimation of China’s inter-provincial material capital stock: 1952–2000. Econ. Res. 2004, 10, 35–44. [Google Scholar]
- Pu, W.F.; Zhang, A.L.; Wen, L.J. Can China’s resource-saving and environmentally friendly society really improve the efficiency of industrial land use? Land 2021, 10, 751. [Google Scholar] [CrossRef]
- Beijing Zhiyan Kexin Consulting. The Analysis of Coal Price Trend in 2017 and Impact Study in China (in Chinese), Industry Research Report, 2017. Available online: https://www.sohu.com/a/162801835_775892 (accessed on 22 May 2019).
- Geng, H.G.; Zhang, K.; Zhang, H.W. Research on sustainable development of resource-based small industrial and mining cities—A case study of Yangquanqu Town, Xiaoyi, Shanxi Province, China. Procedia Eng. 2011, 21, 633–640. [Google Scholar]
- Zheng, Y.T. Focusing on the implementation of key tasks and promote the construction of the comprehensive reform pilot zone—Read the shanxi comprehensive reform experiment “implementation plan (2013–2015)” and “2013 action plan”. Advance 2013, 9, 4–6. [Google Scholar]
- Yan, P.F.; Wang, B. Technical efficiency, technological progress and productivity growth: Empirical analysis based on DEA. Econ. Res. 2004, 12, 88–96. [Google Scholar]
Figure 1.
The percentage increase of input variables (i.e., urban construction area, the fixed capital stock of secondary and tertiary industry, and the number of people employed in the secondary and tertiary industries from 2006 to 2015).
Figure 1.
The percentage increase of input variables (i.e., urban construction area, the fixed capital stock of secondary and tertiary industry, and the number of people employed in the secondary and tertiary industries from 2006 to 2015).

Figure 2.
The percentage increase of output variables, such as the value added by the secondary and tertiary industries and green coverage of built-up areas, between 2006 and 2015.
Figure 2.
The percentage increase of output variables, such as the value added by the secondary and tertiary industries and green coverage of built-up areas, between 2006 and 2015.

Figure 3.
Comparisons between the average scores of land use efficiencies before and after the comprehensive economic transformation.
Figure 3.
Comparisons between the average scores of land use efficiencies before and after the comprehensive economic transformation.

Figure 4.
The overall (average) land use efficiency score trend for the total of studied cities in Shanxi Province from 2006–2015.
Figure 4.
The overall (average) land use efficiency score trend for the total of studied cities in Shanxi Province from 2006–2015.

Figure 5.
The trends of overall (average) year-on-year change of the Malmquist productivity index, technological change index, and technical efficiency change index for the total studied cities in Shanxi Province from 2006 to 2015.
Figure 5.
The trends of overall (average) year-on-year change of the Malmquist productivity index, technological change index, and technical efficiency change index for the total studied cities in Shanxi Province from 2006 to 2015.

Figure 6.
The percentage increase of explanatory variables such as GDPP, coal consumption CP, IS, GOV, and UPL, from 2006 to 2015.
Figure 6.
The percentage increase of explanatory variables such as GDPP, coal consumption CP, IS, GOV, and UPL, from 2006 to 2015.


Table 1.
Variables of land use efficiency model.
| Variables Type | Variables | Measurement | Expected Sign |
|---|---|---|---|
| Input Variables | Capital | 2nd & tertiary industries fixed asset (10,000 yuan) | Positive |
| Land | Urban construction land area (square kilometer) | Positive | |
| Labor | Number of employments on 2nd & tertiary industries | Positive | |
| Research expenses | R&D research funds (10,000 yuan) | Positive | |
| Energy consumption | Coal consumption (Ton/10,000 yuan) | Negative | |
| Output Variables | Economic output | Value-added of 2nd and tertiary industry (10,000 yuan) | Positive |
| Quality of Environment | Green area coverage rate (%) | Positive | |
| Days completed for Green area coverage (%) | Positive |
Table 2.
The scores of land use efficiencies (Bootstrap-DEA) for 11 prefecture-level cities in Shanxi Province 2006–2015.
Table 2.
The scores of land use efficiencies (Bootstrap-DEA) for 11 prefecture-level cities in Shanxi Province 2006–2015.
| City | 2006 | 2007 | 2008 | 2009 | 2010 | 2011 | 2012 | 2013 | 2014 | 2015 | Mean | S.D. |
|---|---|---|---|---|---|---|---|---|---|---|---|---|
| Taiyuan | 0.847 | 0.803 | 0.824 | 0.714 | 0.798 | 0.813 | 0.816 | 0.892 | 0.952 | 0.914 | 0.837 | 0.068 |
| Datong | 0.865 | 0.782 | 0.795 | 0.607 | 0.609 | 0.592 | 0.564 | 0.610 | 0.672 | 0.789 | 0.688 | 0.108 |
| Yangquan | 0.764 | 0.643 | 0.855 | 0.823 | 0.866 | 0.897 | 0.870 | 0.880 | 0.899 | 0.918 | 0.841 | 0.082 |
| Changzhi | 0.905 | 0.847 | 0.906 | 0.769 | 0.815 | 0.888 | 0.829 | 0.855 | 0.867 | 0.865 | 0.855 | 0.043 |
| Jincheng | 0.947 | 0.760 | 0.804 | 0.669 | 0.756 | 0.771 | 0.777 | 0.819 | 0.836 | 0.901 | 0.804 | 0.079 |
| Shuozhou | 0.922 | 0.881 | 0.907 | 0.841 | 0.837 | 0.829 | 0.834 | 0.854 | 0.875 | 0.905 | 0.869 | 0.034 |
| Jinzhong | 0.879 | 0.741 | 0.742 | 0.618 | 0.673 | 0.657 | 0.643 | 0.679 | 0.707 | 0.763 | 0.710 | 0.076 |
| Yuncheng | 0.957 | 0.828 | 0.766 | 0.638 | 0.553 | 0.579 | 0.553 | 0.623 | 0.739 | 0.835 | 0.707 | 0.139 |
| Xinzhou | 0.887 | 0.892 | 0.928 | 0.712 | 0.597 | 0.579 | 0.541 | 0.653 | 0.646 | 0.802 | 0.724 | 0.143 |
| Linfen | 0.938 | 0.884 | 0.910 | 0.767 | 0.727 | 0.751 | 0.727 | 0.738 | 0.769 | 0.844 | 0.805 | 0.081 |
| Luliang | 0.934 | 0.880 | 0.897 | 0.835 | 0.831 | 0.835 | 0.828 | 0.860 | 0.868 | 0.916 | 0.868 | 0.038 |
Table 3.
The year-on-year land productivity change index for prefectural level cities in Shanxi Province 2006–2015 (Malmquist).
Table 3.
The year-on-year land productivity change index for prefectural level cities in Shanxi Province 2006–2015 (Malmquist).
| City | 2006/2007 | 2007/2008 | 2008/2009 | 2009/2010 | 2000/2011 | 2011/2012 | 2012/2013 | 2013/2014 | 2014/2015 |
|---|---|---|---|---|---|---|---|---|---|
| Taiyuan | 1.028 ** | 0.949 ** | 0.919 ** | 0.983 ** | 0.978 ** | 0.932 ** | 0.853 | 0.894 | 0.927 ** |
| Datong | 0.962 | 0.945 ** | 0.816 | 0.900 ** | 0.951 ** | 0.894 ** | 0.838 | 0.877 | 0.951 |
| Yangquan | 0.916 | 1.006 | 0.860 ** | 0.845 ** | 0.868 ** | 0.867 ** | 0.879 * | 0.868 ** | 0.885 ** |
| Changzhi | 0.998 ** | 1.035 ** | 0.939 | 0.981 ** | 1.042 ** | 0.875 ** | 0.807 * | 0.828 ** | 0.783 ** |
| Jincheng | 0.894 | 1.003 ** | 0.890 | 0.939 ** | 0.984 ** | 0.922 ** | 0.822 | 0.824 ** | 0.841 |
| Shuozhou | 1.146 ** | 0.837 ** | 1.054 ** | 0.947 ** | 0.994 ** | 0.931 ** | 0.914 ** | 0.895 ** | 0.819 ** |
| Jinzhong | 0.897 | 0.968 ** | 0.933 | 1.011 ** | 0.986 ** | 0.810 ** | 0.829 ** | 0.839 ** | 0.834 |
| Yuncheng | 0.918 | 0.920 ** | 0.891 | 0.885 | 1.184 | 0.892 ** | 0.880 * | 0.927 * | 0.875 |
| Xinzhou | 1.057 ** | 1.017 ** | 0.796 | 0.849 | 0.966 ** | 0.873 ** | 1.069 * | 0.922 ** | 1.003 |
| Linfen | 1.008 | 1.044 ** | 0.867 | 1.022 ** | 1.069 ** | 0.877 ** | 0.845 ** | 0.849 ** | 0.872 * |
| Luliang | 1.083 * | 0.993 ** | 1.009 * | 1.103 ** | 1.086 ** | 0.941 ** | 0.853 ** | 0.847 ** | 0.839 |
Note: * Significance level at 10%; ** Significance level at 5%.
Table 4.
The year-on-year technical efficiency change index for prefectural cities in Shanxi Province 2006–2015 (Bootstrap-Malmquist).
Table 4.
The year-on-year technical efficiency change index for prefectural cities in Shanxi Province 2006–2015 (Bootstrap-Malmquist).
| City | 2006/2007 | 2007/2008 | 2008/2009 | 2009/2010 | 2000/2011 | 2011/2012 | 2012/2013 | 2013/2014 | 2014/2015 |
|---|---|---|---|---|---|---|---|---|---|
| Taiyuan | 0.911 | 1.026 | 0.821 | 1.112 | 1.051 | 0.989 | 1.105 | 1.096 | 0.998 |
| Datong | 0.870 | 1.022 | 0.729 | 1.012 | 1.002 | 0.951 | 1.091 | 1.094 | 1.202 |
| Yangquan | 0.817 | 1.340 | 0.939 | 1.090 | 1.054 | 0.957 | 1.028 | 1.004 | 1.021 |
| Changzhi | 0.888 | 1.082 | 0.822 | 1.062 | 1.108 | 0.925 | 1.034 | 1.012 | 1.020 |
| Jincheng | 0.755 | 1.069 | 0.824 | 1.089 | 1.043 | 0.985 | 1.063 | 1.013 | 1.108 |
| Shuozhou | 0.953 | 1.016 | 0.928 | 0.997 | 1.006 | 0.988 | 1.025 | 1.014 | 1.039 |
| Jinzhong | 0.798 | 1.014 | 0.815 | 1.088 | 1.025 | 0.929 | 1.067 | 1.029 | 1.104 |
| Yuncheng | 0.822 | 0.932 | 0.816 | 0.858 | 1.075 | 0.951 | 1.117 | 1.171 | 1.157 |
| Xinzhou | 0.958 | 1.058 | 0.740 | 0.829 | 0.988 | 0.943 | 1.230 | 0.986 | 1.257 |
| Linfen | 0.912 | 1.022 | 0.808 | 0.971 | 1.028 | 0.948 | 1.033 | 1.029 | 1.117 |
| Luliang | 0.951 | 1.018 | 0.929 | 0.990 | 1.006 | 0.989 | 1.020 | 1.017 | 1.045 |
Table 5.
The year-on-year technological change index for prefectural level cities in Shanxi Province 2006–2015 (Bootstrap-Malmquist).
Table 5.
The year-on-year technological change index for prefectural level cities in Shanxi Province 2006–2015 (Bootstrap-Malmquist).
| City | 2006/2007 | 2007/2008 | 2008/2009 | 2009/2010 | 2000/2011 | 2011/2012 | 2012/2013 | 2013/2014 | 2014/2015 |
|---|---|---|---|---|---|---|---|---|---|
| Taiyuan | 1.063 | 0.942 | 1.033 | 0.895 | 0.969 | 0.917 | 0.787 | 0.830 | 0.927 |
| Datong | 1.042 | 0.942 | 1.033 | 0.895 | 0.969 | 0.917 | 0.788 | 0.815 | 0.814 |
| Yangquan | 1.055 | 0.762 | 0.853 | 0.795 | 0.846 | 0.867 | 0.879 | 0.868 | 0.885 |
| Changzhi | 1.055 | 0.974 | 1.054 | 0.930 | 0.979 | 0.916 | 0.798 | 0.818 | 0.794 |
| Jincheng | 1.100 | 0.953 | 1.005 | 0.868 | 0.969 | 0.918 | 0.792 | 0.816 | 0.784 |
| Shuozhou | 1.146 | 0.837 | 1.054 | 0.947 | 0.993 | 0.930 | 0.914 | 0.895 | 0.819 |
| Jinzhong | 1.046 | 0.973 | 1.057 | 0.935 | 0.966 | 0.869 | 0.798 | 0.817 | 0.782 |
| Yuncheng | 1.036 | 1.005 | 1.009 | 1.037 | 1.101 | 0.928 | 0.809 | 0.800 | 0.786 |
| Xinzhou | 1.031 | 0.981 | 0.983 | 1.034 | 1.000 | 0.901 | 0.886 | 0.946 | 0.836 |
| Linfen | 1.056 | 1.039 | 0.993 | 1.050 | 1.062 | 0.912 | 0.832 | 0.833 | 0.810 |
| Luliang | 1.083 | 0.993 | 1.009 | 1.103 | 1.086 | 0.941 | 0.853 | 0.847 | 0.839 |
Table 6.
Panel data model on regression analysis of explanatory variables with land efficiency score.
Table 6.
Panel data model on regression analysis of explanatory variables with land efficiency score.
| Explanatory Variables | Model I | Model II |
|---|---|---|
| C | 0.704 *** (8.189) | 0.616 *** (3.129) |
| GDPP | 0.055 ** (2.575) | 0.056 ** (2.111) |
| CP | 0.168 *** (2.726) | 0.301 *** (3.353) |
| IS | −0.001 (−0.568) | 0.0046 * (1.9117) |
| UPL | −0.002 (−0.991) | −0.007 (−1.599) |
| GOV | 0.0017 (1.032) | 0.0047 ** (2.553) |
| R2 | 0.09 | 0.534 |
| F value | Not Significant | 7.2 *** |
| HausmanTest | Random Effect Declined | -- |
Note: ***, **, * Indicates significance level of 1%, 5%, and 10%, respectively. The t value is shown in brackets.
Publisher’s Note: MDPI stays neutral with regard to jurisdictional claims in published maps and institutional affiliations. |
© 2021 by the authors. Licensee MDPI, Basel, Switzerland. This article is an open access article distributed under the terms and conditions of the Creative Commons Attribution (CC BY) license (https://creativecommons.org/licenses/by/4.0/).
Share and Cite
MDPI and ACS Style
Ge, X.J.; Liu, X. Urban Land Use Efficiency under Resource-Based Economic Transformation—A Case Study of Shanxi Province. Land 2021, 10, 850. https://doi.org/10.3390/land10080850
AMA Style
Ge XJ, Liu X. Urban Land Use Efficiency under Resource-Based Economic Transformation—A Case Study of Shanxi Province. Land. 2021; 10(8):850. https://doi.org/10.3390/land10080850
Chicago/Turabian StyleGe, Xin Janet, and Xiaoxia Liu. 2021. "Urban Land Use Efficiency under Resource-Based Economic Transformation—A Case Study of Shanxi Province" Land 10, no. 8: 850. https://doi.org/10.3390/land10080850
Note that from the first issue of 2016, this journal uses article numbers instead of page numbers. See further details here.