
Ethnic Disparities in the Development of Sight-Threatening Diabetic Retinopathy in a UK Multi-Ethnic Population with Diabetes: An Observational Cohort Study

 ,
,
Abstract
:1. Introduction
2. Materials and Methods
3. Results
3.1. Overall Study Population
3.2. Baseline Characteristics of the Study Population
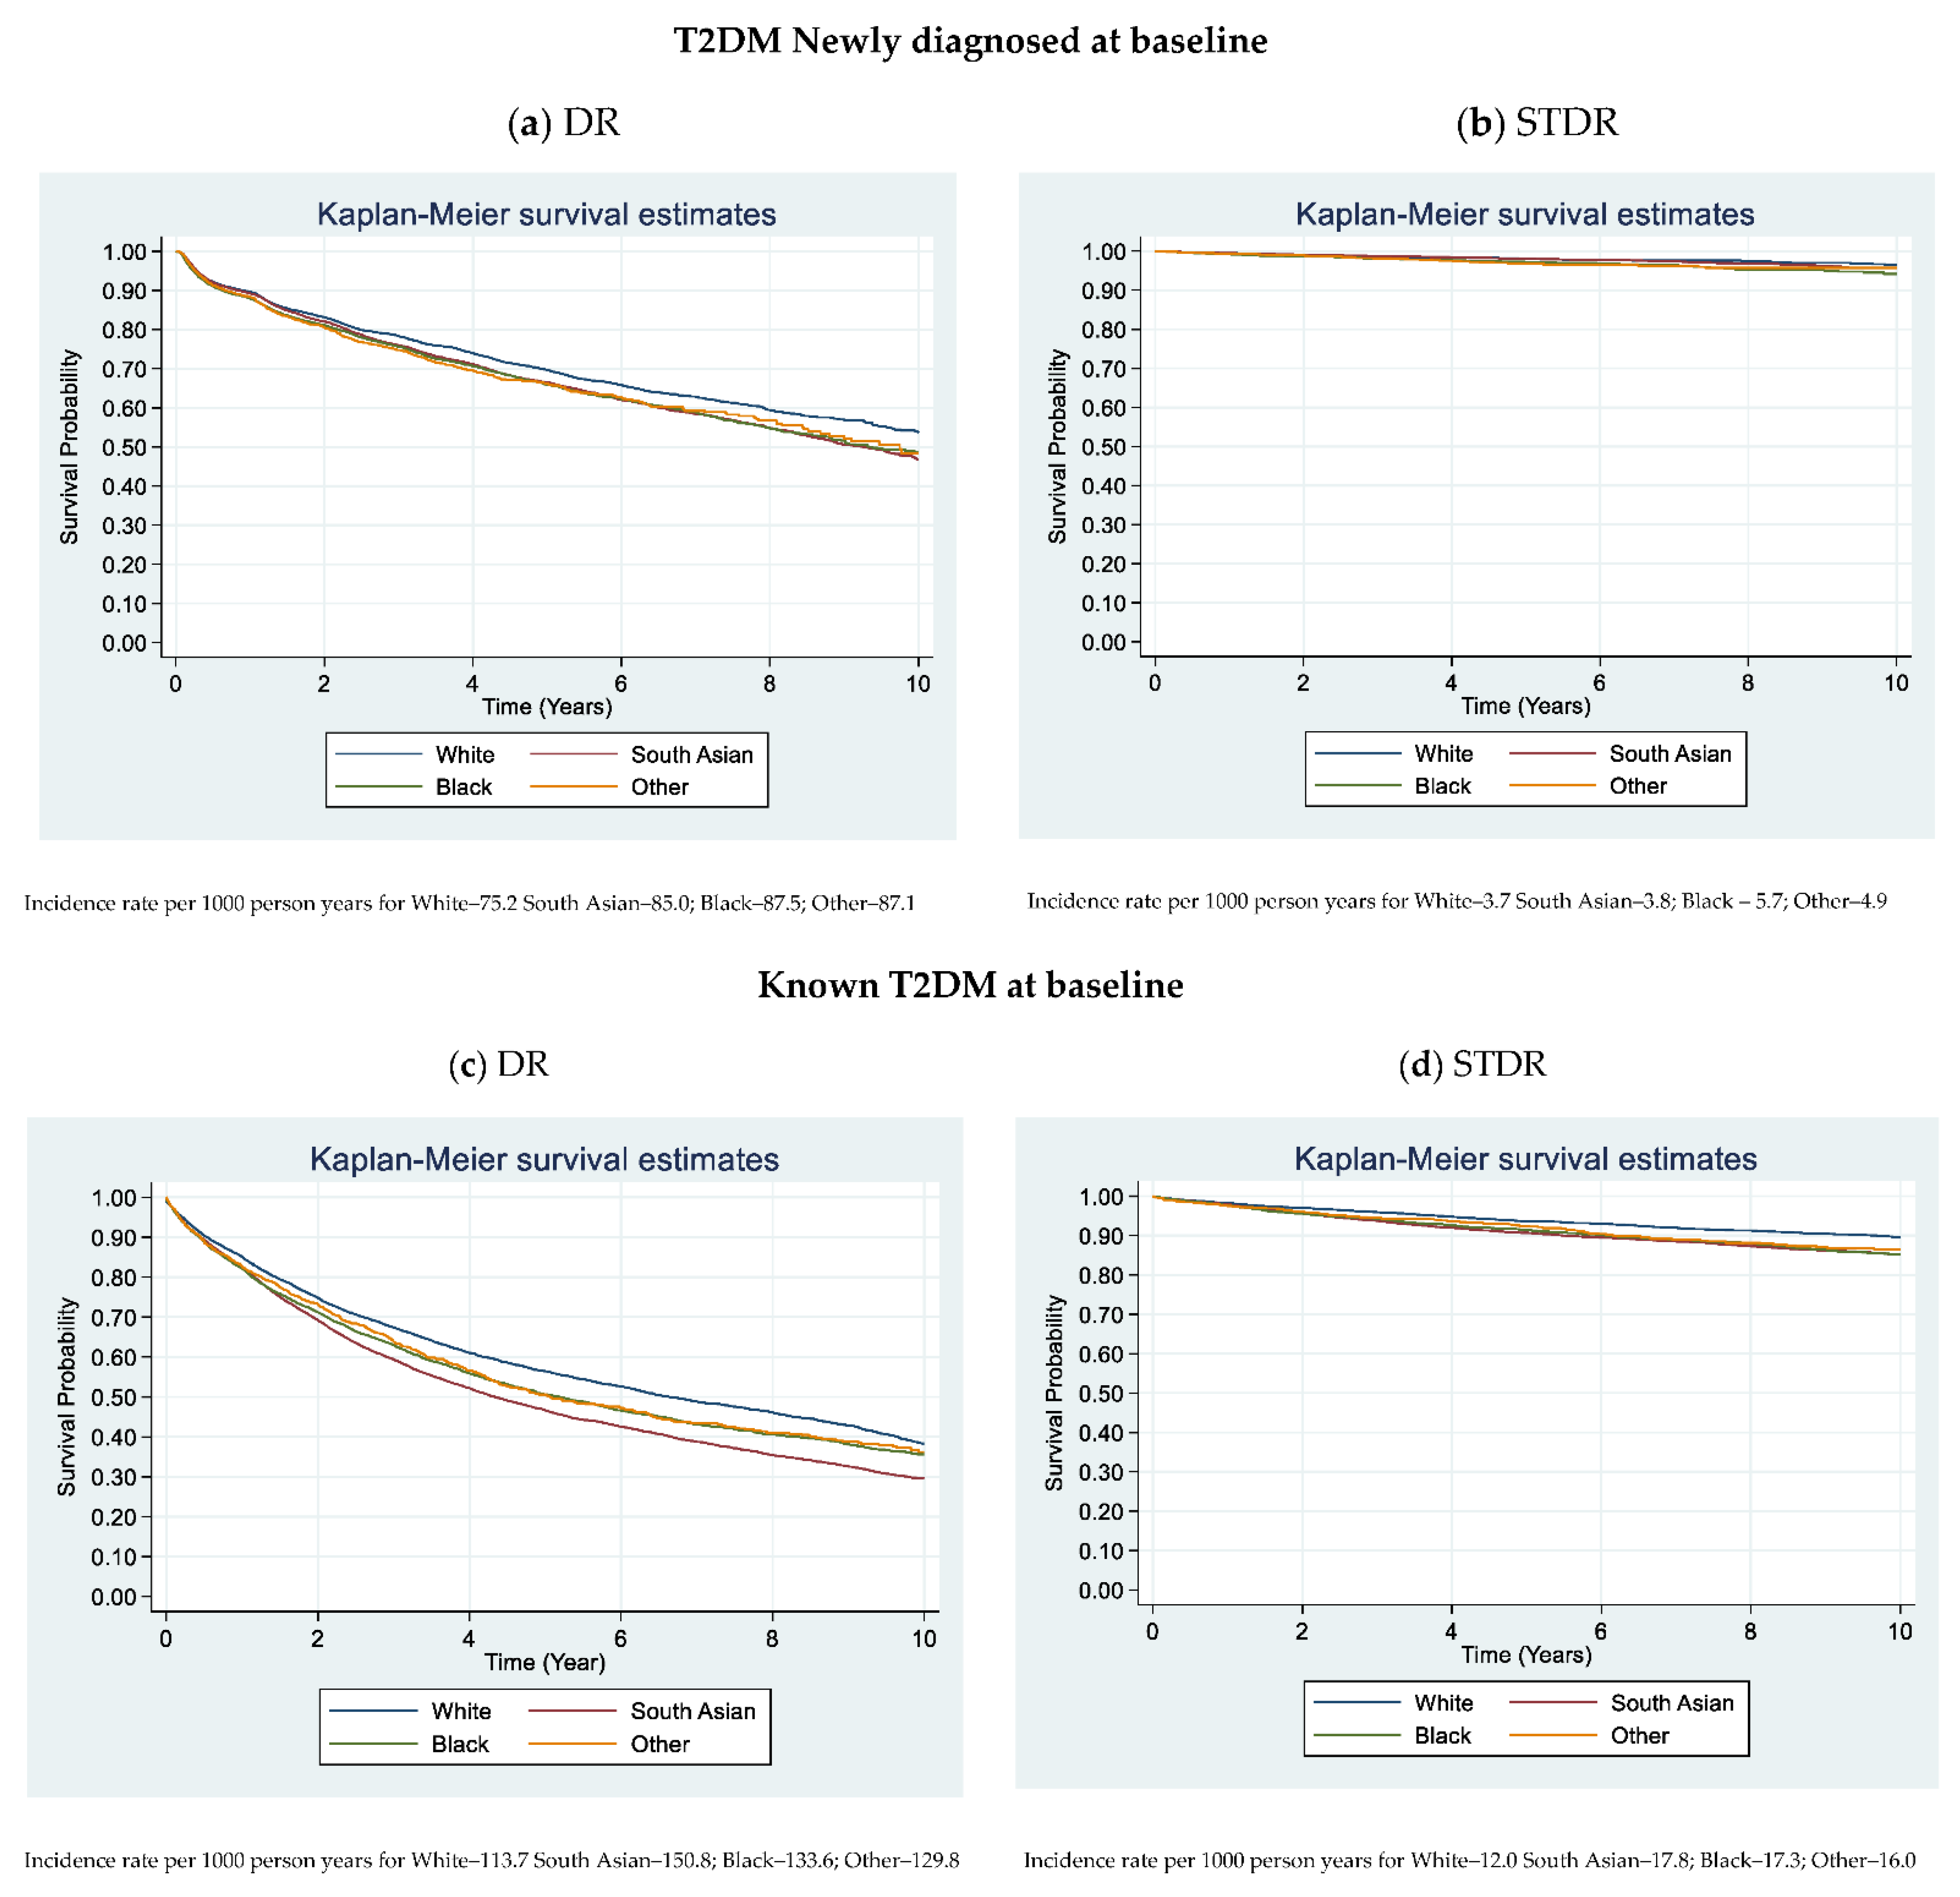
3.3. Kaplan Meier Plots
3.4. DR/STDR Events and Incidence Rate
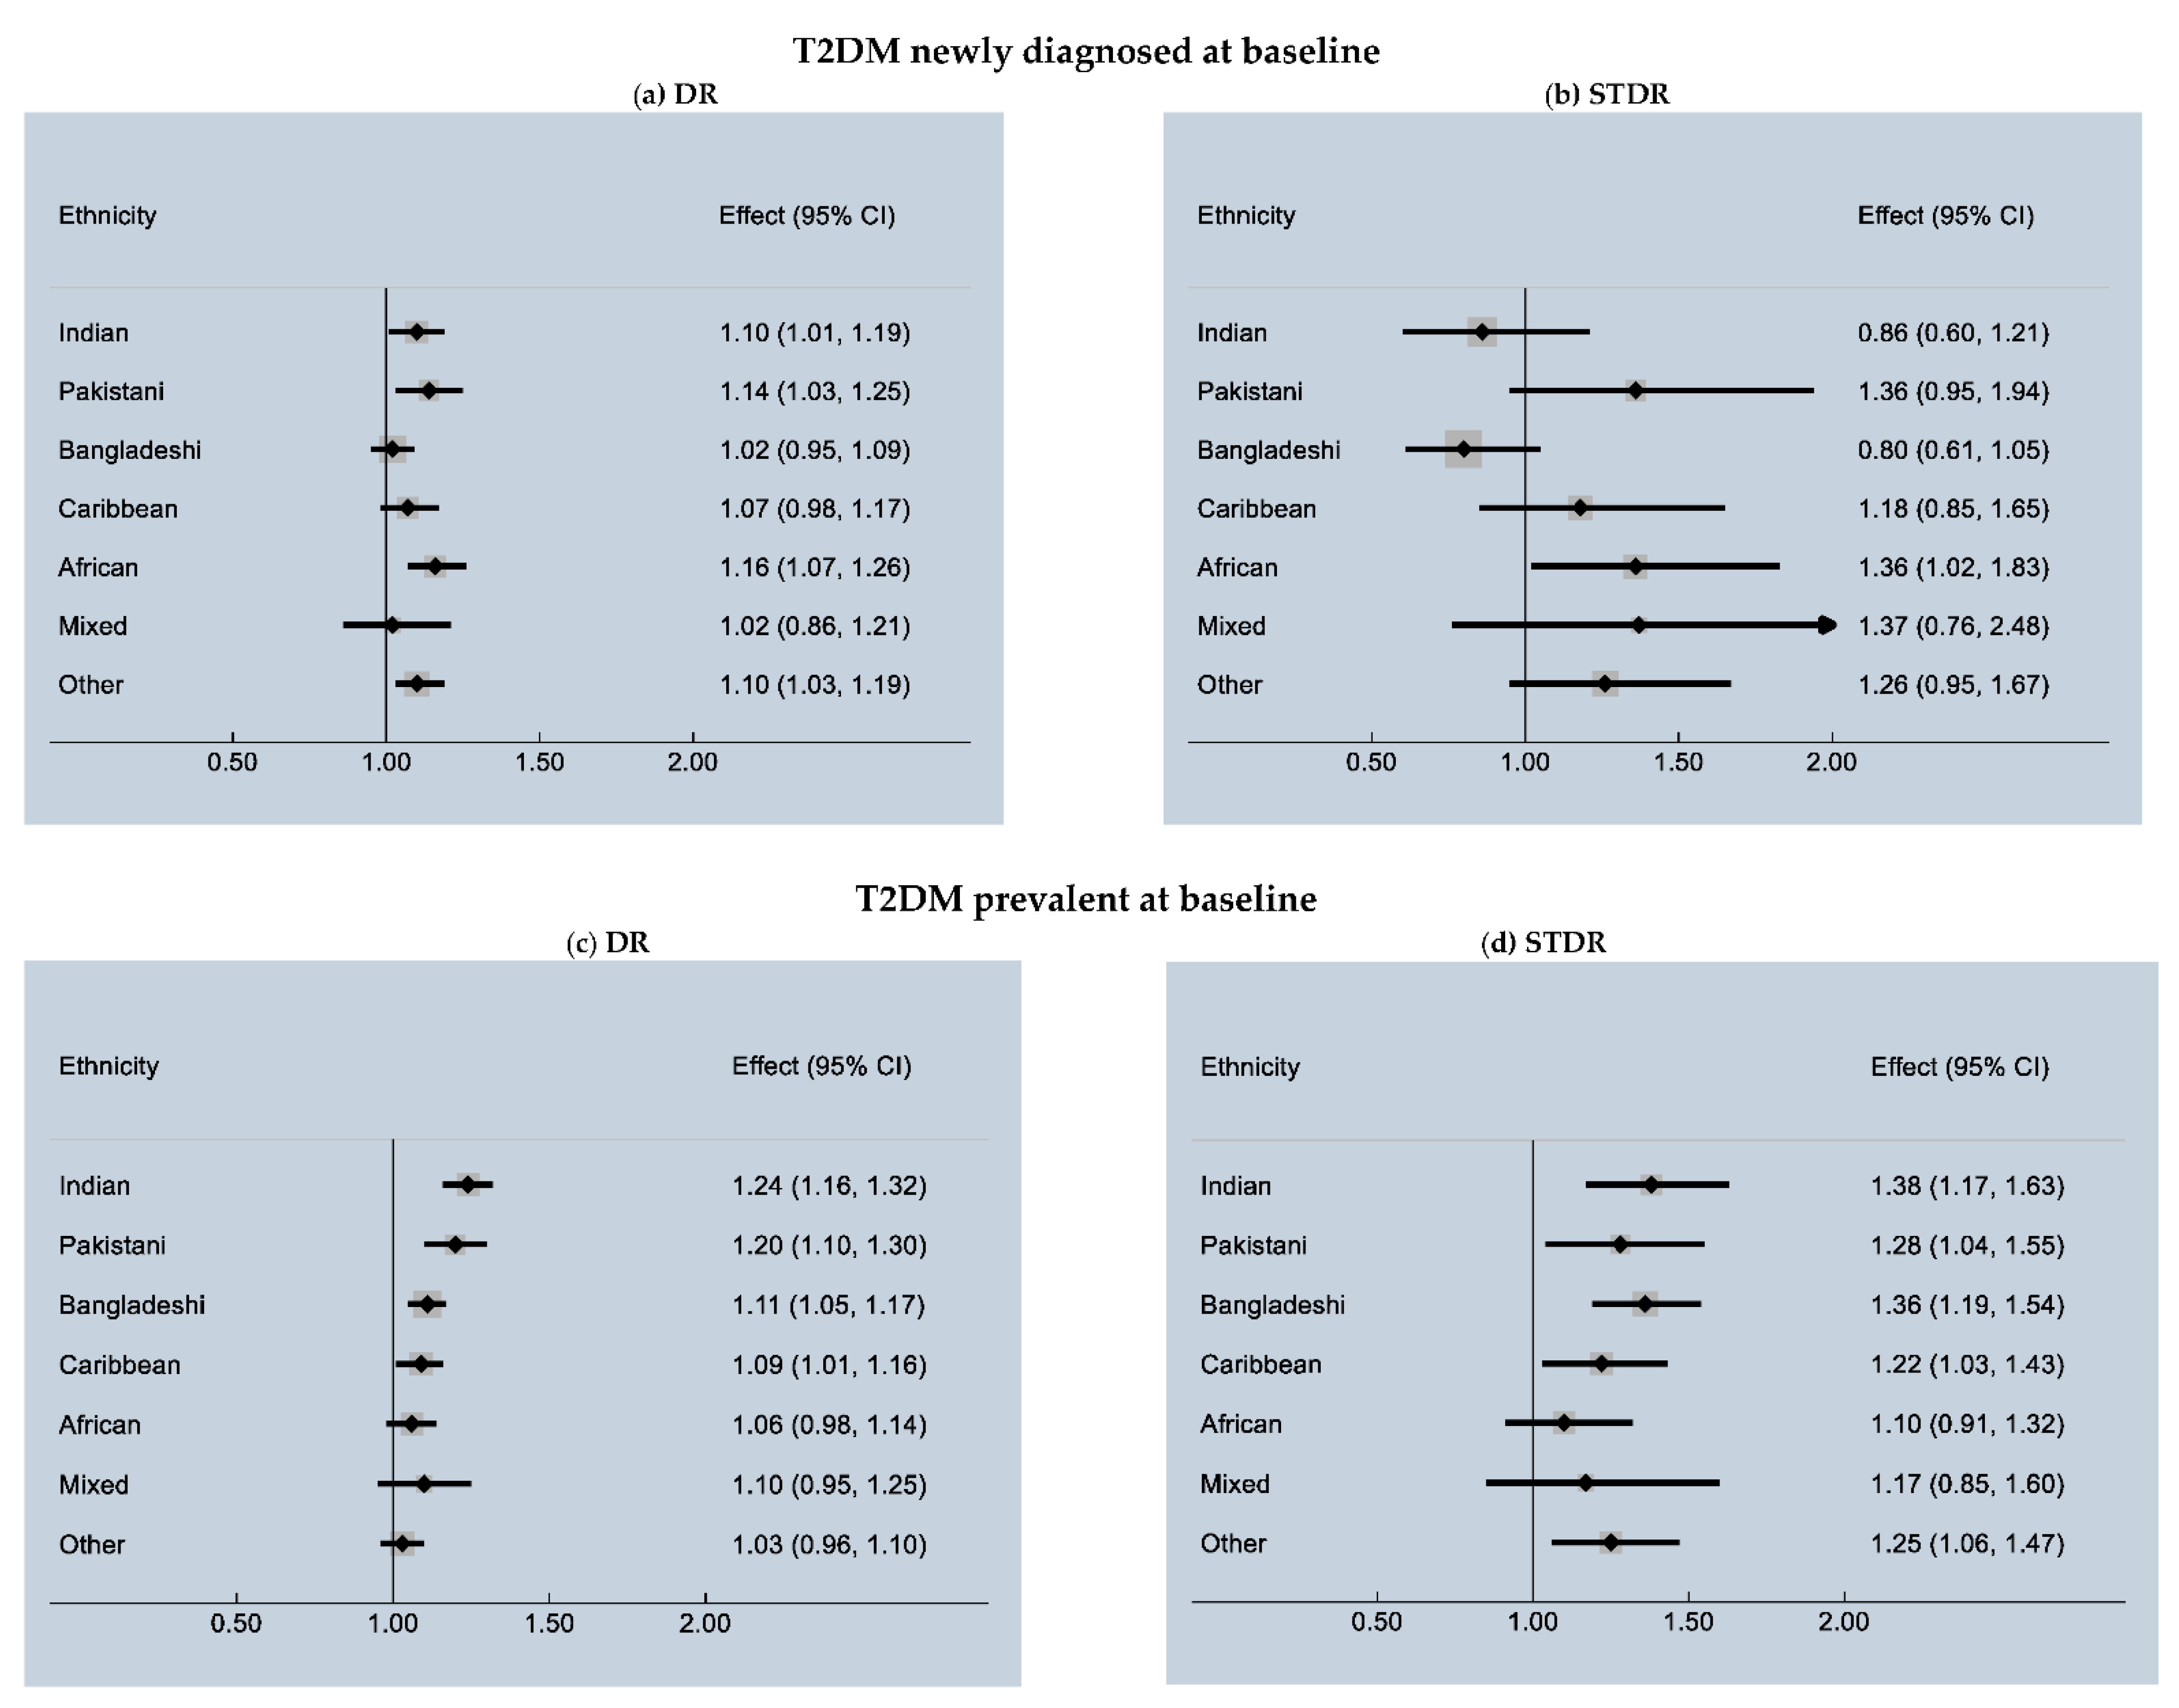
3.5. Multivariable Analysis and Ethnic Variation in Incident DR/STDR
3.6. Other Risk Factors Contributing to DR and STDR
4. Discussion
5. Conclusions
Author Contributions
Funding
Institutional Review Board Statement
Informed Consent Statement
Data Availability Statement
Acknowledgments
Conflicts of Interest
References
- World Health Organization. Global Report on Diabetes 2016. 10 March 2019. Available online: https://www.who.int/publications/i/item/9789241565257 (accessed on 27 June 2021).
- International Diabetes Federation. IDF Diabetes Atlas, 9th ed.; IDF: Brussels, Belgium, 2019. [Google Scholar]
- The Royal College of Ophthalmologists. Diabetic Retinopathy Guidelines 2012. 10 March 2019. Available online: https://www.rcophth.ac.uk/wp-content/uploads/2014/12/2013-SCI-301-FINAL-DR-GUIDELINES-DEC-2012-updated-July-2013.pdf (accessed on 26 June 2021).
- Mathur, R.; Bhaskaran, K.; Edwards, E.; Lee, H.; Chaturvedi, N.; Smeeth, L.; Douglas, I. Population trends in the 10-year incidence and prevalence of diabetic retinopathy in the UK: A cohort study in the Clinical Practice Research Datalink 2004–2014. BMJ Open 2017, 7, e014444. [Google Scholar] [CrossRef] [PubMed]
- Thomas, R.L.; Dunstan, F.D.; Luzio, S.; Chowdhury, S.R.; North, R.; Hale, S.L.; Gibbins, R.L.; Owens, D.R. Prevalence of diabetic retinopathy within a national diabetic retinopathy screening service. Br. J. Ophthalmol. 2014, 99, 64–68. [Google Scholar] [CrossRef] [Green Version]
- Office for National Statistics. Population of England and Wales 7 August 2020. Available online: https://www.ethnicity-facts-figures.service.gov.uk/uk-population-by-ethnicity/national-and-regional-populations/population-of-england-and-wales/latest (accessed on 26 June 2021).
- Goff, L.M. Ethnicity and Type 2 diabetes in the UK. Diabet. Med. 2019, 36, 927–938. [Google Scholar] [CrossRef] [Green Version]
- Pham, T.M.; Carpenter, J.R.; Morris, T.P.; Sharma, M.; Petersen, I. Ethnic Differences in the Prevalence of Type 2 Diabetes Diagnoses in the UK: Cross-Sectional Analysis of the Health Improvement Network Primary Care Database. Clin. Epidemiol. 2019, 11, 1081–1088. [Google Scholar] [CrossRef] [PubMed] [Green Version]
- Whicher, C.A.; O’Neill, S.; Holt, R.I.G. Diabetes in the UK: 2019. Diabet. Med. 2020, 37, 242–247. [Google Scholar] [CrossRef] [PubMed]
- Emanuele, N.; Sacks, J.; Klein, R.; Reda, D.; Anderson, R.; Duckworth, W.; Abraira, C. For the Veterans Affairs Diabetes Trial Group Ethnicity, Race, and Baseline Retinopathy Correlates in the Veterans Affairs Diabetes Trial. Diabetes Care 2005, 28, 1954–1958. [Google Scholar] [CrossRef] [Green Version]
- Sivaprasad, S.; Gupta, B.; Crosby-Nwaobi, R.; Evans, J. Prevalence of Diabetic Retinopathy in Various Ethnic Groups: A Worldwide Perspective. Surv. Ophthalmol. 2012, 57, 347–370. [Google Scholar] [CrossRef] [PubMed]
- Tan, G.S.; Gan, A.; Sabanayagam, C.; Tham, Y.C.; Neelam, K.; Mitchell, P.; Wang, J.J.; Lamoureux, E.L.; Cheng Ch Wong, T.Y. Ethnic Differences in the Prevalence and Risk Factors of Diabetic Retinopathy: The Singapore Epidemiology of Eye Diseases Study. Ophthalmology 2018, 125, 529–536. [Google Scholar] [CrossRef]
- Sivaprasad, S.; Gupta, B.; Gulliford, M.; Dodhia, H.; Mohamed, M.; Nagi, D.; Evans, J.R. Ethnic Variations in the Prevalence of Diabetic Retinopathy in People with Diabetes Attending Screening in the United Kingdom (DRIVE UK). PLoS ONE 2012, 7, e32182. [Google Scholar] [CrossRef]
- Raymond, N.T.; Varadhan, L.; Reynold, D.R.; Bush, K.; Sankaranarayanan, S.; Bellary, S.; Barnett, A.H.; Kumar, S.; O'Hare, J.P. UK Asian Diabetes Study Retinopathy Study Group. Higher prevalence of retinopathy in diabetic patients of South Asian ethnicity compared with white Euro-peans in the community: A cross-sectional study. Diabetes Care 2009, 32, 410–415. [Google Scholar] [CrossRef] [Green Version]
- Nwosu, S.N. Prevalence and pattern of retinal diseases at the Guinness Eye Hospital, Onitsha, Nigeria. Ophthalmic Epidemiol. 2000, 7, 41–48. [Google Scholar] [CrossRef]
- Leske, M.C.; Wu, S.-Y.; Nemesure, B.; Hennis, A. Causes of visual loss and their risk factors: An incidence summary from the Barbados Eye Studies. Rev. Panam. Salud Pública 2010, 27, 259–267. [Google Scholar] [CrossRef] [PubMed]
- Haider, S.; Sadiq, S.N.; Moore, D.; Price, M.J.; Nirantharakumar, K. Prognostic prediction models for diabetic retinopathy progression: A systematic review. Eye 2019, 33, 702–713. [Google Scholar] [CrossRef] [PubMed]
- Van der Heijden, A.A.; Nijpels, G.; Badloe, F.; Lovejoy, H.L.; Peelen, L.; Feenstra, T.; Moons, K.; Sliecker, R.; Herings, R.; Elders, P.; et al. Prediction models for development of retinopathy in people with type 2 diabetes: Systematic review and external validation in a Dutch primary care setting. Diabetologia 2020, 63, 1110–1119. [Google Scholar] [CrossRef] [PubMed]
- Public Health England. NHS Diabetic Eye Screening Programme-Overview of Patient Pathway, Grading Pathway, Surveillance Pathways and Referral Pathways; 2017. Available online: https://assets.publishing.service.gov.uk/government/uploads/system/uploads/attachment_data/file/648658/Diabetic_Eye_Screening_pathway_overviews.pdf (accessed on 27 June 2021).
- Stratton, I.; Kohner, E.M.; Aldington, S.; Turner, R.C.; Holman, R.R.; Manley, S.E.; Matthews, D.R. UKPDS 50: Risk factors for incidence and progression of retinopathy in Type II diabetes over 6 years from diagnosis. Diabetologia 2001, 44, 156–163. [Google Scholar] [CrossRef] [PubMed] [Green Version]
- Younis, N.; Broadbent, D.M.; Vora, J.P.; Harding, S. Incidence of sight-threatening retinopathy in patients with type 2 diabetes in the Liverpool Diabetic Eye Study: A cohort study. Lancet 2003, 361, 195–200. [Google Scholar] [CrossRef]
- Jones, C.D.; Greenwood, R.H.; Misra, A.; Bachmann, M.O. Incidence and Progression of Diabetic Retinopathy During 17 Years of a Population-Based Screening Program in England. Diabetes Care 2012, 35, 592–596. [Google Scholar] [CrossRef] [Green Version]
- McKay, A.J.; Gunn, L.H.; Nugawela, M.D.; Sathish, T.; Majeed, A.; Vamos, E.; Molina, G.; Sivaprasad, S. Associations between attainment of incentivized primary care indicators and incident sight-threatening diabetic retinopathy in England: A population-based historical cohort study. Diabetes Obes. Metab. 2021, 23, 1322–1330. [Google Scholar] [CrossRef]
- McKay, A.J.; Gunn, L.H.; Sathish, T.; Vamos, E.; Nugawela, M.; Majeed, A.; Molina, G.; Sivaprasad, S. Associations between attainment of incentivised primary care indicators and incident diabetic retinopathy in England: A population-based historical cohort study. BMC Med. 2021, 19, 1–10. [Google Scholar] [CrossRef]
- Sivaprasad, S.; Gupta, B.; Gulliford, M.C.; Dodhia, H.; Mann, S.; Nagi, D.; Evans, J. Ethnic Variation in the Prevalence of Visual Impairment in People Attending Diabetic Retinopathy Screening in the United Kingdom (DRIVE UK). PLoS ONE 2012, 7, e39608. [Google Scholar] [CrossRef] [Green Version]
- Lawrenson, J.G.; Bourmpaki, E.; Bunce, C.; Stratton, I.M.; Gardner, P.; Anderson, J. EROS Study Group Trends in diabetic retinopathy screening attendance and associations with vision impairment attributable to diabetes in a large nationwide cohort. Diabet. Med. 2021, 38, e14425. [Google Scholar] [CrossRef] [PubMed]
- National Health Service. The National Health Service (General Medical Services Contracts and Personal Medical Services Agreements) (Amendment) (No. 3) Regulations 2020. 2020. Available online: https://www.legislation.gov.uk/uksi/2020/1415/made (accessed on 27 July 2021).
- Nuffield Trust. Ethnicity Coding in English Health Service Datasets. 10/12/2020. 2021. Available online: https://www.nuffieldtrust.org.uk/project/ethnicity-coding-in-english-health-service-datasets#timelines (accessed on 10 December 2020).
- Hull, S.; Mathur, R.; Boomla, K.; Chowdhury, T.A.; Dreyer, G.; Alazawi, W.; Robson, J. Research into practice: Understanding ethnic differences in healthcare usage and outcomes in general practice. Br. J. Gen. Pr. 2014, 64, 653–655. [Google Scholar] [CrossRef] [PubMed] [Green Version]
- Mastropasqua, R.; Luo, Y.H.-L.; Cheah, Y.S.; Egan, C.; Lewis, J.; Da Cruz, L. Black patients sustain vision loss while White and South Asian patients gain vision following delamination or segmentation surgery for tractional complications associated with proliferative diabetic retinopathy. Eye 2017, 31, 1468–1474. [Google Scholar] [CrossRef] [PubMed] [Green Version]


| Whole Population | White | South Asian | Black | Other | |
|---|---|---|---|---|---|
| N = 32,652 | N = 8727 | N = 15,291 | N = 6639 | N = 1995 | |
| >Age at T2DM diagnosis, years | |||||
| <45 | 10,136 (31.0) | 1423 (16.3) | 6536 (42.7) | 1678 (25.3) | 499 (25.0) |
| 45 to <55 | 9352 (28.6) | 2258 (25.9) | 4329 (28.3) | 2176 (32.8) | 589 (29.5) |
| 55 to <65 | 6789 (20.8) | 2360 (27.0) | 2530 (16.6) | 1369 (20.6) | 530 (26.6) |
| 65 to <75 | 4091 (12.5) | 1622 (18.6) | 1269 (8.3) | 947 (14.3) | 253 (12.7) |
| 75+ | 2284 (6.9) | 1064 (12.2) | 627 (4.1) | 469 (7.1) | 124 (6.2) |
| Gender | |||||
| Male | 18,332 (56.1) | 5064 (58.0) | 8842 (57.8) | 3381 (50.9) | 1045 (52.4) |
| Female | 14,320 (43.8) | 3663 (41.9) | 6449 (42.2) | 3258 (49.1) | 950 (47.7) |
| Townsend Score (quintiles) | |||||
| 1 (most affluent) | 6874 (21.0) | 1484 (17.0) | 4043 (26.4) | 978 (14.7) | 369 (18.5) |
| 2 | 6795 (20.8) | 1766 (20.2) | 3159 (20.7) | 1425 (21.5) | 445 (22.3) |
| 3 | 6409 (19.6) | 1931 (22.1) | 2708 (17.7) | 1369 (20.6) | 401 (20.1) |
| 4 | 6335 (19.4) | 1774 (20.3) | 2807 (18.4) | 1390 (20.9) | 364 (18.3) |
| 5 (most deprived) | 6130 (18.8) | 1739 (19.9) | 2535 (16.6) | 1448 (21.8) | 408 (20.4) |
| Not recorded | 109 (0.3) | 33 (0.4) | 39 (0.3) | 29 (0.4) | 8 (0.4) |
| Body Mass Index (kg/m2) | |||||
| <18.5 | 321(1.0) | 71 (0.8) | 167 (1.1) | 51 (0.8) | 32 (1.6) |
| 18.5 to <25 | 4627 (14.2) | 686 (7.9) | 3002 (19.6) | 610 (9.2) | 329 (16.5) |
| 25 to <30 | 10,979 (33.7) | 1990 (22.8) | 6381 (41.7) | 1951 (29.4) | 657 (32.9) |
| ≥30 | 14067 (43.1) | 5094 (58.4) | 4706 (30.8) | 3494 (52.6) | 773 (38.7) |
| Not recorded | 2658 (8.2) | 886 (10.2) | 1035 (6.8) | 533 (8.0) | 204 (10.3) |
| HbA1c (mmol/mol) | |||||
| <50 | 6927 (21.2) | 2198 (25.2) | 2912 (19.0) | 1399 (21.1) | 418 (20.9) |
| 50 to <100 | 18, 368 (56.2) | 4626 (53.0) | 9002 (58.9) | 3602 (54.3) | 1138 (57.0) |
| ≥100 | 2561 (7.8) | 627 (7.6) | 970 (6.3) | 795 (11.9) | 169 (8.5) |
| Not recorded | 4796 (14.7) | 1276 (14.6) | 2407 (15.7) | 843 (12.7) | 270 (13.5) |
| Systolic Blood Pressure (mmHg) | |||||
| <120 | 6396 (19.6) | 1224 (14.0) | 3897 (25.5) | 918 (13.8) | 357 (17.9) |
| 120 to <130 | 7537 (23.1) | 1891 (21.7) | 3865 (25.3) | 1315 (20.2) | 430 (21.6) |
| 130 to <140 | 8468 (25.9) | 2404 (27.5) | 3756 (24.6) | 1792 (27.0) | 516 (25.8) |
| ≥140 | 9273 (28.4) | 2943 (33.7) | 3348 (22.0) | 2367 (35.6) | 615 (30.8) |
| Not recorded | 978 (3.0) | 265 (3.0) | 425 (2.8) | 211 (3.2) | 77 (3.9) |
| Total Cholesterol (mmol/L) | |||||
| <5.2 | 17,072 (52.3) | 4537 (52.0) | 8221 (53.8) | 3351 (50.5) | 963 (48.3) |
| 5.2 to <6.2 | 8188 (25.1) | 2068 (23.7) | 3898 (25.5) | 1719 (25.9) | 503 (25.2) |
| ≥6.2 | 5413 (16.6) | 1542 (17.7) | 2359 (15.4) | 1127 (16.8) | 385 (19.3) |
| Not recorded | 1979 (6.1) | 580 (6.6) | 813 (5.3) | 442 (6.7) | 144 (7.2) |
| eGFR (mL/min/1.73m2) | |||||
| <60 | 2546 (7.8) | 939 (10.8) | 738 (4.8) | 747 (11.3) | 122 (6.2) |
| ≥60 | 27,832 (85.2) | 7219 (82.7) | 13,461 (88.0) | 5438 (81.9) | 1714 (85.9) |
| Not recorded | 2274 (7.1) | 569 (6.5) | 1092 (7.1) | 454 (6.8) | 159 (7.9) |
| History of Cardiovascular Disease | |||||
| No | 29,532 (90.4) | 7339 (84.1) | 14,135 (92.4) | 6233 (93.8) | 1825 (91.5) |
| Yes | 3120 (9.6) | 1388 (15.9) | 1156 (7.4) | 406 (6.2) | 170 (8.5) |
| History of Antidiabetic | 21,779 (66.7) | 6002 (66.8) | 10,037 (65.6) | 4409 (66.4) | 1331 (66.7) |
| No drug | 10,873 (31.3) | 2725 (31.2) | 5254 (34.4) | 2230 (33.6) | 664 (33.3) |
| One drug | |||||
| History of Antihypertensive Medication | |||||
| No | 17,620 (53.9) | 3935 (45.1) | 9396 (61.4) | 3232 (48.7) | 1057 (53.0) |
| Yes | 15,032 (46.0) | 4792 (54.9) | 5895 (38.6) | 3407 (51.3) | 938 (47.0) |
| History of Statin Medication | |||||
| No | 6229 (19.1) | 1495 (17.1) | 2553 (16.7) | 1749 (26.3) | 432 (21.7) |
| Yes | 26,423 (80.9) | 7232 (82.9) | 12,738 (83.5) | 4890 (73.7) | 1563 (78.3) |
| Whole Population | White | South Asian | Black | Other | |
|---|---|---|---|---|---|
| N = 25,564 | N = 6946 | N = 11,963 | N = 5216 | N = 1439 | |
| Age, Years | |||||
| <45 | 4956 (19.4) | 738 (10.6) | 3055 (25.5) | 923 (17.7) | 243 (16.9) |
| 45 to <55 | 6207 (24.3) | 1357 (19.5) | 3297 (27.5) | 1213 (23.3) | 340 (23.7) |
| 55 to <65 | 5860 (22.9) | 1827 (26.3) | 2495 (20.8) | 1134 (21.7) | 404 (28.0) |
| 65 to <75 | 5407 (21.1) | 1628 (23.4) | 2218 (18.5) | 1258 (24.1) | 303 (21.0) |
| 75+ | 3134 (12.2) | 1396 (20.1) | 901 (7.5) | 688 (13.2) | 149 (10.3) |
| Duration of Diabetes | |||||
| 0 to <2 years (ref) | 4030 (15.8) | 1089 (15.7) | 1875 (15.7) | 806 (15.5) | 260 (18.1) |
| 2 to <5 years | 6835 (26.7) | 1891 (27.2) | 3177 (26.6) | 1368 (26.2) | 399 (27.7) |
| 5 to <10 years | 8125 (31.8) | 2281 (32.8) | 3799 (31.7) | 1642 (31.5) | 403 (28.0) |
| ≥10 years | 6574 (25.7) | 1685 (24.3) | 3112 (26.0) | 1400 (26.8) | 377 (26.1) |
| Gender | |||||
| Male | 13,289 (51.9) | 3724 (53.6) | 6333 (52.9) | 2524 (48.4) | 708 (49.2) |
| Female | 12,275 (48.0) | 3222 (46.4) | 5630 (47.1) | 2692 (51.6) | 731 (50.8) |
| Townsend Score (quintiles) | |||||
| 1 | 4812 (18.8) | 1016 (14.6) | 2774 (23.2) | 762 (14.6) | 260 (18.0) |
| 2 | 4840 (18.9) | 1270 (18.3) | 2264 (18.9) | 1021 (19.6) | 285 (19.8) |
| 3 | 5110 (20.0) | 1622 (23.4) | 2161 (18.3) | 1036 (19.9) | 291 (20.2) |
| 4 | 5366 (20.9) | 1537 (22.1) | 2432 (20.3) | 1151 (22.1) | 246 (17.1) |
| 5 | 5373 (21.0) | 1488 (21.4) | 2307 (19.3) | 1227 (23.5) | 351 (24.4) |
| Not recorded | 63 (0.3) | 13 (0.2) | 25 (0.2) | 19 (0.4) | 6 (0.4) |
| Body Mass Index (kg/m2) | |||||
| <18.5 | 389 (1.5) | 83 (1.2) | 216 (1.8) | 56 (1.1) | 34 (2.4) |
| 18.5 to <25 | 4608 (18.0) | 646 (9.3) | 2999 (25.1) | 675 (12.9) | 288 (20.0) |
| 25 to <30 | 8745 (34.2) | 1778 (25.6) | 4788 (40.0) | 1723 (33.0) | 456 (31.6) |
| ≥30 | 8966 (35.1) | 3466 (49.9) | 2814 (23.5) | 2191 (42.0) | 495 (34.4) |
| Not recorded | 2856 (11.2) | 973 (14.0) | 1146 (9.6) | 571 (10.9) | 166 (11.5) |
| HbA1c (mmol/mol) | |||||
| <50 | 5692 (22.3) | 1897 (27.3) | 2307 (19.3) | 1177 (22.6) | 312 (21.7) |
| 50 to <100 | 15,362 (60.1) | 3794 (54.6) | 7701 (64.4) | 3005 (57.6) | 862 (59.9) |
| ≥100 | 1644 (6.4) | 373 (5.4) | 702 (5.8) | 474 (9.1) | 95 (6.6) |
| Not recorded | 2866 (11.2) | 882 (12.7) | 1254 (10.5) | 560 (10.7) | 170 (11.8) |
| Systolic Blood Pressure (mmHg) | |||||
| <120 | 5347 (20.9) | 1129 (16.2) | 3166 (26.5) | 774 (14.8) | 279 (19.4) |
| 120 to <130 | 5733 (22.4) | 1436 (20.7) | 2945 (24.6) | 1058 (20.3) | 294 (20.5) |
| 130 to <140 | 6313 (24.7) | 1887 (27.2) | 2699 (22.5) | 1365 (26.2) | 362 (25.2) |
| ≥140 | 7600 (29.7) | 2318 (33.3) | 2929 (24.5) | 1881 (36.0) | 472 (32.7) |
| Not recorded | 571 (2.2) | 176 (2.5) | 225 (1.9) | 138 (2.7) | 32 (2.2) |
| Total Cholesterol (mmol/L) | |||||
| <5.2 | 18,456 (72.2) | 4904 (70.6) | 8949 (74.8) | 3605 (69.1) | 998 (69.4) |
| 5.2 to <6.2 | 3237 (12.7) | 883 (12.7) | 1388 (11.6) | 767 (14.7) | 199 (13.8) |
| ≥6.2 | 1643 (6.4) | 465 (6.7) | 677 (5.7) | 376 (7.2) | 125 (8.7) |
| Not recorded | 2228 (8.7) | 694 (9.9) | 949 (7.9) | 468 (8.9) | 117 (8.1) |
| eGFR (mL/min/1.73m2) | |||||
| <60 | 2978 (11.7) | 1036 (14.9) | 1126 (9.4) | 678 (13.0) | 138 (9.6) |
| ≥60 | 20,160 (78.8) | 5140 (74.0) | 9813 (82.0) | 4039 (77.4) | 1168 (81.2) |
| Not recorded | 2426 (9.5) | 770 (11.1) | 1024 (8.6) | 499 (9.6) | 133 (9.2) |
| History of Cardiovascular Disease | |||||
| No | 21,734 (85.0) | 5474 (78.8) | 10,338 (86.4) | 4669 (89.5) | 1253 (87.1) |
| Yes | 3830 (15.0) | 1472 (21.2) | 1625 (13.6) | 547 (10.5) | 186 (12.9) |
| History of Antidiabetic Drugs | |||||
| No drug | 4470 (17.5) | 1508 (21.7) | 1750 (14.6) | 954 (18.3) | 258 (17.9) |
| One drug | 7244 (28.3) | 1988 (28.6) | 3414 (28.5) | 1403 (26.9) | 439 (30.5) |
| Two drugs | 9356 (36.6) | 2242 (32.3) | 4781 (40.0) | 1832 (35.1) | 501 (34.8) |
| Insulin | 4494 (17.6) | 1208 (17.4) | 2018 (16.9) | 1027 (19.7) | 241 (16.8) |
| History of Antihypertensive Medication | |||||
| No | 8880 (34.7) | 2003 (28.8) | 4562 (38.1) | 1770 (33.9) | 545 (37.9) |
| Yes | 16,684 (65.3) | 4943 (71.2) | 7401 (61.9) | 3446 (66.1) | 894 (62.1) |
| History of Statin Medication—ever | |||||
| No | 2528 (9.9) | 741 (10.7) | 763 (6.4) | 831 (15.9) | 193 (13.4) |
| Yes | 23,036 (90.1) | 6205 (89.3) | 11,200 (93.6) | 4385 (84.1) | 1246 (86.6) |
| People with Newly Diagnosed T2DM at Baseline | |||||||||
|---|---|---|---|---|---|---|---|---|---|
| Ethnicity | Total Number of People | DR | STDR | ||||||
| Number of Events | Percentage with Events | Person-Years | Incidence Rate per 1000 Person Years (95% CI) | Number of Events | Percentage with Events | Person-Years | Incidence Rate per 1000 Person Years (95% CI) | ||
| Whole Population | 32,652 | 8638 | 26.5 | 104,257.8 | 82.85 (81.12–84.61) | 557 | 1.7 | 132,126.7 | 4.21 (3.88–4.58) |
| White | 8727 | 2227 | 25.5 | 29,624.4 | 75.17 (72.12–78.36) | 137 | 1.6 | 37,185.5 | 3.68 (3.11–4.35) |
| South Asian | 15,291 | 4035 | 26.4 | 47,448.6 | 85.04 (82.45–87.70) | 229 | 1.5 | 60,163.5 | 3.81 (3.34–4.33) |
| Black | 6639 | 1833 | 27.6 | 20,953.3 | 87.48 (83.56–91.58) | 152 | 2.3 | 26,854.9 | 5.66 (4.83–6.63) |
| Other | 1995 | 543 | 27.2 | 6231.5 | 87.13 (80.11–94.78) | 39 | 1.9 | 7922.8 | 4.92 (3.59–6.73) |
| People with Known T2DM at Baseline | |||||||||
| Ethnicity | Total Number of People | DR | STDR | ||||||
| Number of Events | Percentage with Events | Person Years | Incidence Rate per 1000 Person Years (95% CI) | Number of Events | Percentage with Events | Person Years | Incidence Rate per 1000 Person Years (95% CI) | ||
| Whole Population | 25,564 | 12,124 | 47.4 | 89,534.1 | 135.41 (133.02–137.84) | 2200 | 8.6 | 137,140.3 | 16.04 (15.38–16. 72) |
| White | 6946 | 2946 | 42.4 | 25,900.1 | 113.74 (109.71–117.92) | 454 | 6.5 | 37,727.6 | 12.03 (10.97–13.19) |
| South Asian | 11,963 | 6100 | 50.9 | 40,447.5 | 150.81 (147.07–154.64) | 1145 | 9.6 | 64,136.8 | 17.85 (16.84–18.91) |
| Black | 5216 | 2422 | 46.4 | 18,134.7 | 133.56 (128.37–138.98) | 480 | 9.2 | 27,699.3 | 17.32 (15.84–18.94) |
| Other | 1439 | 656 | 45.6 | 5051.9 | 129.85 (120.28–140.18) | 121 | 8.4 | 7576.5 | 15.97 (13.36–19.08) |
| DR | STDR | |||
|---|---|---|---|---|
| Adjusted HR | p Value | Adjusted HR | p Value | |
| Ethnic Group | ||||
| White (ref) | 1 | 1 | ||
| South Asian | ||||
| Indian | 1.10 (1.01–1.19) | 0.029 | 0.86 (0.60–1.21) | 0.377 |
| Pakistani | 1.14 (1.03–1.25) | 0.011 | 1.36 (0.95–1.94) | 0.094 |
| Bangladeshi | 1.02 (0.95–1.09) | 0.733 | 0.80 (0.61–1.05) | 0.107 |
| Black | ||||
| Caribbean | 1.07 (0.98–1.17) | 0.178 | 1.18 (0.85–1.65) | 0.315 |
| African | 1.16 (1.07–1.26) | <0.001 | 1.36 (1.02–1.83) | 0.039 |
| Mixed and other | ||||
| Mixed | 1.02 (0.86–1.21) | 0.878 | 1.37 (0.76–2.48) | 0.296 |
| Other | 1.10 (1.03–1.19) | 0.012 | 1.26 (0.95–1.67) | 0.108 |
| Age at Study Entry, Years | ||||
| <45 | 1.21 (1.09–1.35) | 0.001 | 0.84 (0.56–1.25) | 0.392 |
| 45–54 | 1.15 (1.04–1.27) | 0.011 | 0.98 (0.67–1.43) | 0.897 |
| 55–64 | 1.10 (0.99–1.22) | 0.089 | 0.79 (0.54–1.17) | 0.236 |
| 65–74 | 0.99 (0.89–1.10) | 0.728 | 0.93 (0.63–1.38) | 0.735 |
| 75+ | 1 | 1 | ||
| Gender | ||||
| Female | 1 | 1 | ||
| Male | 1.12(1.07–1.17) | <0.001 | 1.22 (1.02–1.47) | 0.001 |
| Townsend Score (quintiles) | ||||
| 1 (affluent) | 1 | 1 | ||
| 2 | 0.93 (0.88–1.00) | 0.028 | 0.83 (0.63–1.09) | 0.176 |
| 3 | 0.95 (0.88–1.01) | 0.072 | 1.05 (0.80–1.38) | 0.724 |
| 4 | 0.95 (0.89–1.02) | 0.105 | 1.24 (0.96–1.62) | 0.104 |
| 5 (deprived) | 0.90 (0.84–0.97) | 0.002 | 1.18 (0.90–1.54) | 0.229 |
| Not recorded | 0.58 (0.38–0.90) | 0.015 | 0.51 (0.07–3.63) | 0.497 |
| Body Mass Index (kg/m2) | ||||
| <18.5 | 1 | 1 | ||
| 18.5–25 | 1.00 (0.81–1.24) | 0.97 | 0.66 (0.37–1.17) | 0.157 |
| 25–30 | 0.90 (0.73–1.12) | 0.322 | 0.47 (0.27–0.82) | 0.008 |
| ≥30 | 0.87 (0.70–1.07) | 0.172 | 0.32 (0.18–0.57) | <0.001 |
| Not recorded | 0.73 (0.58–0.91) | 0.005 | 0.24 (0.12–0.48) | <0.001 |
| HbA1c (mmol/mol) | ||||
| <50 | 1 | 1 | ||
| 50–99 | 1.19 (1.12–1.26) | <0.001 | 1.43 (1.10–1.84) | 0.007 |
| ≥ 100 | 1.70 (1.57–1.85) | <0.001 | 3.68 (2.73–4.95) | <0.001 |
| Not recorded | 1.07 (0.98–1.16) | 0.143 | 1.31 (0.92–1.87) | 0.13 |
| Systolic Blood Pressure—SBP (mmHg) | ||||
| <120 | 1 | 1 | ||
| 120–129 | 1.05 (0.98–1.12) | 0.237 | 1.13 (0.85–1.51) | 0.385 |
| 130–140 | 1.07 (1.01–1.15) | 0.05 | 1.23 (0.93–1.62) | 0.147 |
| ≥140 | 1.25 (1.17–1.33) | <0.001 | 1.88 (1.45–2.44) | <0.001 |
| Not recorded | 0.95 (0.80–1.14) | 0.551 | 0.98 (0.47–2.02) | 0.947 |
| Total Cholesterol (mmol/L) | ||||
| <5.2 | 1 | 1 | ||
| 5.2- 6.1 | 0.97 (0.92–1.02) | 0.195 | 0.83 (0.67–1.02) | 0.081 |
| ≥6.2 | 1.01 (0.95–1.08) | 0.795 | 0.94 (0.75–1.19) | 0.622 |
| Not recorded | 0.91 (0.80–1.03) | 0.13 | 1.37 (0.89–2.11) | 0.149 |
| eGFR (mL/min/1.73m2) | ||||
| ≥60 | 1 | 1 | ||
| <60 | 1.09 (1.00–1.19) | 0.057 | 1.32 (0.97–1.79) | 0.077 |
| Not recorded | 1.00 (0.90–1.12) | 0.968 | 1.20 (0.80–1.79) | 0.375 |
| Cardiovascular Disease History—ever | ||||
| No | 1 | 1 | ||
| Yes | 1.05 (0.97–1.13) | 0.304 | 1.06 (0.77–1.46) | 0.722 |
| Antidiabetic Drugs History—ever Closest Record to Baseline | ||||
| No drug | 1 | 1 | ||
| One drug | 0.97 (0.93–1.02) | 0.142 | 0.97 (0.81–1.16) | 0.725 |
| History of Antihypertensive Medication | ||||
| No | 1 | 1 | ||
| Yes | 1.02 (0.97–1.07) | 0.495 | 0.77 (0.63–0.93) | 0.008 |
| Statin History | ||||
| No | 1 | 1 | ||
| Yes | 1.12 (1.07–1.18) | <0.001 | 1.20 (0.99–1.46) | 0.066 |
| DR | STDR | |||
|---|---|---|---|---|
| Adjusted HR | p Value | Adjusted HR | p Value | |
| Ethnic Group | ||||
| White (ref) | 1 | 1 | ||
| South Asian | ||||
| Indian | 1.24 (1.16–1.33) | <0.001 | 1.39 (1.18–1.63) | <0.001 |
| Pakistani | 1.20 (1.11–1.30) | <0.001 | 1.28 (1.05–1.55) | 0.016 |
| Bangladeshi | 1.11 (1.05–1.17) | <0.001 | 1.36 (1.19–1.55) | <0.001 |
| Black | ||||
| Caribbean | 1.09 (1.01–1.16) | 0.02 | 1.22 (1.04–1.43) | 0.016 |
| African | 1.06 (0.98–1.14) | 0.145 | 1.10 (0.92–1.33) | 0.294 |
| Mixed and Other | ||||
| Mixed | 1.10 (0.96–1.26) | 0.19 | 1.17 (0.85–1.61) | 0.328 |
| Other | 1.03 (0.97–1.11) | 0.335 | 1.25 (1.07–1.47) | 0.006 |
| Duration of Diabetes | ||||
| 0 to <2 years (ref) | 1 | 1 | ||
| 2 to <5 years | 1.17 (1.10–1.24) | <0.001 | 1.18 (0.99–1.40) | 0.059 |
| 5 to <10 years | 1.37 (1.29–1.45) | <0.001 | 1.40 (1.18–1.66) | <0.001 |
| ≥10 years | 1.83 (1.71–1.96) | <0.001 | 2.46 (2.06–2.90) | <0.001 |
| Age at Study Entry, Years | ||||
| <45 | 1.52 (1.40–1.66) | <0.001 | 1.68 (1.37–2.05) | <0.001 |
| 45–54 | 1.51 (1.40–1.62) | <0.001 | 1.91 (1.60–2.29) | <0.001 |
| 55–64 | 1.32 (1.23–1.42) | <0.001 | 1.41 (1.18–1.68) | <0.001 |
| 65–74 | 1.15 (1.07–1.23) | <0.001 | 1.35 (1.14–1.61) | 0.001 |
| 75+ | 1 | 1 | ||
| Gender | ||||
| Female | 1 | 1 | ||
| Male | 1.10 (1.06–1.14) | <0.001 | 1.15 (1.06–1.26) | 0.001 |
| Townsend Score (quintiles) | ||||
| 1 | 1 | 1 | ||
| 2 | 0.95 (0.89–1.00) | 0.067 | 1.06 (0.91–1.22) | 0.495 |
| 3 | 0.97 (0.91–1.02) | 0.247 | 1.22 (1.06–1.40) | 0.005 |
| 4 | 0.91 (0.86–0.97) | 0.003 | 1.22 (1.06–1.40) | 0.005 |
| 5 | 0.95 (0.89–1.00) | 0.088 | 1.30 (1.13–1.49) | <0.001 |
| Not recorded | 0.86 (0.58–1.28) | 0.462 | 0.46 (0.11–1.88) | 0.286 |
| Body Mass Index (kg/m2) | ||||
| <18.5 | 1 | 1 | ||
| 18.5–25 | 1.03 (0.88–1.20) | 0.703 | 0.94 (0.66–1.35) | 0.756 |
| 25–30 | 1.00 (0.86–1.18) | 0.94 | 0.89 (0.63–1.27) | 0.551 |
| ≥30 | 0.91 (0.78–1.07) | 0.261 | 0.76 (0.53–1.08) | 0.132 |
| Not recorded | 0.96 (0.81–1.13) | 0.63 | 1.06 (0.74–1.53) | 0.72 |
| HbA1c (mmol/mol) | ||||
| <50 | 1 | 1 | ||
| 50–99 | 1.29 (1.23–1.36) | <0.001 | 1.62 (1.40–1.87) | <0.001 |
| ≥100 | 1.83 (1.69–1.98) | <0.001 | 3.20 (2.68–3.83) | <0.001 |
| Not recorded | 1.00 (0.92–1.09) | 0.905 | 1.53 (1.25–1.88) | <0.001 |
| Systolic Blood Pressure—SBP (mmHg) | ||||
| <120 | 1 | 1 | ||
| 120–129 | 1.12 (1.05–1.18) | <0.001 | 1.26 (1.09–1.45) | 0.001 |
| 130–140 | 1.16 (1.10–1.23) | <0.001 | 1.34 (1.17–1.55) | <0.001 |
| ≥140 | 1.28 (1.21–1.35) | <0.001 | 1.80 (1.57–2.05) | <0.001 |
| Not recorded | 0.97 (0.84–1.13) | 0.709 | 1.17 (0.83–1.63) | 0.356 |
| Total Cholesterol (mmol/L) | ||||
| <5.2 | 1 | 1 | ||
| 5.2–6.1 | 0.96 (0.91–1.02) | 0.197 | 1.01 (0.88–1.15) | 0.871 |
| ≥6.2 | 0.96 (0.89–1.03) | 0.233 | 1.04 (0.88–1.24) | 0.593 |
| Not recorded | 0.99 (0.91–1.07) | 0.857 | 1.07 (0.89–1.27) | 0.473 |
| eGFR (mL/min/1.73m2) | ||||
| ≥60 | 1 | 1 | ||
| <60 | 1.10 (1.04–1.17) | 0.001 | 1.35 (1.19–1.54) | <0.001 |
| Not recorded | 1.05 (0.98–1.14) | 0.178 | 1.10 (0.93–1.30) | 0.279 |
| History of Cardiovascular Disease | ||||
| No | 1 | 1 | ||
| Yes | 0.98 (0.93–1.04) | 0.584 | 0.96 (0.85–1.08) | 0.514 |
| History of Antidiabetic Drugs History- | ||||
| No drug | 1 | 1 | ||
| One drug | 1.01 (0.94–1.07) | 0.854 | 0.82 (0.68–0.98) | 0.035 |
| Two drugs | 1.26 (1.18–1.34) | <0.001 | 1.36 (1.15–1.60) | <0.001 |
| Insulin | 1.77 (1.65–1.89) | <0.001 | 2.72 (2.30–3.21) | <0.001 |
| History of Antihypertensives | ||||
| No | 1 | 1 | ||
| Yes | 0.99 (0.95–1.04) | 0.752 | 1.00 (0.89–1.12) | 0.993 |
| History of Statin | ||||
| No | 1 | 1 | ||
| Yes | 1.07 (1.01–1.13) | 0.008 | 0.96 (0.85–1.08) | 0.519 |
Publisher’s Note: MDPI stays neutral with regard to jurisdictional claims in published maps and institutional affiliations. |
© 2021 by the authors. Licensee MDPI, Basel, Switzerland. This article is an open access article distributed under the terms and conditions of the Creative Commons Attribution (CC BY) license (https://creativecommons.org/licenses/by/4.0/).
Share and Cite
Nugawela, M.D.; Gurudas, S.; Prevost, A.T.; Mathur, R.; Robson, J.; Hanif, W.; Majeed, A.; Sivaprasad, S. Ethnic Disparities in the Development of Sight-Threatening Diabetic Retinopathy in a UK Multi-Ethnic Population with Diabetes: An Observational Cohort Study. J. Pers. Med. 2021, 11, 740. https://doi.org/10.3390/jpm11080740
Nugawela MD, Gurudas S, Prevost AT, Mathur R, Robson J, Hanif W, Majeed A, Sivaprasad S. Ethnic Disparities in the Development of Sight-Threatening Diabetic Retinopathy in a UK Multi-Ethnic Population with Diabetes: An Observational Cohort Study. Journal of Personalized Medicine. 2021; 11(8):740. https://doi.org/10.3390/jpm11080740
Chicago/Turabian StyleNugawela, Manjula D., Sarega Gurudas, A Toby Prevost, Rohini Mathur, John Robson, Wasim Hanif, Azeem Majeed, and Sobha Sivaprasad. 2021. "Ethnic Disparities in the Development of Sight-Threatening Diabetic Retinopathy in a UK Multi-Ethnic Population with Diabetes: An Observational Cohort Study" Journal of Personalized Medicine 11, no. 8: 740. https://doi.org/10.3390/jpm11080740