Article

Active Methanotrophs and Their Response to Temperature in Marine Environments: An Experimental Study

1
Key Laboratory of Gas Hydrate, Ministry of Natural Resources, Qingdao Institute of Marine Geology, Qingdao 266237, China
2
Laboratory for Marine Mineral Resources, Qingdao National Laboratory for Marine Science and Technology, Qingdao 266071, China
3
College of Marine Life Science, Ocean University of China, Qingdao 266100, China
*
Author to whom correspondence should be addressed.
J. Mar. Sci. Eng. 2021, 9(11), 1261; https://doi.org/10.3390/jmse9111261
Submission received: 21 October 2021 / Revised: 11 November 2021 / Accepted: 11 November 2021 / Published: 12 November 2021

Abstract

:
Aerobic methane (CH4) oxidation plays a significant role in marine CH4 consumption. Temperature changes resulting from, for example, global warming, have been suggested to be able to influence methanotrophic communities and their CH4 oxidation capacity. However, exact knowledge regarding temperature controls on marine aerobic methane oxidation is still missing. In this study, CH4 consumption and the methanotrophic community structure were investigated by incubating sediments from shallow (Bohai Bay) and deep marine environments (East China Sea) at 4, 15, and 28 °C for up to 250 days. The results show that the abundance of the methanotrophic population, dominated by the family Methylococcaceae (type I methanotrophs), was significantly elevated after all incubations and that aerobic methane oxidation for both areas had a strong temperature sensitivity. A positive correlation between the CH4 oxidation rate and temperature was witnessed in the Bohai Bay incubations, whereas for the East China Sea incubations, the optimum temperature was 15 °C. The systematic variations of pmoA OTUs between the Bohai Bay and East China Sea incubations indicated that the exact behaviors of CH4 oxidation rates with temperature are related to the different methanotrophic community structures in shallow and deep seas. These results are of great significance for quantitatively evaluating the biodegradability of CH4 in different marine environments.

1. Introduction

At present, gas hydrates are the most abundant source of methane on the earth [1,2,3]. A great amount of methane is released due to the decomposition of gas hydrates from submarine reservoirs [4], which are gradually consumed by anaerobic methanotrophic archaea (ANME) in anoxic sediment layers and aerobic methanotrophs in oxic layers [5,6]. Methanotrophs are a subset of methylotrophs that utilize CH4 and other C1 compounds as the sole carbon and energy sources under aerobic conditions [7,8]. Aerobic methane oxidation in natural ecosystems is, thus, one important way to control CH4 emissions in the atmosphere, reducing the potential of global warming [9,10,11,12]. Thus, better knowledge on the aerobic methane oxidation of natural ecosystems is of great significance to precisely characterize the emissions of CH4 and trends of global warming.
Temperature is an important factor that controls microbial processes. A larger number of studies have been conducted to investigate the effects of temperature on aerobic methane oxidation for various ecosystems, and they have shown the distinct response patterns of methanotrophic community structures and activities, as well as CH4 oxidation rates to temperature [13,14,15,16]. For instance, the optimum temperature of aerobic methane oxidation for most ecosystems is between 20–45 °C [7], whereas methanotrophs from acid soils in the Arctic had optimum growth temperatures of less than 10 °C [6]. The lower temperature limits for aerobic methane oxidation in nature are also different. Mohanty et al. [17] found that the lower temperature limits in rice fields and forest soil were quite different (15 °C and 5 °C, respectively), although both soils showed similar maximum aerobic methane oxidation rates at 25–35 °C. However, these studies were mainly focused on terrestrial ecosystems, and works specifically examining aerobic methane oxidation in marine ecosystems are absent.
In fact, aerobic methane oxidation in marine environments also plays a significant role in the biodegradability of CH4 in nature. Aerobic methane oxidation driven by methanotrophs is very common in shallow marine environments, such as the Santa Barbara Channel in California (at a water depth of 5–70 m) and the Coal Oil Point seep field in Bohai Bay (at a water depth of 17–23 m) [18,19]. In deep marine environments, such as hydrothermal plumes in the Okinawa Trough [20], aerobic methane oxidation has also been reported [21,22,23]. It is not hard to deduce that aerobic methane oxidation patterns in shallow marine environments should be significantly influenced by temperature, which shows evident seasonal fluctuations and is susceptible to solar radiation and sea–air heat transfer [24,25]. Although variations in temperature resulting from seasonal fluctuations may be quite limited and the bottom water temperature is usually stable (2–7 °C) for deep marine environments, it may be influenced by ocean currents [26]. The temperature sensitivity of methanotrophs is susceptible to other environmental factors, such as water content and sediment characteristics [27,28,29], and thus, the response of aerobic methane oxidation patterns to temperature in terrestrial ecosystems such as rice fields, forests, or permafrost soils may be quite different from that in marine environments [30,31]. Currently, exact knowledge regarding temperature controls on marine aerobic methane oxidation is still missing.
In this study, the CH4 consumption and methanotrophic community structures were investigated by incubating sediments from shallow (Bohai Bay) and deep marine environments (East China Sea) at 4, 15, and 28 °C. By comparing the incubations representing shallow and deep marine environments, we aimed to illustrate the exact effects of temperature on methanotroph community structures and aerobic methane oxidation patterns in marine ecosystems.

2. Materials and Methods

2.1. Sediment Source

The marine sediment samples were collected from two seas, the Shaleitian Coal Oil Point seep field of Bohai Bay (BB) and the cold seep system in the western slope of Mid-Okinawa Trough in East China Sea (ECS), which represent different water depths and temperature conditions. The sediment samples from BB and ECS were collected by a remotely operated submersible box sampler and a gravity corer, respectively. It has been reported that potential methane leakages with significant CH4 concentration anomalies exist in both areas [32,33]. In this study, the headspace methane concentrations of sediments were 10–167 μL/L in BB [34] and 33 μL/L in ECS (Table 1). Both sediment samples were confirmed to contain the methanotrophic community that can degrade CH4 via aerobic oxidation by microbial community composition in original sediments along with preliminary cultivating experiments [35]. The physical and chemical characteristics of both samples are given in Table 1. The sampling position in BB was located at a water depth of 23 m, where the surface temperature of the seafloor varies obviously from 6.3 to 28.6 °C, influenced by the seasons [36]. The BB sample used in this study was taken in July and the water temperature at the seabed was 19 °C. The water depth at another sampling position in ECS was 979 m, where the surface temperature is constant at about 4 °C. The ORP value of the BB sediment sample was −28 mV, indicating a relatively oxidized environment. The two collected samples were stored at a temperature of ~2 °C.

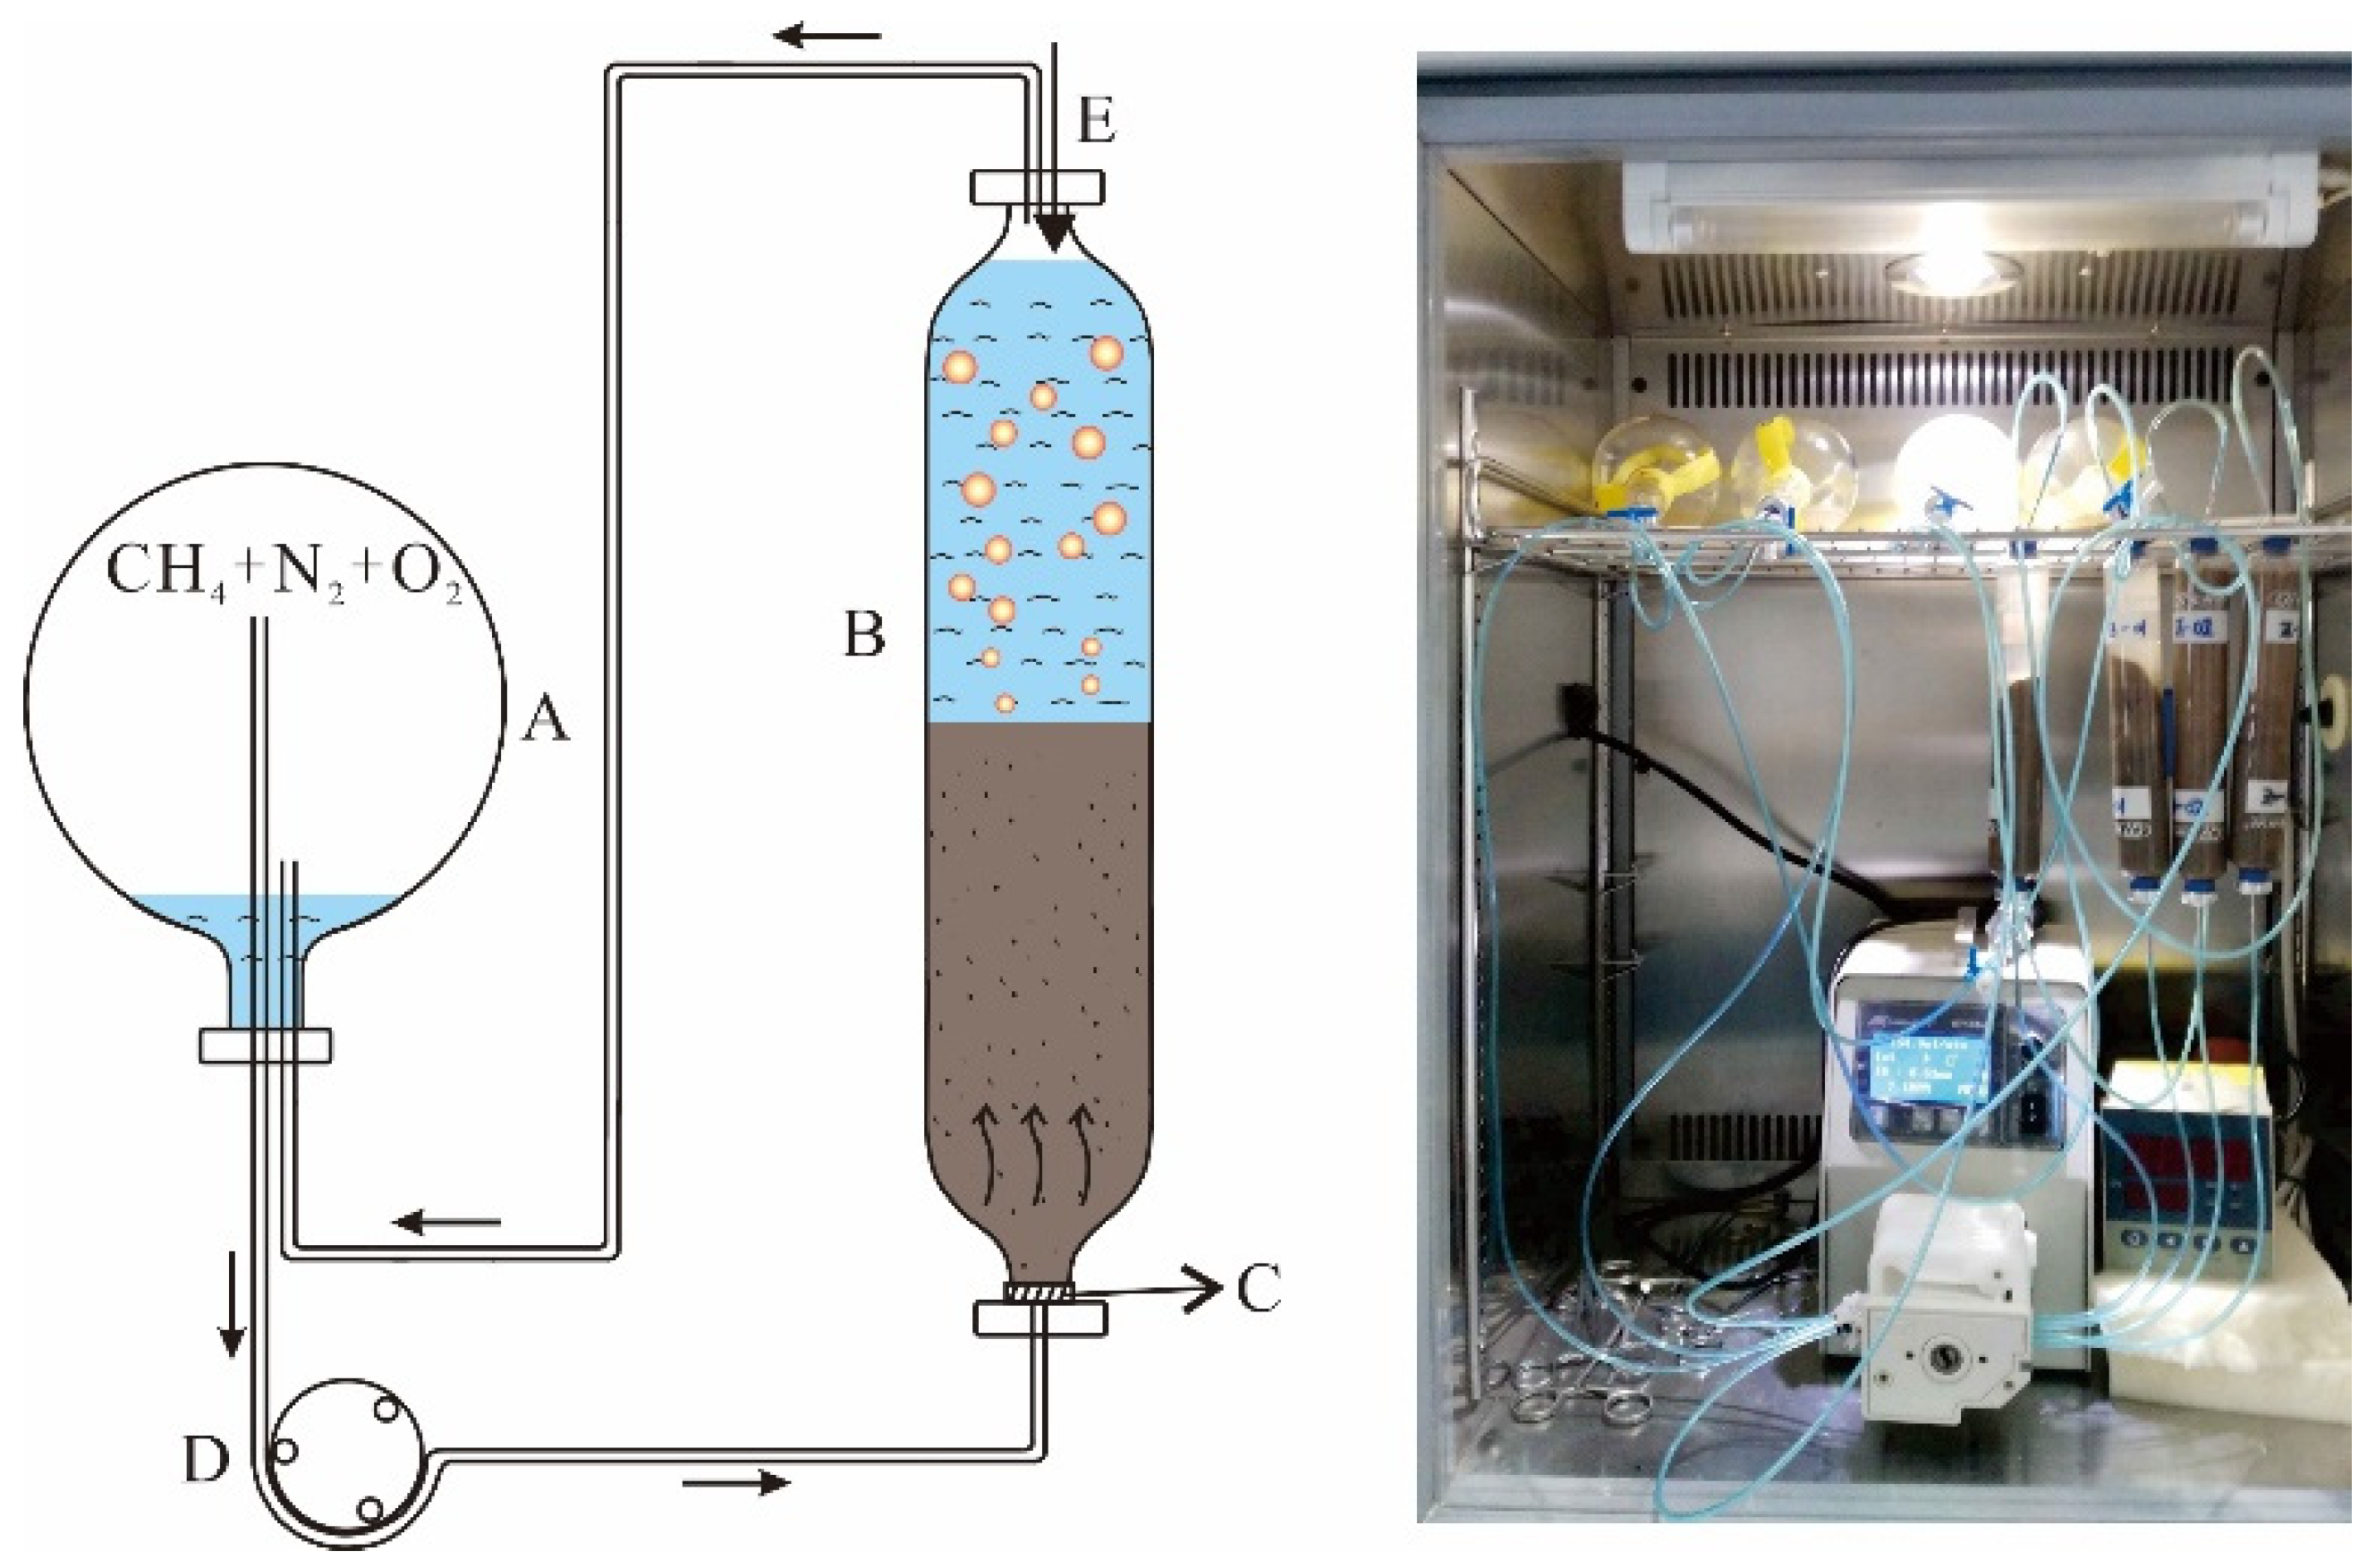
2.2. Sediment Incubations

We filled a 100 mL serum vial with 60 mL of medium and 120 g of sediment, successively, and sealed it with a butyl rubber stopper followed by an aluminum crimp cap (Figure 1). The medium was composed of (g L−1) K2HPO4 (1.5500), NaH2PO4·2H2O (1.1050), NH4Cl (2.0000), MgCl2·6H2O (0.0750), and (NH4)2SO4 (0.1000), ZnSO4·7H2O (0.0044). The medium was supplemented with 1 mL/L trace element solution. A 360 mL gas-tight glass bottle for storing gas was connected with the serum vial by two pipelines. The hermetic performance of the bottle was assured by adding about 60 mL of medium before the gas injection. On one of the pipelines, a multi-channel peristaltic pump (BT100-1L, Longer, Shanghai, China) was installed to circulate the experimental gas through the sediment column from bottom to top. In the experiment, a flow rate of 50 μL min−1 (72 mL d−1) was adjusted in the range of the CH4 flux in marine seepage [4].
After the connection, the experimental system was vacuumed for half an hour. The 360 mL glass bottle was then injected with 60 mL of CH4 and 300 mL of O2. The proportions of CH4 and O2 were determined on the basis of stoichiometry for complete CH4 oxidation, as well as the amount of organic matter in sediments. The sediment samples from two marine areas were incubated at different temperatures (4 °C, 15 °C, and 28 °C), respectively. The temperature was set according to the temperature range for CH4 oxidation in extensive shallow and deep oceans. Three incubations with different temperatures were performed in duplicate (two experimental treatments), along with one control for each sediment sample. Finally, 14 treatments were conducted for the sediments from both areas in this study. About 500 mL of ultrahigh purity (UHP) N2 was injected into each treatment as an overpressure, such that gas sampling did not draw a vacuum. An extra 60 mL of UHP N2 was added into the control as a substitute for CH4 to achieve similar pressure with the experimental treatment. All the treatments were incubated in a dark biochemical incubator (LT-BIX120L, Leadtech, Shanghai, China), with a temperature uniformity of ±0.5 °C.
CH4 oxidation in each incubation was monitored by assessing changes in gas concentrations in the headspace, microbial community compositions, and methanotrophic biomass. The headspace gases of the 100 mL serum vial were subsampled by a 100 μL Hamilton microsyringe (Hamilton 81056, Tianjin, China) for the compositional measurement at intervals of 3–7 days. The amount of gas sampled in a single sampling operation was 50 μL. At the same time as the gas subsampling, the system pressure was also measured using a pressure sensor connected to a steel needle. The accuracy of the pressure sensor is 0.001 MPa and the pressure loss of each measurement is less than ~0.002 MPa. Thus, the influence on the subsequent analyses of CH4 composition resulting from the subsampling and pressure measurement is negligible. The incubations were terminated after the complete consumption of the CH4, or after 250 days if the CH4 was not completely consumed. At the end of each temperature experiment, sediment slurries were transferred to 50 mL centrifuge tubes by centrifuging them at 9000 rpm for 10 min, discarding the supernatant, and freezing them at −20 °C for later DNA extraction.

2.3. Methane Oxidation Measurement

The oxidation of CH4 in the headspace was tracked over time using a gas chromatograph coupled with thermal conductivity and flame ionization detectors (GC-TCD/FID, Thermo, Shanghai, China). The gas chromatographic separation of the headspace gases, including CH4, CO2, N2, and O2, was performed with an HP-PLOT Q (30 m × 0.32 mm × 20.0μm) column. The column oven temperature was programmed at 60 °C for 4 min. Helium (UHP, 99.999%) was used as the carrier gas at a 3 mL/min flow rate. The gas injection was conducted in split mode with a split ratio of 10:1. The injector, TCD, and FID temperatures were set at 200 °C, 200 °C,, and 280 °C, respectively. The flow rates of hydrogen, air, and make-up gas for the FID detector were 40, 450, and 40 mL/min, respectively. Combined with CH4% (v/v) acquired by GC, headspace pressure, and temperature, the CH4 content (mmol) in the headspace was calculated with the ideal gas law.
The CH4 consumption curves of the CH4 headspace concentration vs. the incubation time at different temperatures are given. The data on the variation of CH4 oxidation rates with temperature in the BB sediments were described in our previous study [37], but we optimized the calculation method in this study. The steepest parts of the curves were selected to characterize the CH4 oxidation by calculating the CH4 oxidation rate from linear regression analysis using a minimum of six points [17,29,38]. The CH4 oxidation rates were normalized to the dry weight of the sediments.

2.4. DNA Extraction

DNA was extracted from the original sediments and the sediment slurries after incubation using the EZNA® Soil DNA kit (Omega Bio-Tek, Beijing, China) based on the manufacture’s recommended protocol. The DNA concentrations were quantified by a NanoDrop2000 Spectrophotometer. The DNA extracts were stored at −20 °C, and each extract was divided into two portions for MiSeq PE300 sequencing (Majorbio Bio-Pharm Technology Co., Ltd., Shanghai, China) and quantitative real-time PCR.

2.5. PCR Amplification, Illumina Miseq Sequencing, and Data Processing

The methanotrophic communities in the incubations were analyzed using the universal primer pair A189F-mb661R, targeting the pmoA genes (an indicator of methanotroph) for PCR amplification. The PCR amplification was performed on an ABI GeneAmp® 9700 PCR System (Applied Biosystems, Arlington, USA). The PCR reaction mixture (20 μL) contained 0.4 μL 5× FastPfu Buffer, 2 μL dNTPs (2.5 mM), 0.8 μL forward and reverse primers, 0.4 μL FastPfu Polymerase, 0.2 μL BSA, and approximately 10 ng of template DNA. The temperature cycle consisted of 95°C for 3 min, followed by 30 cycles of 95 °C for 30 s, 55 °C for 30 s, 72 °C for 45 s, and a final extension at 72 °C for 10 min.
The Illumine Miseq sequencing for PCR-amplified pmoA genes was carried out on an Illumina Miseq PE300 platform by Majorbio Bio-Pharm Technology Co., Ltd., Shanghai, China. The sequences were assigned to OTUs at a sequence similarity of 97% with UCLUST. The fgr/pmoA gene database and NCBI database project (http://www.ncbi.nlm.nih.gov, accessed on 24 September 2021) was used for taxonomic annotation analysis of the pmoA gene sequences. Relative abundances of the OTUs in each sample were performed to determine the variations of the methanotrophic community structures during the incubation.

2.6. Quantitative Real-Time PCR Assays

The quantitative real-time PCR (qPCR) assays targeting the methanotroph were performed by an ABI 7300 real-time PCR system (Applied Biosystems, Arlington, USA). Fragments of pmoA genes were amplified by the same primer sets as the PCR amplification in Illumina Miseq sequencing. The reaction component (20 μL) contained 10 μL of SYBR® Premix Ex Tag TM (Ta-KaRa, Dalian, China), 0.2 μmol L−1 of each primer, and 2 μL of template DNA. The samples were analyzed in triplicate. The results are expressed as the number of marker gene copies per gram of sediment.

2.7. Statistical Analyses and Temperature Sensitivity Calculations

Statistical analyses of the effect of temperature on the CH4 oxidation process, including biomass yields (i.e., pmoA gene copy numbers) and CH4 oxidation rates, were conducted using one-way ANOVA by IBM SPSS Statistic 25 software. The differences were considered statistically significant for p-values below 0.05 [39].
Temperature sensitivity analyses were performed using empirical descriptor Q10 values. Q10 values describe the changes in the CH4 oxidation rate when the temperature increases by 10 °C [29]. The Q10 values were calculated by the following equation:
Q 10 = ( R 2 R 1 ) 10 T 2 T 1
where R1 and R2 are the CH4 oxidation rates at the different temperatures T1 and T2.

3. Results

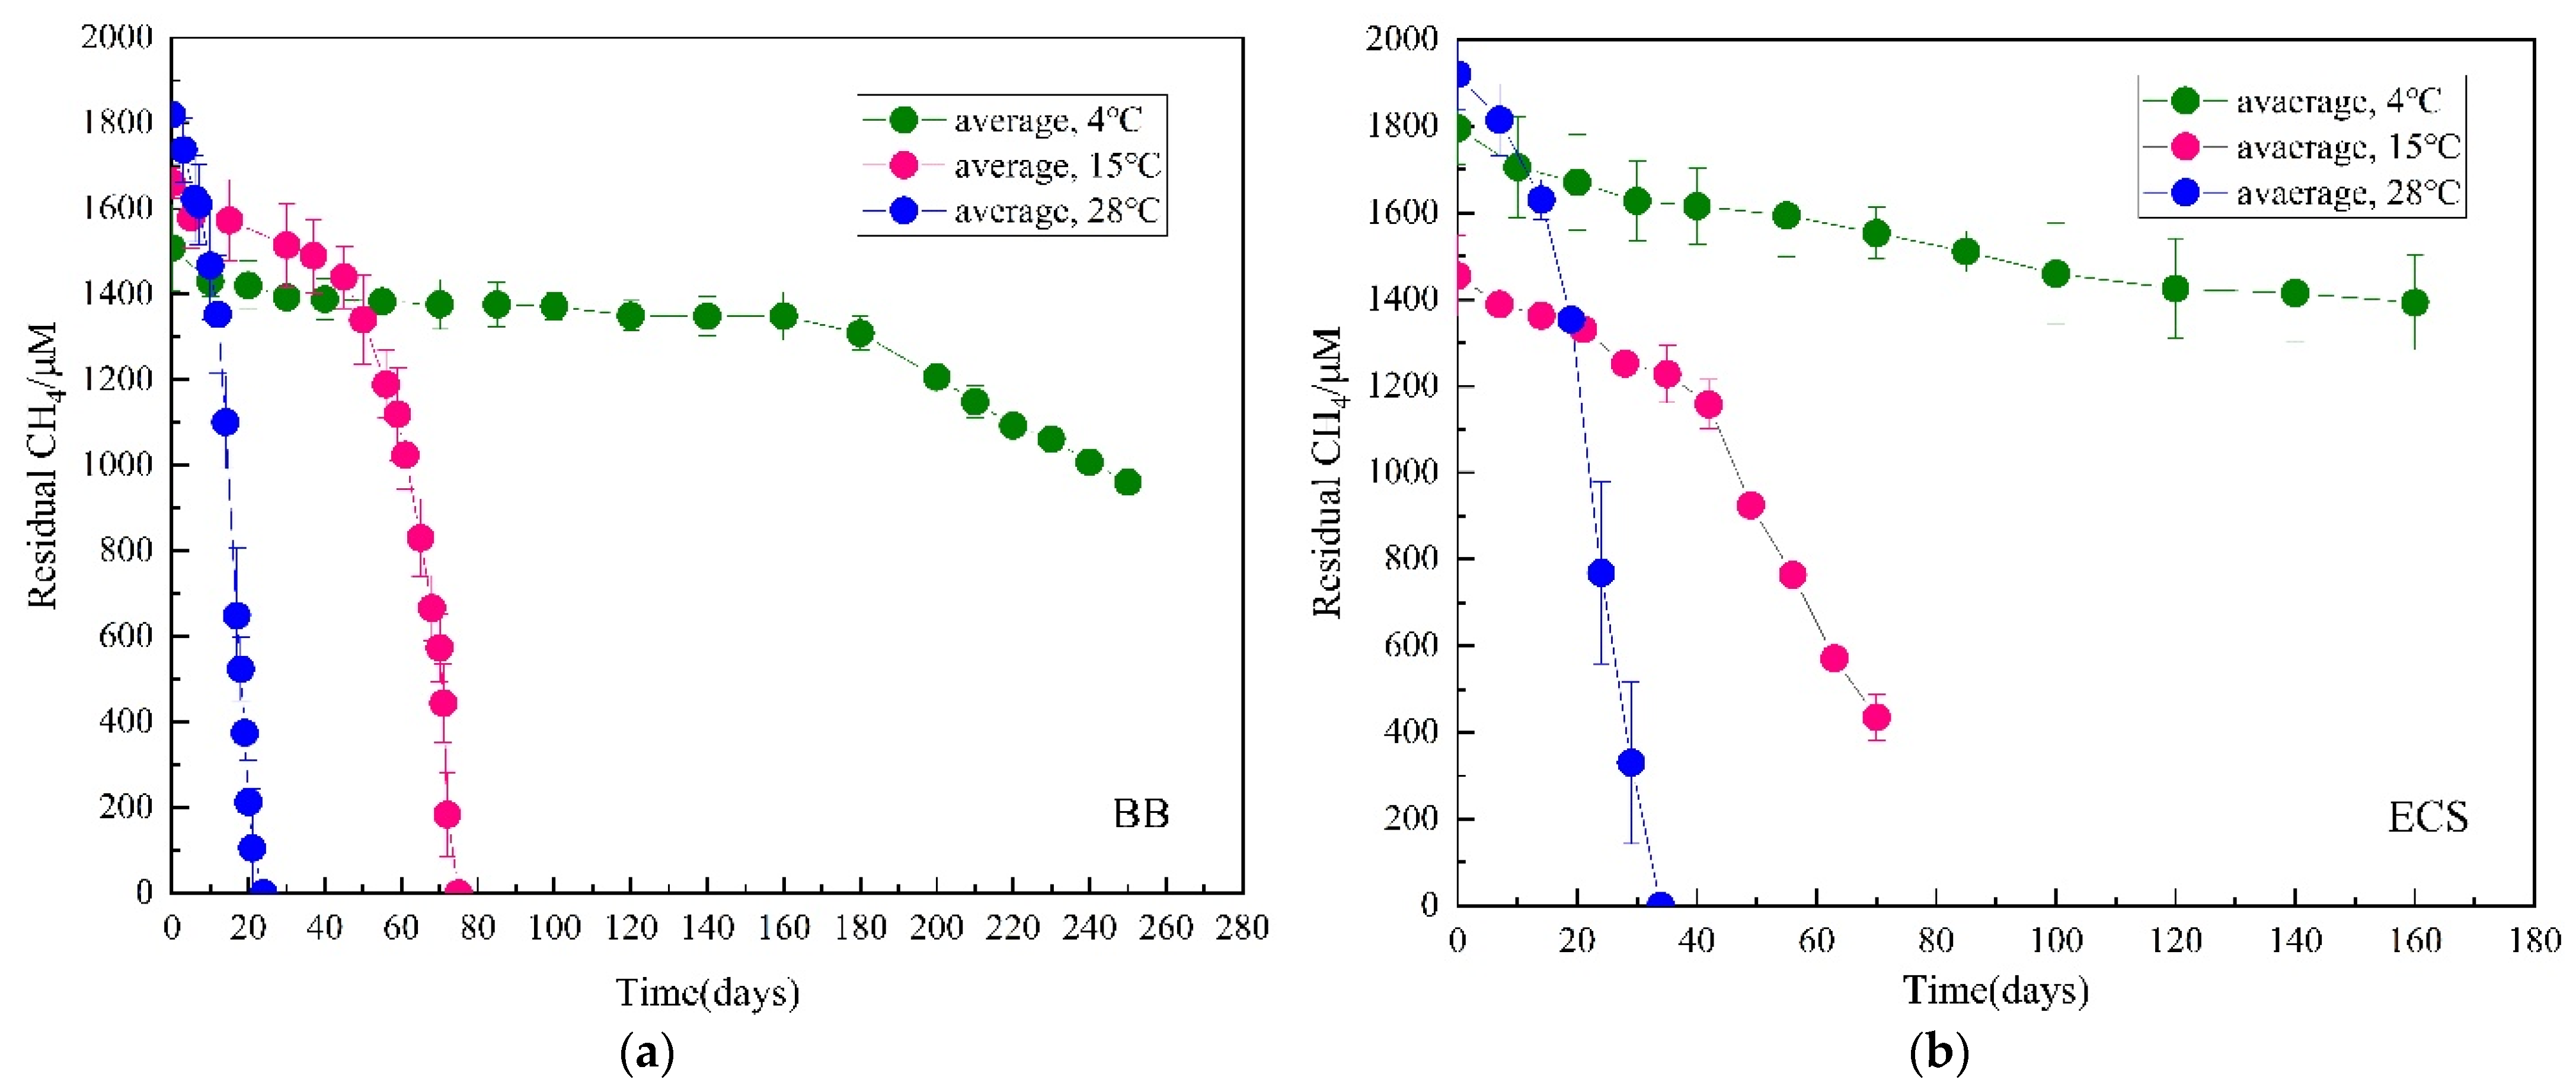
3.1. Methane Consumption

The aerobic CH4 consumption in all experimental treatments was higher than that of the organic matter oxidation in the control treatments (<10.0%), which indicates that the CH4 oxidation driven by methanotrophs occurred at 4–28 °C in the sediments in both areas. The residual CH4 concentrations (μM) in the headspace over incubation time are shown in Figure 2 and Table S1. The consumption time for a similar amount of CH4 from both areas showed consistent characteristics at different temperature intervals. The consumption times of CH4 at 4 °C were the longest (>250 days for BB and >160 days for ECS). Accordingly, the CH4 oxidation rates obtained by linear regression analysis show that the CH4 oxidation rates at 4 °C in both areas were lower than those at high temperatures (Table 2 and Table S2). The aerobic methane oxidation rates from the BB sediments increased by an order of magnitude as the temperature rose, which indicates that higher temperatures will promote the oxidation process. In contrast to the BB sediments, although the oxidation time of the ECS sediments at 15 °C was longer than that at 28 °C, the average oxidation rate at 15 °C (2.61 μmol gdw−1 d−1, R2 range of 0.96–0.98) was the fastest and nearly twice the average rate at 28 °C (1.39 μmol gdw−1 d−1, R2 range of 0.96–0.99).
In this study, p values obtained from one-way ANOVA of the effect of temperature on aerobic methane oxidation rates in BB (p = 0.007) and ECS (p = 0.009) sediments were both less than 0.01 (Table 2), indicating a strong effect of temperature on the CH4 oxidation activity in both areas. The temperature coefficient (Q10) was also calculated to characterize the temperature sensitivity of CH4 oxidation (Table 2). Q10 values for CH4 oxidation in the BB sediments were 8.3 over the temperature range of 4–15 °C, which was higher than that at 15–28 °C (Q10 = 2.1). Similarly, the Q10 values for CH4 oxidation in the ECS sediments at low temperatures were also much higher (Q10 = 4.1 at 4–15 °C; Q10 = 0.6 at 15–28 °C). However, for the same temperature interval, the Q10 values for the BB incubations were systematically higher than those for the ECS incubations, indicating a higher temperature sensitivity of the CH4 oxidation for the BB incubations.

3.2. Methanotrophic Community Structure

After CH4 biodegradation at different temperatures, 233,592 high-quality sequences were obtained from 2 original and 12 incubated sediments, which were classified into 125 OTUs with a similar cutoff of 97%. Number of sequences for each sample in BB and ECS incubations was shown in Table S4. The community structure of the pmoA genes was examined by dominant OTUs with relative abundance higher than 1% (Figure 3). It is shown that proportions of pmoA sequences affiliated with Methylocystis (OTU98) from type II methanotrophs in the original sample from BB were as low as 1.94%, while the remainder were non-methanotrophs. In contrast to the BB sediment, the methanotrophs in the original sample from ECS, including Methylocystis (OTU14) and Methylocaldum (OTU54), accounted for as much as 84.2%. After the incubations at different temperatures, although the dominant OTUs of incubated sediments from BB and ECS both belong to the family Methylococcaceae from type I methanotrophs, they varied between different incubations. For the BB incubation, the unclassified _Methylococcaceae (OTU1) was dominant at all temperatures, accounting for 91.91–99.48% of the family Methylococcaceae (Figure 3a). The relative abundance of pmoA sequences derived from Methylobacter (OTU9 and OTU13) was less than 0.01% in the incubation at 4 °C and up to 8.0% in the incubation at 28 °C, showing a positive correlation with temperature. Similar to the pmoA sequences of the BB incubations, the unclassified_Methylococcaceae was also predominant in the incubated sediments from ECS which accounted for 97.80–99.97% (Figure 3b). However, the unclassified_Methylococcaceae in the ECS incubations consisted of two OTUs, OTU1 and OTU4. A few pmoA sequences (0.03–2.17%) affiliated with Methylobacter (OTU9) were also observed in the ECS samples, with the abundance decreasing with the elevated temperature.

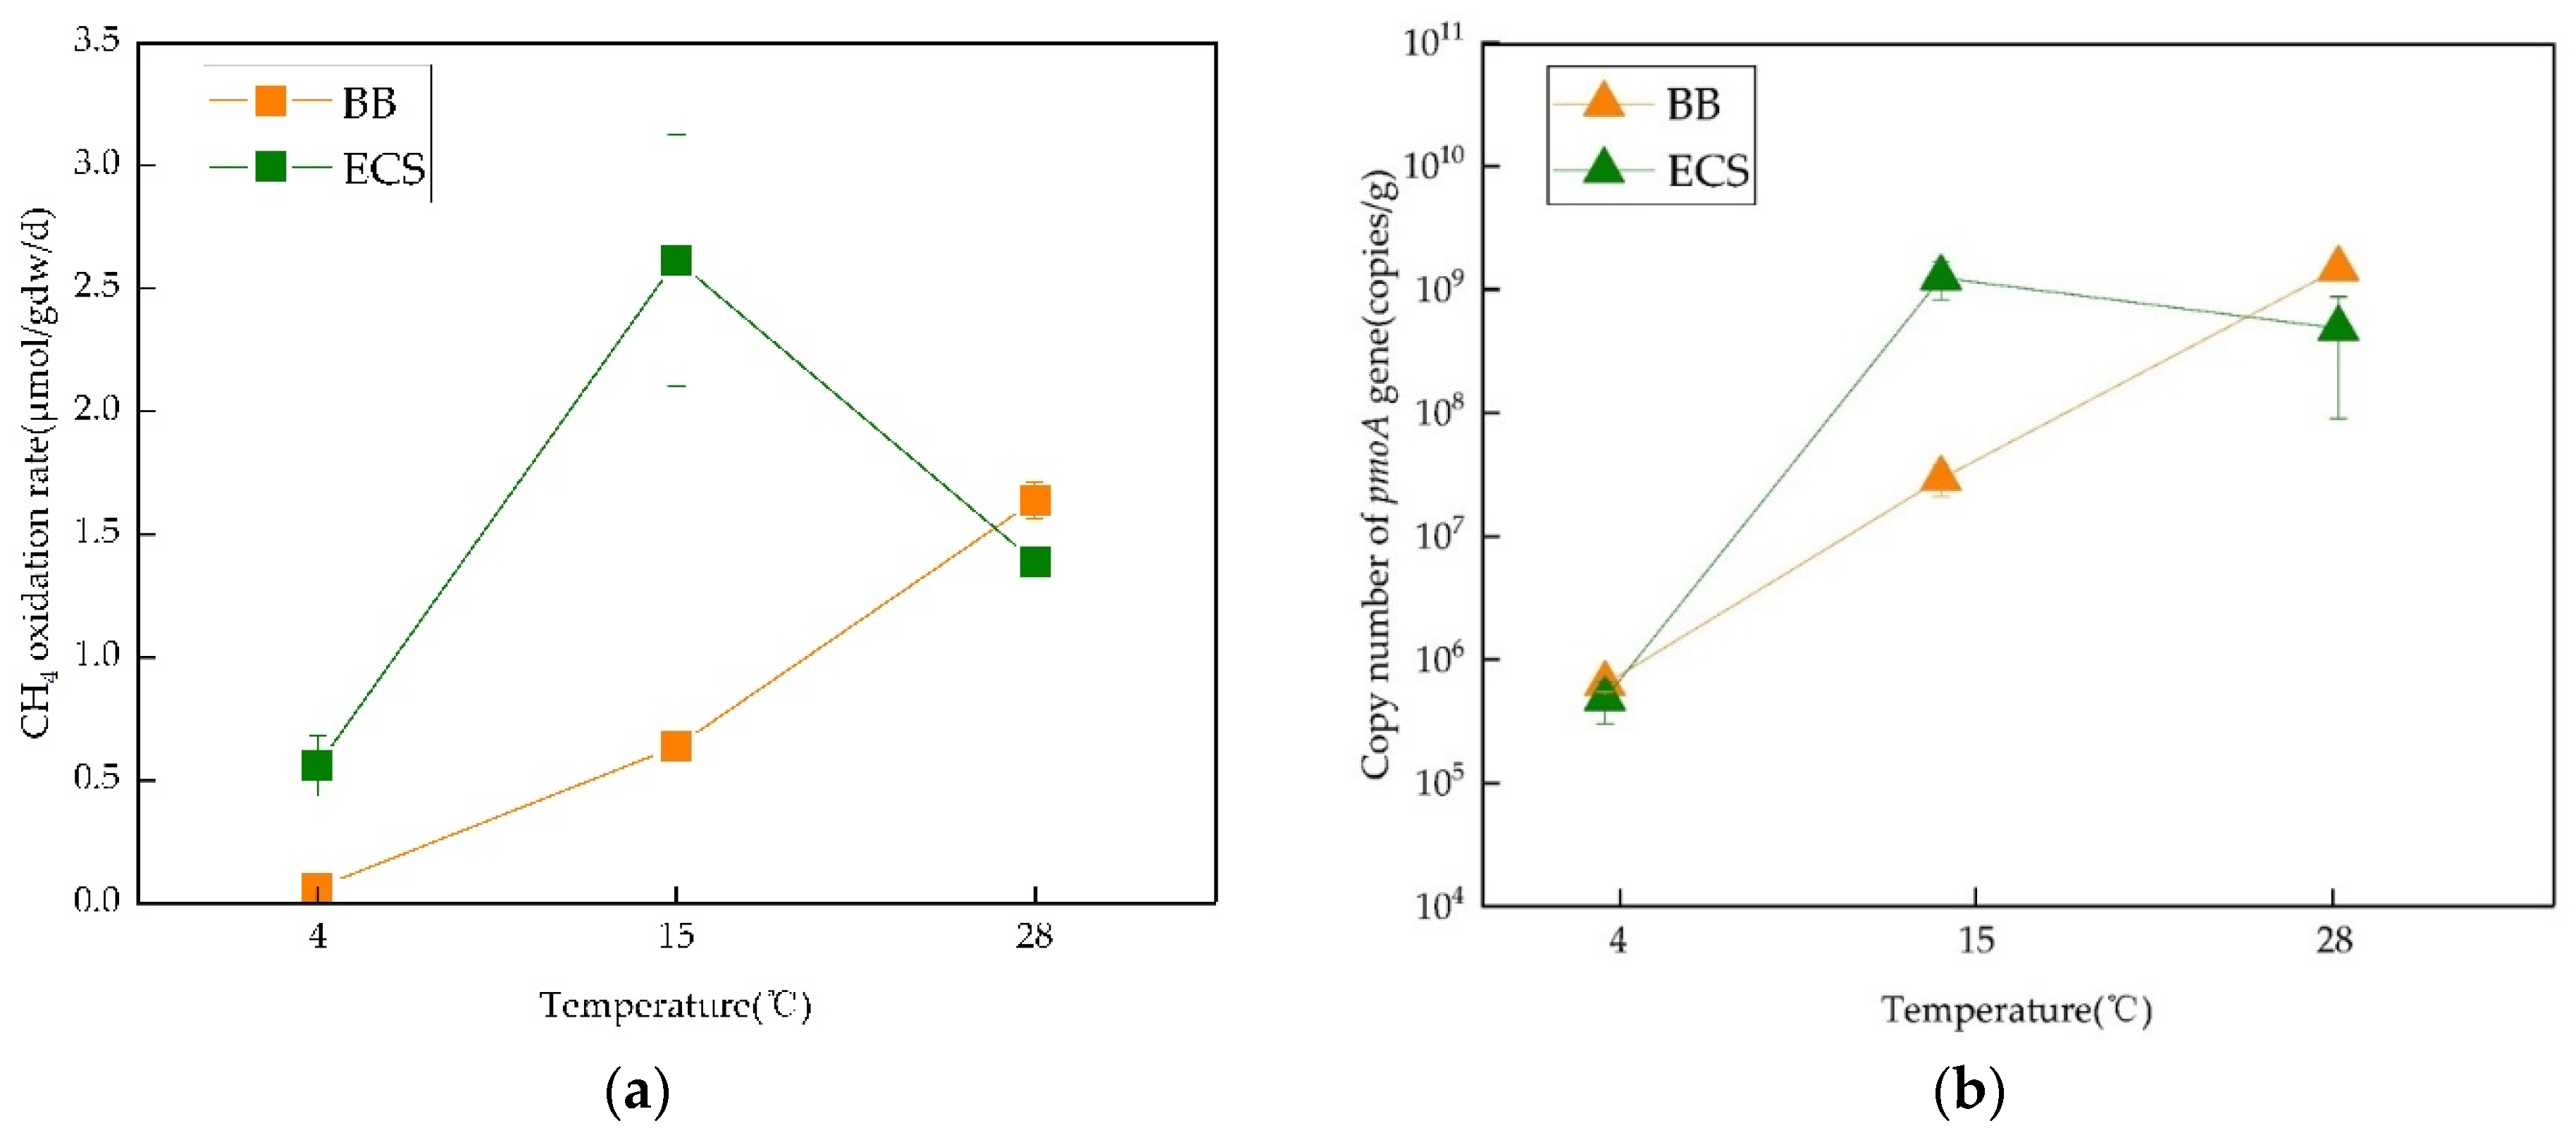
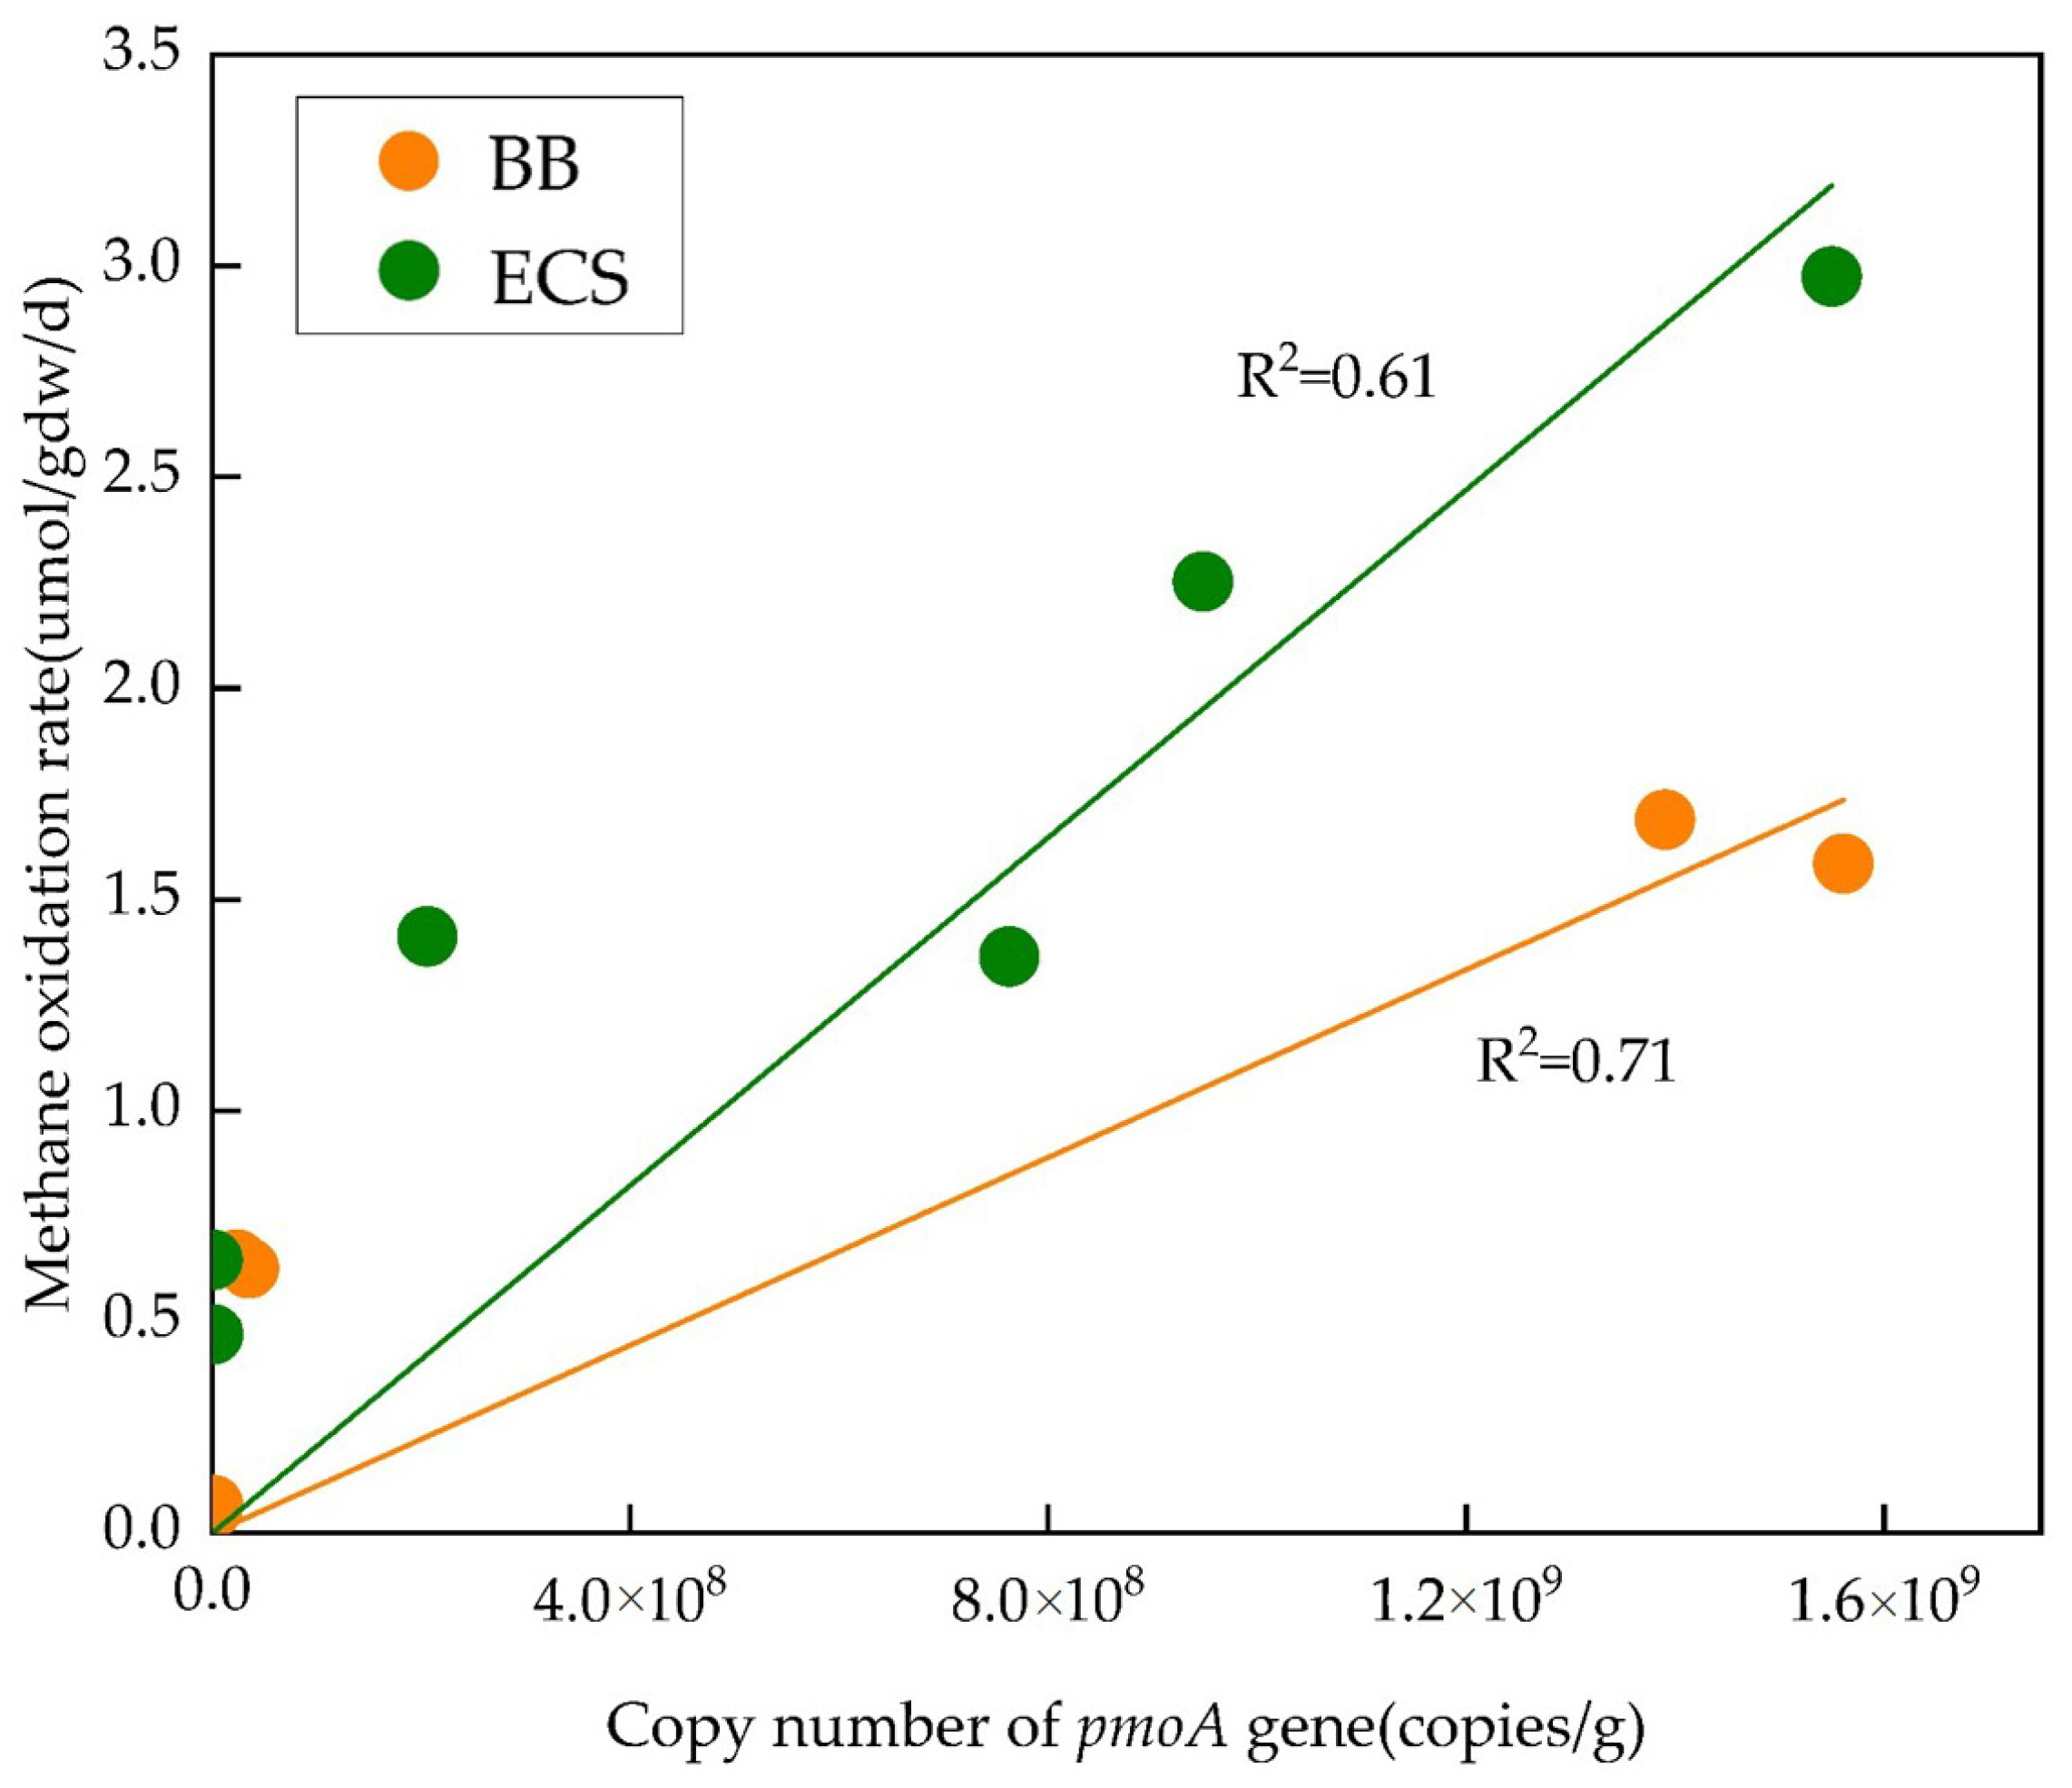
3.3. Abundance of Methanotrophic Population

The CH4 consumption was accompanied by the growth of methanotrophic populations, the abundance of which varied at different temperatures (Table 3 and Table S3). In the BB sediments, the growth of methanotrophic populations characterized by pmoA genes was consistent with the CH4 consumption curves. At both temperature intervals (4–15 °C and 15–28 °C), the abundance of pmoA genes increased by two orders of magnitude. It should be noted that the abundance of pmoA genes from the 4 °C incubation is not completely suitable for the comparison because, unlike other incubations, CH4 in the headspace was not fully consumed within the experimental time of this study. However, the results here at least suggest that the growth of methanotrophs in marine sediments grow more slowly at 4 °C than that at higher temperatures. In contrast to the BB sediments, the abundance of methanotrophic population in the ECS sediments was as high as 1.25 × 10⁹ copies/g at 15 °C, where the fastest CH4 oxidation rate (2.61 μmol gdw−1 d−1) was observed. The p value obtained from the one-way ANOVA of the effect of temperature on the abundance of pmoA genes in ECS sediments (p = 0.046) is smaller than 0.05, indicating a significant effect of temperature on the growth of methanotrophic biomass in the ECS incubations. Nevertheless, the p value calculated from the BB incubations is 0.135, suggesting that temperature did not have a significant effect on the growth of methanotrophic biomass in the studied BB incubations.

4. Discussion

4.1. Temperature Effect on CH4 Oxidation Rate

Despite the consensus that temperature fluctuations influence aerobic CH4 oxidation patterns, some published studies suggest that such influences are minor (Table 2). This is supported by the generally low Q10 values (generally < 3) reported for ecosystems, including wetlands, peat soils, forest soils, and lake sediments [29,31,41,42], and is generally explained by the sensitivity of the enzymes to low temperatures and the decreasing solubility of CH4 and O2 with elevated temperatures [29]. In this study, the temperature sensitivity of methanotrophs in the BB and ECS incubations at the high temperatures of 15–28 °C was low (Q10 values 0.6–2.1), which is therefore consistent with previous studies for most terrestrial ecosystems. Nonetheless, our study revealed that marine aerobic methane oxidation may be highly sensitive to low temperatures (e.g., 4–15 °C), as indicated by the high Q10 values ranging from 4.1 to 8.3. This indicates that temperature plays a more significant role in controlling aerobic CH4 oxidation patterns for marine ecosystems.
The results of this study indicate that CH4 biodegradation over the temperature range of 4–28 °C was quite different in shallow and deep marine environments (Figure 4a). Average aerobic methane oxidation rates from the BB incubations were 0.06–1.64 μmol gdw−1 d−1 at temperatures ranging from 4 to 28 °C. This is consistent with the results (0.01–0.63 μmol gdw−1 d−1) obtained from laboratory incubations using, for example, lake sediments at 4–30 °C [29]. Meanwhile, the CH4 oxidation rates from the BB incubations increased 10-fold over the studied temperature interval. This positive correlation between the temperature and CH4 oxidation rates is also consistent with many studies which have shown increment trends of CH4 oxidation below 30 °C [28,40], and the optimum temperature for CH4 oxidation ranges from 20 to 38 °C [6,13,17,43]. However, in contrast to incubations using the BB sediments, the CH4 oxidation rates for incubations using the ECS sediments did not increase with elevating temperatures, and the optimum temperature of aerobic methane oxidation was 15 °C. This is not uncommon and in fact, some published studies have found that the optimum temperature for CH4 oxidation could be as low as 10 °C, or even lower in cold environments, such as the Arctic [44]. The uncoupling of temperature and aerobic methane oxidation rates for the deep marine environments could be explained by the existence of some specific methanotrophic community in deep oceans [31]. Another feature of aerobic methane oxidation reported in this study is that a 10-fold higher rate was observed at the same temperature (except for 28 °C) in the ECS incubations than that in the BB incubations. Thus, it is reasonable to deduce that the CH4 oxidation capacity in deep-sea sediments, like ECS, is stronger than that in shallow-sea sediments, like BB.
It is noted that although our results of aerobic methane oxidation rates (0.06–2.61 μmol gdw−1 d−1) are broadly similar to the previous experimental data (0.1 × 10⁻⁴–12.2 μmol gdw−1 d−1) obtained from terrestrial habitats [31,40], they are very different from those obtained by in situ observations (6–289 mmol m−3 d−1) [45]. Thus, great caution should be taken when applying the results from this study to natural ecosystems.

4.2. Temperature Effect on Methanotrophic Community

Almost all pmoA sequences in the incubated sediments in our study (representing the active communities from BB and ECS) phylogenetically belong to type I methanotrophs (families Methylococcaceae), which is different from other ecosystems with abundant species or types of methanotrophs (Table 3). It is generally recognized that type I methanotrophs are one of the main methanotrophic communities found in marine environments by natural observations [46]. Nonetheless, significant variations of pmoA OTUs were found between the same sediment samples at different temperatures and between different samples at the same temperatures (Figure 3). OTU13, which clusters to Methylobacter, was only observed in the BB incubations and displayed a positive correlation with temperature. This may be a main reason for the increases in the CH4 oxidation rates of the BB incubations from 4 to 28 °C. In contrast, OTU4, which clusters to unclassified_ Methylococcaceae, only occurred in the ECS incubations at 4 °C (close to the in situ temperature). It is not hard to deduce that the relative complex relationship between the CH4 oxidation state and temperature for the ECS incubations must be related to the special methanotrophic community structure (e.g., OTU4). However, a straightforward relationship between the methanotrophic community structure and CH4 biodegradation activity was still not fully revealed by this study and needs further clarification.
Nonetheless, the high correlation coefficients for the correlations between methanotrophic abundance and the aerobic methane oxidation rates for both BB and ECS incubations (0.71 and 0.61, respectively) suggest that the response of methanotrophic abundance to temperature was consistent with that of the aerobic methane oxidation rates in both areas (Figure 5). However, the abundances of pmoA genes, representing active methanotrophic communities, varied for the BB and ECS incubations at different temperatures (Figure 4b). For the BB incubations, the abundance of methanotrophic communities responded positively to temperature, with the optimum temperature being 28 °C in the experimental conditions of this study. This temperature was close to that of maximum methanotrophic activity (20–31 °C) in land cover soil, peat soil, wetland, and forest soil [6,40]. For aerobic methane oxidation in BB with seasonal climate, the above results also indicate that the biomass growth and CH4 oxidation rate in the seabed sediments should be the fastest in summer. In contrast, the optimum growth temperature of methanotrophs in the ECS sediments was only about 15 °C, which has also been reported for cold ecosystems, such as the Arctic [6,47]. Considering that the in situ temperature of the BB sediments is much higher than that of the ECS sediments, the contrasting optimum temperature for aerobic methane oxidation between BB and ECS further suggests that the aerobic methane oxidation patterns are controlled by in situ environments.

5. Conclusions

In this study, we investigated the effect of temperature on aerobic methane oxidation and methanotrophic communities using marine sediments collected from BB (a shallow sea with a water depth of 23 m) and ECS (a deep sea with a water depth of ~1000 m). The aerobic methane oxidation rates for the BB sediments increased by an order of magnitude (0.06–1.64 μmol gdw−1 d−1) from 4 to 28 °C, whereas those for the ECS incubations reached the maximum (2.61 μmol gdw−1 d−1) at 15 °C. CH4 oxidation in the two areas was more sensitive to low temperatures (Q10 = 4.1–8.3) than high temperatures (Q10 = 0.6–2.1). The active methanotrophs in both areas were Methylococcaceae from type I methanotrophs. However, the pmoA OTU composition was different, and the two areas had their own unique OTU types. The different responses of the methanotrophic growth and the CH4 oxidation rates to temperature for incubations from the two areas indicate that shallow and deep marine environments are characterized by different CH4 oxidation patterns. These results are of great significance for quantitatively evaluating the biodegradability of CH4 in different marine environments.

Supplementary Materials

The following are available online at https://www.mdpi.com/article/10.3390/jmse9111261/s1, Table S1: CH4 contents at subsequent time points (nmol) in the headspace of the BB and ECS incubations, Table S2: CH4 oxidation rate (μmol/gdw/day) of each treatment of the BB and ECS incubations, Table S3: Abundance of pmoA genes (copies/g) in each sediment sample after the BB and ECS incubations, Table S4: Number of sequences for each sample in BB and ECS incubations.

Author Contributions

Designed the study, J.L.; conducted the incubations and performed the analyses, J.L. and X.X.; data curation, J.L. and Y.C.; collected the samples, Z.S. and X.H.; writing—original draft preparation, J.L.; writing—review and editing, C.L. and N.W. All authors have read and agreed to the published version of the manuscript.

Funding

This research was funded by the Natural Science Foundation of Shandong Province (No. ZR2020QD070), the National Natural Science Foundation of China (No. 42106052), and the China Geological Survey Project (No. DD20190221).

Institutional Review Board Statement

Not applicable.

Informed Consent Statement

Not applicable.

Data Availability Statement

The demultiplexed reads of the pmoA gene amplicon sequences were deposited at the National Center for Biotechnology Information (NCBI) under accession number SRP189409.

Acknowledgments

We gratefully acknowledge Yufeng Chen, Yanlong Li, Qingguo Meng, and Qingtao Bu for their technical assistance and helpful advice.

Conflicts of Interest

The authors declare no conflict of interest.

References

  1. Kushwaha, O.S.; Meshram, S.B.; Bhattacharjee, G.; Kumar, R. Molecular Insights about Gas Hydrate Formation. In Advances in Spectroscopy: Molecules to Materials; Springer: Berlin/Heidelberg, Germany, 2019; pp. 311–322. [Google Scholar]
  2. Lu, X.; Zhang, X.; Sun, F.; Wang, S.; Liu, L.; Liu, C. Experimental Study on the Shear Band of Methane Hydrate-Bearing Sediment. J. Mar. Sci. Eng. 2021, 9, 1158. [Google Scholar] [CrossRef]
  3. Bei, K.; Xu, T.; Shang, S.; Wei, Z.; Yuan, Y.; Tian, H. Numerical modeling of gas migration and hydrate formation in heterogeneous marine sediments. J. Mar. Sci. Eng. 2019, 7, 348. [Google Scholar] [CrossRef] [Green Version]
  4. Etiope, G. Natural Gas Seepage; Springer International Publishing: Cham, Switzerland, 2015. [Google Scholar]
  5. Yang, H.; Yu, S.; Lu, H. Iron-Coupled Anaerobic Oxidation of Methane in Marine Sediments: A Review. J. Mar. Sci. Eng. 2021, 9, 875. [Google Scholar] [CrossRef]
  6. Hanson, R.S.; Hanson, T.E. Methanotrophic bacteria. Microbiol. Rev. 1996, 60, 439–471. [Google Scholar] [CrossRef]
  7. Shukla, P.N.; Pandey, K.; Mishra, V.K. Environmental determinants of soil methane oxidation and methanotrophs. Crit. Rev. Environ. Sci. Technol. 2013, 43, 1945–2011. [Google Scholar] [CrossRef]
  8. Haque, M.F.U.; Xu, H.-J.; Murrell, J.C.; Crombie, A. Facultative methanotrophs-diversity, genetics, molecular ecology and biotechnological potential: A mini-review. Microbiology 2020, 166, 894–908. [Google Scholar] [CrossRef] [PubMed]
  9. Kizilova, A.; Yurkov, A.; Kravchenko, I. Aerobic methanotrophs in natural and agricultural soils of European Russia. Diversity 2013, 5, 541–556. [Google Scholar] [CrossRef]
  10. Chowdhury, T.R.; Dick, R.P. Ecology of aerobic methanotrophs in controlling methane fluxes from wetlands. Appl. Soil Ecol. 2013, 65, 8–22. [Google Scholar] [CrossRef]
  11. Lehtoranta, K.; Koponen, P.; Vesala, H.; Kallinen, K.; Maunula, T. Performance and Regeneration of Methane Oxidation Catalyst for LNG Ships. J. Mar. Sci. Eng. 2021, 9, 111. [Google Scholar] [CrossRef]
  12. Wei, Z.; Xu, T.; Shang, S.; Tian, H.; Cao, Y.; Wang, J.; Shi, Z.; Liu, X. Laboratory Experimental Study on the Formation of Authigenic Carbonates Induced by Microbes in Marine Sediments. J. Mar. Sci. Eng. 2021, 9, 479. [Google Scholar] [CrossRef]
  13. Brindha, R.; Vasudevan, N. Methane oxidation capacity of methanotrophs isolated from different soil ecosystems. Int. J. Environ. Sci. Technol. 2018, 15, 1931–1940. [Google Scholar] [CrossRef]
  14. He, R.; Wooller, M.J.; Pohlman, J.W.; Quensen, J.; Tiedje, J.M.; Leigh, M.B. Shifts in identity and activity of methanotrophs in arctic lake sediments in response to temperature changes. Appl. Environ. Microbiol. 2012, 78, 4715–4723. [Google Scholar] [CrossRef] [PubMed] [Green Version]
  15. Zhang, L.; Dumont, M.G.; Bodelier, P.L.; Adams, J.M.; He, D.; Chu, H. DNA stable-isotope probing highlights the effects of temperature on functionally active methanotrophs in natural wetlands. Soil Biol. Biochem. 2020, 149, 107954. [Google Scholar] [CrossRef]
  16. Praeg, N.; Wagner, A.O.; Illmer, P. Plant species, temperature, and bedrock affect net methane flux out of grassland and forest soils. Plant Soil 2017, 410, 193–206. [Google Scholar] [CrossRef] [Green Version]
  17. Mohanty, S.R.; Bodelier, P.L.; Conrad, R. Effect of temperature on composition of the methanotrophic community in rice field and forest soil. FEMS Microbiol. Ecol. 2007, 62, 24–31. [Google Scholar] [CrossRef]
  18. Mau, S.; Heintz, M.B.; Valentine, D.L. Quantification of CH4 loss and transport in dissolved plumes of the Santa Barbara Channel, California. Cont. Shelf Res. 2012, 32, 110–120. [Google Scholar] [CrossRef]
  19. Li, J.; Liu, C.; He, X.; Santosh, M.; Hu, G.; Sun, Z.; Li, Y.; Meng, Q.; Ning, F. Aerobic microbial oxidation of hydrocarbon gases: Implications for oil and gas exploration. Mar. Pet. Geol. 2019, 103, 76–86. [Google Scholar] [CrossRef]
  20. Kawagucci, S.; Matsui, Y.; Makabe, A.; Fukuba, T.; Onishi, Y.; Nunoura, T.; Yokokawa, T. Hydrogen and carbon isotope fractionation factors of aerobic methane oxidation in deep-sea water. Biogeosciences 2021, 18, 5351–5362. [Google Scholar] [CrossRef]
  21. Chan, E.W.; Shiller, A.M.; Joung, D.J.; Arrington, E.C.; Valentine, D.L.; Redmond, M.C.; Breier, J.A.; Socolofsky, S.A.; Kessler, J.D. Investigations of aerobic methane oxidation in two marine seep environments: Part 1—Chemical kinetics. J. Geophys. Res. Oceans 2019, 124, 8852–8868. [Google Scholar] [CrossRef]
  22. Li, M.; Jain, S.; Baker, B.J.; Taylor, C.; Dick, G.J. Novel hydrocarbon monooxygenase genes in the metatranscriptome of a natural deep-sea hydrocarbon plume. Environ. Microbiol. 2014, 16, 60–71. [Google Scholar] [CrossRef] [PubMed] [Green Version]
  23. Felden, J.; Lichtschlag, A.; Wenzhöfer, F.; Beer, D.d.; Feseker, T.; Pop Ristova, P.; Lange, G.d.; Boetius, A. Limitations of microbial hydrocarbon degradation at the Amon mud volcano (Nile deep-sea fan). Biogeosciences 2013, 10, 3269–3283. [Google Scholar] [CrossRef] [Green Version]
  24. Amos, C.L.; Al-Rashidi, T.B.; Rakha, K.; El-Gamily, H.; Nicholls, R. Sea surface temperature trends in the coastal ocean. Curr. Dev. Oceanogr. 2013, 6, 1–13. [Google Scholar]
  25. Hasse, L. The sea surface temperature deviation and the heat flow at the sea-air interface. Bound. -Layer Meteorol. 1971, 1, 368–379. [Google Scholar] [CrossRef]
  26. Doblin, M.A.; Van Sebille, E. Drift in ocean currents impacts intergenerational microbial exposure to temperature. Proc. Natl. Acad. Sci. USA 2016, 113, 5700–5705. [Google Scholar] [CrossRef] [PubMed] [Green Version]
  27. Xing, Z.; Zhao, T.; Zhang, L.; Gao, Y.; Liu, S.; Yang, X. Effects of copper on expression of methane monooxygenases, trichloroethylene degradation, and community structure in methanotrophic consortia. Eng. Life Sci. 2018, 18, 236–243. [Google Scholar] [CrossRef] [Green Version]
  28. Einola, J.-K.M.; Kettunen, R.H.; Rintala, J.A. Responses of methane oxidation to temperature and water content in cover soil of a boreal landfill. Soil Biol. Biochem. 2007, 39, 1156–1164. [Google Scholar] [CrossRef]
  29. Duc, N.T.; Crill, P.; Bastviken, D. Implications of temperature and sediment characteristics on methane formation and oxidation in lake sediments. Biogeochemistry 2010, 100, 185–196. [Google Scholar] [CrossRef]
  30. Houghton, K.M.; Stewart, L.C. Temperature-gradient incubation isolates multiple competitive species from a single environmental sample. Access Microbiol. 2020, 2, acmi000081. [Google Scholar] [CrossRef] [PubMed]
  31. Zeng, L.; Tian, J.; Chen, H.; Wu, N.; Yan, Z.; Du, L.; Shen, Y.; Wang, X. Changes in methane oxidation ability and methanotrophic community composition across different climatic zones. J. Soils Sediments 2019, 19, 533–543. [Google Scholar] [CrossRef]
  32. Xu, C.; Wu, N.; Sun, Z.; Zhang, X.; Geng, W.; Cao, H.; Wang, L.; Zhang, X.; Xu, G. Methane seepage inferred from pore water geochemistry in shallow sediments in the western slope of the Mid-Okinawa Trough. Mar. Pet. Geol. 2018, 98, 306–315. [Google Scholar] [CrossRef]
  33. Zang, K.; Zhang, G.; Wang, J. Methane emissions from oil and gas platforms in the Bohai Sea, China. Environ. Pollut. 2020, 263, 114486. [Google Scholar] [CrossRef]
  34. Zhang, N. Geochemical of Hydrocarbon Gas from the Surface Seabed Sediment in Bohai Bay Basin. Ph.D. Thesis, Jilin University, Changchun, China, 2016. [Google Scholar]
  35. Li, J.; Liu, C.; Wu, N.; He, X.; Hao, X.; Li, F.; Chen, Y.; Meng, Q. The Variation of Microbial (Methanotroph) Communities in Marine Sediments Due to Aerobic Oxidation of Hydrocarbons. J. Ocean Univ. China 2021, 20, 553–561. [Google Scholar] [CrossRef]
  36. Zang, K. Seasonal Variations and Regulatory Mechanisms of Dissolved Methane Concentration and Its Sea-to-Air Fluxes in the Seasonal Oxygen Deficient Zones in Bohai Sea. Ph.D. Thesis, Chinese Academy of Meteorological Sciences, Beijing, China, 2018. [Google Scholar]
  37. Chen, Y.-F.; Zheng, X.-L.; Jing, L.; He, X.-l.; Liu, C.-L.; Meng, Q.-G.; Qin, D.-D.; Zhang, P.-Y. Study on Oxidation Rate and Isotope Fractionation of Methane in Bohai Sea Sediments. Rock Miner. Anal. 2018, 37, 164–174. [Google Scholar]
  38. Gebert, J.; Groengroeft, A.; Miehlich, G. Kinetics of microbial landfill methane oxidation in biofilters. Waste Manag. 2003, 23, 609–619. [Google Scholar] [CrossRef]
  39. Pérez, R.; Cantera, S.; Bordel, S.; García-Encina, P.A.; Muñoz, R. The effect of temperature during culture enrichment on methanotrophic polyhydroxyalkanoate production. Int. Biodeterior. Biodegrad. 2019, 140, 144–151. [Google Scholar] [CrossRef] [Green Version]
  40. Reddy, K.R.; Rai, R.K.; Green, S.J.; Chetri, J.K. Effect of temperature on methane oxidation and community composition in landfill cover soil. J. Ind. Microbiol. Biotechnol. 2019, 46, 1283–1295. [Google Scholar] [CrossRef]
  41. Dunfield, P.; Dumont, R.; Moore, T.R. Methane production and consumption in temperate and subarctic peat soils: Response to temperature and pH. Soil Biol. Biochem. 1993, 25, 321–326. [Google Scholar] [CrossRef]
  42. Segers, R. Methane production and methane consumption: A review of processes underlying wetland methane fluxes. Biogeochemistry 1998, 41, 23–51. [Google Scholar] [CrossRef]
  43. Scheutz, C.; Kjeldsen, P. Environmental factors influencing attenuation of methane and hydrochlorofluorocarbons in landfill cover soils. J. Environ. Qual. 2004, 33, 72–79. [Google Scholar] [CrossRef]
  44. Omelchenko, M.; Vasileva, L.L.; Khmelenina, V.; Trotsenko, Y.A. Pathways of primary and intermediate metabolism in a psychrophilic methanotroph. Microbiology 1993, 62, 509–512. [Google Scholar]
  45. Boetius, A.; Wenzhöfer, F. Seafloor oxygen consumption fuelled by methane from cold seeps. Nat. Geosci. 2013, 6, 725–734. [Google Scholar] [CrossRef]
  46. Ruff, S.E.; Felden, J.; Gruber-Vodicka, H.R.; Marcon, Y.; Knittel, K.; Ramette, A.; Boetius, A. In situ development of a methanotrophic microbiome in deep-sea sediments. ISME J. 2019, 13, 197–213. [Google Scholar] [CrossRef] [PubMed] [Green Version]
  47. Oshkin, I.Y.; Belova, S.E.; Danilova, O.V.; Miroshnikov, K.K.; Rijpstra, W.I.C.; Damsté, J.S.S.; Liesack, W.; Dedysh, S.N. Methylovulum psychrotolerans sp. nov., a cold-adapted methanotroph from low-temperature terrestrial environments, and emended description of the genus Methylovulum. Int. J. Syst. Evol. Microbiol. 2016, 66, 2417–2423. [Google Scholar] [CrossRef] [PubMed] [Green Version]
Figure 1. Experimental setup for incubation. Four treatments were run with the setup simultaneously in this study.
Jmse 09 01261 g001
Figure 2. CH4 consumption over incubation time at different temperatures with BB (a) and ECS (b) sediments. Values represent means of duplicate incubations ±SD.
Jmse 09 01261 g002
Figure 3. Taxonomic composition of methanotrophic communities in sediment samples from BB (a) and ECS (b).
Jmse 09 01261 g003
Figure 4. CH4 consumption over incubation time at different temperatures with BB (a) and ECS (b) sediments. Values represent means of duplicate incubations ± SD.
Jmse 09 01261 g004
Figure 5. Correlation between CH4 oxidation rates and average copy numbers of pmoA genes at different temperatures.
Jmse 09 01261 g005
Table 1. Physical and chemical characteristics of the sediments used in this study.
LocationWater Depth (m)Bottom Water Temperature 1 (°C)Water ContentTOCMedian Grain Size (μm)CH4 Concentration 2 (μL/L)pHORP 3/mV
BB236.3–28.639.2%0.666.010–1678.7−a28
ECS979~4.046.3%1.5118.5338.3-
1 Bottom water temperature was annual monitoring data. 2 CH4 concentrations of BB were obtained from several sediments from Shaleitian Coal Oil Point seep field cited from Zhang [34]. The BB sediment sample used in this study was collected during the same sampling. 3 ORP is the abbreviation for oxidation–reduction potential.
Table 2. Potential CH4 oxidation rates (μmol gdw−1 d−1), Mean (R2), Q10 values, and one-way ANOVA.
EcosystemTemperatureCH4 Oxidation Rate 1 (R2 2)Q10 ValuesOne-Way ANOVA 3Source
4–15 °C15–28 °Cd.f4p
BB4 °C0.06 (0.97–0.99)8.32.120.007This paper
15 °C0.64 (0.89–0.91)
28 °C1.64 (0.95–0.98)
ECS4 °C0.56 (0.92)4.10.620.009
15 °C2.61 (0.97–0.99)
28 °C1.39 (0.96–0.99)
Eight lakes in central Sweden4–30 °C0.01–0.63 (0.83–1.00)0.5–2.4--[29]
Two forest zones10–25 °C<0.0002 (-)0.2–1.9--[31]
Zion landfill site6–40 °C0.85–4.84 (-)1.4–3.3-<0.004[40]
1 CH4 oxidation rate at each temperature in this study was obtained by averaging two slopes by linear regression analysis of the two experimental treatments. 2 R2 values were the correlation coefficients from the linear regression. 3 One-way ANOVA was conducted with CH4 oxidation rates obtained from all six experimental treatments. 4 d.f is degree of freedom in one-way ANOVA.
Table 3. Active methanotrophs, abundance of pmoA genes 1 (copies/g) and ANOVA of the effect of temperature on methanotrophic populations.
EcosystemTemperatureType of Active MethanotrophsInitial Abundance of pmoA GenesAverage Abundance of pmoA GenesOne-Way ANOVA 2Source
d.f3p
BB4 °Cunclassified_Methylococcaceae4.18 × 1046.35 × 10520.135This paper
15 °Cunclassified_Methylococcaceae
Methylobacter
2.94 × 10⁷
28 °C1.48 × 109
ECS4 °Cunclassified_Methylococcaceae
Methylobacter
4.78 × 1044.86 × 10520.046
15 °C1.25 × 109
28 °Cunclassified_Methylococcaceae4.84 × 108
Arctic lake4–21 °CMethylobacter; Methylophilus;
Methylomonas; Methylophilus
----[14]
Two forest zones10–25 °CMethylobacter; Methylocaldum; Methylomicrobium; Methylocystis----[31]
Zion landfill site6–40 °CMethylobacter; Methylocystis;
Methylocaldum; Methylotenera
----[40]
1 Average abundance of pmoA genes calculated from the two treatments at each temperature. 2 One-way ANOVA was conducted with abundance of pmoA genes obtained from all six experimental treatments. 3 d.f is degree of freedom.
Publisher’s Note: MDPI stays neutral with regard to jurisdictional claims in published maps and institutional affiliations.

