Article

Coastal Vulnerability of the West Coast of Aceh Besar: A Coastal Morphology Assessment

1
Geographical Information Systems Laboratory, Faculty of Marine and Fisheries, Universitas Syiah Kuala, Banda Aceh 23111, Indonesia
2
Marine and Fisheries Science Study Program, Universitas Syiah Kuala, Banda Aceh 23111, Indonesia
3
Center for Environmental and Natural Resources Research (PPLH-SDA), Universitas Syiah Kuala, Banda Aceh 23111, Indonesia
4
Center for Marine and Fisheries Research (PRKP), Universitas Syiah Kuala, Banda Aceh 23111, Indonesia
5
Department of Agribusiness, Faculty of Agriculture, Universitas Syiah Kuala, Banda Aceh 23111, Indonesia
6
Remote Sensing and Cartography Lab., Universitas Syiah Kuala, Banda Aceh 23111, Indonesia
*
Author to whom correspondence should be addressed.
J. Mar. Sci. Eng. 2021, 9(8), 815; https://doi.org/10.3390/jmse9080815
Submission received: 9 June 2021 / Revised: 15 July 2021 / Accepted: 22 July 2021 / Published: 28 July 2021
(This article belongs to the Section Geological Oceanography)

Abstract

:
The purpose of this study was to determine how vulnerable the west coast of Aceh Besar, Aceh province, Indonesia, is in terms of its coastal morphology. This research was conducted from August to December 2020 and data processing was carried out at the Geographical Information Systems Laboratory, Faculty of Marine Affairs and Fisheries, Syiah Kuala University. The method used was the coastal vulnerability index (CVI) with four geological parameters, namely geomorphological parameters, beach elevation, beach slope and shoreline changes. The results obtained from the CVI method show that 20.60% of the west coast of Aceh Besar, which has a total coastline length of 93.2 km, is in the very high vulnerability category (19.2 km), while 23.18% (21.6 km) is in the high vulnerability category, 8.80% (8.2 km) in the moderate category, 6.44% (6 km) in the low category and 40.99% (38.2 km) in the very low category. Sub-districts classified as having very high vulnerability are Peukanbada (7.94%), Leupung (6.22%), Lhoong (4.94%), and Lhoknga (1.50%). The geomorphology of areas that have very high vulnerability is generally in the form of sandy beaches with a very gentle slope, while, geomorphologically, areas that have very low vulnerability have a high elevation and cliff beaches.

1. Introduction

Aceh Besar district is located in the Aceh province, tip of Sumatra, Indonesia, which is divided into two coastal locations, namely the north coast of Aceh Besar and the west coast of Aceh Besar. The sea water area is 2796 km2 and Aceh Besar has a coastline of 344 km [1]. This coastal area is greatly influenced by natural phenomena, the surrounding environment and anthropogenic features [2,3]. Rukin [4] stated that coastal areas have unique landscapes and socio-economic characteristics that affect human activities, and these human activities usually create long-term effects in the form of coastal changes if they are not managed properly [5,6]. Socio-economic activities carried out by humans and geo-oceanographic processes can result in morphological changes on the coast [7,8]. Since the coastal environment is very vulnerable and sensitive to change, a careful assessment of the critical issues and shortcomings is required before the implementation of any intervention or strategy involving the coastal system [9,10].
The morphology of the Aceh coast has changed significantly, especially in 2004, when a tsunami struck Aceh’s waters [11,12]. Syamsidik et al. [13] examined the morphological recovery of the Banda Aceh City coast 10 years after the Aceh tsunami. The results of this study indicate that some of the coastal morphology in Banda Aceh has undergone significant changes and is still unstable, even though there are other parts that have experienced relative stability. According to the study in [14], changes in coastal morphology are related to the geo-oceanographic processes in coastal areas. These processes occur because of the natural balance that occurs in nature, such as storms that cause large waves, flooding due to tides, or erosion and sedimentation due to soil erodibility [15,16].
Joesidawati [17] identified the relationship between coastal morphology and coastal vulnerability using the geological and physical parameters of the coast. The results of this study indicate that almost all coastal areas studied have high vulnerability, despite the fact that 10 physical parameters were used. Meanwhile, Pramanik et al. [18] classified the physical parameters of the coast geologically into four studied variables, namely geomorphology, changes in shoreline, beach elevation, bathymetry and beach slope. The geomorphological type of the coastal area is one of the aspects used to indicate its vulnerability [19,20].
Research on the coastal vulnerability index has been carried out by several researchers. The authors of [7] conducted a study on the coastal vulnerability index in relation to sea level rises in Ghana, West Africa. Moreover, Pramanik et al. [18] also assessed coastal vulnerability in relation to sea level rises on the coast of Krishna Godavari, East India. Furthermore, the authors of another study reviewed the coastal vulnerability of Andhra Pradesh, India, by evaluating data collection, risk levels and mitigation strategies [21]. The findings of these studies explain why coastal vulnerability assessments have many different analytical approaches and methodologies, because coastal areas have very complex conditions, despite having the same foundation of interdependence and interrelationships. Research on the coastal vulnerability index in Indonesia, among other areas, was conducted by [22], in which an analysis of coastal vulnerability to the threat of sea level rises in Southern Yogyakarta was carried out. The results of vulnerability research associated with sea level rises indicate that these rises are very influential in terms of coastal vulnerability and are a key problem in coastal areas. In addition, reference [23] conducted a vulnerability analysis of the coast and fishery resources using the GIS approach on the coast of the Purworejo district in the southern part of Central Java province, Indonesia. The results showed that spatial visualization with imaging technology resulted in a more informative analysis. Furthermore, research on the coastal vulnerability index in the Aceh region was carried out by [24] using physical parameters from the Ujung Pancu to the Ujung Bate beaches of the north Aceh coast. Zouhrawaty et al. [25] also conducted research on the coastal vulnerability index in relation to storm disasters from the area of the estuary of Krueng Aceh to the Alue Naga flood canal of Aceh province. They found that almost 50% of the study area faces very high vulnerability.
The west coast of Aceh Besar constitutes a vulnerable environment and requires special attention to preserve its ecosystem and the human activities that occur within it. Many studies have been devoted to analyzing the main factors influencing coastal vulnerability as part of ecosystem conservation. The most frequently and commonly used approach is the coastal vulnerability index (CVI). This approach takes into account all relevant variables that characterize the coastal environment in relation to forcing actions, morphological characteristics, and socio-economic, ecological and cultural aspects [26]. Therefore, the morphological characteristics method is one of the approaches used in our assessment of the coastal vulnerability of the west coast of Aceh Besar.
The west coast of Aceh Besar is a coastal area that is prone to tsunami hazards, climate change and sea level rises. This area will always change continuously. Unfortunately, to date, research has never been conducted on the coastal vulnerability index (CVI) of the west coast of Aceh Besar. Therefore, an assessment of the vulnerability index of the west coast of Aceh is certainly necessary for the purpose of identifying areas that may be sensitive to natural changes in the future. When determining the coastal vulnerability index, a strategy is required to minimize the impact that will occur. For this reason, it is necessary to conduct a study to determine how much vulnerability exists on the west coast of Aceh Besar in terms of its coastal morphology. Therefore, this study aims to assess the vulnerability index of the west coast of Aceh Besar based on its coastal morphology by limiting the assessment to four parameters, namely geomorphology, elevation, beach slope and shoreline change.

2. Research Methods

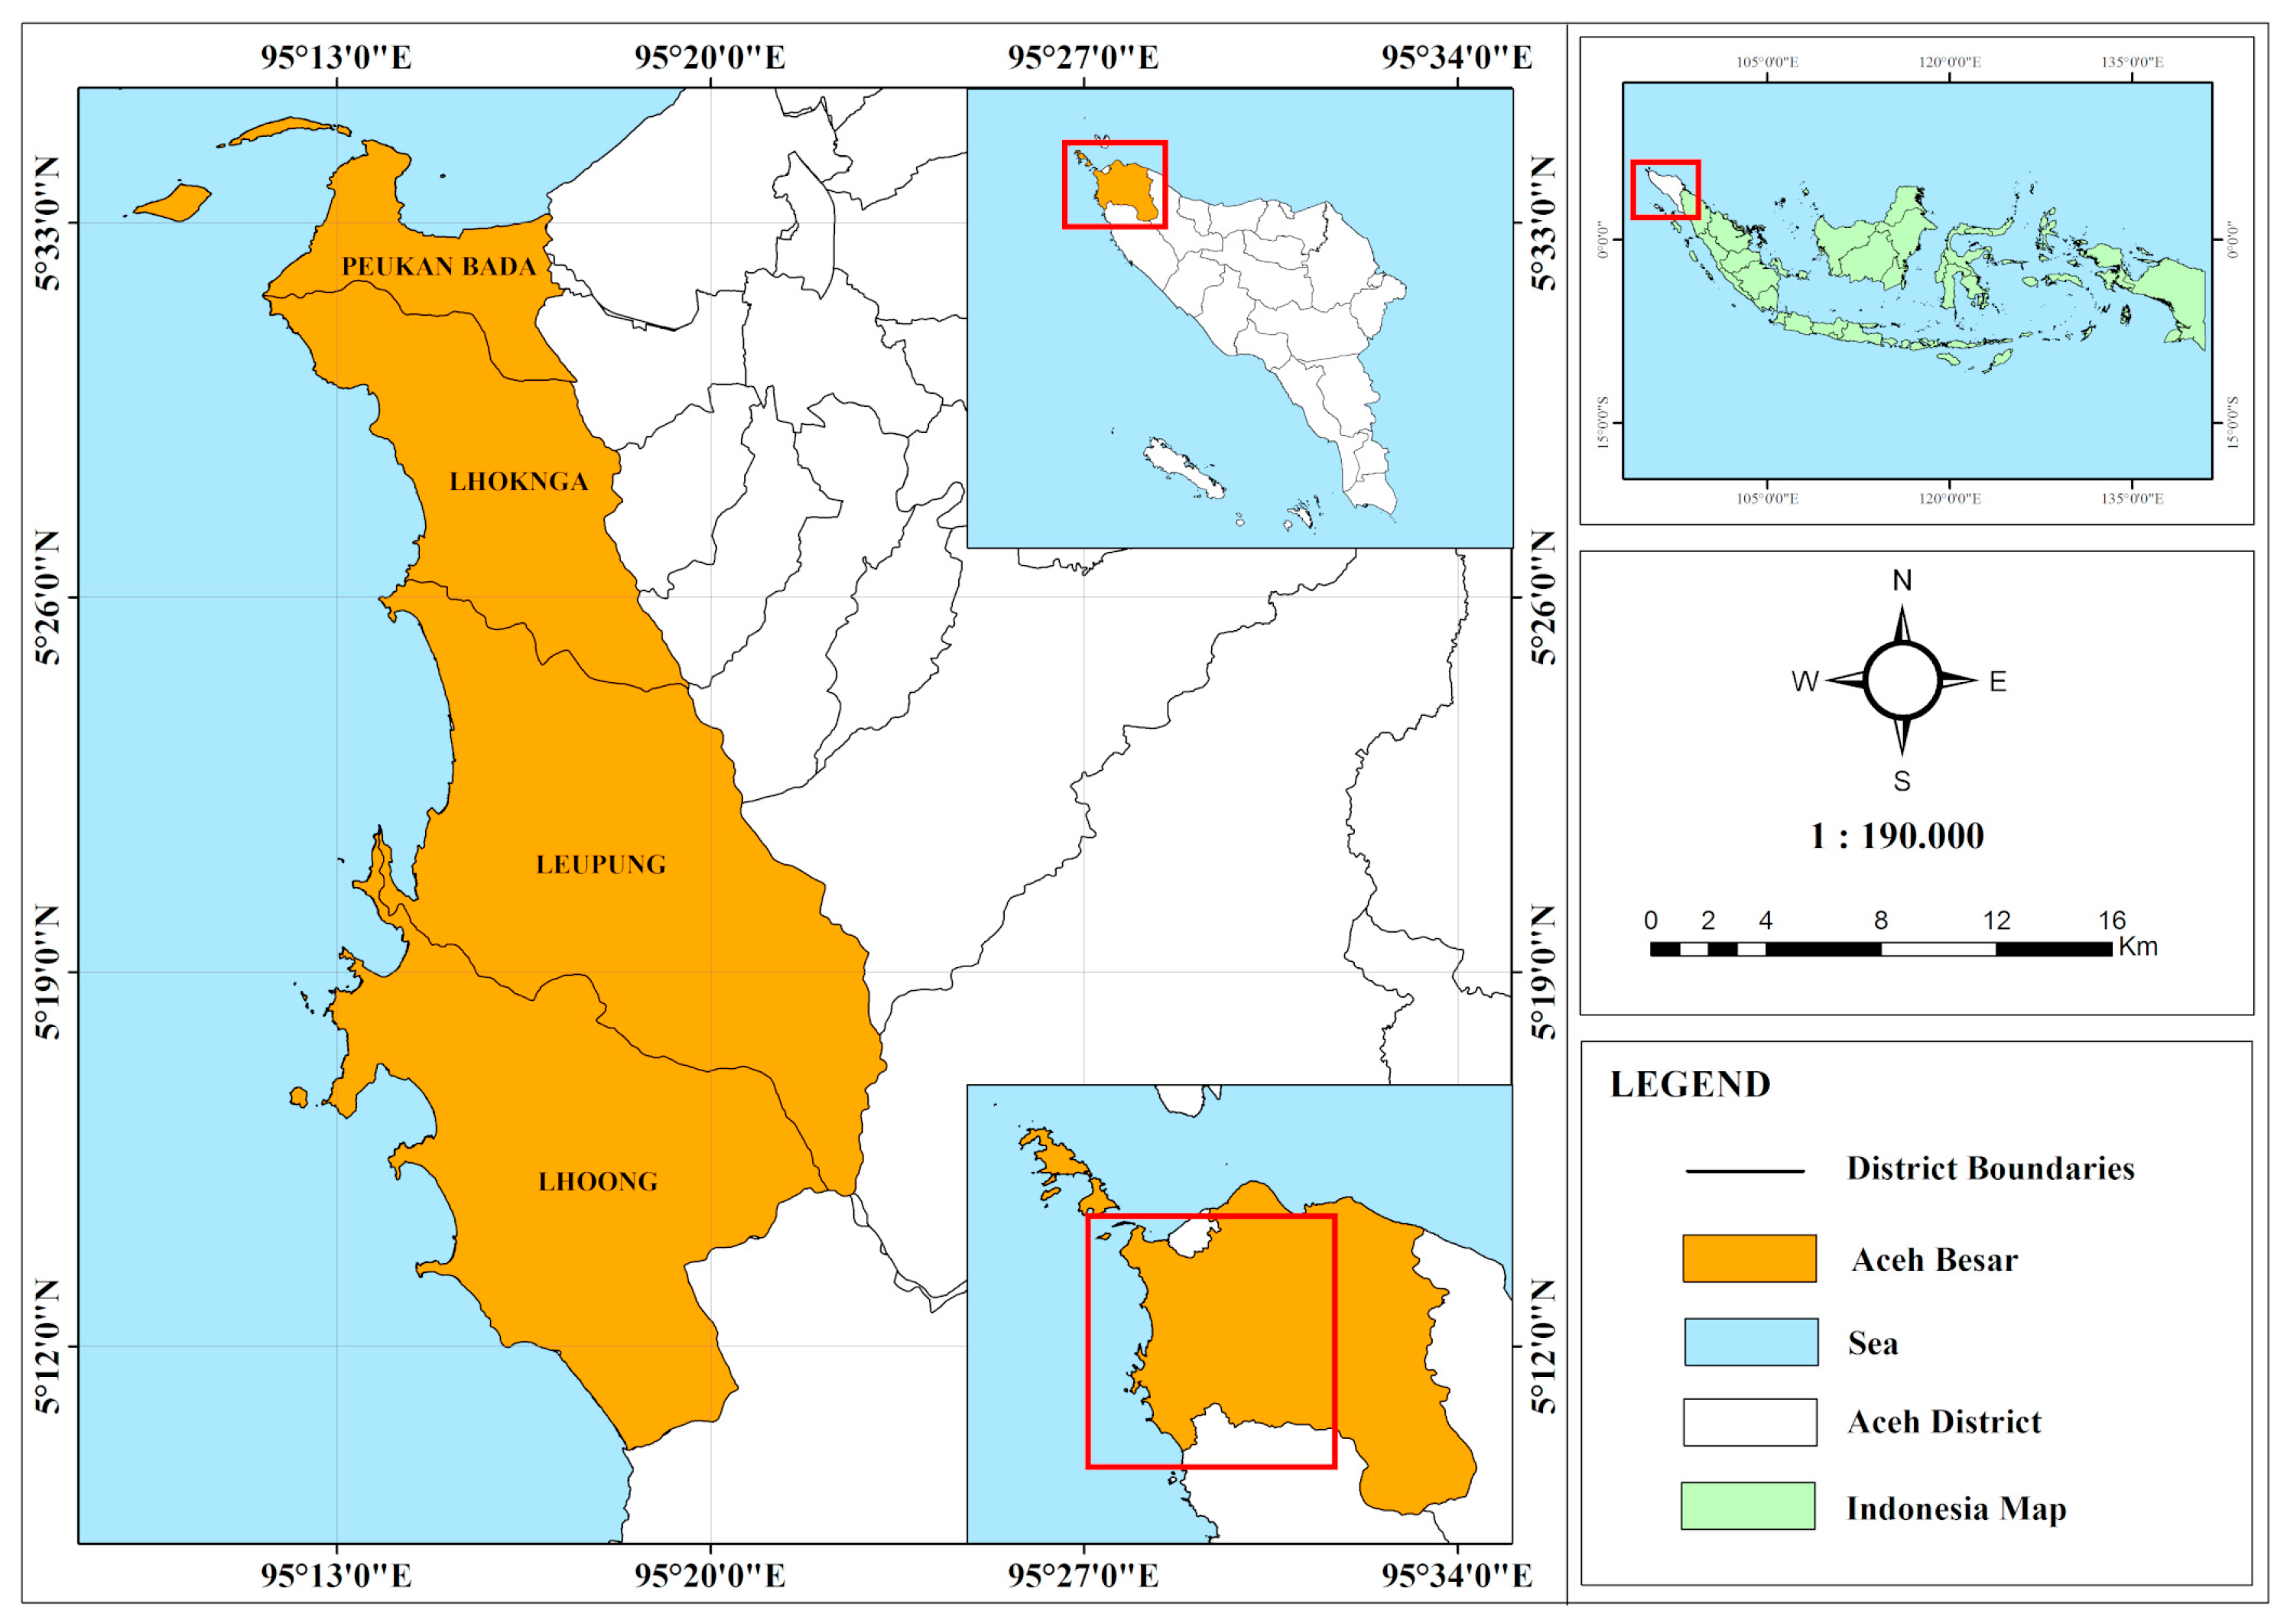
2.1. Location and Time of Research

The research was carried out on the west coast of Aceh Besar, starting from the coast of Ulee Leue to the coast of Lhoong, in a 93.2 km area (Figure 1). This research area includes four coastal sub-districts in the Aceh Besar district, namely Peukanbada, Lhoknga, Leupung and Lhoong. The research began in August 2020 and was completed in December 2020. Data processing was carried out at the Marine Geographical Information System Laboratory, Faculty of Marine Affairs and Fisheries, Syiah Kuala University.

2.2. Work Procedures

2.2.1. Determination of Cell Points

The cell points of the research location were determined and divided into several cells by grouping the length of the coastline into an area of 200 m × 200 m, with the aim of making the analysis process easier and producing some data for each given cell. The results of each data cell then represent the results of the coastal vulnerability index mapping.

2.2.2. The Data Collection

The data collected included primary data and secondary data (Table 1). The primary data were obtained from the field survey results during the research period. Primary data such as geomorphology was obtained from geomorphological field mapping, while elevation data was measured directly in the field using GPS as the ellipsoid height which was then transformed to orthometric height. Meanwhile, the secondary data such as coastal slope and shoreline changes were obtained through data source providers from related agencies and several related references. To ensure the accuracy of the data obtained, the data were further verified and compared with data from field measurements and the results of previous studies in several locations. The collected data were calculated and analyzed using the CVI method and further analyzed to identify the coastal vulnerability classes using ArcGIS software.

2.2.3. Analysis of CVI Data

The determination of the value of the coastal vulnerability index (CVI) for each cell was carried out by combining several risk parameters associated with it to produce an indicator of coastal vulnerability. The calculation of the coastal vulnerability index value was carried out using the CVI method with four coastal morphological parameters, namely the root of the multiplication of a parameter value being studied divided by the number of parameters studied [27]. The evaluation of the elevation parameters was carried out by calculating the average elevation in each cell, while the evaluation of the coastal slope was carried out by calculating the average value of the cross-shore direction perpendicular to each cell. Shoreline changes were calculated based on Landsat OLI imagery data for the last five years from 2015 to 2019 by examining changes in the annual average anomaly.
CVI = a × b × c × d 4
where:
  • CVI = coastal vulnerability index (CVI)
  • a = geomorphology
  • b = beach elevation
  • c = coastal slope
  • d = change in coastline.
The geomorphic parameter a is geological fabric in relation to the geomorphological processes and rock mass strength parameters. Geomorphological features were defined from available geological maps, field investigation, and data from the professional and scientific papers [28,29,30,31]. Coastal elevation parameter b is determined based on DEM data and field measurements. The coastal slope c is used as an indicator of the relative vulnerability to inundation, coastal stability, and the potential coastline retreat [28]. While, the coastal slope was determined from the combination between bathymetry and DEM data. It was defined as a maximal slope of 50 m from the sea before the shoreline up to 50 m inland, calculated every 20 m because of the coastal slope’s variability and the value used was the average slope in each cell. The shoreline changed is a parameter related to energy acting on the coast causing beach erosion and sedimentation.
The determination of the index classification, using the Likert method [32] assisted by ArcGIS 10.3.1 software [33], is divided into five categories, namely very low, low, medium, high and very high (Table 2). These categories are classified according to the calculation of the coastal vulnerability index and are assigned a color according to the level of vulnerability, as shown in Table 3 [34].

3. Result and Discussion

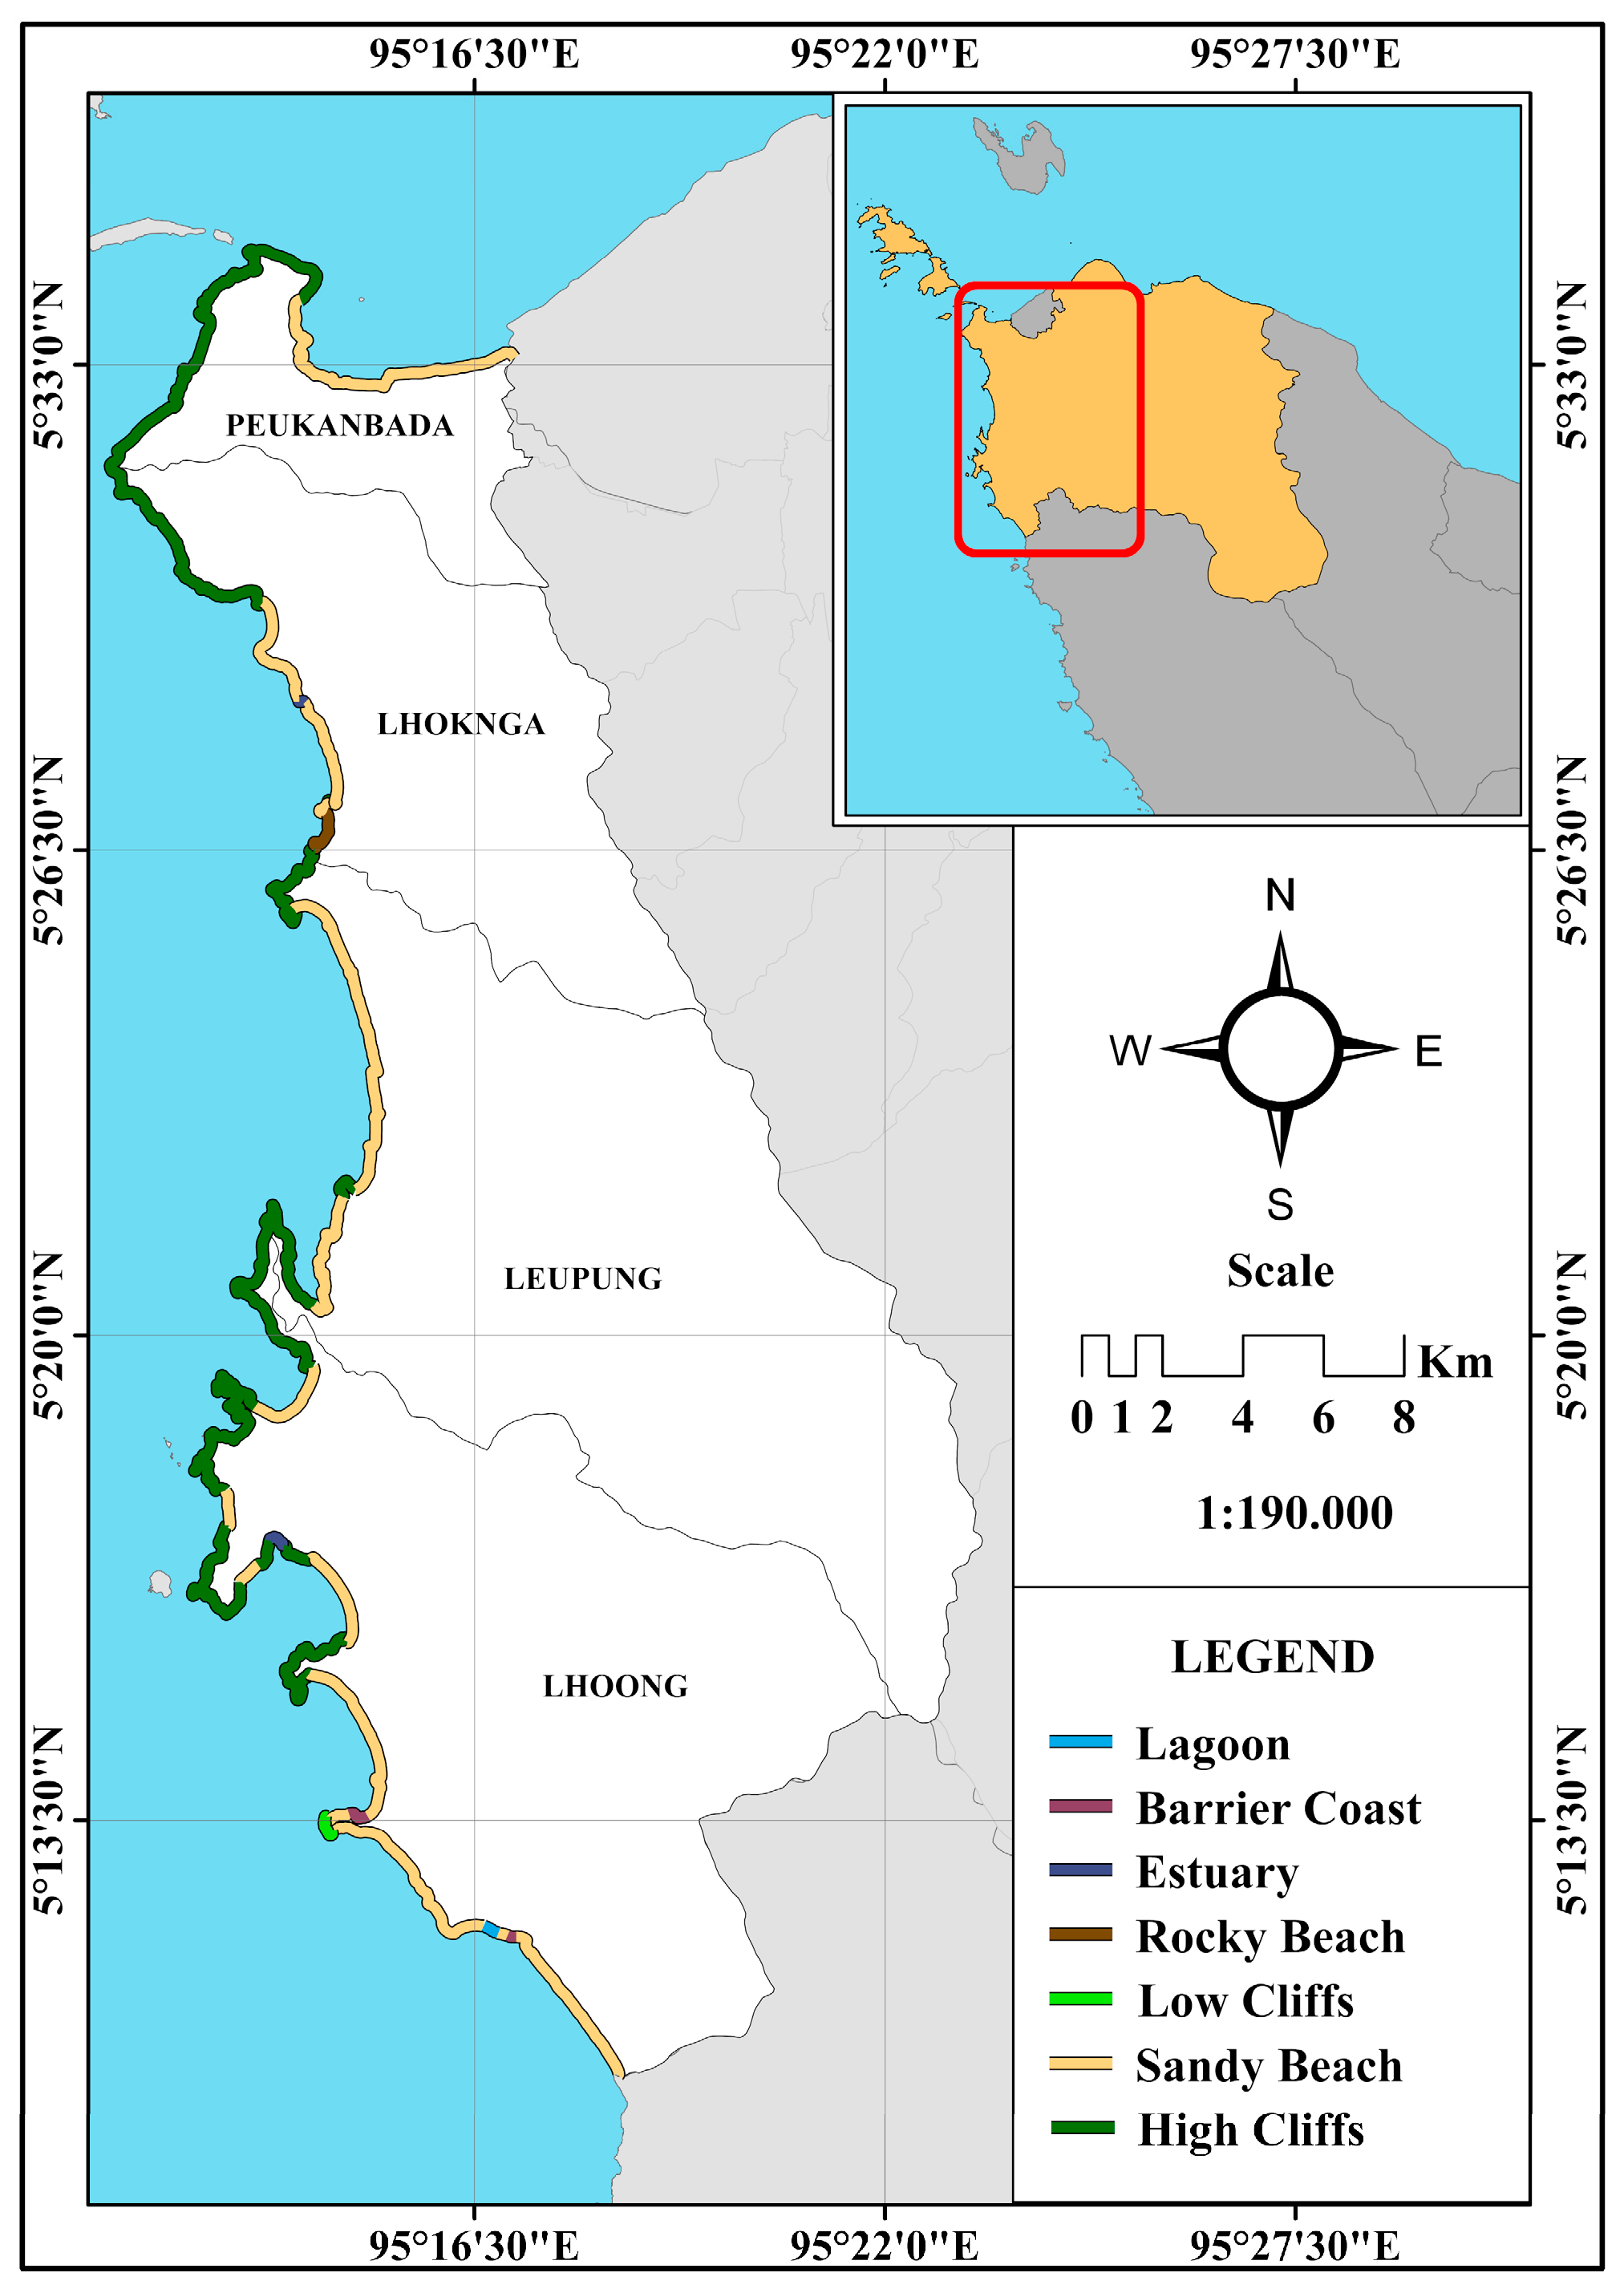
3.1. Coastal Vulnerability Based on Coastal Geomorphology

The results of our geomorphological study of the west coast of Aceh Besar can be seen in Figure 1. The west coast of Aceh Besar has a geomorphology composed of sandy beaches, rocky beaches, cliff beaches, barrier beaches, lagoons, and estuaries. The most dominant geomorphology on the west coast of Aceh Besar is sandy beaches (48.07%) and high cliffs (47%).
The vulnerability map from the geomorphological study of the west coast of Aceh Besar is shown in Figure 2 and Table 4. The results show that most of the west coast of Aceh Besar, with a study length of 93.2 km, is categorized as having a very high vulnerability of 50.64%, consisting of sandy beaches (48.07%), estuaries (0.64%), and barrier coast (1.93%). Meanwhile, the high-vulnerability area comprises 0.43% and is a lagoon area. Furthermore, the medium vulnerability area comprises 1.73%, made up of low-cliffed coast areas (0.64%) and rocky coast (1.29%). Finally, geomorphologically, 47% of the location is categorized as a high-cliffed coastal area.
Isdianto et al. [35] stated that areas with sandy beaches, muddy beaches, barrier beaches, and deltas as part of their geomorphology are very vulnerable to the dangers of sea level rises and ocean dynamics such as currents and tidal waves. Therefore, beaches in this category are vulnerable to hazards. In addition, Alviani [36] and Sakka [37] also stated that areas that have low relief, such as barrier coasts, estuaries, lagoons, and deltas, have a high level of vulnerability to erosion. Meanwhile, areas with a low level of vulnerability to erosion are those that have hard substrates and high relief, such as rocky beaches and high cliffs.
The map of the vulnerability level and the quantitative percentage of vulnerability based on the coastal geomorphology of the area are shown in Figure 3 and Table 4. The results show that almost all areas in the northern part of Aceh Besar district have very high vulnerability. Figure 3 also shows that the sub-districts of Leupung and Lhoong are also areas with very high vulnerability compared to other areas because, geomorphologically, these areas are dominated by sandy beaches. Meanwhile, Peukanbada and Lhoong sub-districts have very low vulnerability because almost half of the area is located in high-cliffed coastal locations.

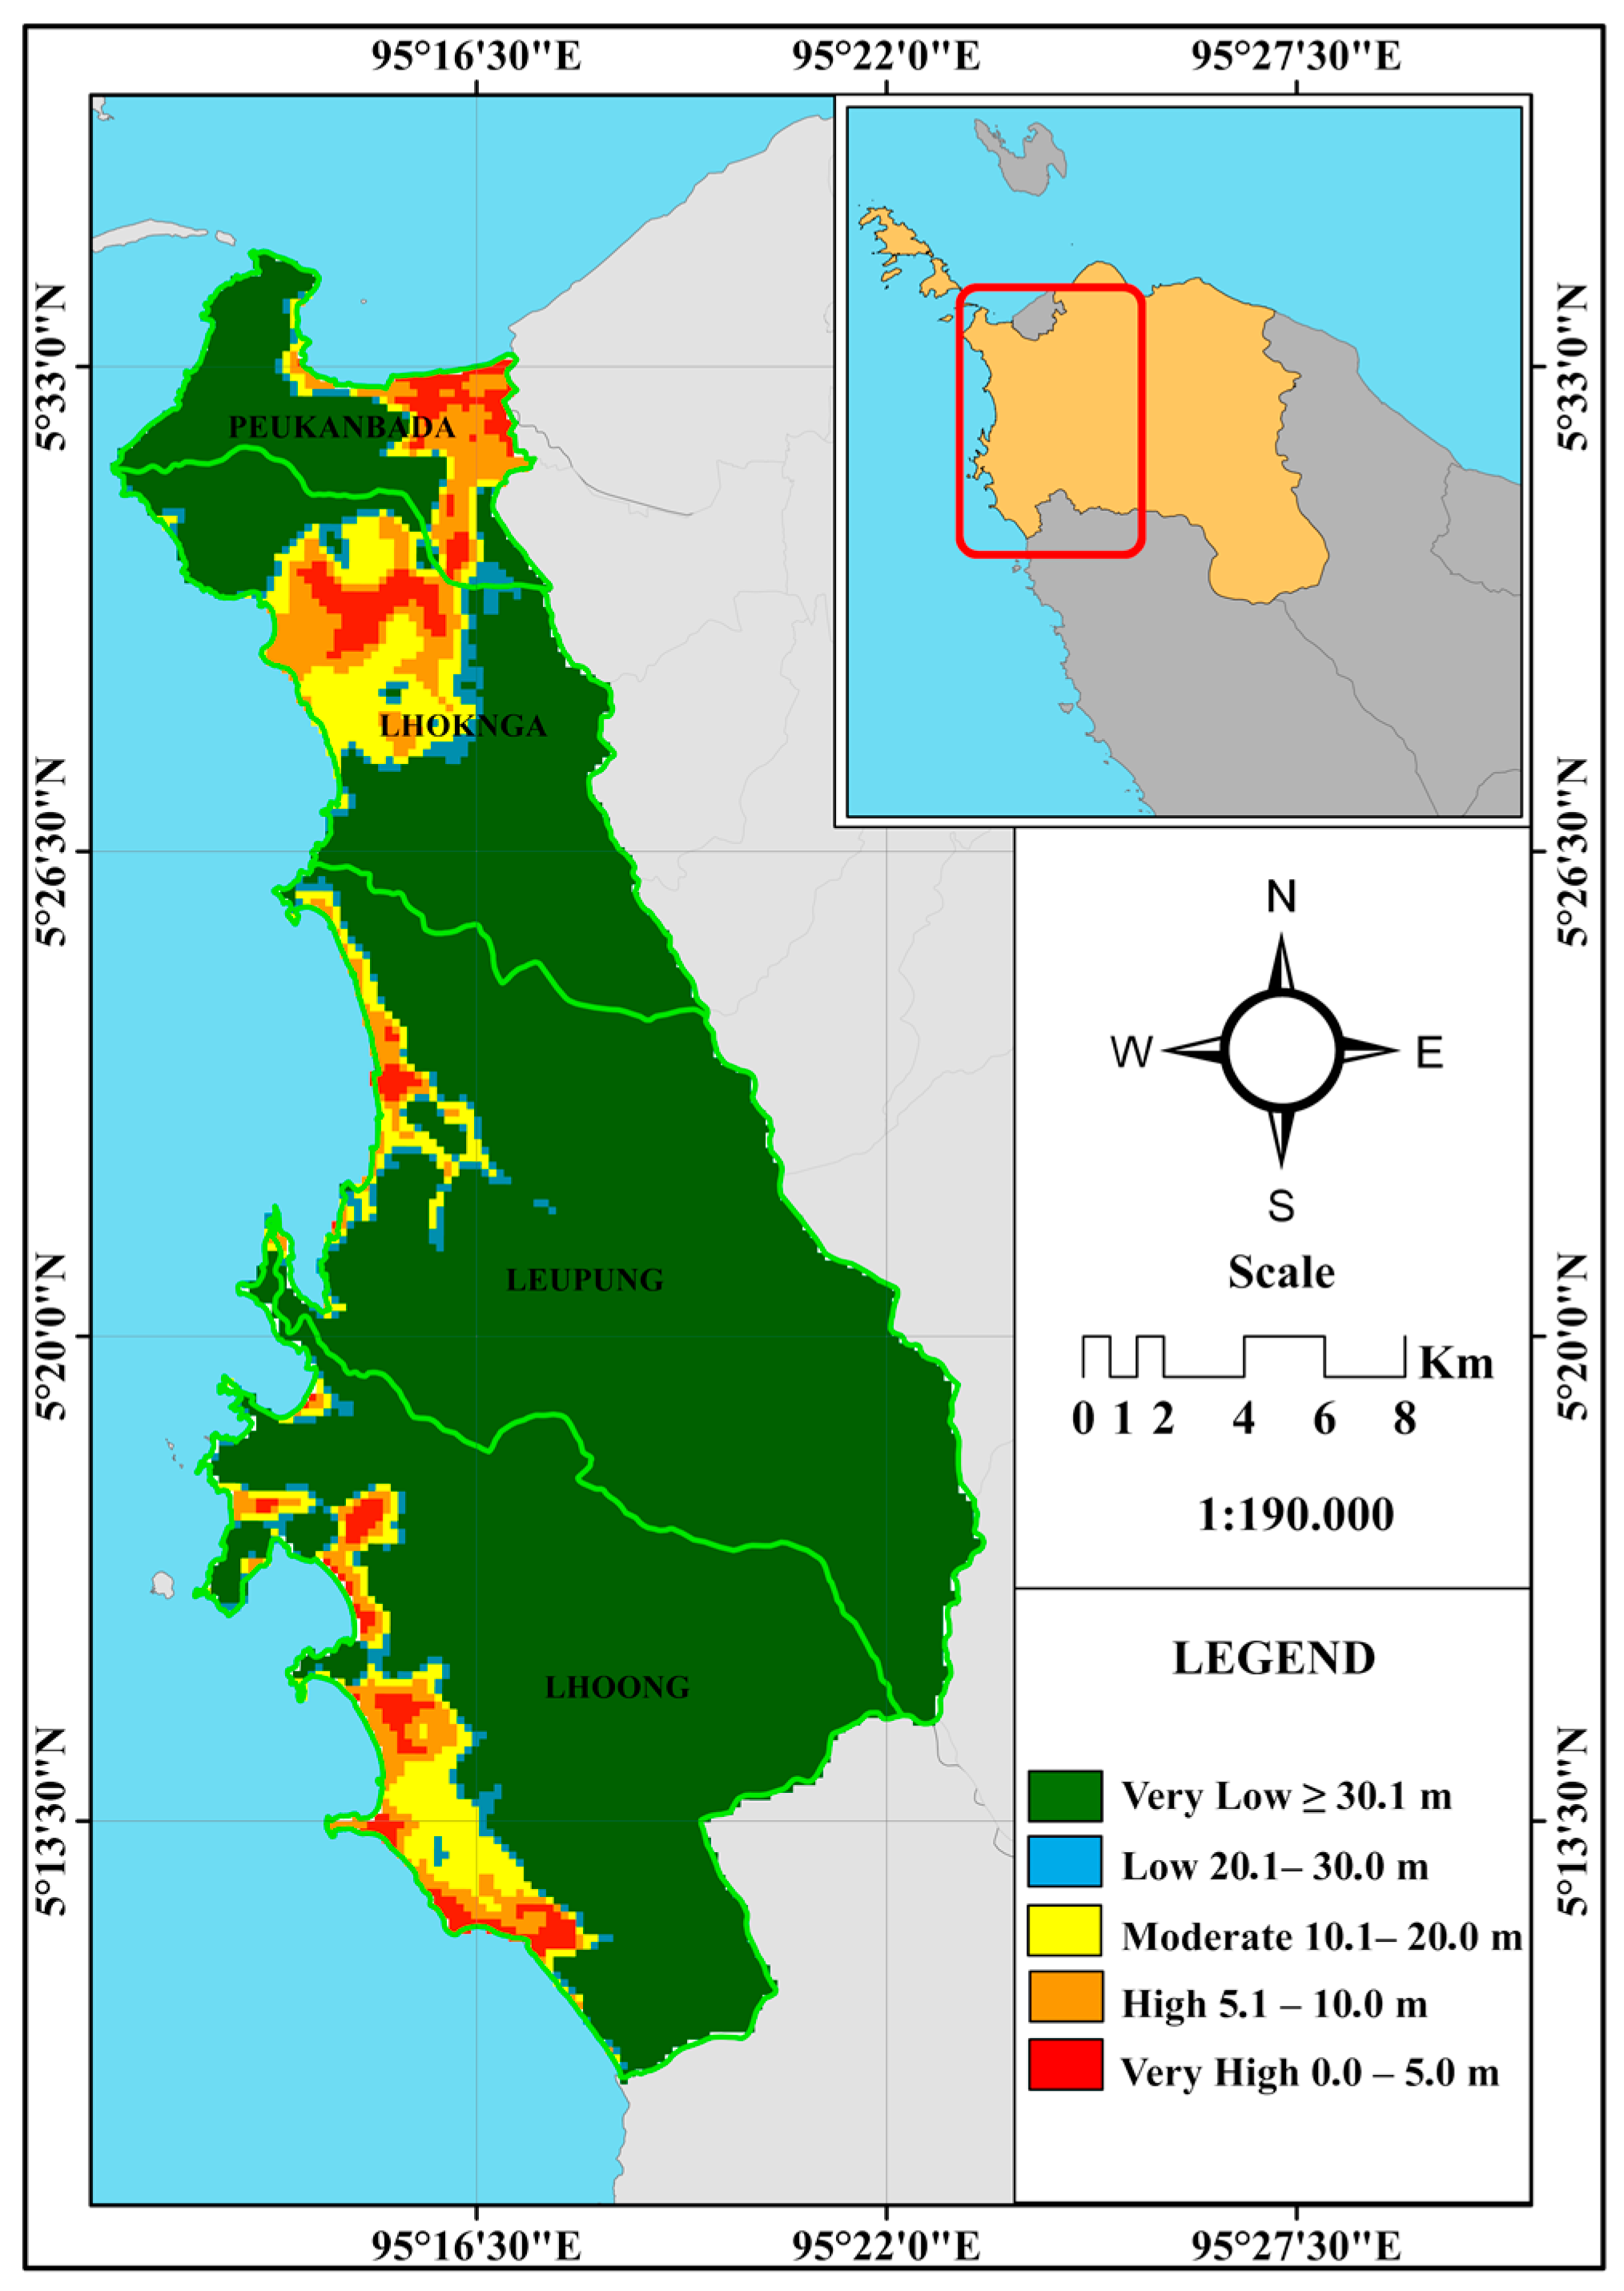
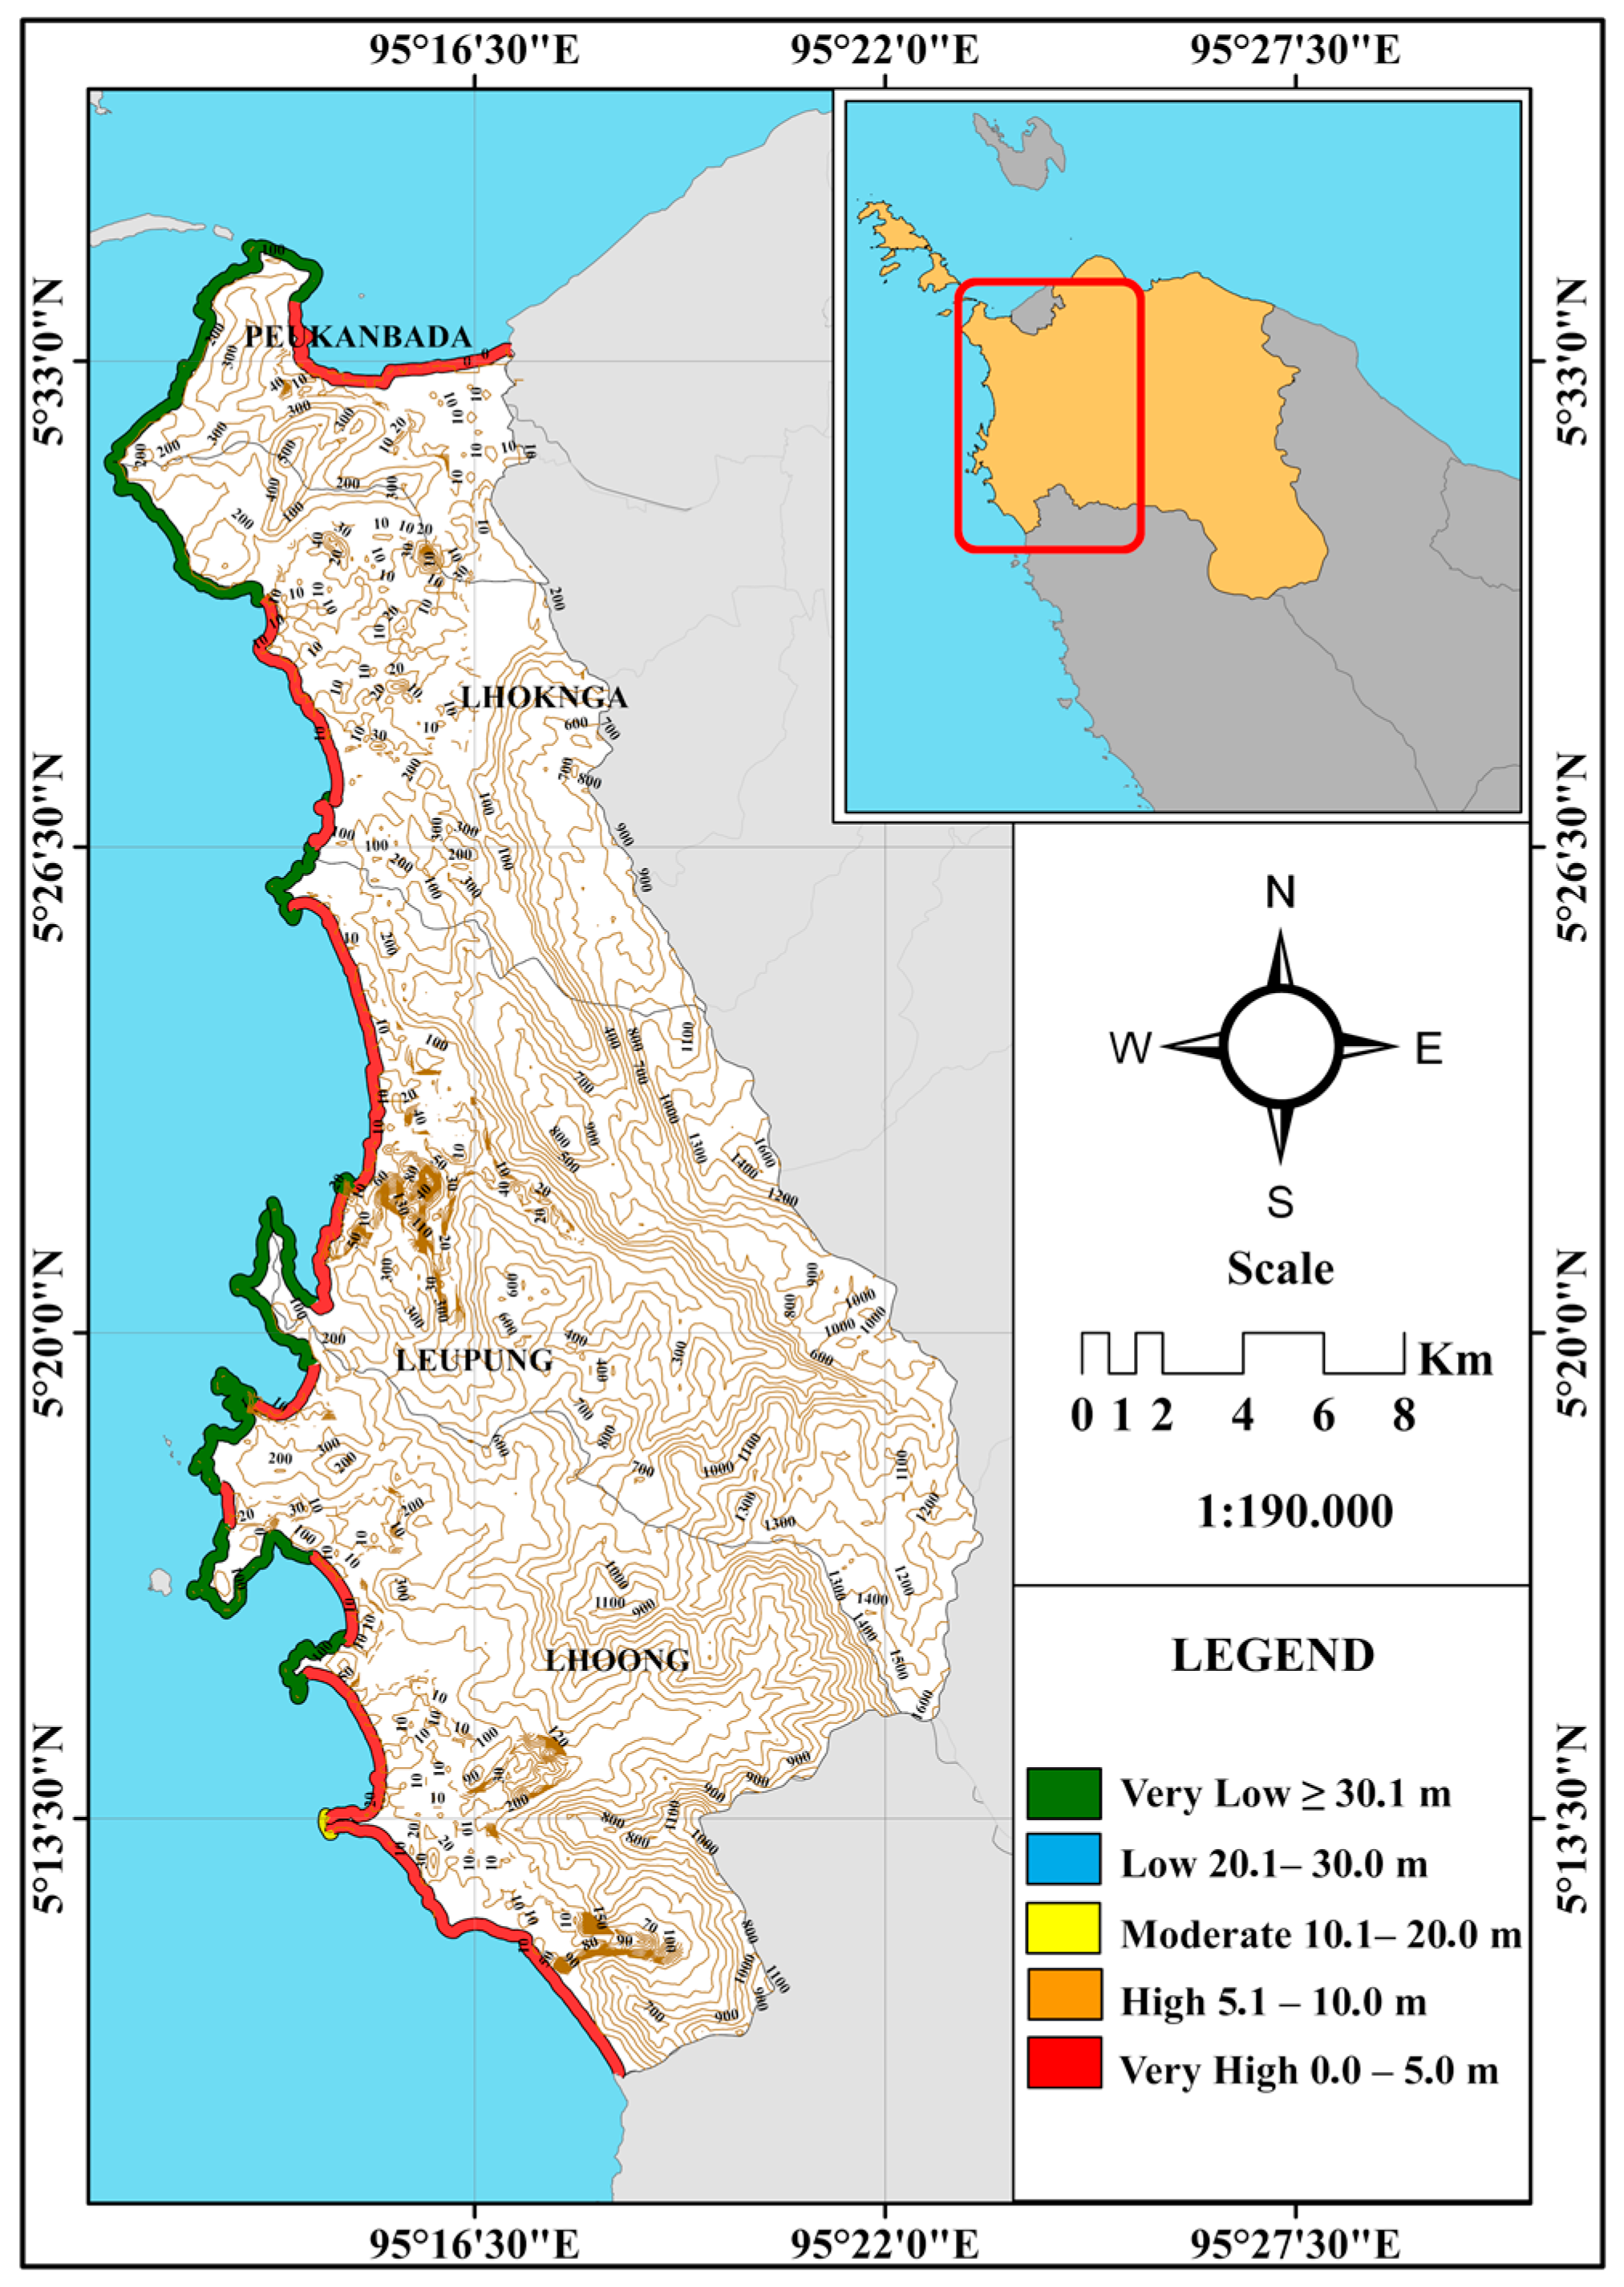
3.2. Coastal Vulnerability Based on Coastal Elevation

The results of the coastal elevation analysis of the west coast of Aceh Besar are shown in Figure 4, based on DEMNAS data, and Figure 5, from the field data analysis. Based on Figure 4 and Figure 5 it can be concluded that around 40% of the west coast of Aceh Besar comprises cliffs with elevations above 30 m, while more than 51% of the area is located at an elevation between 0 and 5 m above sea level.
The map of the elevation vulnerability levels can be seen in Table 5. The results of this tabulation are presented in Figure 5, which shows that most of the study area consists of highly vulnerable areas with an average elevation of 2 m, spread across all sub-districts. When viewed from the coastal elevation, the Peukanbada sub-district has the lowest average elevation, which is 1.14 m with a coverage area of 7%. The Lhoong sub-district area is a low-elevation area with an average elevation of 1.75 m, but covers more than 21% of the low-elevation area. Meanwhile, the highest low-elevation area, on average, is Leupung sub-district, where the average elevation is about 1.82 m, covering more than 12% of the area.
The results of the coastal elevation analysis can identify and predict areas that will be lost due to the impact of future sea level rises [38]. Rahadiati et al. [38] estimated that, in the next 100 years, sea level rises will increase by between 0.5 and 5 m. In addition, Hamuna et al. [39] stated that, when high waves occur in a low coastal elevation, water will enter the land, causing water inundation. Therefore, the coast, which has a low elevation between 0 and 5 m above sea level, has a very high vulnerability in the event of sea level rises and large waves [40,41].

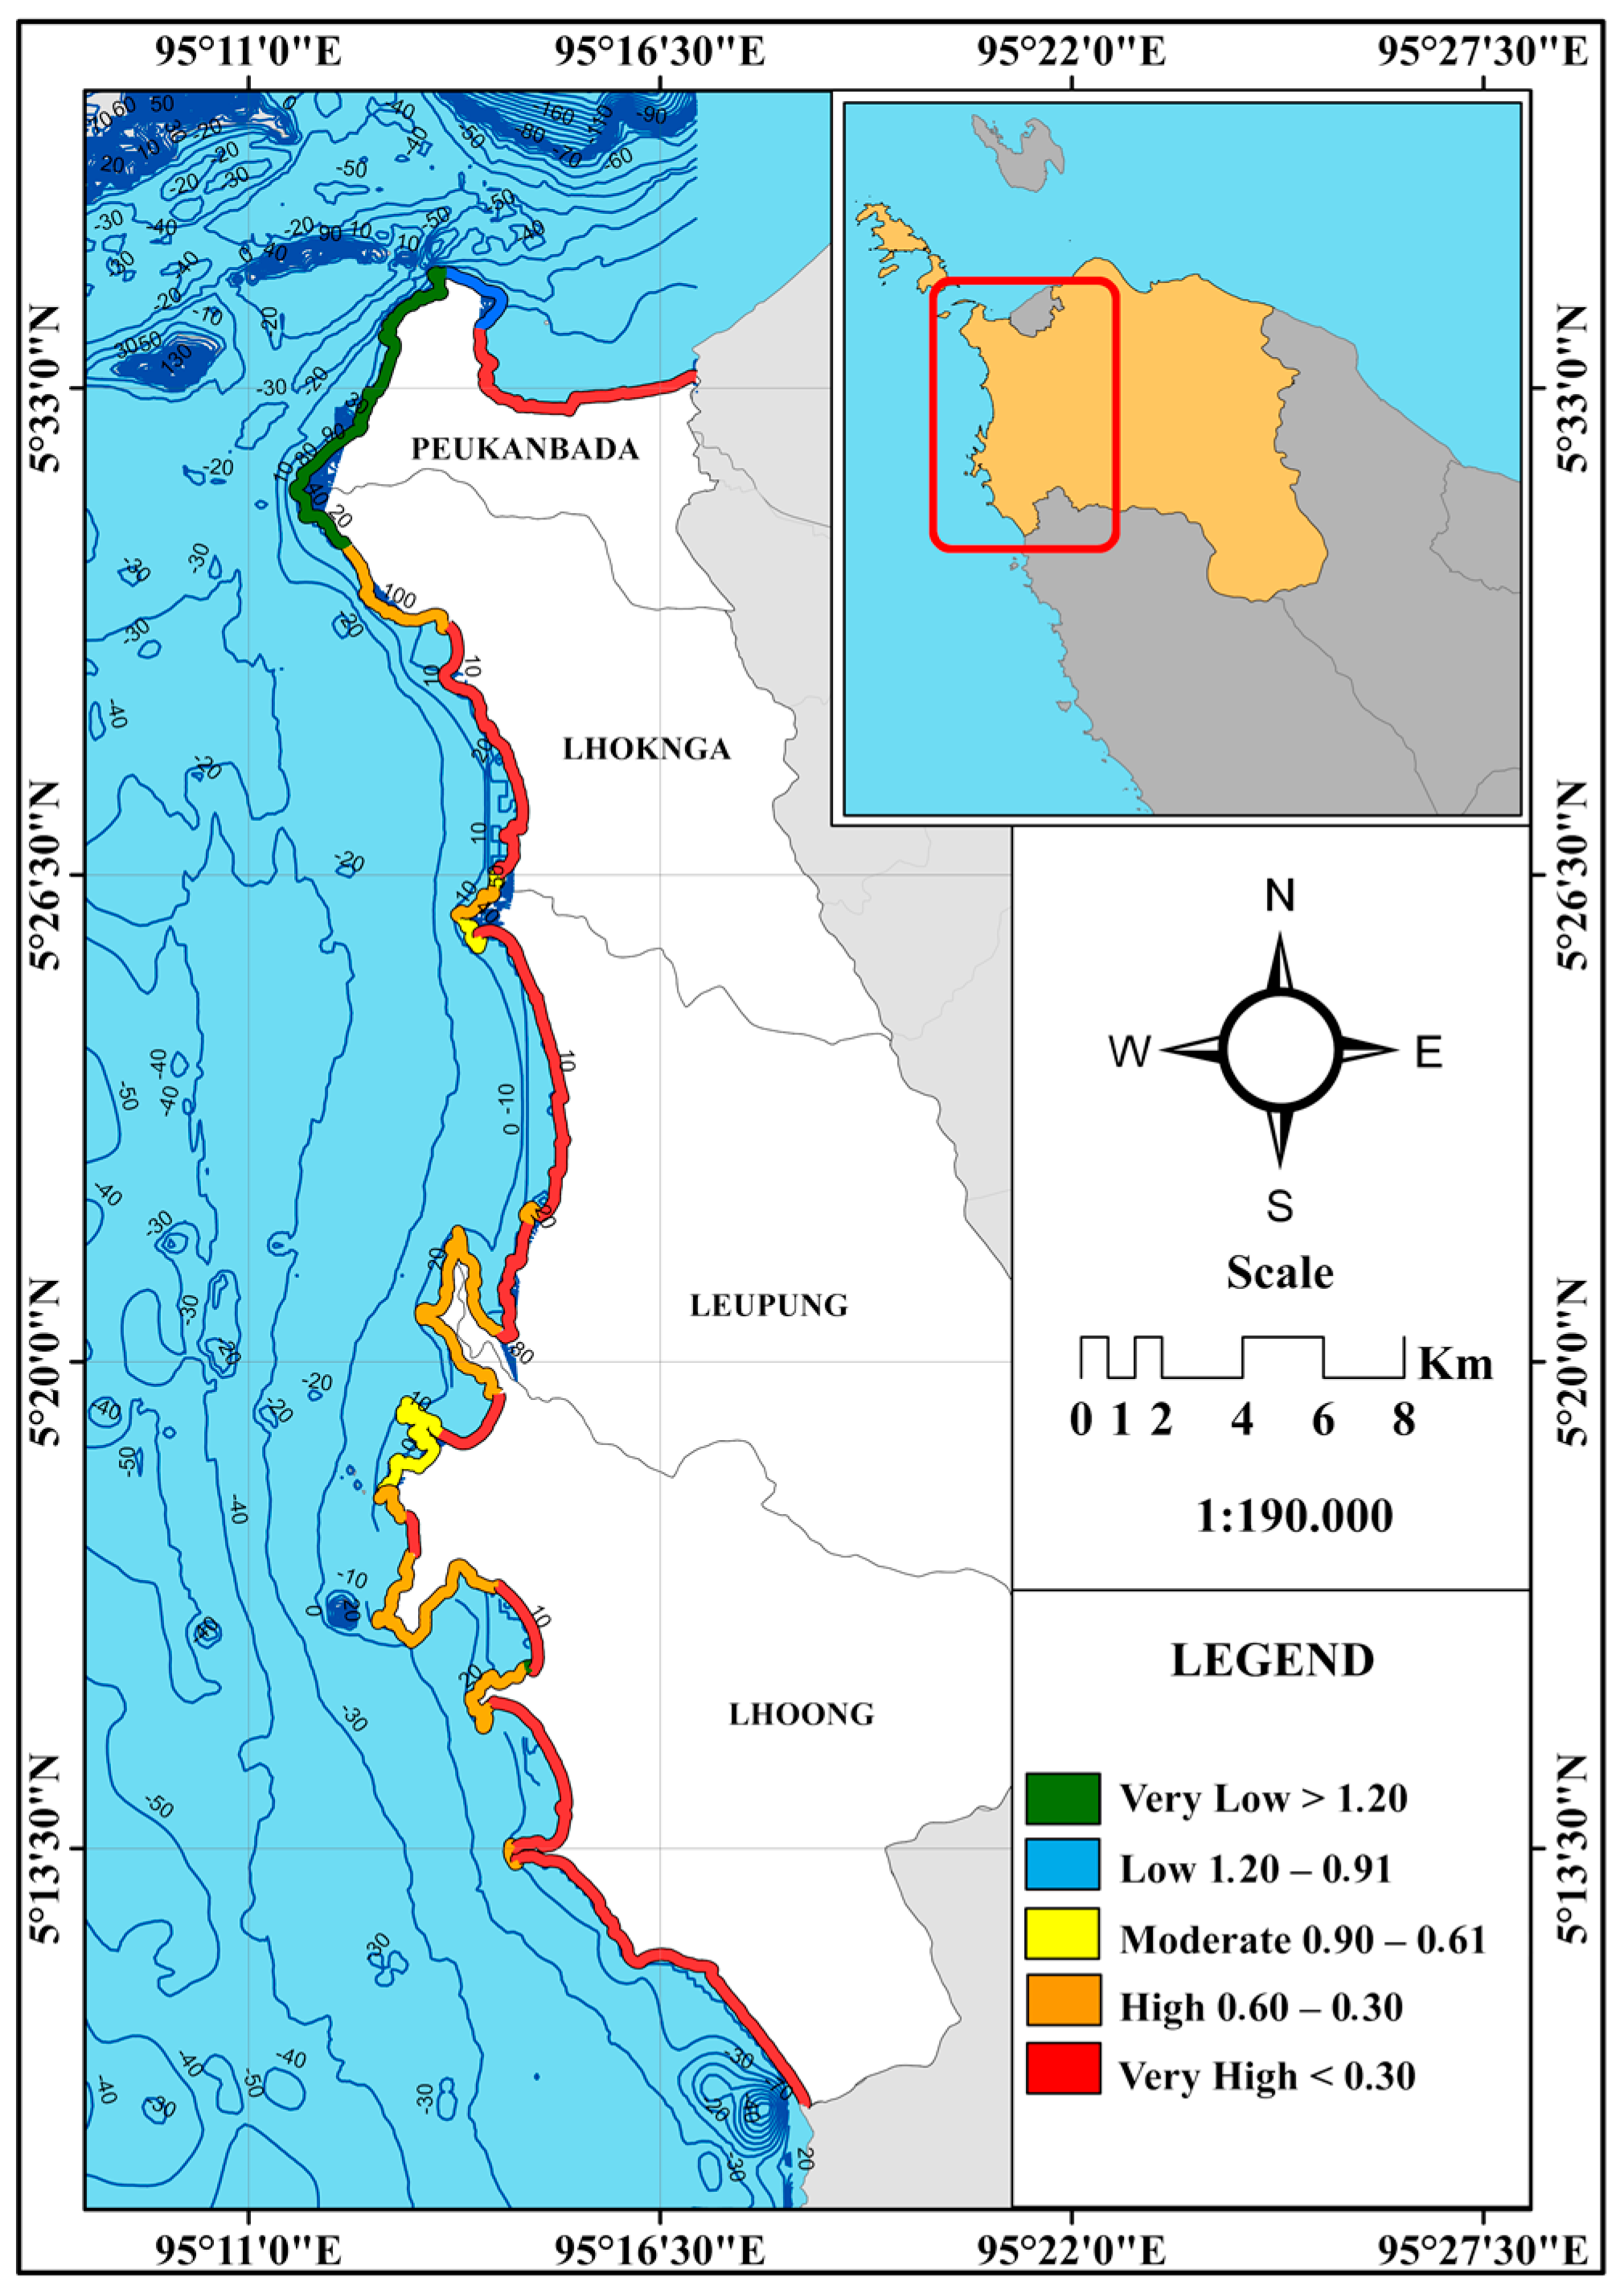
3.3. Coastal Vulnerability Based on Coastal Slope

The analysis results in Figure 6 and Table 6 show that the overall slope of the west coast of Aceh Besar is dominated by very high vulnerability, with an average slope of 0.12%. This very gentle slope covers 47.6 km (51.07%) of the total length of the study area and is generally distributed across all sub-districts. Furthermore, 26 km (27.9%) of the study area in the Lhoknga, Leupung and Lhoong sub-districts shows high vulnerability with a coastal slope of 0.46%. Only about 11% of the total area, found in Peukanbada (8.58%), Lhoknga (2.36%) and Lhoong (0.21%) sub-districts, has very low vulnerability, with a coastal slope above 1.45%.
In estimating the occurrence of sea level rises, the coastal slope must be studied and investigated, as sea level rises are highly likely to occur on gentle coastal slopes, which will potentially inundate coastal areas [42,43]. In addition, a sloping beach area will facilitate the run-up of waves entering the coast, which can lead to coastal erosion and flooding occurring more easily [44,45]. In accordance with the results of the analysis in Figure 6, Lhoong sub-district area has the lowest coastal slope, at 0.09%, which is classified as very high vulnerability. On the other hand, Peukan Bada sub-district has very low vulnerability because the area comprises high cliffs with a steep coastal slope.

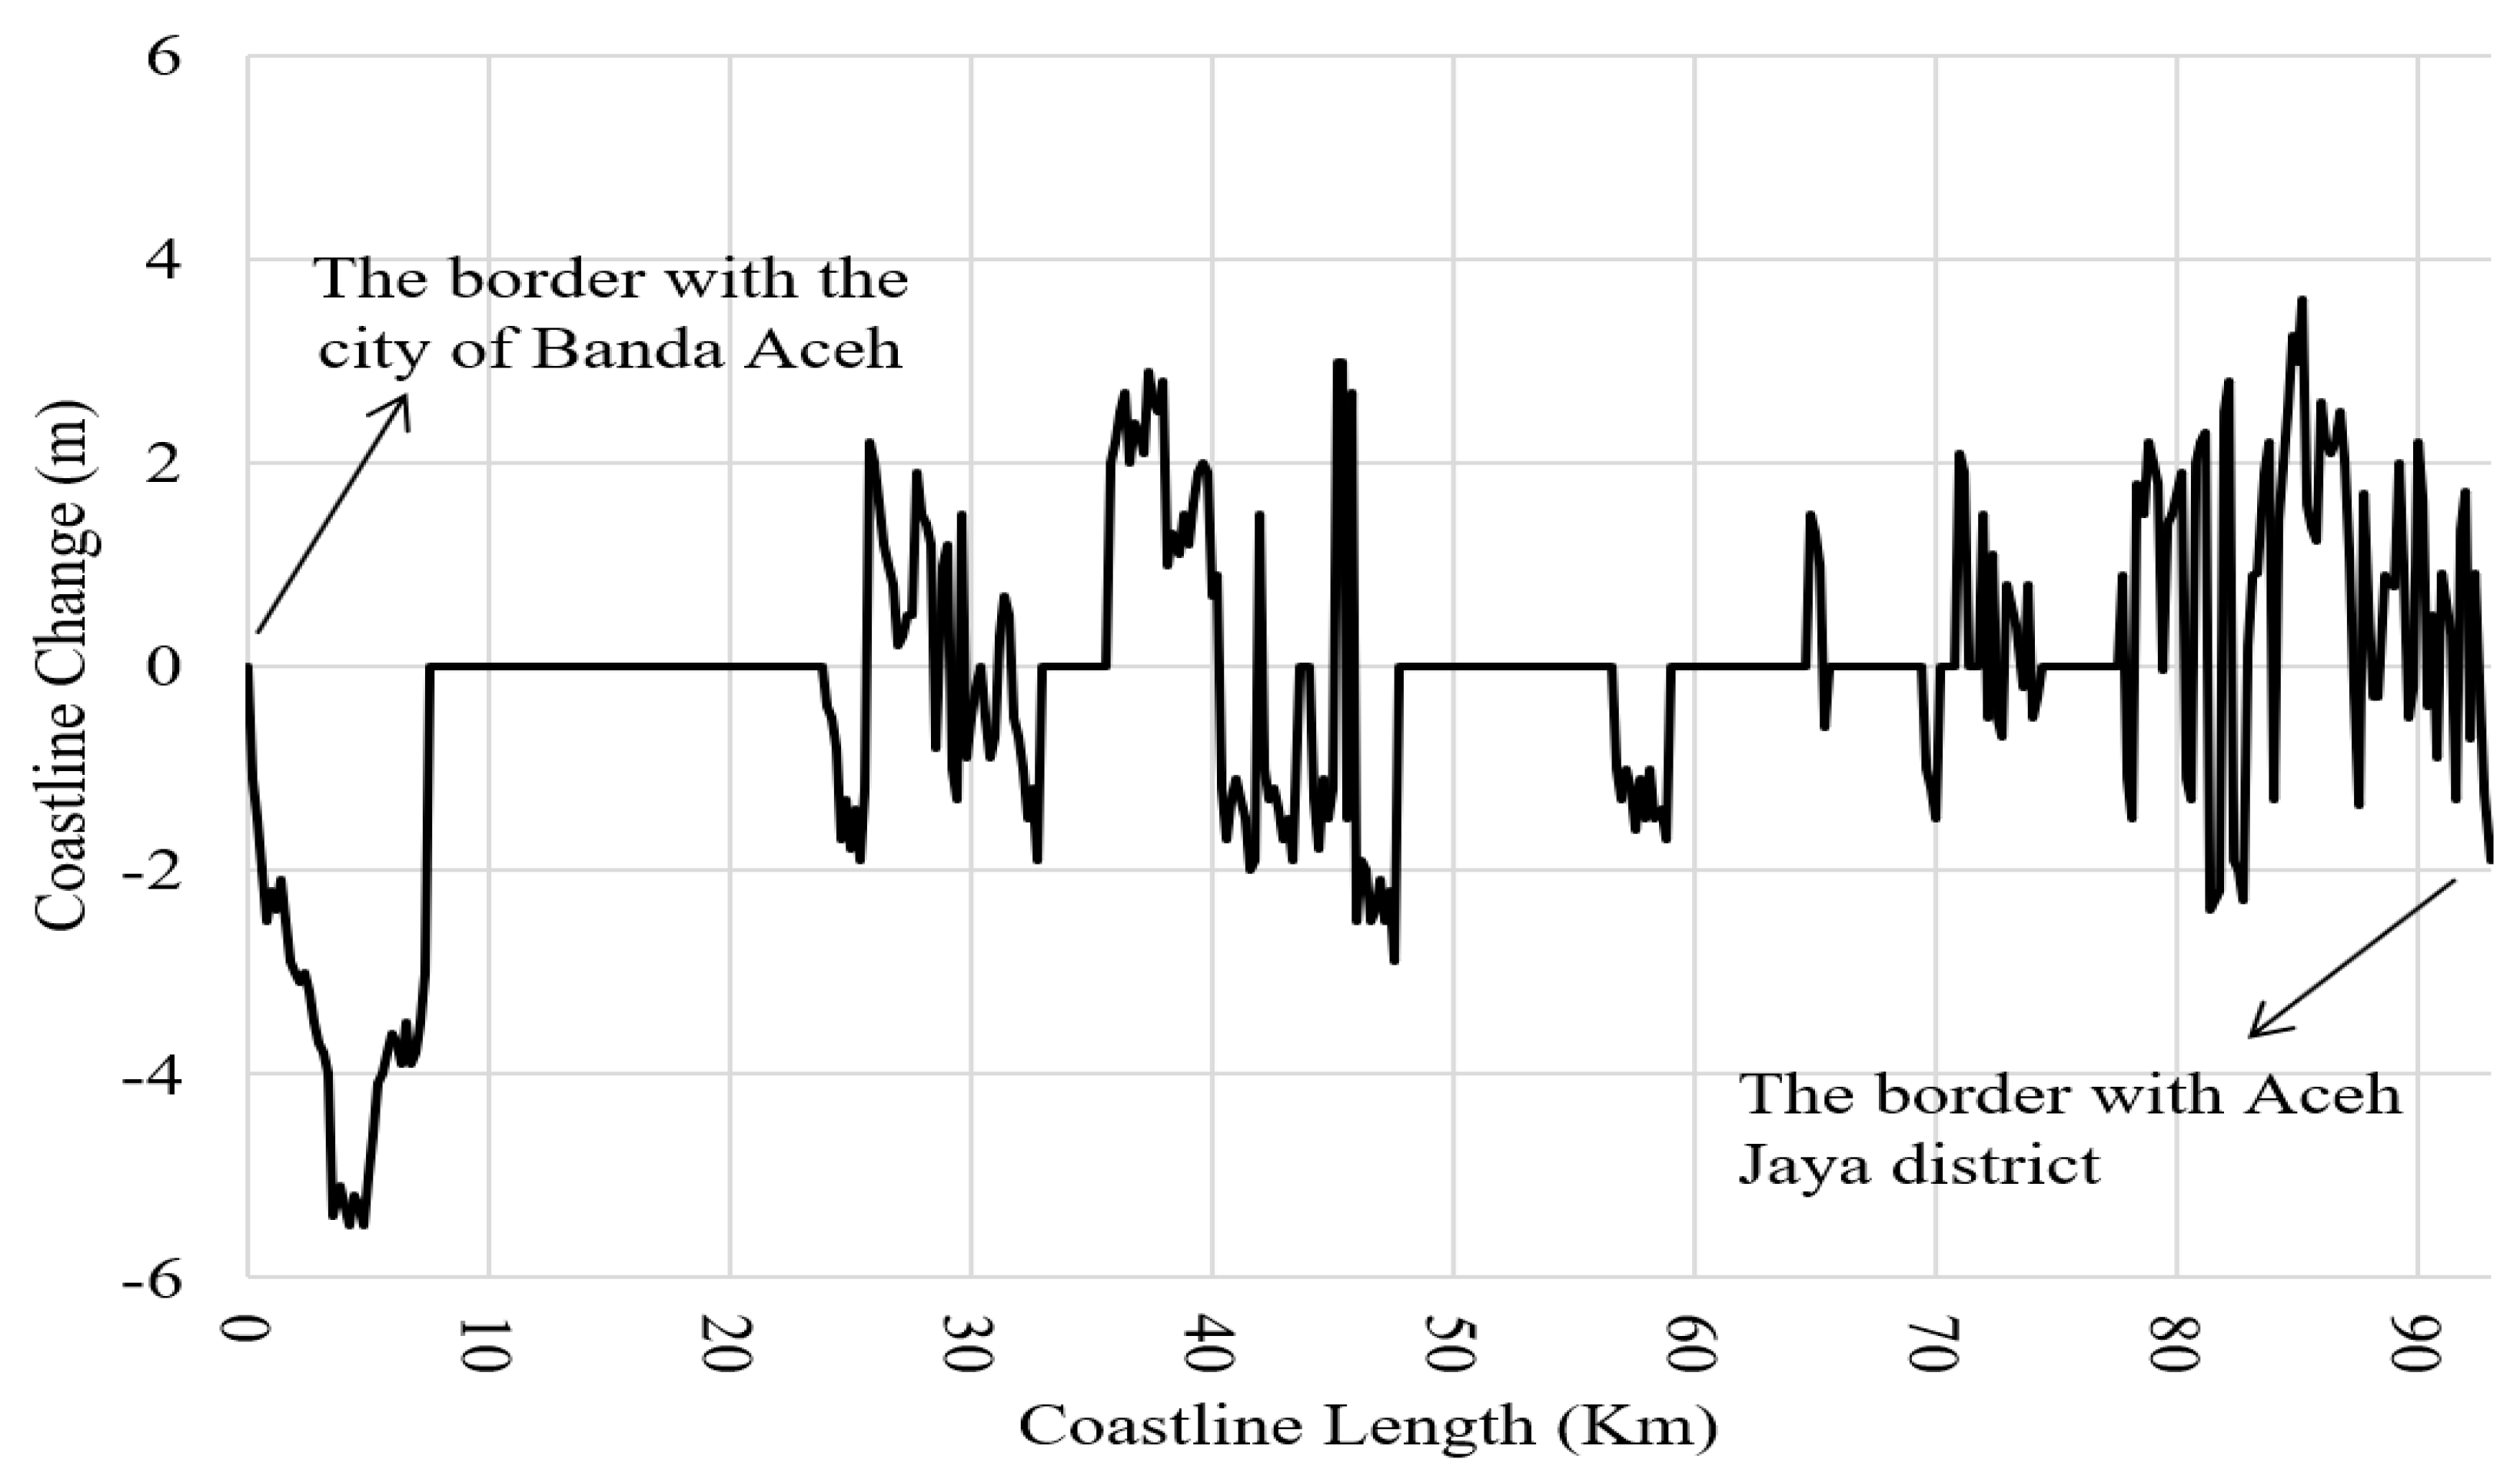
3.4. Coastal Vulnerability Based on Shoreline Changes

Activities that occur in coastal areas on land and at sea greatly influence changes in the coastline, in the form of either accretion or erosion [36]. The results of the shoreline change analysis using Landsat OLI imagery from 2015 to 2019 are shown in Figure 7 and Table 7. These data indicate that the overall study area experienced an average erosion of −3.34 m across 9.8 km (10.51%) of the total length of the study area, which is categorized as having very high vulnerability. Furthermore, the 10.4 m area (11.16%) experienced an average erosion of −1.45 m, which was categorized as high vulnerability. Additionally, the 56.2 km area (60.31%) was categorized as being moderately vulnerable, with changes in the coastline between −1 and 1 m. Furthermore, the level of erosion in the 7.2 km area (7.73%) is −0.59 m, while the level of accretion in the 5.4 km area (5.79%) is 0.63 m. In total, 43.6 km (46.78%) of the length of the coastline has not changed because this comprises areas in which cliffs and rocky beaches are present. The areas that possess low vulnerability have an accretion of +1.55 m and a length of 10.4 km (11.16%). Meanwhile, areas with very low vulnerability experienced an accretion of +2.54 m ha and possessed a length of 6.4 km (6.86%).
Changes in the coastline of the west coast of Aceh Besar can also be seen in the shoreline changes graph in Figure 8. The results of the analysis show that very large levels of erosion occurred in the last five years in Peukan Bada sub-district, while large amounts of sedimentation occurred in Lhoong sub-district. The overall results indicate that the shoreline changes in the study area mean that this location is in the moderate to very highly vulnerable category.
Changes in the shoreline occur due to hydro-oceanographic dynamics, which cause areas of erosion and sedimentation. However, the dominant factors that cause shoreline changes are location, coastal geomorphology [46] and the dynamics of waves and longshore currents [47]. Furthermore, the dynamics of currents, waves, wind and rain cause coastal degradation, while accretion generally occurs in areas that possess estuaries and areas that are host to human activities [48,49].

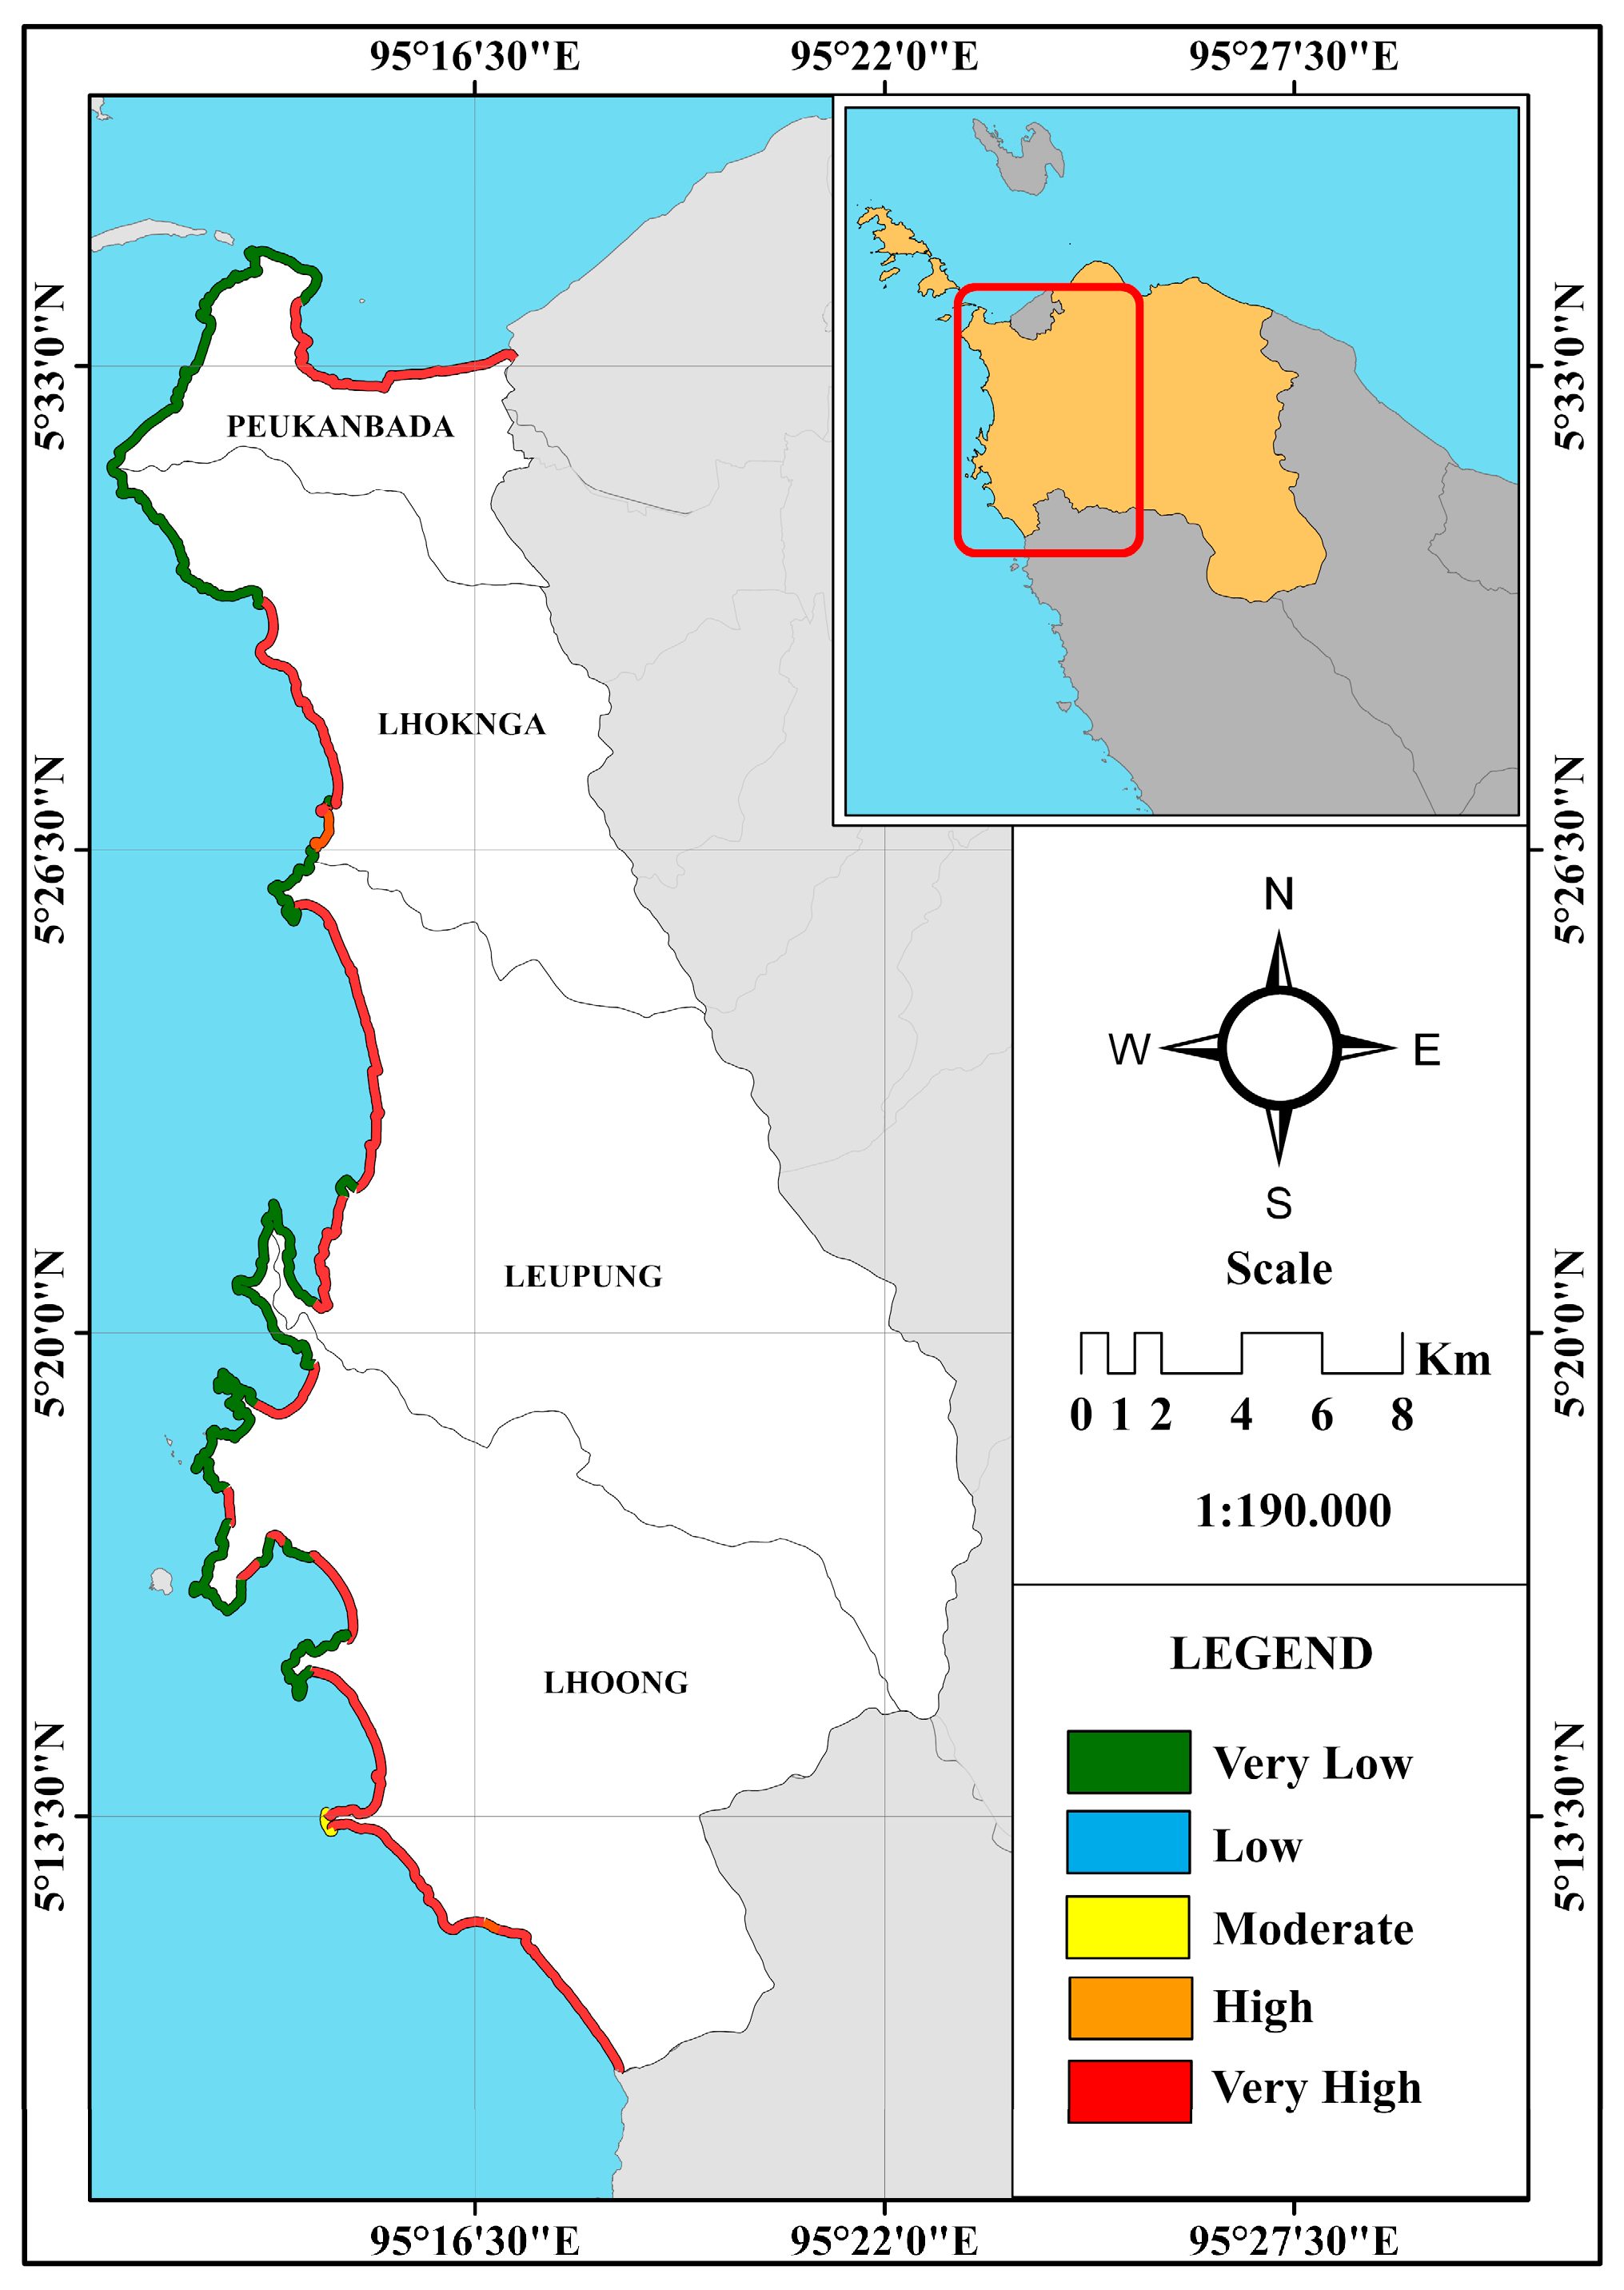
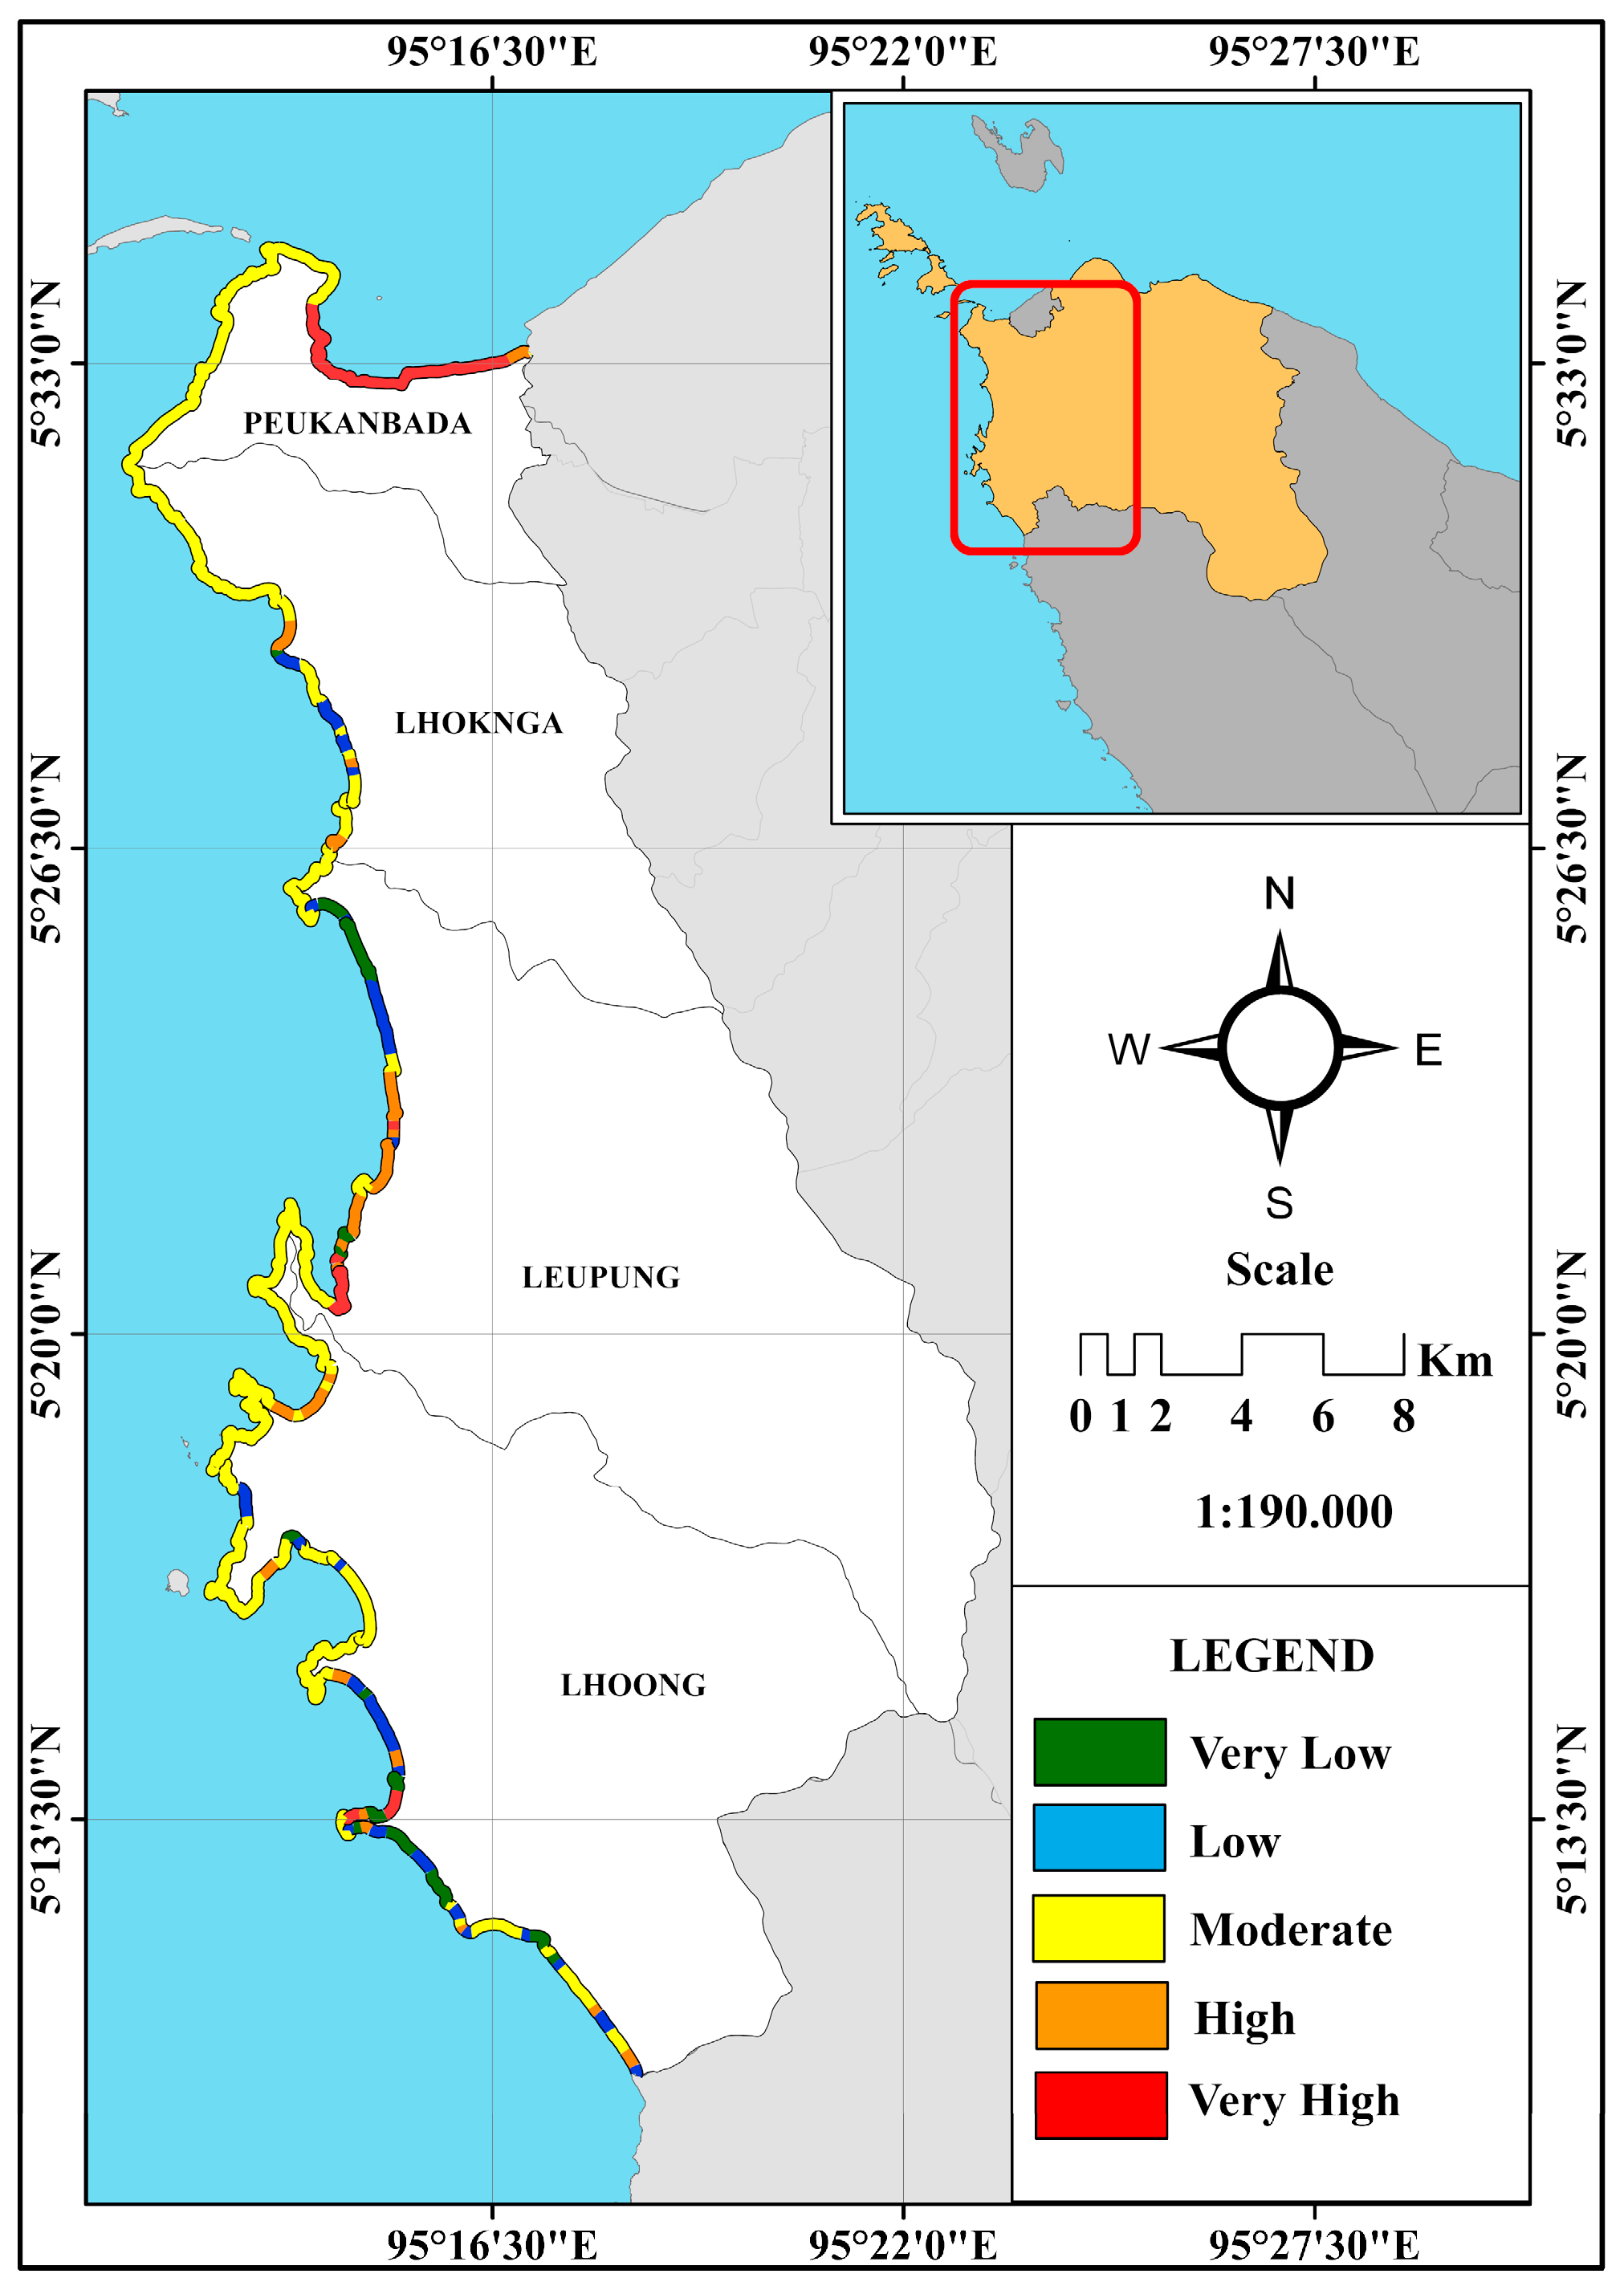
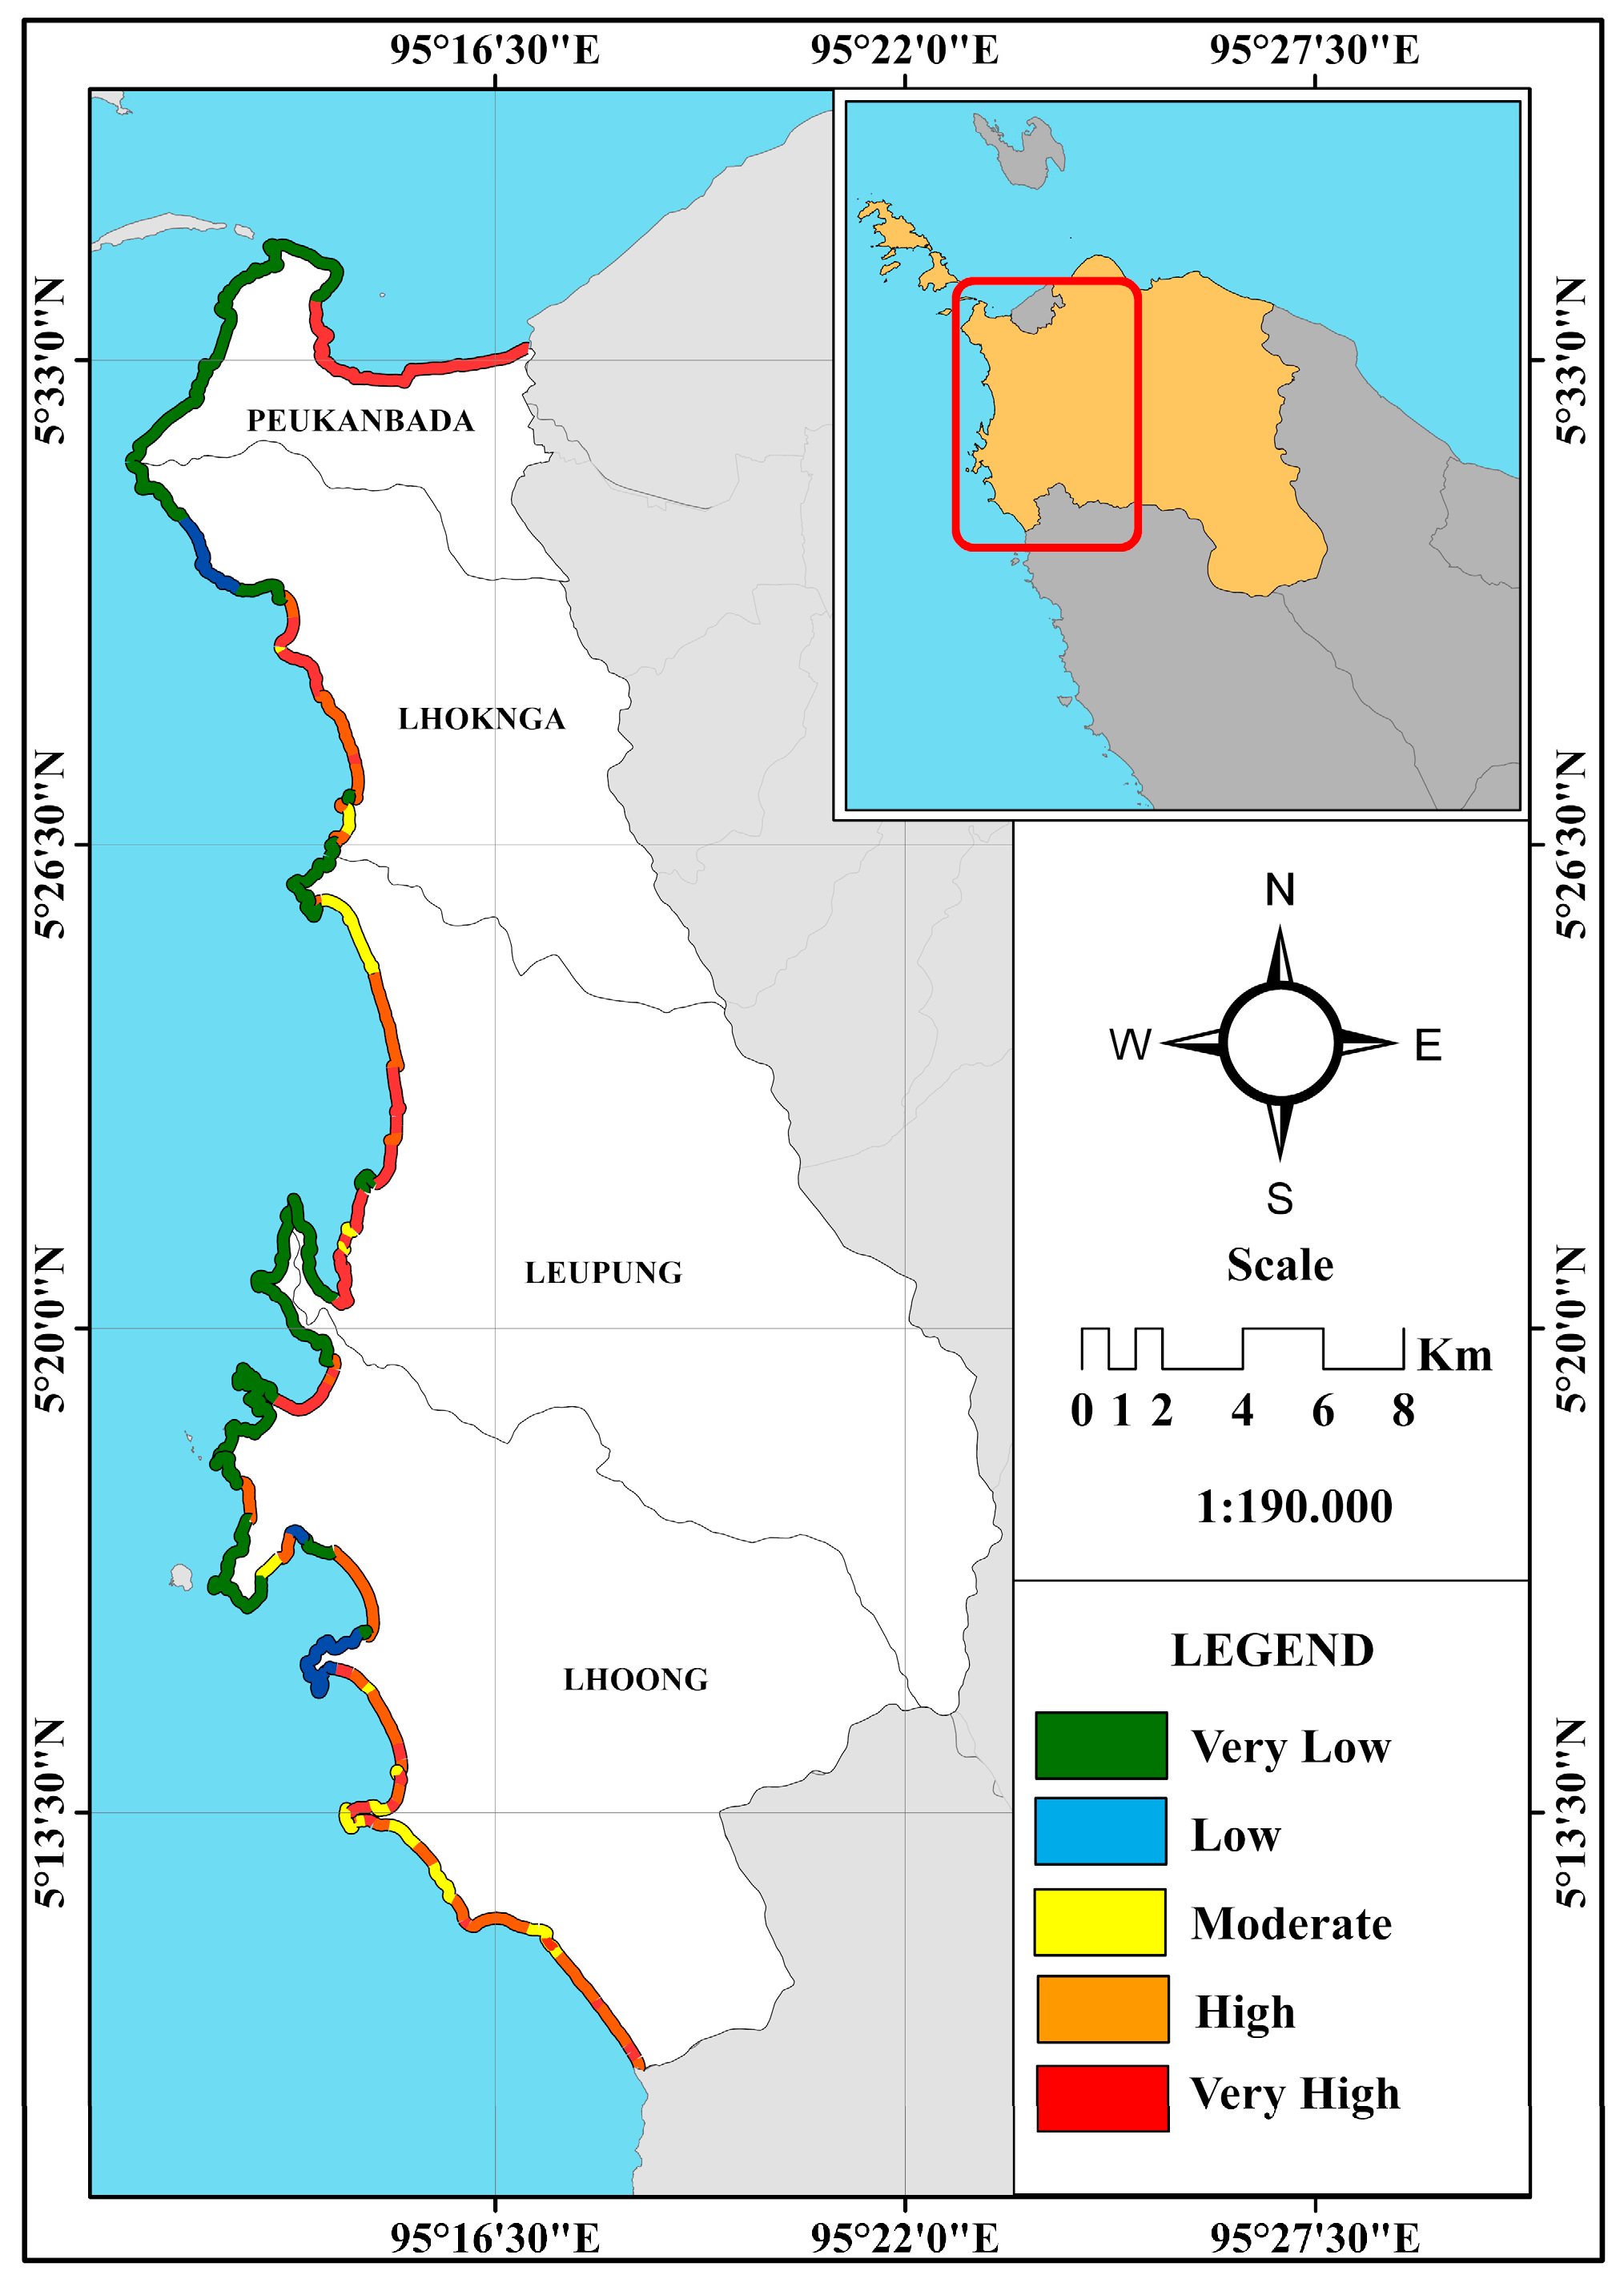
3.5. CVI of the West Coast of Aceh Besar—Overall Analysis

The results of the vulnerability analysis of the west coast of Aceh Besar can be seen in Figure 9 and Table 8. The results show that 19.2 km (20.60%) of the west coast of Aceh Besar has very high vulnerability, 21.6 km (23.18%) has high vulnerability, 8.2 km (8.80%) has medium vulnerability, 6 km (6.44%) has low vulnerability, and 38.2 km (40.99%) has very low vulnerability.
All four sub-districts have a very high level of vulnerability, with 7.94% of Peukanbada sub-district being very high vulnerability, followed by 6.22% of Leupung sub-district, 4.94% of Lhoong sub-district, and 1.50% of Lhoknga sub-district. The sub-districts that have very low vulnerability are Lhoong (19.10%), Peukanbada (11.15%), Leupung (6.01%), and Lhoknga (4.72%). Geomorphologically, areas with very high vulnerability generally have sandy beaches with a gentle coastal slope. Meanwhile, the geomorphology of areas with very low levels of vulnerability tends to include high elevations and cliffs.

4. Conclusions

Based on the results of the morphological characteristics assessment, using geomorphological parameters, coastal elevation, coastal slope and shoreline changes, we can conclude that ~54% of the west coast of Aceh Besar is in a state of moderate to very high vulnerability. The results of this study indicate that ~19.2 km (20.60%) of the west coast of Aceh Besar is very highly vulnerable, ~21.6 km (23.18%) is highly vulnerable, ~8.2 km (8.80%) is moderately vulnerable, ~6 km (6.44%) displays low vulnerability, and ~38.2 km (40.99%) displays very low vulnerability. The map of the results of the overall coastal vulnerability index (CVI) shows that all sub-districts on the west coast of Aceh Besar are generally very high and high vulnerability because, geomorphologically, the area is a sandy coastal area that has a significantly low elevation and a gentle coastal slope. Meanwhile, areas whose geomorphology comprises cliffs and high elevations have very low vulnerability.

Author Contributions

Conceptualization, M.I.; methodology, H.A.H.; software, Y.I. and M.R.; validation, A.M.S.; formal analysis, M.I., H.A.H. and M.R.; investigation, M.I., H.A.H., I.S., A.D. and A.M.S.; resources, Y.I.; data curation, A.M.S.; writing—original draft preparation, M.I.; writing—review and editing, I.R. and A.D.; visualization, I.S.; supervision, M.I.; project administration, M.I. and A.D.; funding acquisition, M.I. All authors have read and agreed to the published version of the manuscript.

Funding

This research received no external funding.

Institutional Review Board Statement

Not applicable.

Informed Consent Statement

Not applicable.

Data Availability Statement

All data generated or analyzed during this study are included in this published article.

Acknowledgments

The authors gratefully acknowledge Pusat Penelitian dan Pengabdian Kepada Masyarakat (LPPM) universitas Syiah Kuala for their financial support. The authors also thank their colleagues Erdiwansyah, Edy Miswar and Ali Afwanudin for their continued support and valuable discussions with regard to the results of the study.

Conflicts of Interest

The authors declare no conflict of interest.

References

  1. Muchlisin, Z.A. Morphometric variations of rasbora group (pisces: cyprinidae) in Lake Laut Tawar, Aceh Province, Indonesia, based on truss character analysis. Hayati J. Biosci. 2013, 20, 138–143. [Google Scholar] [CrossRef] [Green Version]
  2. Kennish, M.J. Coastal salt marsh systems in the US: A review of anthropogenic impacts. J. Coast. Res. 2001, 17, 731–748. [Google Scholar]
  3. Davidson, K.; Gowen, R.J.; Harrison, P.J.; Fleming, L.E.; Hoagland, P.; Moschonas, G. Anthropogenic nutrients and harmful algae in coastal waters. J. Environ. Manag. 2014, 146, 206–216. [Google Scholar] [CrossRef] [PubMed] [Green Version]
  4. Rukin. Economic Development of Coastal Village Communities. J. Sos. Hum. 2020, 11, 1–14. [Google Scholar]
  5. Dias, J.A.; Cearreta, A.; Isla, F.I.; de Mahiques, M.M. Anthropogenic impacts on Iberoamerican coastal areas: Historical processes, present challenges, and consequences for coastal zone management. Ocean Coast. Manag. 2013, 77, 80–88. [Google Scholar] [CrossRef]
  6. Ahmad, H. Bangladesh coastal zone management status and future trends. J. Coast. Zone Manag. 2019, 22, 1–7. [Google Scholar]
  7. Addo, K.A. Assessing Coastal Vulnerability Index to Climate Change: The Case of Accra–Ghana. J. Coast. Res. 2013, 165, 1892–1897. [Google Scholar] [CrossRef]
  8. Sanchez-Cabeza, J.-A.; Druffel, E.R.M. Environmental records of anthropogenic impacts on coastal ecosystems: An introduction. Mar. Pollut. Bull. 2009, 59, 87–90. [Google Scholar] [CrossRef] [PubMed] [Green Version]
  9. Bukvic, A.; Rohat, G.; Apotsos, A.; de Sherbinin, A. A systematic review of coastal vulnerability mapping. Sustainability 2020, 12, 2822. [Google Scholar] [CrossRef] [Green Version]
  10. Armenio, E.; Mossa, M.; Petrillo, A.F. Coastal vulnerability analysis to support strategies for tackling COVID-19 infection. Ocean Coast. Manag. 2021, 211, 105731. [Google Scholar] [CrossRef]
  11. Umitsu, M.; Tanavud, C.; Patanakanog, B. Effects of landforms on tsunami flow in the plains of Banda Aceh, Indonesia, and Nam Khem, Thailand. Mar. Geol. 2007, 242, 141–153. [Google Scholar] [CrossRef]
  12. Cochard, R.; Ranamukhaarachchi, S.L.; Shivakoti, G.P.; Shipin, O.V.; Edwards, P.J.; Seeland, K.T. The 2004 tsunami in Aceh and Southern Thailand: A review on coastal ecosystems, wave hazards and vulnerability. Perspect. Plant Ecol. Evol. Syst. 2008, 10, 3–40. [Google Scholar] [CrossRef]
  13. Syamsidik; Tursina; Suppasri, A.; Al’Ala, M.; Luthfi, M.; Comfort, L.K. Assessing the tsunami mitigation effectiveness of the planned Banda Aceh Outer Ring Road (BORR), Indonesia. Nat. Hazards Earth Syst. Sci. 2019, 19, 299–312. [Google Scholar] [CrossRef] [Green Version]
  14. Mahendra, R.S.; Mohanty, P.C.; Srinivasa Kumar, T.; Shenoi, S.S.C.; Nayak, S.R. Coastal Multi-hazard vulnerability mapping: A case study along the coast of Nellore District, East Coast of India. Ital. J. Remote Sens. 2010, 42, 67–76. [Google Scholar] [CrossRef]
  15. Masselink, G.; Russell, P.; Rennie, A.; Brooks, S.; Spencer, T. Impacts of climate change on coastal geomorphology and coastal erosion relevant to the coastal and marine environment around the UK. MCCIP Sci. Rev. 2020, 2020, 158–189. [Google Scholar]
  16. Kongeswaran, T.; Karikalan, R. A Study on the Evolution of Coastal Geomorphology between Rameshwaram and Kilakkarai, East Coast of India; NISCAIR-CSIR: New Delhi, India, 2021. [Google Scholar]
  17. Joesidawati, M.I. Penilaian Kerentanan Pantai Di Wilayah Pesisir Kabupaten Tuban Terhadap Ancaman Kerusakan. J. Kelaut. Indones. J. Mar. Sci. Technol. 2016, 9, 188. [Google Scholar] [CrossRef] [Green Version]
  18. Pramanik, M.K.; Biswas, S.S.; Mondal, B.; Pal, R. Coastal vulnerability assessment of the predicted sea level rise in the coastal zone of Krishna–Godavari delta region, Andhra Pradesh, east coast of India. Environ. Dev. Sustain. 2016, 18, 1635–1655. [Google Scholar] [CrossRef]
  19. Pikelj, K.; Juračić, M. Eastern Adriatic Coast (EAC): Geomorphology and coastal vulnerability of a karstic coast. J. Coast. Res. 2013, 29, 944–957. [Google Scholar] [CrossRef]
  20. Pantusa, D.; D’Alessandro, F.; Riefolo, L.; Principato, F.; Tomasicchio, G.R. Application of a coastal vulnerability index. A case study along the Apulian Coastline, Italy. Water 2018, 10, 1218. [Google Scholar] [CrossRef] [Green Version]
  21. Kantamaneni, K.; Phillips, M.; Thomas, T.; Jenkins, R. Assessing coastal vulnerability: Development of a combined physical and economic index. Ocean Coast. Manag. 2018, 158, 164–175. [Google Scholar] [CrossRef]
  22. Hastuti, A.W. Analisis Kerentanan Pesisir Terhadap Ancaman Kenaikan Muka Laut di Selatan Yogyakarta. 2012. Available online: https://repository.ipb.ac.id/handle/123456789/61027 (accessed on 25 July 2021).
  23. Biantara, B.; Hartoko, A.; Purwanti, F. Analisa Kerentanan Pantai Dan Sumberdaya Perikanan Dengan Pendekatan Sig Di Pantai Kabupaten Purworejo. Diponegoro J. Maquares Manag. Aquat. Resour. 2016, 5, 1–10. [Google Scholar]
  24. Yanti, V.; Mailianda, E.; Syamsidik, S. Analisis Pengaruh Parameter Fisik Terhadap Indeks Kerentanan Pantai (Cvi) di Kawasan Pantai Banda Aceh Dan Sekitarnya (Studi Kasus Pada Kawasan Ujung Pancu Sampai Ujung Batee). J. Arsip Rekayasa Sipil Perenc. 2019, 2, 123–133. [Google Scholar] [CrossRef]
  25. Zouhrawaty, A.; Eldina, A.; Syamsidik, F.; Gunawan, S. Kajian kerentanan zona pantai kota Banda Aceh terhadap bencana badai. In Proceedings of the Prosiding Seminar Hasil Penelitian Kebencanaan TDMRC-UNSYIAH, Banda Aceh, Indonesia, 13–19 April 2011. [Google Scholar]
  26. Anfuso, G.; Postacchini, M.; Di Luccio, D.; Benassai, G. Coastal Sensitivity/Vulnerability Characterization and Adaptation Strategies: A Review. J. Mar. Sci. Eng. 2021, 9, 72. [Google Scholar] [CrossRef]
  27. Sakka, P.E.R. Vulnerability Analysis Based on the Coastal Vulnerability Index (CVI) in Makassar City Coast. J. Ilmu Kelaut. Perikan. 2014, 24, 49–53. [Google Scholar]
  28. Ružić, I.; Dugonjić Jovančević, S.; Benac, Č.; Krvavica, N. Assessment of the Coastal Vulnerability Index in an area of complex geological conditions on the Krk Island, Northeast Adriatic Sea. Geosciences 2019, 9, 219. [Google Scholar] [CrossRef] [Green Version]
  29. Koroglu, A.; Ranasinghe, R.; Jiménez, J.A.; Dastgheib, A. Comparison of Coastal Vulnerability Index applications for Barcelona Province. Ocean Coast. Manag. 2019, 178, 104799. [Google Scholar] [CrossRef]
  30. Priya Rajan, S.M.; Nellayaputhenpeedika, M.; Tiwari, S.P.; Vengadasalam, R. Mapping and analysis of the physical vulnerability of coastal Tamil Nadu. Hum. Ecol. Risk Assess. 2020, 26, 1879–1895. [Google Scholar] [CrossRef]
  31. Kantamaneni, K.; Sudha Rani, N.N.V.; Rice, L.; Sur, K.; Thayaparan, M.; Kulatunga, U.; Rege, R.; Yenneti, K.; Campos, L.C. A systematic review of coastal vulnerability assessment studies along Andhra Pradesh, India: A critical evaluation of data gathering, risk levels and mitigation strategies. Water 2019, 11, 393. [Google Scholar] [CrossRef] [Green Version]
  32. Barua, P.; Rahman, S.H. Community-based rehabilitation attempt for solution of climate displacement crisis in the coastal area of Bangladesh. Int. J. Migr. Resid. Mobil. 2018, 1, 358–378. [Google Scholar] [CrossRef]
  33. Hao, H.; Eulie, D.; Weide, A. An Integrative Approach to Assessing Property Owner Perceptions and Modeled Risk to Coastal Hazards. ISPRS Int. J. Geo-Inf. 2020, 9, 275. [Google Scholar] [CrossRef] [Green Version]
  34. Sandhyavitri, A.; Fatnanta, F.; Ramadhan Husaini, R.; Suprayogi, I. Combination of a Coastal Vulnerability Index (CVI) and social economic approaches in prioritizing the development of Riau Coastlines, Indonesia. MATEC Web Conf. 2019, 276, 02006. [Google Scholar] [CrossRef] [Green Version]
  35. Isdianto, A.; Citrosiswoyo, W.; Sambodho, K. Zonasi Wilayah Pesisir Akibat Kenaikan Muka Air Laut. J. Permukim. 2014, 9, 148–157. [Google Scholar]
  36. Alfiani, V. Analisis Tingkat Kerentanan Wilayah Pesisir Terhadap Bencana Banjir di Kota Pasuruan, Jawa Timur. Ph.D. Thesis, UIN Sunan Ampel Surabaya, Surabaya, Indonesia, 2019. [Google Scholar]
  37. Kumar, T.S.; Mahendra, R.S.; Nayak, S.; Radhakrishnan, K.; Sahu, K.C. Coastal vulnerability assessment for Orissa State, East Coast of India. J. Coast. Res. 2010, 26, 523–534. [Google Scholar] [CrossRef]
  38. Rahadiati, A.; Yuliana, E.; Hafsaridewi, R.; Khairuddin, B.; Citra Kusuma, L.P.A.S.; Angin, R.P.; Adimu, H.E.; Ninef, J.S.R.; Galib, M.; Adibrata, S. Model Spasial Temporal Dampak Kenaikan Muka Air Laut Terhadap Permukiman Penduduk Di Pulau Kecil (Kasus: Pulau Karimunjawa dan Pulau Kemujan, Kabupaten Jepara). J. Mat. Sains Teknol. 2018, 19, 138–151. [Google Scholar] [CrossRef]
  39. Hamuna, B.; Sari, A.N.; Alianto, A. Kajian Kerentanan Wilayah Pesisir Ditinjau dari Geomorfologi dan Elevasi Pesisir Kota dan Kabupaten Jayapura, Provinsi Papua. J. Wil. Lingkung. 2018, 6, 1. [Google Scholar] [CrossRef] [Green Version]
  40. Ilmu, D.; Teknologi, D.A.N.; Perikanan, F.; Ilmu, D.A.N. Analisis Kerentanan Pesisir Terhadap Ancaman Kenaikan Muka Laut di Selatan Yogyakarta Amandangi Wahyuning Hastuti Skripsi. 2012. Available online: https://adoc.pub/analisis-kerentanan-pesisir-terhadap-ancaman-kenaikan-muka-l.html (accessed on 25 July 2021).
  41. Angus, S.; Hansom, J.D. Enhancing the resilience of high-vulnerability, low-elevation coastal zones. Ocean Coast. Manag. 2021, 200, 105414. [Google Scholar] [CrossRef]
  42. Chakraborty, D.; Saha, P. Vulnerability assessment for Sagar Island coast, West Bengal with respect to inundation hazards. NISCAIR Online Period. Repos. 2020, 49, 1521–1527. [Google Scholar]
  43. Handartoputra, A.; Purwanti, F.; Hendrarto, B. Penilaian Kerentanan Pantai di Sendang Biru Kabupaten Malang terhadap Variabel Oceanografi berdasarkan Metode CVI (Coastal Vulnerability Index). J. Manag. Aquat. Resour. 2015, 4, 91–97. [Google Scholar]
  44. Gad, F.-K.; Chatzinaki, M.; Vandarakis, D.; Kyriakidou, C.; Kapsimalis, V. Assessment of Wave Storm-Induced Flood Vulnerability in Rhodes Island, Greece. Water 2020, 12, 2978. [Google Scholar] [CrossRef]
  45. Di Risio, M.; Bruschi, A.; Lisi, I.; Pesarino, V.; Pasquali, D. Comparative analysis of coastal flooding vulnerability and hazard assessment at national scale. J. Mar. Sci. Eng. 2017, 5, 51. [Google Scholar] [CrossRef] [Green Version]
  46. Irham, M.; Setiawan, I. The numerical model of the sediment distribution pattern at Lampulo National fisheries port. In Proceedings of the IOP Conference Series: Earth and Environmental Science; IOP Publishing: Jakarta, Indonesia, 2018; Volume 106, p. 12067. [Google Scholar]
  47. Irham, M.; Setiawan, I. The study of flow resulting from wave on Lhonga beach, Aceh Besar. Omni-Akuatika 2017, 13, 13. [Google Scholar] [CrossRef]
  48. Di, L.; Sayung, K.; Demak, K. Studi Perubahan Garis Pantai Akibat Kenaikan Muka Air Laut Di Kecamatan Sayung, Kabupaten Demak. J. Oceanogr. 2017, 6, 281–287. [Google Scholar]
  49. Halim; Halili; Afu, L.O.A. Studi Perubahan Garis Pantai Dengan Pendekatan. Sapa Laut 2016, 1, 24–31. [Google Scholar]
Figure 1. Map of research location in western part of Aceh Besar, district of Aceh, Sumatra, Indonesia.
Jmse 09 00815 g001
Figure 2. Geomorphology of west Aceh Besar district.
Jmse 09 00815 g002
Figure 3. The level of coastal vulnerability based on coastal geomorphology on the west coast of Aceh Besar district.
Jmse 09 00815 g003
Figure 4. Level of elevation vulnerability based on DEMNAS.
Jmse 09 00815 g004
Figure 5. Level of vulnerability elevation resulting from the combination analysis between field data and DEMNAS data.
Jmse 09 00815 g005
Figure 6. Map of vulnerability level based on coastal slope.
Jmse 09 00815 g006
Figure 7. The level of coastal vulnerability due to changes in coastlines in the last five years (2015–2019).
Jmse 09 00815 g007
Figure 8. Graph of coastline changes along the west coast of Aceh Besar.
Jmse 09 00815 g008
Figure 9. Coastal vulnerability of the west Aceh Besar region.
Jmse 09 00815 g009
Table 1. Data acquisition for coastal vulnerability.
No.ParameterUsed DataData Sources
1GeomorphologyGeomorphology DataGoogle Earth
Field Measurement and AnalysisField Survey
BPN Aceh
https://www.atrbpn.go.id/ (accessed on 20 October 2020)
2ElevationField Measurement and AnalysisField Survey
BPN Aceh
https://www.atrbpn.go.id/ (accessed on 20 October 2020)
DEMNASGeospatial Information Agency http://tides.big.go.id/DEMNAS (accessed on 20 October 2020)
3Beach SlopeBATNASGeospatial Information Agency http://tides.big.go.id/DEMNAS/ (accessed on 20 October 2020)
4Shoreline ChangesLANDSAT 8 OLIEarth Explorer—USGS https://earthexplorer.usgs.gov (accessed on 20 October 2020)
Table 2. Vulnerability parameter classes. (Sources: [29,30,31]).
No.ParametersCategories
Very LowLowMediumHighVery High
12345
1GeomorphologyHigh cliffs, rocky beachesMedium cliffs, grooved beachLow cliffs, alluvial plainsPebble beach, estuary, lagoonBarrier beaches, sand beaches, salt marshes, mudflats, deltas,
mangroves, coral reefs
2Beach Elevation (m)≥30.1020.1–30.010.1–20.05.1–10.00.0–5.0
3Beach Slope (%)>1.201.20–0.910.90–0.610.60–0.30<0.30
4Shoreline Change (m)≥(2.1)1.0–2.0−1.0–1.0(−1)–(−2)<(−2.0)
AccretionAccretionStableErosionErosion
Table 3. Classification of vulnerability levels.
CVI ValueVulnerability LevelColor
0.00–2.50Very LowGreen
2.51–5.00LowBlue
5.10–7.50ModerateYellow
7.51–10.00HighOrange
10.10–12.50Very HighRed
Table 4. Percentage of coastal vulnerability in terms of coastal morphology.
Sub-DistrictGeomorphological VulnerabilityTotal
Very LowLowMediumHighVery High
Peukanbada11.16%0.0%0.0%0.0%7.94%19.10%
Lhoknga7.30%0.0%1.29%0.0%8.15%16.74%
Leupung6.01%0.0%0.0%0.0%12.3%18.24%
Lhoong22.53%0.0%0.64%0.43%22.32%45.92%
Total47.00%0.0%1.93%0.43%50.64%100.00%
Table 5. Percentage of coastal vulnerability in terms of coastal elevation.
Sub-DistrictElevation Vulnerability ScaleTotal
Very LowLowMediumHighVery High
Peukanbada11.16%0.0%0.0%0.0%7.94%19.10%
Lhoknga2.79%1.93%2.58%0.0%9.44%16.74%
Leupung1.29%4.72%0.0%0.0%12.23%18.24%
Lhoong5.36%14.81%4.08%0.0%21.67%45.92%
Total20.60%21.46%6.66%0.0%51.28%100.00%
Table 6. Percentage of coastal vulnerability in terms of coastal slope.
Sub-DistrictBeach Slope VulnerabilityTotal
Coverage
Very LowLowMediumHighVery High
Peukanbada8.58%2.58%0%0%7.94%19.10%
Lhoknga2.36%0%0.43%4.51%9.44%16.74%
Leupung0%0%1.29%4.72%12.23%18.24%
Lhoong0.21%0%5.58%18.67%21.46%45.92%
Total11.15%2.58%7.30%27.90%51.07%100.00%
Table 7. Percentage of coastal vulnerability in terms of coastline change.
Sub-DistrictShoreline Vulnerability ChangesTotal
Very LowLowMediumHighVery High
Peukanbada0%0%11.16%0.43%7.51%19.10%
Lhoknga0.21%2.36%12.02%2.15%0.00%16.74%
Leupung2.79%2.58%6.65%4.29%1.93%18.24%
Lhoong3.86%6.22%30.48%4.29%1.07%45.92%
Total6.86%11.16%60.31%11.16%10.51%100.00%
Table 8. West Aceh Besar coastal vulnerability index percentages.
Sub-DistrictCVITotal
Very LowLowMediumHighVery High
Peukanbada11.15%0%0%0%7.94%19.09%
Lhoknga4.72%2.58%0.86%7.08%1.50%16.74%
Leupung6.01%0%2.79%3.22%6.22%18.24%
Lhoong19.10%3.86%5.15%12.88%4.94%45.93%
Total40.98%6.44%8.80%23.18%20.60%100.00%
Publisher’s Note: MDPI stays neutral with regard to jurisdictional claims in published maps and institutional affiliations.

