Evaluation of Lebanon’s Offshore-Wind-Energy Potential
by
 , , and
Gabriel Ibarra-Berastegi
1,2,*,† ,
,
Alain Ulazia
3,†,
Jon Saénz
2,4,† and
Santos José González-Rojí
4,5,6,† 1
Department of NE and Fluid Mechanics, University of the Basque Country (UPV/EHU), Bilbao Engineering School, 48002 Bilbao, Spain
2
Plentzia Itsas Estazioa, PIE, University of the Basque Country (UPV/EHU), 48620 Plentzia, Spain
3
Department of NE and Fluid Mechanics, University of the Basque Country (UPV/EHU), Gipuzkoa Engineering School, 20600 Eibar, Spain
4
Department of Applied Physics II, University of the Basque Country (UPV/EHU), 48940 Leioa, Spain
5
Oeschger Centre for Climate Change Research, University of Bern, 3003 Bern, Switzerland
6
Climate and Environmental Physics, University of Bern, 3003 Bern, Switzerland
*
Author to whom correspondence should be addressed.
†
These authors contributed equally to this work.
J. Mar. Sci. Eng. 2019, 7(10), 361; https://doi.org/10.3390/jmse7100361
Submission received: 21 September 2019
/
Revised: 4 October 2019
/
Accepted: 5 October 2019
/
Published: 10 October 2019
(This article belongs to the Special Issue Offshore Wind Farms)
Abstract
:The only regional evaluation of Lebanese wind-energy potential (National Wind Atlas) dates back to 2011 and was carried out by a United Nations agency. In this work, data from the most recent reanalysis (ERA5) developed at the European Center for Medium Range Weather Forecast (ECMWF), corresponding to the 2010–2017 period, were used to evaluate Lebanese offshore-wind-energy potential. In the present study, wind power density associated to a SIEMENS 154/6 turbine was calculated with a horizontal resolution of 31 km and 1 hour time steps. This work incorporated the impact of air density changes into the calculations due to the seasonal evolution of pressure, temperature, and humidity. Observed average offshore air density was 1.19 for the 2010–2017 period, but if instead of , hourly values were used, seasonal oscillations of wind power density represented differences in percentage terms ranging from −4% in summer to +3% in winter. ERA5 provides hourly wind, temperature, pressure, and dew-point temperature values that allowed us to calculate the hourly evolution of air density during this period and could also be used to accurately evaluate wind power density off the Lebanese coast. There was a significant gradient in wind power density along the shore, with the northern coastal area exhibiting the highest potential and reaching winter values of around 400 . Finally, this study suggests that the initial results provided by the National Wind Atlas overestimated the true offshore-wind-energy potential, thus highlighting the suitability of ERA5 as an accurate tool for similar tasks globally.
1. Introduction
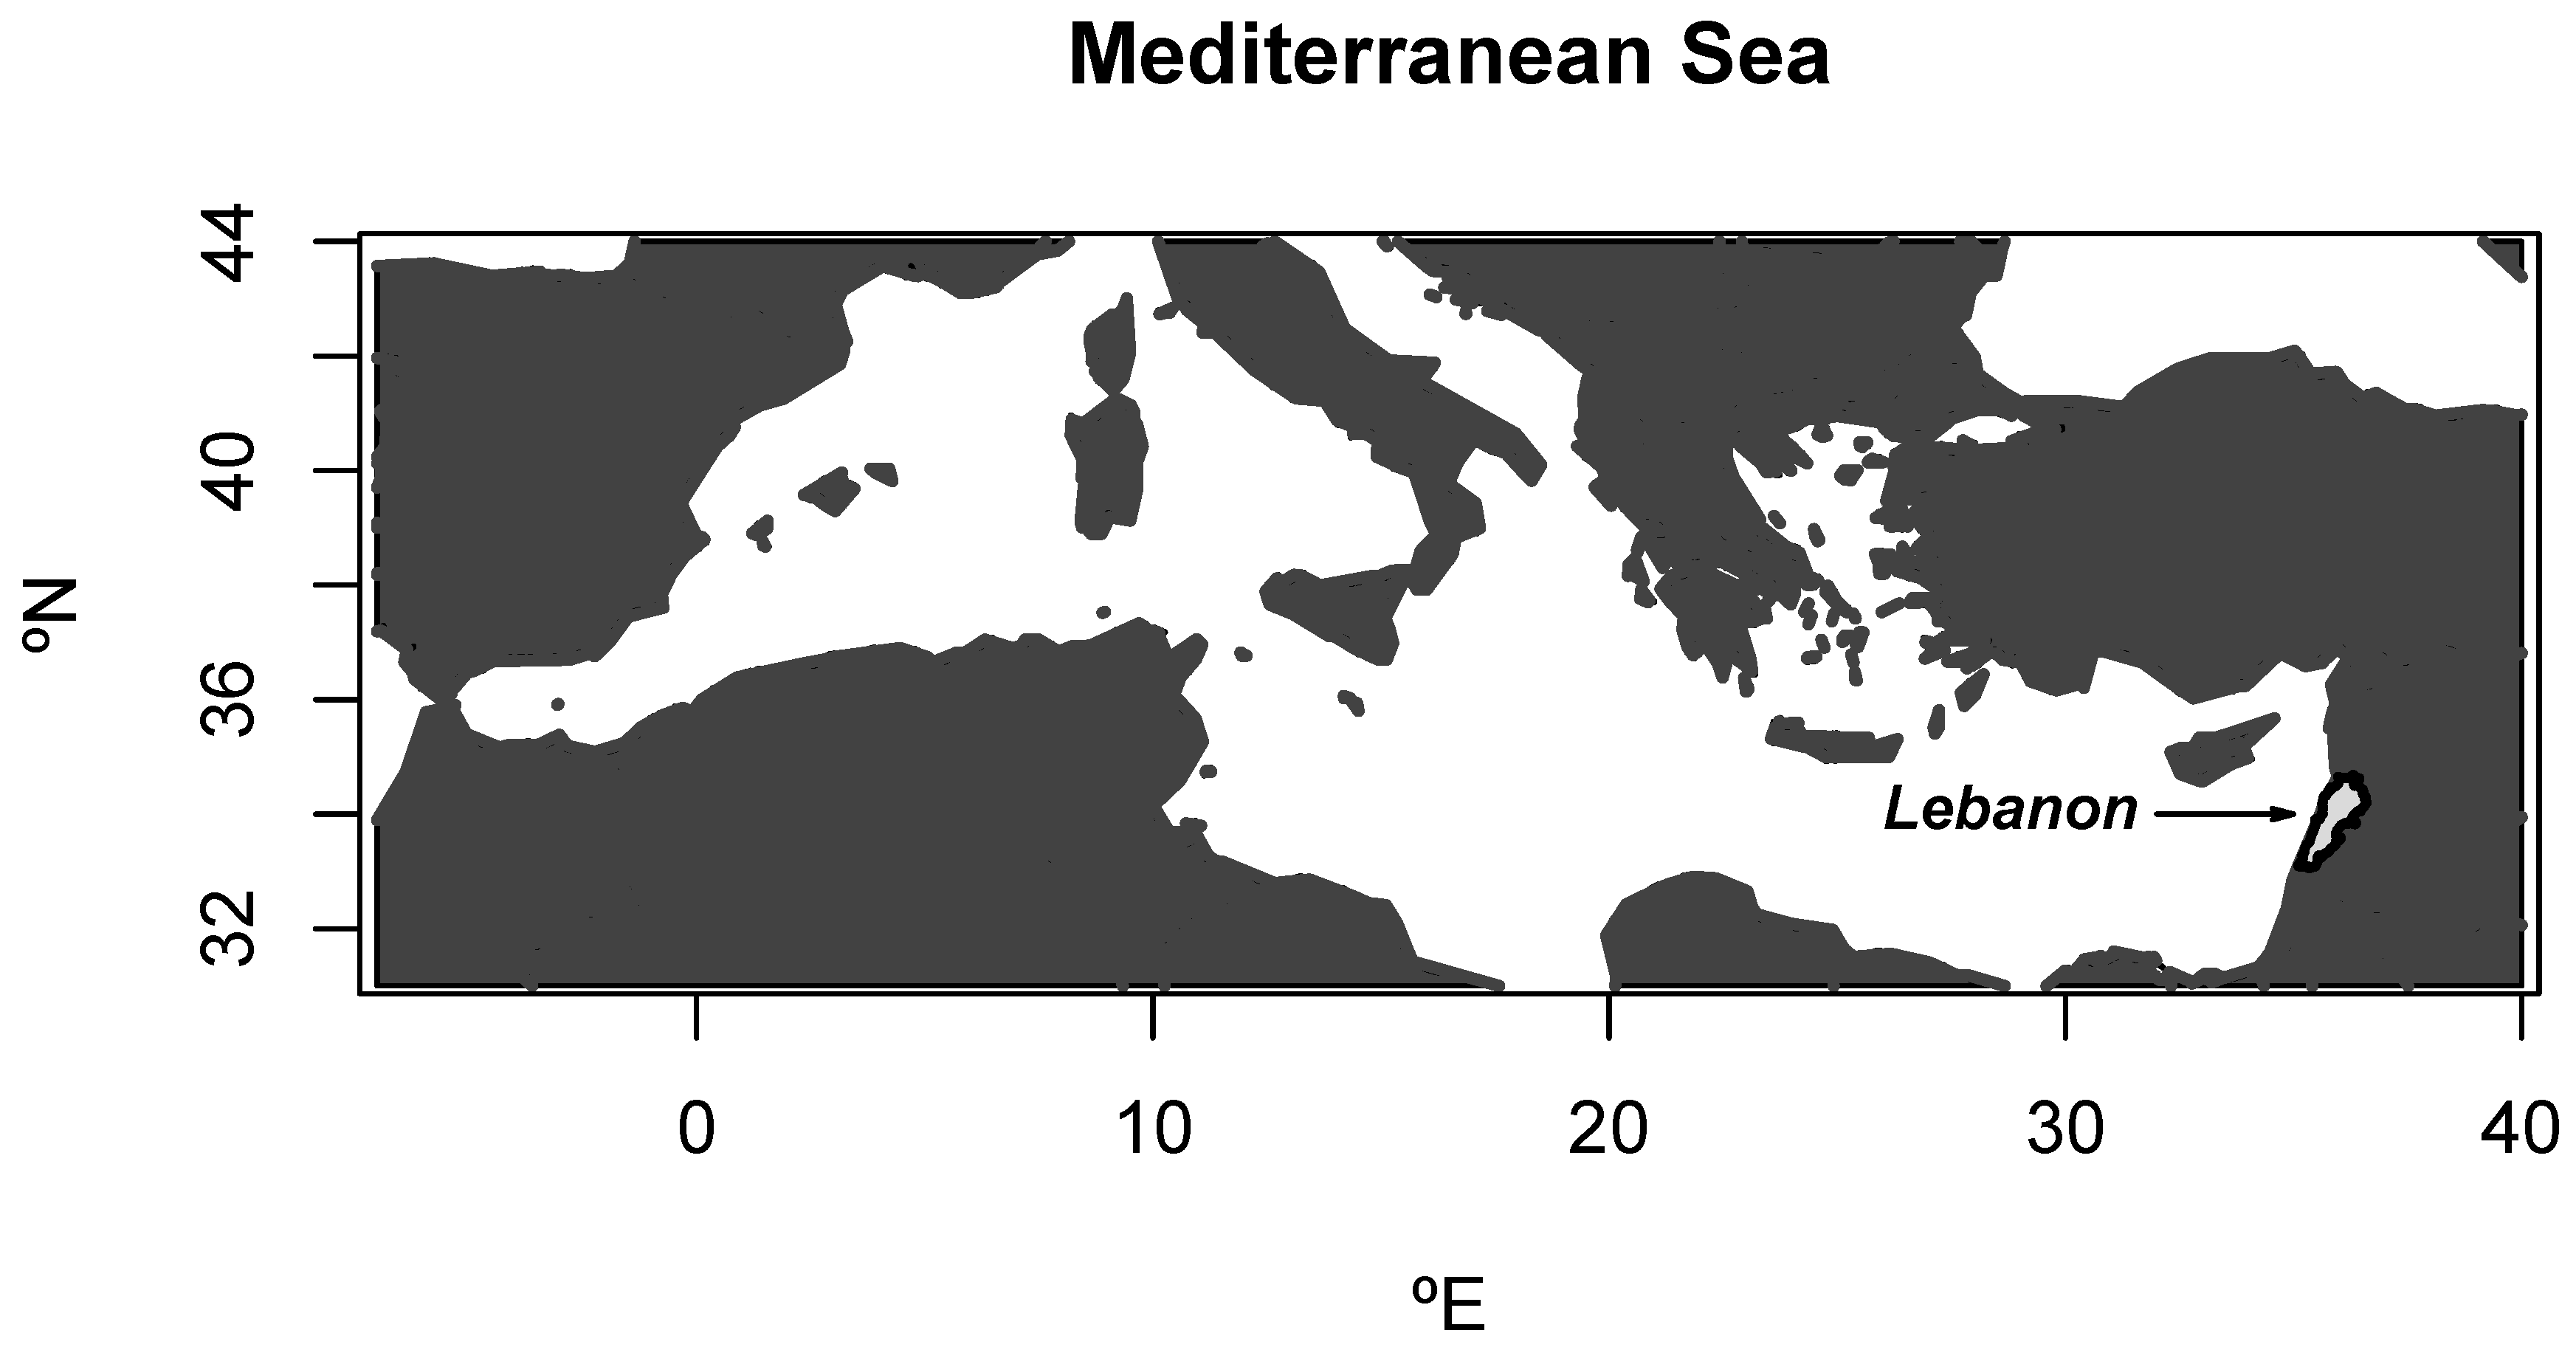
Lebanon is located in the eastern Mediterranean with a shoreline of approximately 210 km (Figure 1). Electricity generated in the country originates mostly from fossil sources that need to be imported. Following the 2020 objective for 12% of electricity from renewable sources in Lebanon [1], some studies have pointed out that electricity from renewable sources—solar and wind energy—needs to be incorporated into the electric mix [2,3,4,5].
Younes et al. [6] suggested that a decentralized policy for energy production could contribute to the economic feasibility of incorporating renewables into the Lebanese electric system. In the case of wind energy, a study indicated that offshore wind energy could be used to support or complement existing power plants [1], but to that purpose, accurate estimation of wind resources is needed. Inland wind-energy potential has been partially assessed using a limited number of sensors [7], but the most comprehensive study carried out so far on Lebanese wind-energy potential is the National Wind Atlas, prepared by the United Nations and made public in 2011 [8]. In the case of offshore wind energy, the National Wind Atlas provides estimations of wind power density () at a height of 80 m for the Lebanese coast. The methodology applied in Atlas involves the use of wind-sensor records and a numerical model. Specific details are extensively described in the original document [9].
The objective of this paper is to characterize Lebanese offshore-wind power potential using the most recent reanalysis, ERA5 [10], freely available through the Copernicus Climate Data Store [11]. ERA5 is becoming increasingly popular for wind-energy assessment studies [12,13]. As an indicator of wind-energy potential for the Lebanese coast, wind power density is used [14]. It was calculated at a height of 178 m corresponding to the hub of the SIEMENS 154/6 floating wind turbine model with a rated power of 6 MW. For comparison purposes with previous estimations gathered in the National Wind Atlas, offshore-wind power density at a height of 80 m was also calculated using ERA5 wind speed, humidity, pressure, and temperature data in order to obtain instantaneous (one-hourly) air density.
Air density is typically considered as constant during the year, with standard value being equal to 1.225 (at sea level, 1013 mb, 15 C) as reference for middle latitudes near the sea, or the annual mean air density for other latitudes and altitudes. The use of constant air density is usual for different wind-energy estimation methods, both at specific locations using anemometers [15,16,17], or over given geographical regions using mesoscale models, remote-sensing data, or reanalysis [18,19,20,21,22,23,24,25,26,27,28,29]. This is understandable since Weibull distribution is commonly fitted onto the wind-speed data of the location to be implemented on the turbine’s power curve. Only wind speed is used because the power curve is provided for constant air density. However, it was shown that deformation of the power curve due to air density changes in its zone is similar to deformation due to pitch misalignment [30] or due to the presence of defective anemometers on the turbine [31].
In recent publications [13,32,33], the authors developed a technique to seasonally estimate the influence of instantaneous air density changes on the capacity factor of a given turbine. Floors et al. [34] emphasized, like us, the importance of air density, and also used ERA5 to study its effects. In this sense, the main physical magnitude that synthesizes the influence of wind speed with air density is the wind power density, the main parameter used for map representation of offshore wind energy in this work for Lebanon.
2. Data and Methodology
2.1. Data
ERA5 meteorological hourly data corresponding to the period of 2010–2017 were downloaded from the Copernicus Climate Data Store [11]. ERA5 provides a spatial resolution of 0.3° (∼31 km) and geographical boundaries covering the Lebanon coastal area included 90 gridpoints with 10 positions in longitude [34.2° E, 36.9° E], and 9 positions in latitude [33° N, 35.4° N]. Since the focus of this study was the analysis of offshore wind energy, only the 30 sea gridpoints were selected for this study (Figure 2).
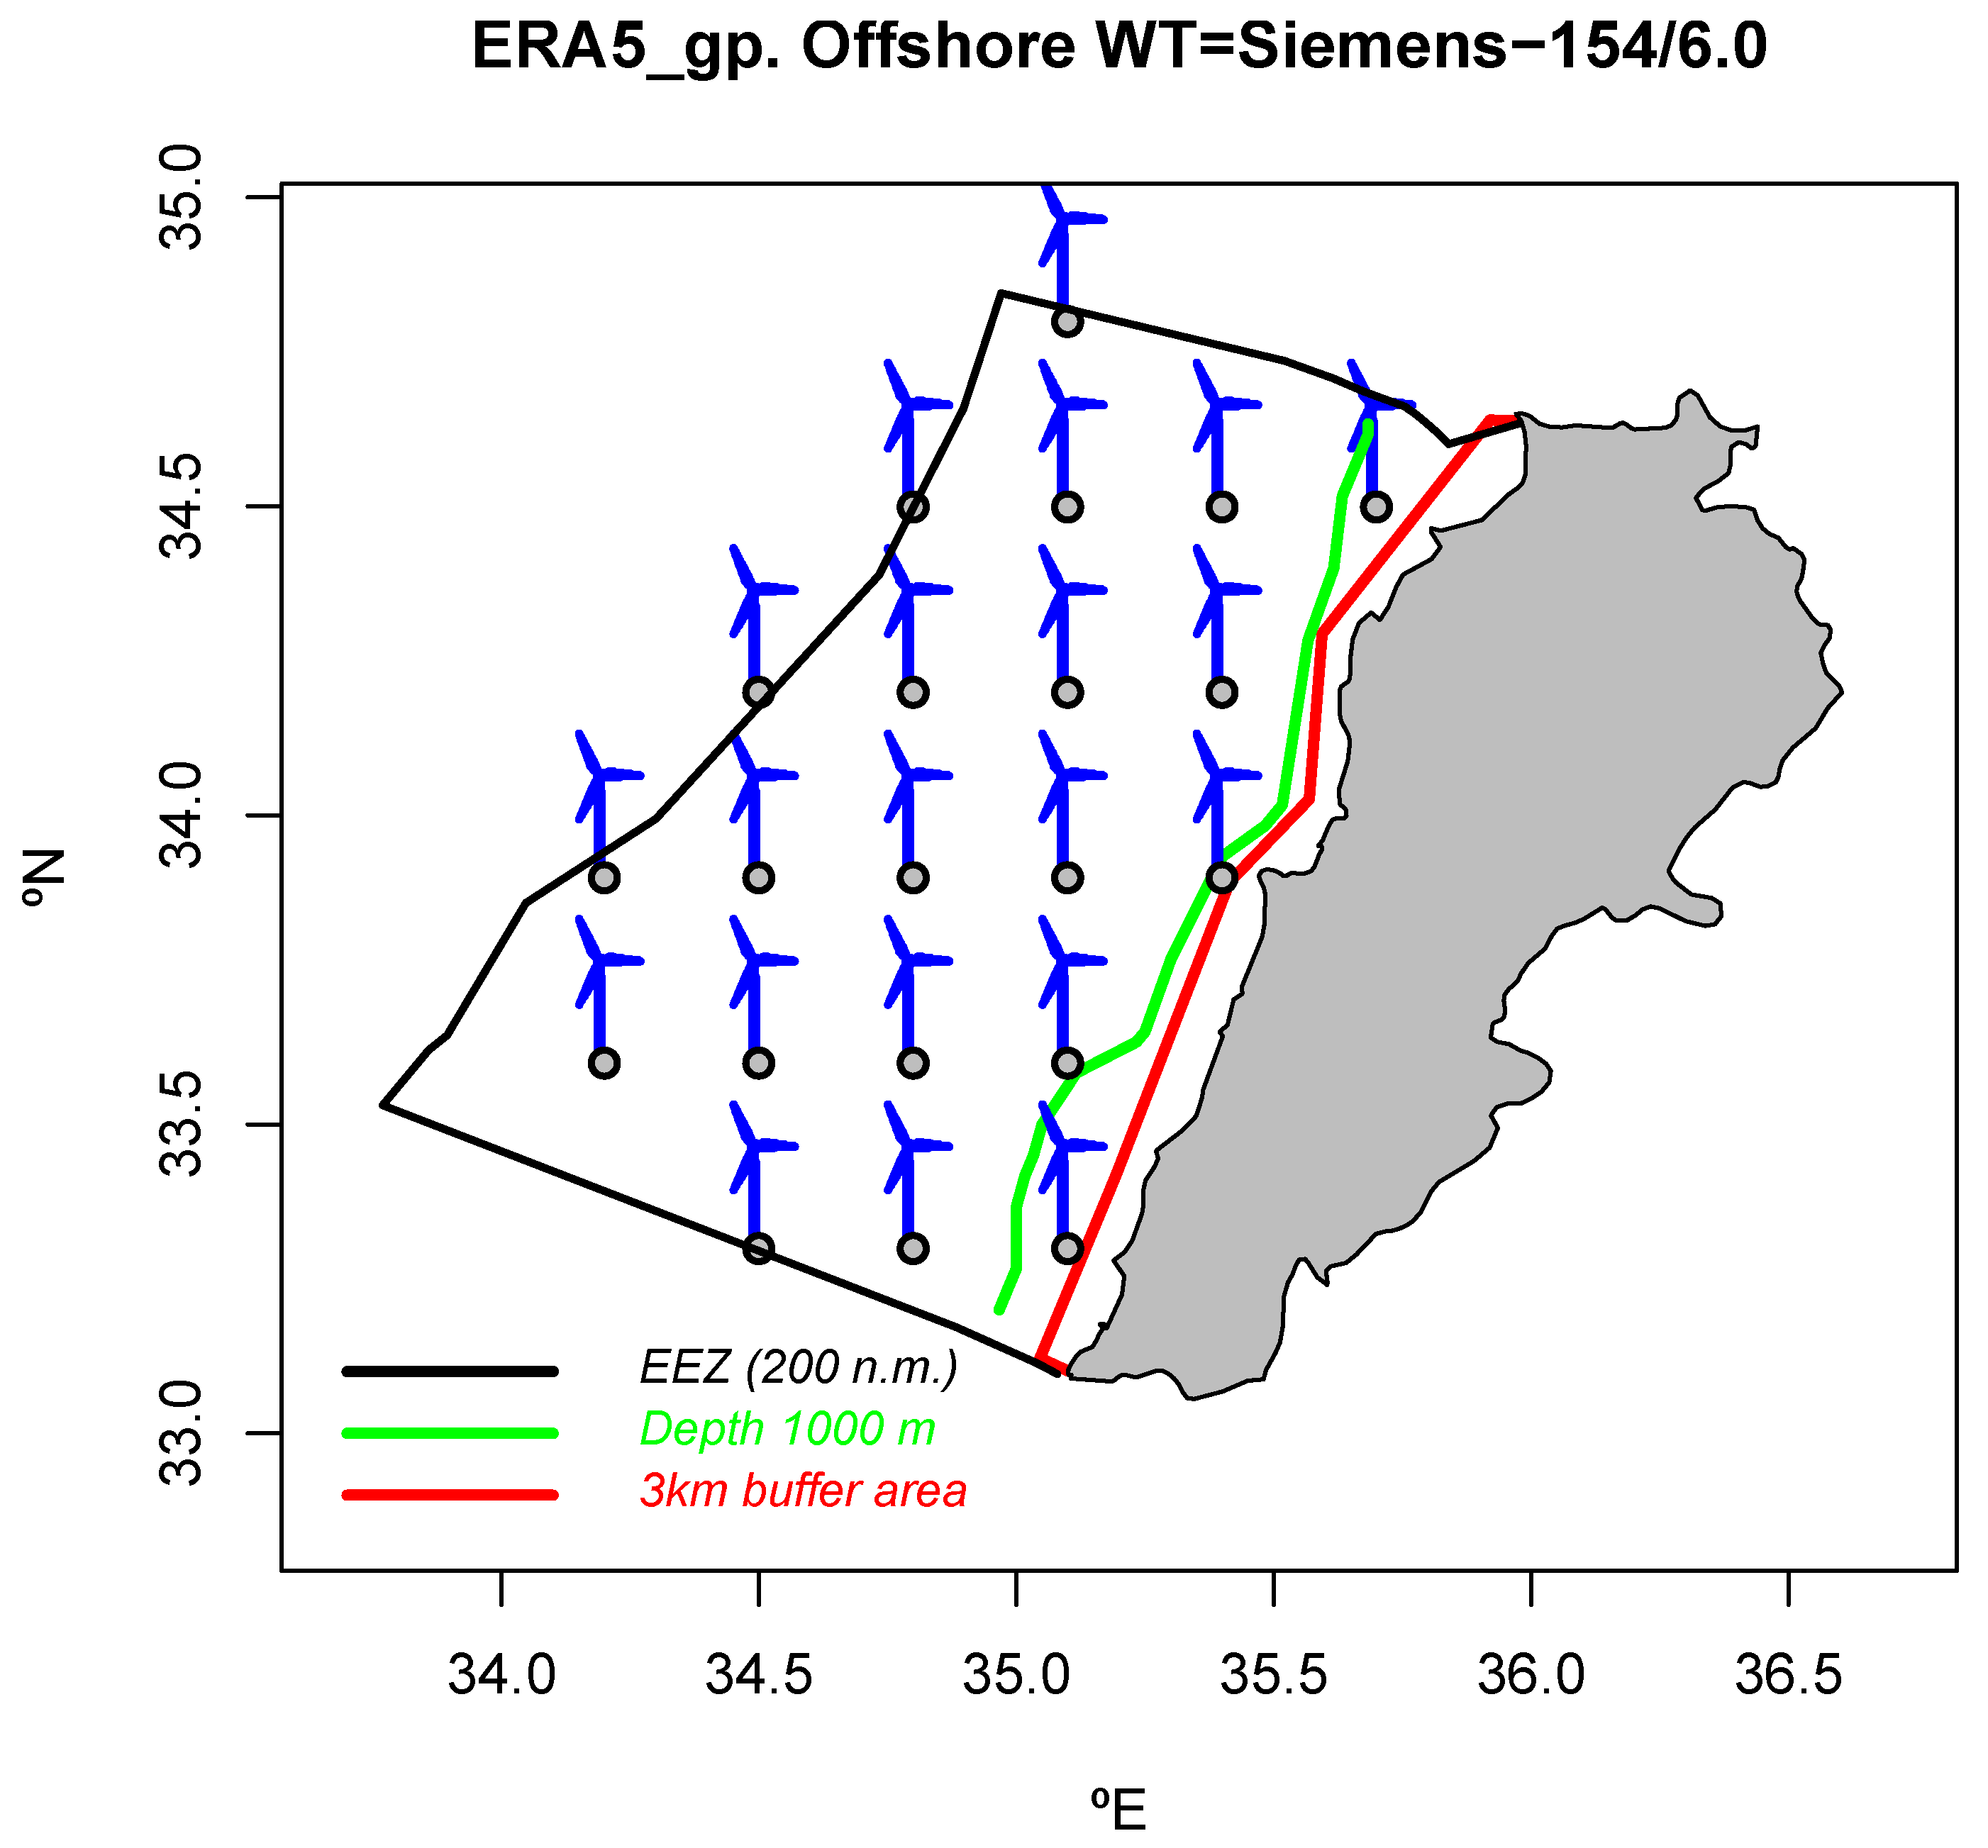
It is to be noted that for implementation of wind-energy facilities in Lebanese waters, there were some practical constraints that deserve a brief mention even though they fall beyond the scope of this study. The Lebanese exclusive economic zone (EEZ) extends 200 nautical miles from the coast and, according to Lebanese legislation, there is a buffer area of 3 km [8,9] in which economic activities like wind energy could not be allowed. It is also worthwhile to mention that water depth increases rapidly as we move from the coast into the sea, thus making floating wind turbines the best solution for any future wind farm. For this reason, hub height h of 178 m corresponding to the SIEMENS 154/6 floating wind-turbine model was chosen to estimate wind power density. However, the current maximum technological limits are 120 km of AC cable to the coast and a mooring limit of 1000 m depth [35]. These practical constraints are represented in Figure 3 where wind turbines represent the location of the ERA5 gripdoints falling within the current administrative boundaries. It is important to mention that some of these constraints, both legal and technical, may change or disappear in the future. For this reason, they have been ignored for this study, although they should be considered for detailed analysis of wind-farm design.
Although wind speed is a vectorial magnitude, for wind energy studies, wind speed values are customarily used. However, ERA5 provides the zonal (projections along the earth’s parallels) and meridional (projections along the earth’s meridians) of the wind speed vector (value+ incoming direction) and the wind speed value must be derived from these two components. The original ERA5 variables downloaded with the above-mentioned time and space resolution and that have been used for this study were:
- (i)
- Zonal wind speed () at a height of 10 m above sea level (masl)
- (ii)
- Meridional wind speed at 10 masl ()
- (iii)
- Zonal wind speed at 100 masl ()
- (iv)
- Meridional wind speed at 100 masl ()
- (v)
- Mean sea level pressure ()
- (vi)
- Surface temperature ()
- (vii)
- Dew point temperature ()
2.2. Methodology
First, at each gridpoint, the ERA5 zonal and meridional wind components were combined to calculate wind-speed values at 10 and 100 masl. Then, assuming a logarithmic law [13,14], surface roughness could first be estimated and then wind-speed values at heights h of 80 and 178 masl could be derived (Equation (1)).
wind power density () at hub height h of the chosen turbine provided an estimation of the energy that could be extracted from the wind (), and it was calculated according to Equation (2) [14].
Air density was not directly provided by ERA5 but could be calculated by combining information on air humidity, pressure, and temperature hourly values. These calculations could be made using the regular equations for atmospheric humidity studies [36,37].
The density of moist air can be computed by means of the expression corresponding to dry air if the virtual temperature is used instead of the real temperature in the equation of state of the dry air. Thus, the density of moist air is given by Equation (3), with pressure (Pa), the virtual temperature (K) and J K kg the constant corresponding to the mixture of gases which forms dry air.
The virtual temperature (K), with is defined by Equation (4), where is the ratio of the gas constants corresponding to dry air and water vapour J K kg.
These computations can be carried out on the basis of these approximations or instead of going through these equations and solving them, a more straightforward method is to use the R [38] package called [39]. This package has been developed by the authors [40] and already incorporate the above mentioned equations. To that purpose, the following three built-in functions were applied to ERA5 hourly data:
- TTdP2rh, to calculate relative humidity from a given temperature , dew point temperature , and pressure , all of them in SI units.
- rh2w, to calculate mixing ratio w from , pressure , and temperature . The mixing ratio is defined as the ratio of the mass of water vapour to the mass of dry air, and was returned as kg/kg.
- densityMoistAir, to calculate density of moist air in from , temperature , and mixing ratio w.
Although the influence of humidity on air density is known to be small and, in most cases, negligible [13,41,42,43], provides an exact and straightforward estimation of values, including the effect of humidity. That is the reason why its effects have been now incorporated into this study. The most specific details on implementation can be found in the literature [40].
After calculating hourly values, by combining Equations (1) and (2) at a height of h = 178 m, the hourly values of corresponding to the 2010–2017 period at the selected 30 gridpoints were obtained. From hourly values and with the aim of providing estimation of the variations along the year, seasonal averages corresponding to the 2010–2017 period were computed. Then, according to the following monthly distribution:
- Winter: December, January, February (DJF).
- Spring: March, April, May (MAM).
- Summer: June, July, August (JJA).
- Autumn: September, October, November (SON).
hourly values of corresponding to the 2000–2017 period have been used to calculate the four seasonal averages [, , and ]. To illustrate some results, the seasonal averages of air density and wind speed at 178 m height ( and ) were also computed from hourly values. Similarly, for comparison purposes with the previous National Wind Atlas [9], hourly values were calculated using Equations (1) and (2) with h = 80 m; finally, all hourly cases corresponding to 2010–2017 were averaged to obtain for the same gridpoints of the area.
3. Results
The values of depend both on air density and wind speed at a height of 178 m (Equation (2)). Regarding in the Lebanese offshore area, there did not exist a relevant spatial gradient, but maximum oscillations of seasonal between summer and winter of ±3% around the average value of = 1.19 could be observed (Figure 4).
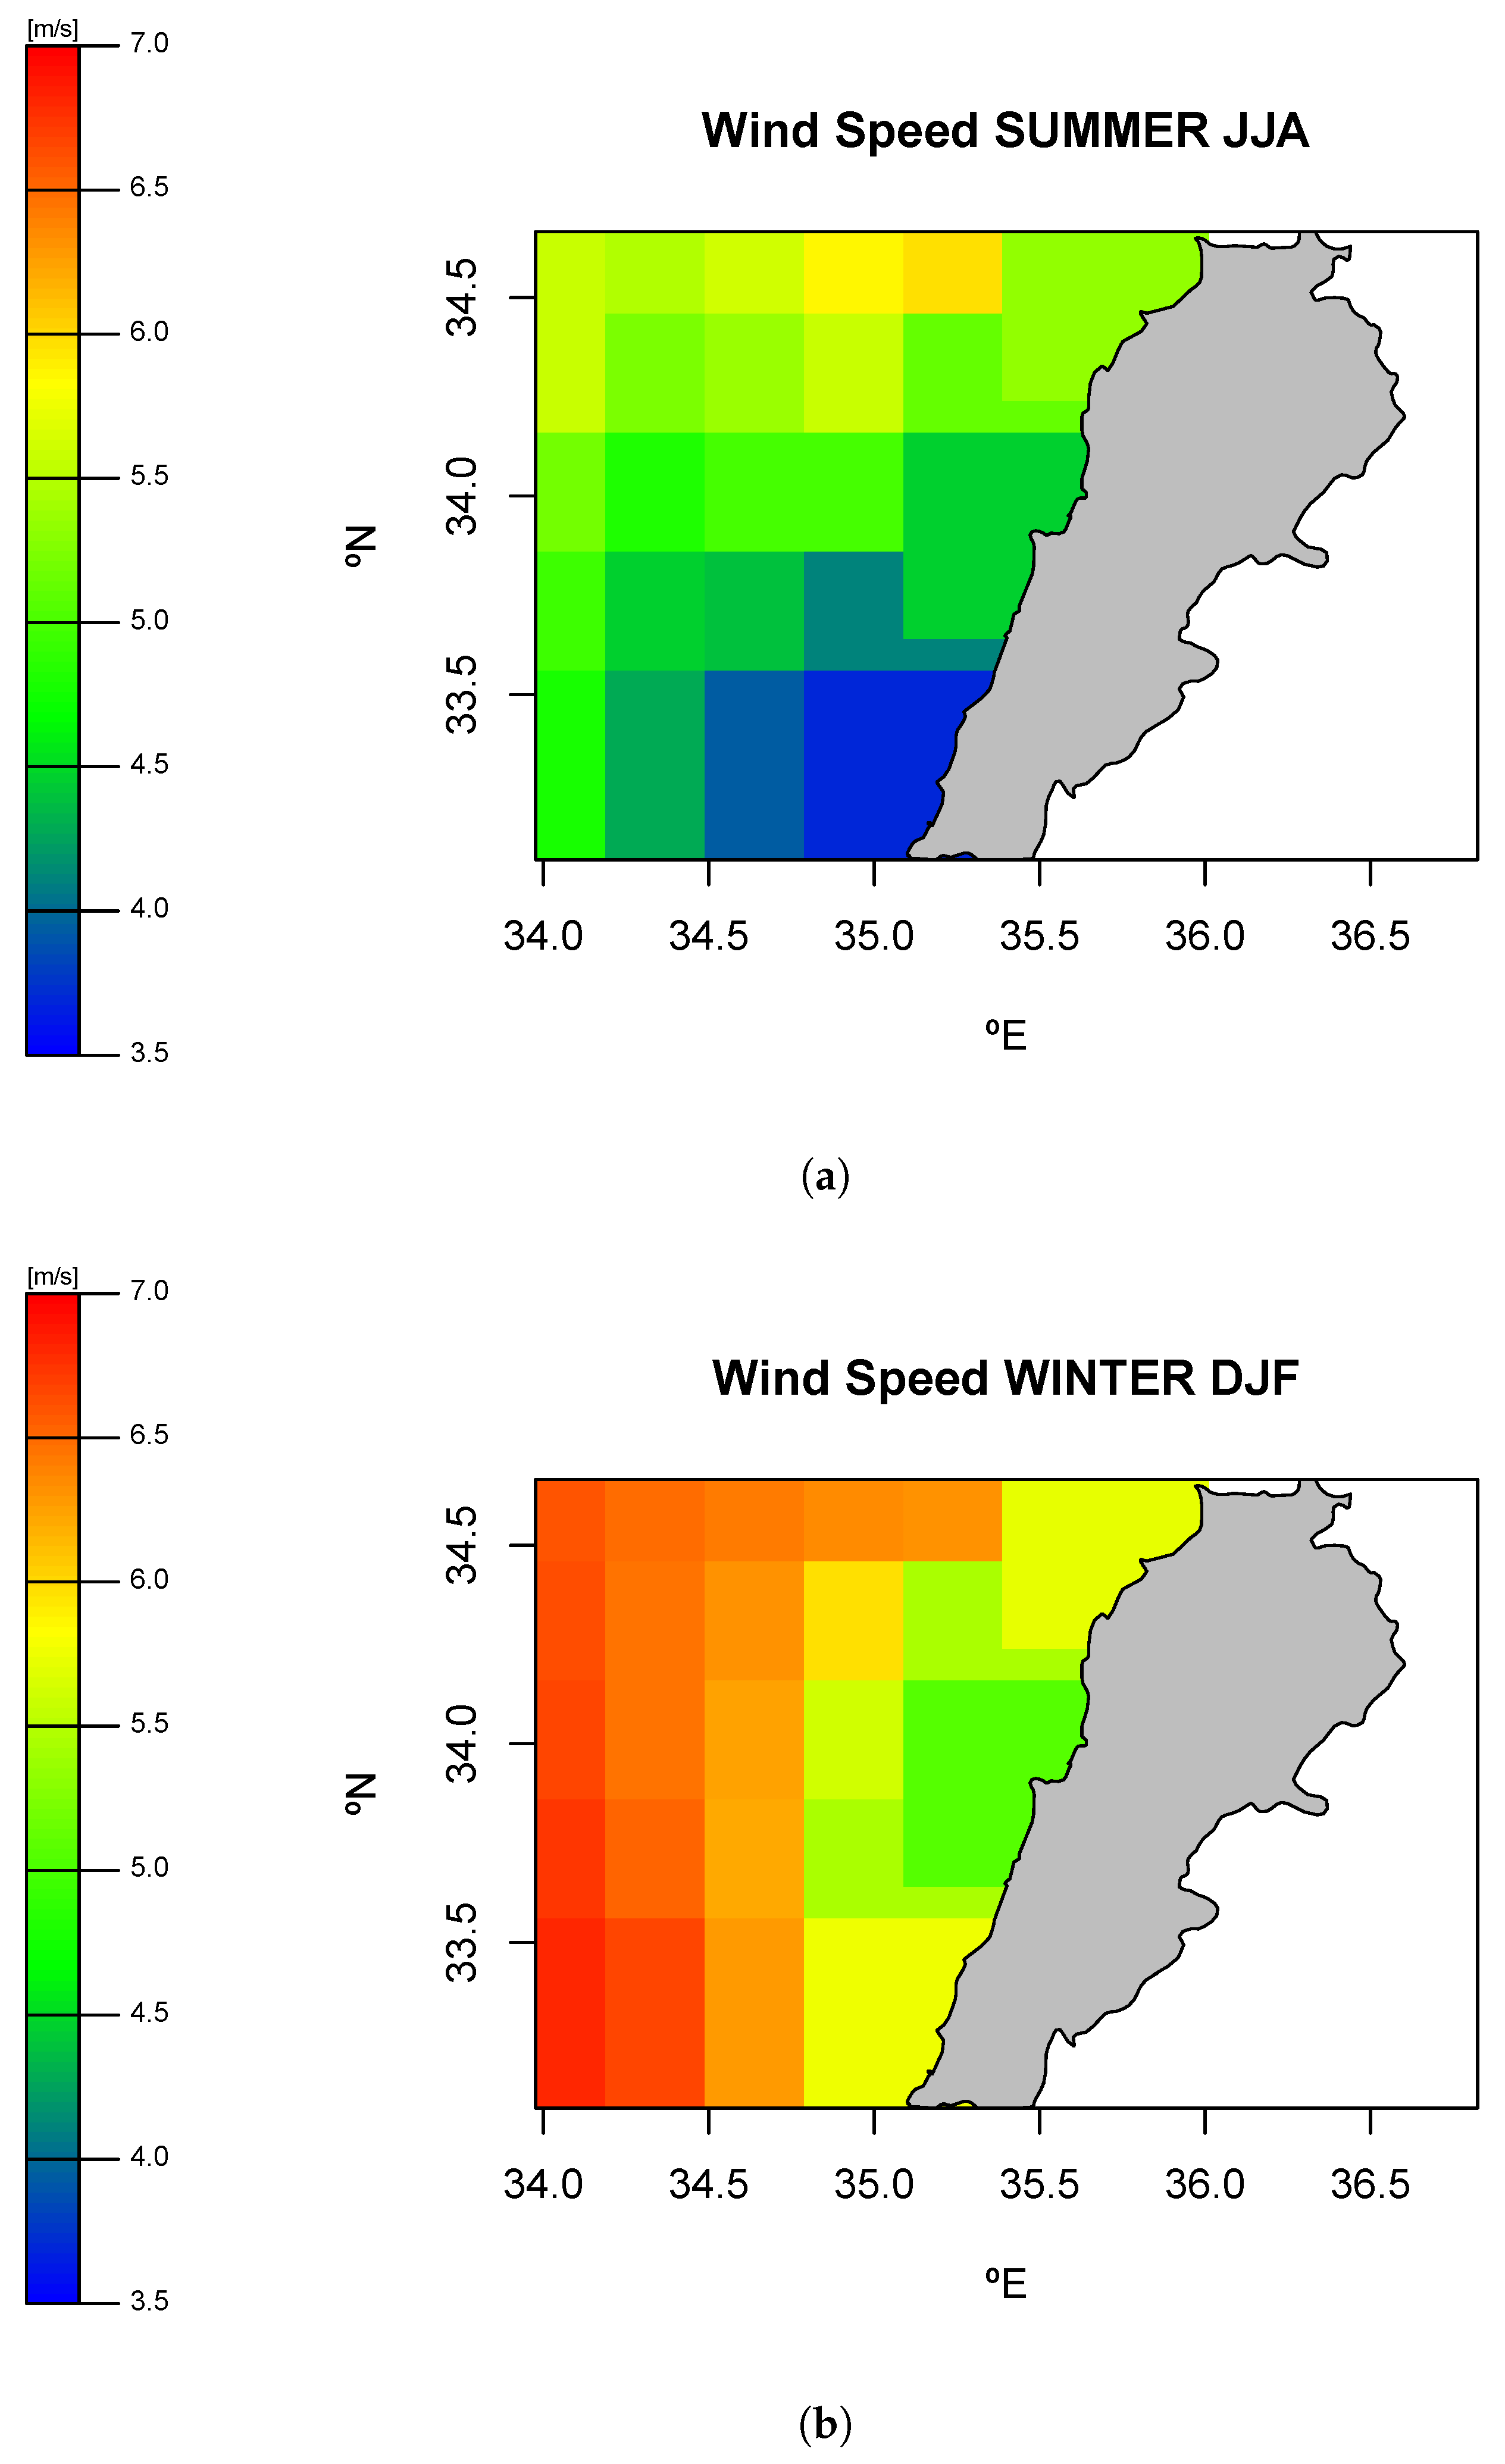
Coming to wind speed, the seasonal averages for the area in the 2010–2017 period, () exhibited two major spatial gradients (Figure 5)
- (i)
- Higher values on the northern coast and smaller in the central coast. However, in winter, intermediate values are observed in the southern coast, while in summmer, wind speeds reach their lowest values along the southern coast.
- (ii)
- As we moved away from the coast into the sea, higher wind-speed values were observed.
Additionally, showed a clear seasonal pattern with substantially lower values in summer than in winter.
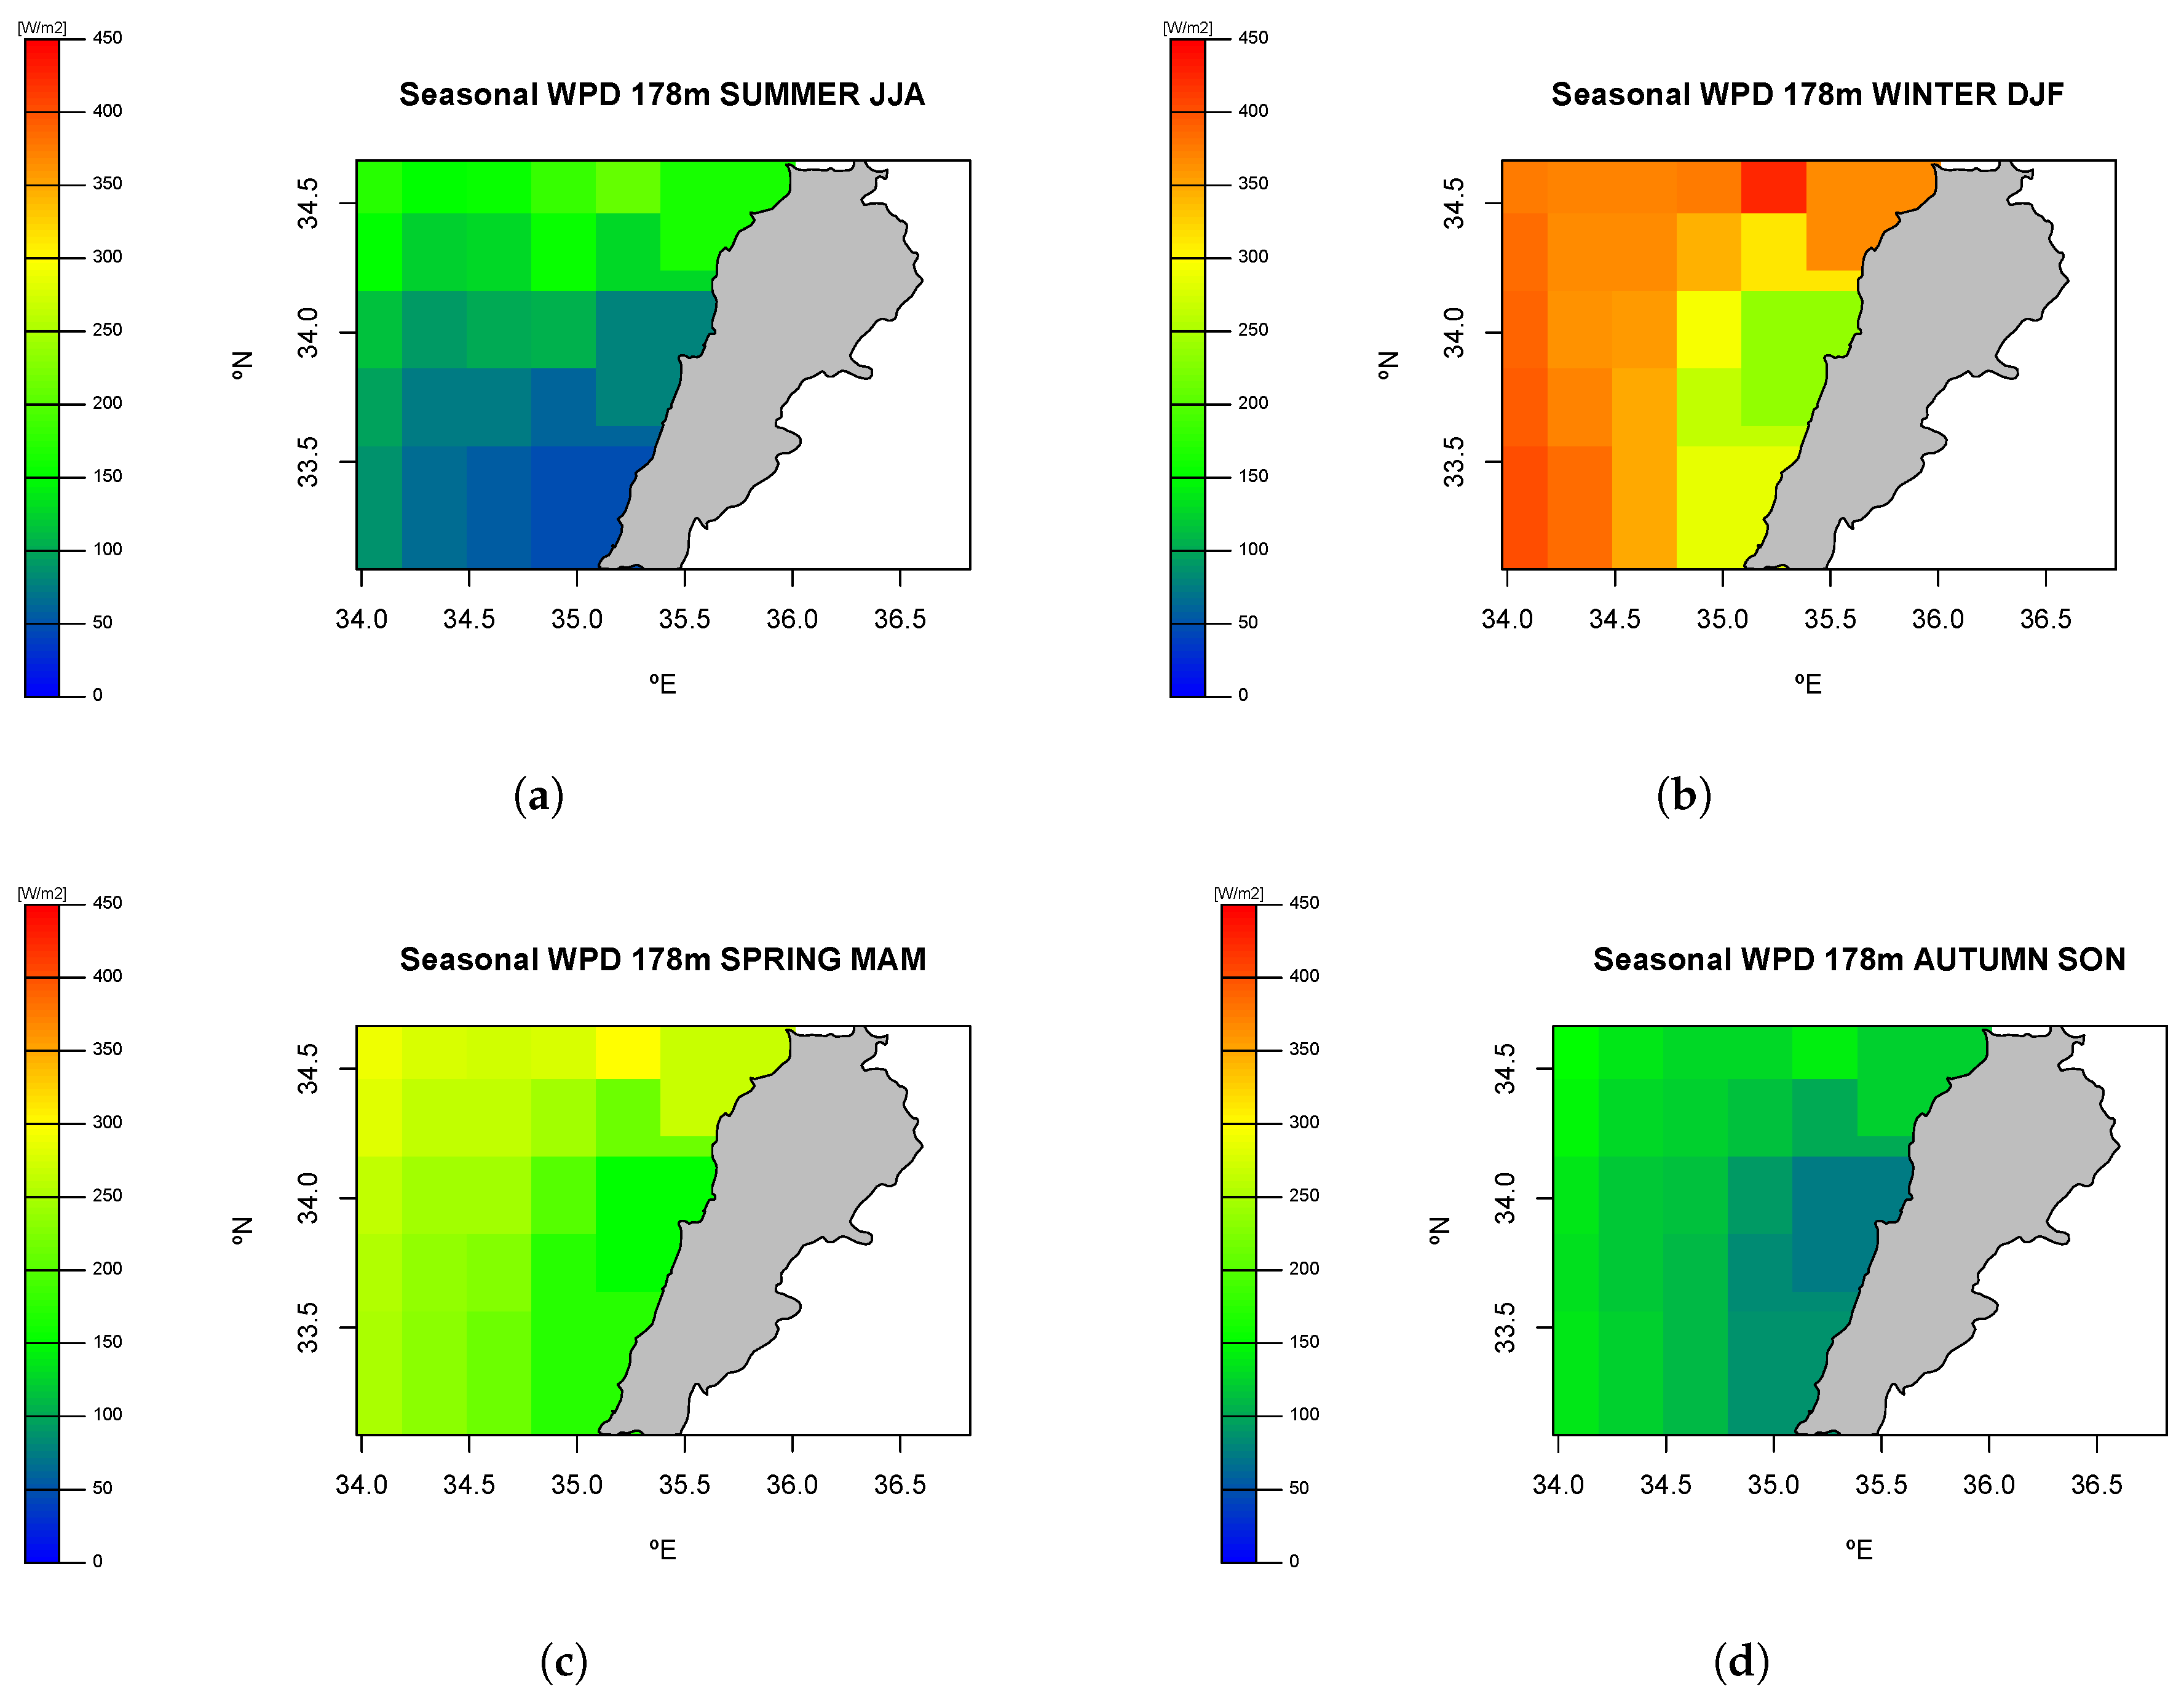
However, the objective of this study was to characterize the evolution of seasonal wind power density to estimate the feasibility of any future wind-farm project. It can be seen (Figure 6) that there was a major spatial gradient along the coast with a maximum in the north and a decreasing gradient southward along the shoreline. Apart from this spatial gradient, showed significant seasonal oscillations driven by the above-mentioned spatial and seasonal patterns of and .
As can be seen, the highest values of took place in the northern part of the coast during winter, reaching values slightly below 400 . This is because the highest seasonal values of and were also observed in that season and zone. For the whole area, the lowest seasonal values were in summer, while intermediate values occurred in spring and autumn. The ratio of between the maximal (winter) and minimal (summer) values at each gridpoint for the whole area was around 1.5, thus indicating strong seasonality in .
It is important to highlight that, if the overall average = 1.19 was introduced as a constant value in Equation (2) instead of using hourly values to calculate (Equation (2)) and then computing seasonal averages , significant errors in the would have taken place. More particularly, our study indicates that winter averages calculated with = 1.19 would underestimate the true by an average of 3% throughout the whole area. Conversely, in summer, an overestimation of 4% would have taken place. This stresses the relevance of not assuming a constant for wind-farm feasibility studies, because it may lead to non-negligible errors at estimating wind power density.
Finally, for comparison purposes with the previous results of offshore-wind power density at 80 masl as gathered in the National Wind Atlas (p. 56) [9], was also calculated with the same methodology for the 2010–2017 period (Figure 7).
The estimations in the previous United Nations report agree with our results (Figure 7) in that the northern area of the country is the zone with the highest potential. However, the attribution of values in this zone reached a maximum of more than 600 ; if averaged on the same area (roughly) as the one corresponding to our pixel of 0.3° × 0.3° centered at [35° E, 34.5° N] (blue triangle in Figure 7), it would be about 450–470 . However, the value at this pixel calculated for the 2010–2017 period and derived from ERA5 was 236.76 . This represents an overestimation in the United Nations report of roughly twice the true .
4. Discussion
The calculation of hourly wind power density assuming a constant value for local air density in Equation (2) is the methodological approach customarily used in many wind power feasibility studies. In those studies, either the standard value of = 1.225 or local annual mean is adopted. In the case of the Lebanese offshore, = 1.19 .
However, air density is not constant and, in the particular case of the Lebanese coast, exhibits remarkable seasonality driven by the seasonal changes in surface pressure, temperature, and humidity.
Ignoring this can lead to wrong estimations of wind-energy potential, as also pointed out in other studies [33]. In the particular case of the Lebanese offshore , errors moved from −3% in winter to +4% in summer. At this point, could play an important role for accurate calculation of wind power density.
In the case of the Lebanese offshore, errors in with respect to previous studies were around 100%. The methodology used for the 2011 assessment is described in the UN report [9] and the differences with respect to this study can be attributed to two facts:
- The poor spatial density of the wind observational data, obtained from a sparse meteorological network providing only surface data. In that study only surface data from 22 stations were used. An additional problem was that the records from all the stations did not cover the same observational periods.
- Generally speaking, the accuracy of the meteorological models used one decade ago was far poorer than the current assimilation algorithms used in ERA5. The model used was the MC () computational model [44].
The use of a poor quality model (by nowadays current standards, not a decade ago) fed with the sparse and low quality data gathered before 2011, can explain the observed differences with the field as obtained with ERA5 and the methodology explained in this work. This highlights the need to use state-of-the-art data and methodologies for similar studies.
Accurate values of the meteorological variables used in this study with reasonable spatial and temporal resolution are required if reliable feasibility studies are to be obtained for a given area. Along these lines, ERA5 is the most valuable tool that can be used not only to estimate Lebanese offshore-wind-energy potential, but also for any other geographical region, either offshore or onshore. These aspects explain its widespread use for wind power density estimations [12,33].
5. Conclusions
The values off the Lebanese coast exhibited strong seasonality, reaching a maximal value of 400 in winter at the northern part of the shore. It should be noted that 400 is a well-known value for the limit of a good wind-energy potential [14]. Higher values were observed as we moved into the sea. Lower values were observed in summer and toward the southern part of the shoreline. Although there was an important overestimation in previous studies, the values obtained now are enough—in the frame of current legal, administrative, and technical limitations—to deploy offshore wind farms that could increase the proportion of renewable energy sources into the Lebanese electric mix. This would also contribute to a less fossil-dependent energy system and, perhaps, to the development of a local wind-energy industry. To that purpose, an accurate characterization of wind power density taking into account changes in air density is needed. The implementation of a proper methodology along with the use of ERA5 and have proven to be valuable tools to accomplish this objective, not only for the Lebanese coast, but in most other places in the world.
Author Contributions
Conceptualization, G.I.-B., A.U., J.S.; methodology, G.I.-B., A.U.; software, J.S., S.J.G.-R.; investigation, G.I.-B., J.S.; writing—original-draft preparation, G.I.-B.; writing—review and editing, all authors; supervision, all authors; project administration, G.I.-B.; funding acquisition, J.S., G.I.-B.
Funding
This work was financially supported by the Spanish Government through MINECO project CGL2016-76561-R, (MINECO/ERDF, UE) and the University of the Basque Country (UPV/EHU, GIU 17/002).
Acknowledgments
This work was financially supported by the Spanish Government through MINECO project CGL2016-76561-R, (MINECO/ERDF, UE) and the University of the Basque Country (UPV/EHU, GIU 17/002). ERA5 data were downloaded at no cost from the Copernicus Climate Data Store.
Conflicts of Interest
The authors declare no conflict of interest.
Abbreviations
The following abbreviations are used in this manuscript:
| ECMWF | European Centre for Medium Range Weather Forecast |
| masl | meters above sea level |
| Surface pressure | |
| Zonal wind speed at a height of 10 m above sea level | |
| Meridional wind speed at 10 m above sea level | |
| Zonal wind speed at 100 m above sea level | |
| Meridional wind speed at 100 masl | |
| Relative humidity | |
| Constant of dry air | |
| Constant of water vapour | |
| water vapour pressure | |
| Surface temperature | |
| Virtual temperature | |
| Dew point temperature | |
| L | Latent heat of vaporization |
| w | Mixing ratio |
| e | Ratio between and |
| Hourly air density | |
| Seasonal average of air density | |
| Overall average of offshore air density (1.19 ) | |
| Wind speed at h masl | |
| Wind speed at 80 masl | |
| Wind speed at 178 masl | |
| Seasonal average of wind speed at 178 masl | |
| Wind Power Density | |
| Wind Power Density at h masl | |
| Hourly Wind Power Density at 80 masl | |
| 2010-2017 average of Wind Power Density at 80 masl | |
| Hourly Wind Power Density at 178 masl | |
| Seasonal average of Wind Power Density at 178 masl |
References
- Al-Kaaki, O.; Salameh, E.; Assi, A.; Arnaout, M.; Salameh, W. Offshore Wind Farms to Support Existing Power Plants Case Study: Deir Ammar Power Plant, Tripoli, Lebanon. In Proceedings of the 2018 IEEE International Multidisciplinary Conference on Engineering Technology (IMCET), Beirut, Lebanon, 14–16 November 2018; pp. 1–6. [Google Scholar]
- Ibrahim, O.; Fardoun, F.; Younes, R.; Louahlia-Gualous, H. Energy status in Lebanon and electricity generation reform plan based on cost and pollution optimization. Renew. Sustain. Energy Rev. 2013, 20, 255–278. [Google Scholar] [CrossRef]
- Elkhoury, M.; Nakad, Z.; Shatila, S. The assessment of wind power for electricity generation in Lebanon. Energy Sources Part A Recovery Util. Environ. Eff. 2010, 32, 1236–1247. [Google Scholar] [CrossRef]
- El-Ali, A.; Moubayed, N.; Outbib, R. Comparison between solar and wind energy in Lebanon. In Proceedings of the 2007 9th International Conference on Electrical Power Quality and Utilisation, Barcelona, Spain, 9–11 October 2007; pp. 1–5. [Google Scholar]
- Kinab, E.; Elkhoury, M. Renewable energy use in Lebanon: Barriers and solutions. Renew. Sustain. Energy Rev. 2012, 16, 4422–4431. [Google Scholar] [CrossRef]
- Younes, R.; Fardoun, F.; Ibrahim, O. Electricity of Lebanon: Problems and Recommendations. Energy Procedia 2012, 19, 310–320. [Google Scholar] [CrossRef] [Green Version]
- Al Zohbi, G.; Hendrick, P.; Bouillard, P. Assessment of wind energy potential in Lebanon. Res. Mar. Sci. 2018, 3, 401–414. [Google Scholar]
- Hassan, G. The National Wind Atlas of Lebanon: A Report; UNDP/CEDRO: Beirut, Lebanon, 2011. [Google Scholar]
- The National Wind Atlas of Lebanon. 2011. Available online: http://www.lb.undp.org/content/lebanon/en/home/library/environment_energy/the-national-wind-atlas-of-lebanon.html (accessed on 10 September 2019).
- Hersbach, H. The ERA5 Atmospheric Reanalysis. AGU Fall Meeting Abstracts. 2016. Available online: http://adsabs.harvard.edu/abs/2016AGUFMNG33D..01H (accessed on 9 July 2019).
- Copernicus Climate Data Store. 2019. Available online: https://cds.climate.copernicus.eu/ (accessed on 10 September 2019).
- Olauson, J. ERA5: The new champion of wind power modelling? Renew. Energy 2018, 126, 322–331. [Google Scholar] [CrossRef] [Green Version]
- Ulazia, A.; Nafarrate, A.; Ibarra-Berastegi, G.; Sáenz, J.; Carreno-Madinabeitia, S. The Consequences of Air Density Variations over Northeastern Scotland for Offshore Wind Energy Potential. Energies 2019, 12, 2635. [Google Scholar] [CrossRef]
- Manwell, J.F.; McGowan, J.G.; Rogers, A.L. Wind Energy Explained: Theory, Design and Application; John Wiley & Sons: Hoboken, NJ, USA, 2010. [Google Scholar]
- Monteiro, C.; Bessa, R.; Miranda, V.; Botterud, A.; Wang, J.; Conzelmann, G. Wind Power Forecasting: State-Of-The-Art 2009; Technical Report; Argonne National Laboratory (ANL): Lemont, IL, USA, 2009.
- Weisser, D. A wind energy analysis of Grenada: An estimation using the Weibull density function. Renew. Energy 2003, 28, 1803–1812. [Google Scholar] [CrossRef]
- Gökçek, M.; Bayülken, A.; Bekdemir, Ş. Investigation of wind characteristics and wind energy potential in Kirklareli, Turkey. Renew. Energy 2007, 32, 1739–1752. [Google Scholar] [CrossRef]
- Dvorak, M.J.; Archer, C.L.; Jacobson, M.Z. California offshore wind energy potential. Renew. Energy 2010, 35, 1244–1254. [Google Scholar] [CrossRef]
- Gross, M.S.; Magar, V. Offshore wind energy potential estimation using UPSCALE climate data. Energy Sci. Eng. 2015, 3, 342–359. [Google Scholar] [CrossRef]
- Akdağ, S.A.; Güler, Ö. Evaluation of wind energy investment interest and electricity generation cost analysis for Turkey. Appl. Energy 2010, 87, 2574–2580. [Google Scholar] [CrossRef]
- Fueyo, N.; Sanz, Y.; Rodrigues, M.; Montañés, C.; Dopazo, C. High resolution modelling of the on-shore technical wind energy potential in Spain. Wind Energy 2010, 13, 717–726. [Google Scholar] [CrossRef]
- Hasager, C.B.; Barthelmie, R.J.; Christiansen, M.B.; Nielsen, M.; Pryor, S. Quantifying offshore wind resources from satellite wind maps: Study area the North Sea. Wind Energy 2006, 9, 63–74. [Google Scholar] [CrossRef]
- Doubrawa, P.; Barthelmie, R.J.; Pryor, S.C.; Hasager, C.B.; Badger, M.; Karagali, I. Satellite winds as a tool for offshore wind resource assessment: The Great Lakes Wind Atlas. Remote. Sens. Environ. 2015, 168, 349–359. [Google Scholar] [CrossRef] [Green Version]
- Carvalho, D.; Rocha, A.; Santos, C.S.; Pereira, R. Wind resource modelling in complex terrain using different mesoscale–microscale coupling techniques. Appl. Energy 2013, 108, 493–504. [Google Scholar] [CrossRef]
- Carvalho, D.; Rocha, A.; Gómez-Gesteira, M.; Santos, C. A sensitivity study of the WRF model in wind simulation for an area of high wind energy. Environ. Model. Softw. 2012, 33, 23–34. [Google Scholar] [CrossRef] [Green Version]
- Carvalho, D.; Rocha, A.; Gómez-Gesteira, M.; Santos, C.S. Sensitivity of the WRF model wind simulation and wind energy production estimates to planetary boundary layer parameterizations for onshore and offshore areas in the Iberian Peninsula. Appl. Energy 2014, 135, 234–246. [Google Scholar] [CrossRef]
- Carvalho, D.; Rocha, A.; Gómez-Gesteira, M.; Santos, C.S. Comparison of reanalyzed, analyzed, satellite-retrieved and NWP modelled winds with buoy data along the Iberian Peninsula coast. Remote. Sens. Environ. 2014, 152, 480–492. [Google Scholar] [CrossRef]
- Carvalho, D.; Rocha, A.; Gómez-Gesteira, M.; Santos, C.S. WRF wind simulation and wind energy production estimates forced by different reanalyses: Comparison with observed data for Portugal. Appl. Energy 2014, 117, 116–126. [Google Scholar] [CrossRef]
- Carvalho, D.; Rocha, A.; Gómez-Gesteira, M.; Santos, C.S. Offshore wind energy resource simulation forced by different reanalyses: Comparison with observed data in the Iberian Peninsula. Appl. Energy 2014, 134, 57–64. [Google Scholar] [CrossRef]
- Elosegui, U.; Egana, I.; Ulazia, A.; Ibarra-Berastegi, G. Pitch angle misalignment correction based on benchmarking and laser scanner measurement in wind farms. Energies 2018, 11, 3357. [Google Scholar] [CrossRef]
- Rabanal, A.; Ulazia, A.; Ibarra-Berastegi, G.; Sáenz, J.; Elosegui, U. MIDAS: A Benchmarking Multi-Criteria Method for the Identification of Defective Anemometers in Wind Farms. Energies 2019, 12, 28. [Google Scholar] [CrossRef]
- Ulazia, A.; Ibarra-Berastegi, G.; Sáenz, J.; Carreno-Madinabeitia, S.; González-Rojí, S.J. Seasonal correction of offshore wind energy potential due to air density: Case of the Iberian Peninsula. Energies 2019, 11, 3648. [Google Scholar] [CrossRef]
- Ulazia, A.; Sáenz, J.; Ibarra-Berastegui, G.; González-Rojí, S.J.; Carreno-Madinabeitia, S. Global estimations of wind energy potential considering seasonal air density changes. Energy 2019, 187, 115938. [Google Scholar] [CrossRef]
- Floors, R.; Nielsen, M. Estimating Air Density Using Observations and Re-Analysis Outputs for Wind Energy Purposes. Energies 2019, 12, 2038. [Google Scholar] [CrossRef]
- Butterfield, C.P.; Musial, W.; Jonkman, J.; Sclavounos, P.; Wayman, L. Engineering Challenges for Floating Offshore Wind Turbines; National Renewable Energy Laboratory: Golden, CO, USA, 2007.
- Bohren, C.F.; Albrecht, B.A. Atmospheric Thermodynamics; Oxford University Press: New York, NY, USA, 1998; p. 402. [Google Scholar]
- Petty, G.W. A First Course in Atmospheric Thermodynamics; Sundog Publishing: Madison, WI, USA, 2008; p. 337. [Google Scholar]
- R Core Team. R: A Language and Environment for Statistical Computing; R Foundation for Statistical Computing: Vienna, Austria, 2018; Available online: https://www.R-project.org/ (accessed on 16 July 2019).
- Sáenz, J.; González-Rojí, S.J.; Carreno-Madinabeitia, S.; Ibarra-Berastegi, G. aiRthermo: Atmospheric Thermodynamics and Visualization. R package version 1.2.1. 2018. Available online: https://CRAN.R-project.org/package=aiRthermo (accessed on 16 July 2019).
- Sáenz, J.; González-Rojí, S.J.; Carreno-Madinabeitia, S.; Ibarra-Berastegi, G. Analysis of atmospheric thermodynamics using the R package aiRthermo. Comput. Geosci. 2019, 122, 113–119. [Google Scholar] [CrossRef]
- Ulazia, A.; Sáenz, J.; Ibarra-Berastegui, G. Sensitivity to the use of 3DVAR data assimilation in a mesoscale model for estimating offshore wind energy potential. A case study of the Iberian northern coastline. Appl. Energy 2016, 180, 617–627. [Google Scholar] [CrossRef]
- Ulazia, A.; Sáenz, J.; Ibarra-Berastegui, G.; González-Rojí, S.J.; Carreno-Madinabeitia, S. Using 3DVAR data assimilation to measure offshore wind energy potential at different turbine heights in the West Mediterranean. Appl. Energy 2017, 208, 1232–1245. [Google Scholar] [CrossRef] [Green Version]
- Ulazia, A.; Gonzalez-Rojí, S.J.; Ibarra-Berastegi, G.; Carreno-Madinabeitia, S.; Sáenz, J.; Nafarrate, A. Seasonal air density variations over the East of Scotland and the consequences for offshore wind energy. In Proceedings of the 2018 7th International Conference on Renewable Energy Research and Applications (ICRERA), Paris, France, 14–17 October 2018; pp. 261–265. [Google Scholar]
- Laprise, R.; Caya, D.; Bergeron, G.; Giguère, M. The formulation of the André Robert MC2 (mesoscale compressible community) model. Atmos.-Ocean 1997, 35, 195–220. [Google Scholar] [CrossRef]
Figure 1.
Lebanon, located in the eastern Mediterranean.

Figure 2.
Location of ERA5 gridpoints on the study area.

Figure 3.
Lebanese exclusive economic zone, 1000 m depth boundary, and buffer area.

Figure 4.
Seasonal air density differences of [%] with respect to = 1.19 . (a) Summer. (b) Winter.

Figure 5.
Lebanon offshore-wind speed at 178 m. Seasonal averages from hourly values. (a) Summer. (b) Winter.
Figure 5.
Lebanon offshore-wind speed at 178 m. Seasonal averages from hourly values. (a) Summer. (b) Winter.

Figure 6.
Wind power density at 178 masl. . (a) Summer. (b) Winter. (c) Spring. (d) Autumn.

Figure 7.
Wind power density at 80 masl . Overall average. The blue triangle represents the pixel centered at coordinates [35° E, 34.5° N]
Figure 7.
Wind power density at 80 masl . Overall average. The blue triangle represents the pixel centered at coordinates [35° E, 34.5° N]

© 2019 by the authors. Licensee MDPI, Basel, Switzerland. This article is an open access article distributed under the terms and conditions of the Creative Commons Attribution (CC BY) license (http://creativecommons.org/licenses/by/4.0/).
Share and Cite
MDPI and ACS Style
Ibarra-Berastegi, G.; Ulazia, A.; Saénz, J.; González-Rojí, S.J. Evaluation of Lebanon’s Offshore-Wind-Energy Potential. J. Mar. Sci. Eng. 2019, 7, 361. https://doi.org/10.3390/jmse7100361
AMA Style
Ibarra-Berastegi G, Ulazia A, Saénz J, González-Rojí SJ. Evaluation of Lebanon’s Offshore-Wind-Energy Potential. Journal of Marine Science and Engineering. 2019; 7(10):361. https://doi.org/10.3390/jmse7100361
Chicago/Turabian StyleIbarra-Berastegi, Gabriel, Alain Ulazia, Jon Saénz, and Santos José González-Rojí. 2019. "Evaluation of Lebanon’s Offshore-Wind-Energy Potential" Journal of Marine Science and Engineering 7, no. 10: 361. https://doi.org/10.3390/jmse7100361
Note that from the first issue of 2016, this journal uses article numbers instead of page numbers. See further details here.